Durr AG · XETR:DUE
Durr — H1 2009 Earnings Presentation
22 slides from Durr's earnings presentation, Aug 6, 2009
Slide 1: Welcome to the conference call: Results January-June 2009
Welcome to the conference call Dürr AG Results January-June 2009 Dürr Group Bietigheim-Bissingen, August 6, 2009
Slide 2: Disclaimer
Disclaimer This presentation has been prepared independently by Dürr AG (“Dürr”). The presentation contains statements which address such key issues as Dürr´s strategy, future financial results, market positions and product development. Such statements should be carefully considered, and it should b
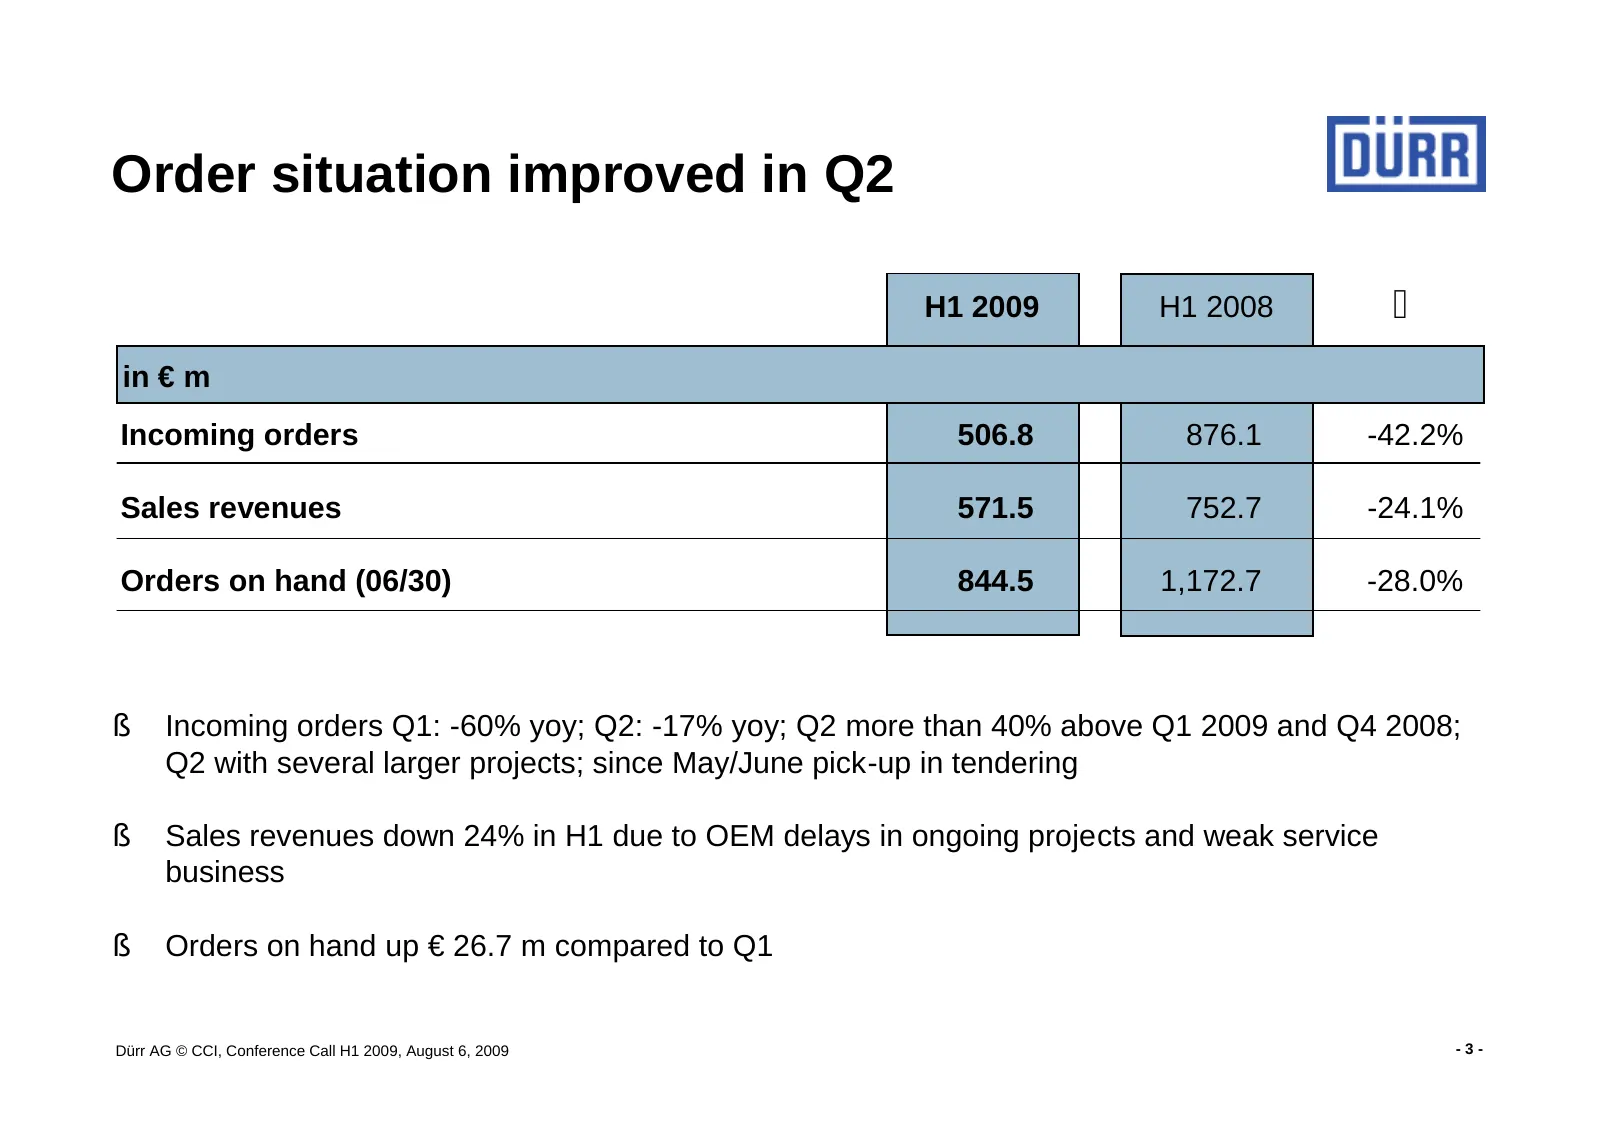
Slide 3: Order situation improved in Q2
Order situation improved in Q2 H1 2009 H1 2008 ∆ in € m Incoming orders 506.8 876.1 -42.2% Sales revenues 571.5 752.7 -24.1% Orders on hand (06/30) 844.5 1,172.7 -28.0% § Incoming orders Q1: -60% yoy; Q2: -17% yoy; Q2 more than 40% above Q1 2009 and Q4 2008; Q2 with several larger projects; since Ma
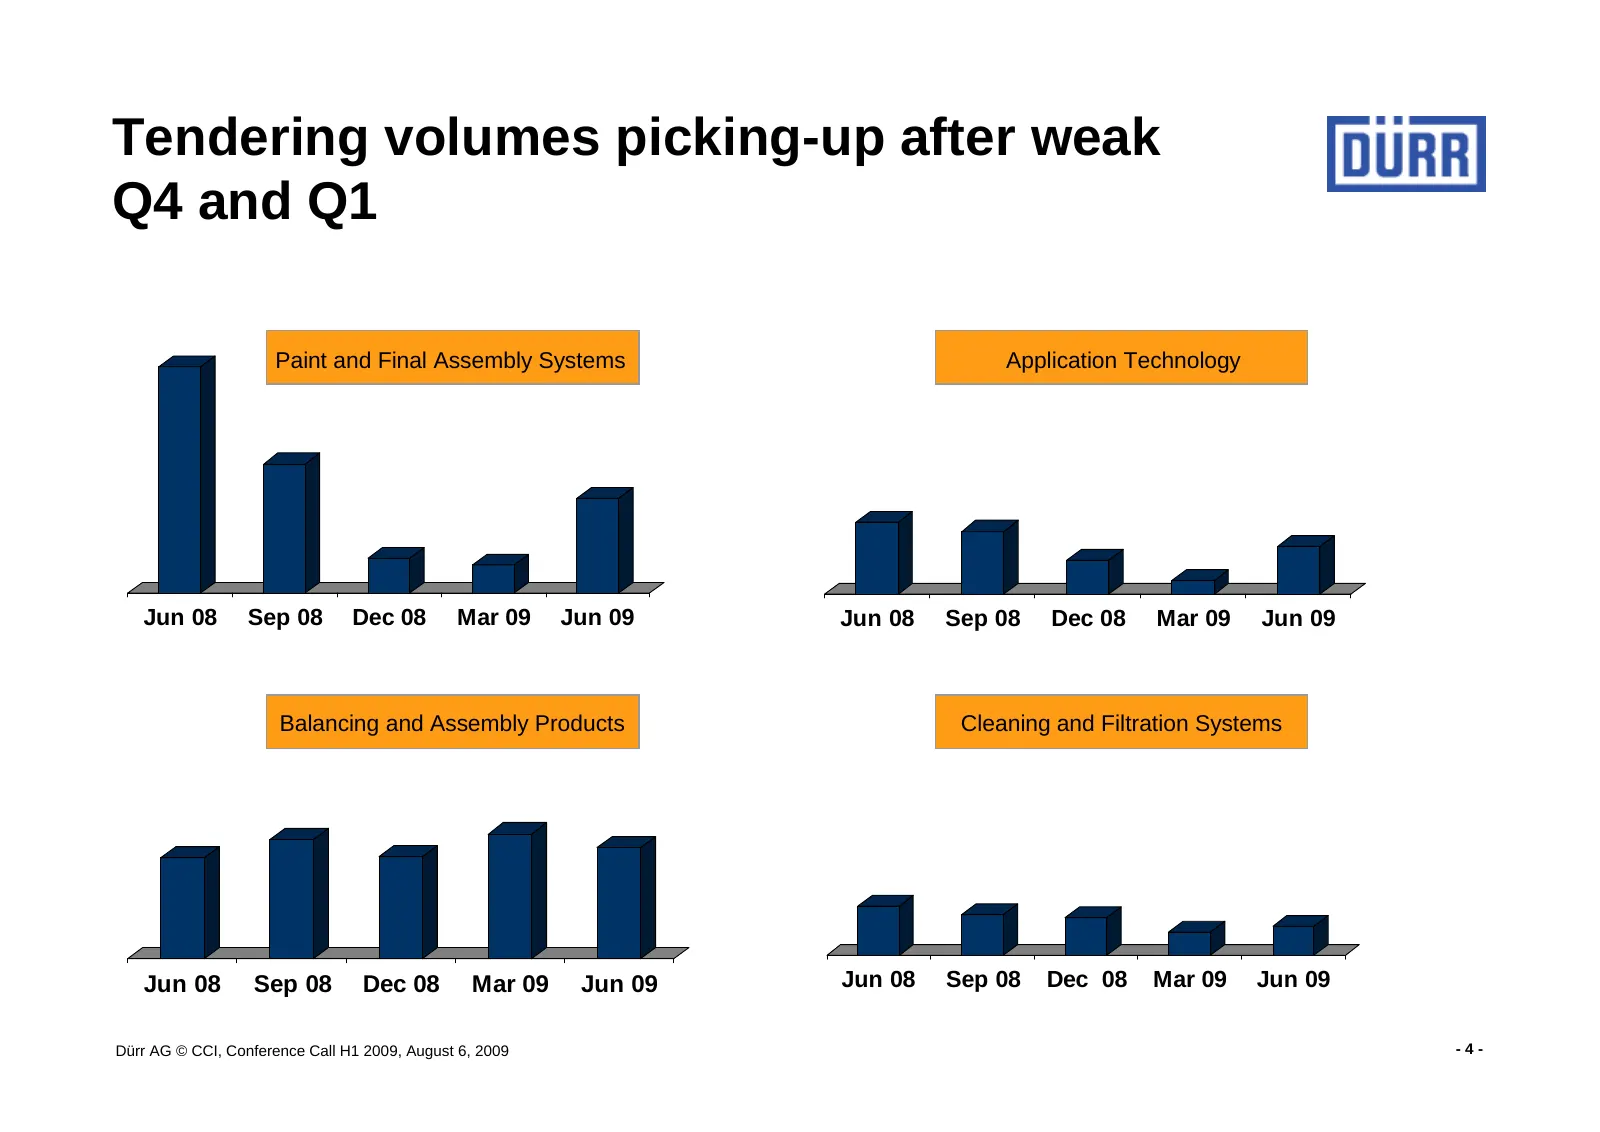
Slide 4: Tendering volumes picking-up after weak Q4 and Q1
Tendering volumes picking-up after weak Q4 and Q1 Paint and Final Assembly Systems Application Technology Jun 08 Sep 08 Dec 08 Mar 09 Jun 09 Jun 08 Sep 08 Dec 08 Mar 09 Jun 09 Balancing and Assembly Products Cleaning and Filtration Systems Jun 08 Sep 08 Dec 08 Mar 09 Jun 09 Jun 08 Sep 08 Dec 08 Mar
Slide 5: Regional order structure changed temporarily
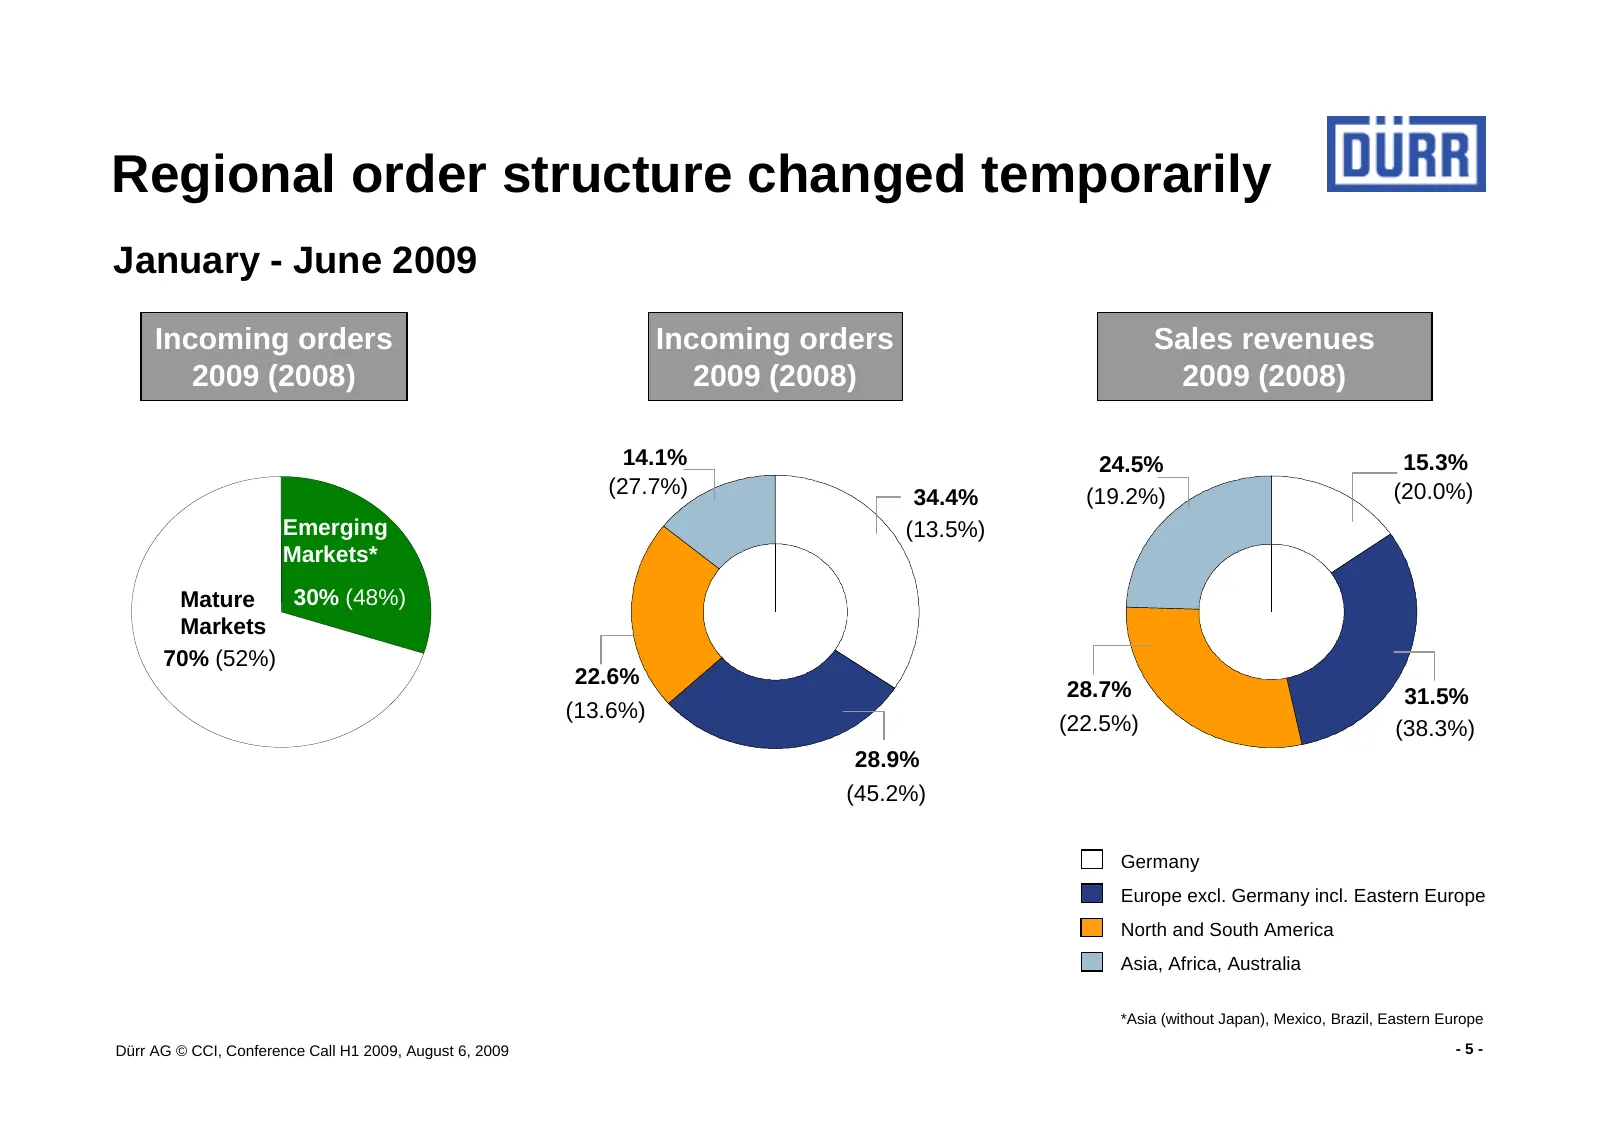
Regional order structure changed temporarily January - June 2009 Incoming orders Incoming orders Sales revenues 2009 (2008) 2009 (2008) 2009 (2008) 14.1% 24.5% 15.3% (27.7%) 34.4% (19.2%) (20.0%) Emerging (13.5%) Markets* Mature 30% (48%) Markets 70% (52%) 22.6% 28.7% 31.5% (13.6%) (22.5%) (38.3%) 2
Slide 6: Positive EBIT despite strong revenue decrease
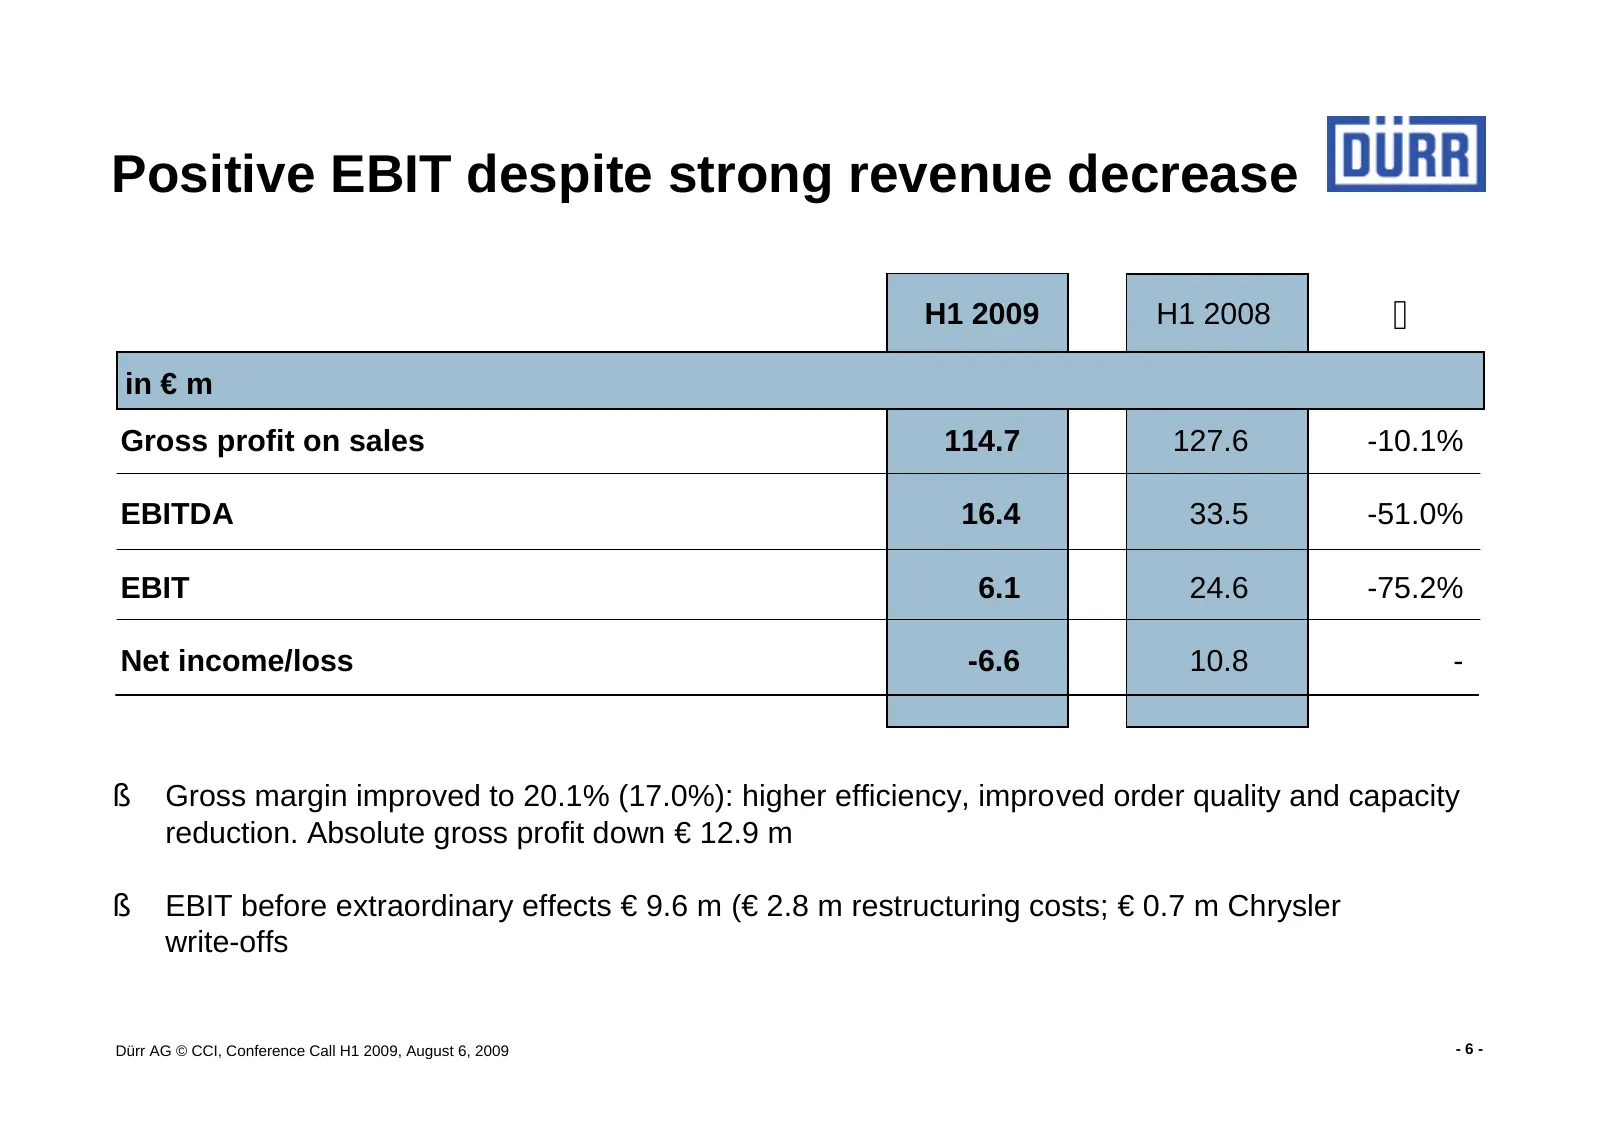
Positive EBIT despite strong revenue decrease H1 2009 H1 2008 ∆ in € m Gross profit on sales 114.7 127.6 -10.1% EBITDA 16.4 33.5 -51.0% EBIT 6.1 24.6 -75.2% Net income/loss -6.6 10.8 - § Gross margin improved to 20.1% (17.0%): higher efficiency, improved order quality and capacity reduction. Absolut
Slide 7: Cash flow improved in Q2
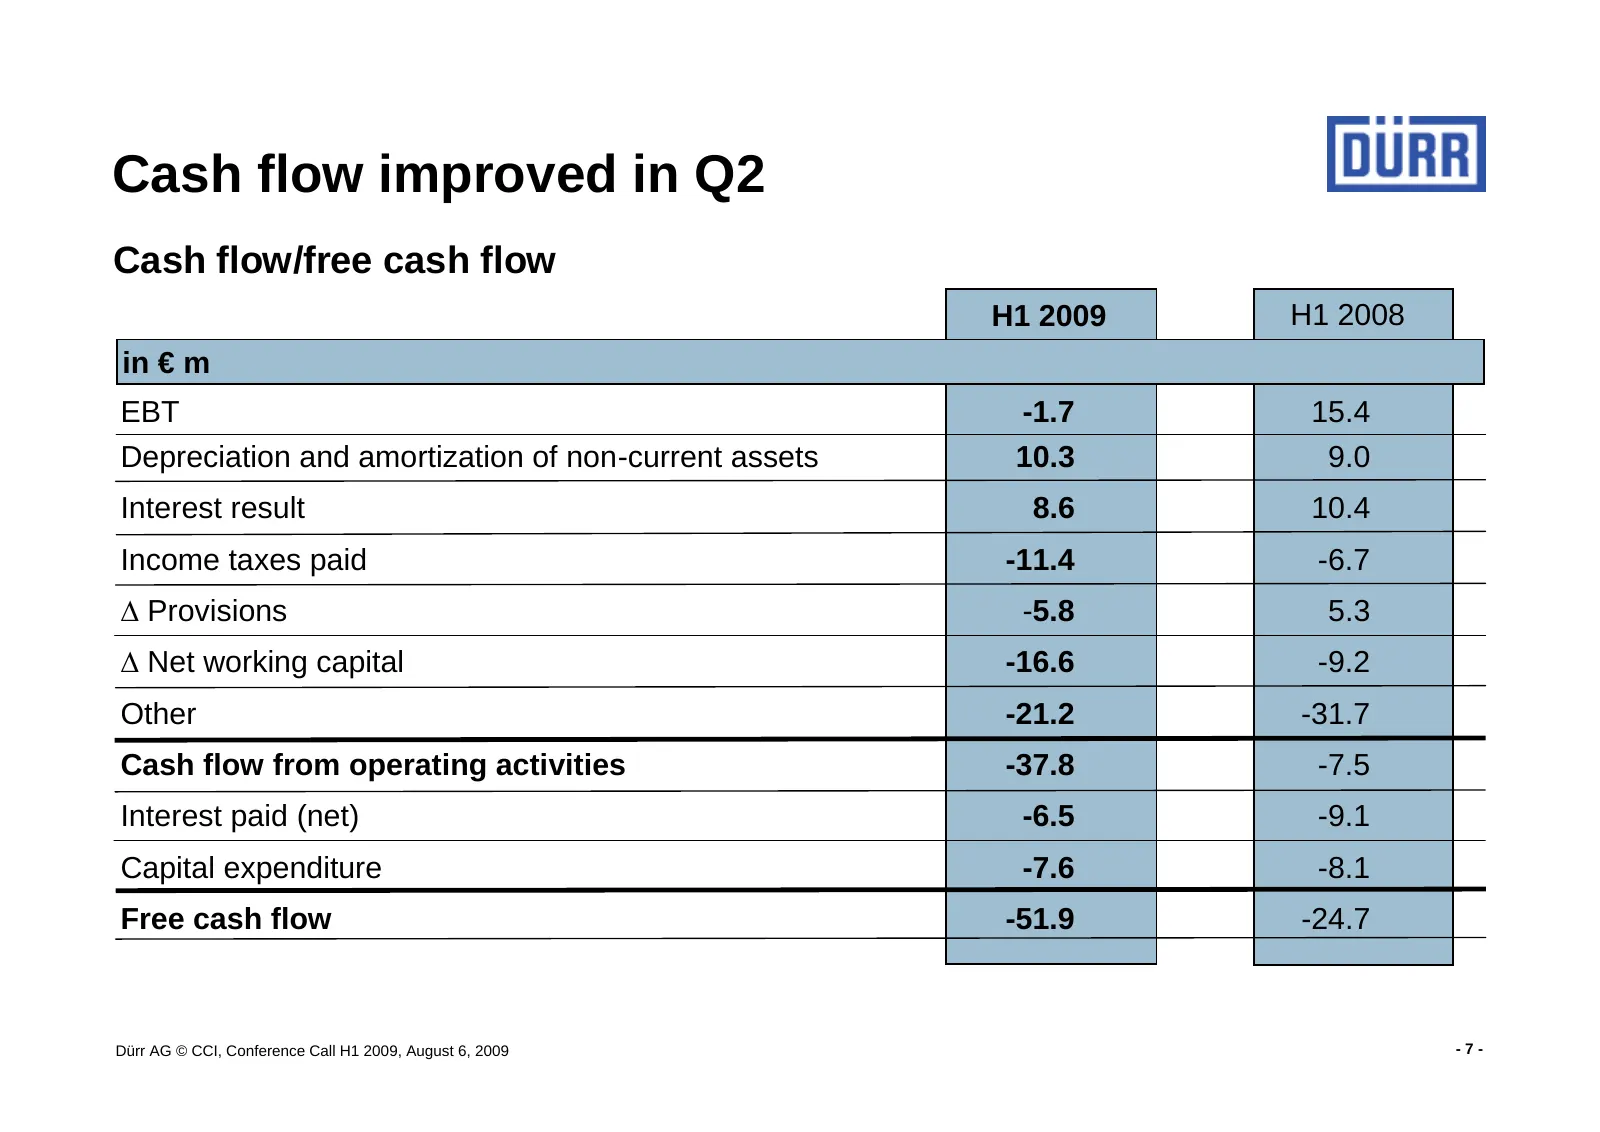
Cash flow improved in Q2 Cash flow/free cash flow H1 2009 H1 2008 in € m EBT -1.7 15.4 Depreciation and amortization of non-current assets 10.3 9.0 Interest result 8.6 10.4 Income taxes paid -11.4 -6.7 ∆ Provisions -5.8 5.3 ∆ Net working capital -16.6 -9.2 Other -21.2 -31.7 Cash flow from operating
Slide 8: Forfaiting reduced
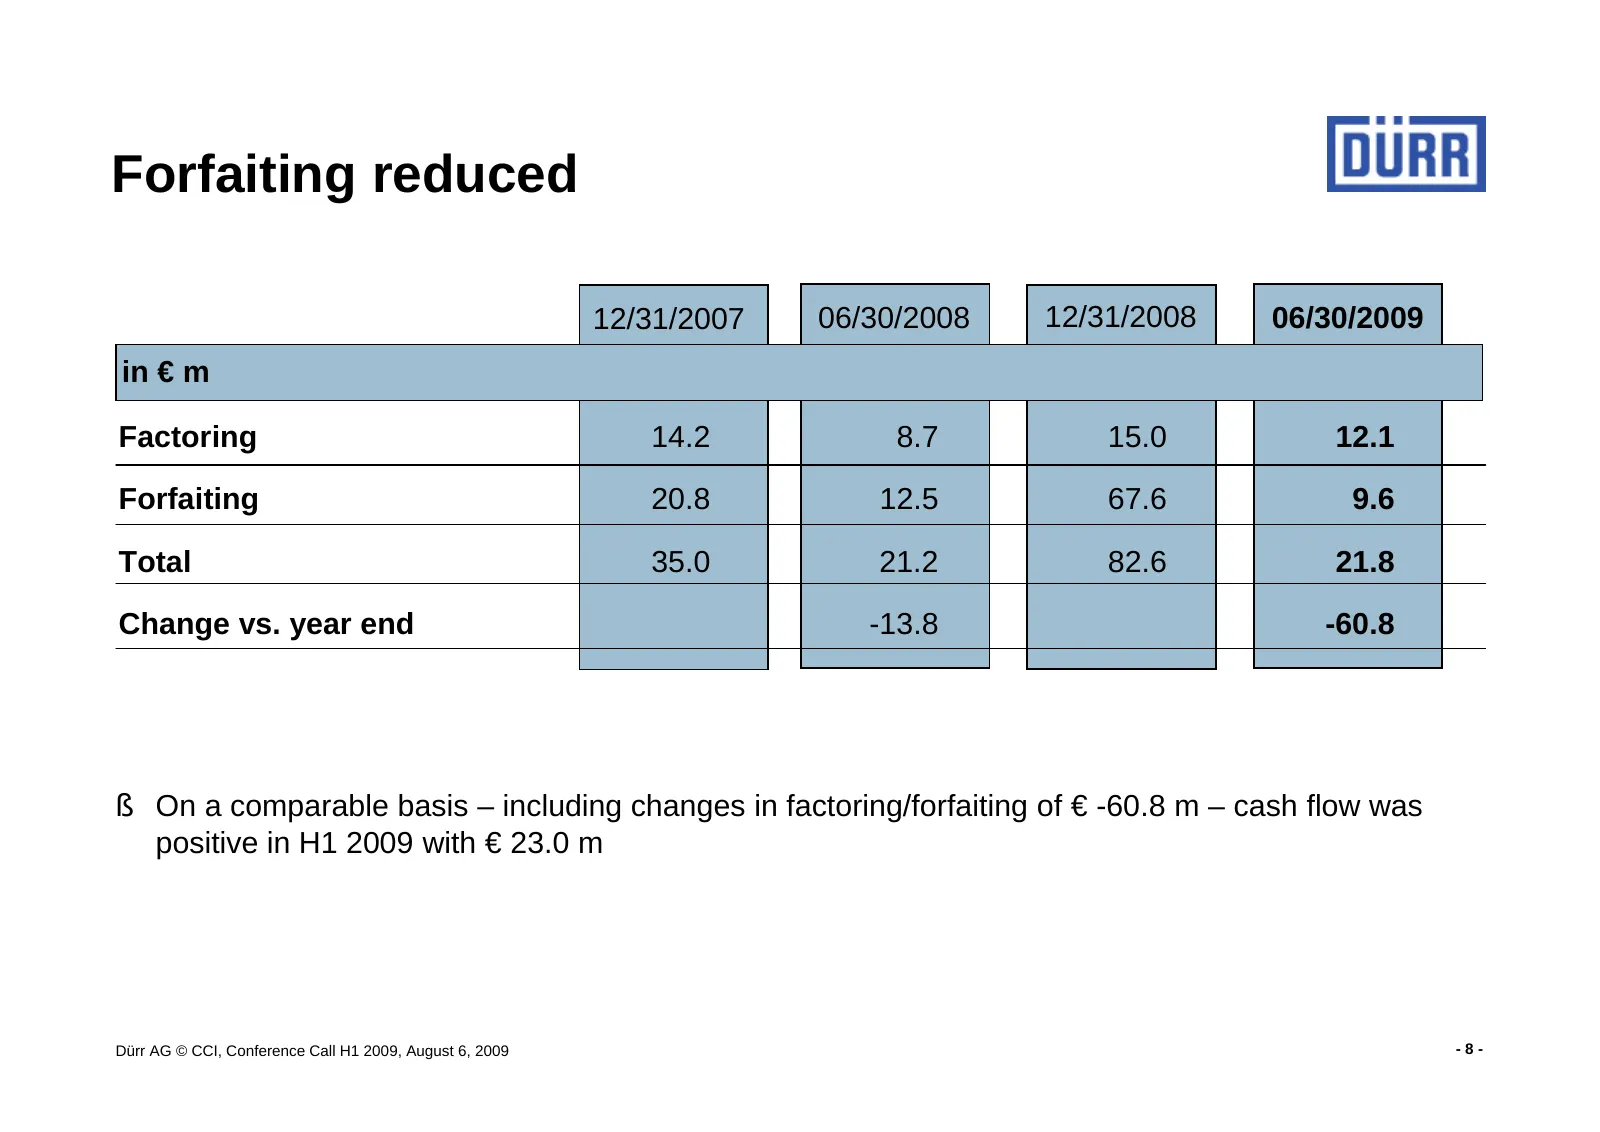
Forfaiting reduced 12/31/2007 06/30/2008 12/31/2008 06/30/2009 in € m Factoring 14.2 8.7 15.0 12.1 Forfaiting 20.8 12.5 67.6 9.6 Total 35.0 21.2 82.6 21.8 Change vs. year end -13.8 -60.8 § On a comparable basis – including changes in factoring/forfaiting of € -60.8 m – cash flow was positive in H1 2
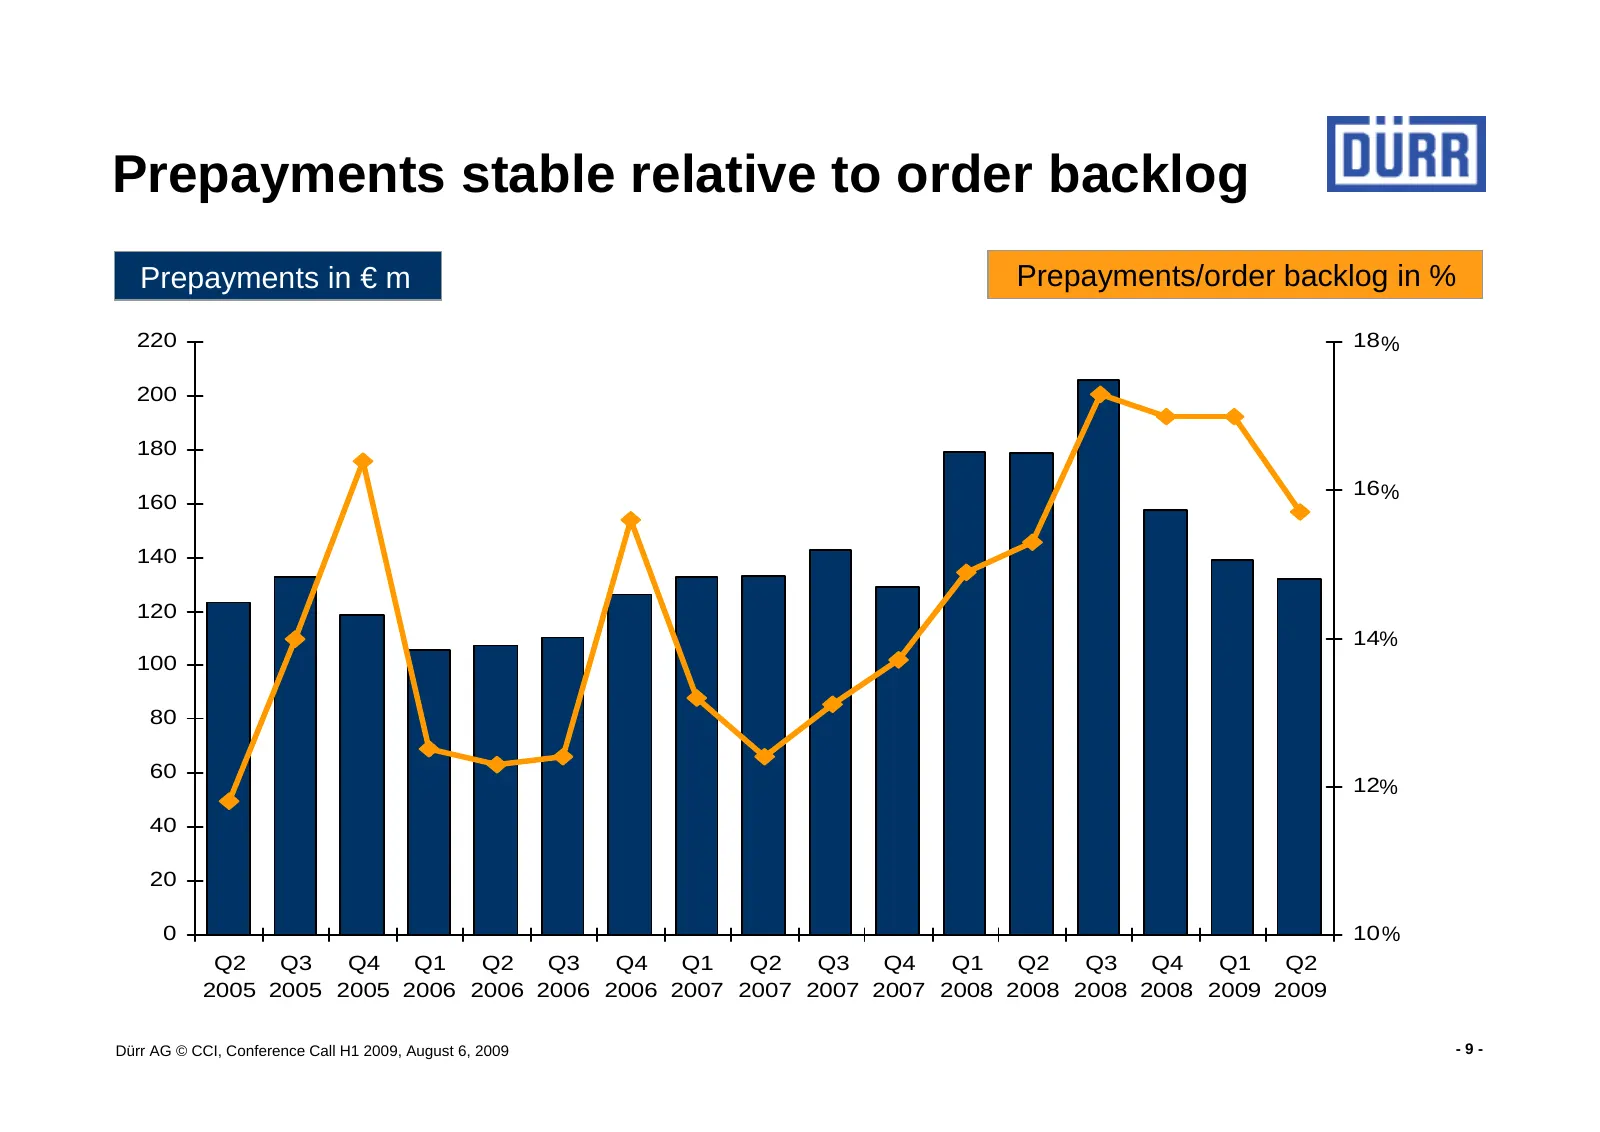
Slide 9: Prepayments stable relative to order backlog
Prepayments stable relative to order backlog Prepayments in € m Prepayments/order backlog in % 220 18 % 200 180 16 % 160 140 120 14% 100 80 60 12% 40 20 0 10 % Q2 Q3 Q4 Q1 Q2 Q3 Q4 Q1 Q2 Q3 Q4 Q1 Q2 Q3 Q4 Q1 Q2 2005 2005 2005 2006 2006 2006 2006 2007 2007 2007 2007 2008 2008 2008 2008 2009 2009 Dürr
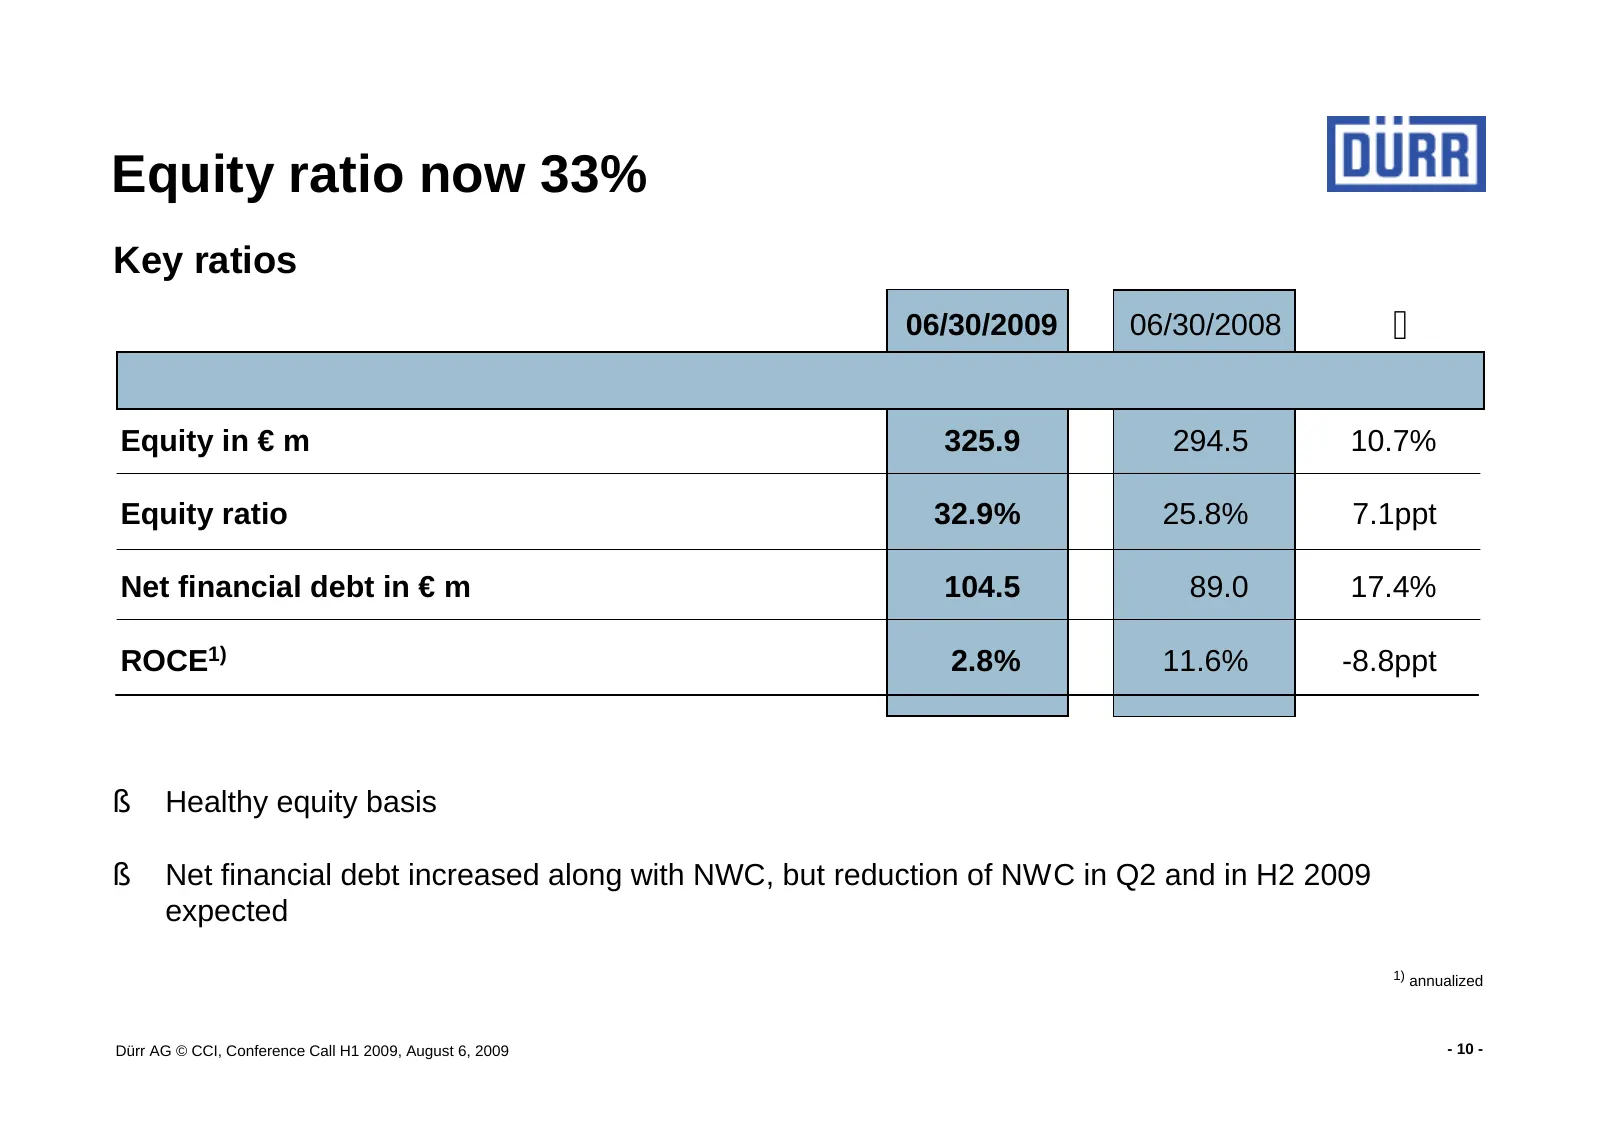
Slide 10: Equity ratio now 33%
Equity ratio now 33% Key ratios 06/30/2009 06/30/2008 ∆ Equity in € m 325.9 294.5 10.7% Equity ratio 32.9% 25.8% 7.1ppt Net financial debt in € m 104.5 89.0 17.4% ROCE1) 2.8% 11.6% -8.8ppt § Healthy equity basis § Net financial debt increased along with NWC, but reduction of NWC in Q2 and in H2 2009
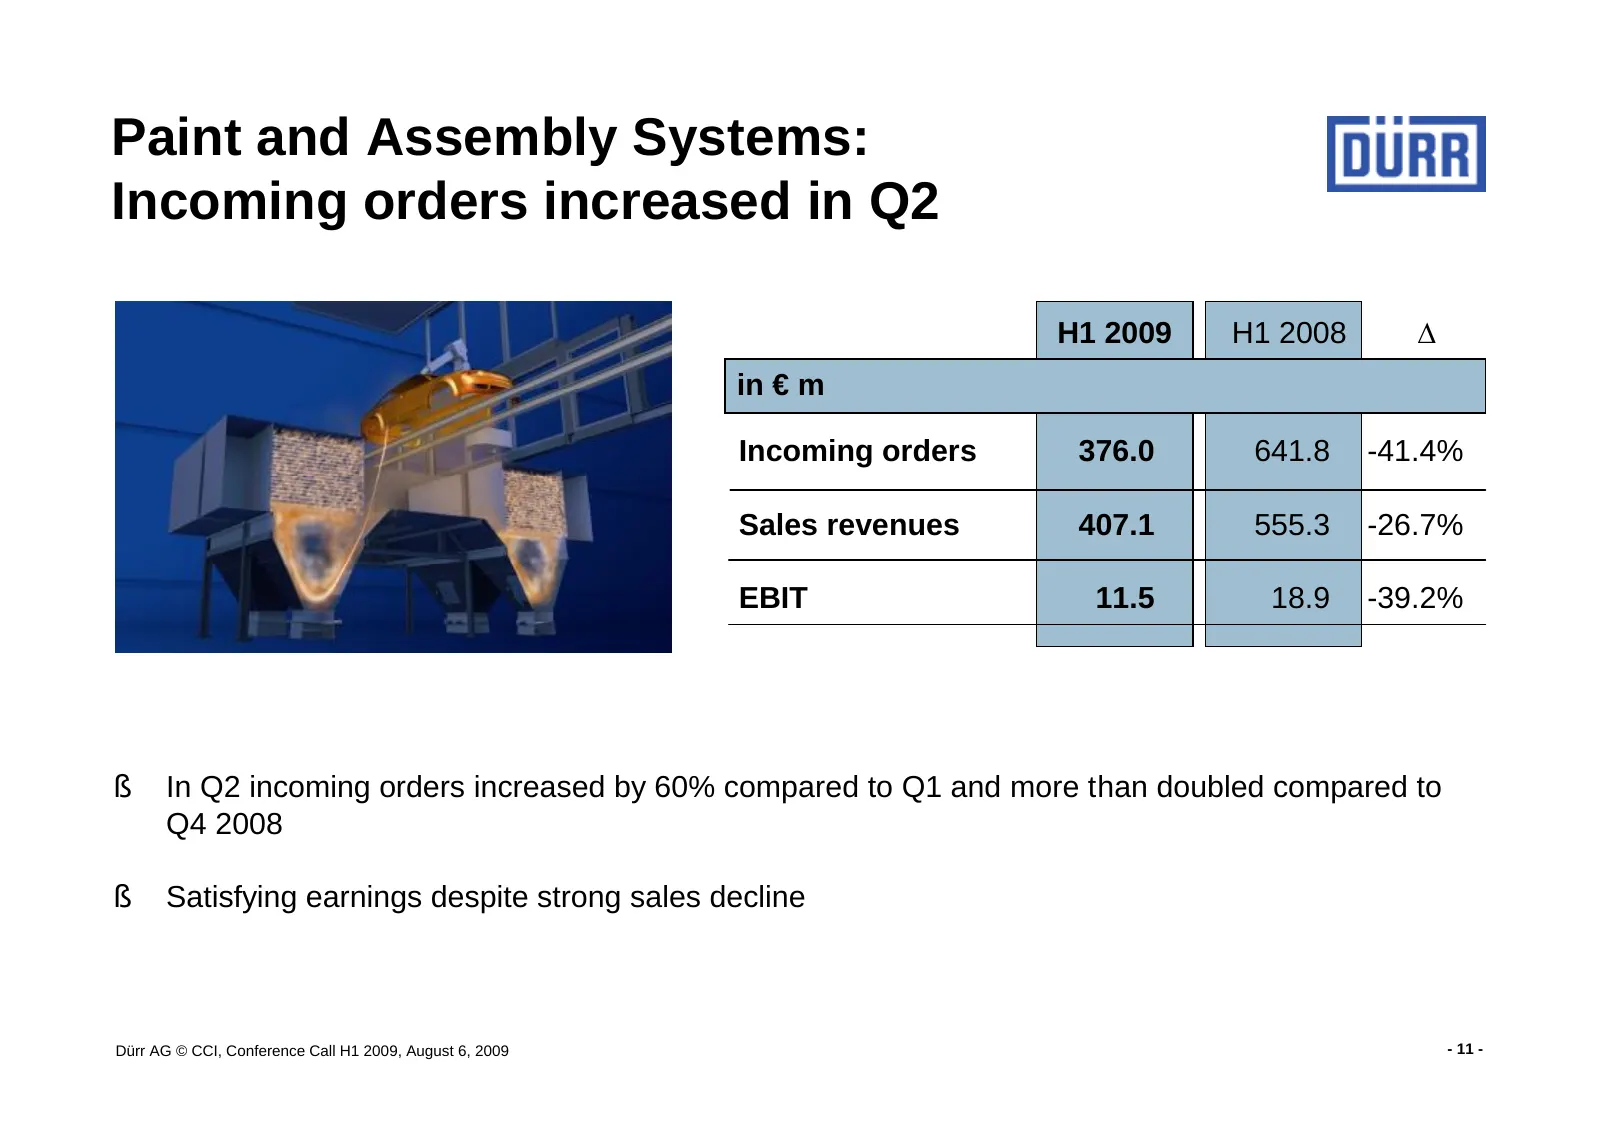
Slide 11: Paint and Assembly Systems: Incoming orders increased in Q2
Paint and Assembly Systems: Incoming orders increased in Q2 H1 2009 H1 2008 ∆ in € m Incoming orders 376.0 641.8 -41.4% Sales revenues 407.1 555.3 -26.7% EBIT 11.5 18.9 -39.2% § In Q2 incoming orders increased by 60% compared to Q1 and more than doubled compared to Q4 2008 § Satisfying earnings desp
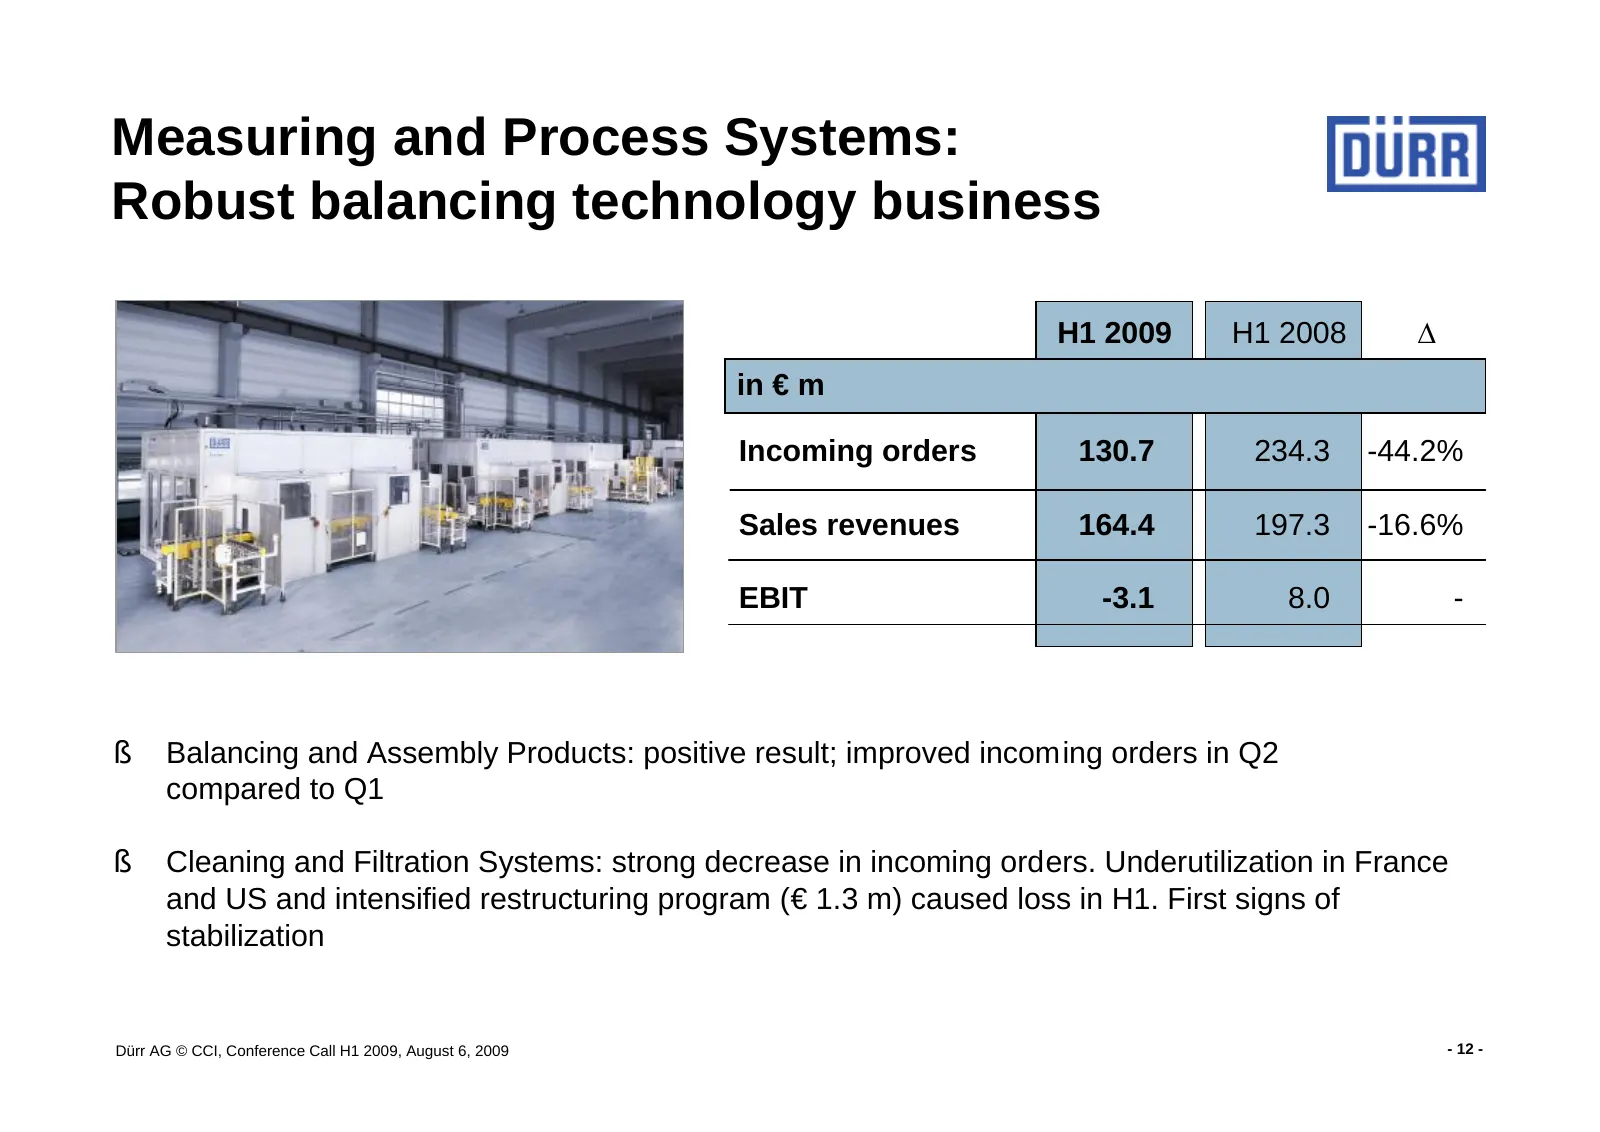
Slide 12: Measuring and Process Systems: Robust balancing technology business
Measuring and Process Systems: Robust balancing technology business H1 2009 H1 2008 ∆ in € m Incoming orders 130.7 234.3 -44.2% Sales revenues 164.4 197.3 -16.6% EBIT -3.1 8.0 - § Balancing and Assembly Products: positive result; improved incoming orders in Q2 compared to Q1 § Cleaning and Filtratio
Slide 13: Cost cutting and utilization measures against downturn in H1 2009
Cost cutting and utilization measures against downturn in H1 2009 Cost savings § Reduction of workforce by 300 since Q4 2008 (09/30/2008: 6,107) § Reduction of temps by 564 since Q4 2008 (09/30/2008: 1,078) § Hiring freeze, natural attrition, working time accounts, short time work § Spending contain
Slide 14: Cost cutting and utilization measures against downturn in H2 2009
Cost cutting and utilization measures against downturn in H2 2009 Cost savings § Additional reduction of workforce by 350 and temps by 150 § Restructuring USA: further downsizing with focus on service; new Service Center in Alabama § Restructuring France: further downsizing with focus on service Pro
Slide 15: Dürr-Campus: We have moved!
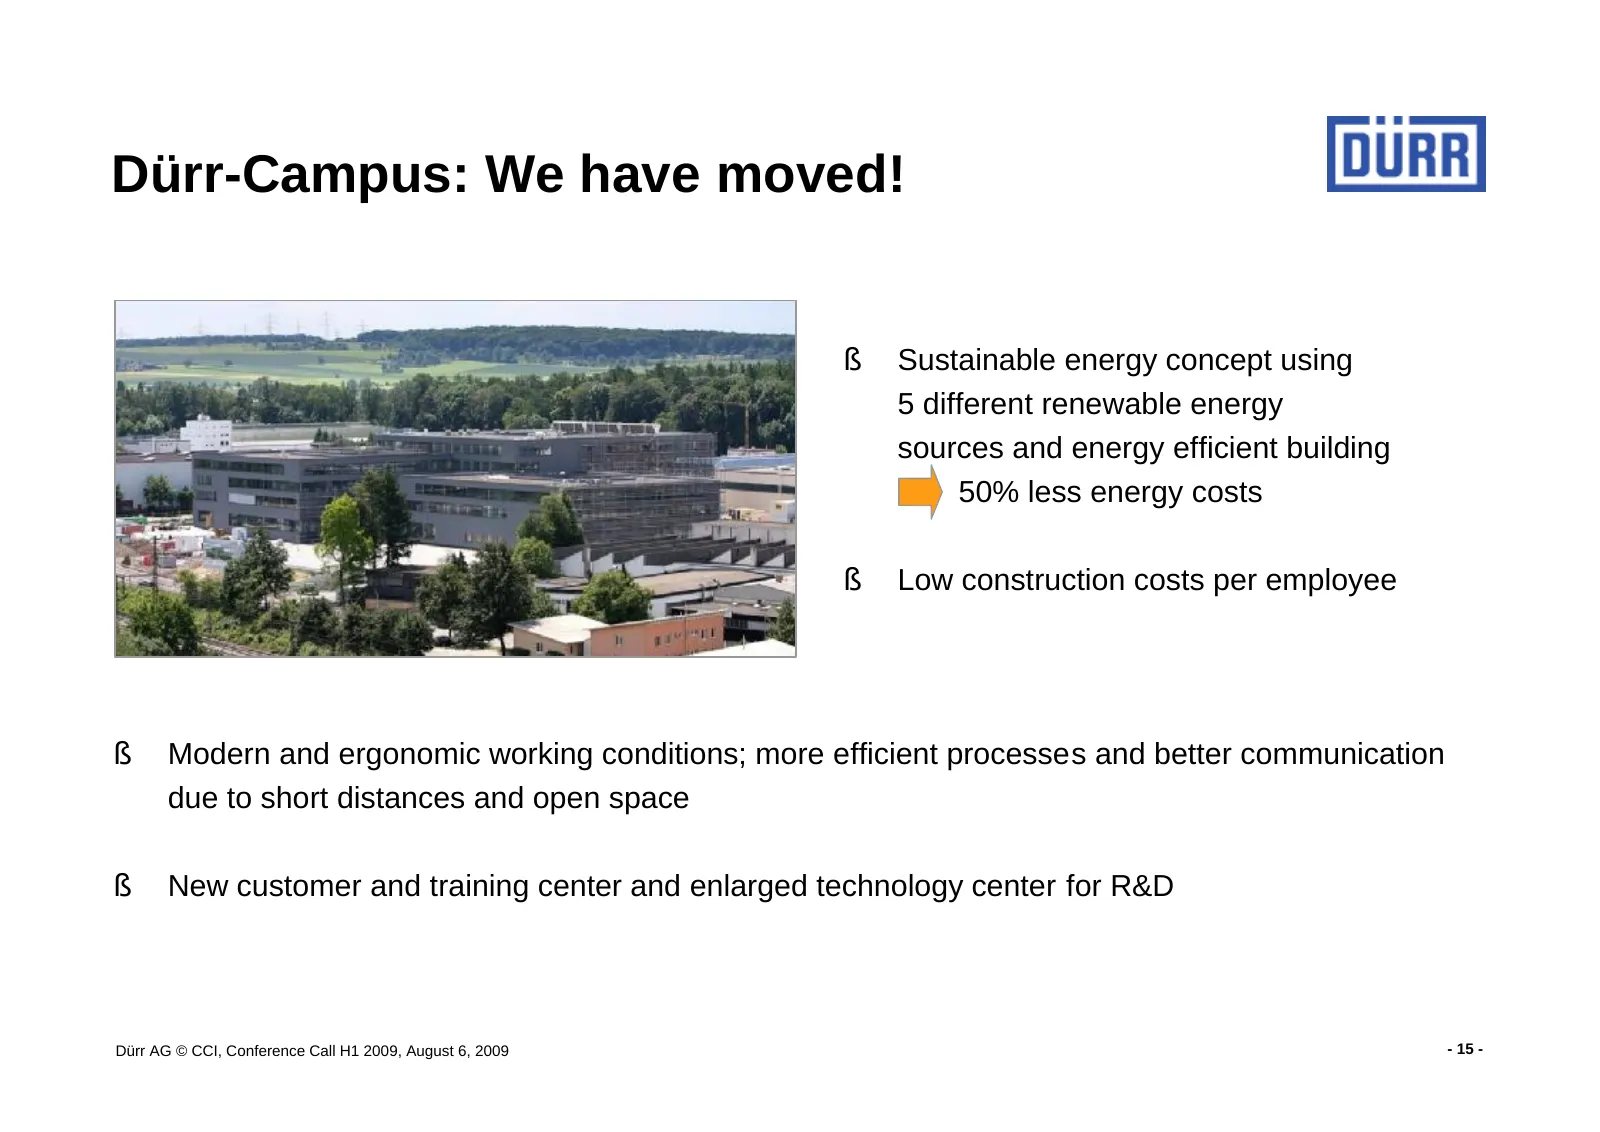
Dürr-Campus: We have moved! § Sustainable energy concept using 5 different renewable energy sources and energy efficient building => 50% less energy costs § Low construction costs per employee § Modern and ergonomic working conditions; more efficient processes and better communication due to short d
Slide 16: Summary
Summary § Adjustment of capacities and processes to lower capex level of OEMs to be finalized by end of 2009 § Dürr to stay EBIT positive in each quarter, cash flow to improve in H2 2009 § Healthy balance sheet, unused credit and guarantee lines stay at € 400 m § Pick-up in tendering, order pipeline

Slide 17: Financial calendar
Financial calendar 08/26/2009 Mechanical Engineering Conference, Commerzbank, Frankfurt 11/05/2009 Interim report January - September 2009 11/09 - 11/11/2009 German Equity Forum, Frankfurt 12/01 - 12/02/2009 Mechanical Engineering Conference, BHF-Bank, Frankfurt 12/03/2009 German Industrials Confere
Slide 18: Dürr AG © CCI, Conference Call H1 2009, August 6, 2009
Dürr AG © CCI, Conference Call H1 2009, August 6, 2009 - 18 -
Slide 19: Shareholder structure August 3, 2009
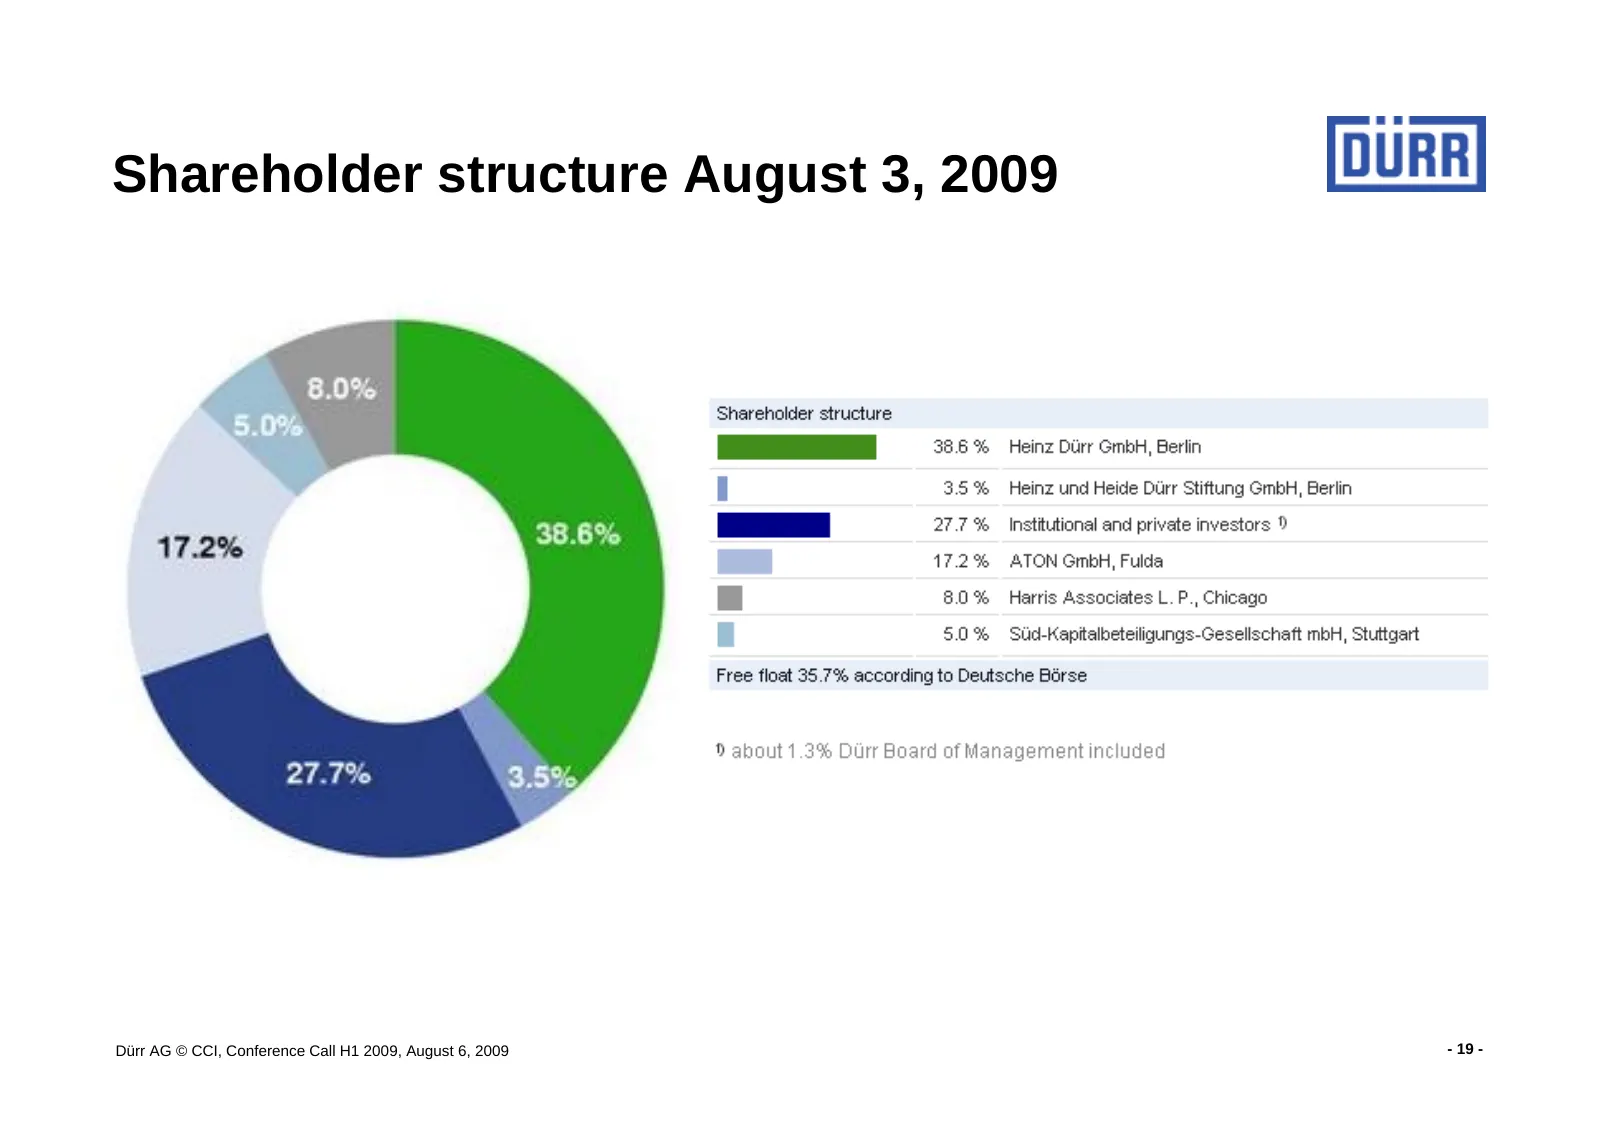
Shareholder structure August 3, 2009 Dürr AG © CCI, Conference Call H1 2009, August 6, 2009 - 19 -
Slide 20: Employees: 23.7% of workforce in emerging markets
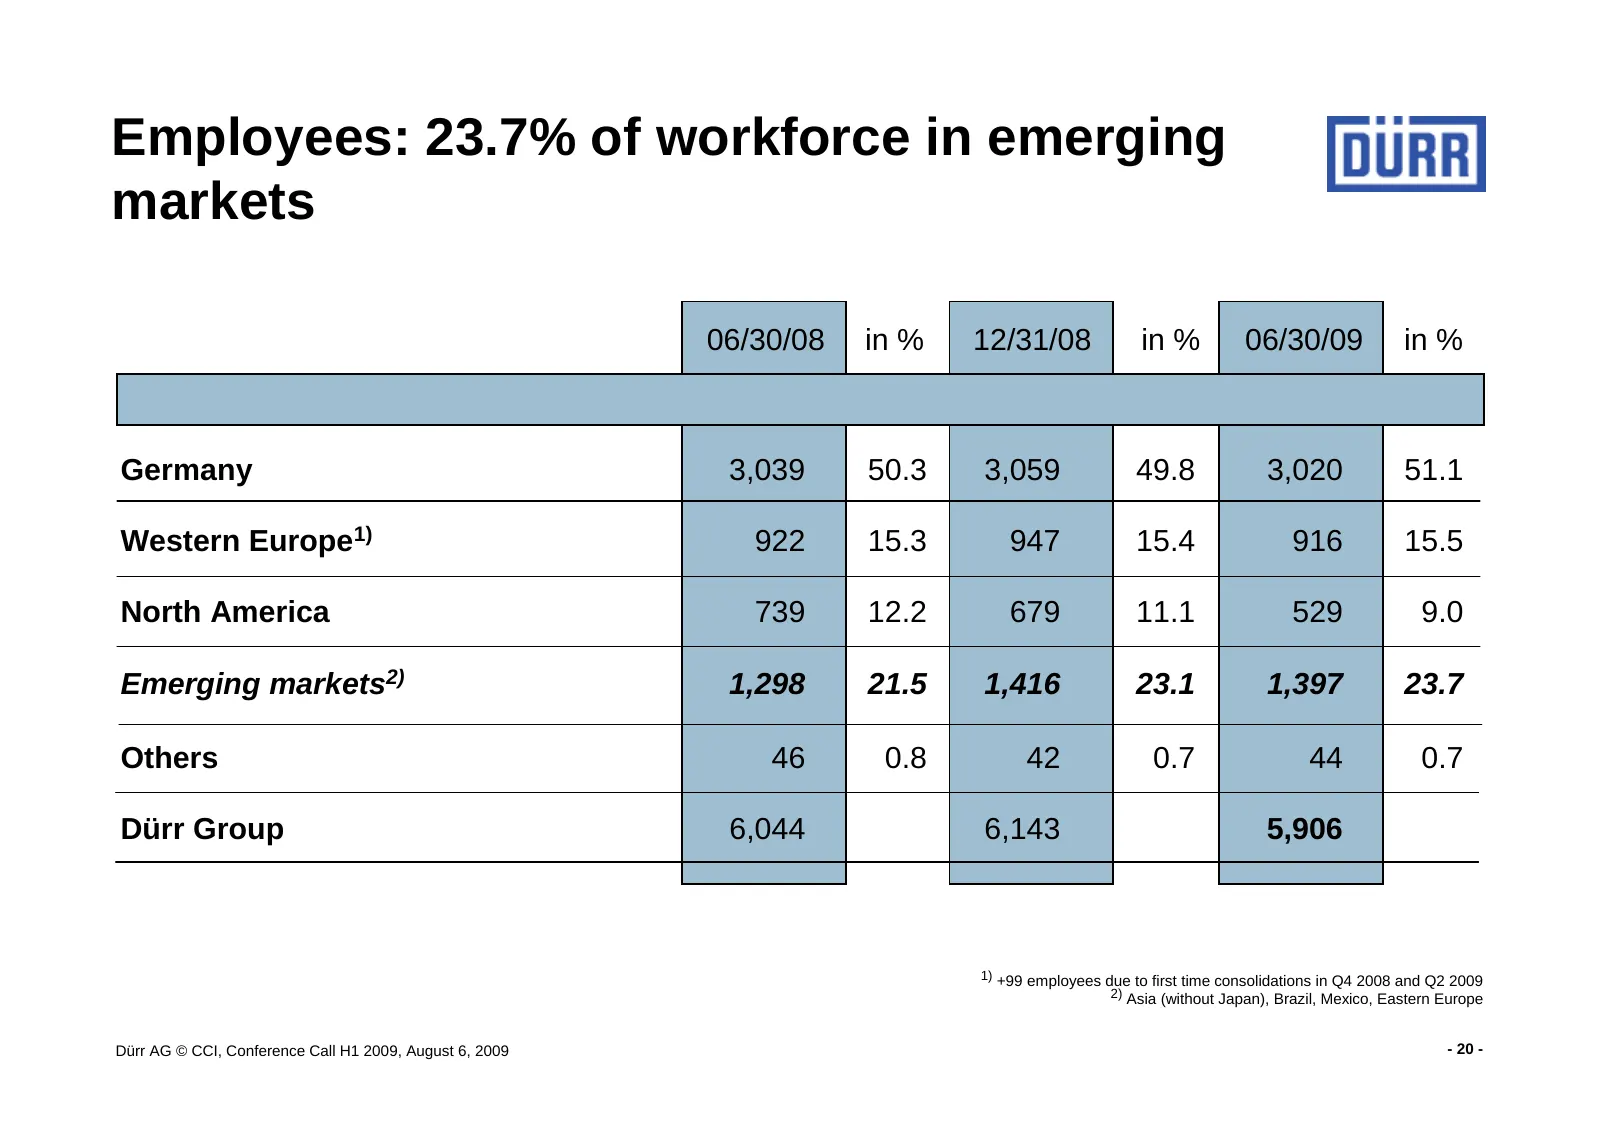
Employees: 23.7% of workforce in emerging markets 06/30/08 in % 12/31/08 in % 06/30/09 in % Germany 3,039 50.3 3,059 49.8 3,020 51.1 Western Europe1) 922 15.3 947 15.4 916 15.5 North America 739 12.2 679 11.1 529 9.0 Emerging markets2) 1,298 21.5 1,416 23.1 1,397 23.7 Others 46 0.8 42 0.7 44 0.7 Dür
Slide 21: Rising small car registrations in Europe
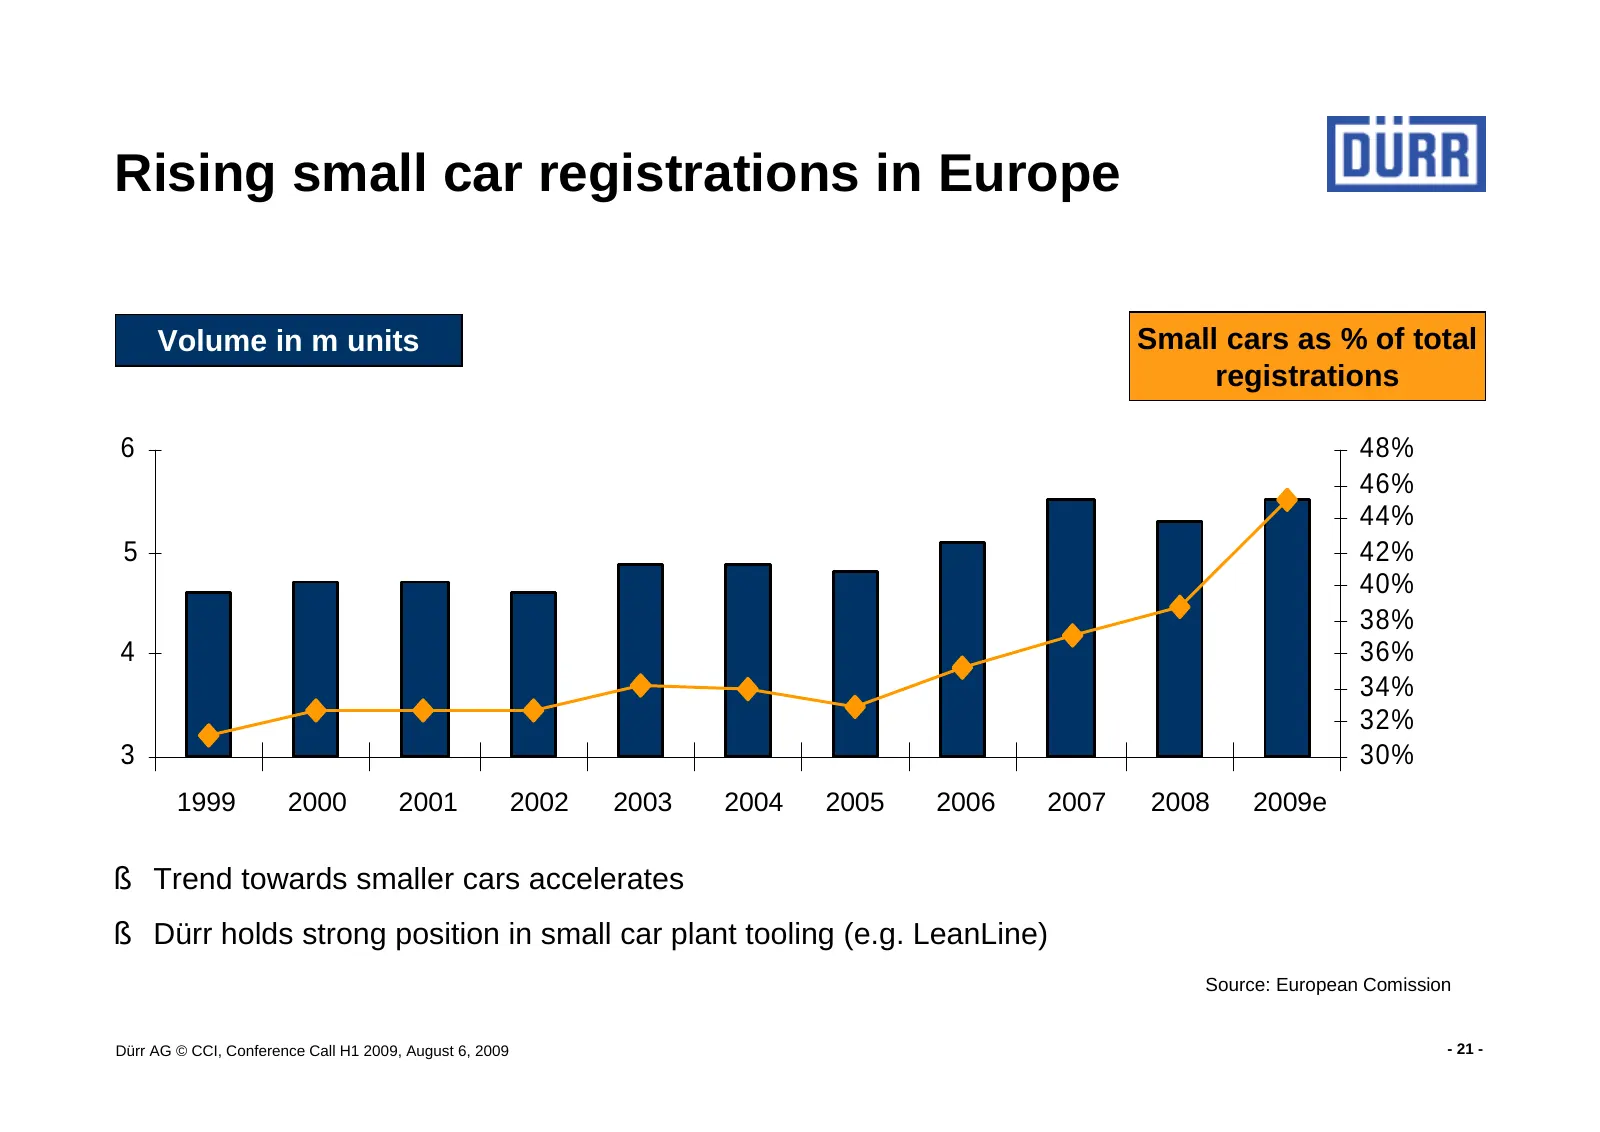
Rising small car registrations in Europe Volume in m units Small cars as % of total registrations 6 48% 46% 44% 5 42% 40% 38% 4 36% 34% 32% 3 30% 1999 2000 2001 2002 2003 2004 2005 2006 2007 2008 2009e 99 00 01 02 03 04 05 06 07 08 e 09 § Trend towards smaller cars accelerates 19 20 20 20 20 20 20 2
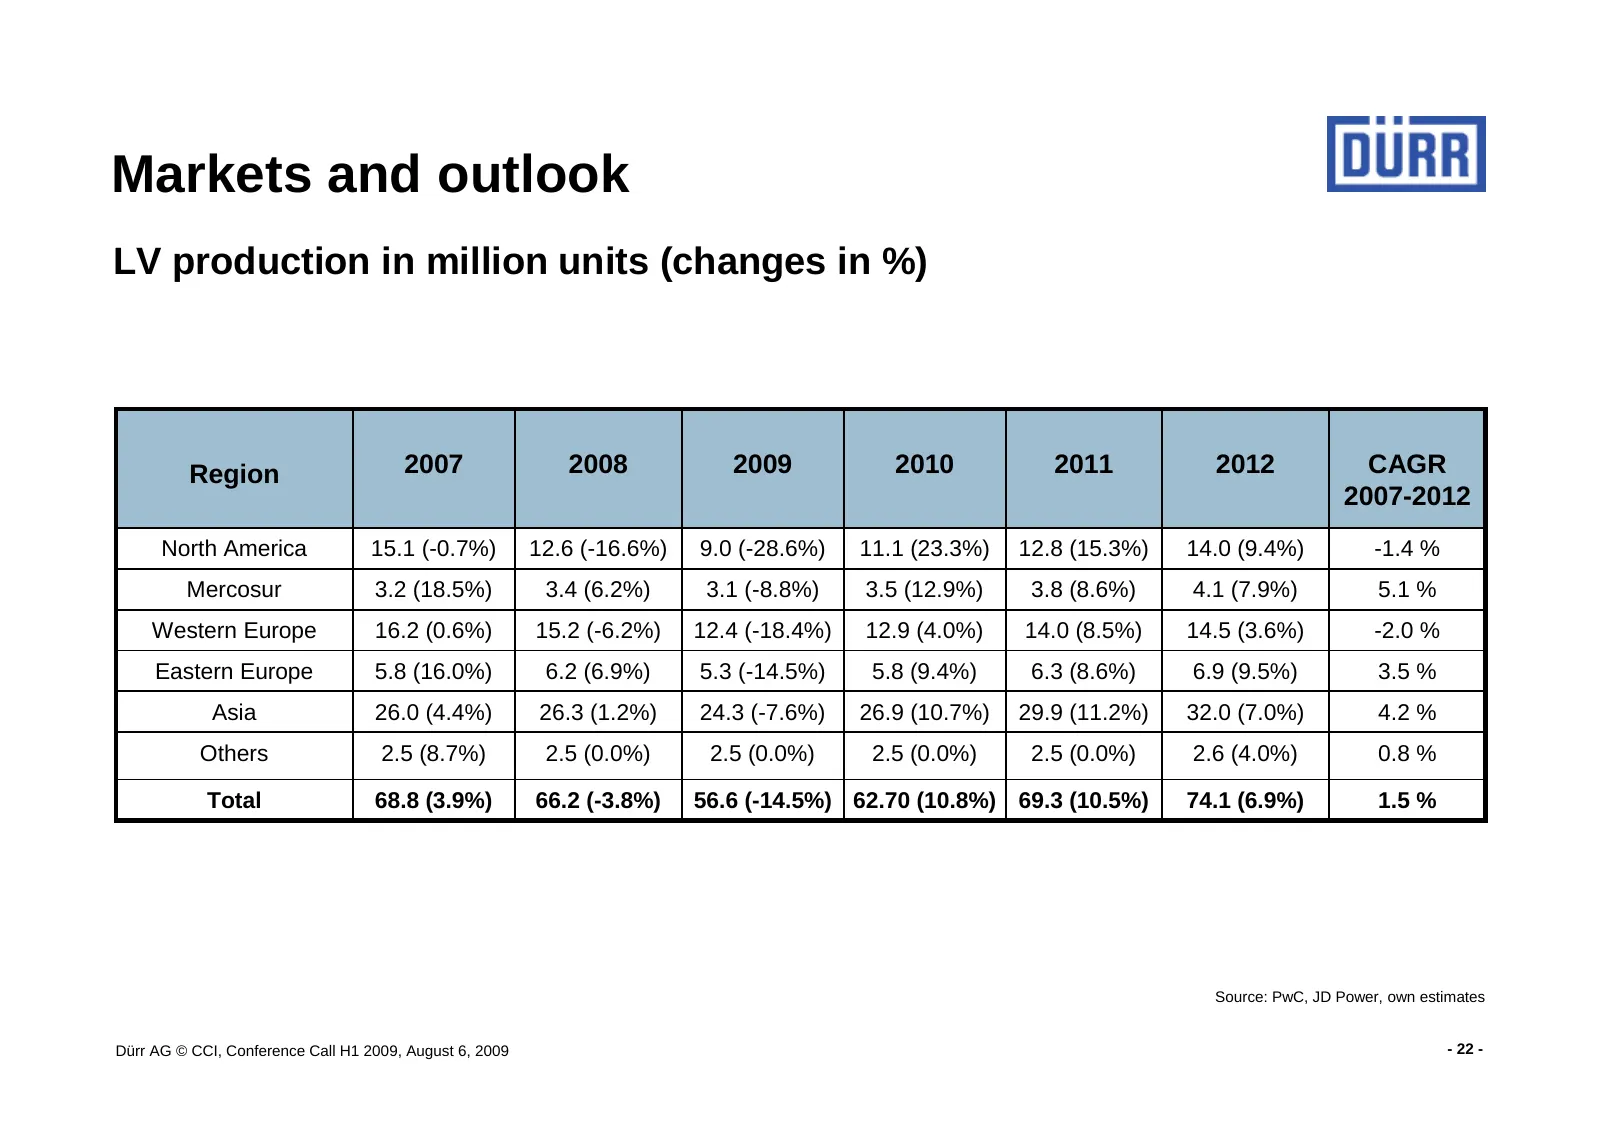
Slide 22: Markets and outlook
Markets and outlook LV production in million units (changes in %) Region 2007 2008 2009 2010 2011 2012 CAGR 2007-2012 North America 15.1 (-0.7%) 12.6 (-16.6%) 9.0 (-28.6%) 11.1 (23.3%) 12.8 (15.3%) 14.0 (9.4%) -1.4 % Mercosur 3.2 (18.5%) 3.4 (6.2%) 3.1 (-8.8%) 3.5 (12.9%) 3.8 (8.6%) 4.1 (7.9%) 5.1 %
Source: Internet Archive copy of durr.com
More decks from Durr AG
 Q3 2026 Earnings Presentation33 slides · Nov 12, 2026
 Q2 2026 Earnings Presentation39 slides · Aug 6, 2026
 Q1 2026 Earnings Presentation35 slides · May 12, 2026
 Fact Sheet (2025)2 slides · Dec 2, 2025
 Q3 2025 Earnings Presentation46 slides · Nov 13, 2025
 Q2 2025 Earnings Presentation31 slides · Jul 24, 2025