Great Plains Energy Incorporated
Great Plains Energy — Non-Deal Roadshow (June 2009)
17 slides from Great Plains Energy's roadshow presentation, Jun 16, 2009
Slide 1: Great Plains Energy Investor Meetings
Exhibit 99.1 Great Plains Energy Investor Meetings June 17, 2009 P_VOELTEKJ\GXP Roadshow Draft (May 8th) v2.ppt
Slide 2: Company Representatives
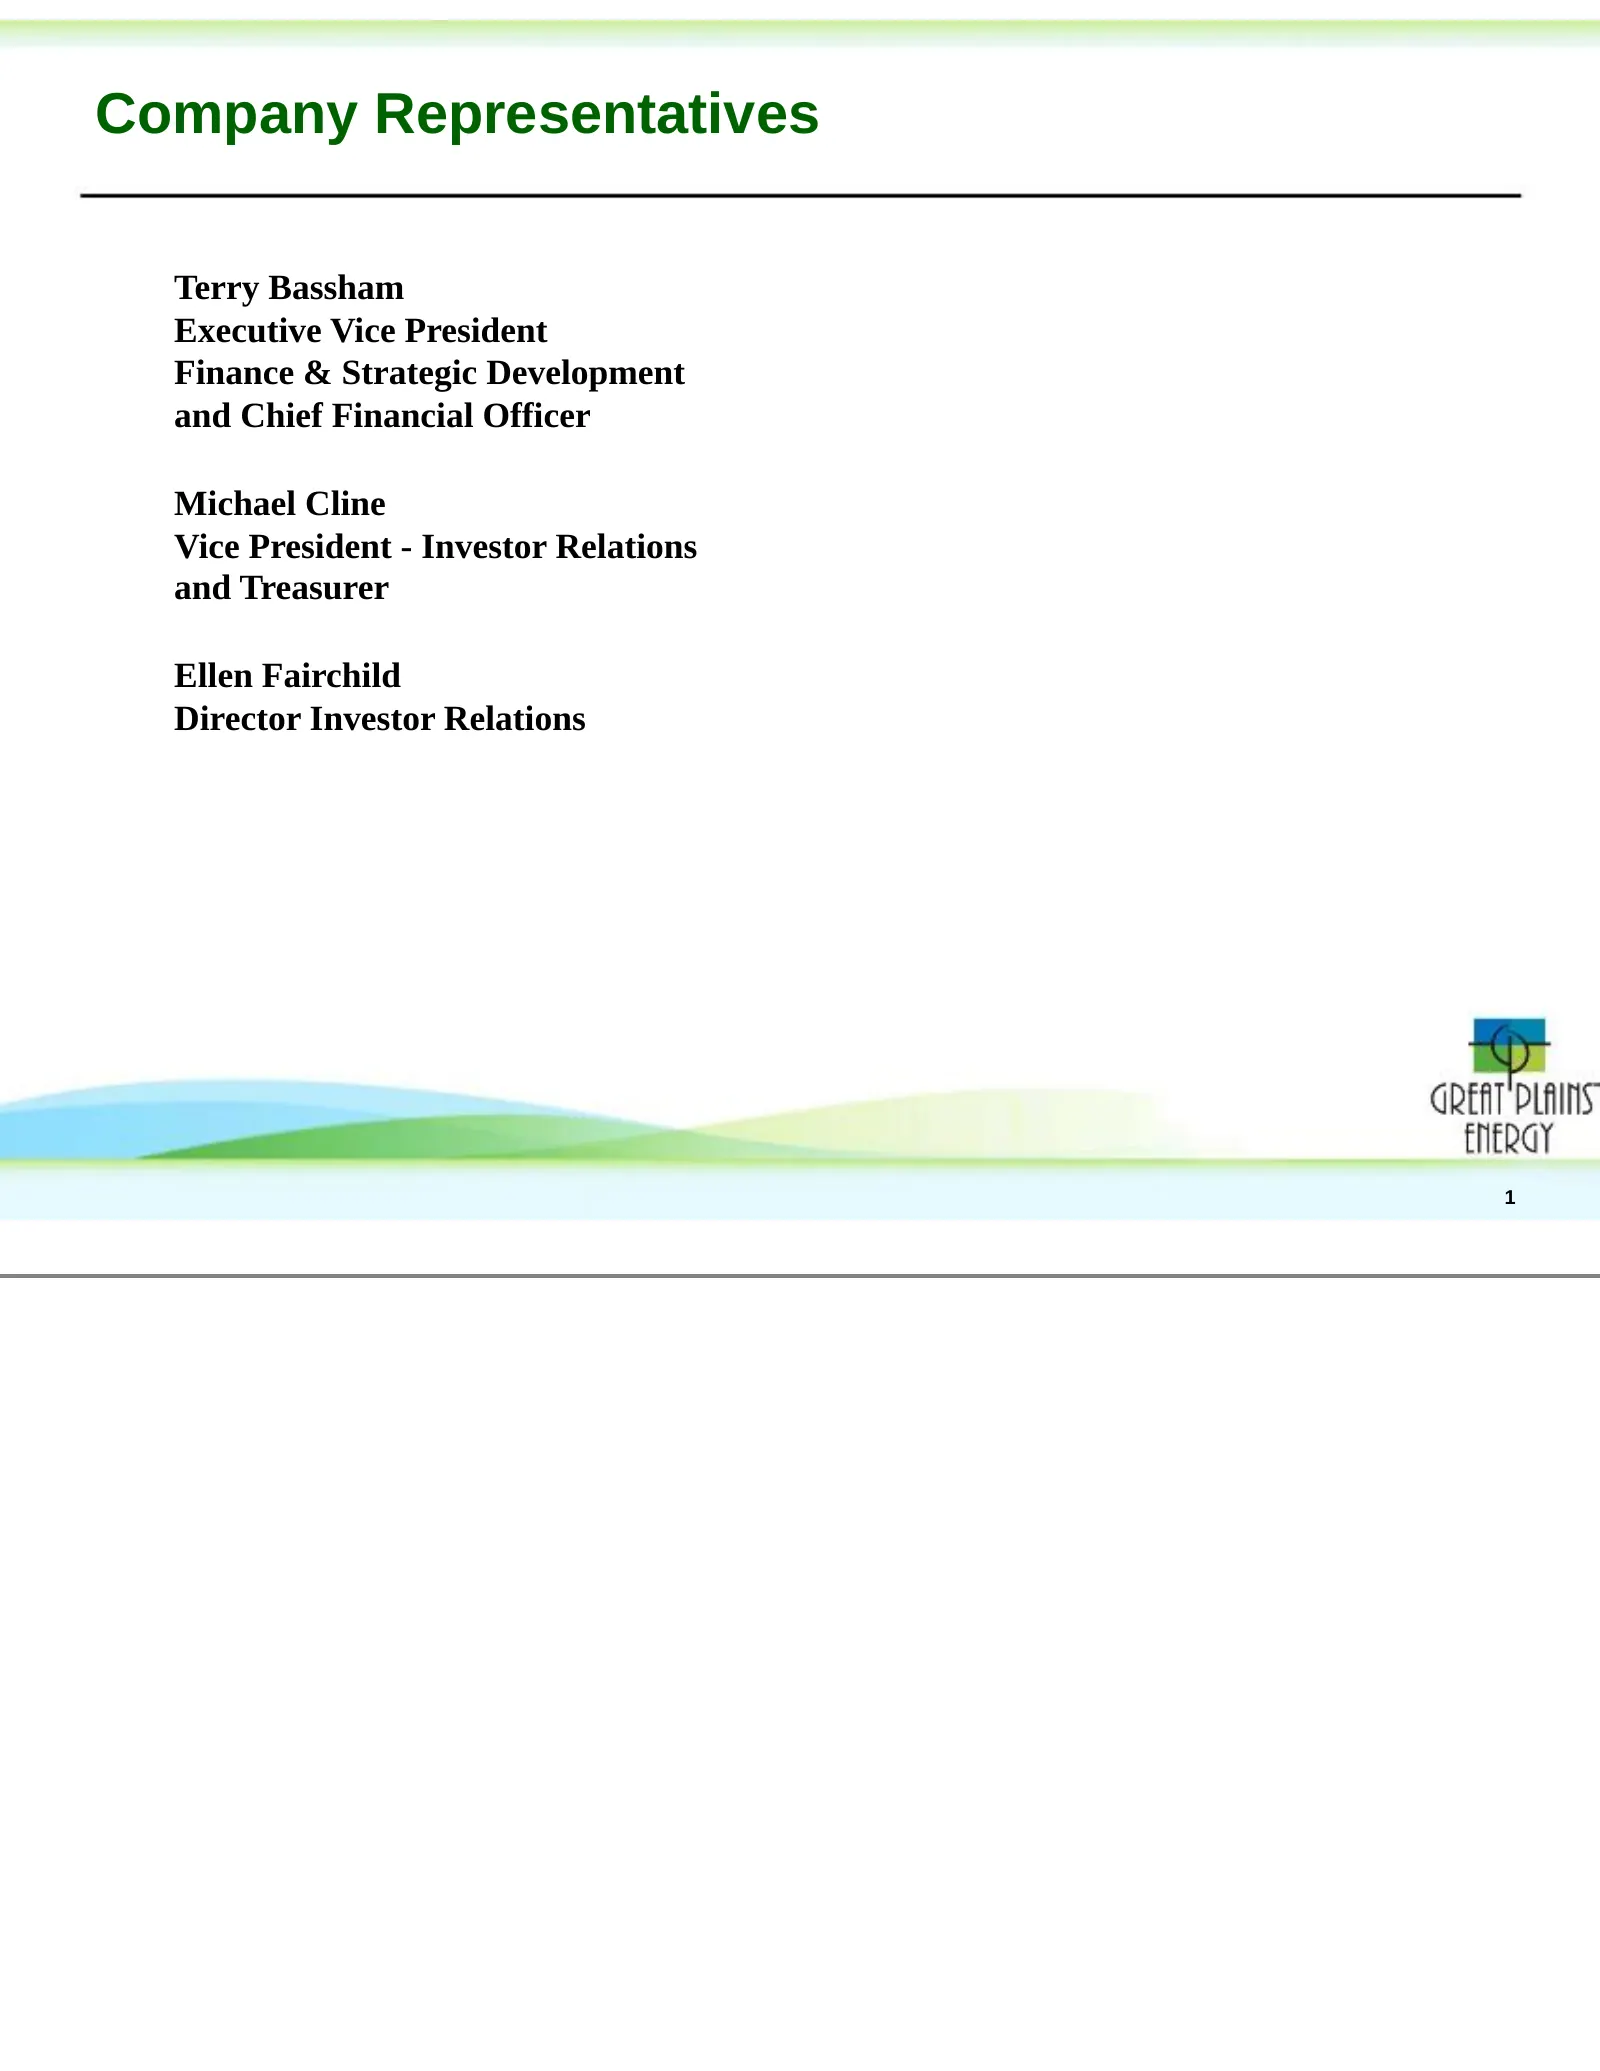
Company Representatives Terry Bassham Executive Vice President Finance & Strategic Development and Chief Financial Officer Michael Cline Vice President - Investor Relations and Treasurer Ellen Fairchild Director Investor Relations 1
Slide 3: Forward Looking Statements
Forward Looking Statements FORWARD-LOOKING STATEMENTS Statements made in this presentation that are not based on historical facts are forward-looking, may involve risks and uncertainties, and are ntended to be as of the date when made. Forward-looking statements include, but are not limited to, the
Slide 4: Key Investment Highlights
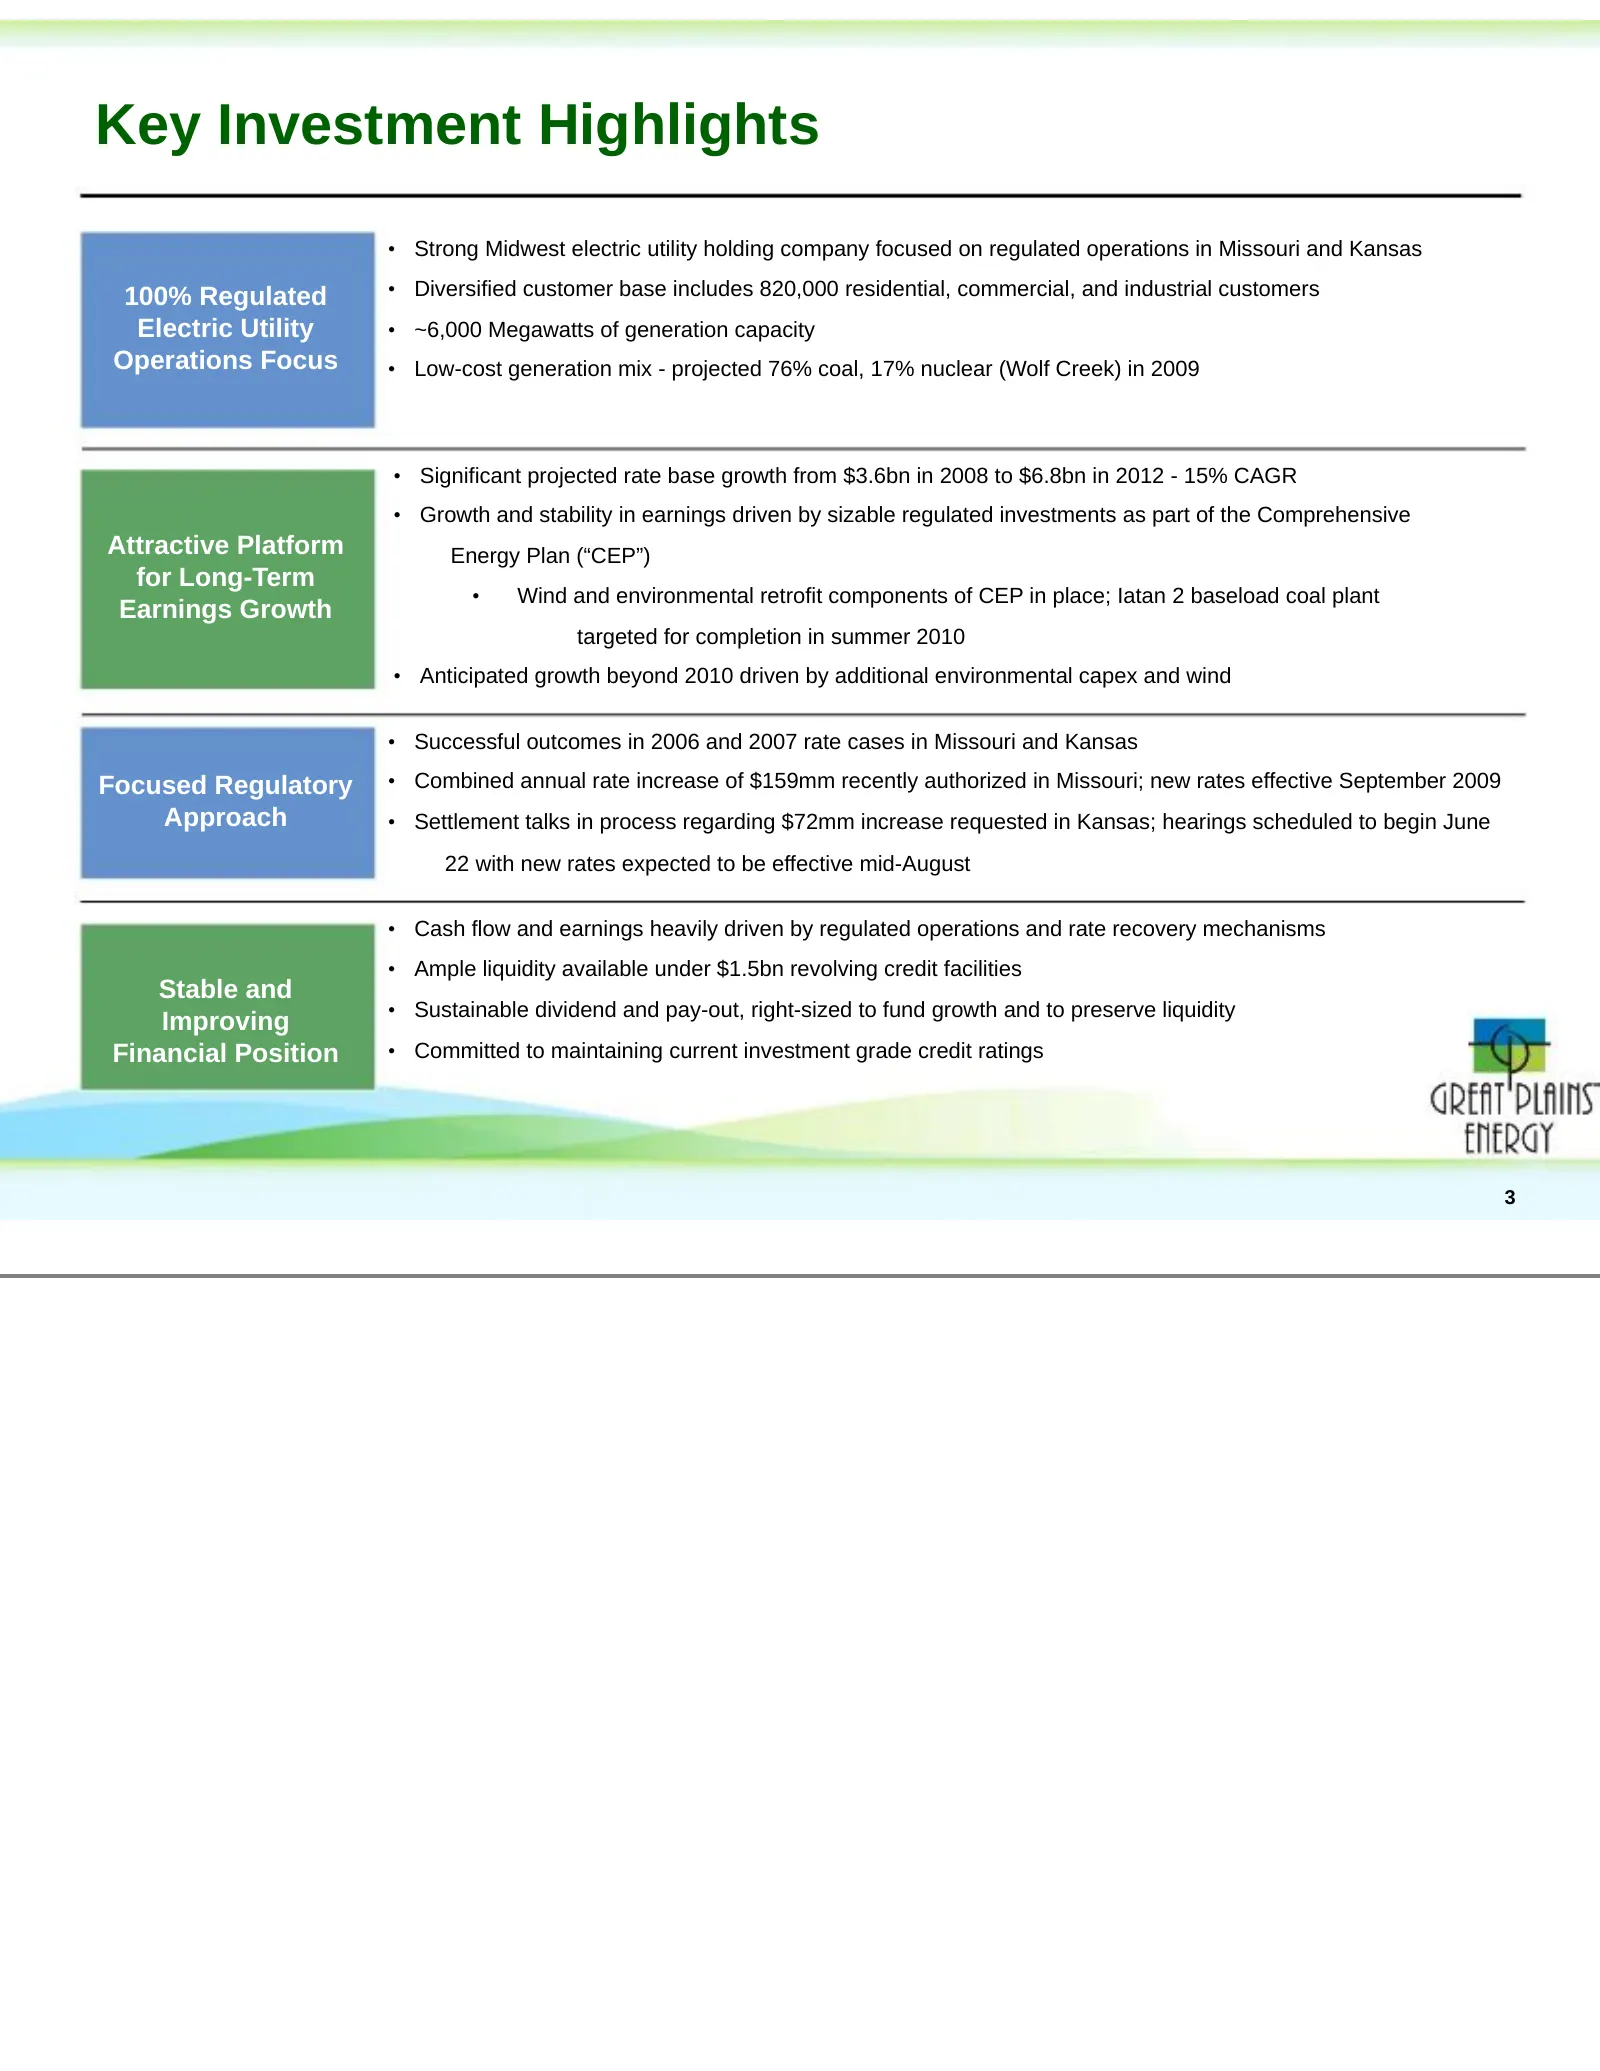
Key Investment Highlights • Strong Midwest electric utility holding company focused on regulated operations in Missouri and Kansas 100% Regulated • Diversified customer base includes 820,000 residential, commercial, and industrial customers Electric Utility • ~6,000 Megawatts of generation capacity
Slide 5: Regulated Electric Utility Operations
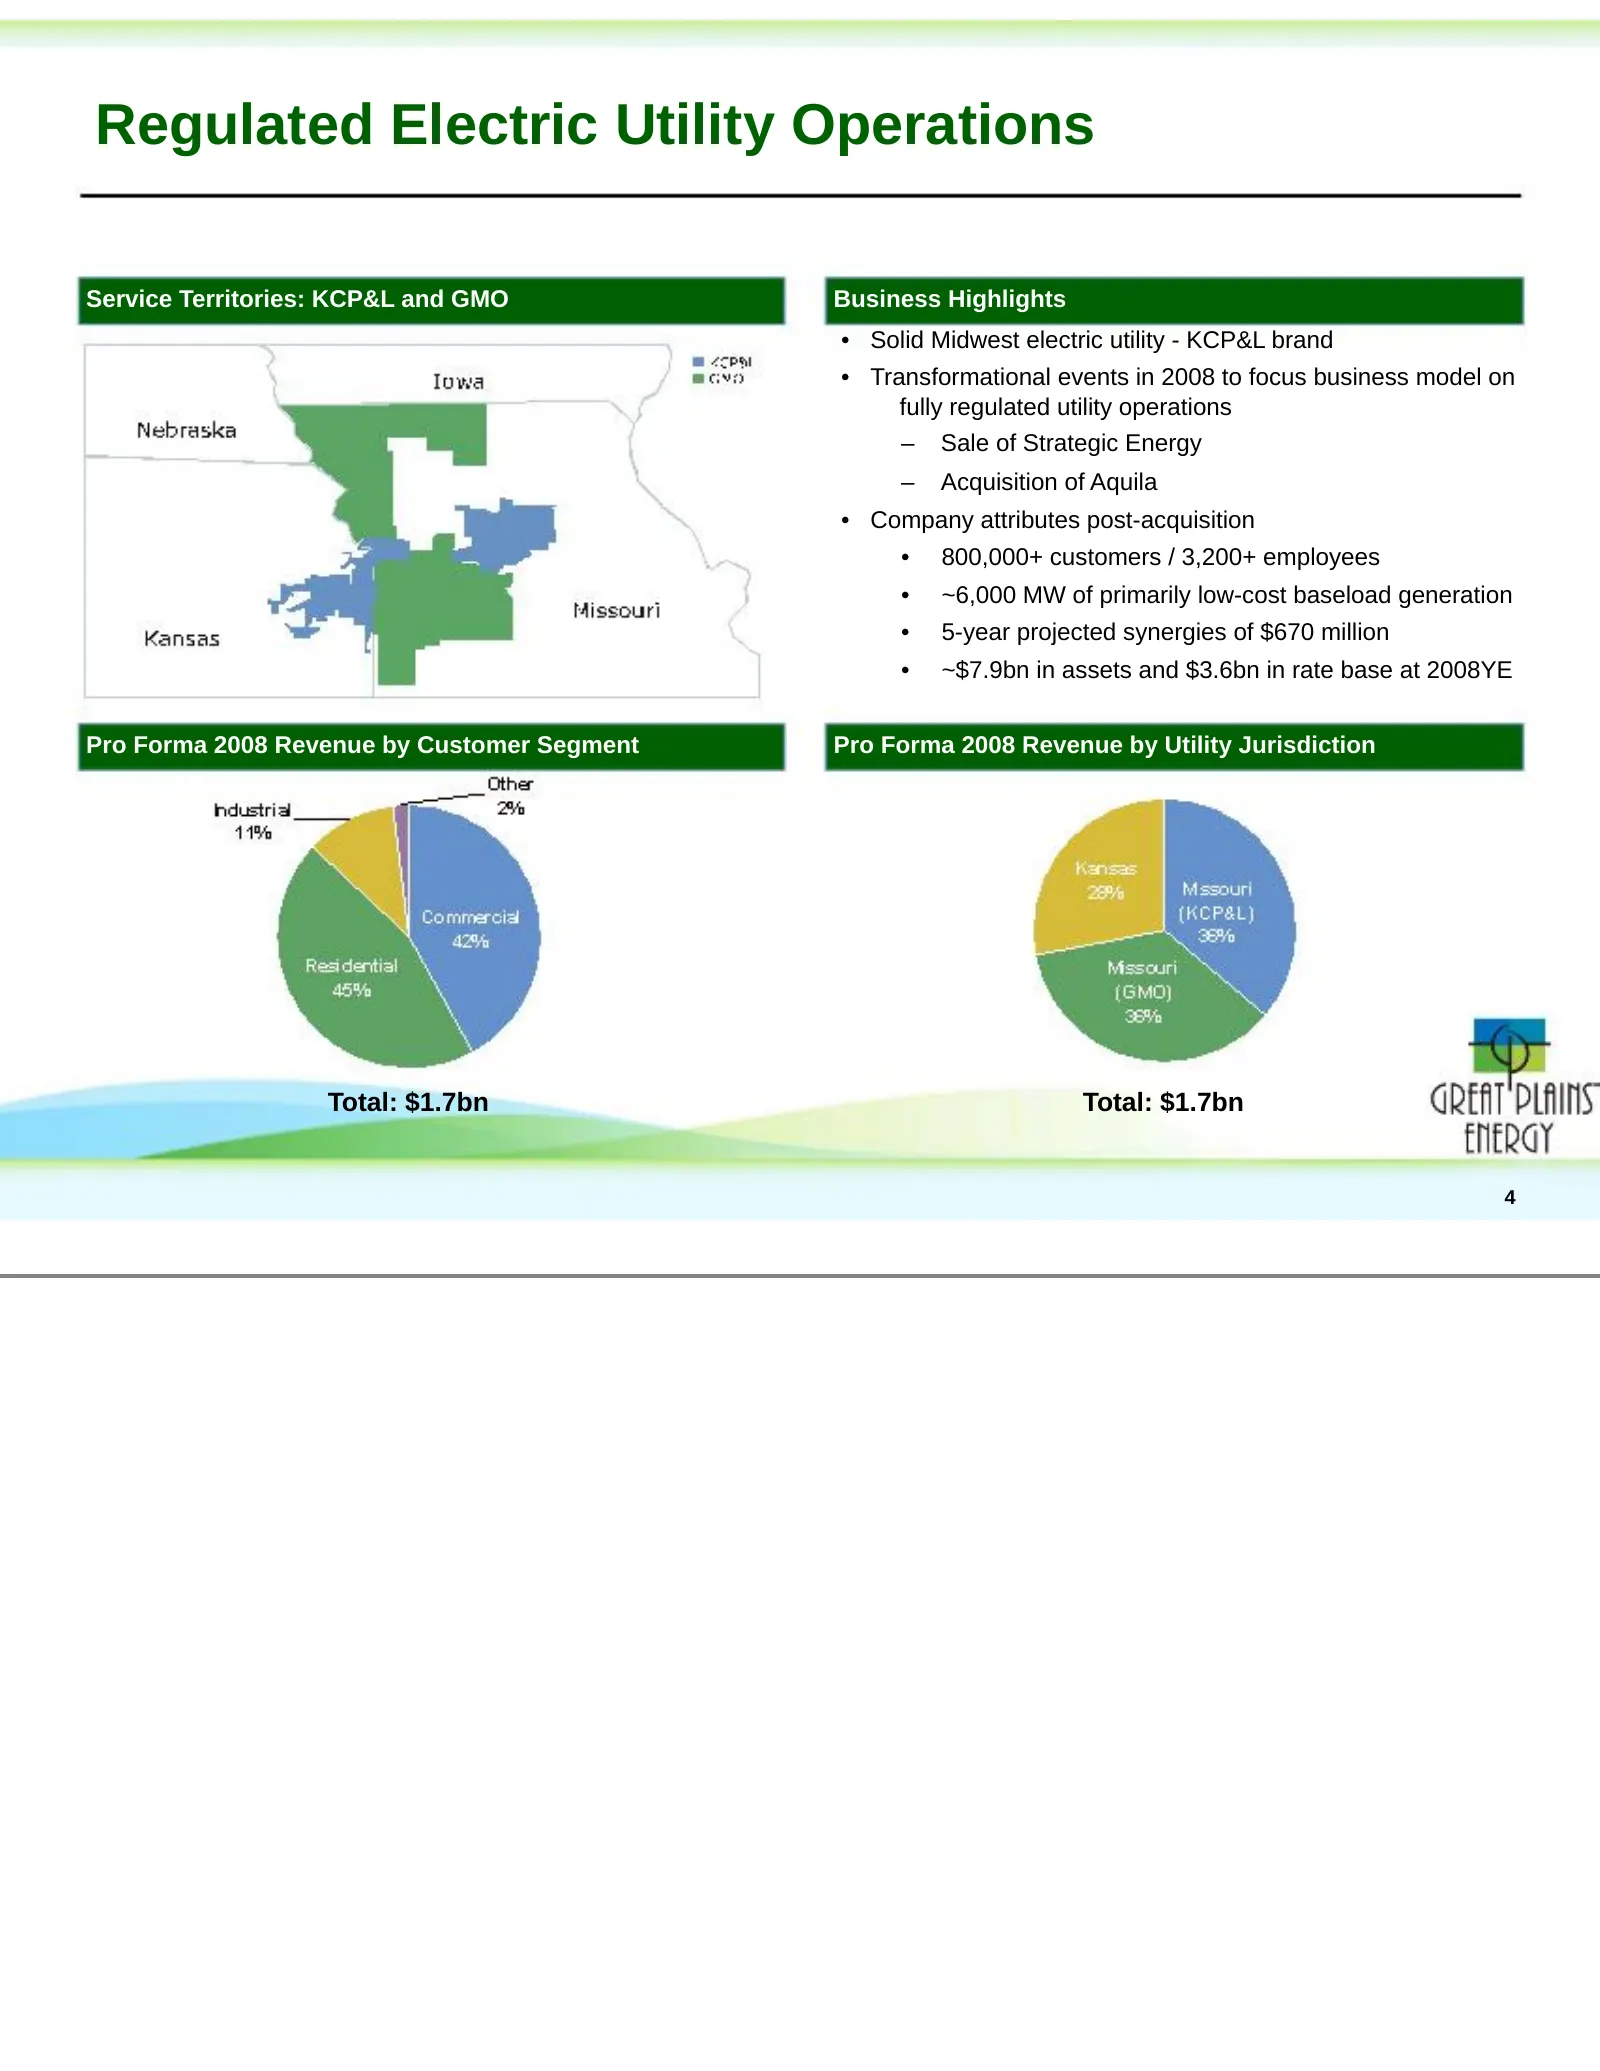
Regulated Electric Utility Operations Service Territories: KCP&L and GMO Business Highlights • Solid Midwest electric utility - KCP&L brand • Transformational events in 2008 to focus business model on fully regulated utility operations – Sale of Strategic Energy – Acquisition of Aquila • Company att
Slide 6: Attractive Platform for Long-Term Growth
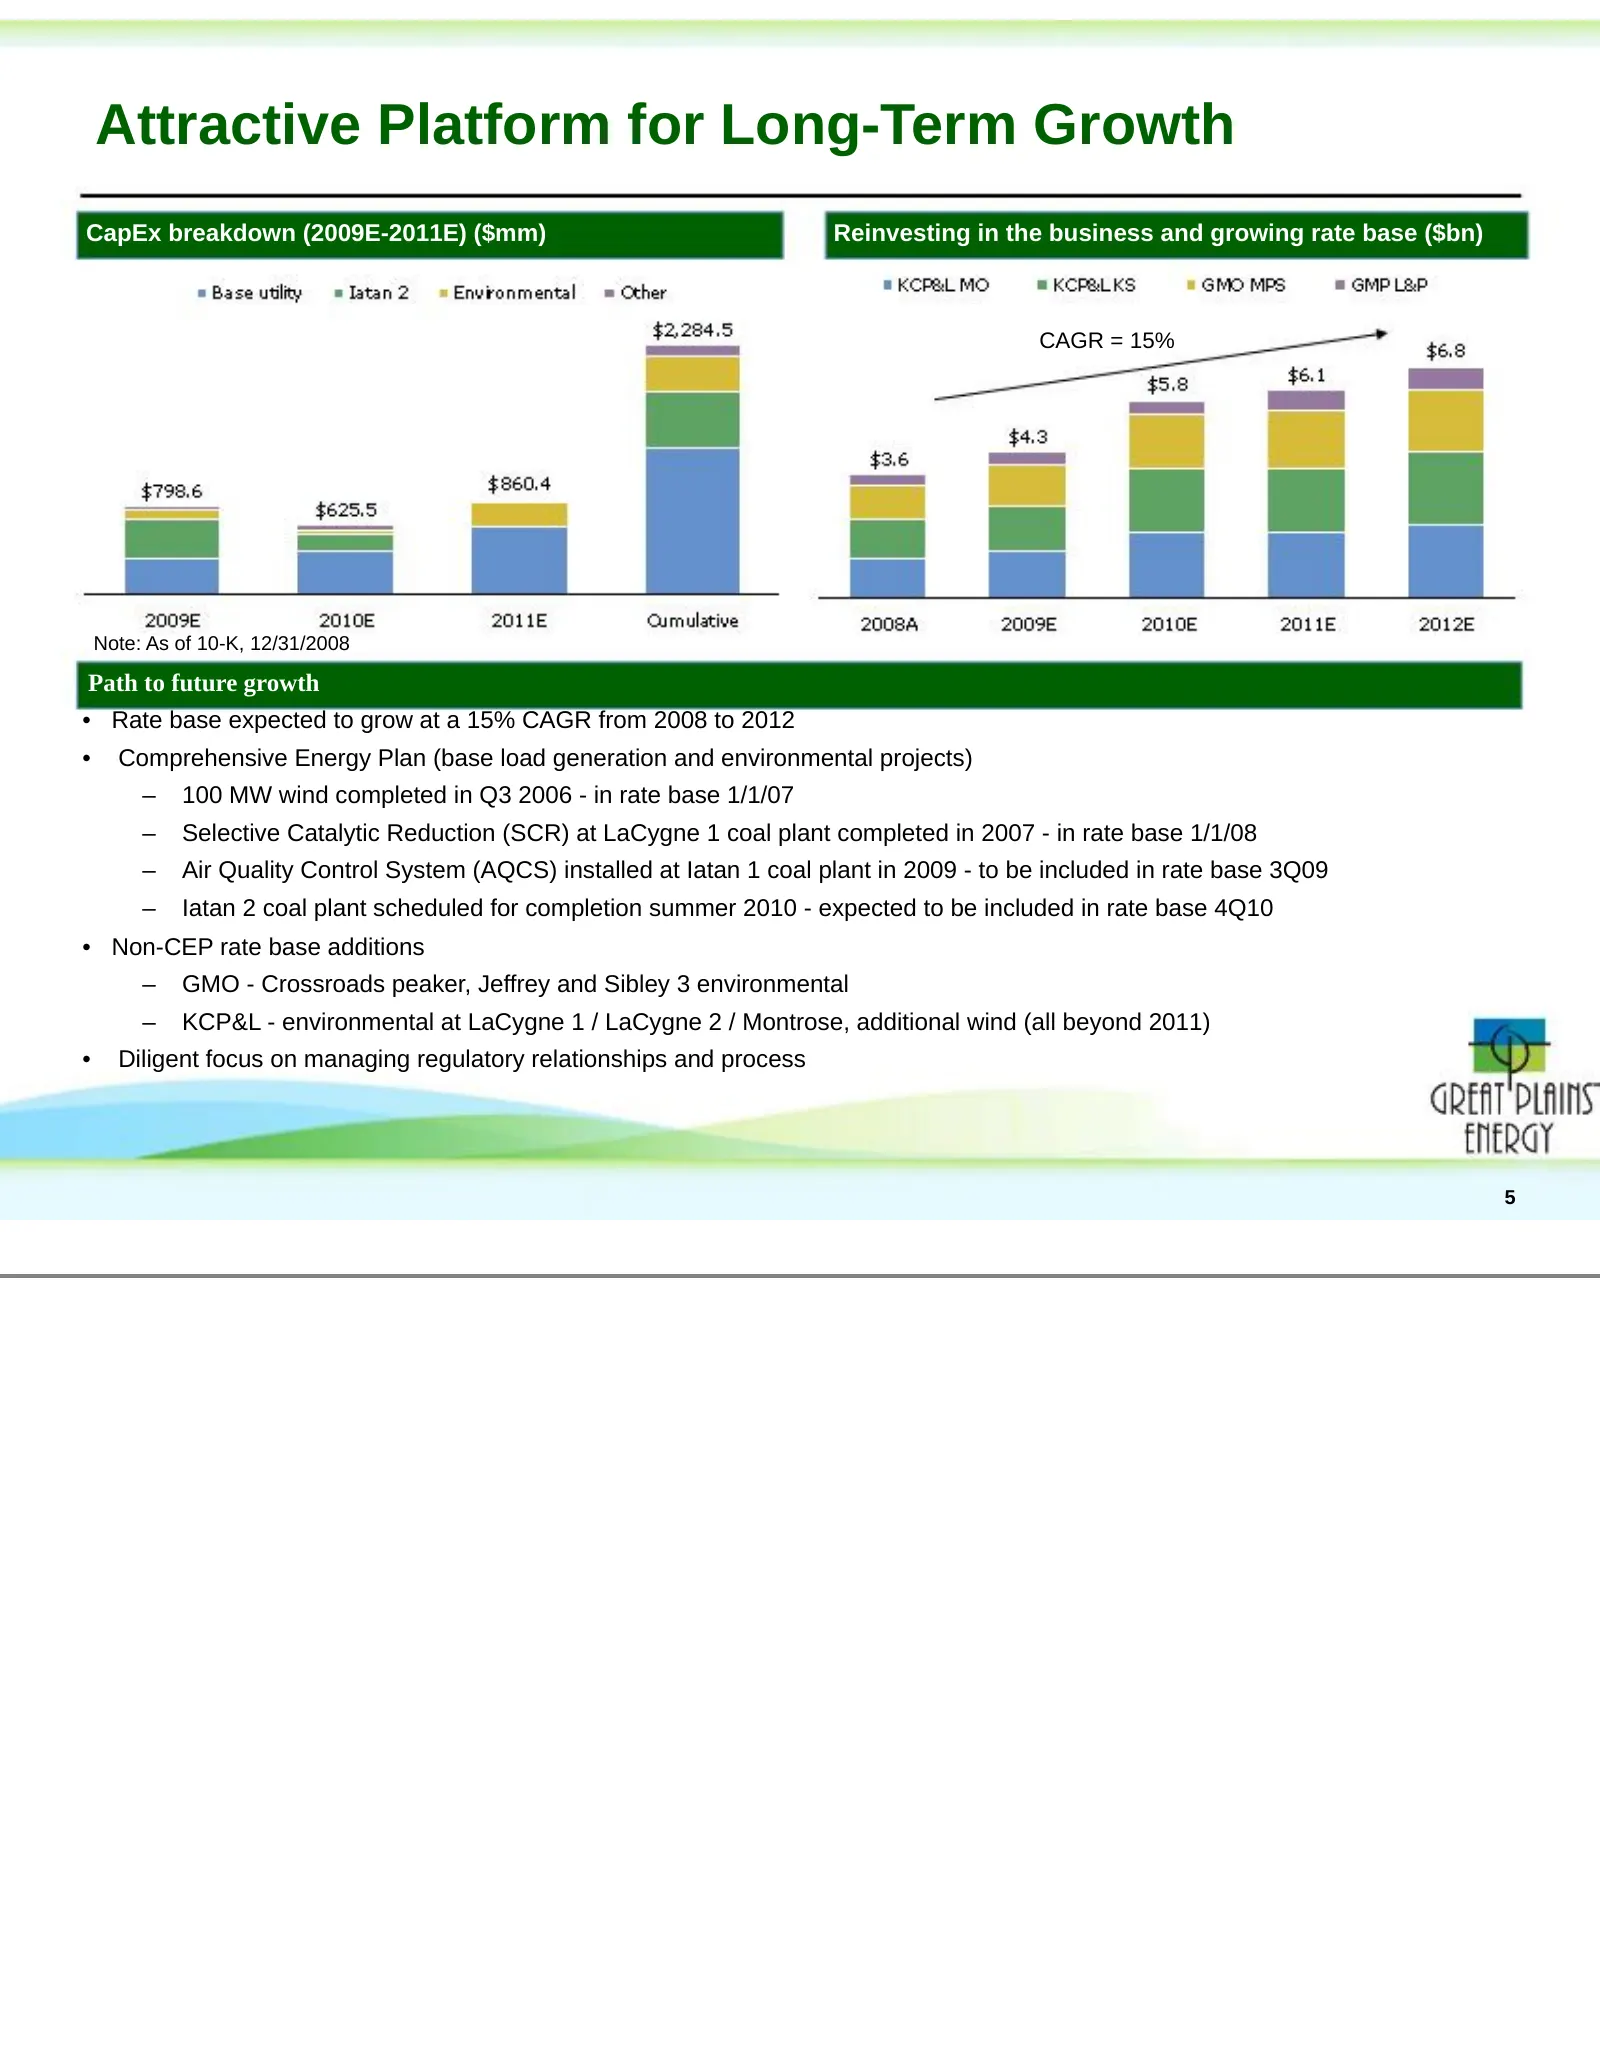
Attractive Platform for Long-Term Growth CapEx breakdown (2009E-2011E) ($mm) Reinvesting in the business and growing rate base ($bn) CAGR = 15% Note: As of 10-K, 12/31/2008 Path to future growth • Rate base expected to grow at a 15% CAGR from 2008 to 2012 • Comprehensive Energy Plan (base load gener
Slide 7: Focused Regulatory Approach
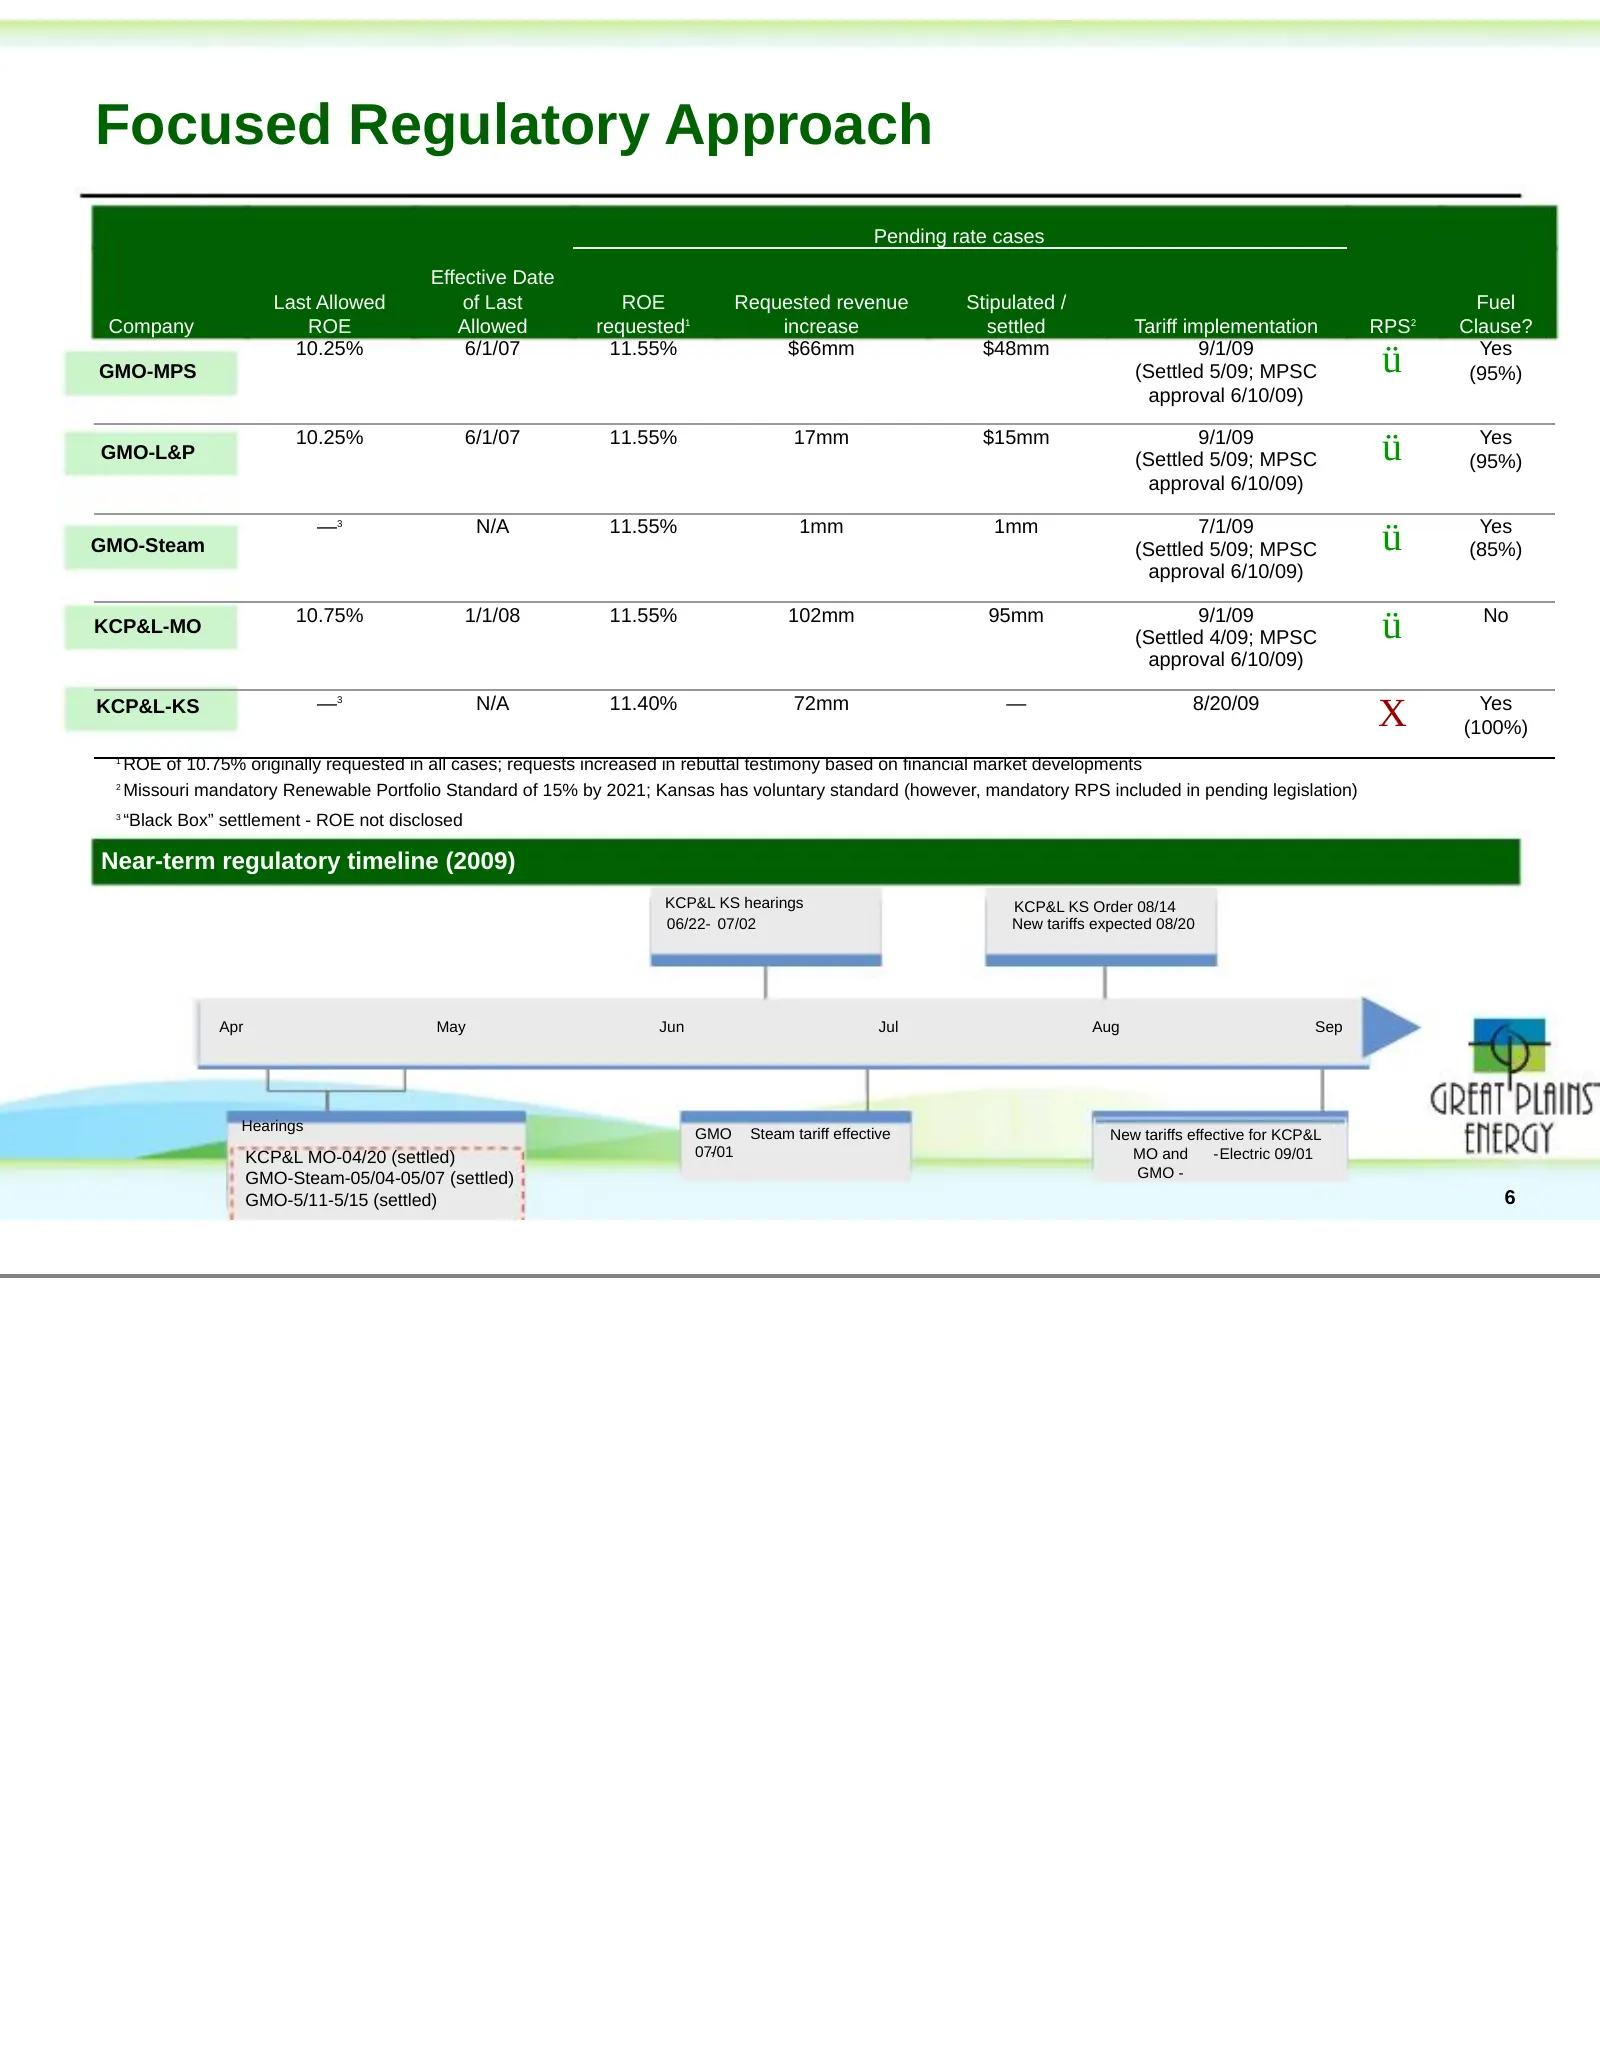
Focused Regulatory Approach Pending rate cases Effective Date Last Allowed of Last ROE Requested revenue Stipulated / Fuel Company ROE Allowed requested1 increase settled Tariff implementation RPS2 Clause? GMO-MPS 10.25% 6/1/07 ROE 11.55% $66mm $48mm revenue increase 9/1/09 (Settled 5/09; MPSC ü Yes
Slide 8: Missouri Regulatory Update
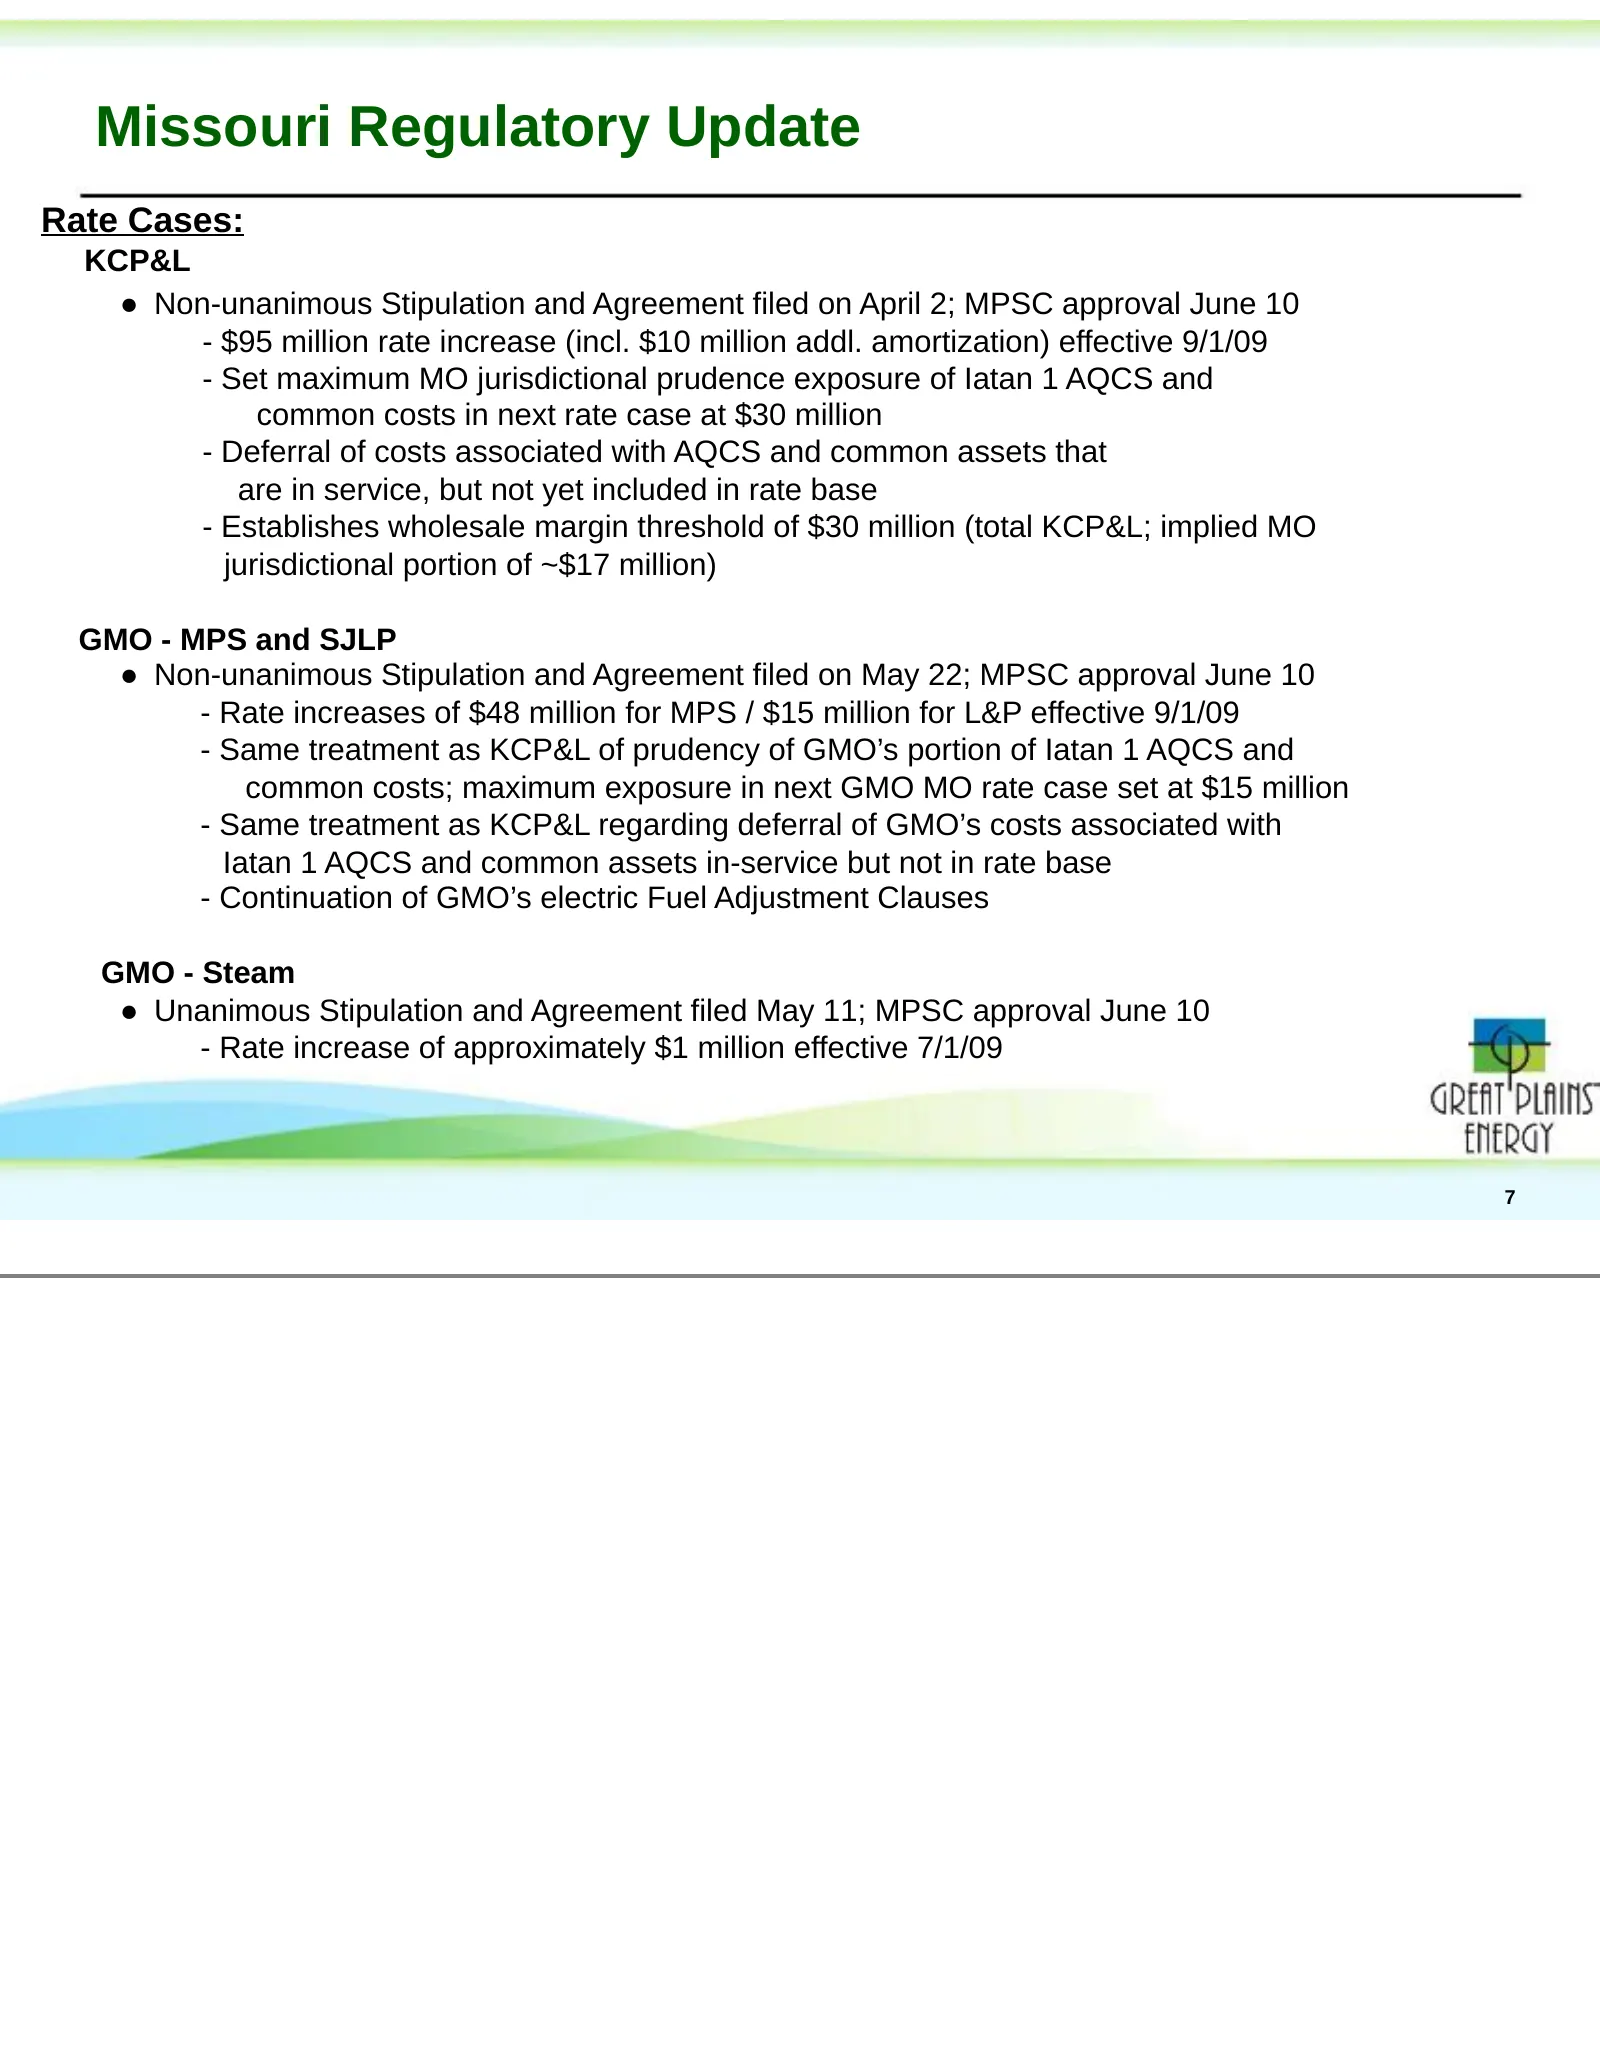
Missouri Regulatory Update Rate Cases: KCP&L ● Non-unanimous Stipulation and Agreement filed on April 2; MPSC approval June 10 - $95 million rate increase (incl. $10 million addl. amortization) effective 9/1/09 - Set maximum MO jurisdictional prudence exposure of Iatan 1 AQCS and common costs in nex
Slide 9: KS Regulatory Update
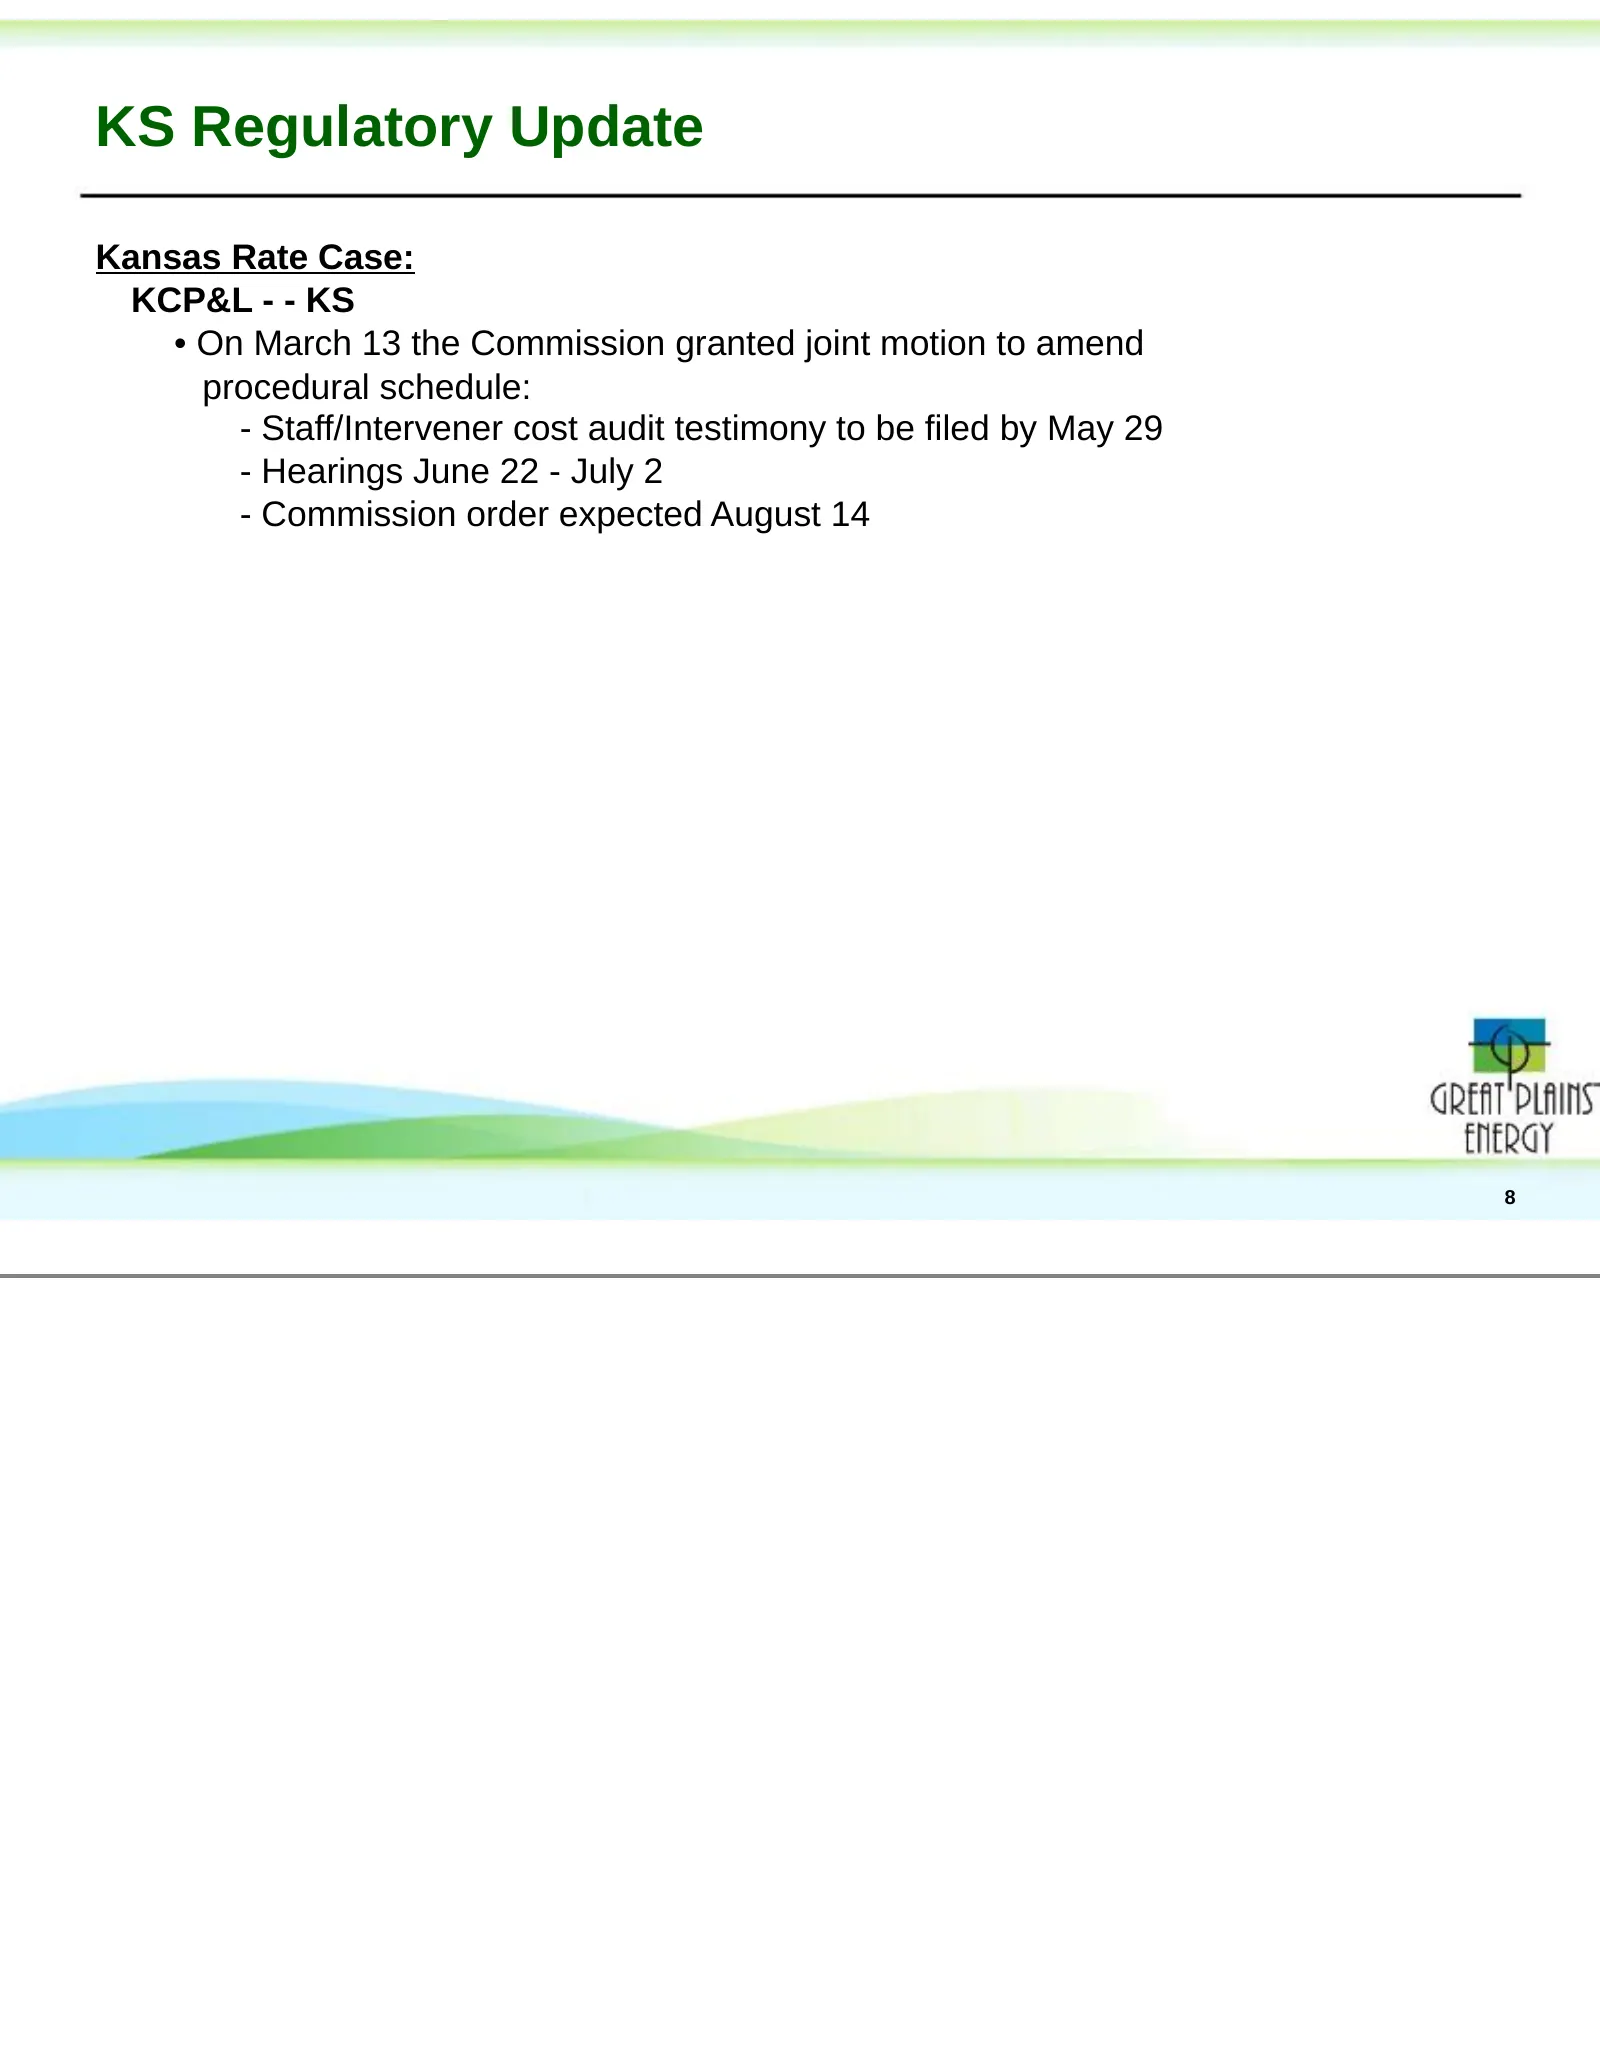
KS Regulatory Update Kansas Rate Case: KCP&L - - KS • On March 13 the Commission granted joint motion to amend procedural schedule: - Staff/Intervener cost audit testimony to be filed by May 29 - Hearings June 22 - July 2 - Commission order expected August 14 8
Slide 10: Strong Track Record of Execution
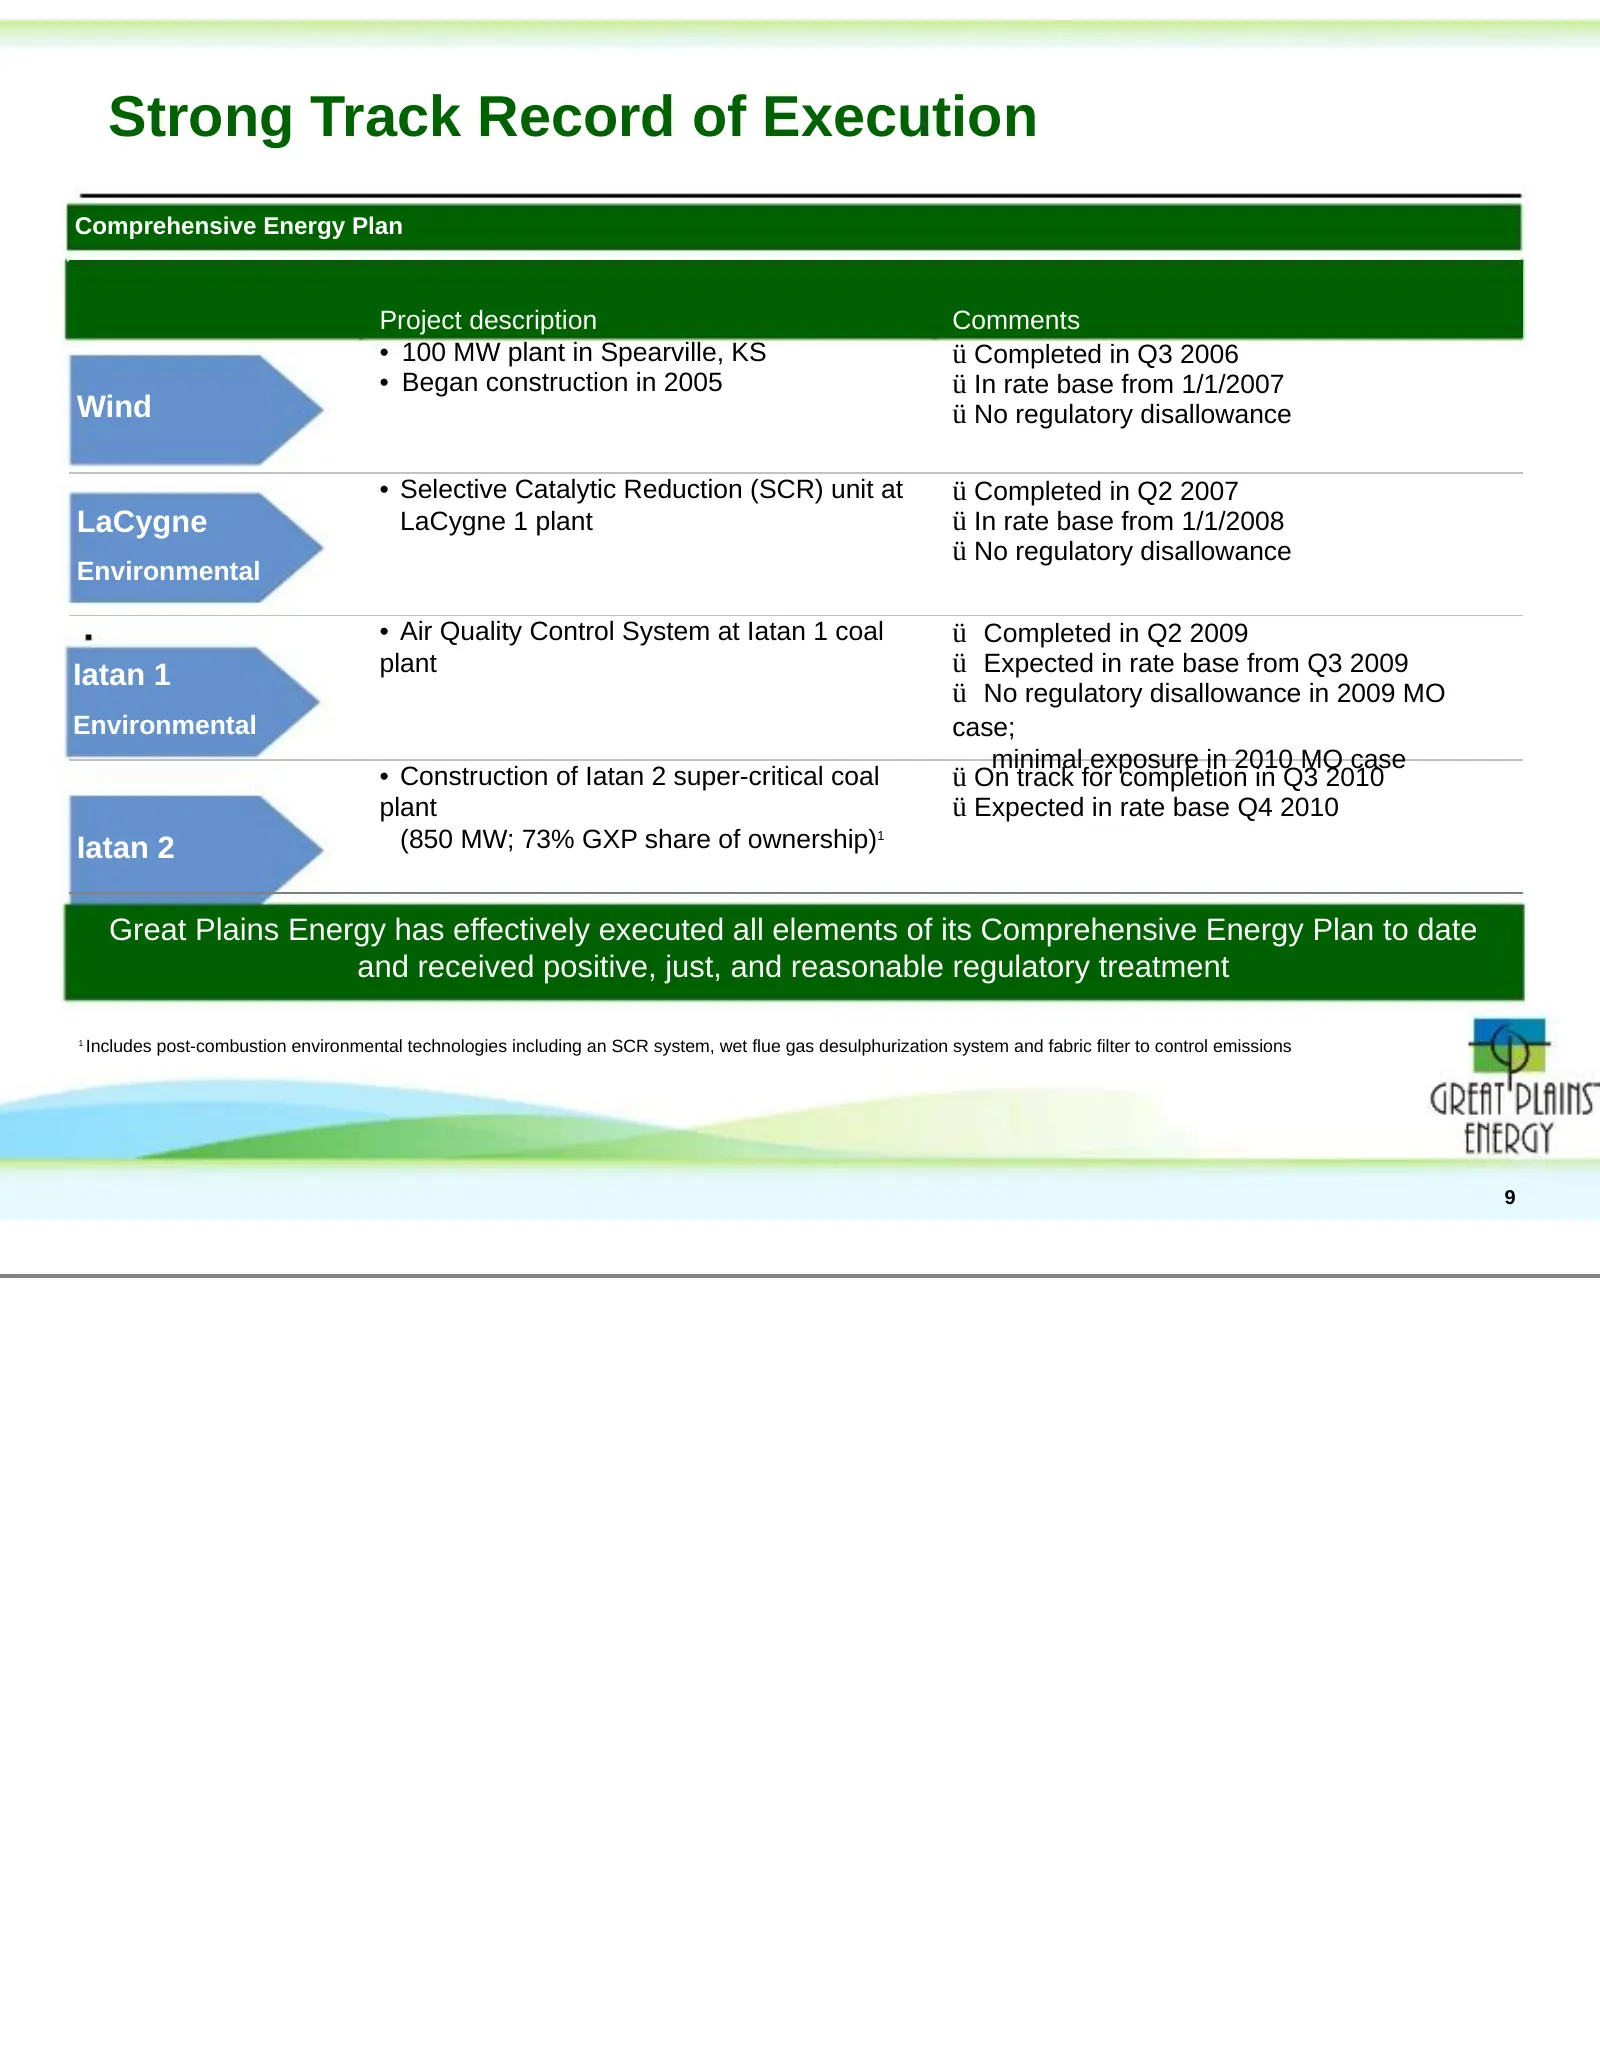
Strong Track Record of Execution Comprehensive Energy Plan Project description Comments • 100 MW plant in Spearville, KS ü Completed in Q3 2006 • Began construction in 2005 ü In rate base from 1/1/2007 Wind ü No regulatory disallowance • Selective Catalytic Reduction (SCR) unit at ü Completed in Q2
Slide 11: Financial Update
Financial Update P_VOELTEKJ\GXP Roadshow Draft (May 8th) v2.ppt
Slide 12: Overview of May 2009 Dual-Tranche Offering
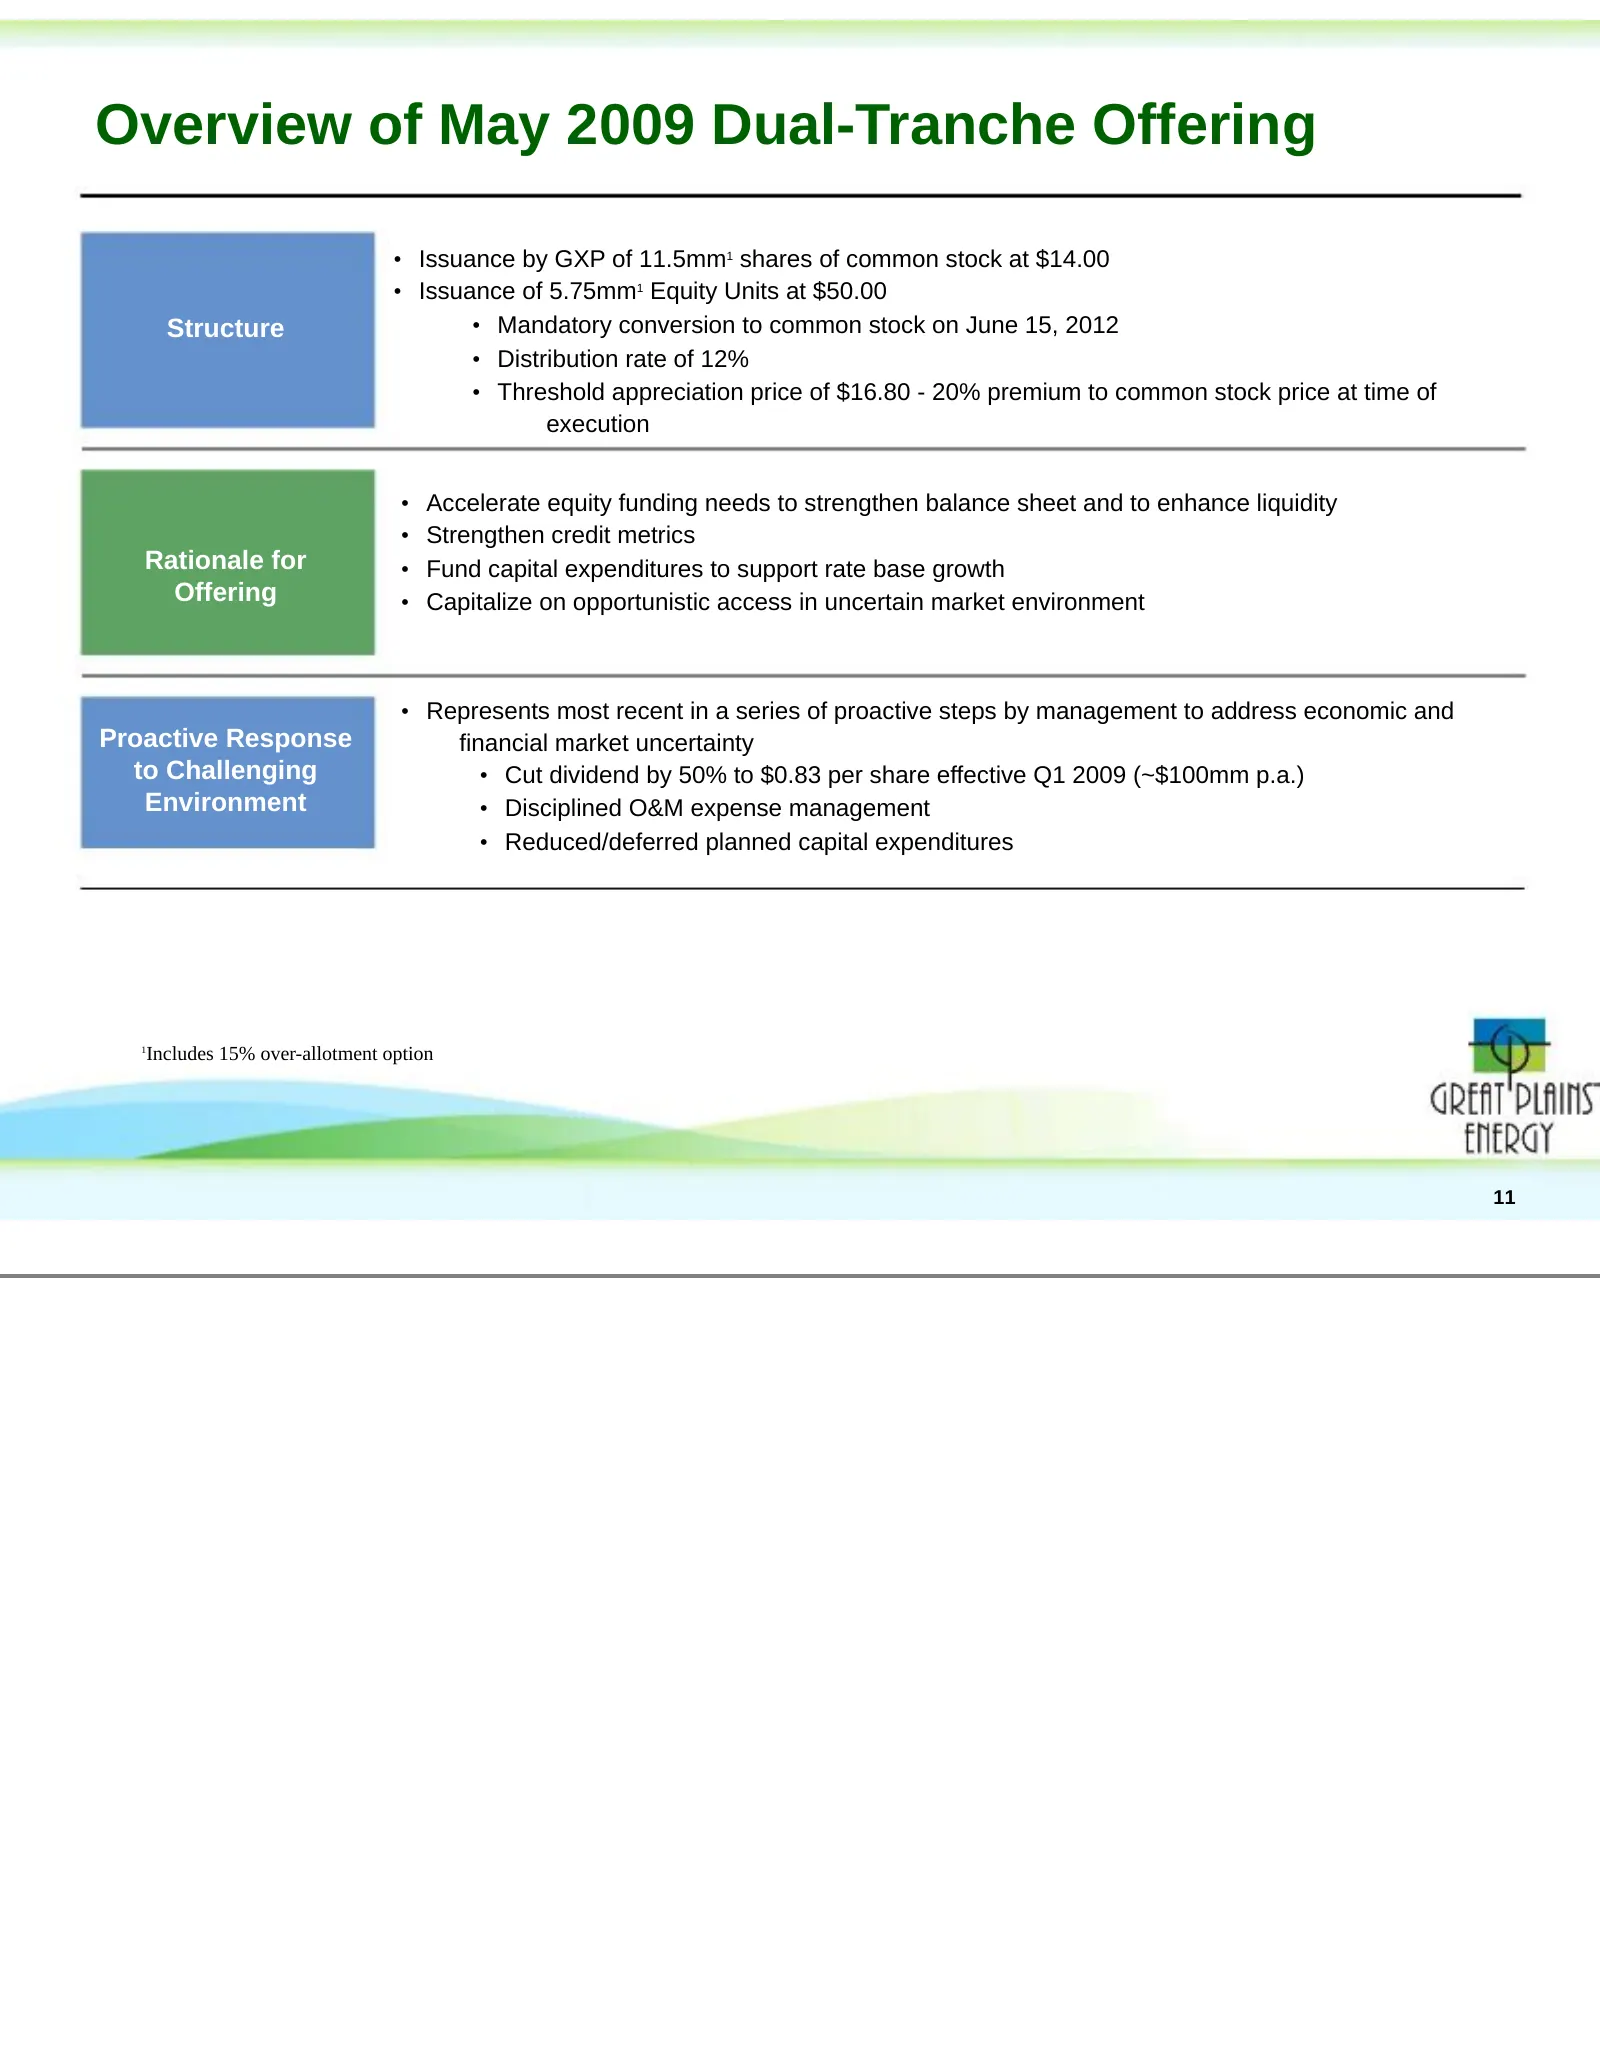
Overview of May 2009 Dual-Tranche Offering • Issuance by GXP of 11.5mm1 shares of common stock at $14.00 • Issuance of 5.75mm1 Equity Units at $50.00 Structure • Mandatory conversion to common stock on June 15, 2012 • Distribution rate of 12% • Threshold appreciation price of $16.80 - 20% premium to
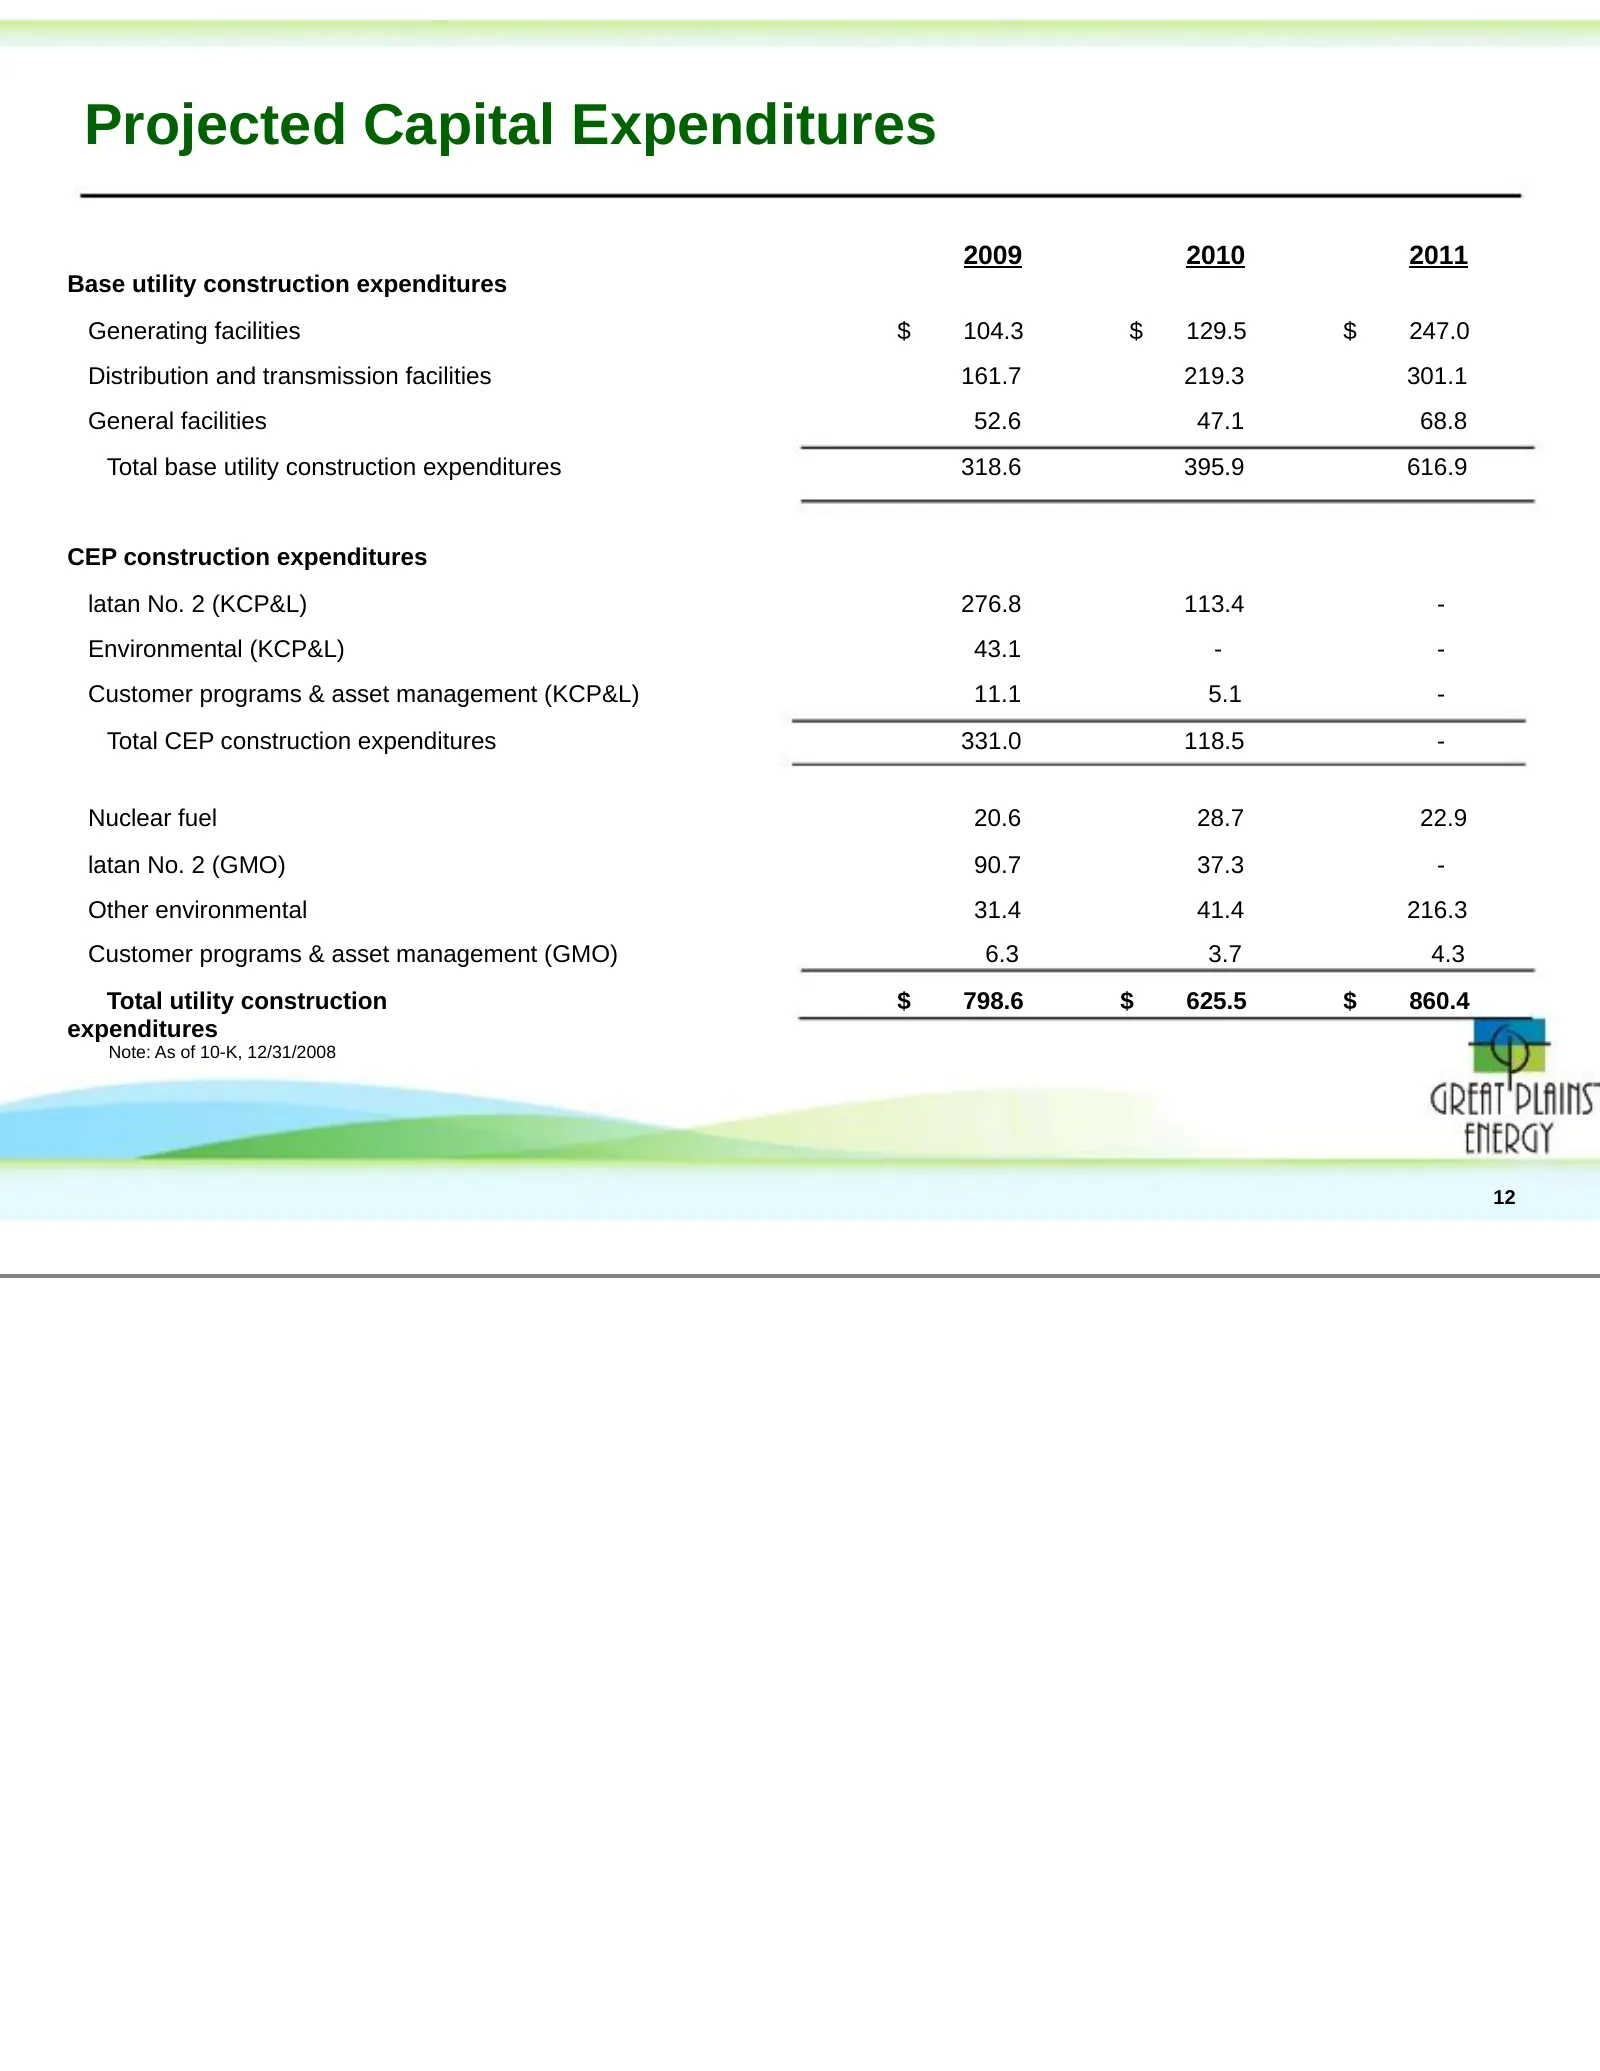
Slide 13: Projected Capital Expenditures
Projected Capital Expenditures 2009 2010 2011 Base utility construction expenditures Generating facilities $ 104.3 $ 129.5 $ 247.0 Distribution and transmission facilities 161.7 219.3 301.1 General facilities 52.6 47.1 68.8 Total base utility construction expenditures 318.6 395.9 616.9 CEP construct
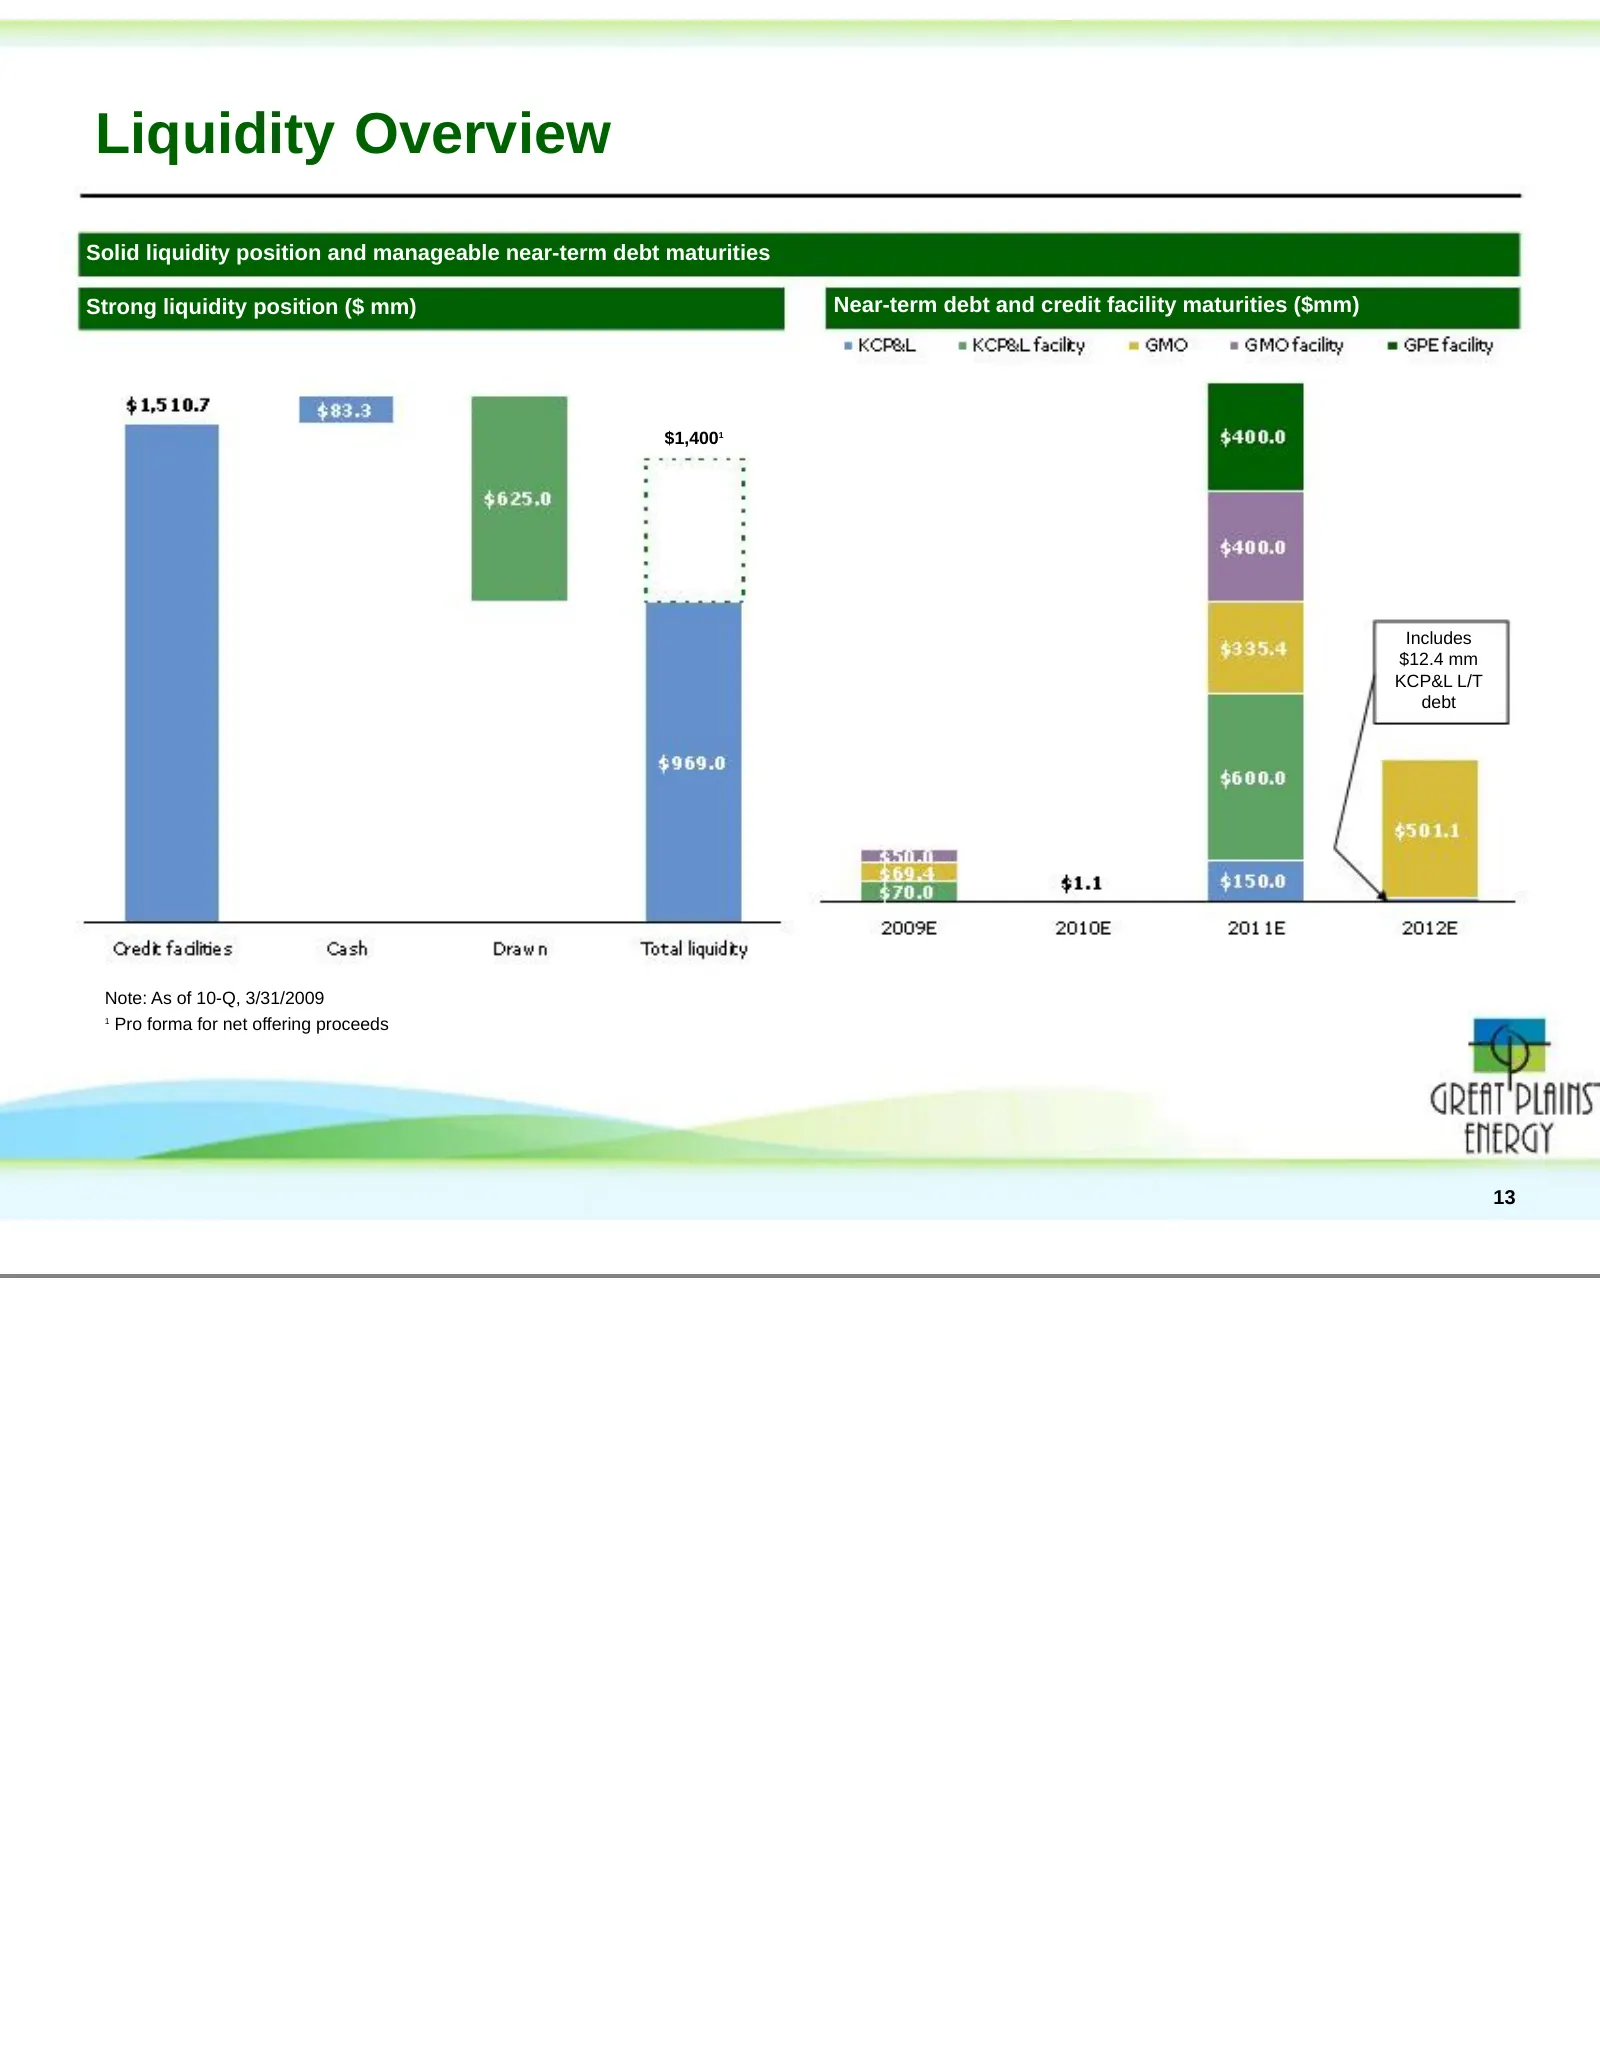
Slide 14: Liquidity Overview
Liquidity Overview Solid liquidity position and manageable near-term debt maturities Strong liquidity position ($ mm) Near-term debt and credit facility maturities ($mm) $1,4001 Includes $12.4 mm KCP&L L/T debt Note: As of 10-Q, 3/31/2009 1 Pro forma for net offering proceeds 13
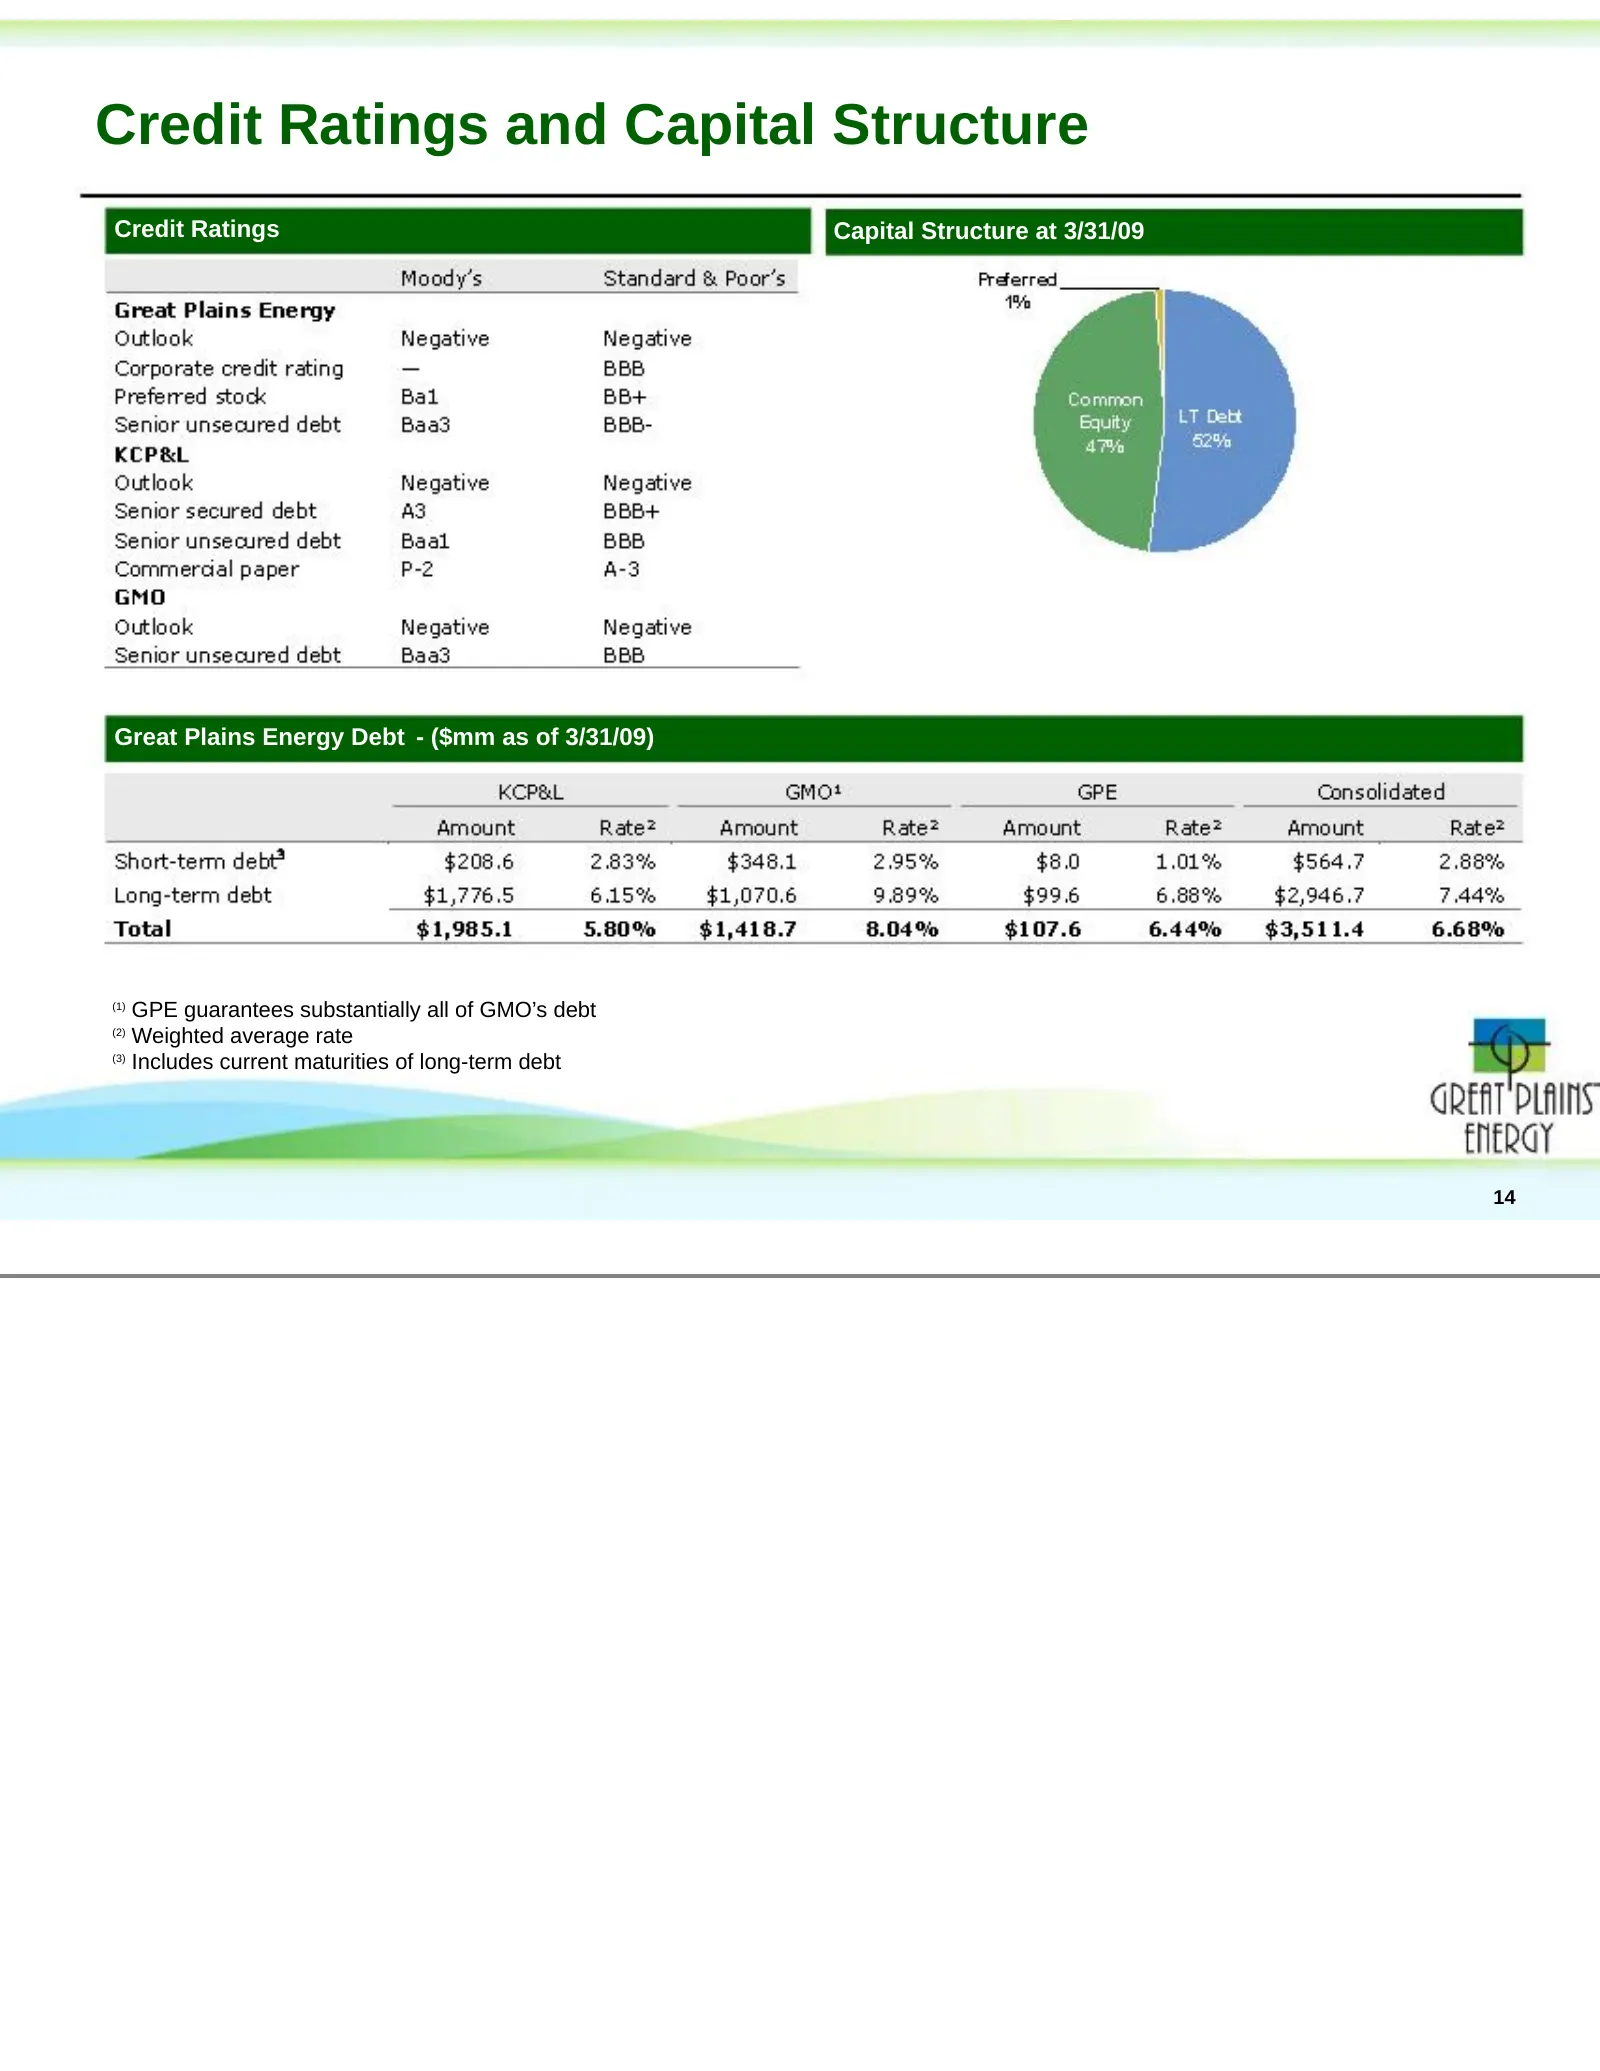
Slide 15: Credit Ratings and Capital Structure
Credit Ratings and Capital Structure Credit Ratings Capital Structure at 3/31/09 Great Plains Energy Debt - ($mm as of 3/31/09) (1) GPE guarantees substantially all of GMO’s debt (2) Weighted average rate (3) Includes current maturities of long-term debt 14
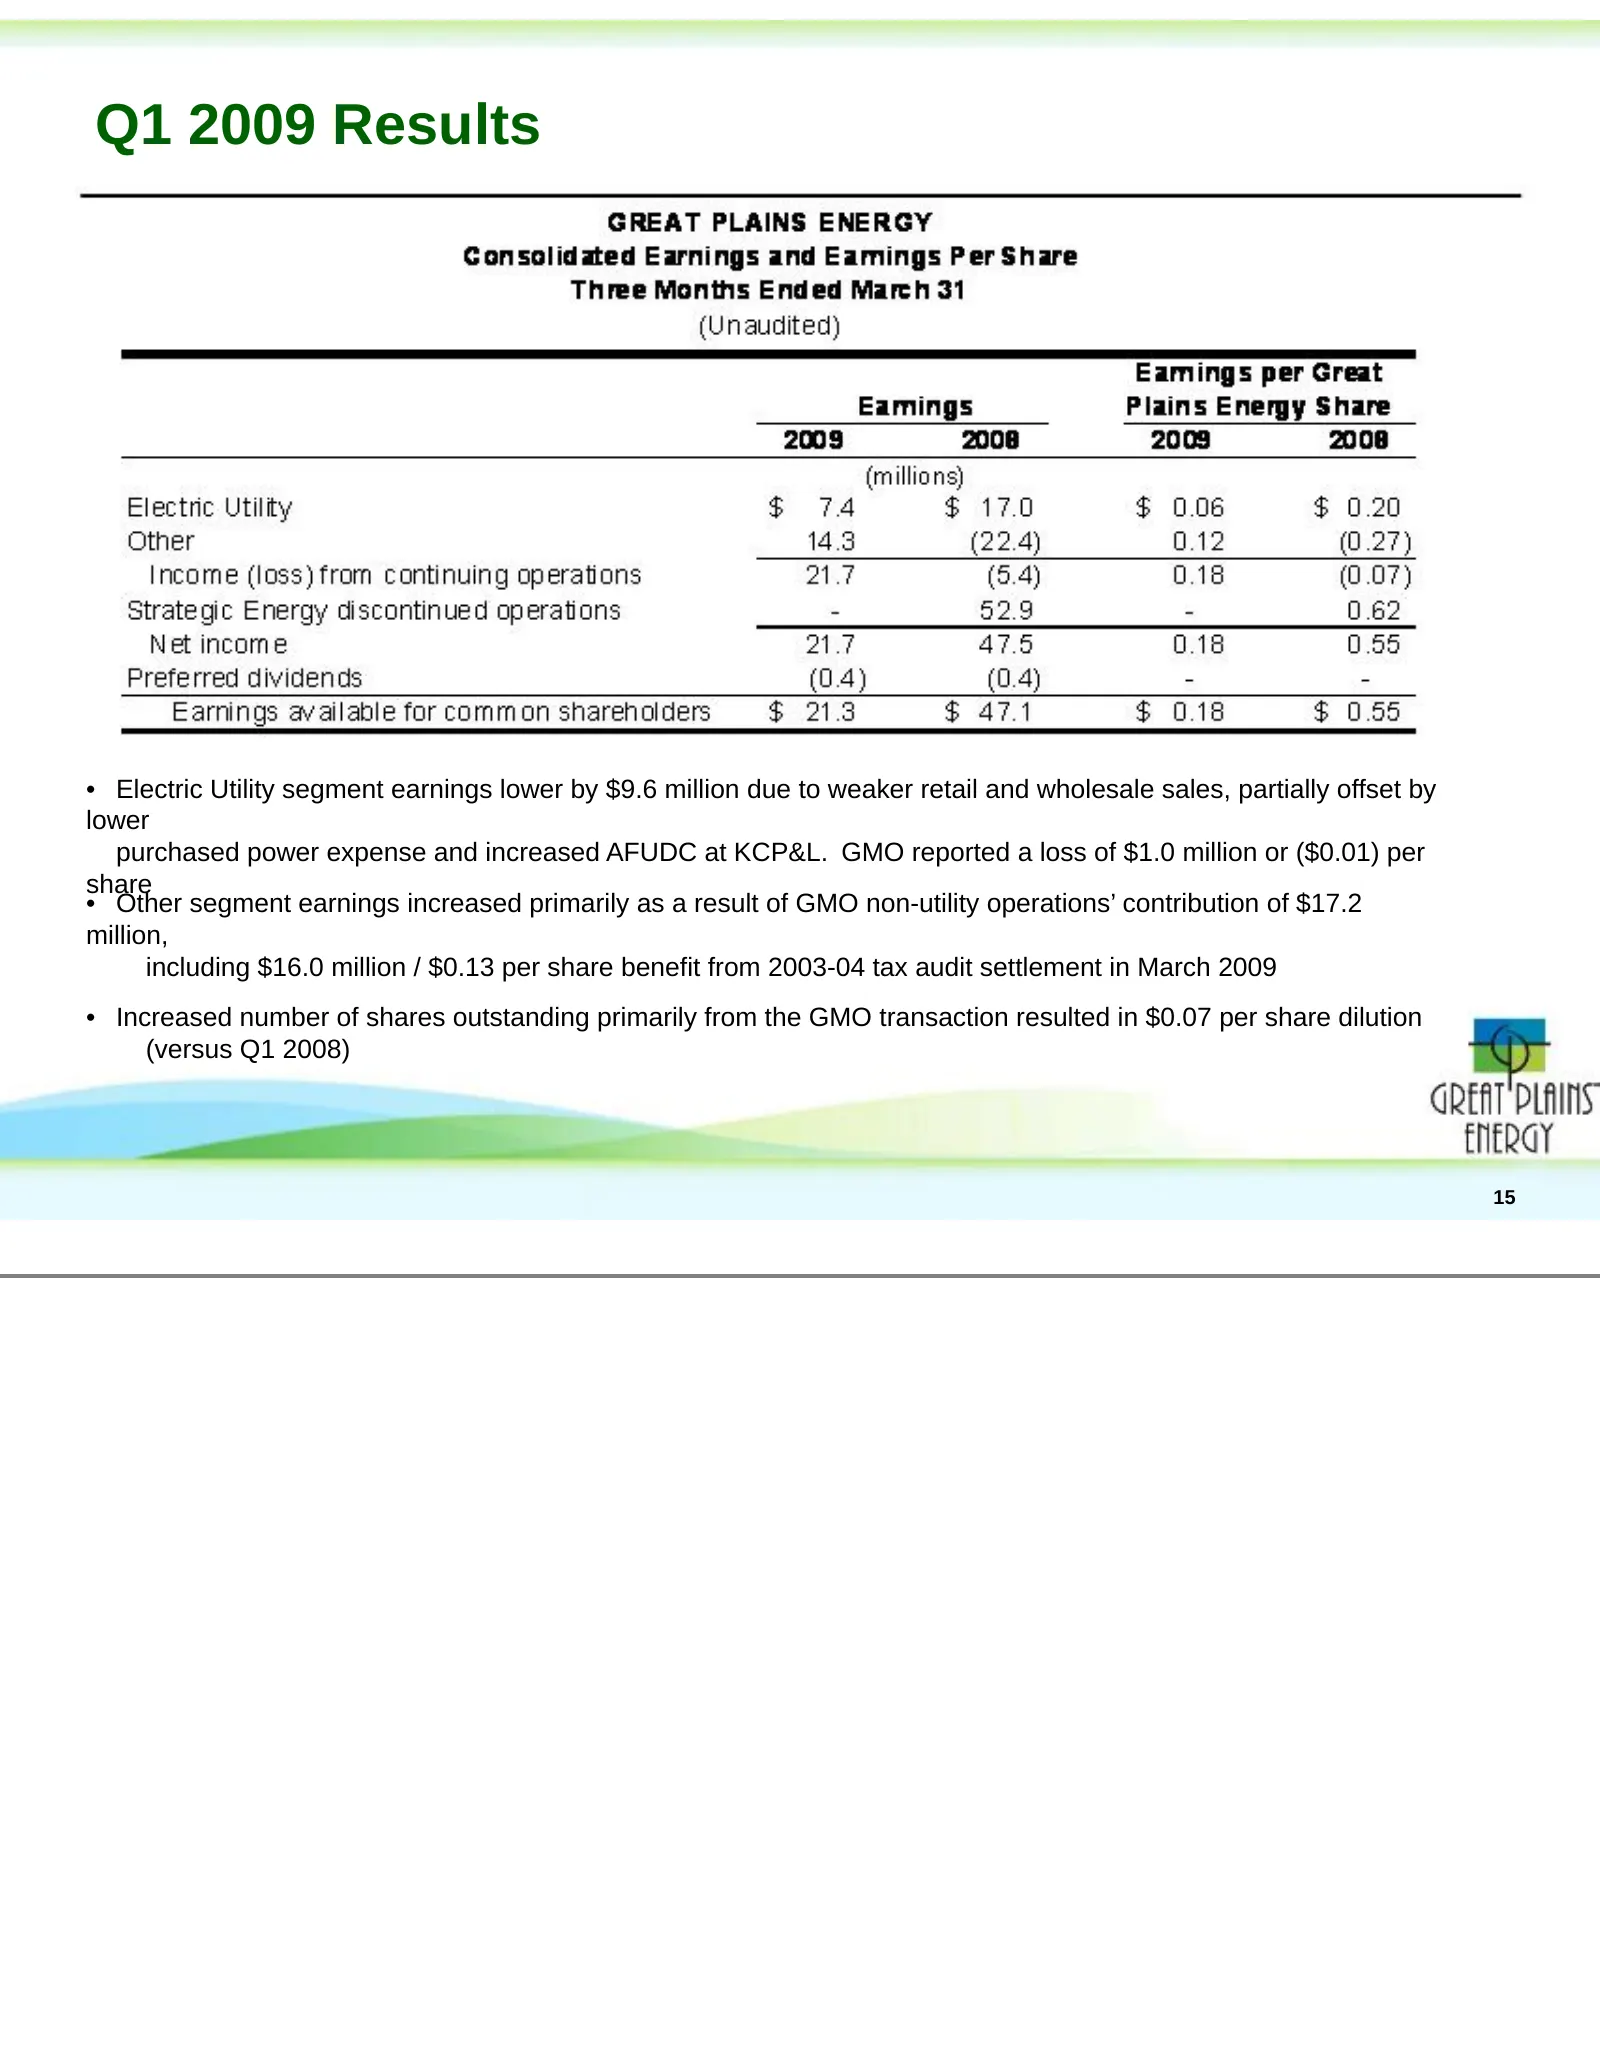
Slide 16: Q1 2009 Results
Q1 2009 Results • Electric Utility segment earnings lower by $9.6 million due to weaker retail and wholesale sales, partially offset by lower purchased power expense and increased AFUDC at KCP&L. GMO reported a loss of $1.0 million or ($0.01) per share • Other segment earnings increased primarily as

Slide 17
Source: SEC EDGAR · 8-K filed Jun 16, 2009
More decks from Great Plains Energy Incorporated
 Merger or Acquisition (January 2018)27 slides · Jan 10, 2018
 2017 Edison Electric Institute Financial Conference25 slides · Nov 3, 2017
 Merger or Acquisition (October 2017)14 slides · Oct 31, 2017
 Merger or Acquisition (October 2017)9 slides · Oct 31, 2017
 Merger or Acquisition (August 2017)18 slides · Aug 8, 2017
 Merger or Acquisition (August 2017)9 slides · Aug 8, 2017