Ayala Land Inc. · PSE:ALI
Ayala Land — H1 2016 Earnings Presentation
35 slides from Ayala Land's earnings presentation, Aug 9, 2016
Slide 1: 1H 2016 Analysts' Briefing
1H 2016 | Analysts’ Briefing 09 August 2016
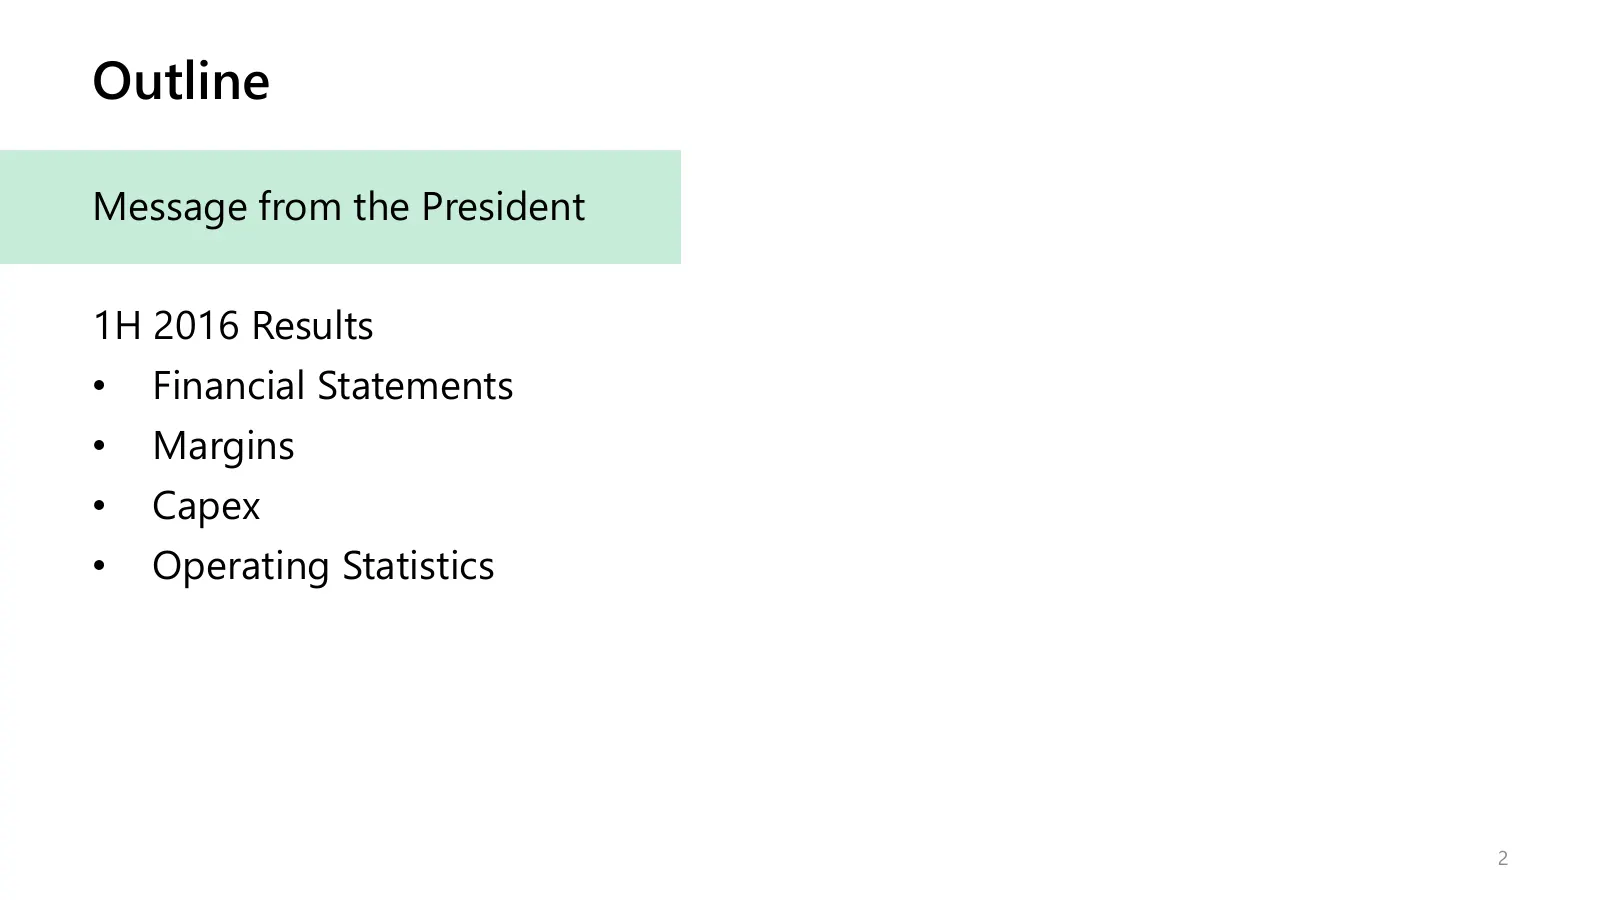
Slide 2: Outline
Outline Message from the President 1H 2016 Results • Financial Statements • Margins • Capex • Operating Statistics 2
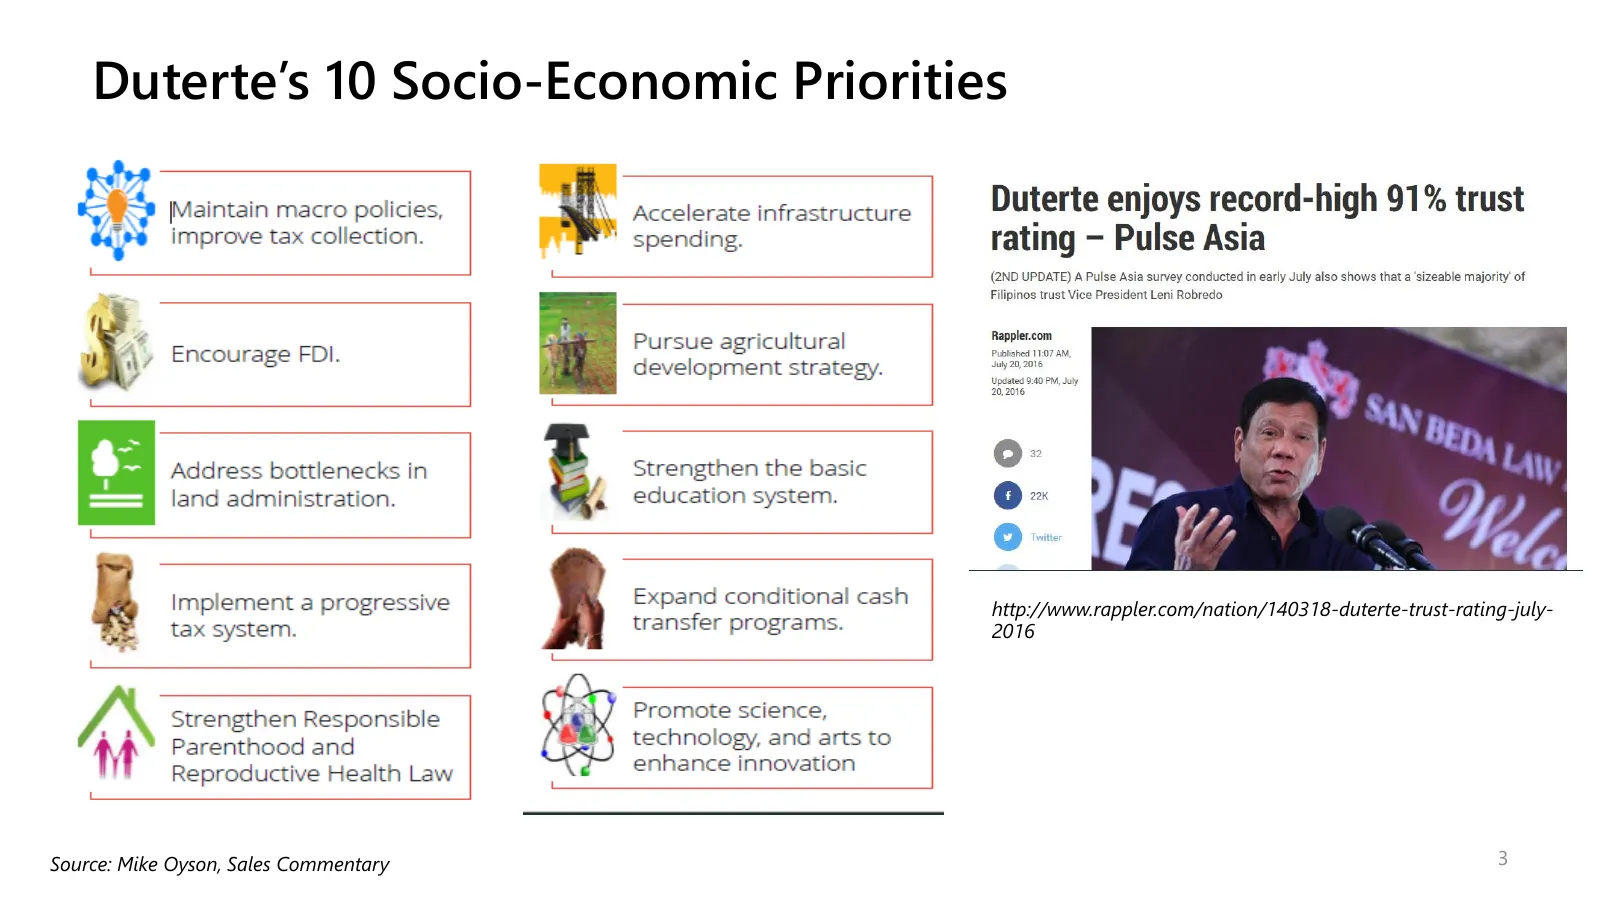
Slide 3: Duterte's 10 Socio-Economic Priorities
Duterte’s 10 Socio-Economic Priorities http://www.rappler.com/nation/140318-duterte-trust-rating-july- 2016 Source: Mike Oyson, Sales Commentary 3
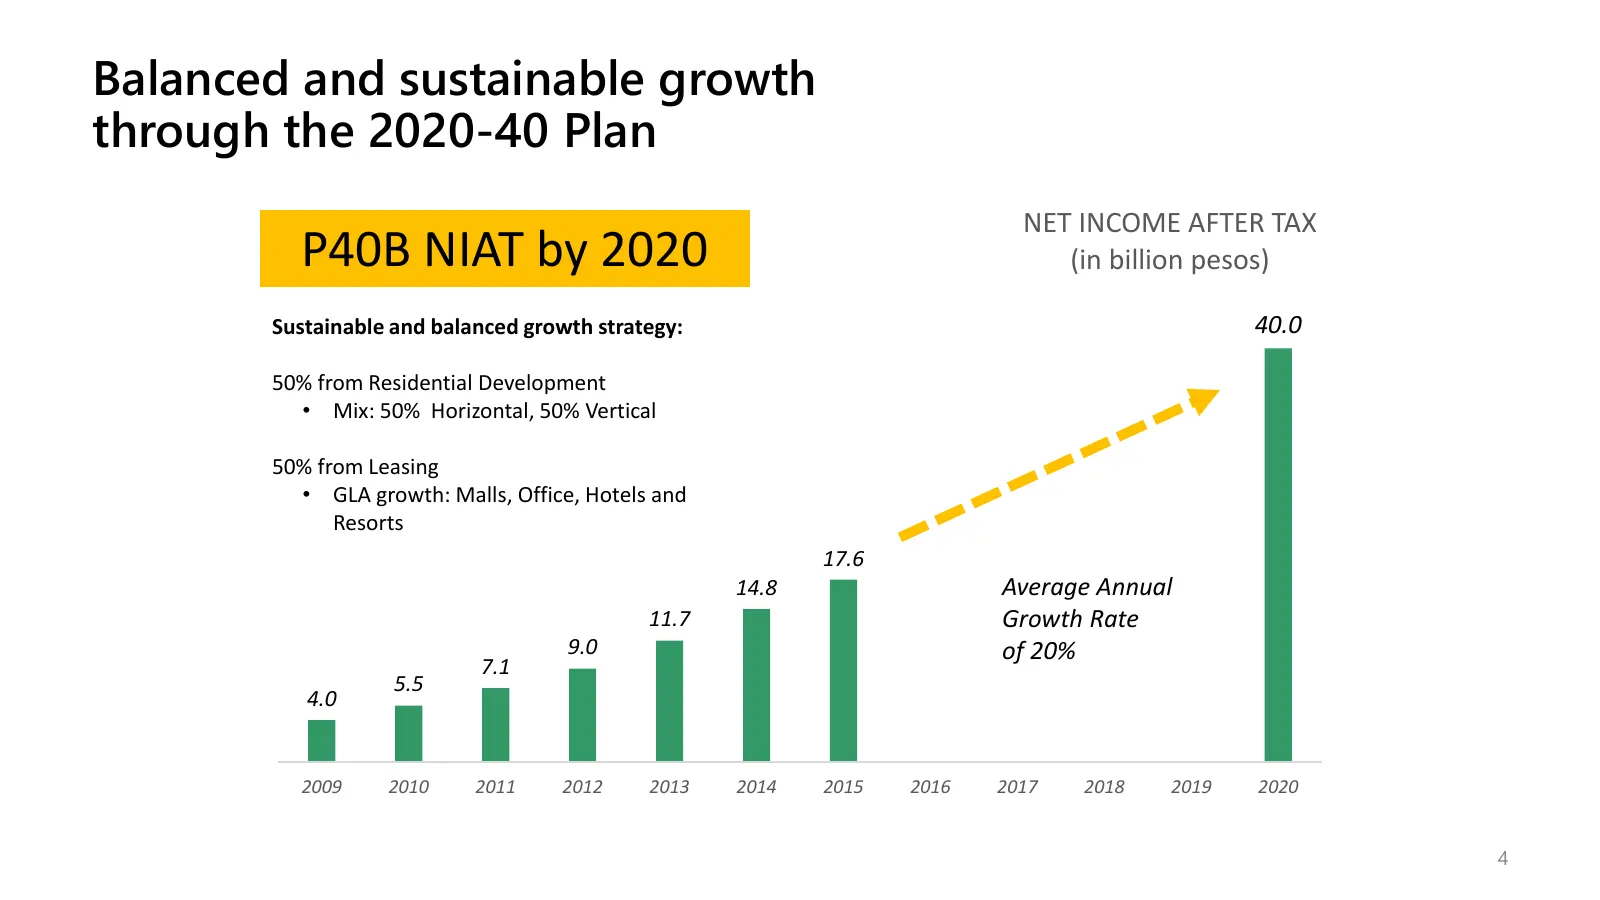
Slide 4: Balanced and sustainable growth through the 2020-40 Plan
Balanced and sustainable growth through the 2020-40 Plan NET INCOME AFTER TAX P40B NIAT by 2020 (in billion pesos) Sustainable and balanced growth strategy: 40.0 50% from Residential Development • Mix: 50% Horizontal, 50% Vertical 50% from Leasing • GLA growth: Malls, Office, Hotels and Resorts 17.6
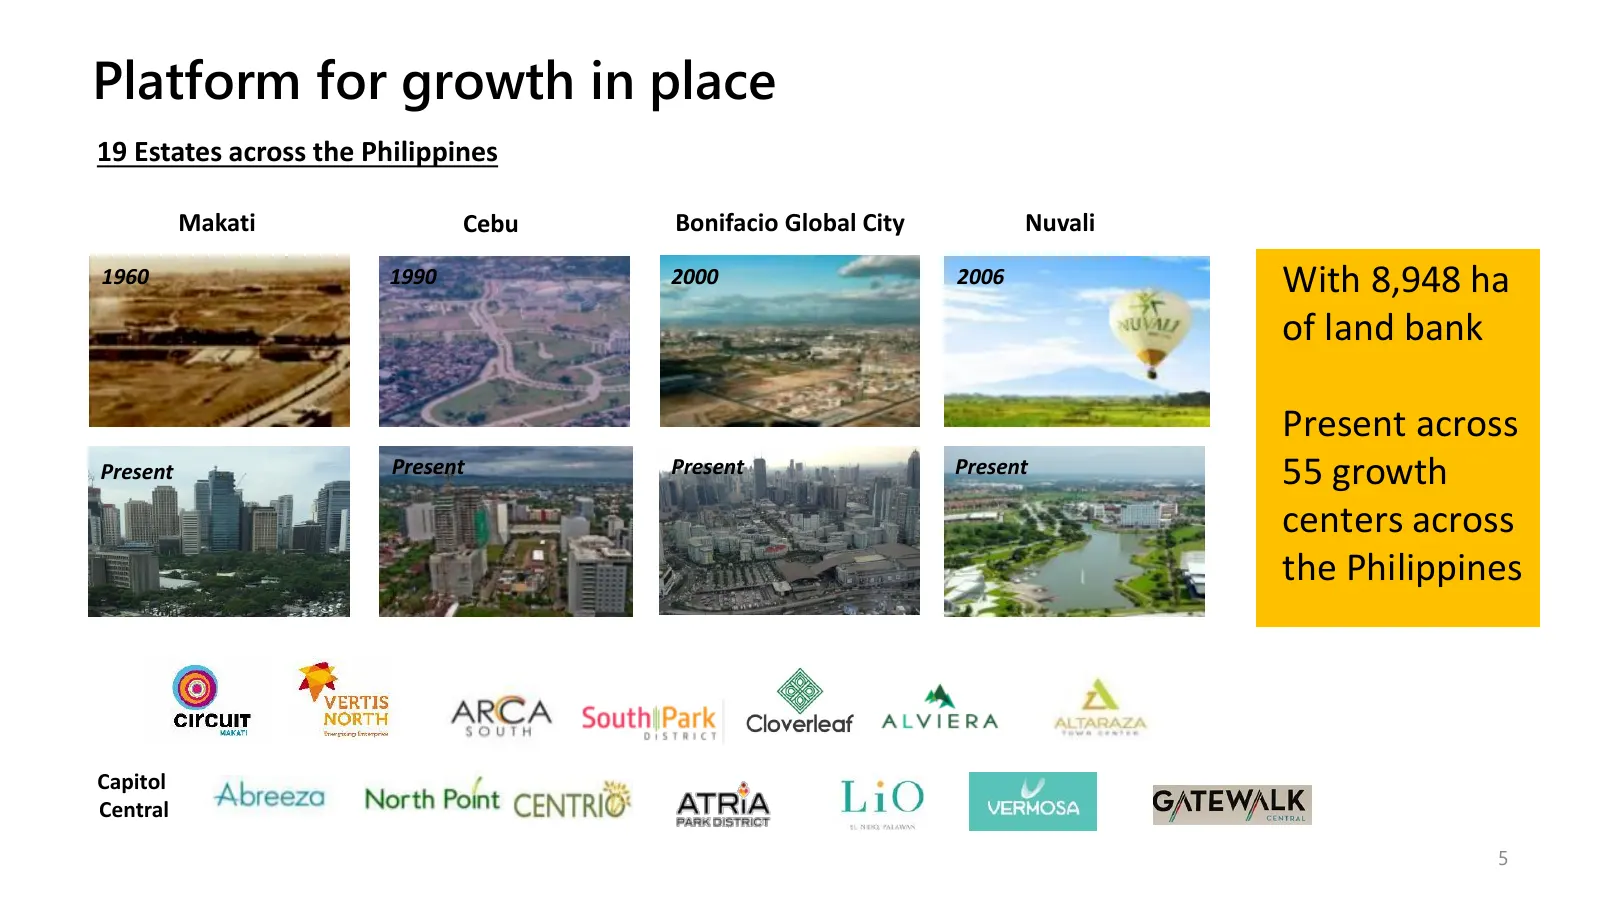
Slide 5: Platform for growth in place
Platform for growth in place 19 Estates across the Philippines Makati Cebu Bonifacio Global City Nuvali 1960 1990 2000 2006 With 8,948 ha of land bank Present across Present Present Present Present 55 growth centers across the Philippines Capitol Central 5
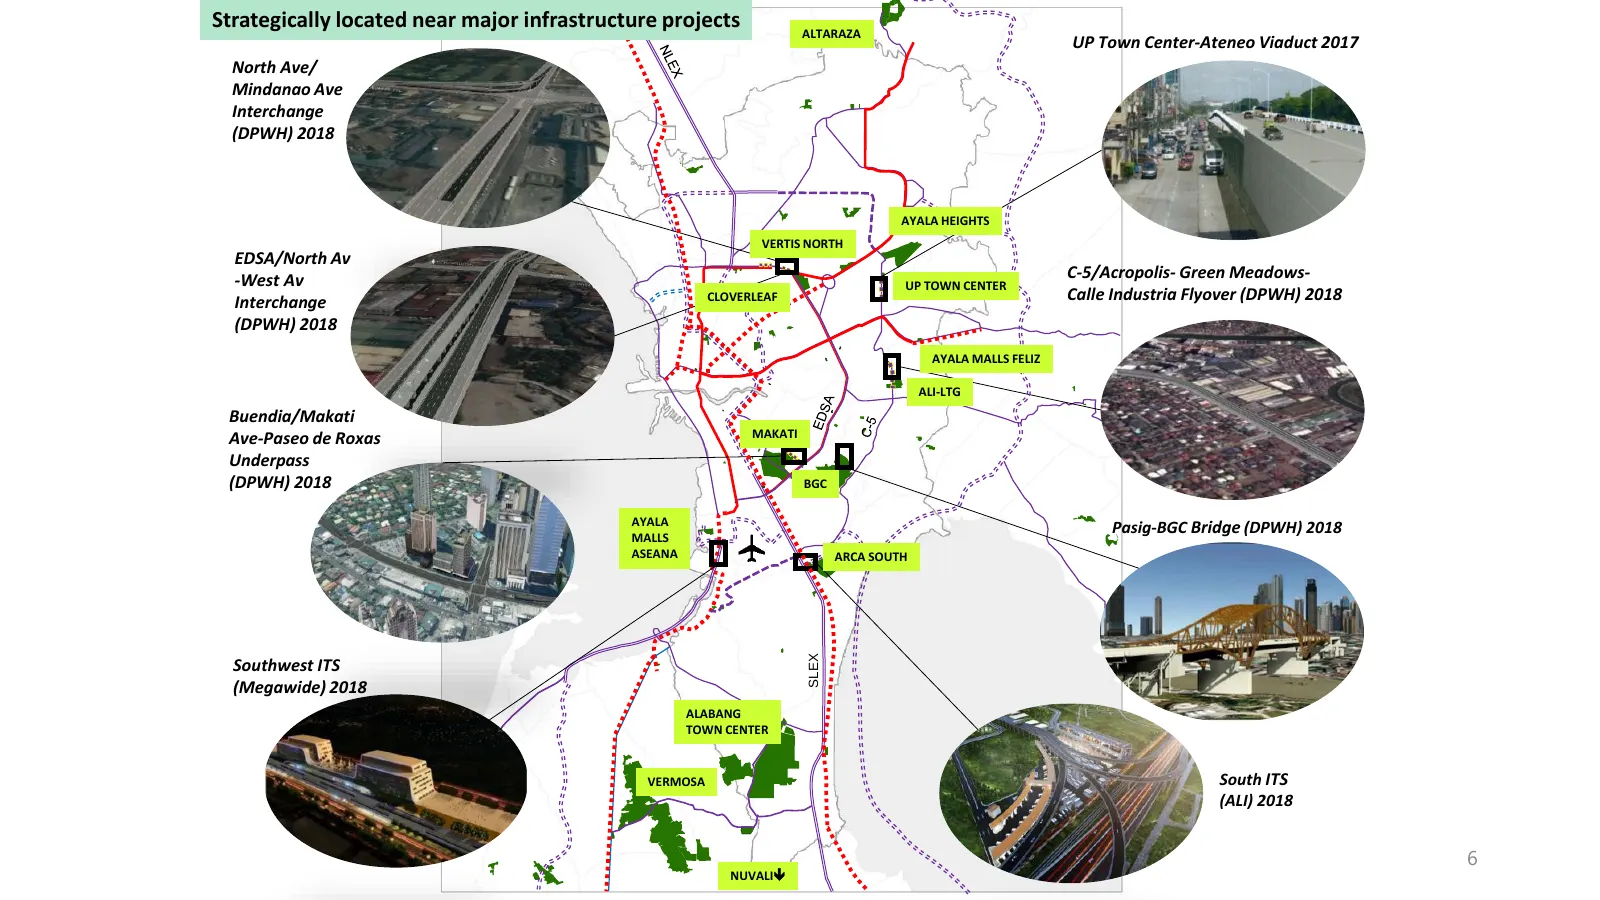
Slide 6: Strategically located near major infrastructure projects
Strategically located near major infrastructure projects ALTARAZA UP Town Center-Ateneo Viaduct 2017 North Ave/ Mindanao Ave Interchange (DPWH) 2018 AYALA HEIGHTS VERTIS NORTH EDSA/North Av -West Av C-5/Acropolis- Green Meadows- UP TOWN CENTER Interchange CLOVERLEAF Calle Industria Flyover (DPWH) 20
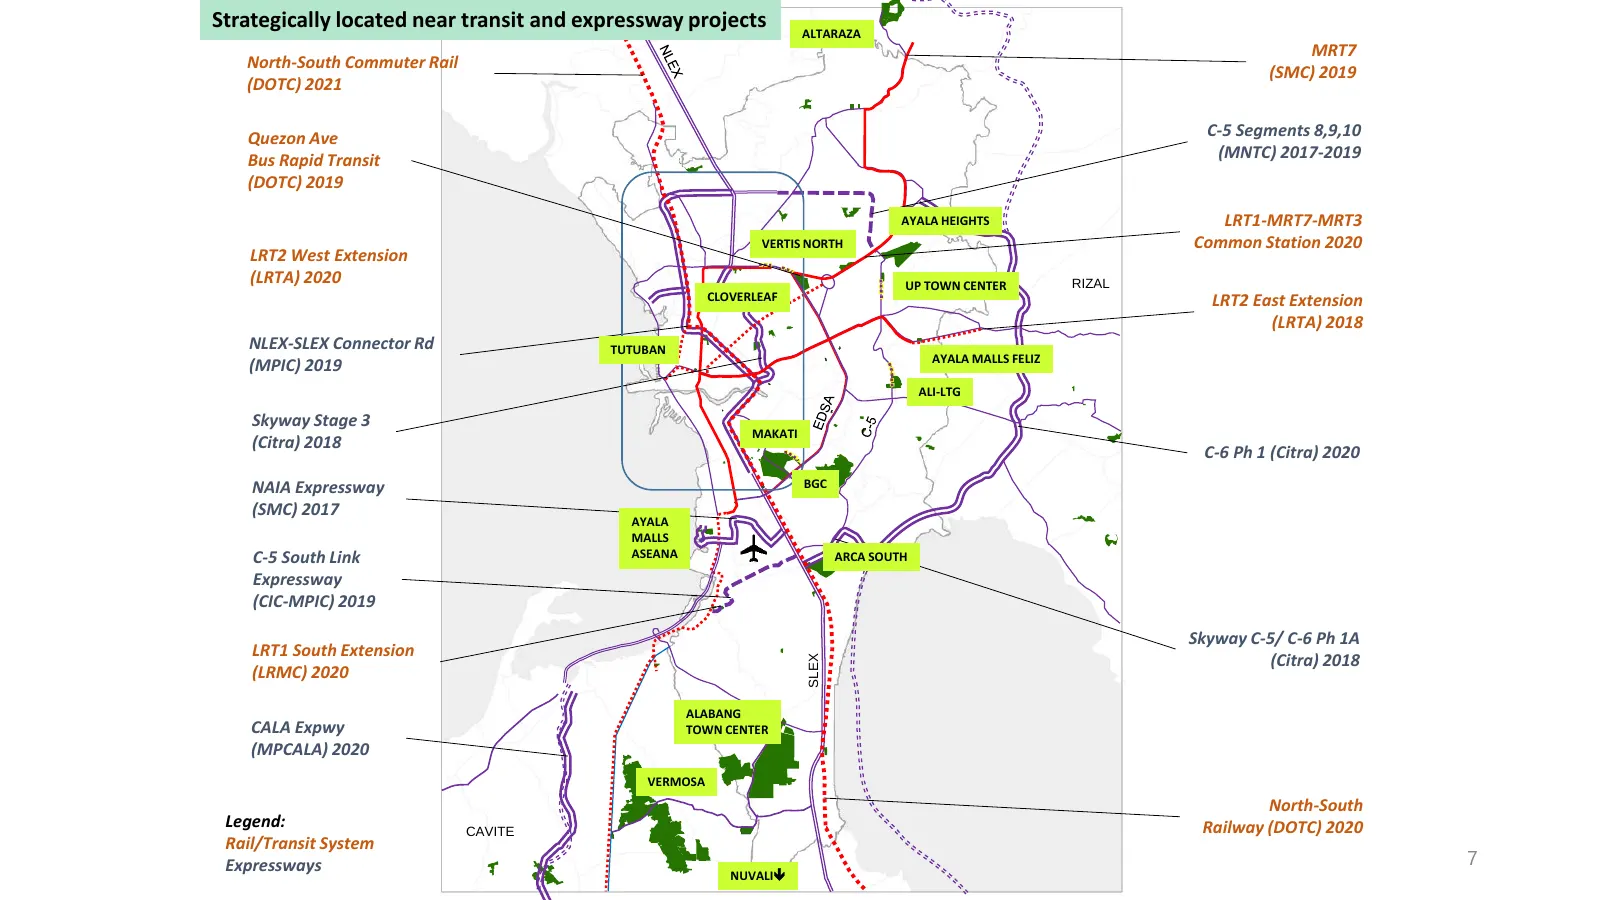
Slide 7: Strategically located near transit and expressway projects
Strategically located near transit and expressway projects ALTARAZA MRT7 North-South Commuter Rail (SMC) 2019 (DOTC) 2021 Quezon Ave C-5 Segments 8,9,10 Bus Rapid Transit (MNTC) 2017-2019 (DOTC) 2019 AYALA HEIGHTS LRT1-MRT7-MRT3 VERTIS NORTH Common Station 2020 LRT2 West Extension (LRTA) 2020 UP TOW
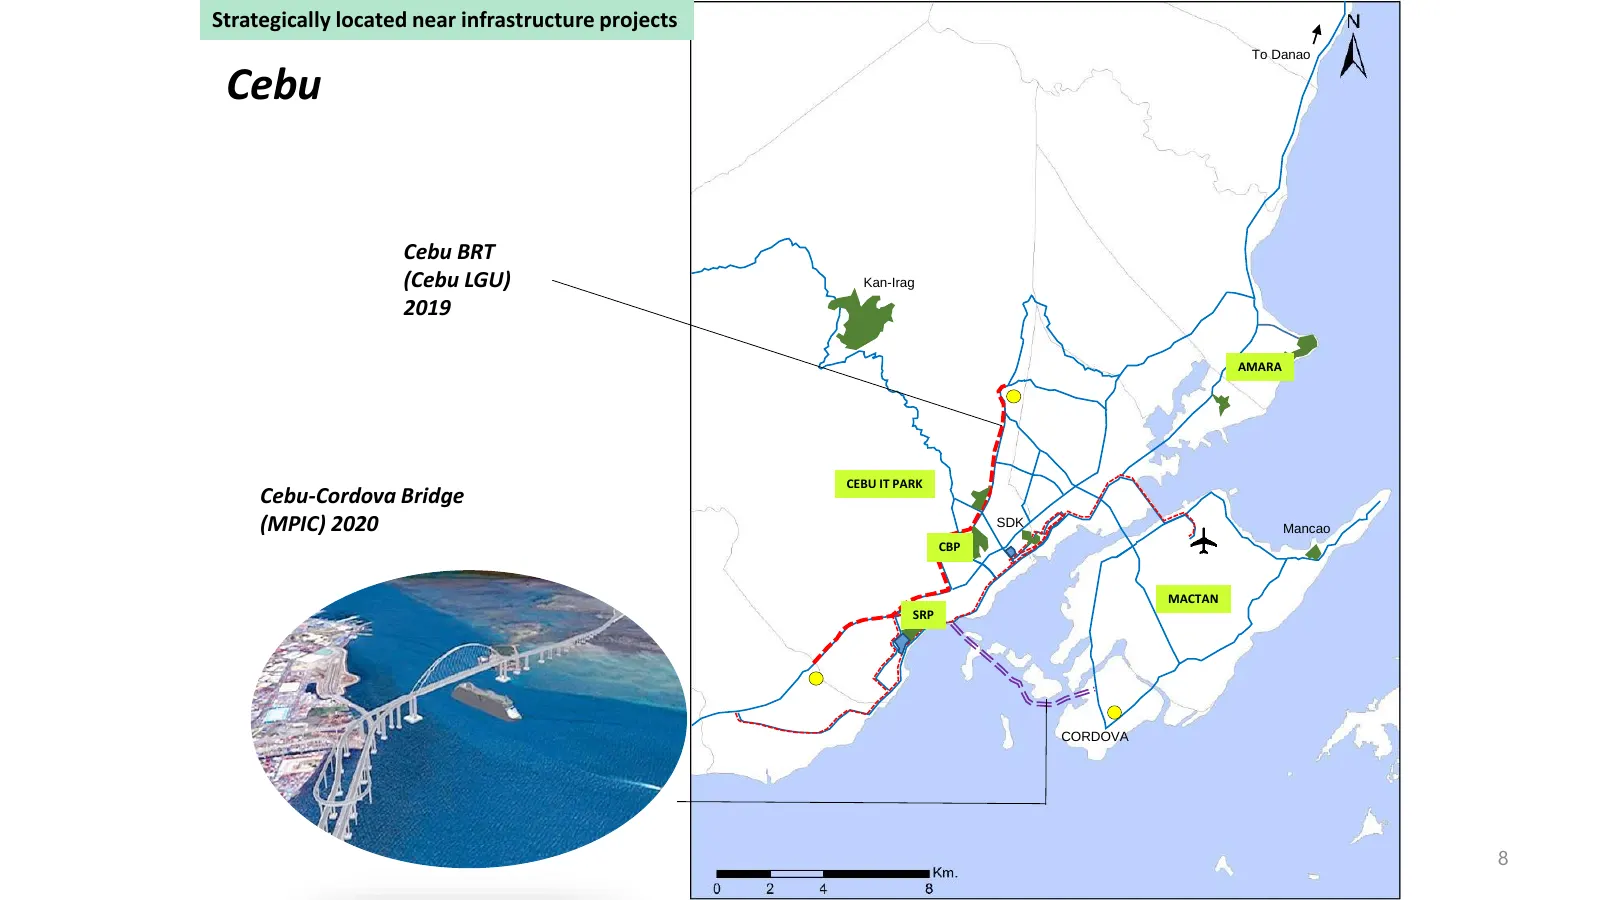
Slide 8: Cebu: Strategically located near infrastructure projects
Strategically located near infrastructure projects To Danao Cebu Cebu BRT (Cebu LGU) Kan-Irag 2019 AMARA CEBU IT PARK Cebu-Cordova Bridge (MPIC) 2020 SDK Mancao CBP MACTAN SRP CORDOVA 8
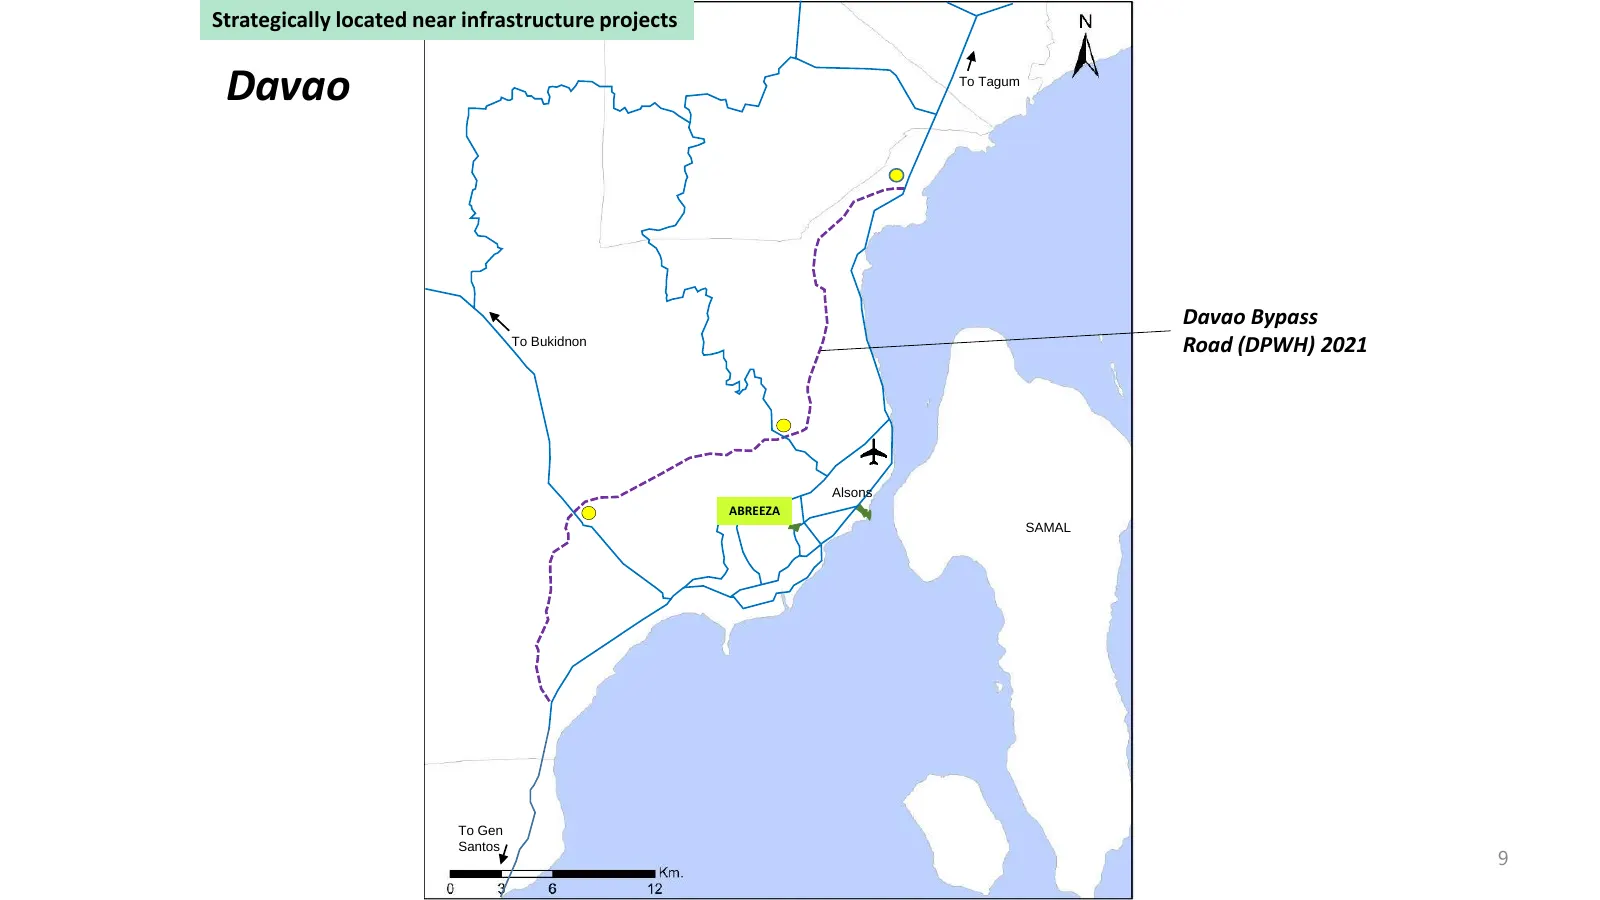
Slide 9: Davao: Strategically located near infrastructure projects
Strategically located near infrastructure projects Davao To Tagum Davao Bypass To Bukidnon Road (DPWH) 2021 Alsons ABREEZA SAMAL To Gen Santos 9
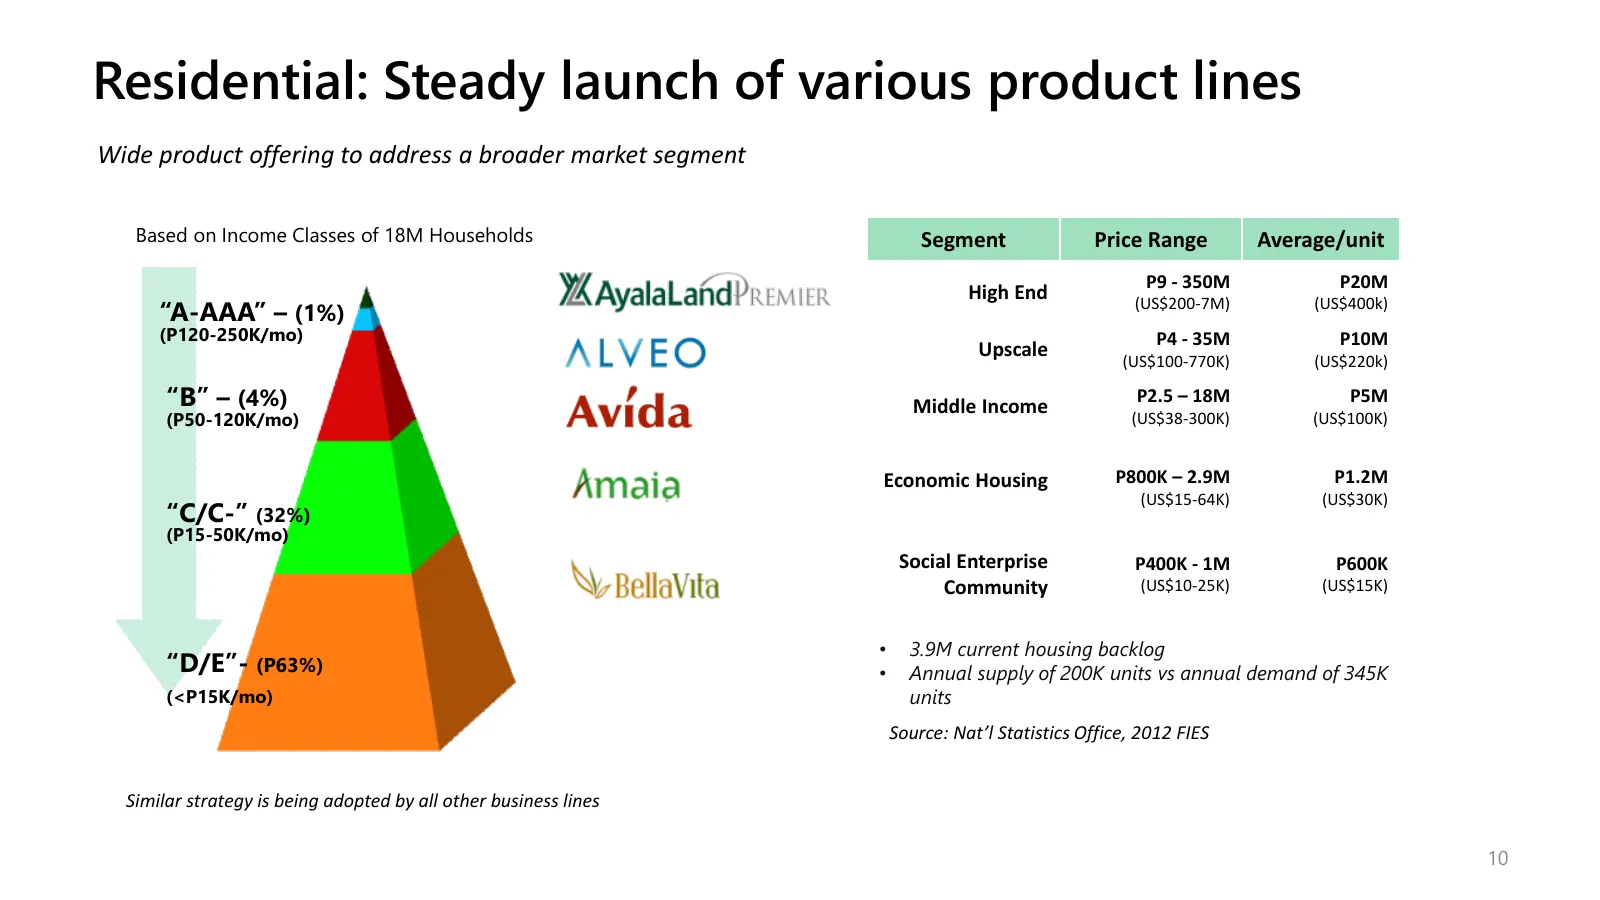
Slide 10: Residential: Steady launch of various product lines
Residential: Steady launch of various product lines Wide product offering to address a broader market segment Based on Income Classes of 18M Households Segment Price Range Average/unit P9 - 350M P20M High End “A-AAA” – (1%) (US$200-7M) (US$400k) (P120-250K/mo) P4 - 35M P10M Upscale (US$100-770K) (US
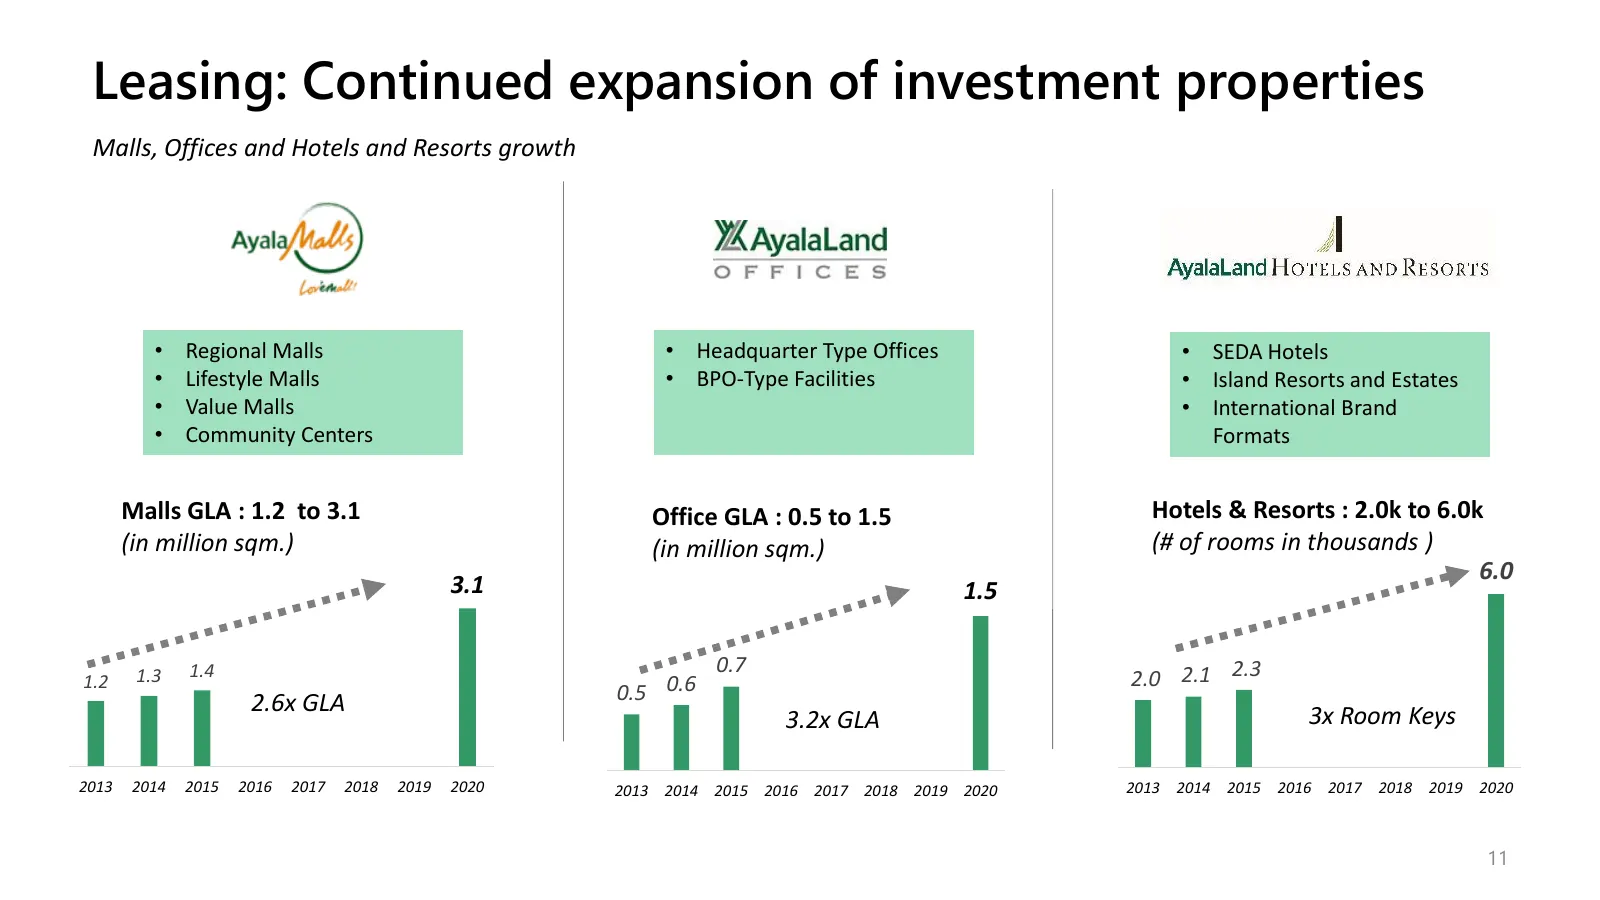
Slide 11: Leasing: Continued expansion of investment properties
Leasing: Continued expansion of investment properties Malls, Offices and Hotels and Resorts growth • Regional Malls • Headquarter Type Offices • SEDA Hotels • Lifestyle Malls • BPO-Type Facilities • Island Resorts and Estates • Value Malls • International Brand • Community Centers Formats Malls GLA
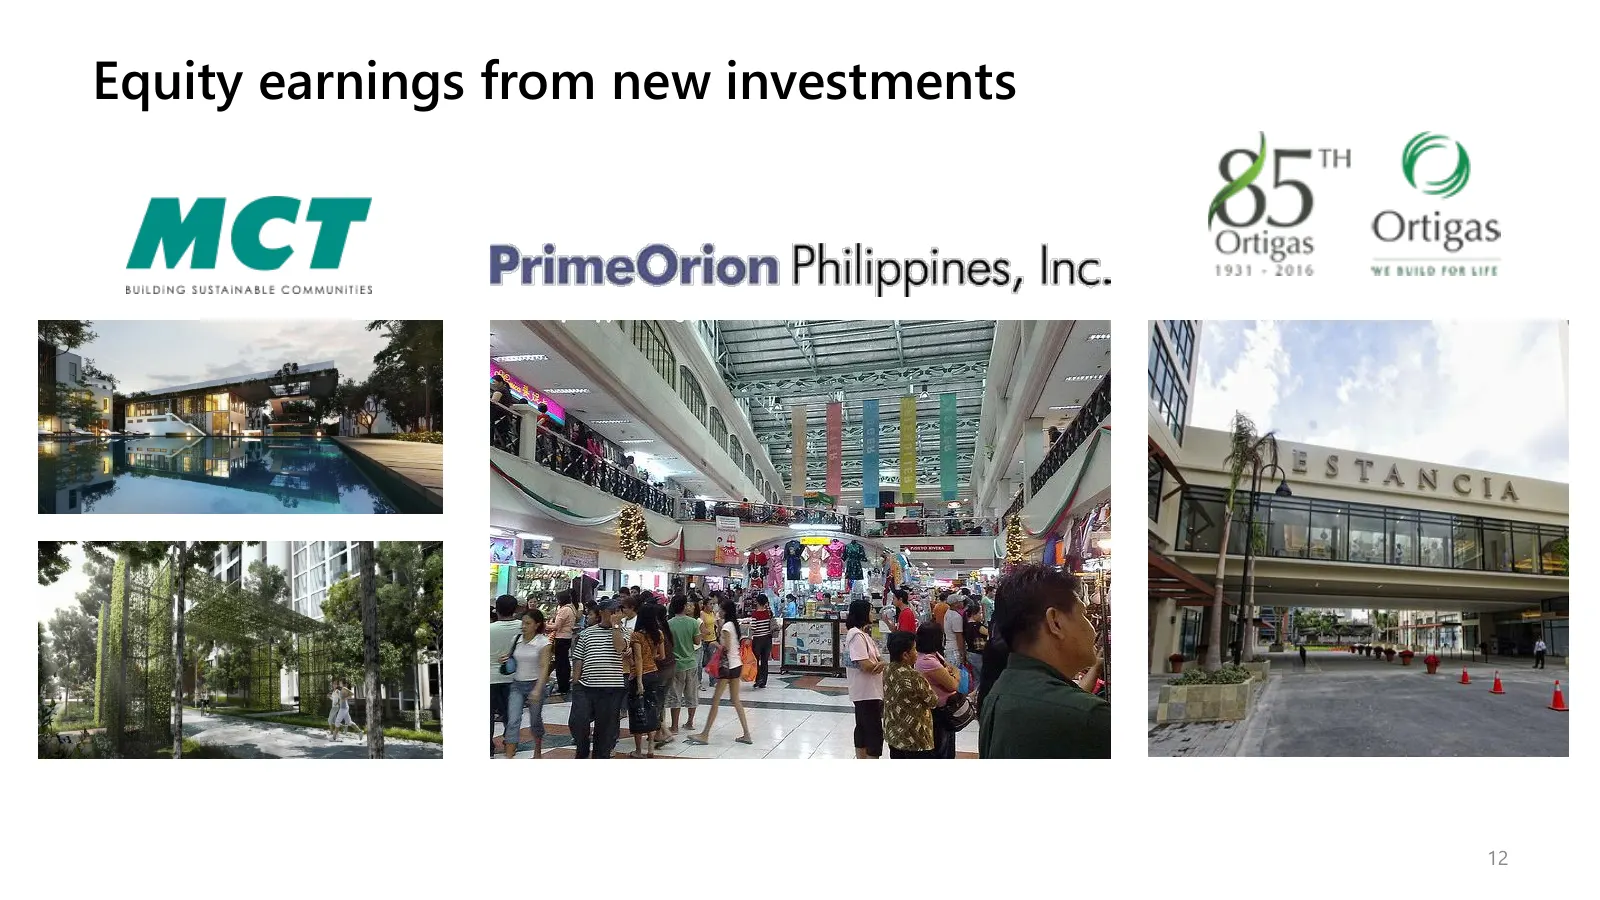
Slide 12: Equity earnings from new investments
Equity earnings from new investments 12
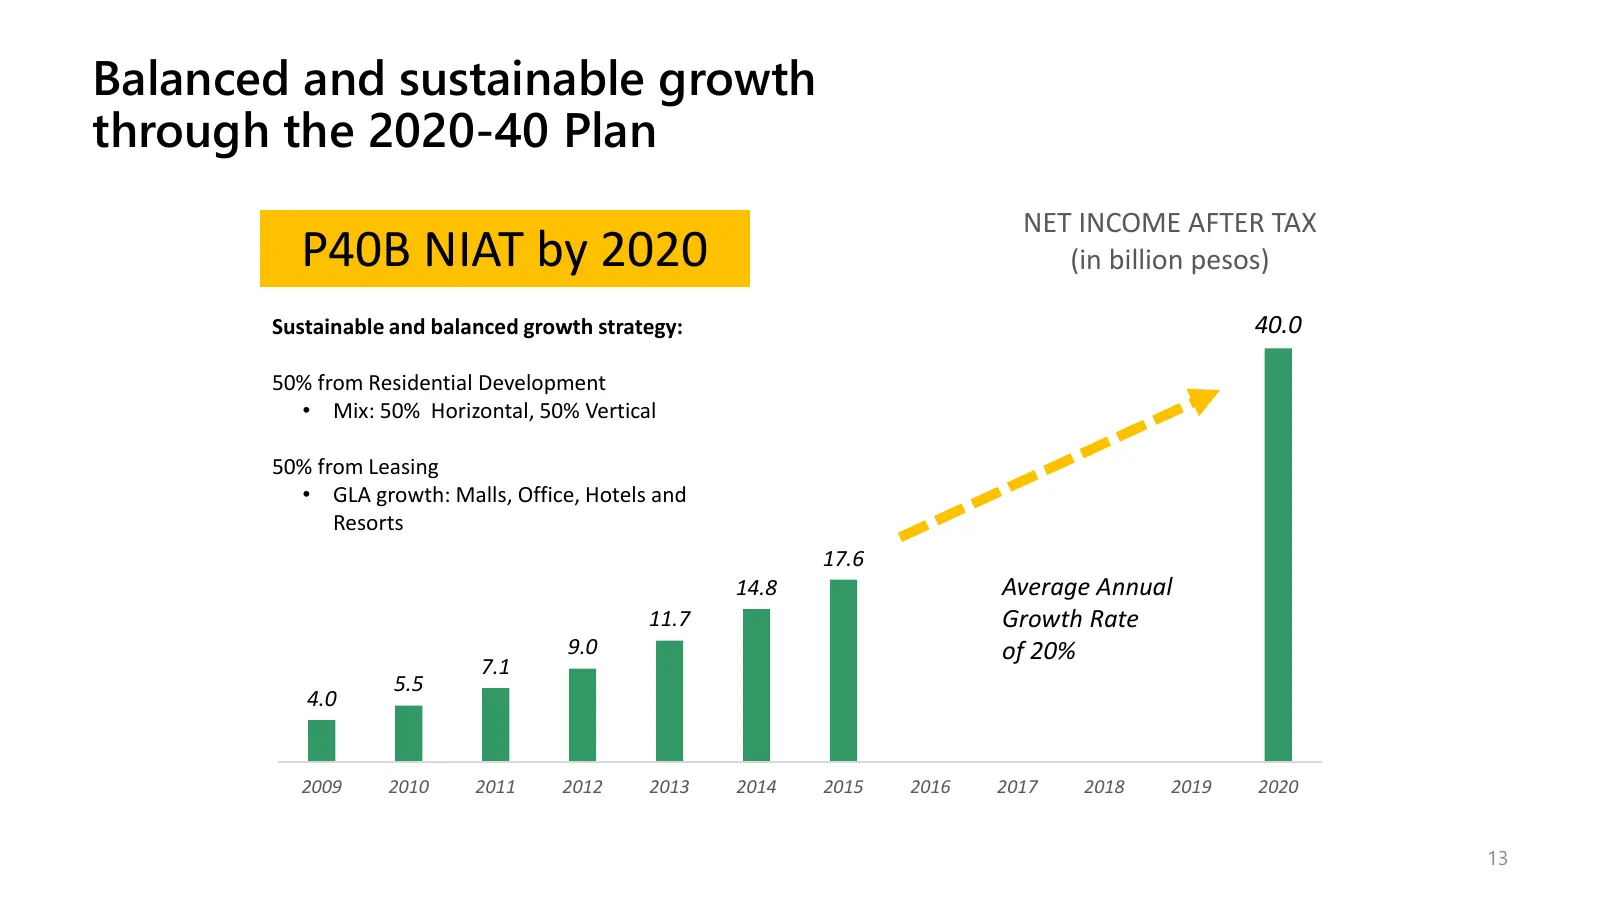
Slide 13: Balanced and sustainable growth through the 2020-40 Plan
Balanced and sustainable growth through the 2020-40 Plan NET INCOME AFTER TAX P40B NIAT by 2020 (in billion pesos) Sustainable and balanced growth strategy: 40.0 50% from Residential Development • Mix: 50% Horizontal, 50% Vertical 50% from Leasing • GLA growth: Malls, Office, Hotels and Resorts 17.6
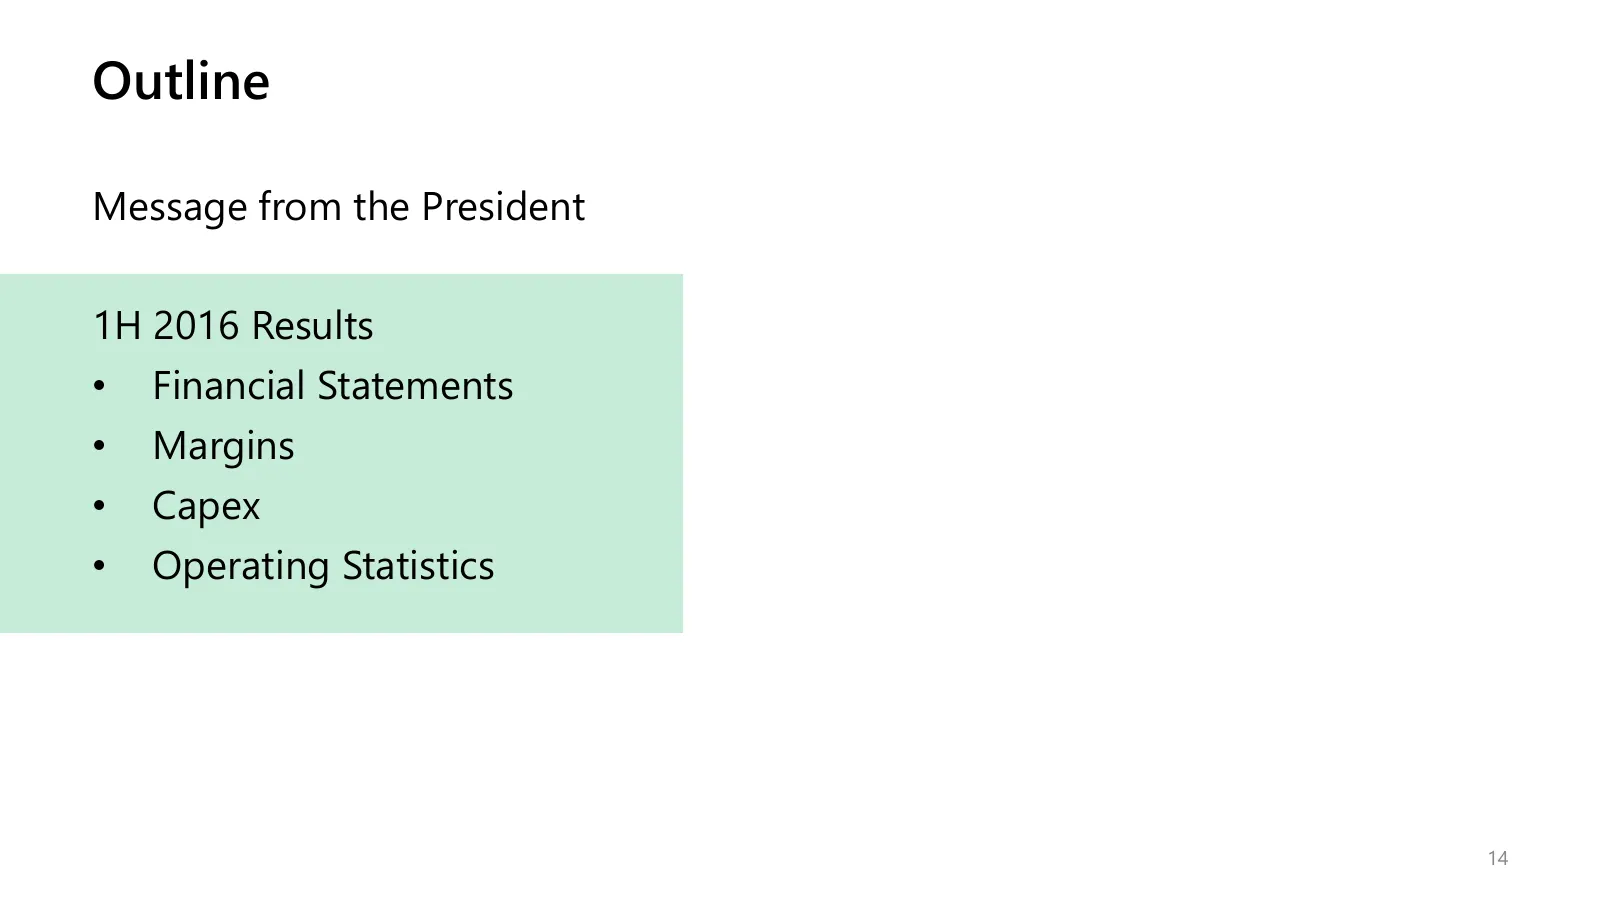
Slide 14: Outline
Outline Message from the President 1H 2016 Results • Financial Statements • Margins • Capex • Operating Statistics 14
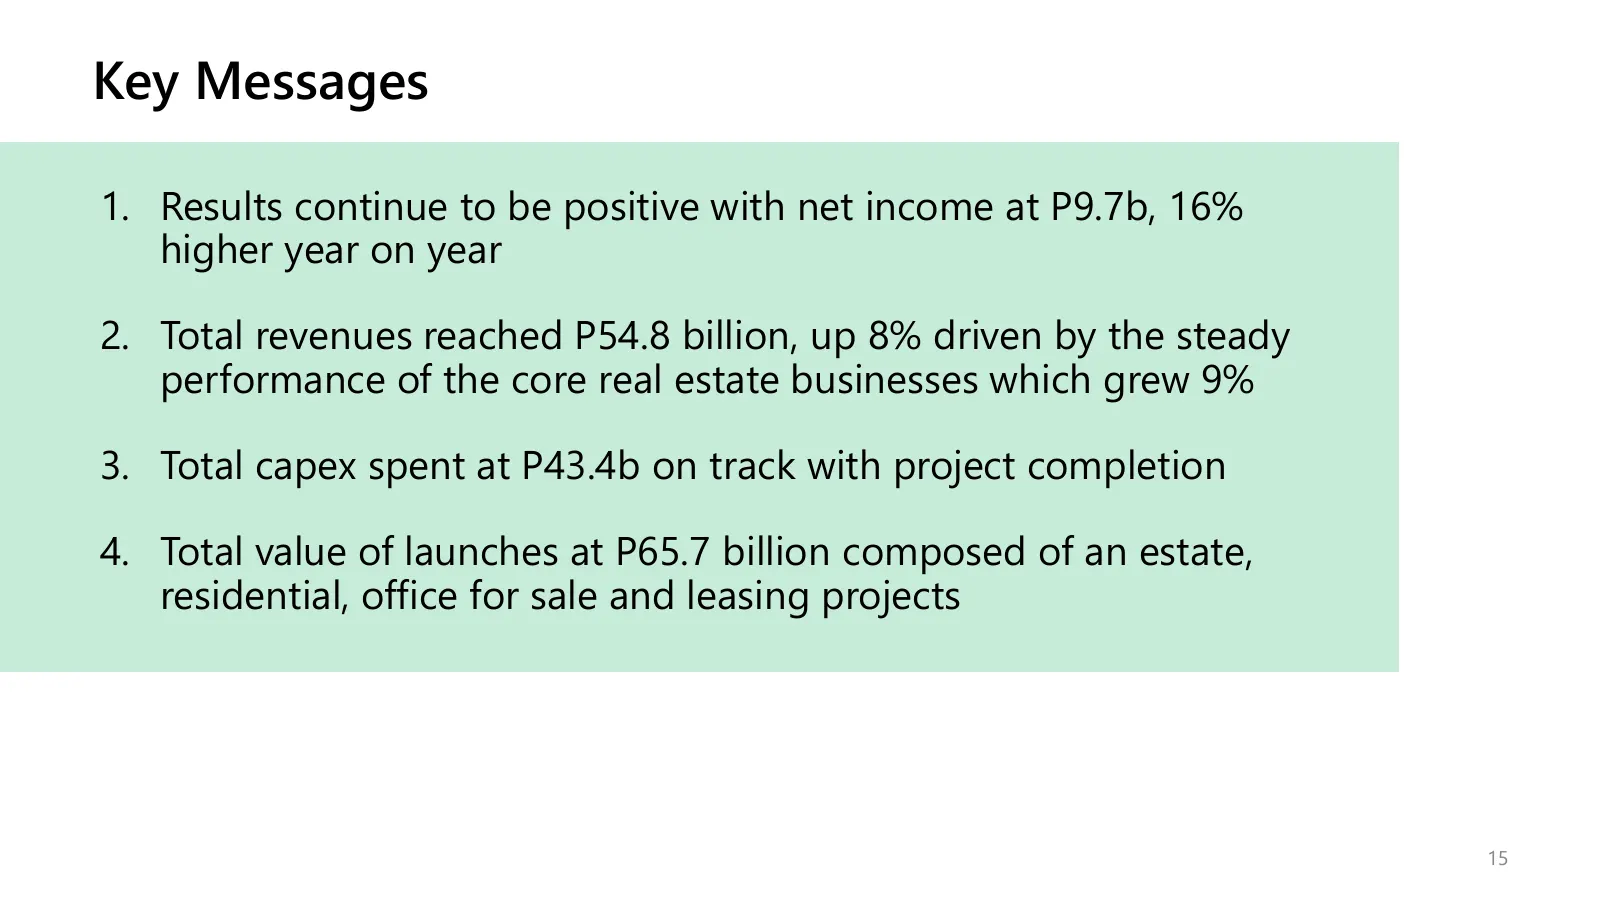
Slide 15: Key Messages
Key Messages 1. Results continue to be positive with net income at P9.7b, 16% higher year on year 2. Total revenues reached P54.8 billion, up 8% driven by the steady performance of the core real estate businesses which grew 9% 3. Total capex spent at P43.4b on track with project completion 4. Total
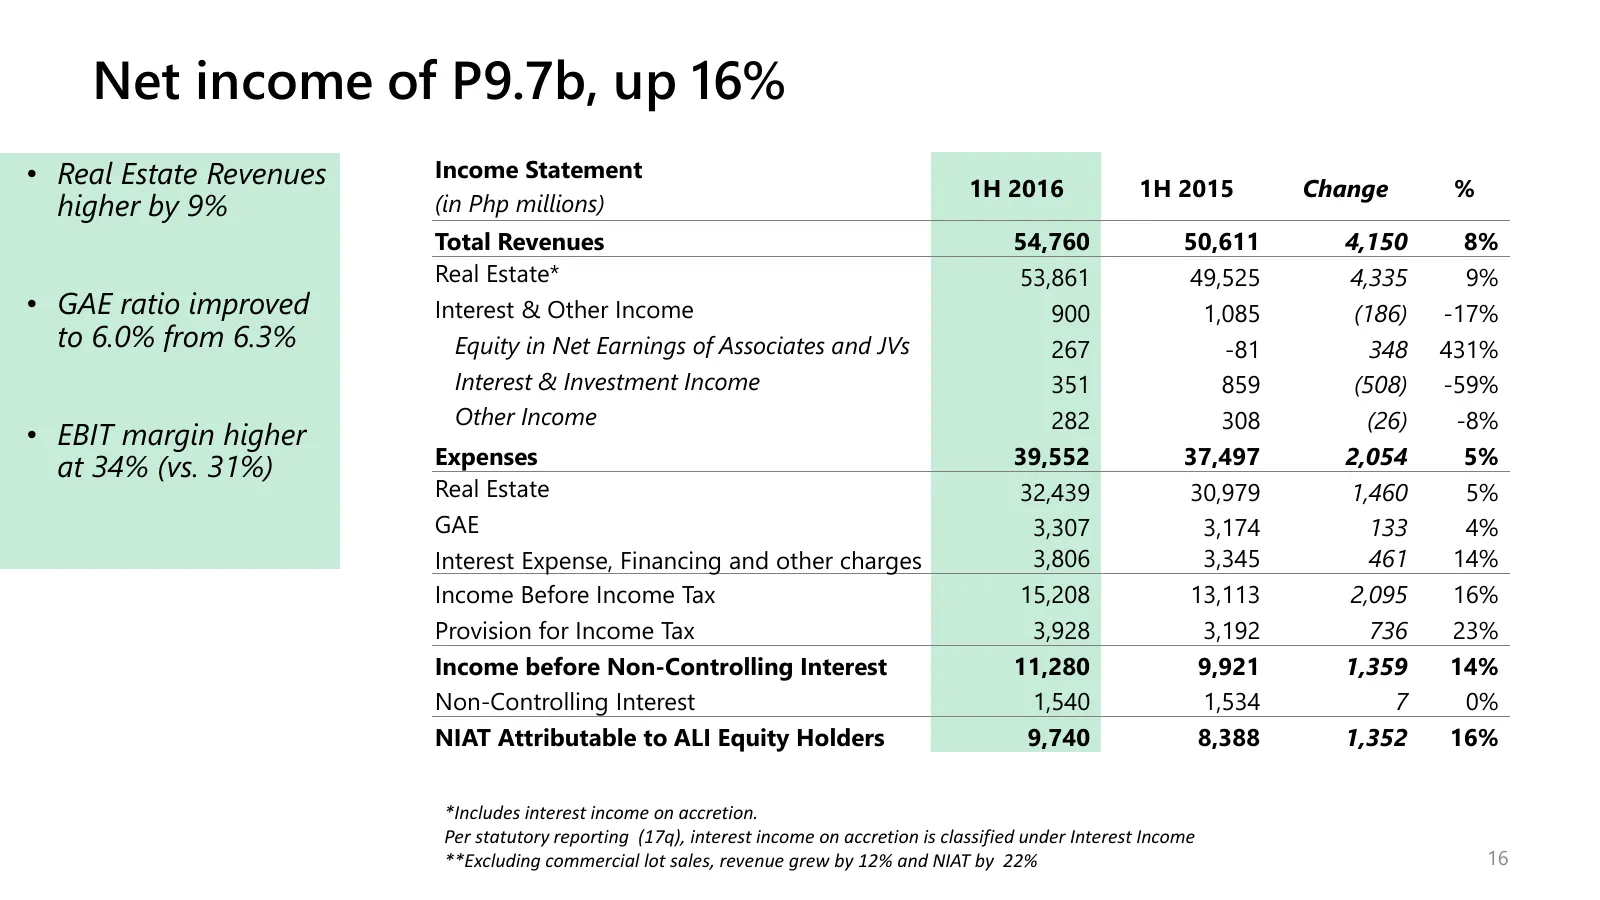
Slide 16: Net income of P9.7b, up 16%
Net income of P9.7b, up 16% • Real Estate Revenues Income Statement 1H 2016 1H 2015 Change % higher by 9% (in Php millions) Total Revenues 54,760 50,611 4,150 8% Real Estate* 53,861 49,525 4,335 9% • GAE ratio improved Interest & Other Income 900 1,085 (186) -17% to 6.0% from 6.3% Equity in Net Earn
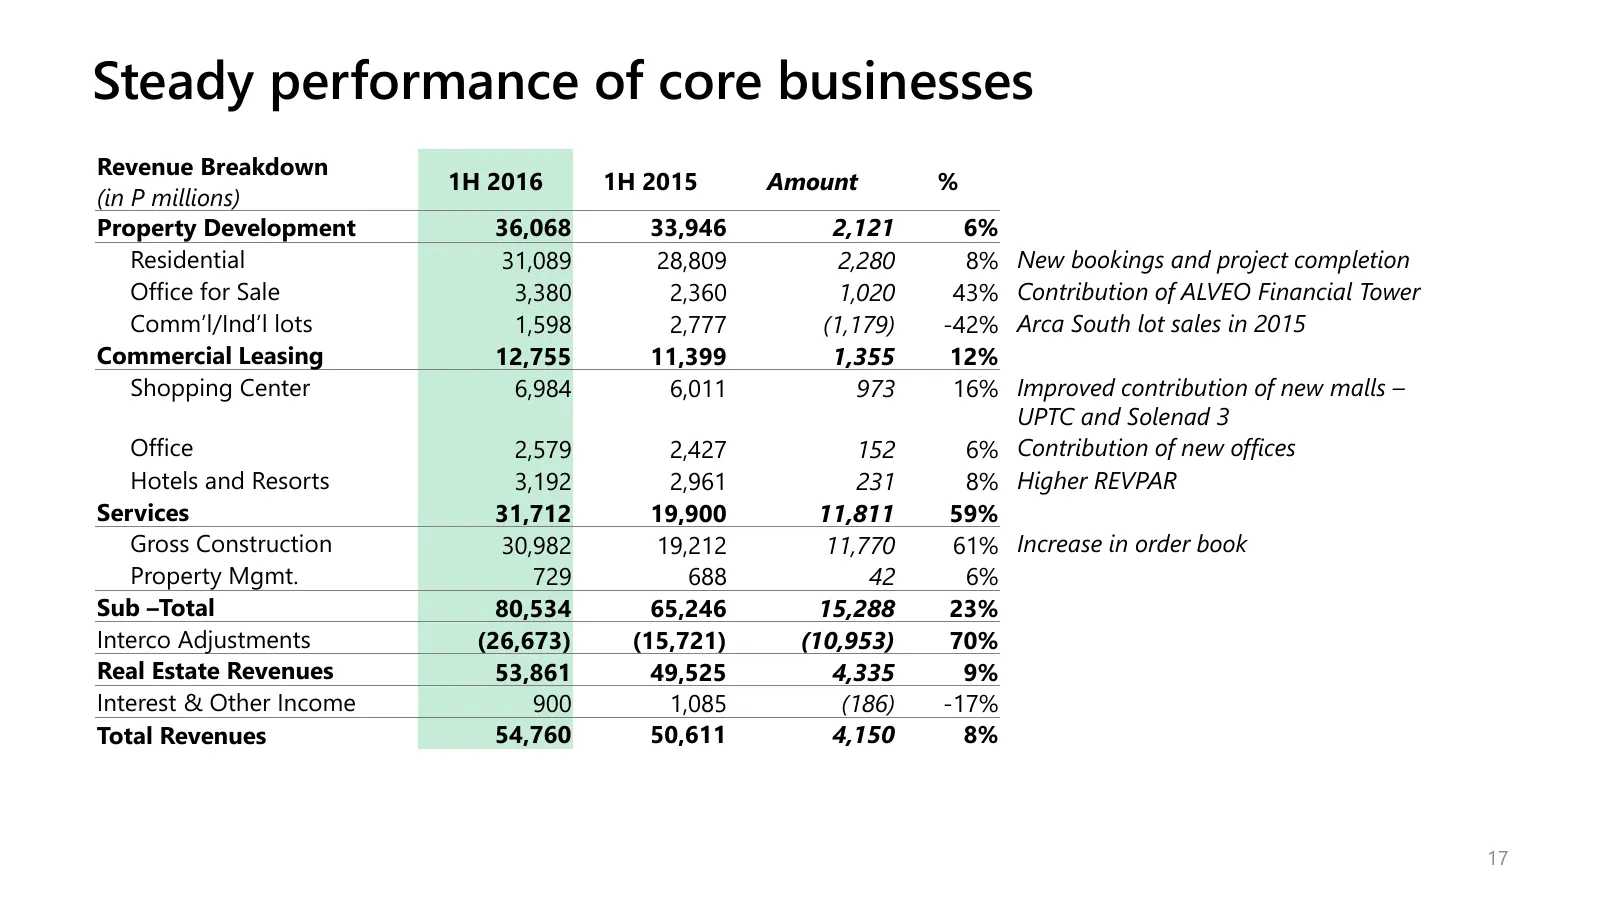
Slide 17: Steady performance of core businesses
Steady performance of core businesses Revenue Breakdown 1H 2016 1H 2015 Amount % (in P millions) Property Development 36,068 33,946 2,121 6% Residential 31,089 28,809 2,280 8% New bookings and project completion Office for Sale 3,380 2,360 1,020 43% Contribution of ALVEO Financial Tower Comm’l/Ind’l
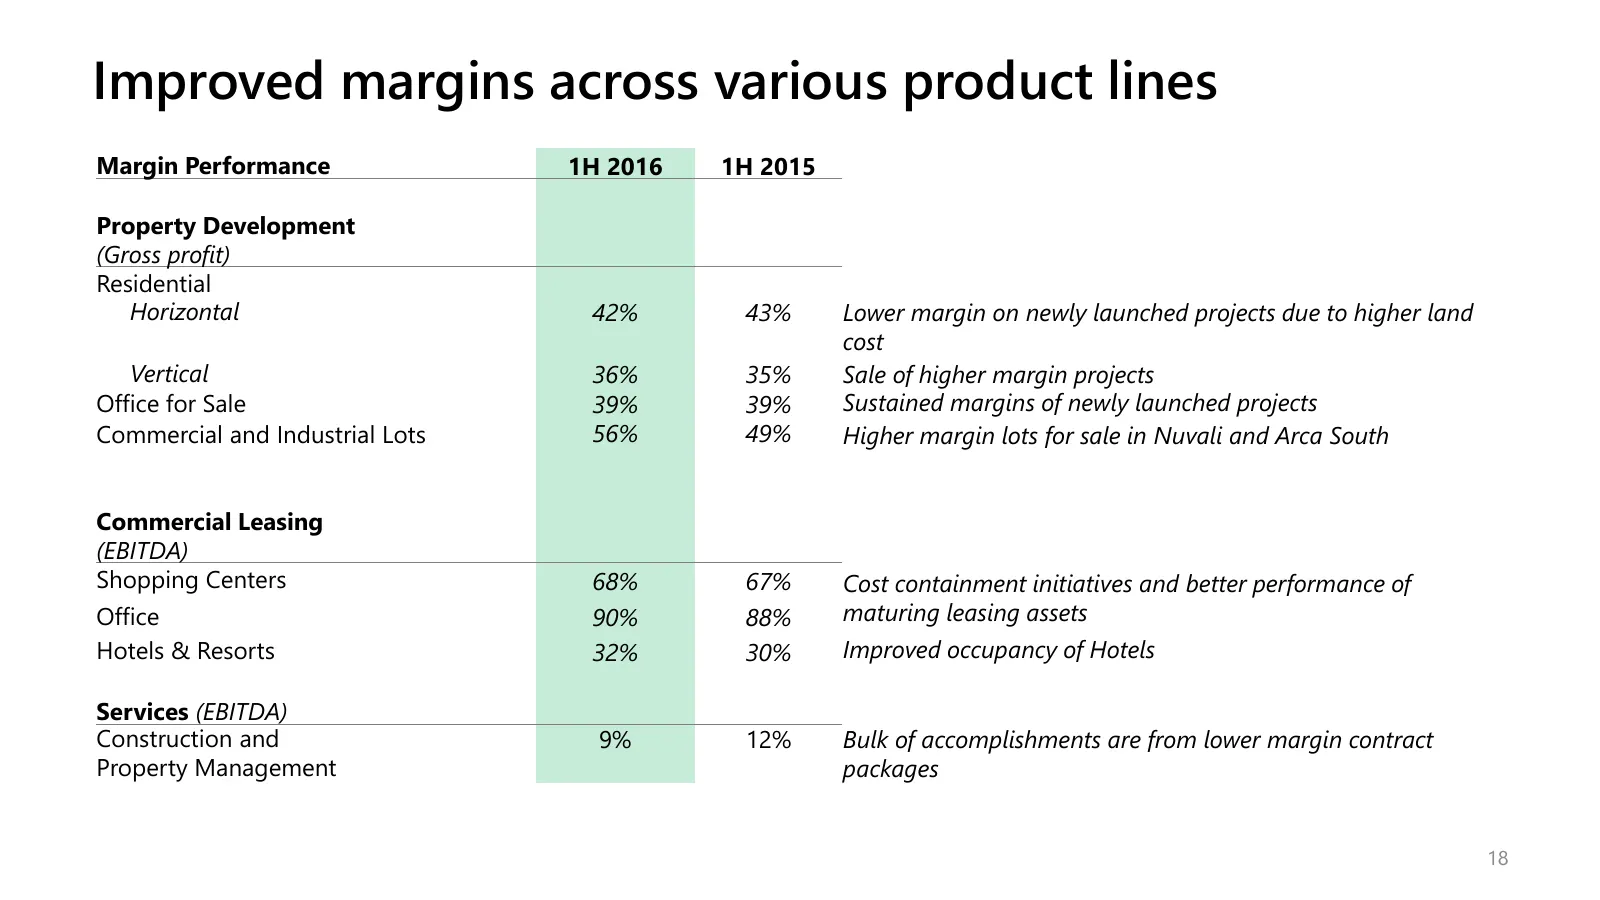
Slide 18: Improved margins across various product lines
Improved margins across various product lines Margin Performance 1H 2016 1H 2015 Property Development (Gross profit) Residential Horizontal 42% 43% Lower margin on newly launched projects due to higher land cost Vertical 36% 35% Sale of higher margin projects Office for Sale 39% 39% Sustained margin
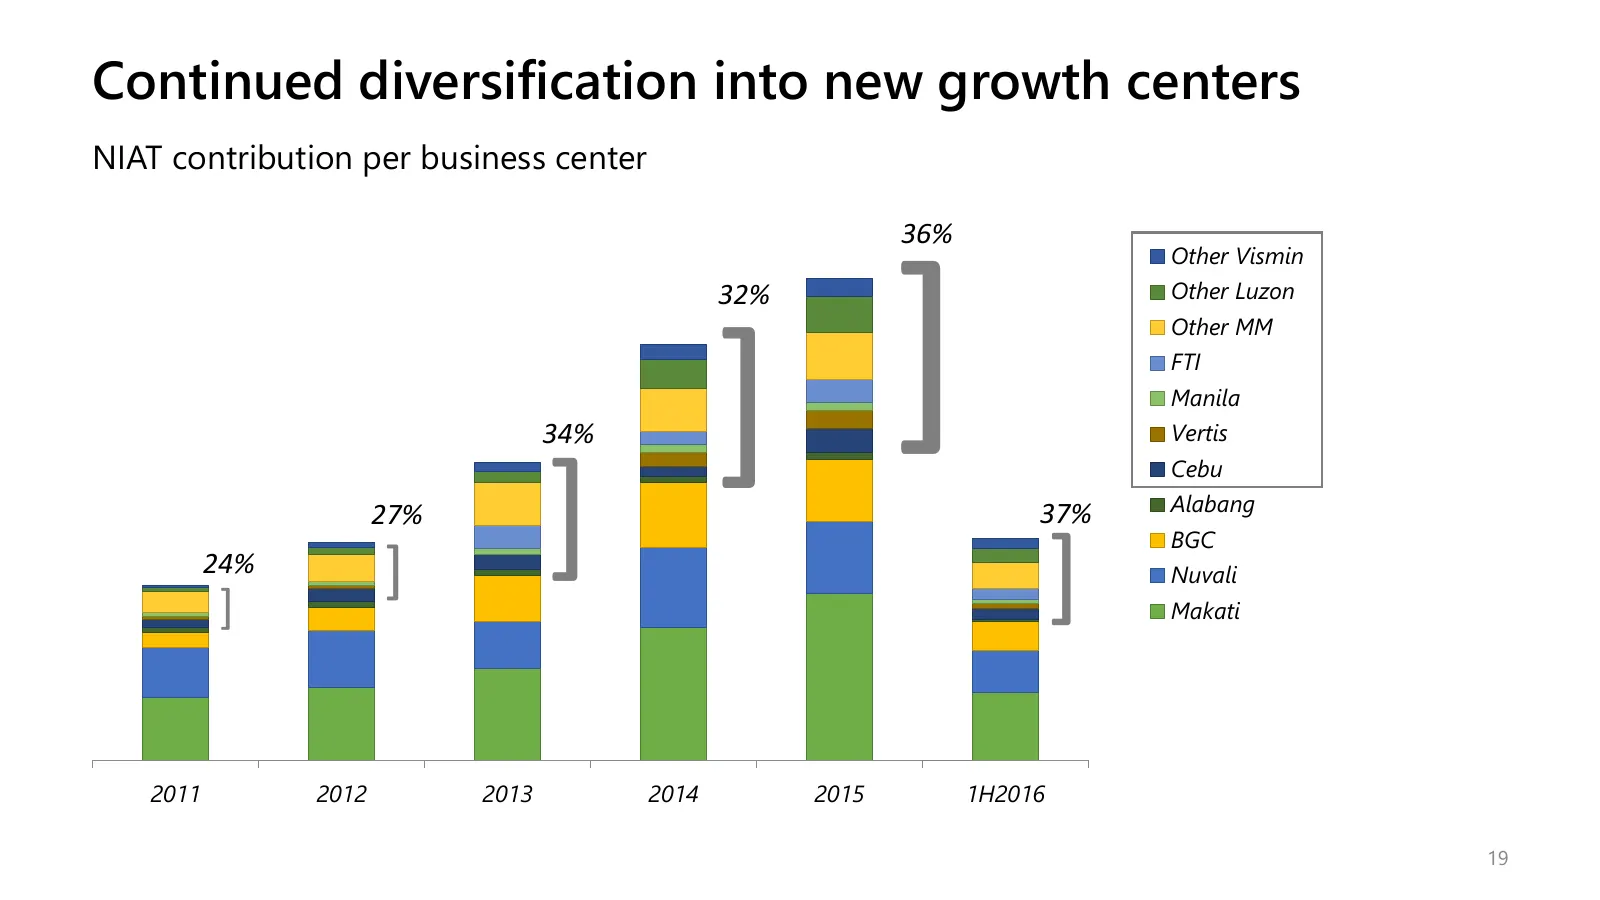
Slide 19: Continued diversification into new growth centers
Continued diversification into new growth centers NIAT contribution per business center 36% Other Vismin ] 32% Other Luzon Other MM 34% ] FTI Manila Vertis ] Cebu 27% 37% Alabang BGC 24% ] ] ] Nuvali Makati 2011 2012 2013 2014 2015 1H2016 19
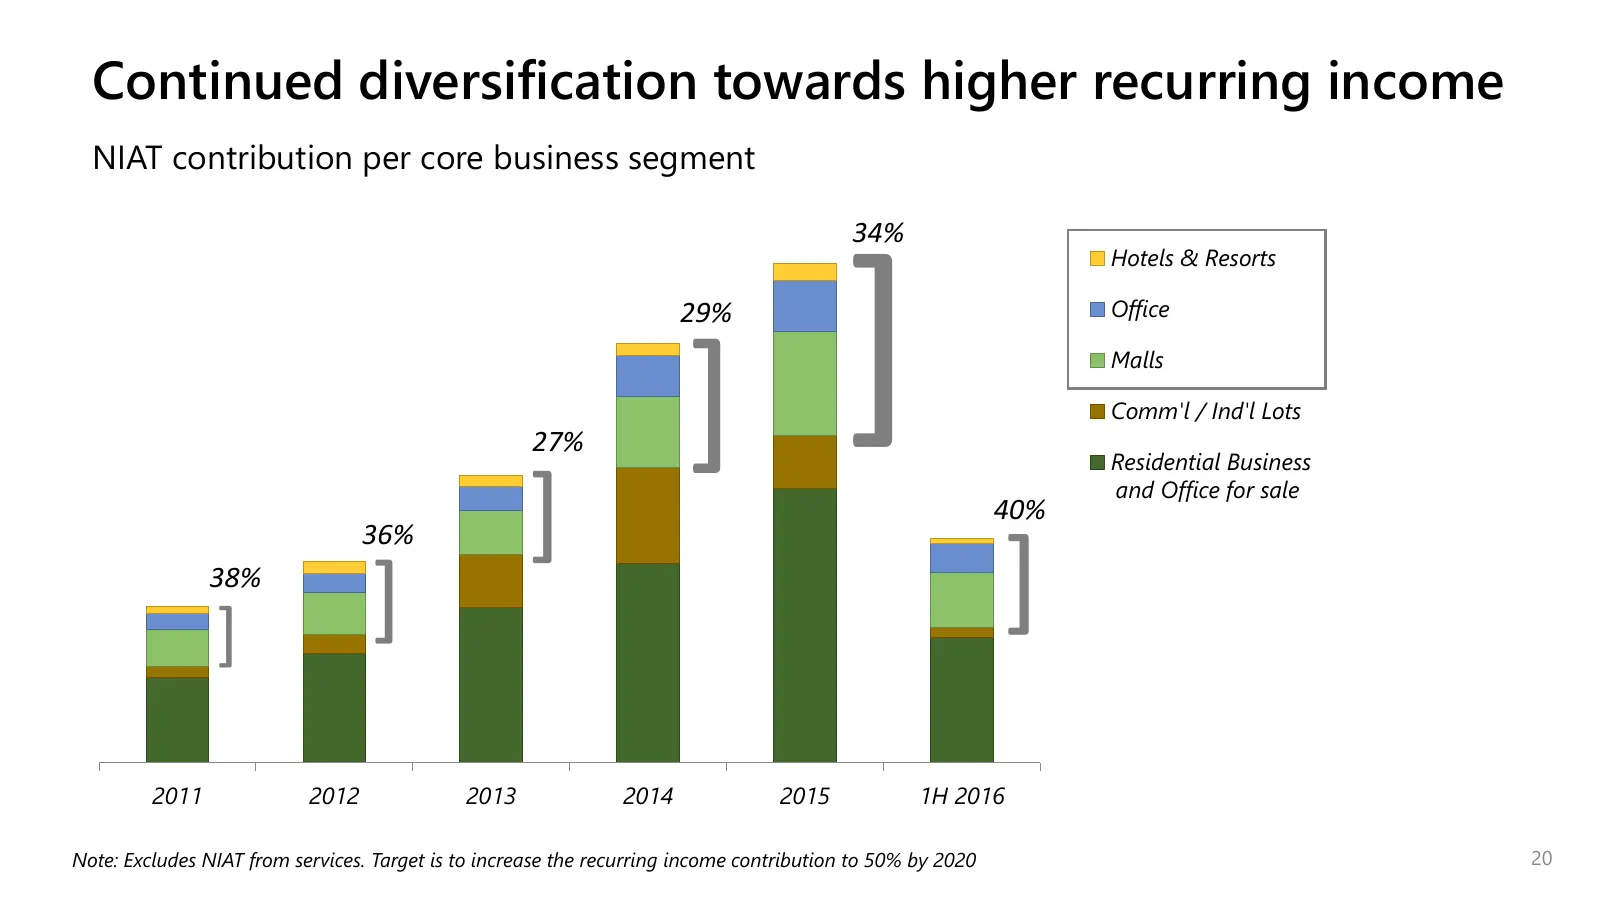
Slide 20: Continued diversification towards higher recurring income
Continued diversification towards higher recurring income NIAT contribution per core business segment 34% ] Hotels & Resorts 29% Office ] Malls Comm'l / Ind'l Lots 27% Residential Business 36% ] 40% and Office for sale 38% ] ] ] 2011 2012 2013 2014 2015 1H 2016 Note: Excludes NIAT from services. Tar
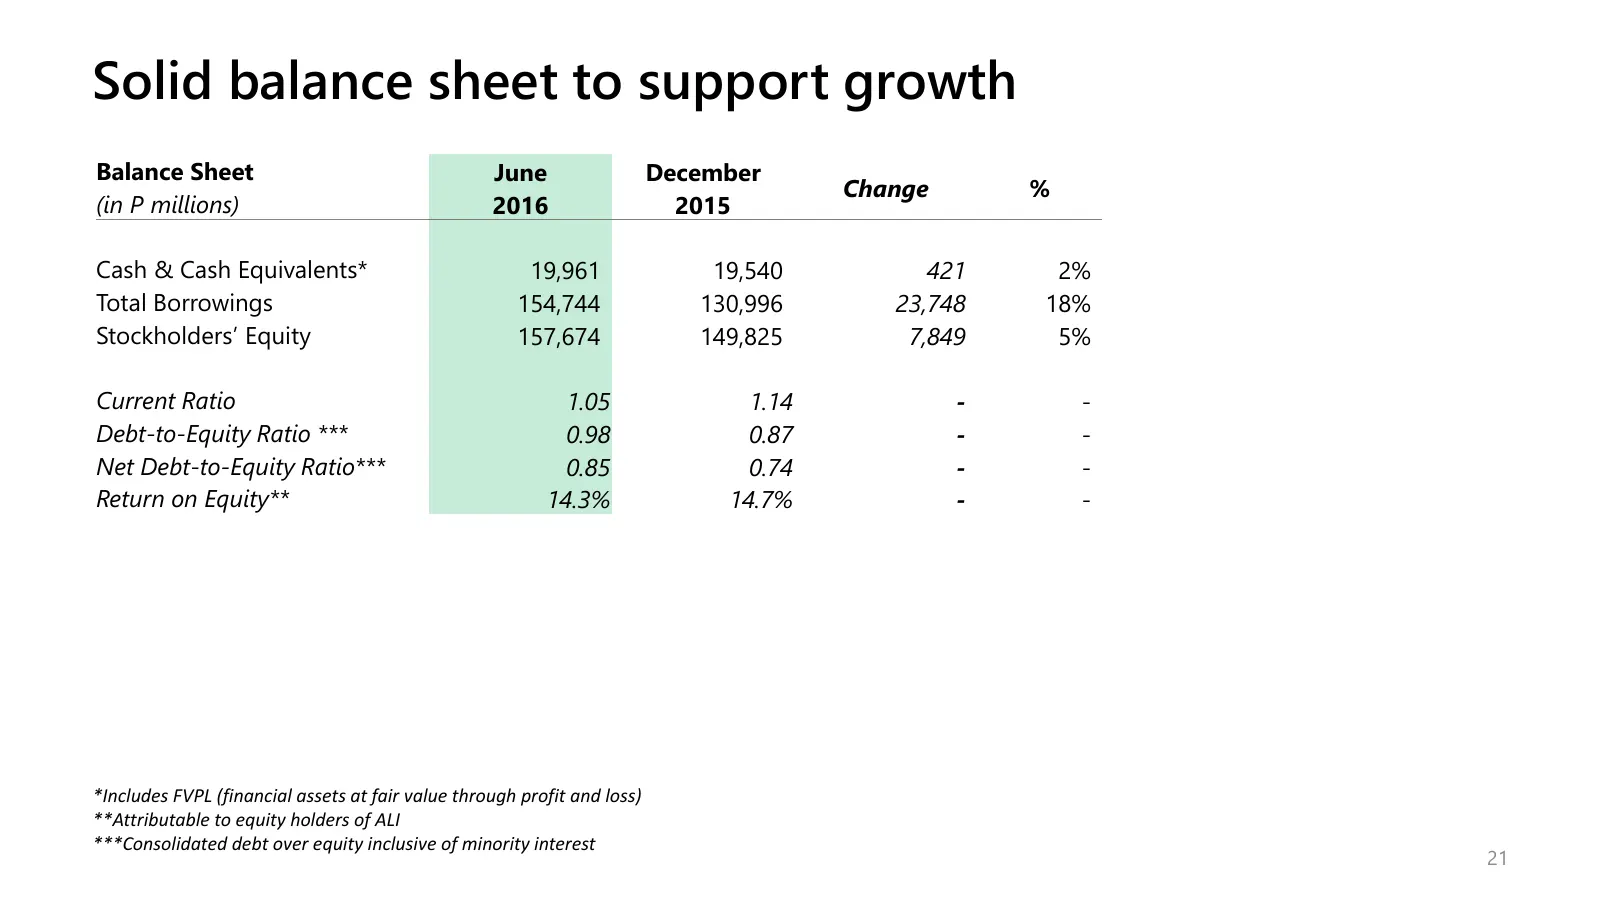
Slide 21: Solid balance sheet to support growth
Solid balance sheet to support growth Balance Sheet June December Change % (in P millions) 2016 2015 Cash & Cash Equivalents* 19,961 19,540 421 2% Total Borrowings 154,744 130,996 23,748 18% Stockholders’ Equity 157,674 149,825 7,849 5% Current Ratio 1.05 1.14 - - Debt-to-Equity Ratio *** 0.98 0.87
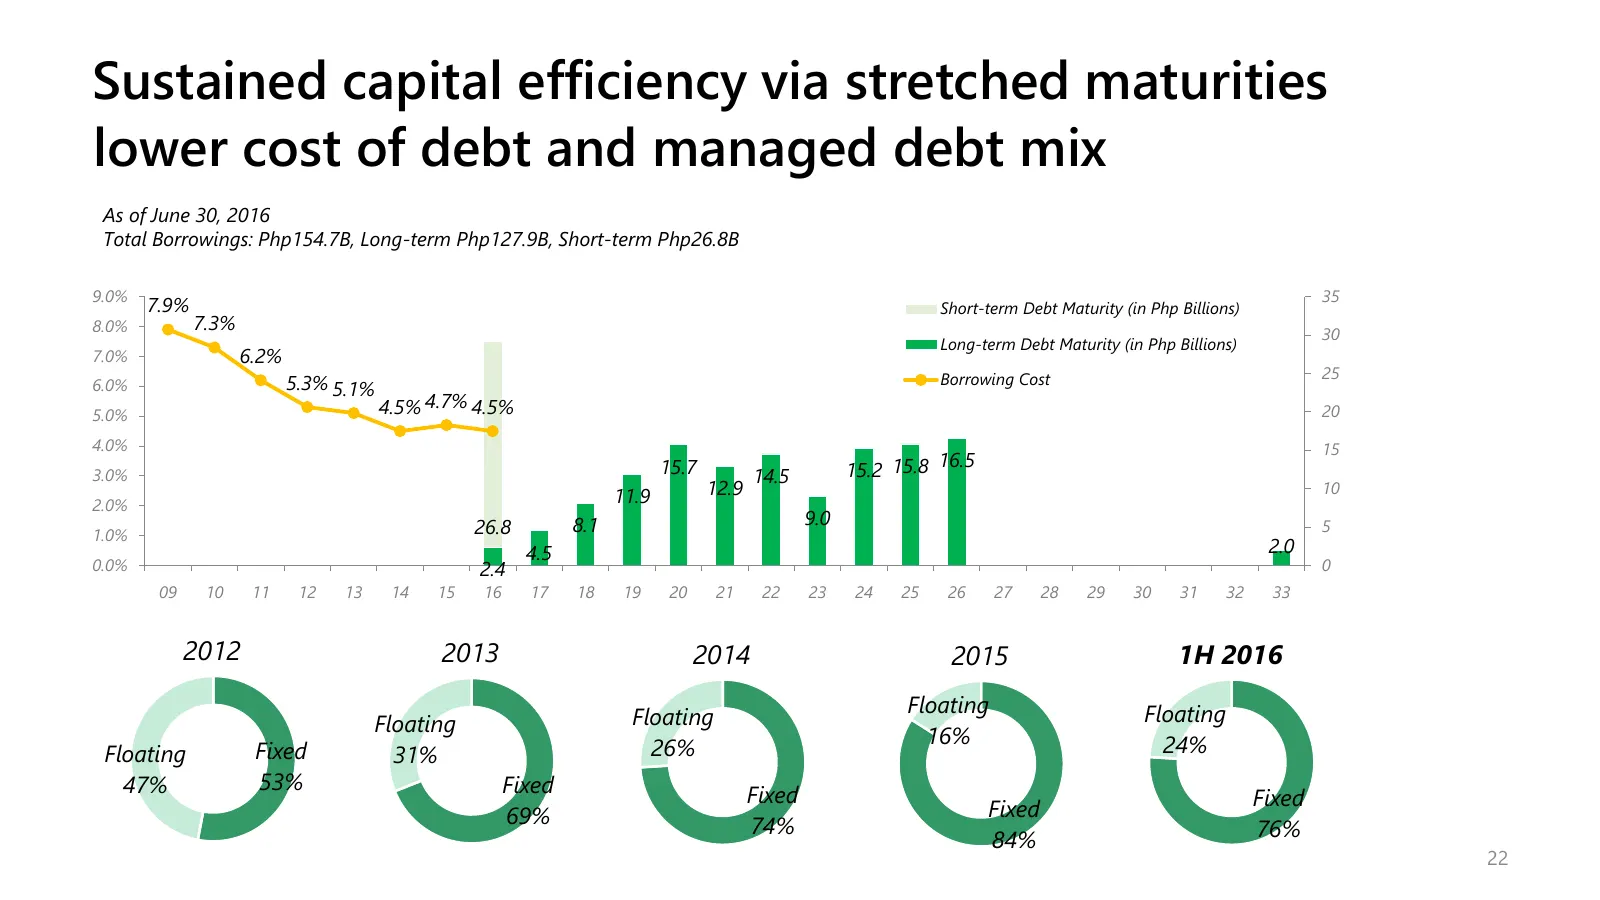
Slide 22: Sustained capital efficiency via stretched maturities, lower cost of debt
Sustained capital efficiency via stretched maturities lower cost of debt and managed debt mix As of June 30, 2016 Total Borrowings: Php154.7B, Long-term Php127.9B, Short-term Php26.8B 9.0% 35 7.9% Short-term Debt Maturity (in Php Billions) 8.0% 7.3% 30 Long-term Debt Maturity (in Php Billions) 7.0%
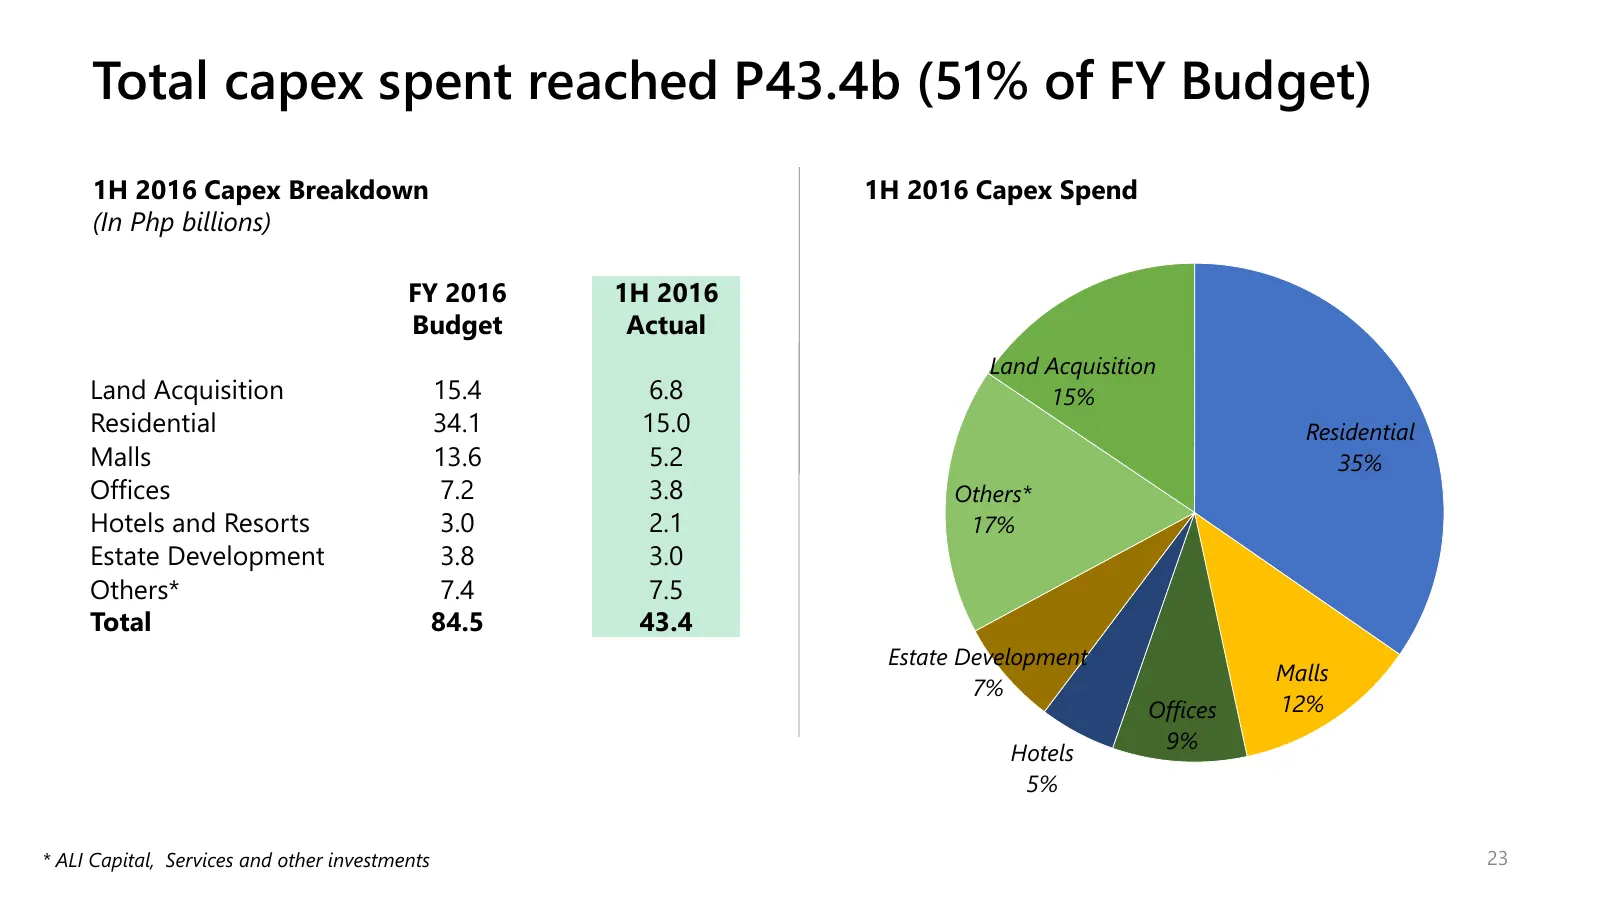
Slide 23: Total capex spent reached P43.4b (51% of FY Budget)
Total capex spent reached P43.4b (51% of FY Budget) 1H 2016 Capex Breakdown 1H 2016 Capex Spend (In Php billions) FY 2016 1H 2016 Budget Actual Land Acquisition Land Acquisition 15.4 6.8 15% Residential 34.1 15.0 Residential Malls 13.6 5.2 35% Offices 7.2 3.8 Others* Hotels and Resorts 3.0 2.1 17% E
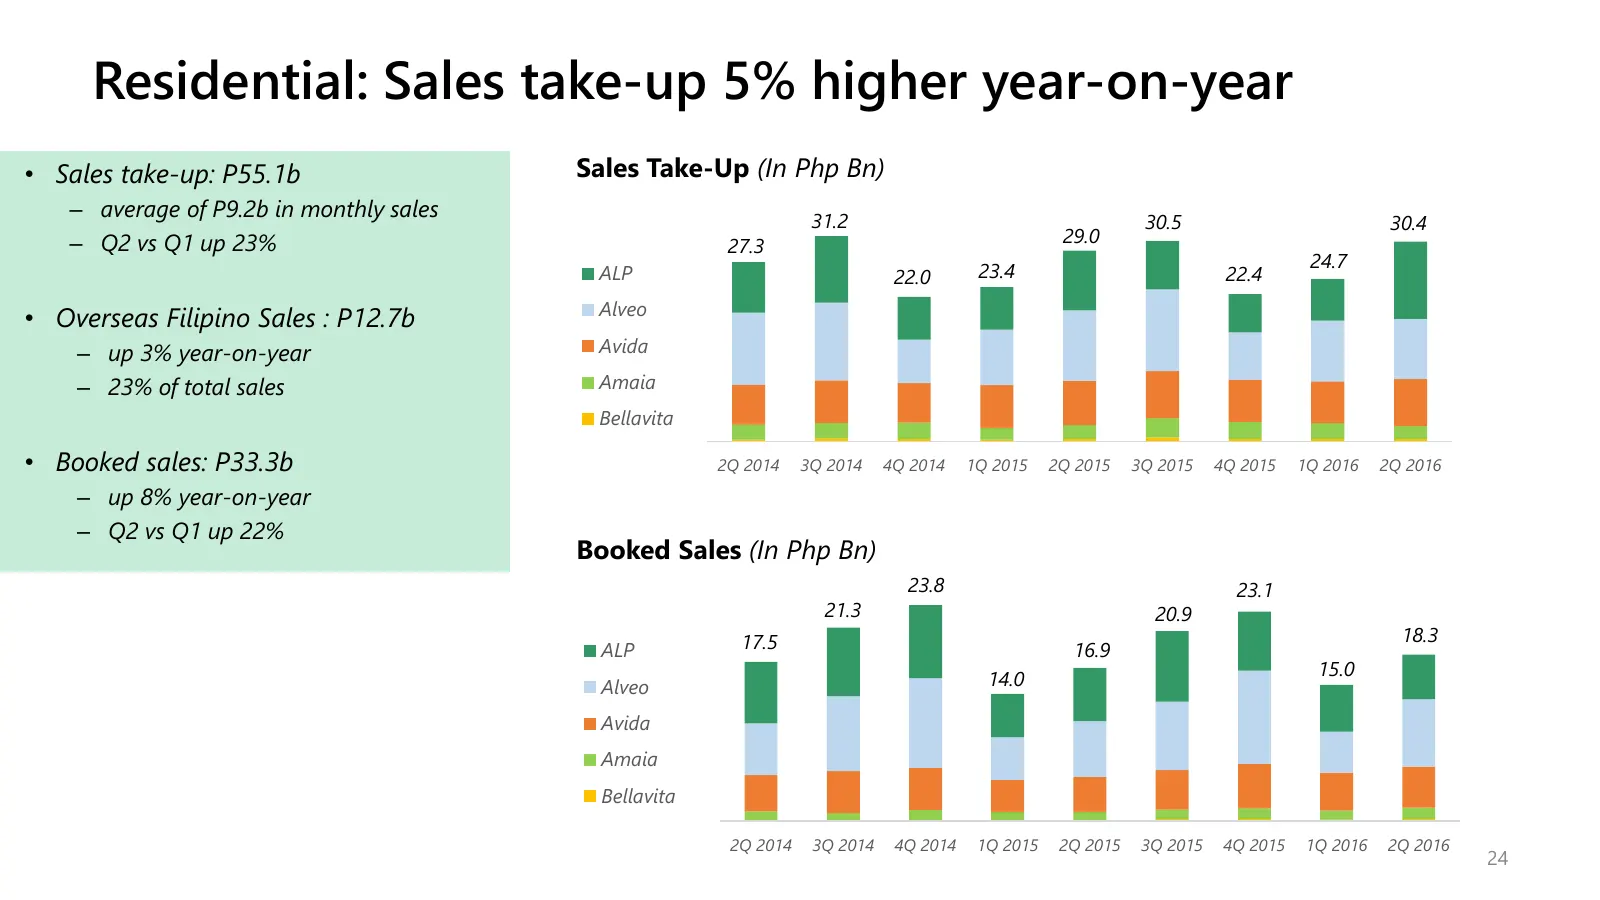
Slide 24: Residential: Sales take-up 5% higher year-on-year
Residential: Sales take-up 5% higher year-on-year • Sales take-up: P55.1b Sales Take-Up (In Php Bn) – average of P9.2b in monthly sales 31.2 30.5 30.4 – Q2 vs Q1 up 23% 29.0 27.3 24.7 ALP 22.0 23.4 22.4 Alveo • Overseas Filipino Sales : P12.7b – up 3% year-on-year Avida – 23% of total sales Amaia Be
Slide 25: Continued build-up of unbooked revenues
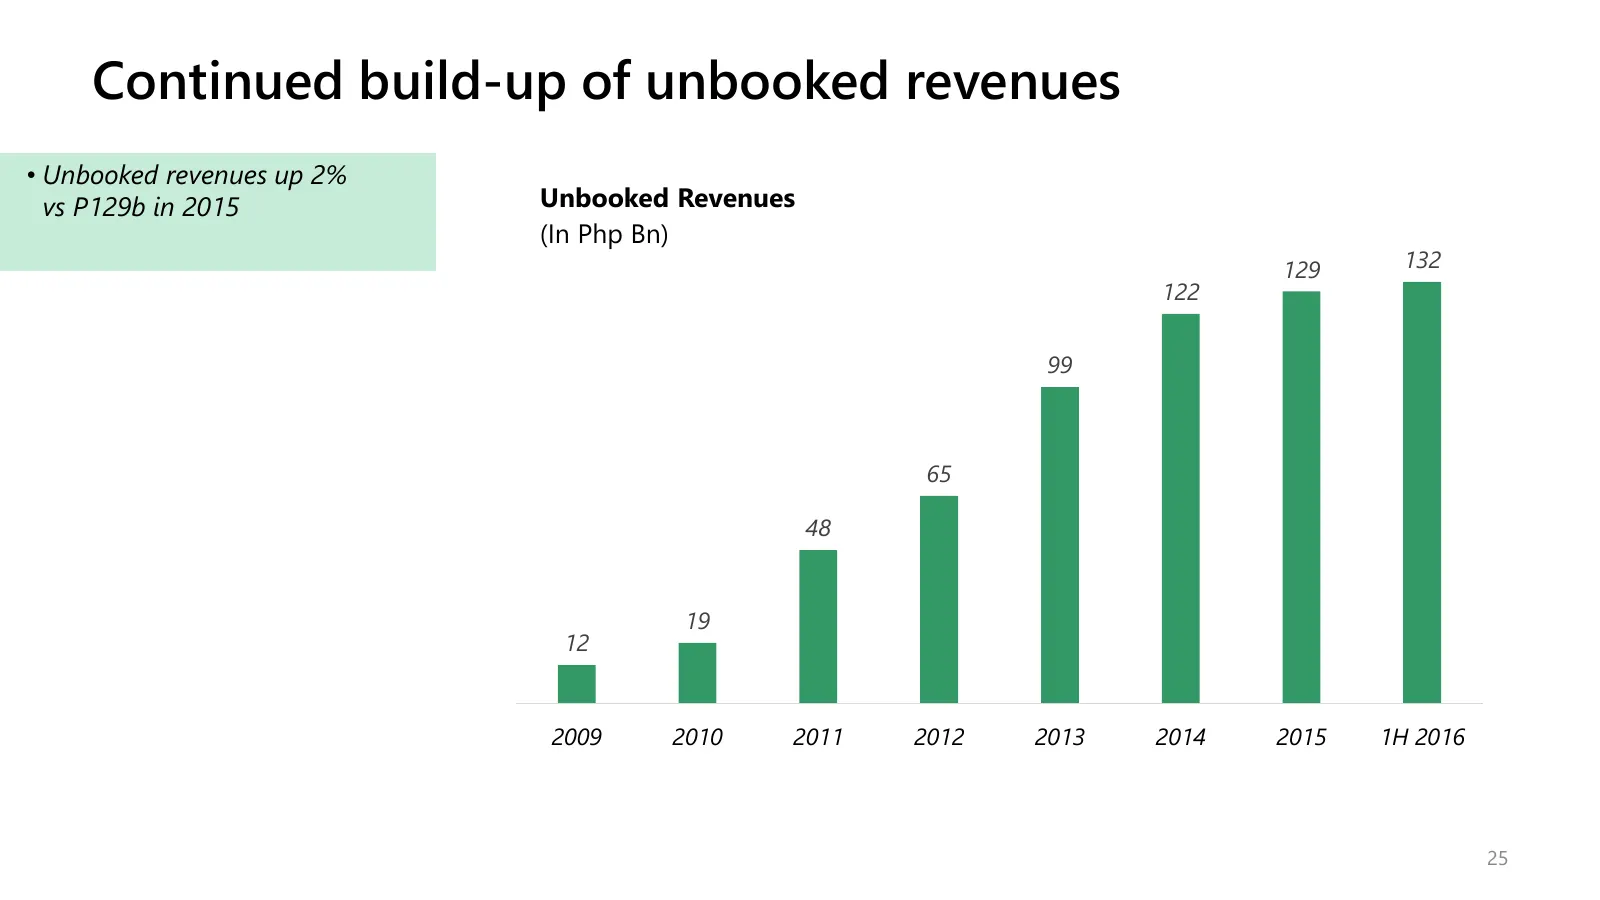
Continued build-up of unbooked revenues • Unbooked revenues up 2% vs P129b in 2015 Unbooked Revenues (In Php Bn) 129 132 122 99 65 48 19 12 2009 2010 2011 2012 2013 2014 2015 1H 2016 25
Slide 26: Key Launches: Residential
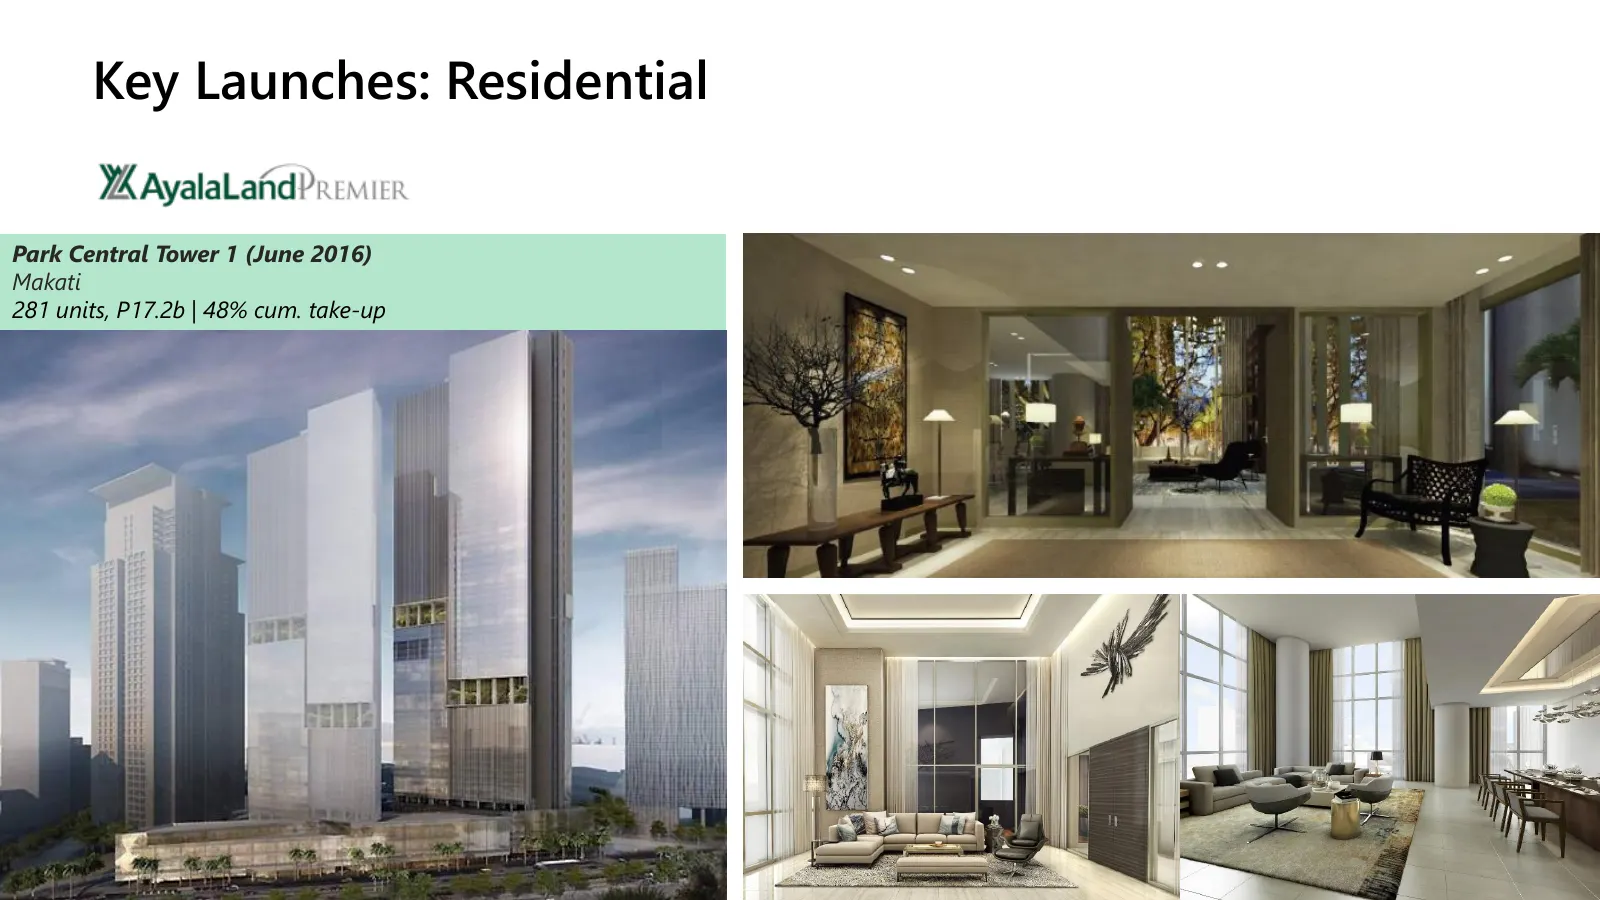
Key Launches: Residential Park Central Tower 1 (June 2016) Makati 281 units, P17.2b | 48% cum. take-up 26
Slide 27: Key Launches: Residential
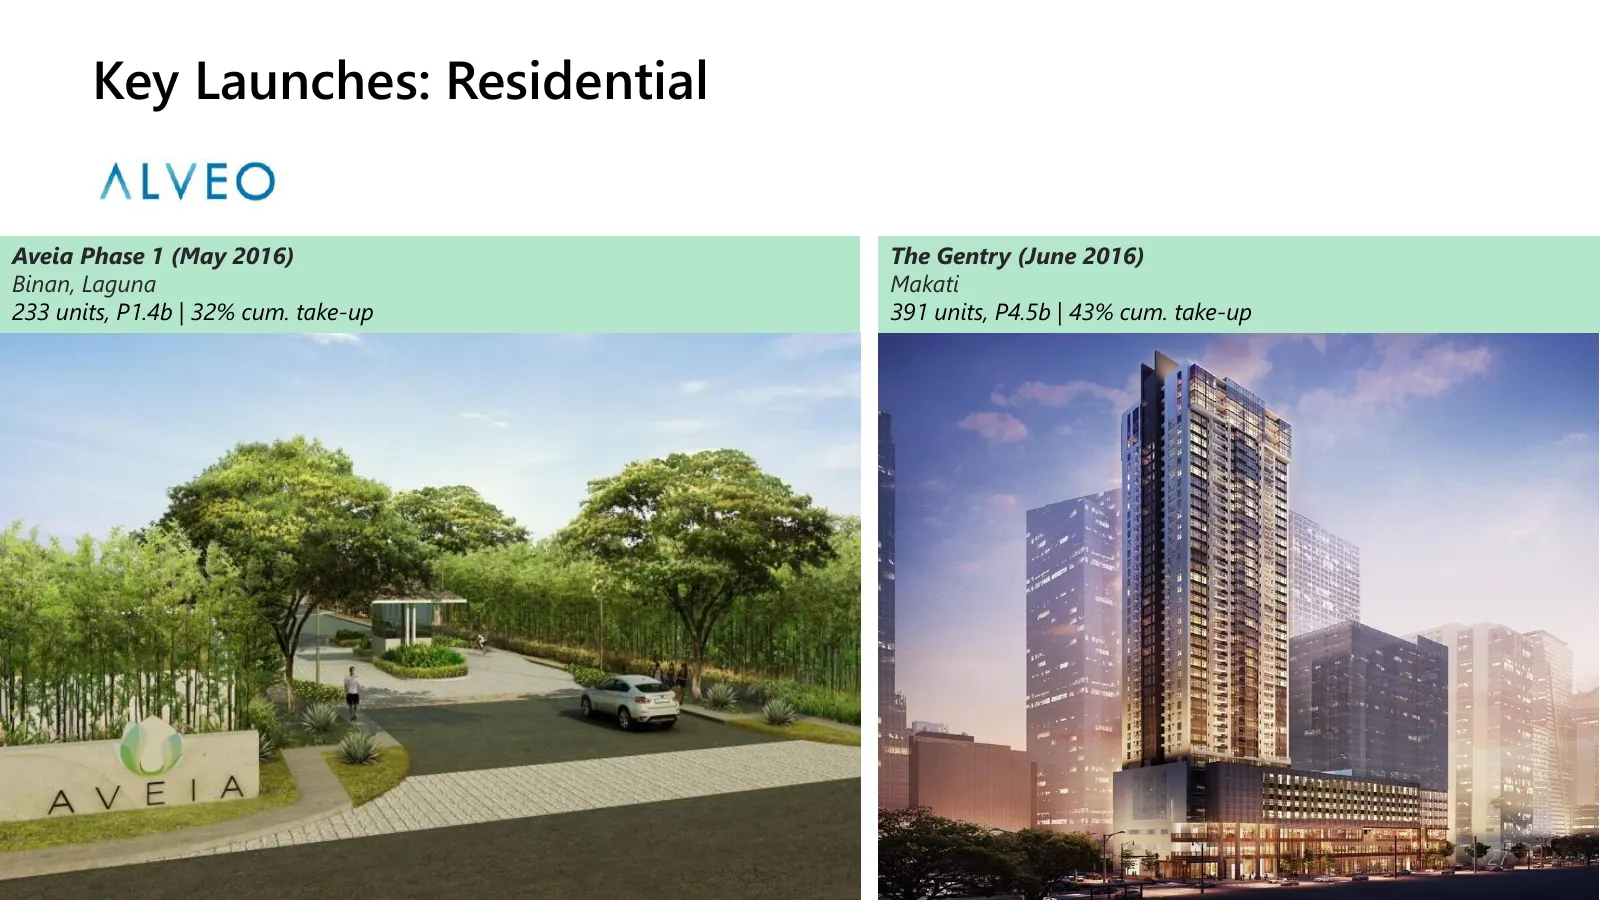
Key Launches: Residential Aveia Phase 1 (May 2016) The Gentry (June 2016) Binan, Laguna Makati 233 units, P1.4b | 32% cum. take-up 391 units, P4.5b | 43% cum. take-up 27
Slide 28: Key Launches: Residential
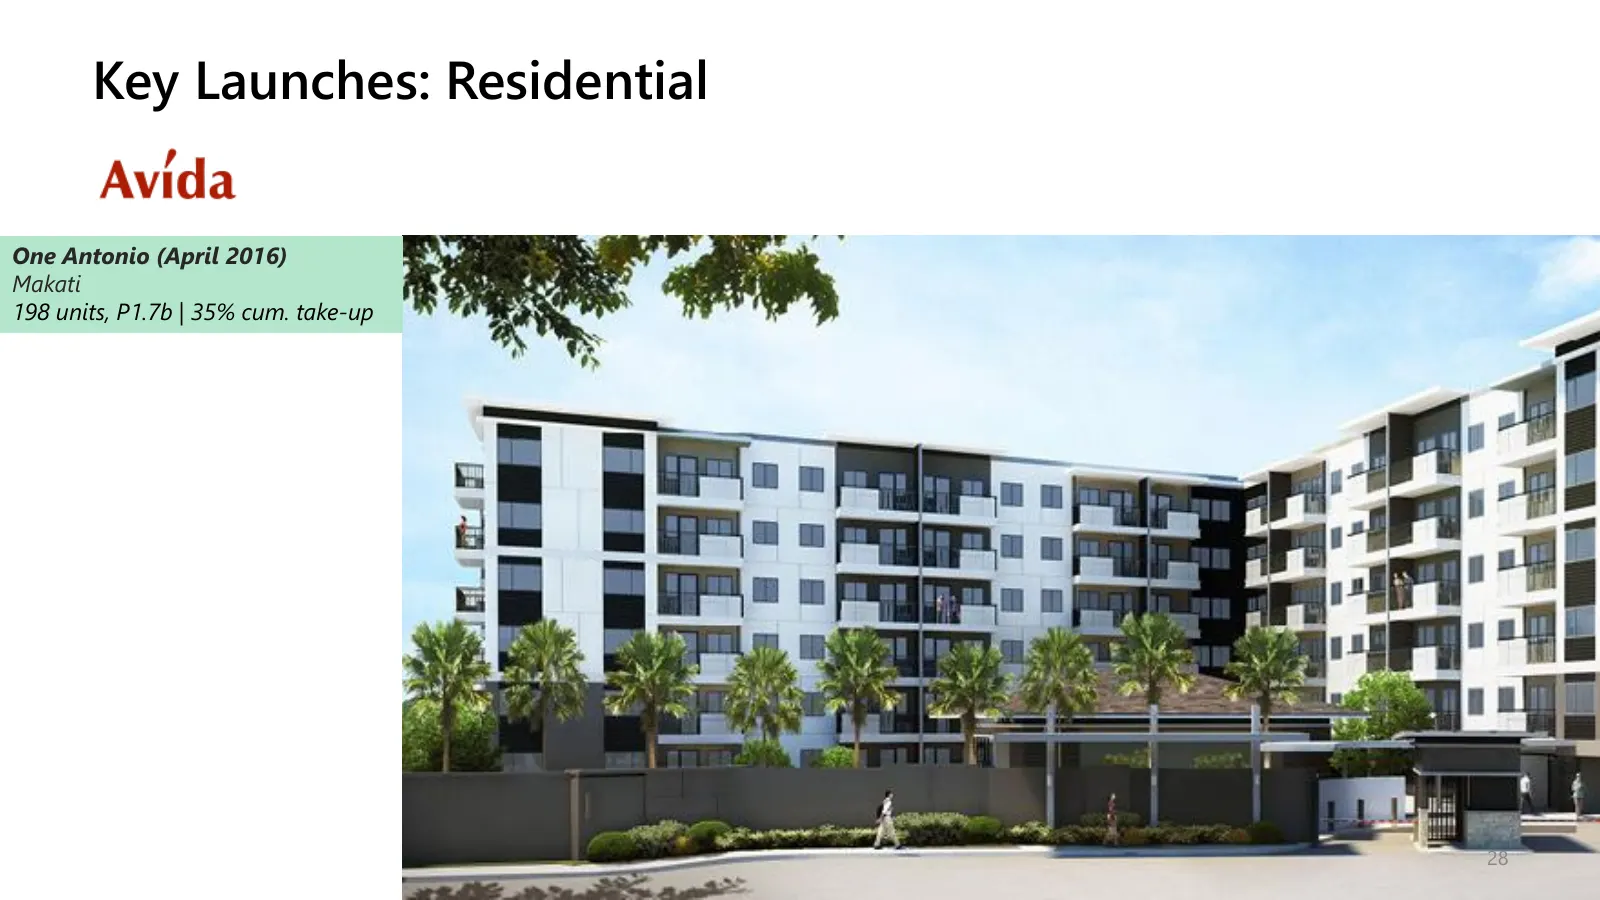
Key Launches: Residential One Antonio (April 2016) Makati 198 units, P1.7b | 35% cum. take-up 28
Slide 29: Key Launches: Gatewalk Central Cebu
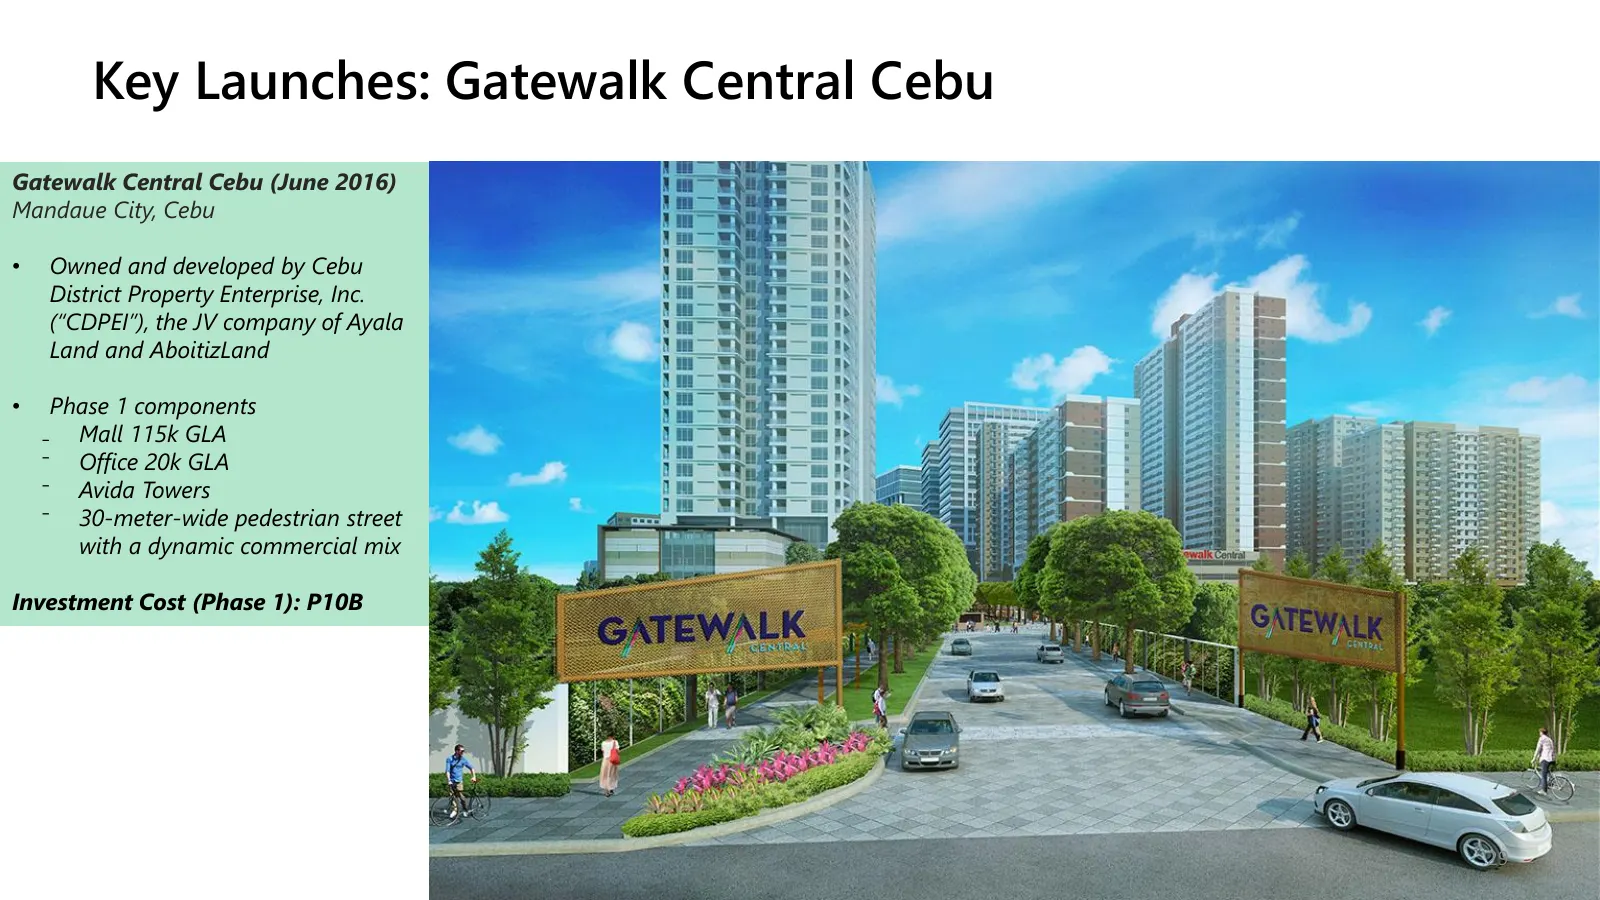
Key Launches: Gatewalk Central Cebu Gatewalk Central Cebu (June 2016) Mandaue City, Cebu • Owned and developed by Cebu District Property Enterprise, Inc. (“CDPEI”), the JV company of Ayala Land and AboitizLand • Phase 1 components ₋ Mall 115k GLA ⁻ Office 20k GLA ⁻ Avida Towers ⁻ 30-meter-wide pedes
Slide 30: Malls: Total GLA of 1.51m sqm
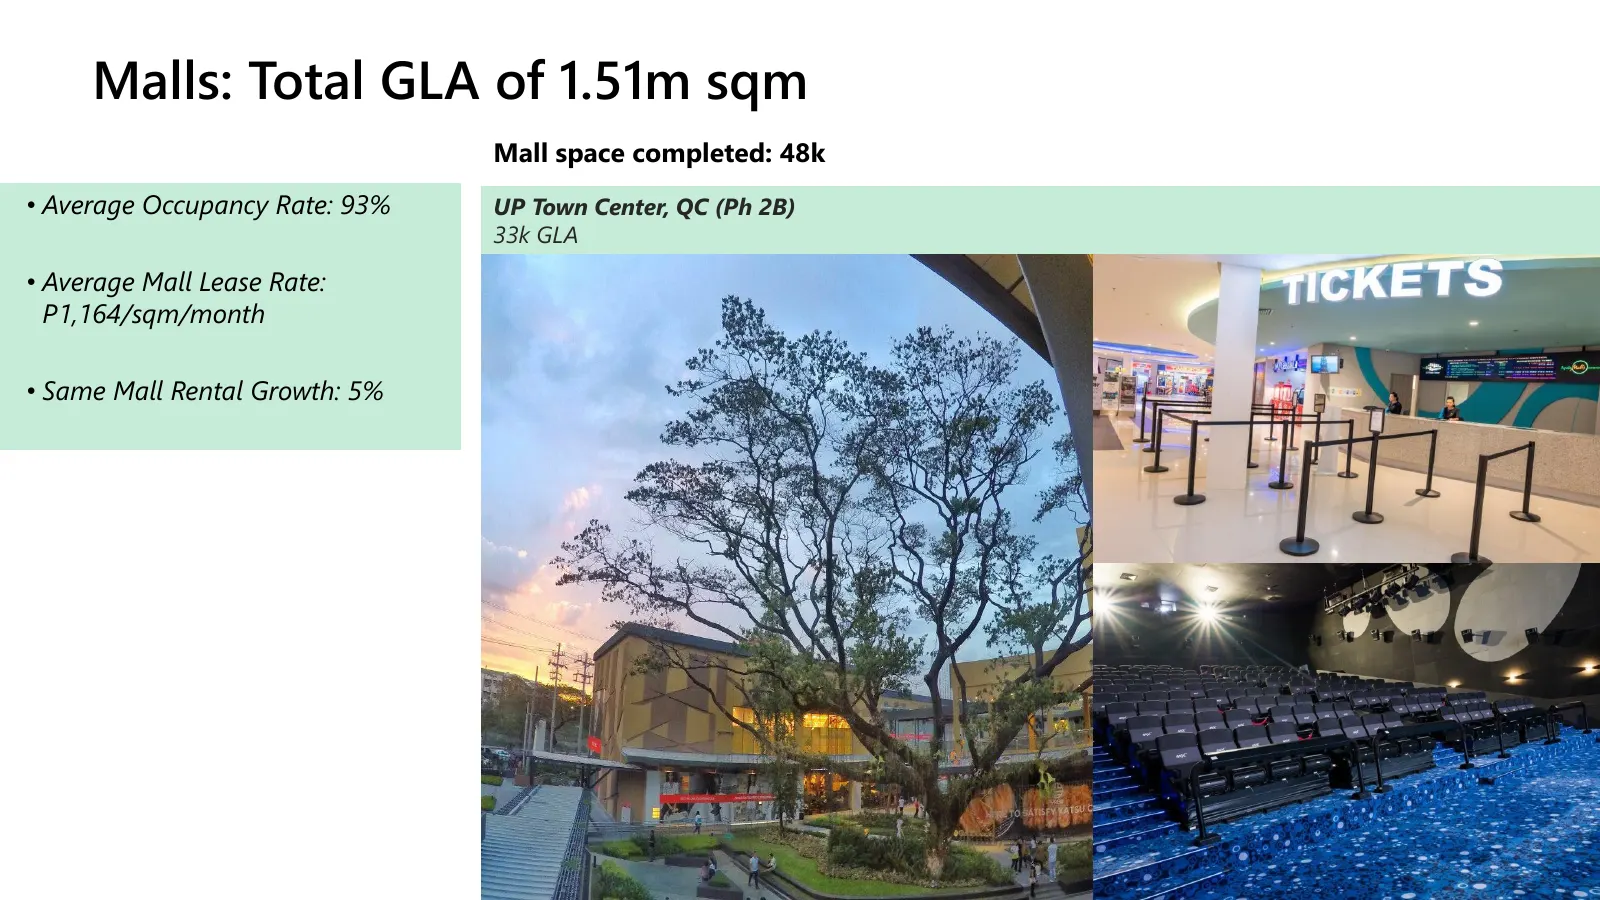
Malls: Total GLA of 1.51m sqm Mall space completed: 48k • Average Occupancy Rate: 93% UP Town Center, QC (Ph 2B) 33k GLA • Average Mall Lease Rate: P1,164/sqm/month • Same Mall Rental Growth: 5% 30
Slide 31: Malls Update
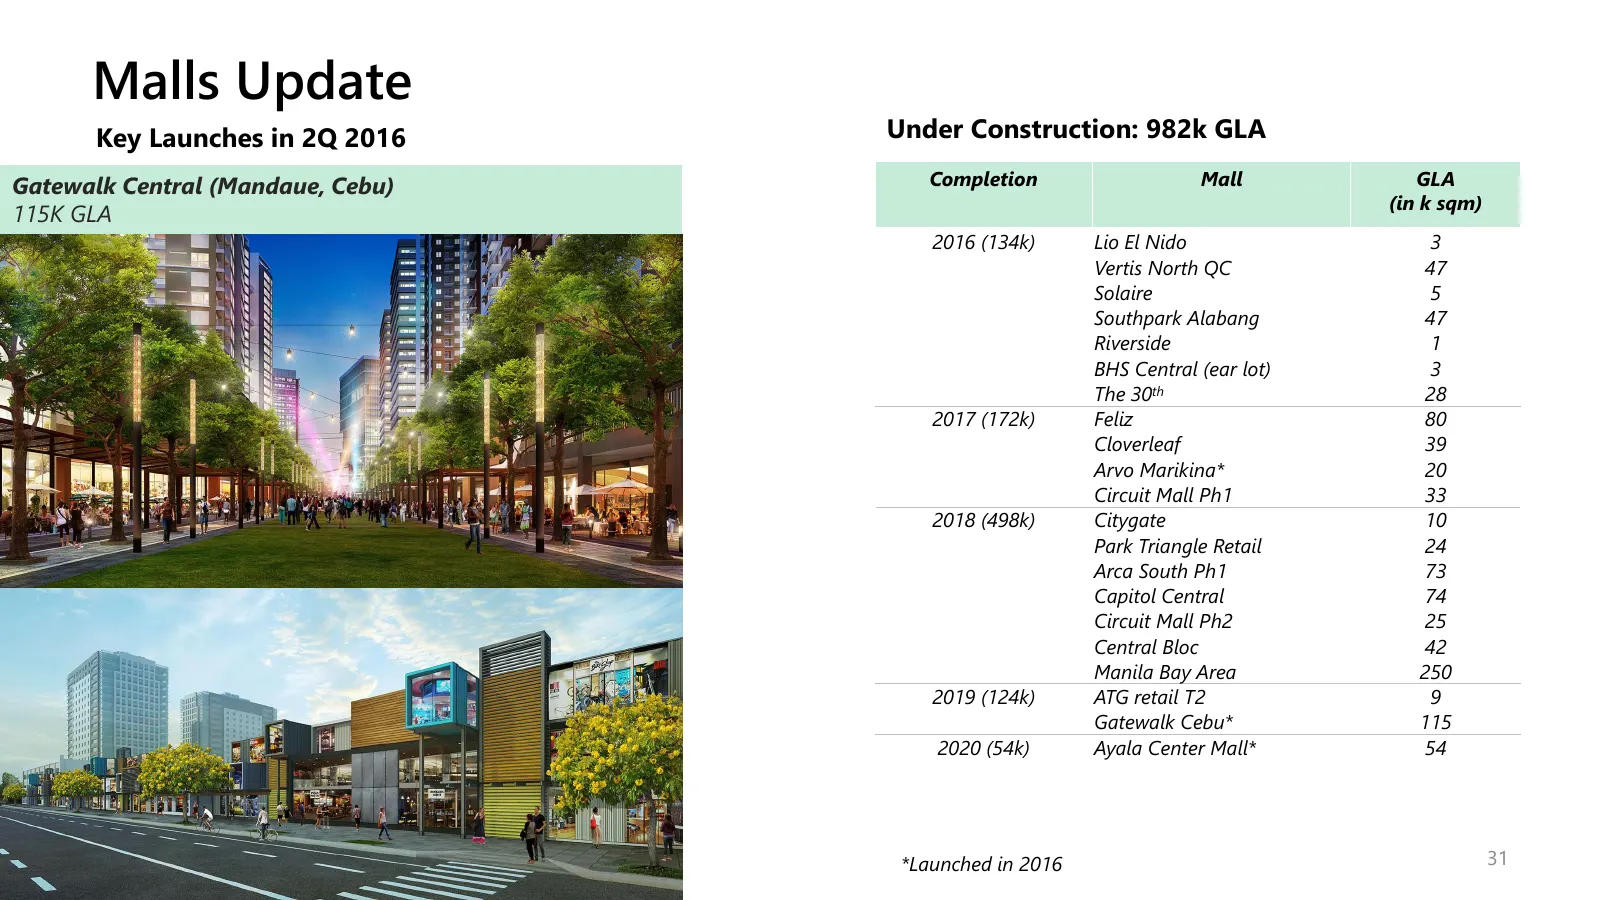
Malls Update Key Launches in 2Q 2016 Under Construction: 982k GLA Gatewalk Central (Mandaue, Cebu) Completion Mall GLA (in k sqm) 115K GLA 2016 (134k) Lio El Nido 3 Vertis North QC 47 Solaire 5 Southpark Alabang 47 Riverside 1 BHS Central (ear lot) 3 The 30th 28 2017 (172k) Feliz 80 Cloverleaf 39 Ar
Slide 32: Offices: Total of 753k sqm
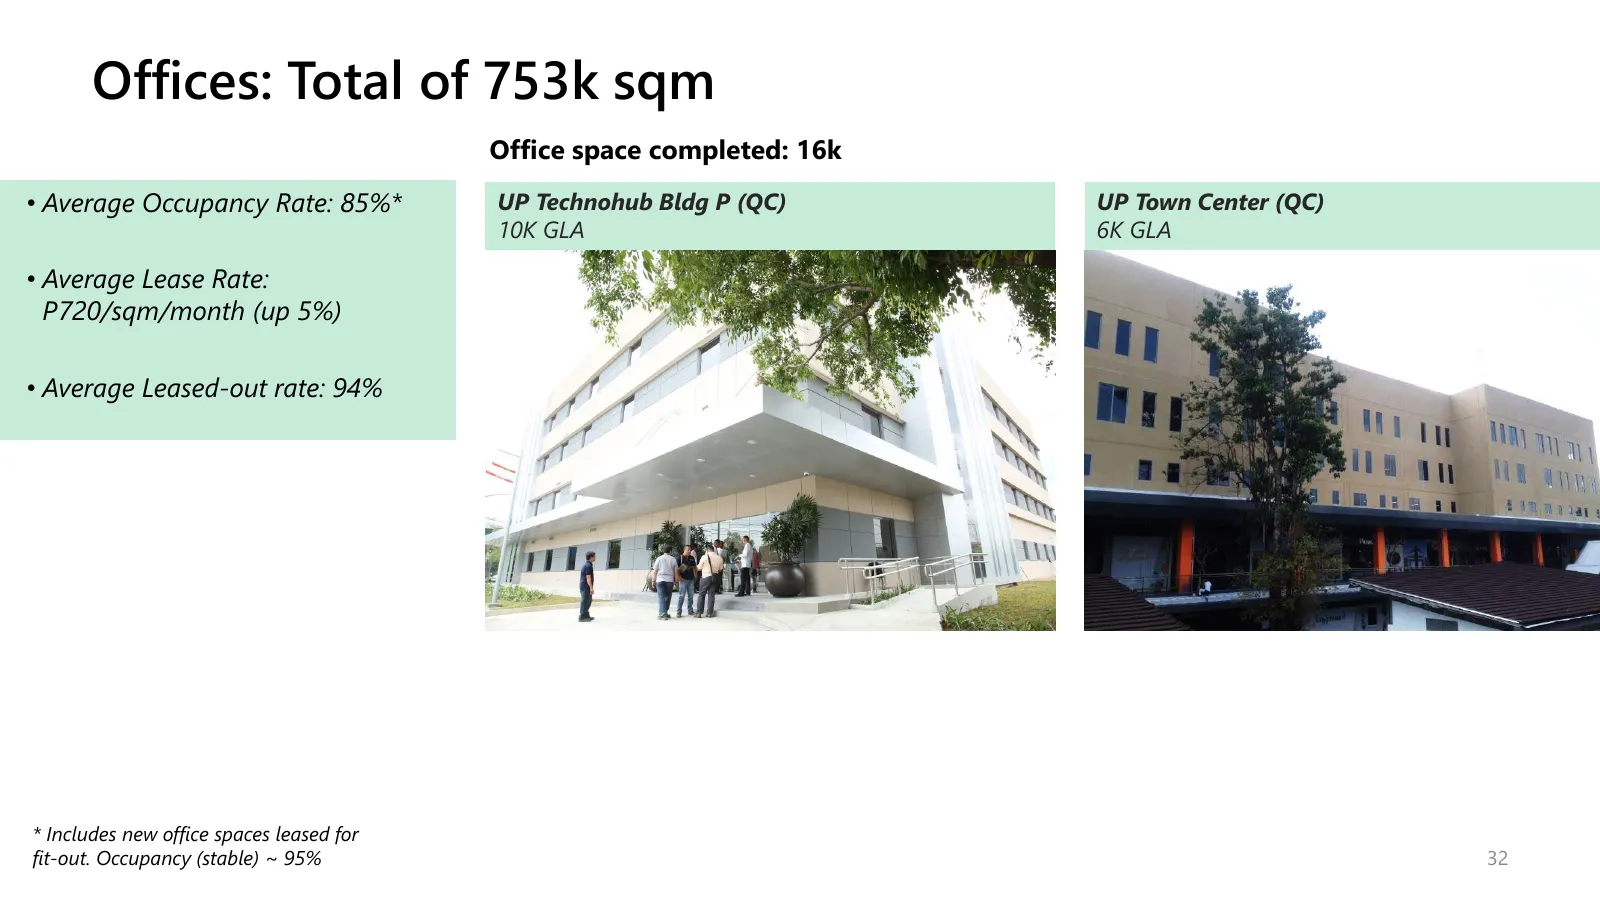
Offices: Total of 753k sqm Office space completed: 16k • Average Occupancy Rate: 85%* UP Technohub Bldg P (QC) UP Town Center (QC) 10K GLA 6K GLA • Average Lease Rate: P720/sqm/month (up 5%) • Average Leased-out rate: 94% * Includes new office spaces leased for fit-out. Occupancy (stable) ~ 95% 32
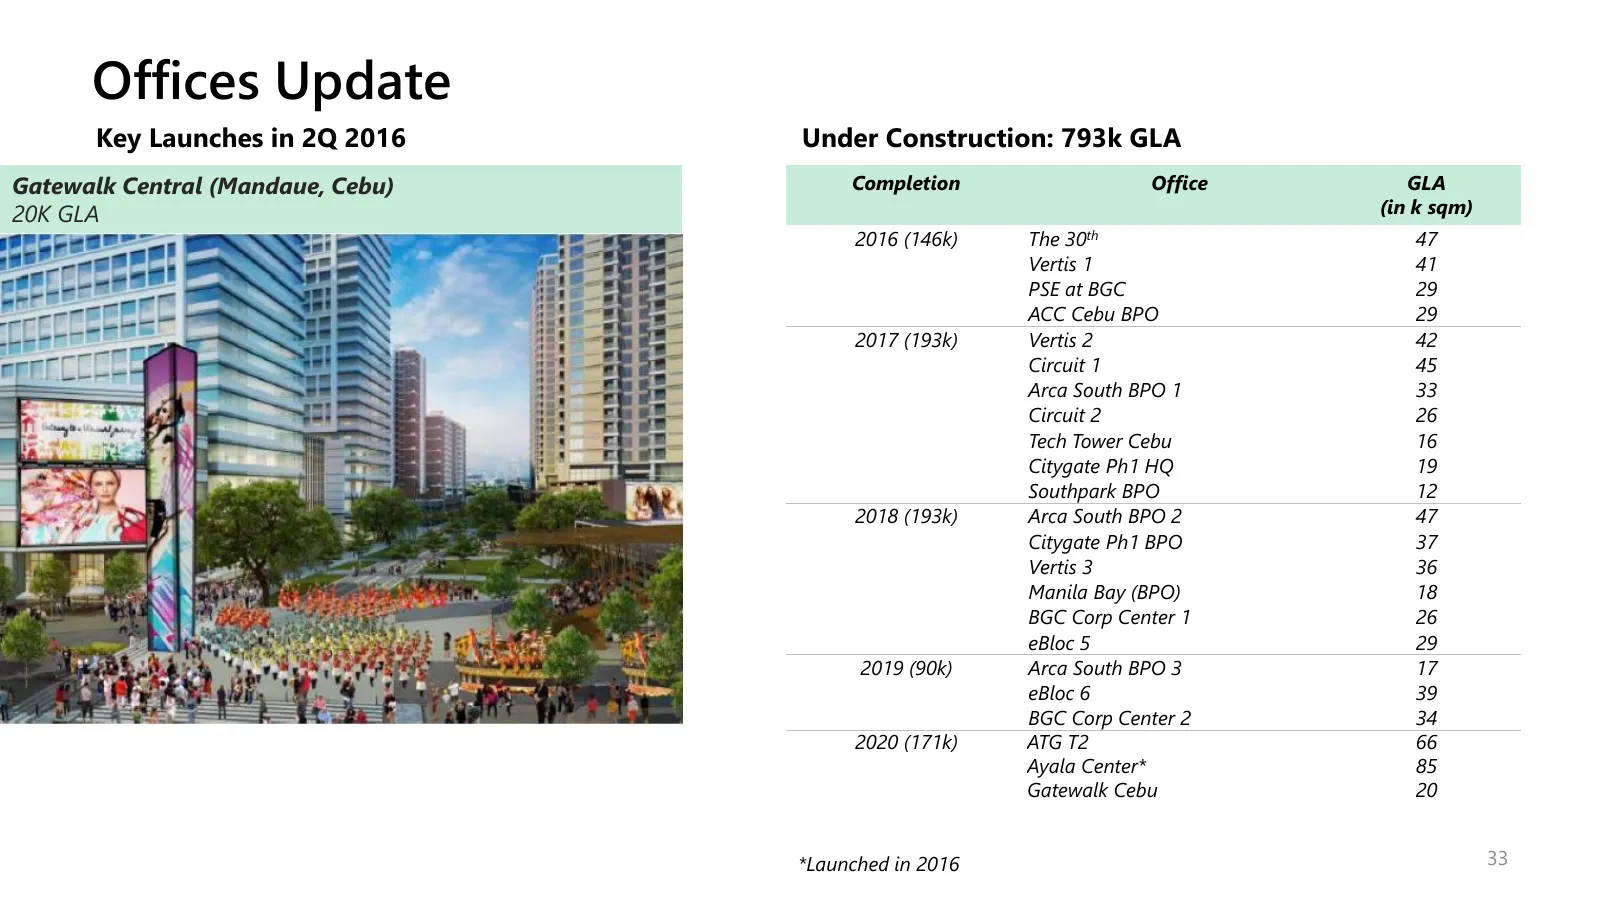
Slide 33: Offices Update
Offices Update Key Launches in 2Q 2016 Under Construction: 793k GLA Gatewalk Central (Mandaue, Cebu) Completion Office GLA 20K GLA (in k sqm) 2016 (146k) The 30th 47 Vertis 1 41 PSE at BGC 29 ACC Cebu BPO 29 2017 (193k) Vertis 2 42 Circuit 1 45 Arca South BPO 1 33 Circuit 2 26 Tech Tower Cebu 16 Cit
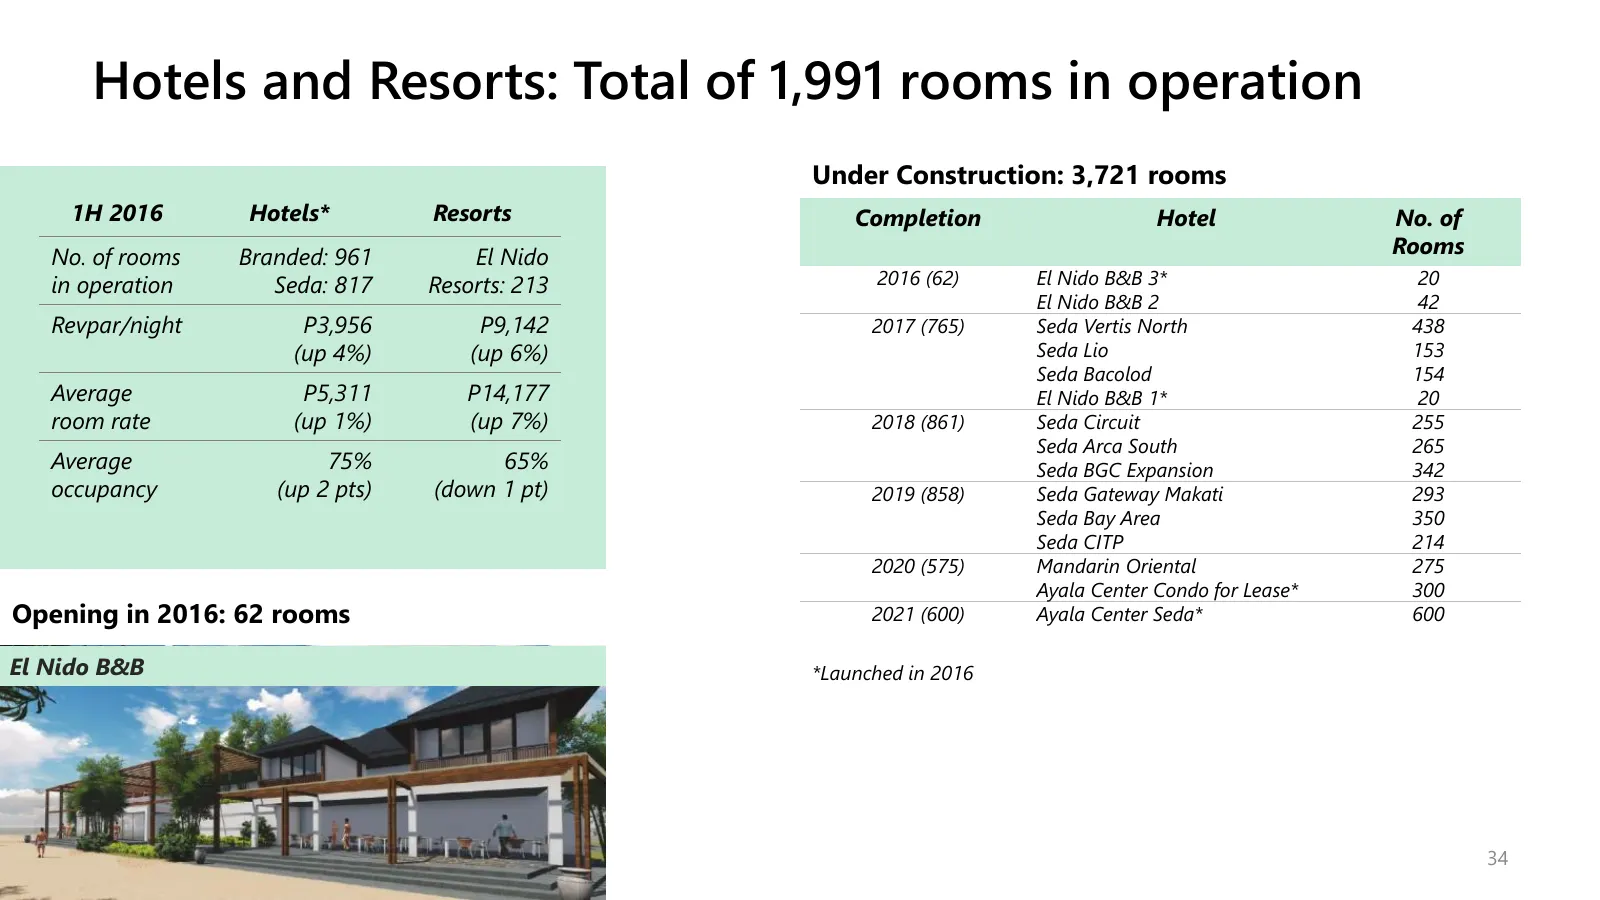
Slide 34: Hotels and Resorts: Total of 1,991 rooms in operation
Hotels and Resorts: Total of 1,991 rooms in operation Under Construction: 3,721 rooms 1H 2016 Hotels* Resorts Completion Hotel No. of No. of rooms Branded: 961 El Nido Rooms in operation Seda: 817 Resorts: 213 2016 (62) El Nido B&B 3* 20 El Nido B&B 2 42 Revpar/night P3,956 P9,142 2017 (765) Seda Ve
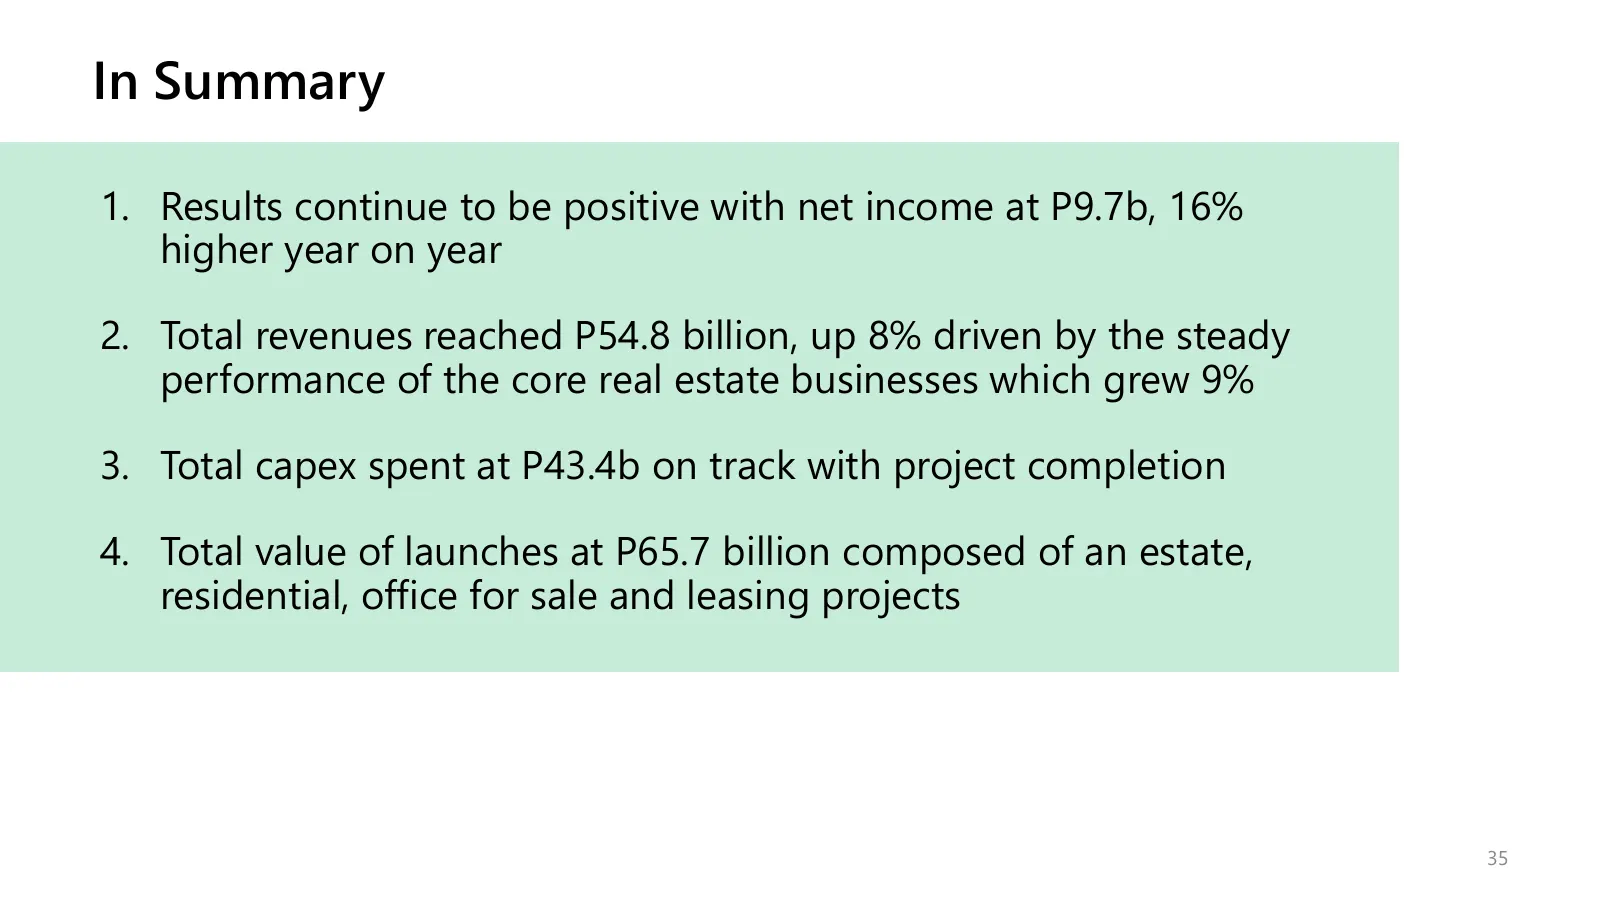
Slide 35: In Summary
In Summary 1. Results continue to be positive with net income at P9.7b, 16% higher year on year 2. Total revenues reached P54.8 billion, up 8% driven by the steady performance of the core real estate businesses which grew 9% 3. Total capex spent at P43.4b on track with project completion 4. Total va
Source: Internet Archive copy of ir.ayalaland.com.ph
More decks from Ayala Land Inc.
 Q1 2026 Earnings Presentation15 slides · Apr 30, 2026
 Q4 2025 Earnings Presentation16 slides · Feb 20, 2026
 Q1 2025 Earnings Presentation10 slides · May 6, 2025
 FY2024 Earnings Presentation15 slides · Feb 20, 2025
 Q1 2024 Earnings Presentation37 slides · May 16, 2024
 Q1 2024 Earnings Presentation12 slides · May 8, 2024