Gsi Commerce — Goldman Sachs Eighth Annual Internet Conference (May 2007)
41 slides from Gsi Commerce's conference presentation, May 22, 2007

Slide 1: Goldman Sachs Eighth Annual Internet Conference
michael rubin – chairman, president, CEO michael conn – executive vice president, CFO may 23, 2007 goldman sachs eighth annual internet conference Exhibit 99.1

Slide 2: Safe harbor statement
safe harbor statement All statements made in this presentation, other than statements of historical fact, are forward-looking statements. The words “anticipate,” “believe,” “estimate,” “expect,” “intend,” “may,” “plan,” “will,” “would,” “should,” “could,” “guidance,” “potential,” “opportunity,” “con

Slide 3: Non-GAAP financial measures
non-GAAP financial measures This presentation contains or may mention the non-GAAP measures merchandise sales, adjusted EBITDA, non-GAAP net income, free cash flow and certain ratios that use those measures. GSI’s consolidated financial statements are prepared and presented in accordance with GAAP.
Slide 4: Agenda
agenda core business core business marketing services – gsi interactive sm gsi international sm
Slide 5: Overview of core business
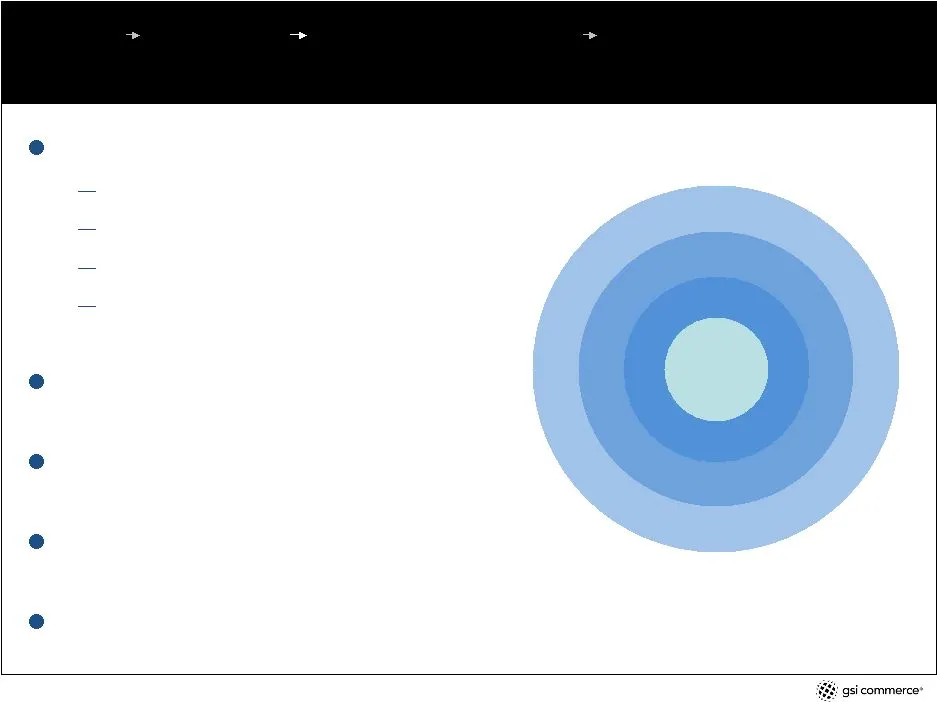
core business overview of core business agenda complete outsourced, e-commerce solution strategy technology fulfillment customer care 60+ major retailers and brands 13 merchandise categories $609.6 million in net revenue in 2006 $1.2 billion in merchandise sales in 2006 e-commerce expertise technolo
Slide 6: 2007 U.S. online general merchandise market $138.1 billion
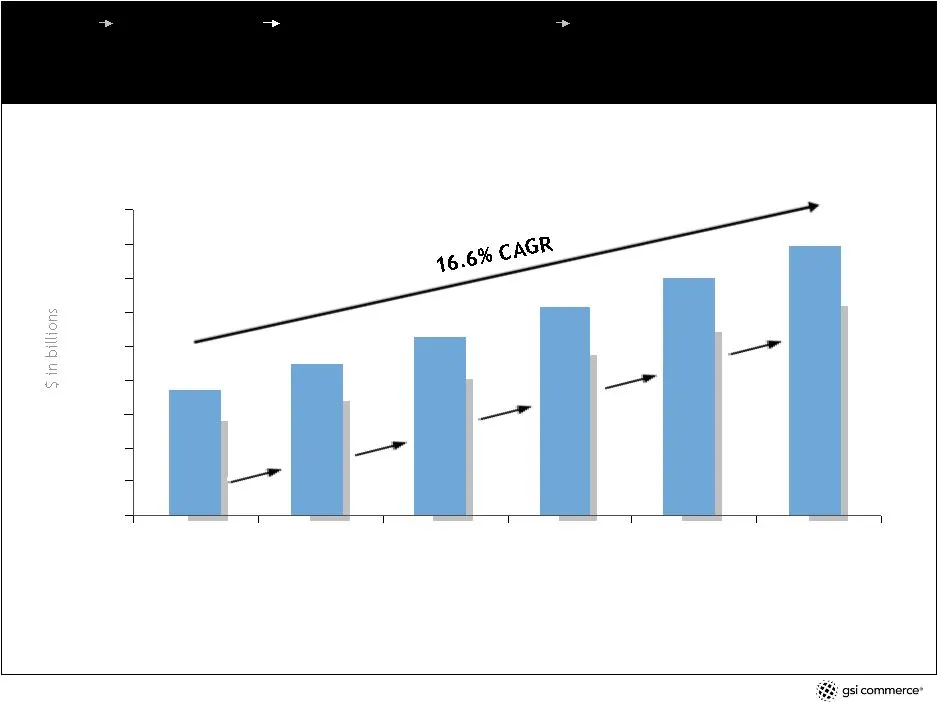
2007 U.S. online general merchandise market $138.1 billion core business * GSI Commerce excludes automobiles and parts, travel, and event and movie tickets, when discussing the U.S. online general merchandise market. GSI target retail categories include apparel, accessories & footwear, appliances &
Slide 7: Leading retailers and brands
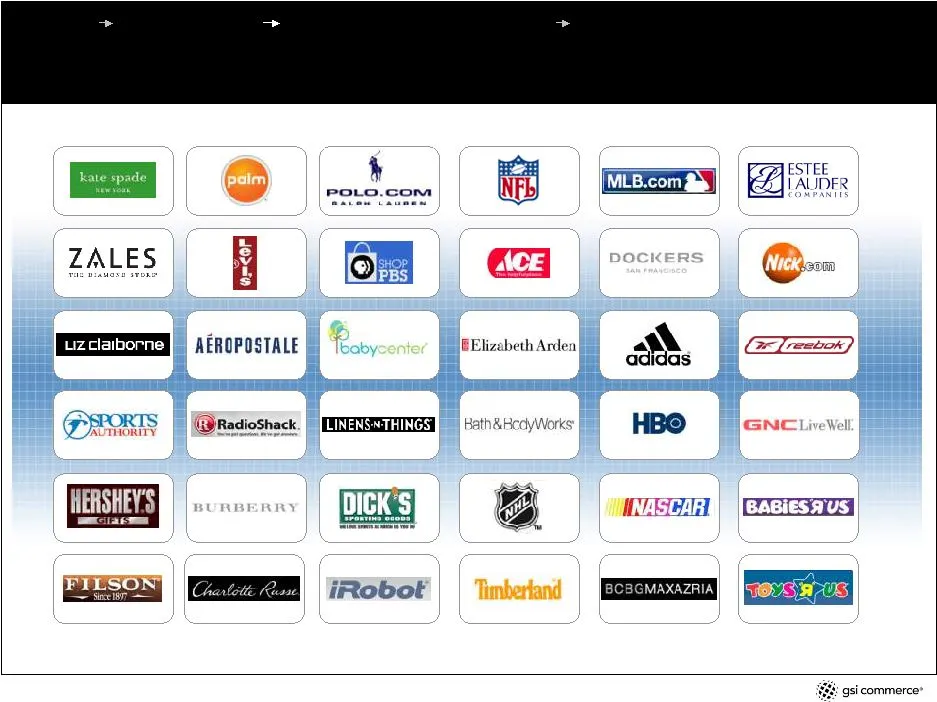
60 + leading retailers and brands core business * Slide shows selected partners.
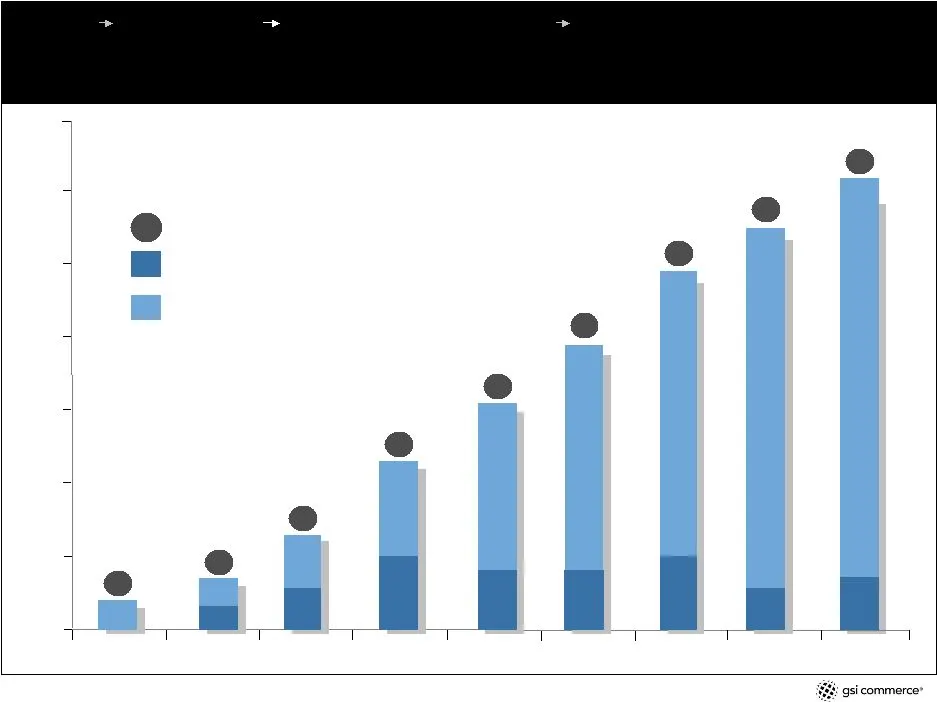
Slide 8: Adding new partners and categories per year
adding 5 to 10 new partners and 1 to 2 categories per year 4 6 7 9 11 1 1 1 core business 13 total domestic partners current partners that launched or are expected to launch with GSI during that year number of categories
Slide 9: Value proposition
value proposition core business complete solution enterprise scale & scope focus on partner’s growth, brand and customer experience
Slide 10: Value proposition – complete solution
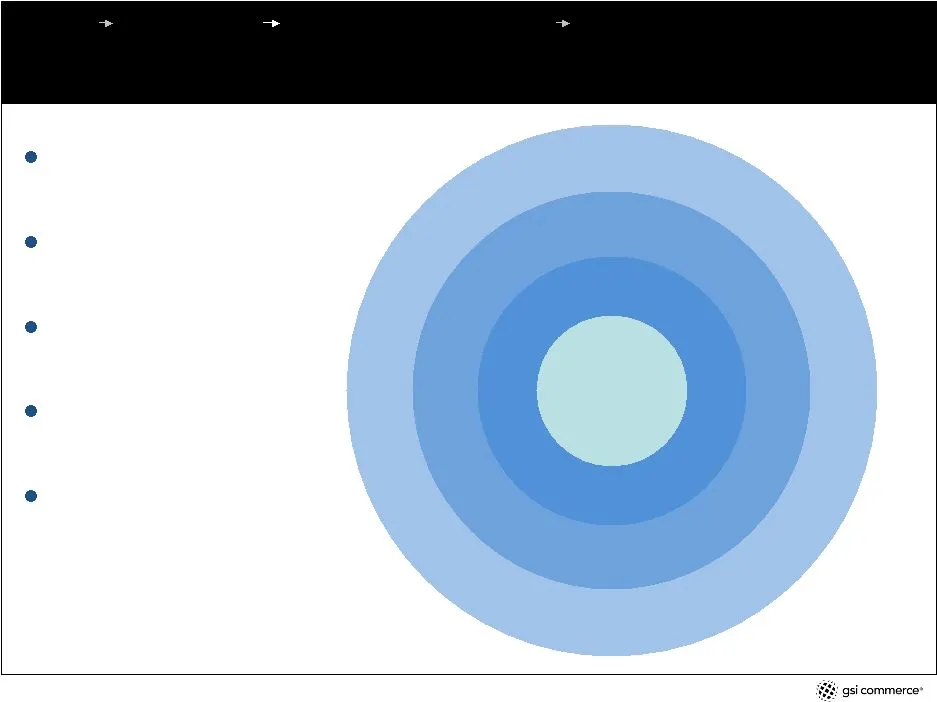
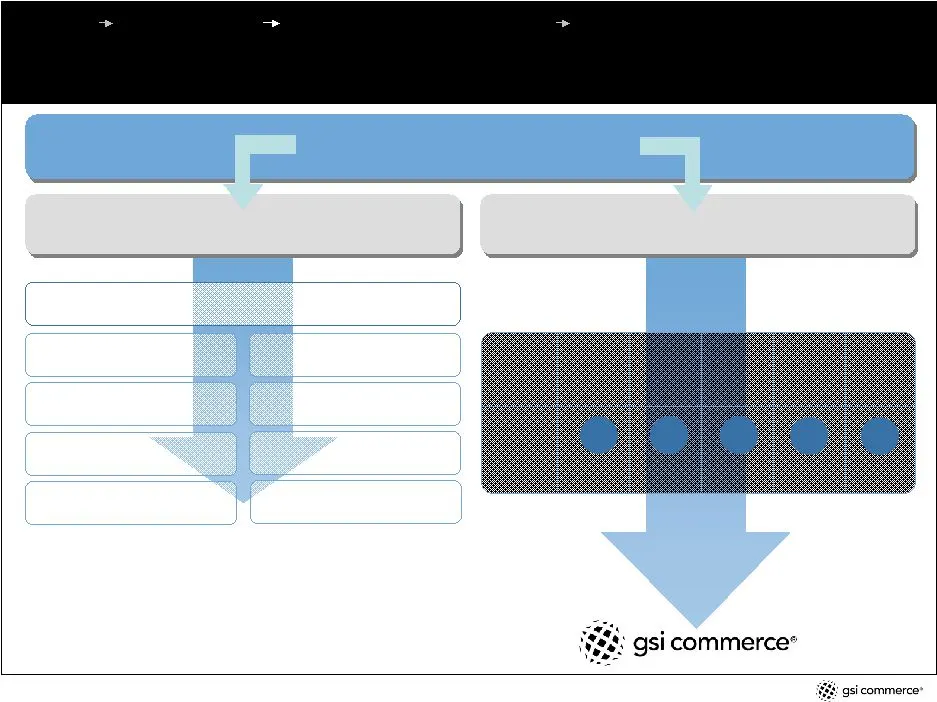
value proposition – complete solution core business e-commerce expertise technology logistics customer care end-to-end, integrated e-commerce platform shared infrastructure and customized solutions increased efficiency – one vendor proven integration – built to work together e-commerce expertise - 3
Slide 11: Value proposition – enterprise scale & scope
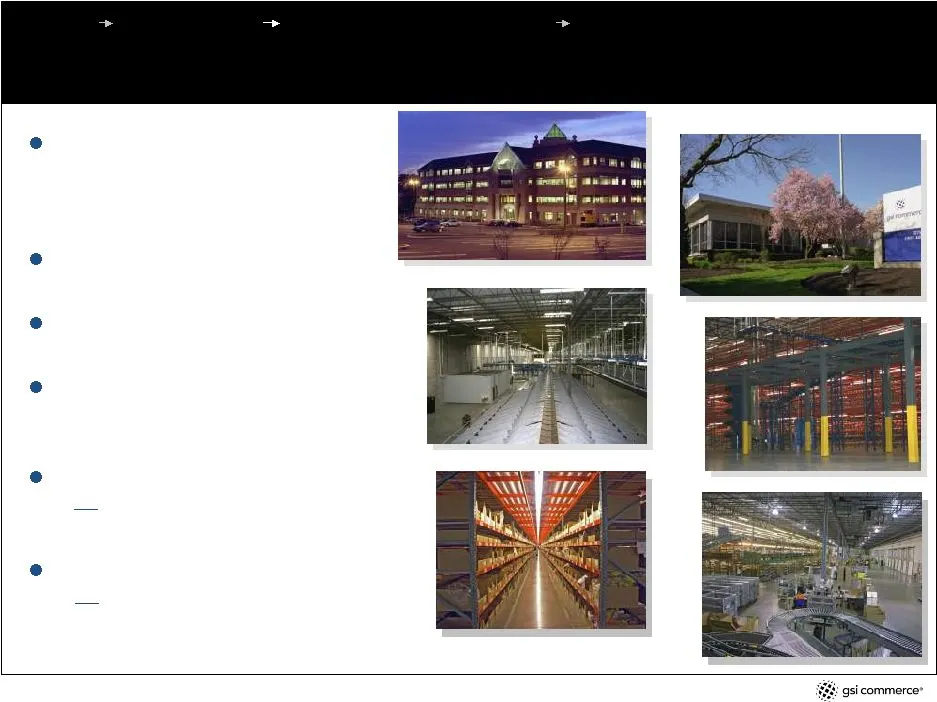
value proposition – enterprise scale & scope core business not partner core competency – e-commerce ~ 2% to 4% of total sales merchandise sales $1.2B in 2006 ~ 2,500 employees redundant, geographically separate data centers 2 customer care facilities ~ 940 people 3 primary fulfillment centers 1.7 mi
Slide 12: Value proposition – focus on partner growth, brand and customer experience
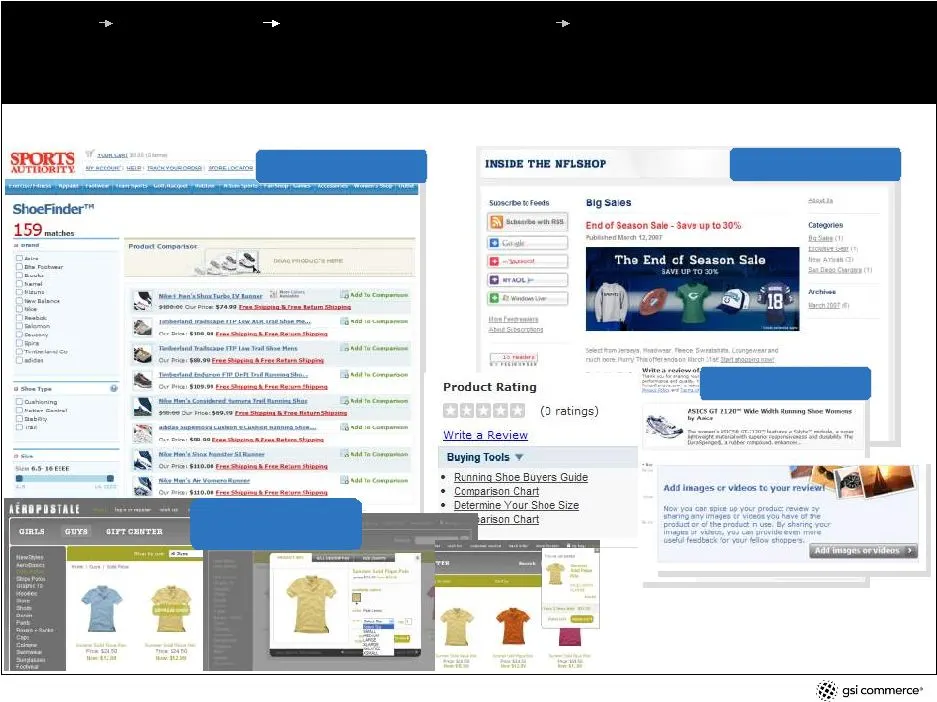
value proposition – focus on partner growth, brand and customer experience core business blogs & RSS feeds decision wizards ratings & reviews express shop tm & mini cart tm enhanced features & functions
Slide 13: Delivering multichannel capabilities
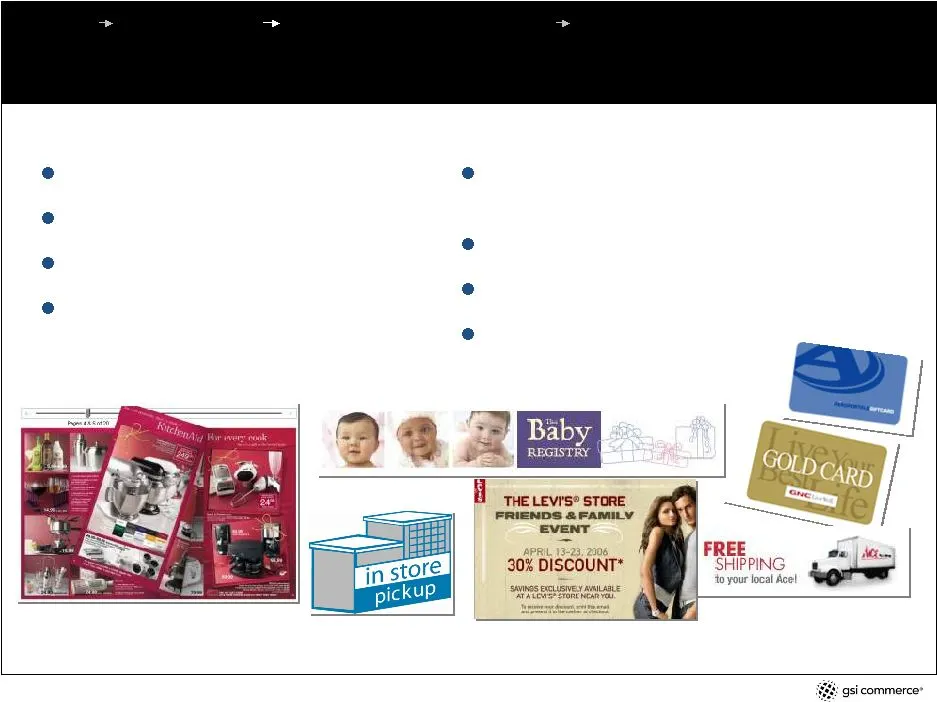
value proposition – focus on partner growth, brand and customer experience core business delivering multichannel capabilities buy online, pick up in store buy online, ship to store buy online, return to store digital versions of print media (e.g. catalogs, circulars) online/offline gift card redempt
Slide 14: Alternative payment methods
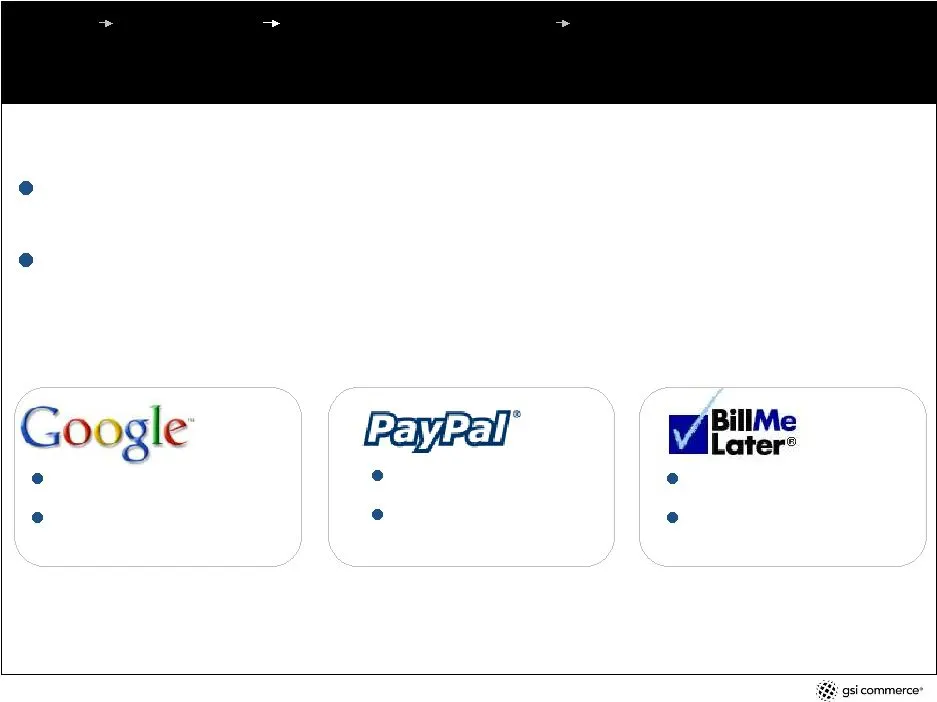
value proposition – focus on partner growth, brand and customer experience core business ~ 38 partner web stores use one or more alternative payment methods black friday thru cyber Monday, 2006 – Bill Me Later, Google Checkout and PayPal accounted for more than 18% of purchases made on GSI Commerce’
Slide 15: GSI Commerce
: gsi commerce®

Slide 16

Slide 17: Competition: e-commerce decision
competition e-commerce decision core business outsource insource web platform IBM, ATG, Microsoft customer care West, Convergys fulfillment /logistics DHL, UPS design aQuantive, Grey Interactive online marketing aQuantive, ValueClick strategy/sys. integrators McKinsey, Accenture order proc/merch sys

Slide 18: Marketing services
marketing services emerging growth opportunities core business
Slide 19: Marketing services
marketing services emerging growth opportunities core business full-service interactive agency creative – user experience & site design online marketing (search, affiliate, comparison shopping engines, branded) e-mail content development & digital photography catalog services provides services to ~
Slide 20: Marketing services – online advertising market
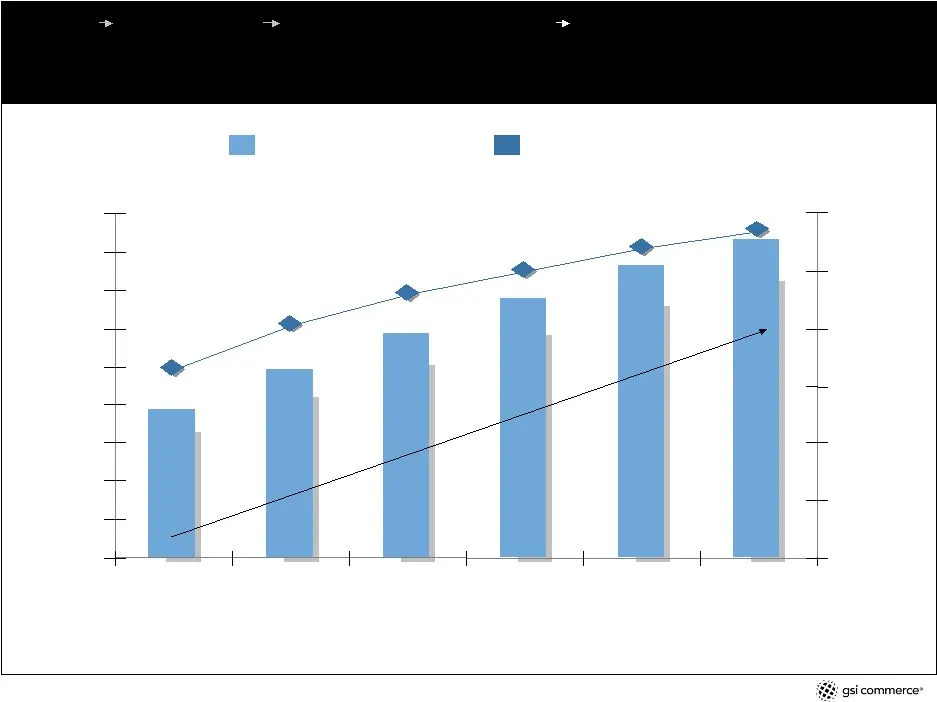
marketing services – online advertising market emerging growth opportunities estimated U.S. online advertising as % of total U.S. advertising spend estimated U.S. online advertising revenues $0 $5 $10 $15 $20 $25 $30 $35 $40 $45 0% 2% 4% 6% 8% 10% 12% $19.3 $24.7 $29.5 $34.0 6.6% 8.1% 9.2% 11.4% 10.
Slide 21: Marketing services – a multichannel requirement
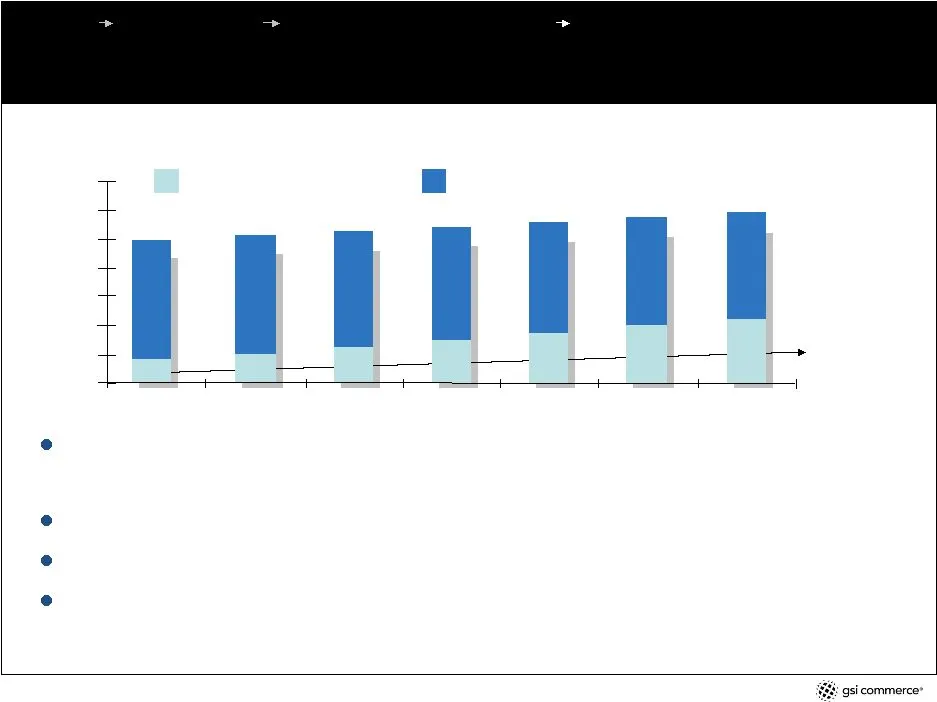
marketing services – a multichannel requirement emerging growth opportunities almost $400 billion of store sales – or 16% of total retail sales – were directly influenced by the Web (cross-channel sales) in 2006. This will grow at a 17% CAGR over the next five years resulting in cross-channel sales
Slide 22: Marketing services – enhancing the customer experience
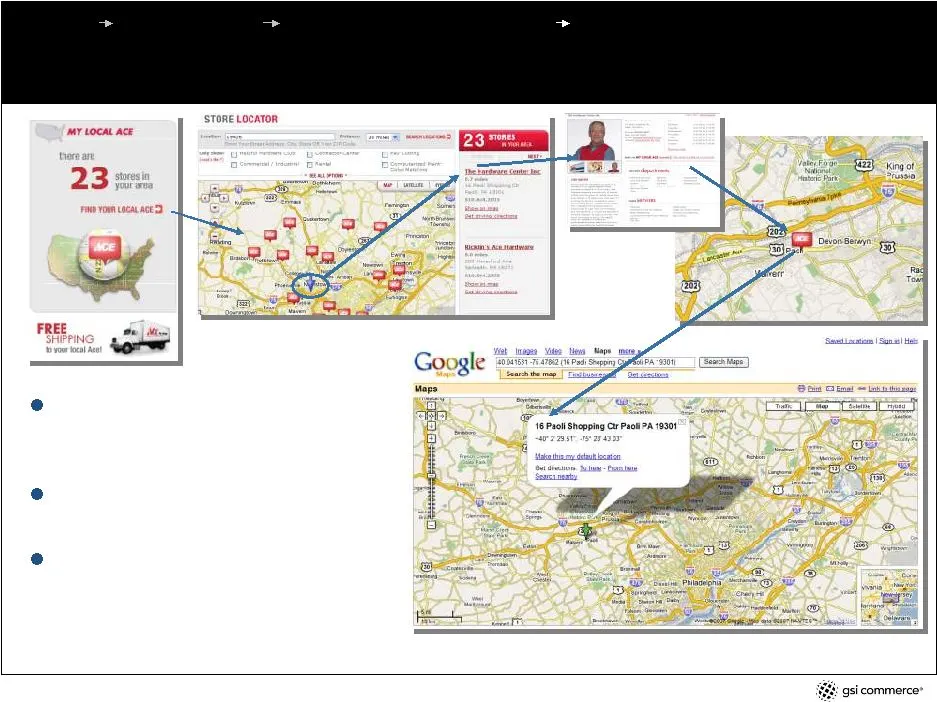
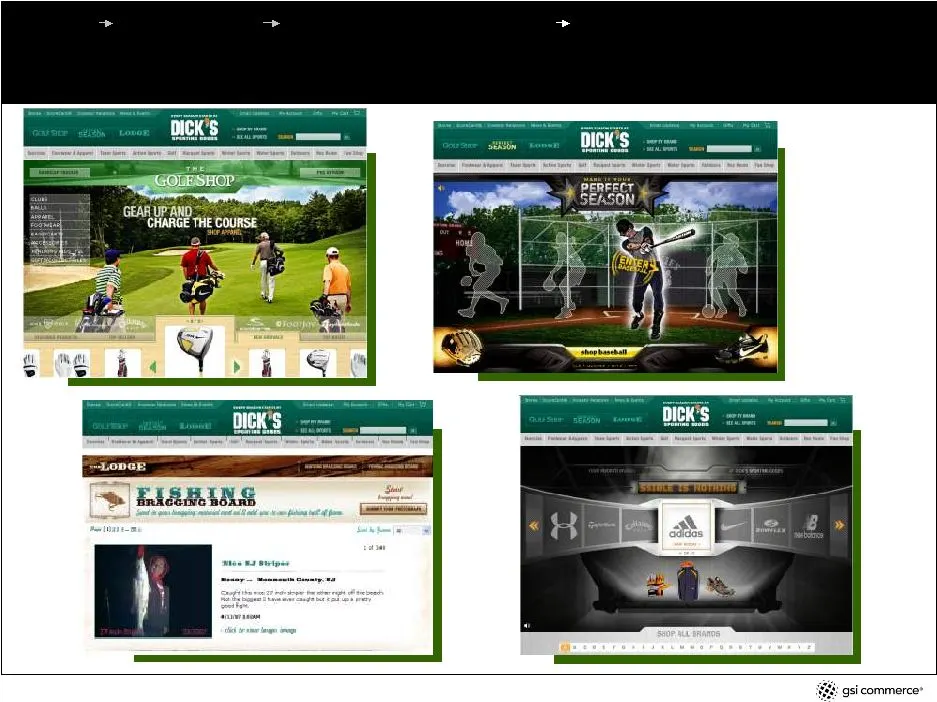
marketing services – enhancing the customer experience emerging growth opportunities Google maps integration provides a rich customer experience accurate, visually branded store locations geo-location auto targets closest stores for the consumer core business
Slide 23: Marketing services – brand integration
marketing services – brand integration emerging growth opportunities core business

Slide 24: International
international emerging growth opportunities core business
Slide 25: International
emerging growth opportunities international core business executive presence in Barcelona, Spain steve davis relocating to build and run the business leveraging 2006 acquisition of Aspherio and incrementally developing core platform europe followed by asia size of the market, current Barcelona prese
Slide 26: International – European e-commerce market
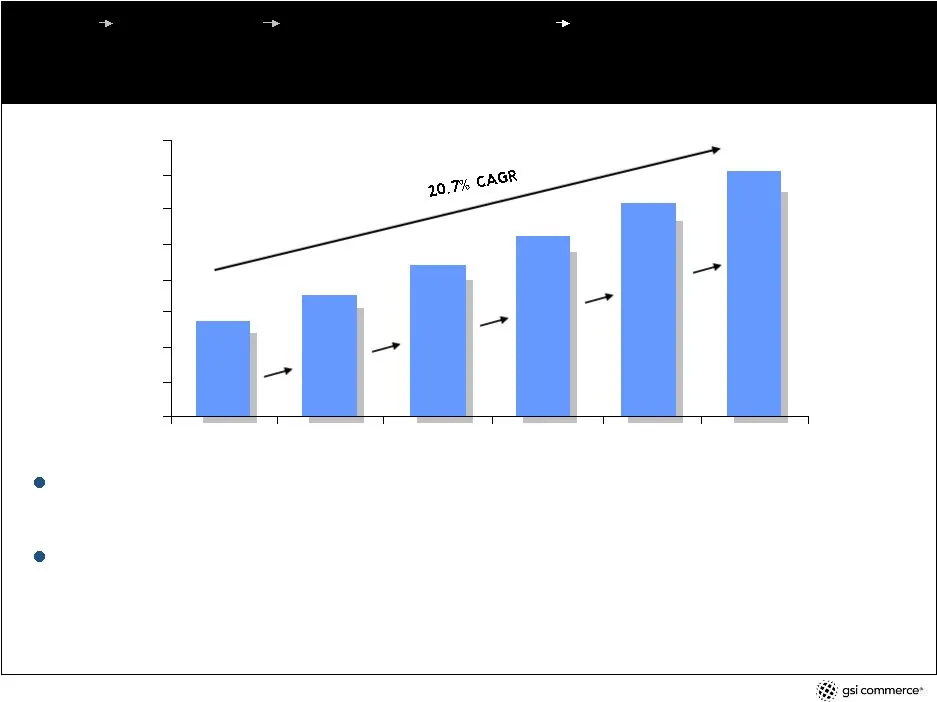
emerging growth opportunities international – european e-commerce market core business * Includes the following European countries: United Kingdom, Germany, France, Italy, Spain, Netherlandds, Belgium, Luxembourg, Norway, Sweden, Denmark, Finland, Austria, Switzerland, Ireland, Portugal and Greece.
Slide 27: International – Asia e-commerce market
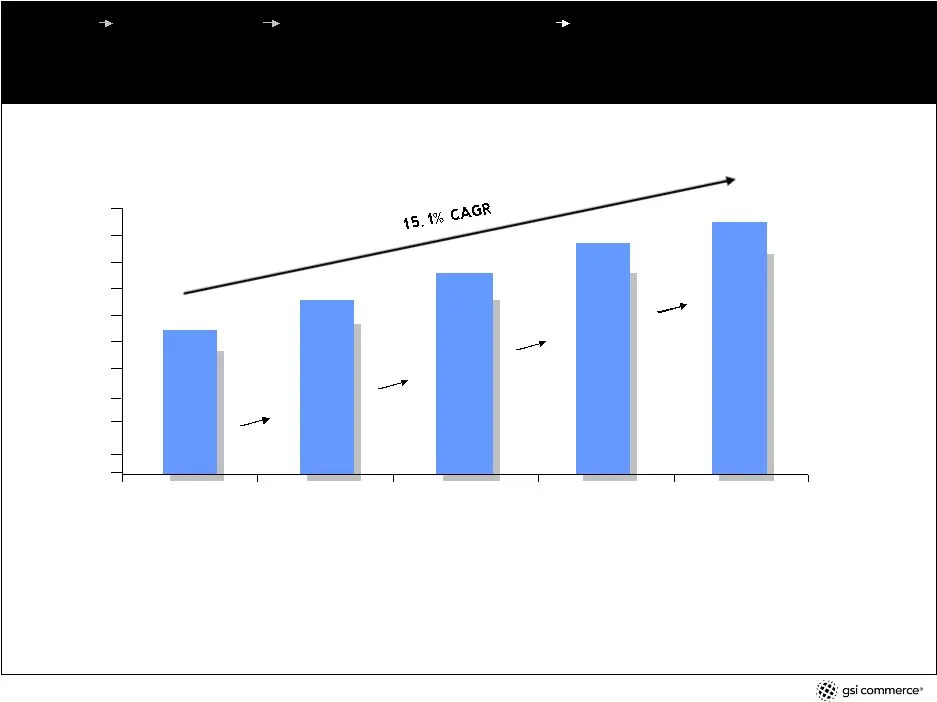
emerging growth opportunities international – asia e-commerce market core business $0 $20 $40 $60 $80 $100 $120 $140 $160 $180 $200 $108.3 $131.1 $151.5 $173.1 $190.2 21.0% 15.6% 14.3% 10.0% * Source: International Data Corporation (IDC), Internet Commerce Model 11.1 projected growth of asian online

Slide 28: Financials
financials financials core business

Slide 29: Growth strategy for the business
growth strategy for the business financials core enterprise market add new partners (5 – 10 per year) – long-term, exclusive deals grow annuity transaction volume increase incremental revenue – technology & multichannel projects renew / extend agreements marketing services - gsi interactive internat
Slide 30: Net revenues – trailing four quarters
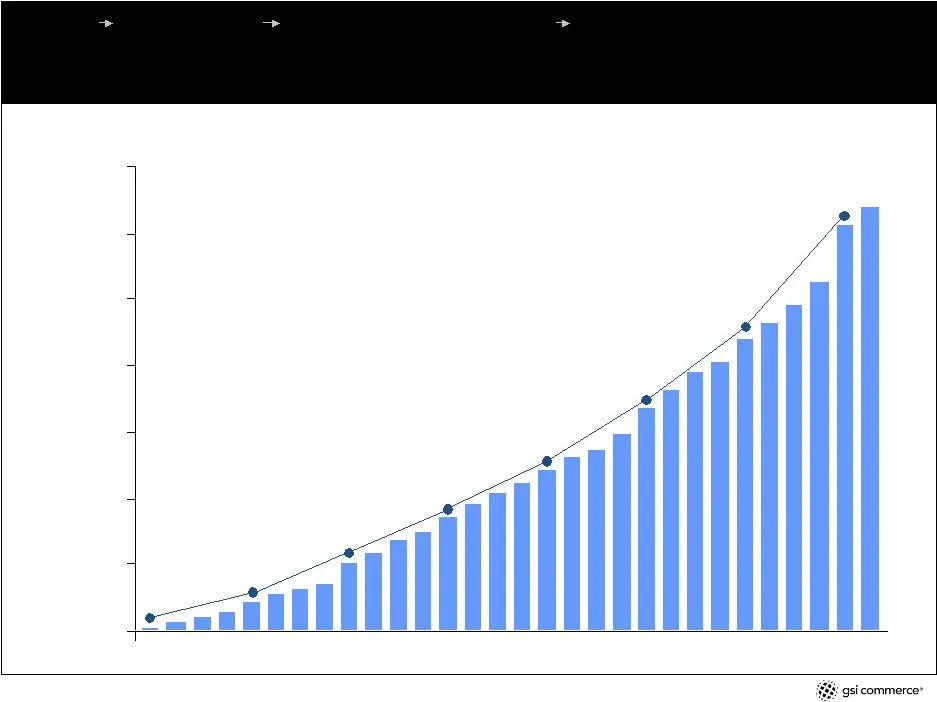
financials net revenues – trailing four quarters core business $0 $100 $200 $300 $400 $500 $600 $700 $5.5 FY99 $42.8 FY00 $102.6 FY01 $172.6 FY02 $241.9 FY03 $335.1 FY04 $440.4 FY05 $609.6 FY06 $ in millions
Slide 31: Merchandise sales and gross profit
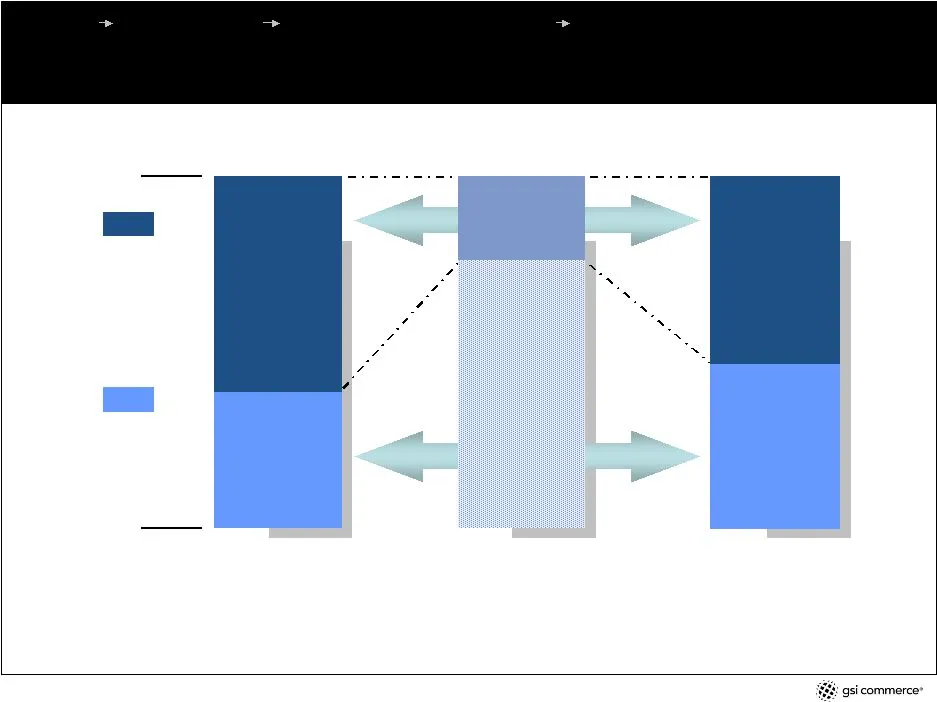
financials merchandise sales and gross profit 61% $726.6 53% $148.4 47% $129.9 39% $461.2 core business 100% merchandise sales 0% non-owned inventory (service fees) owned inventory (product sales) $1,187.8 gross profit $278.3 net revenue $609.6 76% $461.2 $ in millions For a reconciliation of non-GA
Slide 32: Changing revenue mix
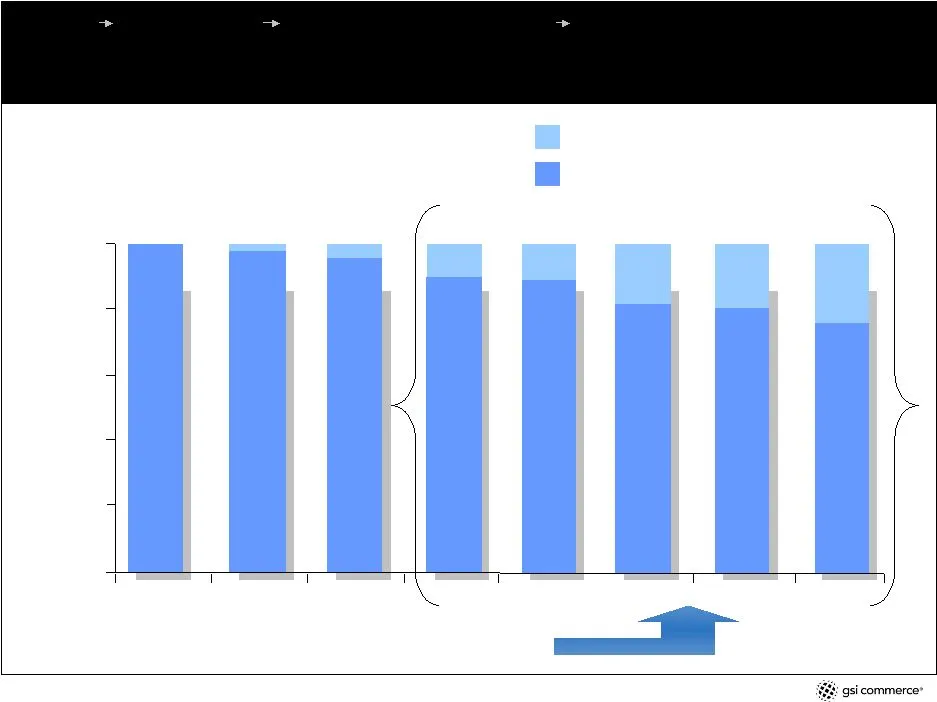
financials changing revenue mix . . . core business product sales % contribution to net revenue service fees % contribution to net revenue % net revenue 0% 20% 40% 60% 80% 100% 100% 97.7% 95.8% 89.7% 89.5% 82.0% 80.7% 75.7% 2.3% 4.2% 10.3% 10.5% 18.0% 19.3% 24.3% service fees compounded annual growt
Slide 33: More fully impacts gross profit contribution
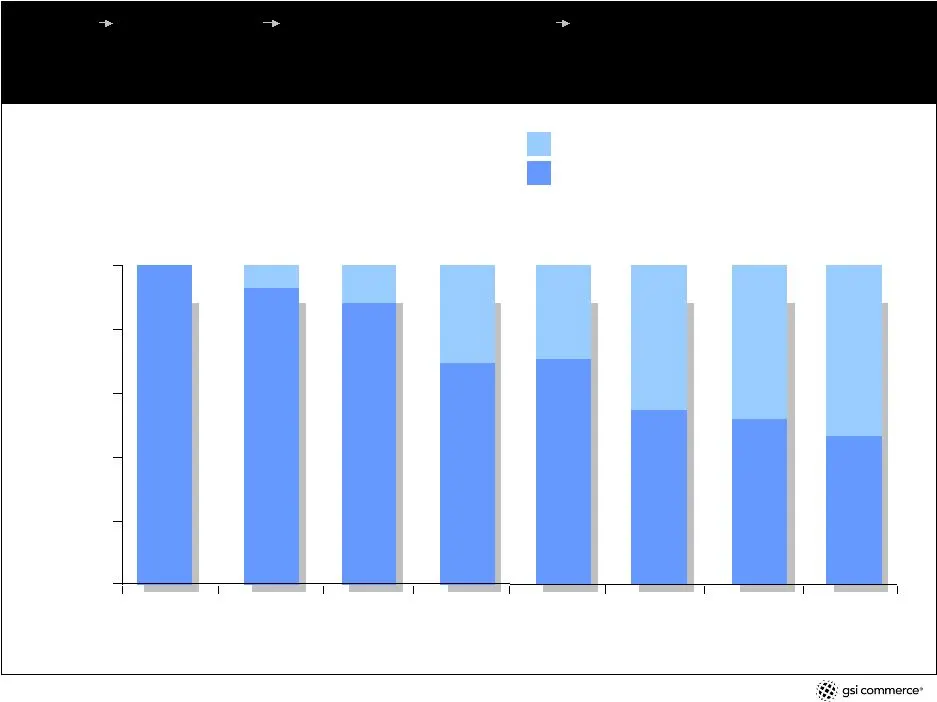
financials . . . more fully impacts gross profit contribution core business product sales % contribution to gross profit service fees % contribution to gross profit 0% 20% 40% 60% 80% 100% % gross profit 100% 92.4% 87.7% 69.5% 70.9% 54.5% 51.9% 46.7% 7.6% 12.3% 30.5% 29.1% 45.5% 48.1% 53.3%
Slide 34: Delivering revenue growth & margin expansion
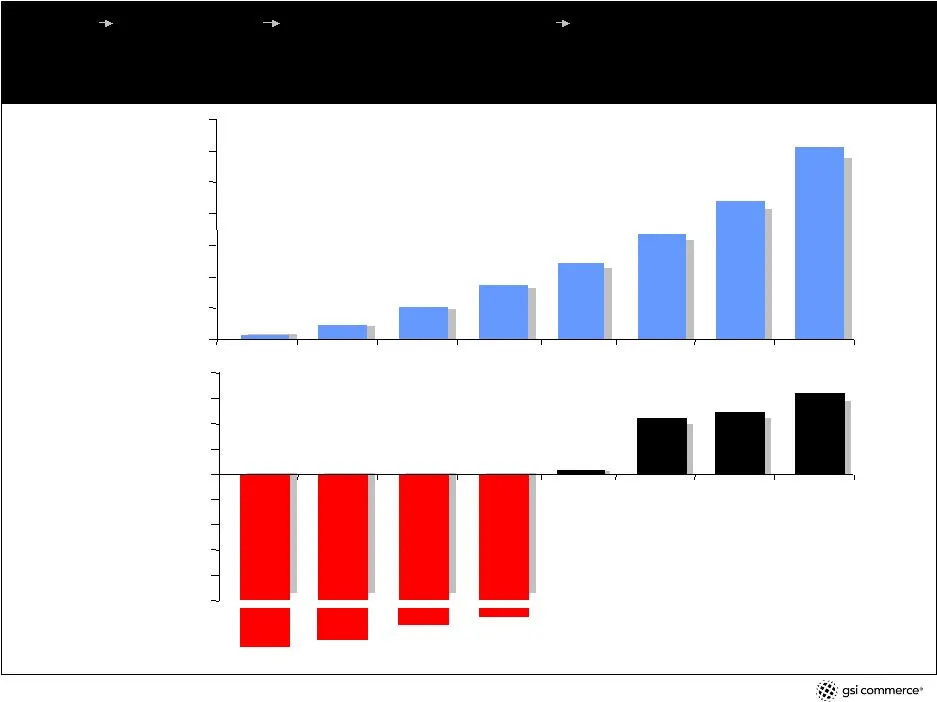
financials Delivering revenue growth & margin expansion core business For a reconciliation of non-GAAP financial measures, see Appendices A thru D and/or see our results for fiscal years 2001 - 2006 at www.gsicommerce.com/news/news.jsp . net revenue $ in millions adjusted EBITDA -467.3% $0 $100 $200
Slide 35: Annual free cash flow – 2006 positive milestone
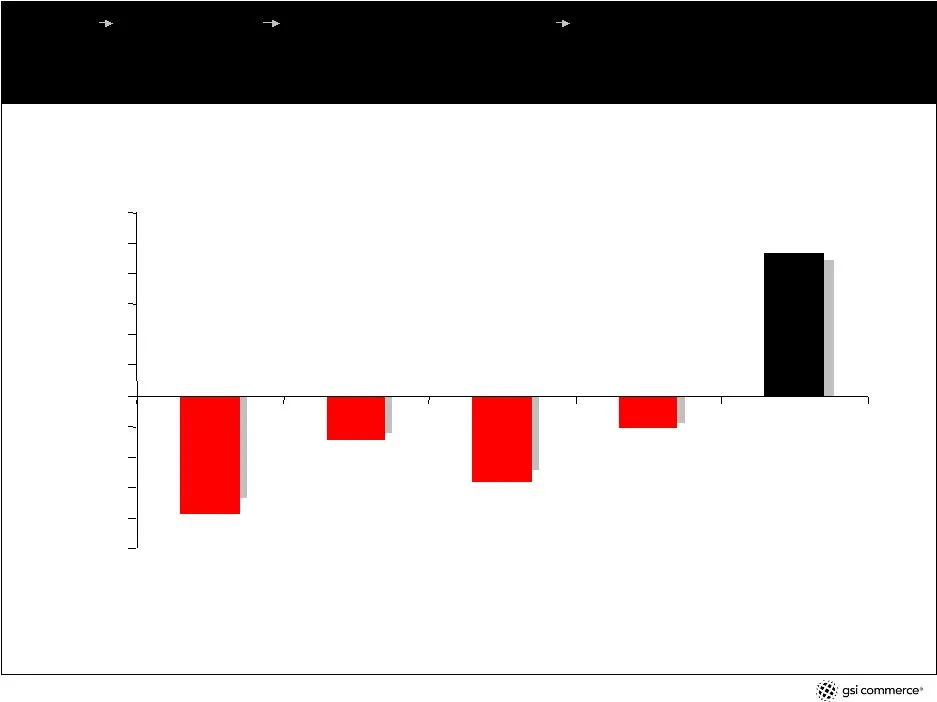
financials annual free cash flow – 2006 positive milestone core business $ in millions -$25 -$20 -$15 -$10 -$5 $0 $5 $10 $15 $20 $25 $30 -$19.4 -$7.5 -$13.6 -$5.3 $23.5 For a reconciliation of non-GAAP financial measures, see Appendices A thru D and/or see our results for fiscal years - at www.gsico
Slide 36: Strong balance sheet
financials strong balance sheet core business cash * $132.1 $184.5 $134.0 inventory $31.3 $46.8 $41.9 net fixed assets $83.6 $106.2 $118.2 total assets $300.8 $463.6 $407.7 debt $71.1 $70.9 $78.7 a/p & accrued expenses $69.2 $149.3 $82.2 total liabilities $146.3 $235.9 $178.3 stockholders’ equity $1

Slide 37: GSI Commerce
$F gsicommerce:
Slide 38: Appendix A
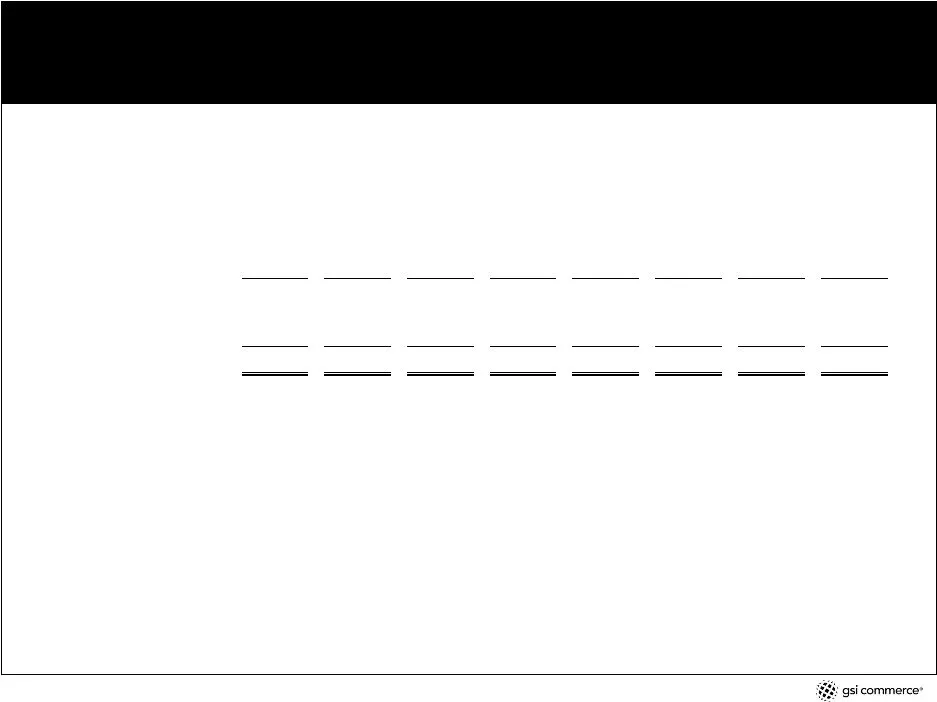
appendix a January 1, December 30, December 29, December 28, January 3, January 1, January 3, January 1, (29,083) $ (53,557) $ (32,497) $ (34,437) $ (13,064) $ (401) $ 2,878 $ 9,647 $ 2,655 4,983 10,282 1,935 3,576 3,805 7,578 8,074 6,662 10,509 11,386 10,944 14,635 21,297 (25,700) $ (40,500) $ (15,
Slide 39: Appendix B
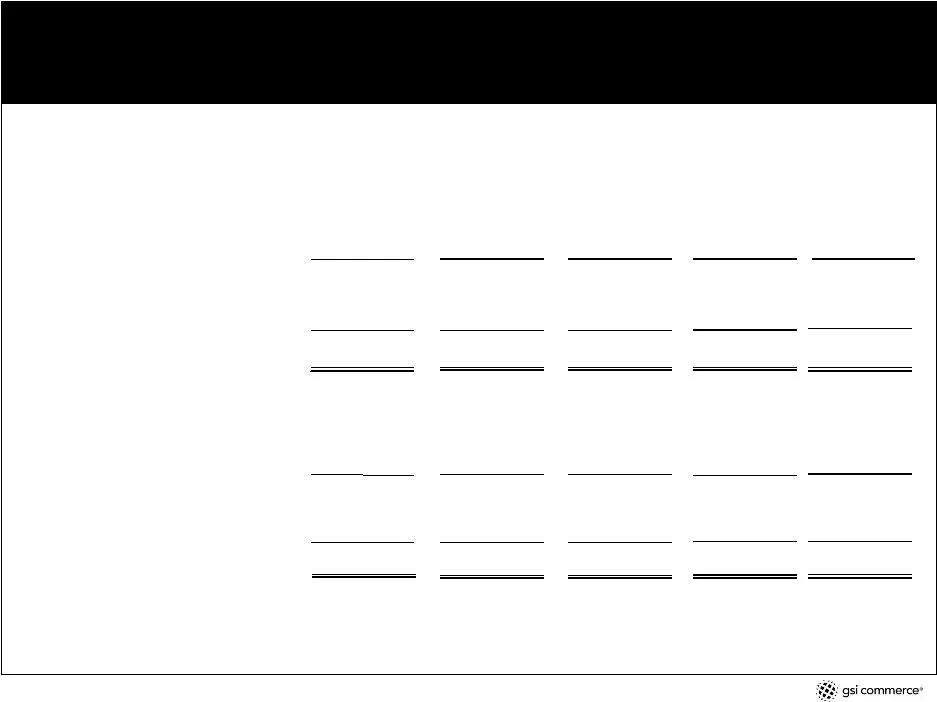
appendix b GSI COMMERCE, INC. AND SUBSIDIARIES MERCHANDISE SALES (1) AND RECONCILIATION TO GAAP RESULTS (Dollars in thousands) (Unaudited) January 3, January 1, Merchandise sales (1) - (a non-GAAP financial measure): Category: Sporting goods 128,489 $ 200,394 $ Other (2) 153,537 274,586 Total mercha

Slide 40: Appendix B . . . continued
appendix b . . . continued January 3, January 1, Year Ended GSI COMMERCE, INC. AND SUBSIDIARIES MERCHANDISE SALES (1) AND RECONCILIATION TO GAAP RESULTS (Dollars in thousands) (Unaudited) Reconciliation of merchandise sales (1) to net revenues: Merchandise sales - (1) (a non-GAAP financial measure):
Slide 41: Appendix C
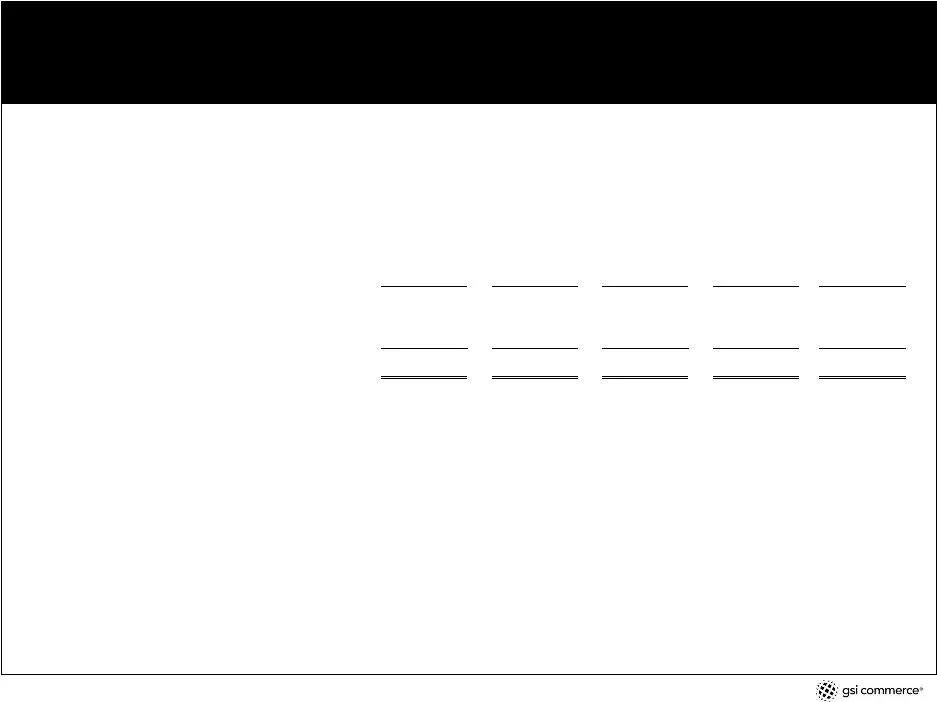
appendix c December 28, January 3, January 1, December 31, December 30, Reconciliation of GAAP operating cash flow to free cash flow GAAP cash flow from operating activities 10,041 $ $ 21,094 $ 24,285 $ 66,077 $ Cash paid for fixed assets, including capitalized software development (29,480) (7,999)
Source: SEC EDGAR · 8-K filed May 22, 2007
More decks from Gsi Commerce Inc
 Merger or Acquisition (October 2009)38 slides · Oct 27, 2009
 Investor Presentation (September 2009)33 slides · Sep 14, 2009
 Investor Presentation (May 2009)37 slides · May 5, 2009
 Investor Presentation (February 2009)41 slides · Feb 24, 2009
 Investor Presentation (November 2008)39 slides · Nov 12, 2008
 Investor Presentation (September 2008)37 slides · Sep 9, 2008