Fauquier Bankshares — Investor Presentation (April 2009)
45 slides from Fauquier Bankshares's investor presentation, Apr 15, 2009
Slide 1: Fauquier Bankshares, Inc. - Deeply rooted in our community
_____________________ FAUQUIER BANKSHARES, INC. Deeply rooted in our community. April 2009
Slide 2: Safe Harbor Statement
Safe Harbor Statement In addition to the historical information contained herein, this report contains forward-looking statements. Forward-looking statements are based on certain assumptions and describe future plans, strategies, and expectations of the Company, and are generally identifiable by use
Slide 3: Table of Contents
Table of Contents Who We Are Market Area Financial Condition Financial Performance and Goals Building Shareholder Value 3 FAUQUIER BANKSHARES, INC.
Slide 4: Who We Are
Who We Are 4 FAUQUIER BANKSHARES, INC.
Slide 5: Fauquier Bankshares, Inc.
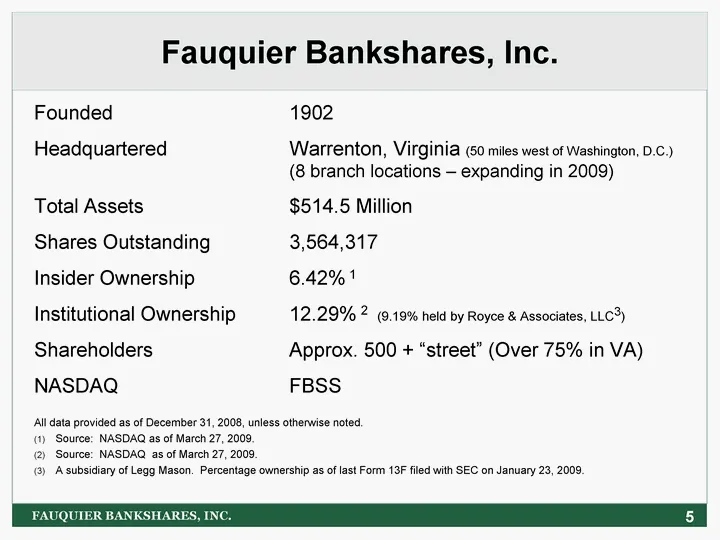
Fauquier Bankshares, Inc. Founded 1902 Headquartered Warrenton, Virginia (50 miles west of Washington, D.C.) (8 branch locations - expanding in 2009) Total Assets $514.5 Million Shares Outstanding 3,564,317 Insider Ownership 6.42% 1 Institutional Ownership 12.29% 2 (9.19% held by Royce & Associates,
Slide 6: Industry Recognition
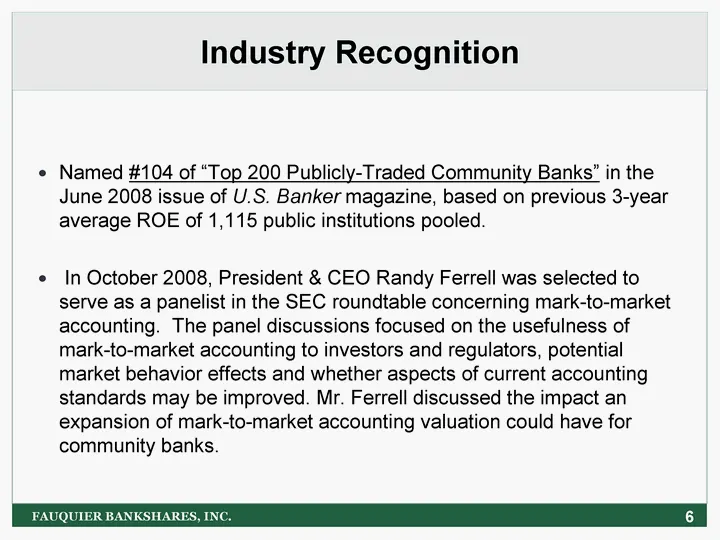
Industry Recognition Named #104 of "Top 200 Publicly-Traded Community Banks" in the June 2008 issue of U.S. Banker magazine, based on previous 3-year average ROE of 1,115 public institutions pooled. In October 2008, President & CEO Randy Ferrell was selected to serve as a panelist in the SEC roundta
Slide 7: Our Success Is a Result of Our Culture
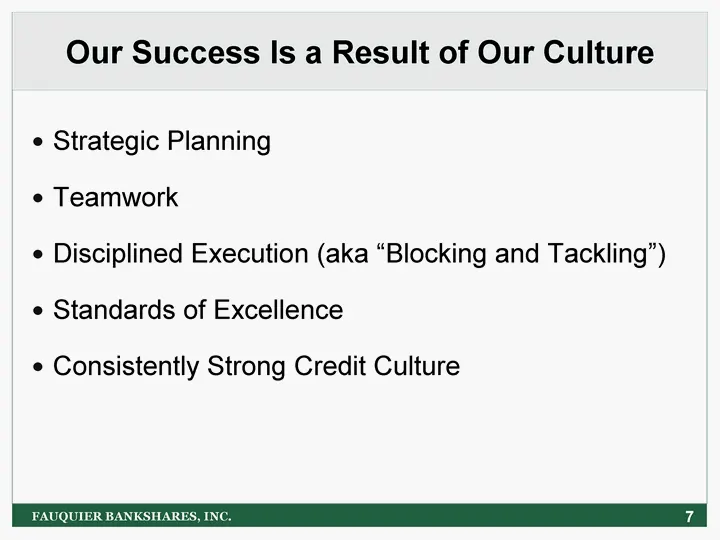
Our Success Is a Result of Our Culture 7 FAUQUIER BANKSHARES, INC. Strategic Planning Teamwork Disciplined Execution (aka "Blocking and Tackling") Standards of Excellence Consistently Strong Credit Culture
Slide 8: Our Management Focus
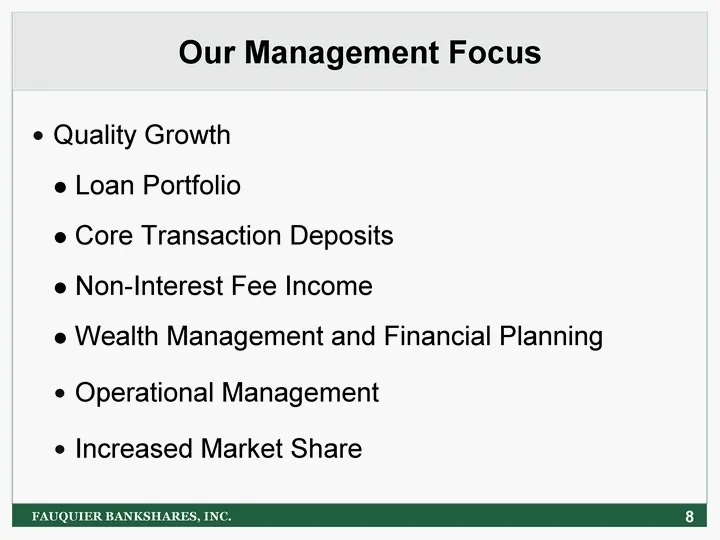
Our Management Focus 8 FAUQUIER BANKSHARES, INC. Quality Growth Loan Portfolio Core Transaction Deposits Non-Interest Fee Income Wealth Management and Financial Planning Operational Management Increased Market Share
Slide 9: Our Customer Focus
Our Customer Focus 9 FAUQUIER BANKSHARES, INC. To deliver a superior customer experience by enabling our retail and commercial customers to make the right choices when selecting financial products and services that best fit their needs and lifestyles, thereby empowering customers to achieve their fi
Slide 10: Market Area
Market Area 10 FAUQUIER BANKSHARES, INC.
Slide 11: Northern Virginia Marketplace
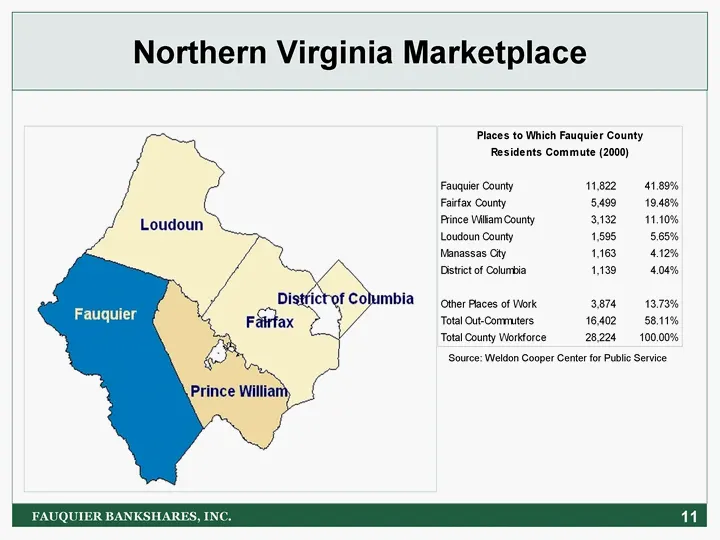
Northern Virginia Marketplace Source: Weldon Cooper Center for Public Service 11 FAUQUIER BANKSHARES, INC.
Slide 12: Primary Market Area
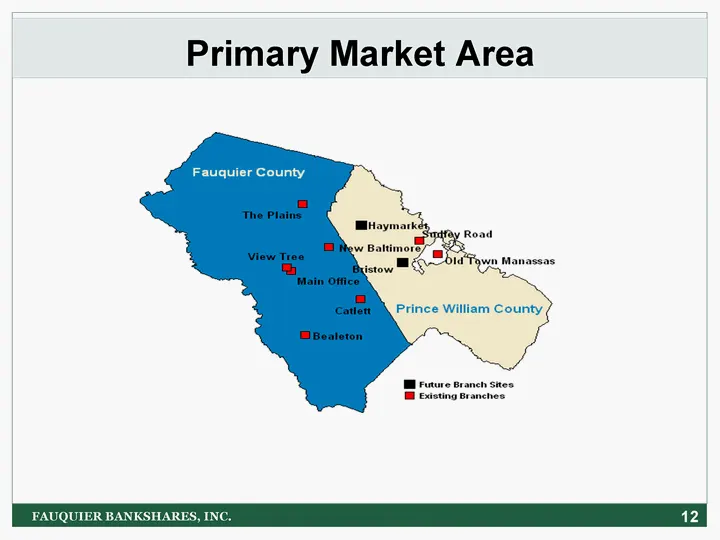
Primary Market Area 12 FAUQUIER BANKSHARES, INC.
Slide 13: Northern Virginia Marketplace
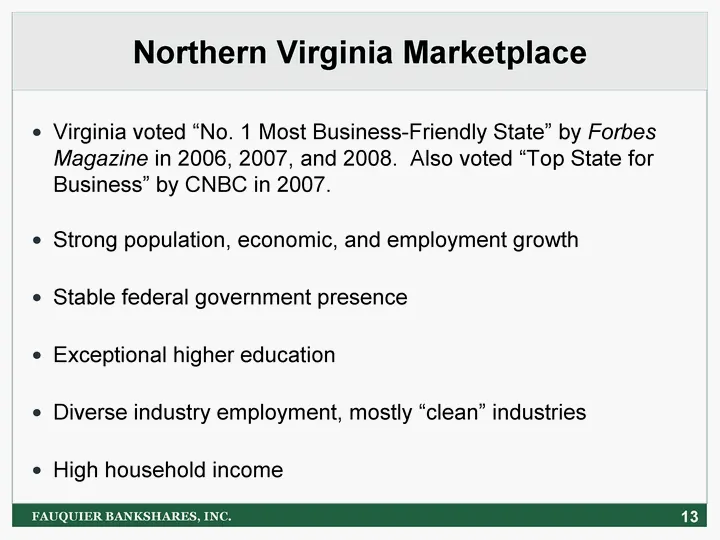
Northern Virginia Marketplace Virginia voted "No. 1 Most Business-Friendly State" by Forbes Magazine in 2006, 2007, and 2008. Also voted "Top State for Business" by CNBC in 2007. Strong population, economic, and employment growth Stable federal government presence Exceptional higher education Divers
Slide 14: Unemployment Rates
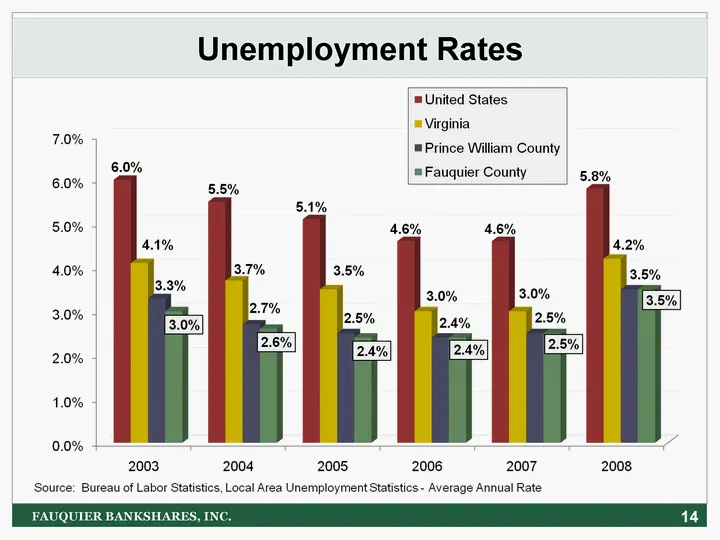
14 Unemployment Rates FAUQUIER BANKSHARES, INC.
Slide 15: Strong Markets with Sustainable Growth
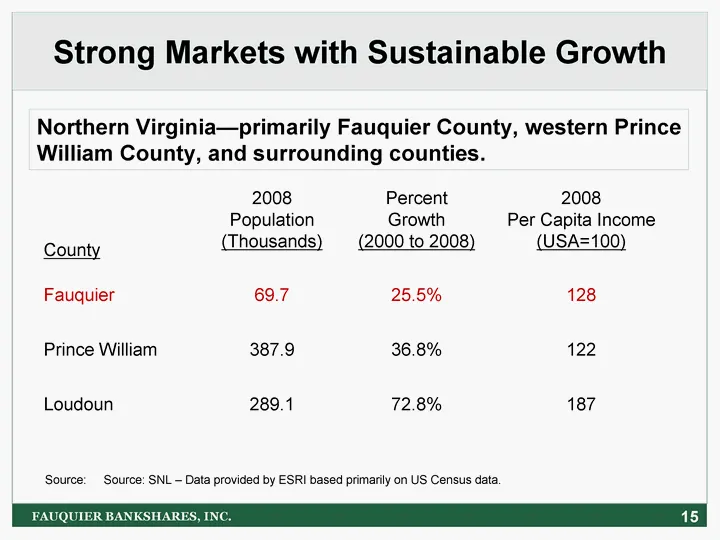
Strong Markets with Sustainable Growth 15 Northern Virginia-primarily Fauquier County, western Prince William County, and surrounding counties. FAUQUIER BANKSHARES, INC. County 2008 Population (Thousands) Percent Growth (2000 to 2008) 2008 Per Capita Income (USA=100) Fauquier 69.7 25.5% 128 Prince W
Slide 16: Deposit Market Share
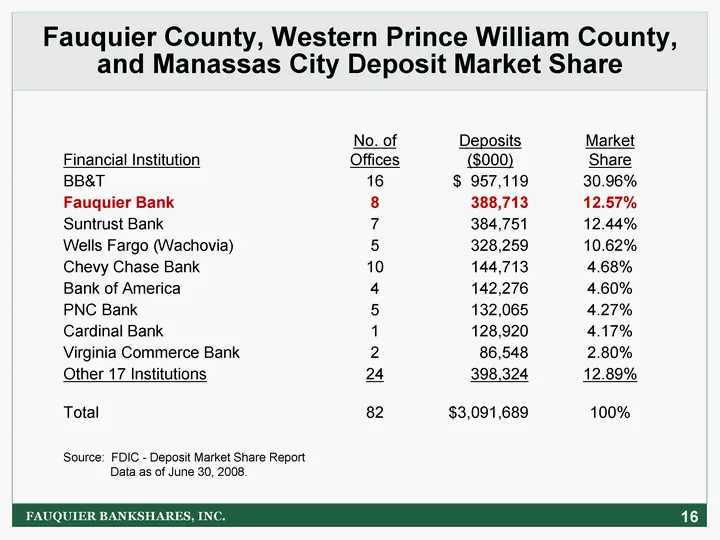
Fauquier County, Western Prince William County, and Manassas City Deposit Market Share FAUQUIER BANKSHARES, INC. 16 Financial Institution No. of Offices Deposits ($000) Market Share BB&T 16 $ 957,119 30.96% Fauquier Bank 8 388,713 12.57% Suntrust Bank 7 384,751 12.44% Wells Fargo (Wachovia) 5 328,25
Slide 17: Financial Condition
Financial Condition FAUQUIER BANKSHARES, INC. 17
Slide 18: Asset and Loan Growth
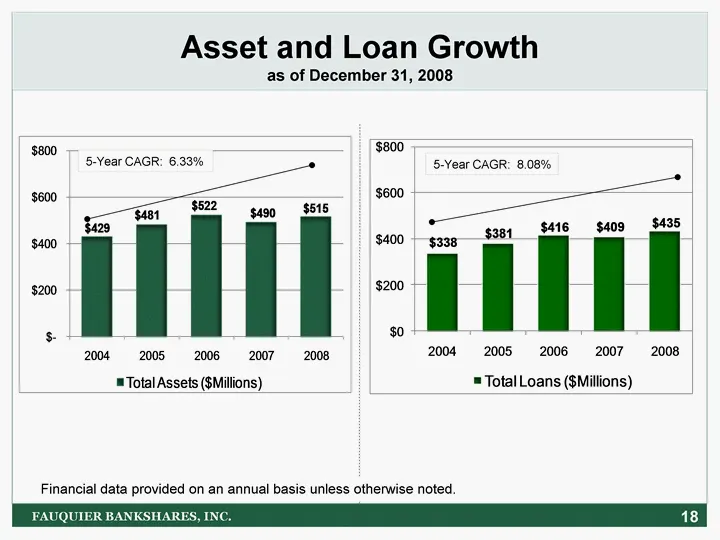
Asset and Loan Growth as of December 31, 2008 5-Year CAGR: 6.33% 5-Year CAGR: 8.08% FAUQUIER BANKSHARES, INC. 18 Financial data provided on an annual basis unless otherwise noted.
Slide 19: Loan Portfolio
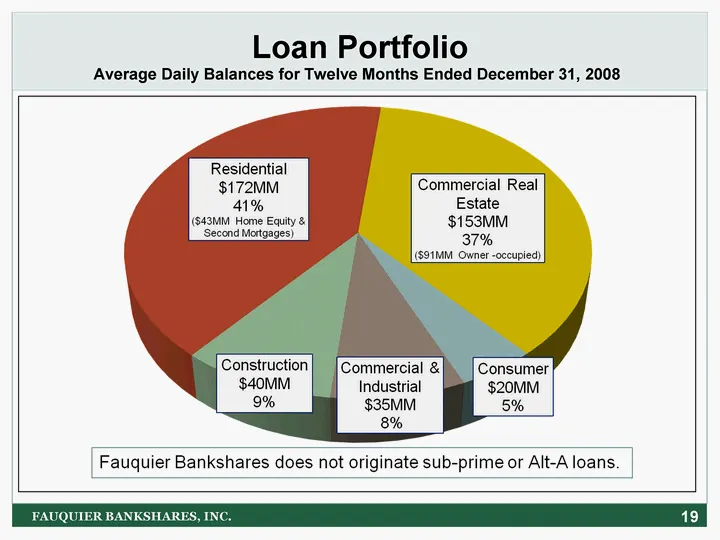
19 Loan Portfolio Loan Portfolio Average Daily Balances for Twelve Months Ended December 31, 2008 FAUQUIER BANKSHARES, INC.
Slide 20: Credit Quality
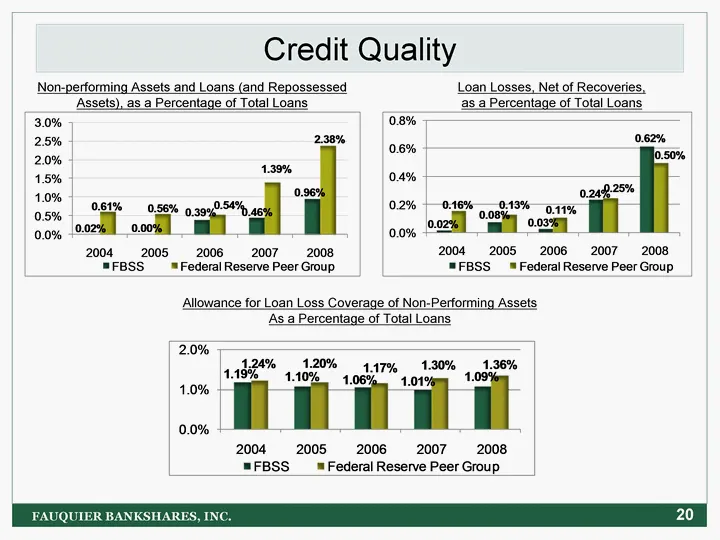
Credit Quality FAUQUIER BANKSHARES, INC. Loan Losses, Net of Recoveries, as a Percentage of Total Loans Allowance for Loan Loss Coverage of Non-Performing Assets As a Percentage of Total Loans Non-performing Assets and Loans (and Repossessed Assets), as a Percentage of Total Loans 20
Slide 21: Capital Management
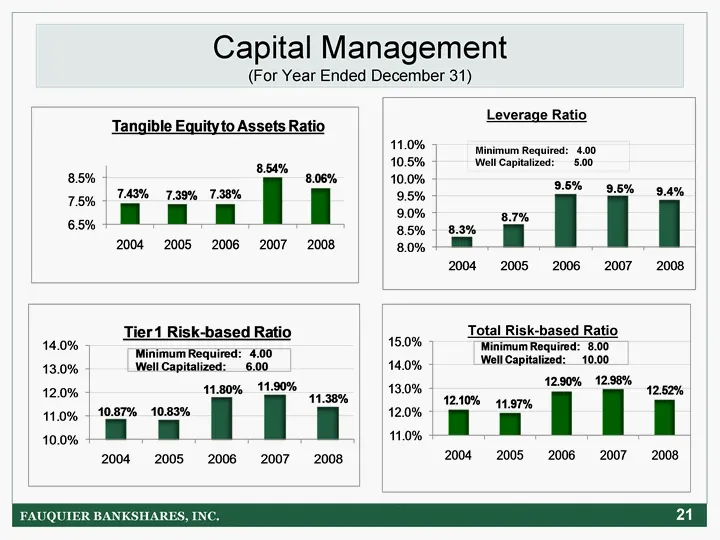
Capital Management (For Year Ended December 31) FAUQUIER BANKSHARES, INC. Total Risk-based Ratio Leverage Ratio Minimum Required: 4.00 Well Capitalized: 5.00 21
Slide 22: Deposit Portfolio
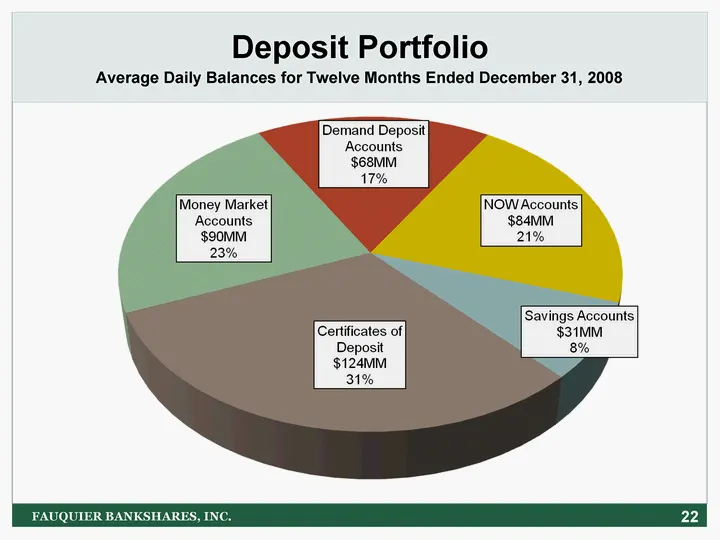
Deposit Portfolio FAUQUIER BANKSHARES, INC. Average Daily Balances for Twelve Months Ended December 31, 2008 22
Slide 23: Deposit Growth (Average YTD)
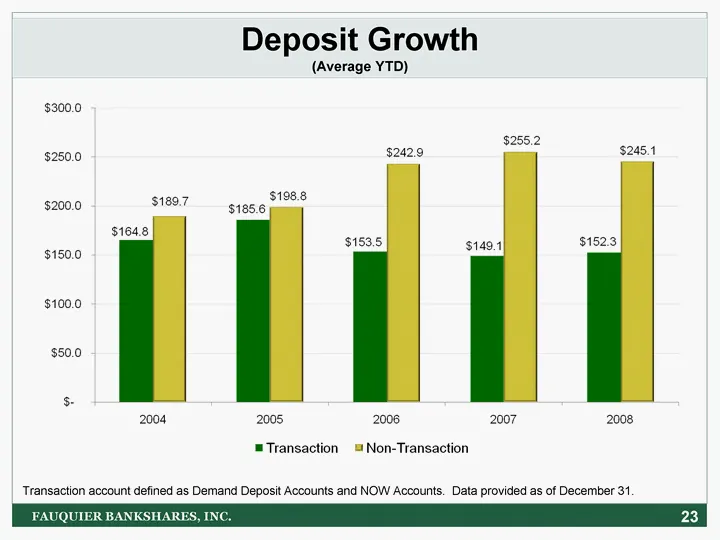
Deposit Growth (Average YTD) 23 Transaction account defined as Demand Deposit Accounts and NOW Accounts. Data provided as of December 31. FAUQUIER BANKSHARES, INC.
Slide 24: FAUQUIER BANKSHARES, INC. 24
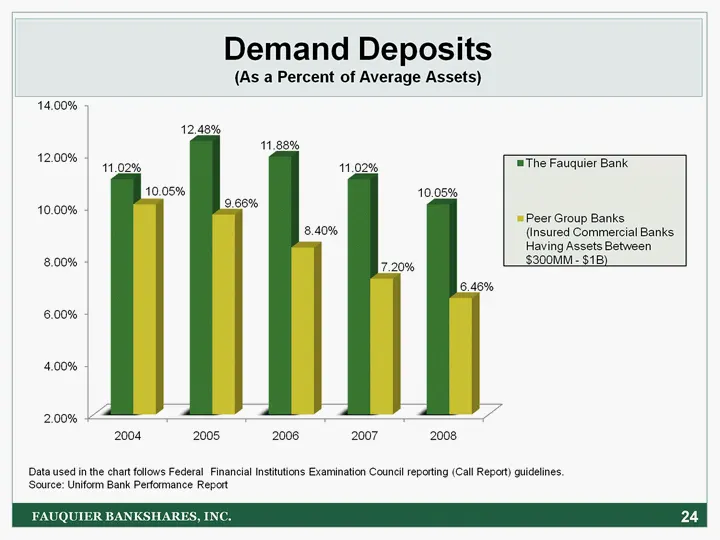
FAUQUIER BANKSHARES, INC. 24
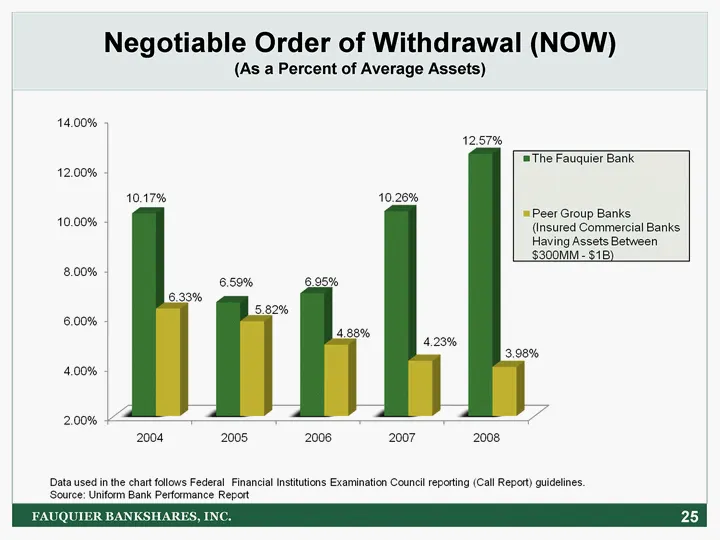
Slide 25: Negotiable Order of Withdrawal (NOW)
Negotiable Order of Withdrawal (NOW) (As a Percent of Average Assets) FAUQUIER BANKSHARES, INC. 25
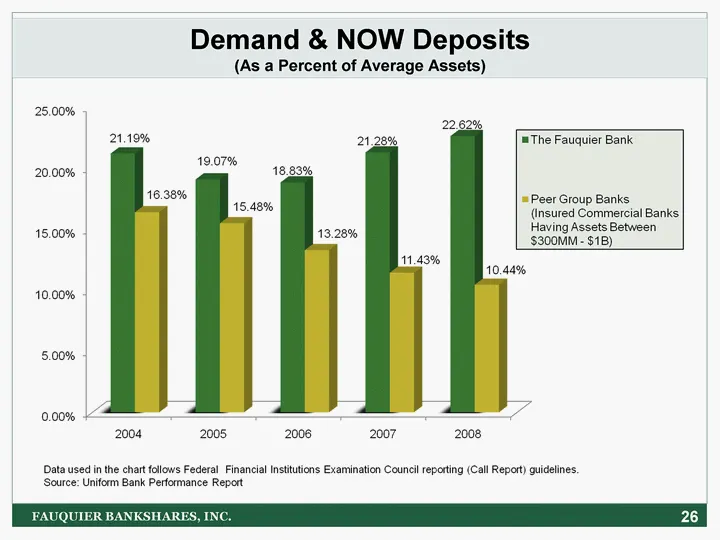
Slide 26: Demand & NOW Deposits
26 Demand & NOW Deposits (As a Percent of Average Assets) FAUQUIER BANKSHARES, INC.
Slide 27: Financial Performance and Goals
Financial Performance and Goals FAUQUIER BANKSHARES, INC. 27
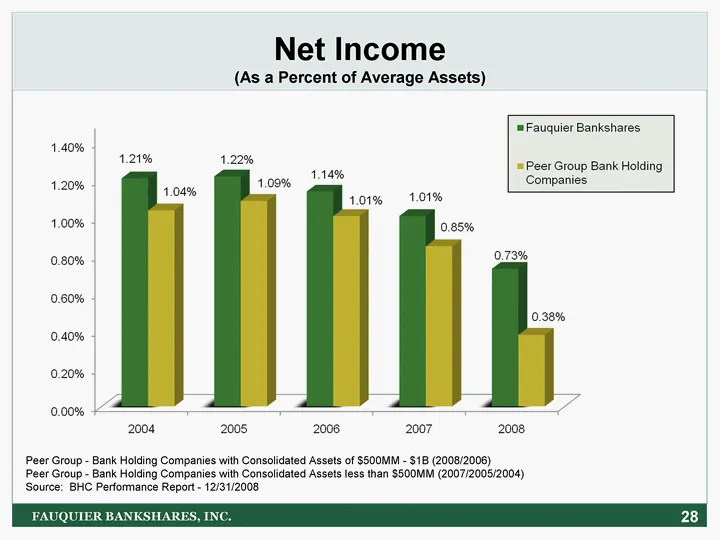
Slide 28: Net Income (As a Percent of Average Assets)
28 Net Income (As a Percent of Average Assets) Peer Group - Bank Holding Companies with Consolidated Assets of $500MM - $1B (2008/2006) Peer Group - Bank Holding Companies with Consolidated Assets less than $500MM (2007/2005/2004) Source: BHC Performance Report - 12/31/2008 FAUQUIER BANKSHARES, INC.
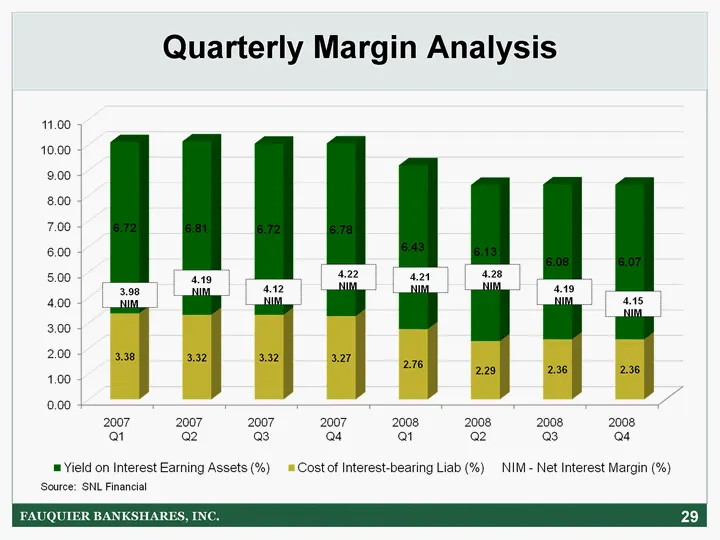
Slide 29: Quarterly Margin Analysis
Quarterly Margin Analysis FAUQUIER BANKSHARES, INC. 29
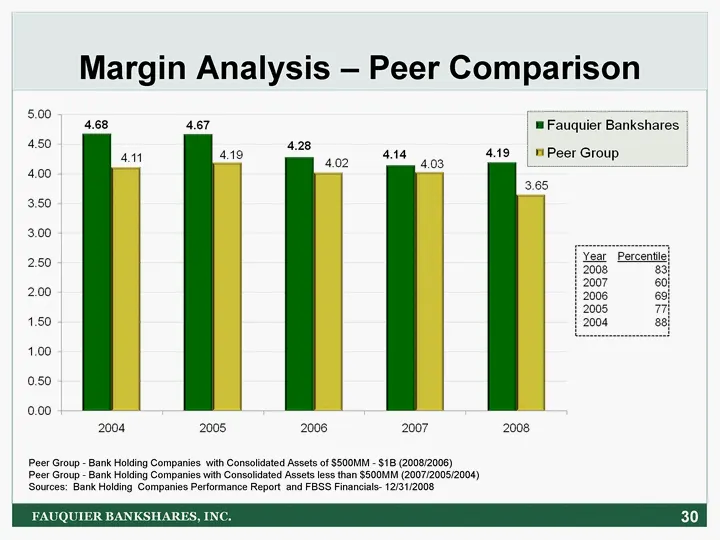
Slide 30: Margin Analysis - Peer Comparison
Margin Analysis - Peer Comparison 30 Peer Group - Bank Holding Companies with Consolidated Assets of $500MM - $1B (2008/2006) Peer Group - Bank Holding Companies with Consolidated Assets less than $500MM (2007/2005/2004) Sources: Bank Holding Companies Performance Report and FBSS Financials- 12/31/2
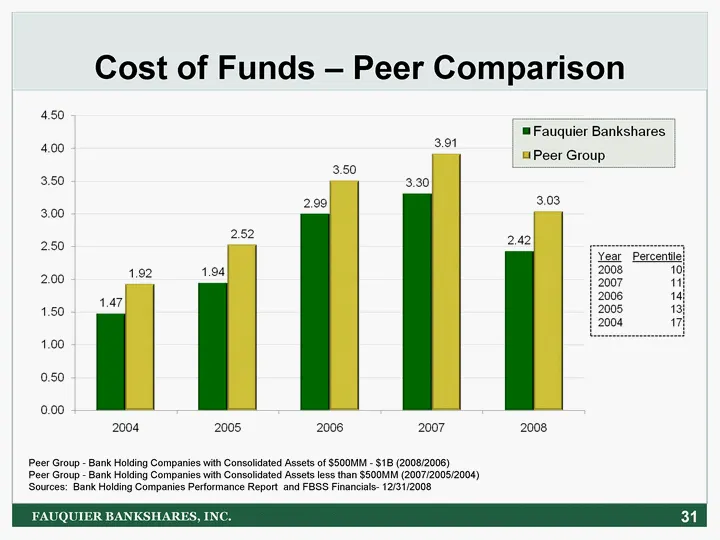
Slide 31: Cost of Funds - Peer Comparison
Cost of Funds - Peer Comparison 31 Peer Group - Bank Holding Companies with Consolidated Assets of $500MM - $1B (2008/2006) Peer Group - Bank Holding Companies with Consolidated Assets less than $500MM (2007/2005/2004) Sources: Bank Holding Companies Performance Report and FBSS Financials- 12/31/200
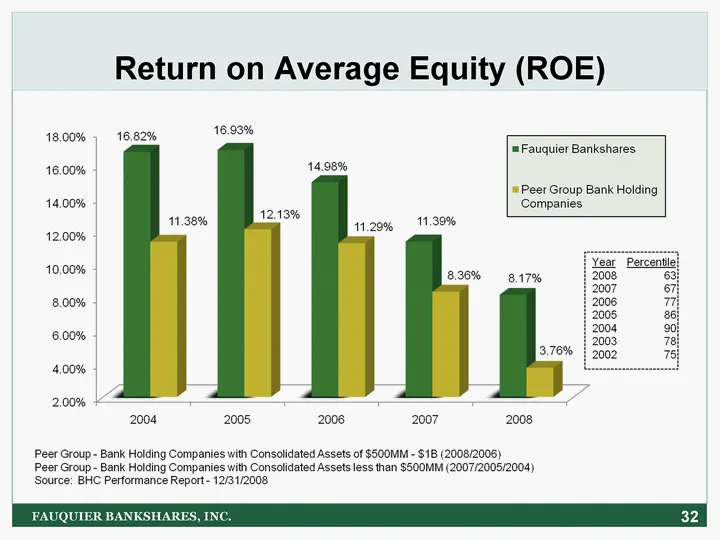
Slide 32: Return on Average Equity (ROE)
32 Return on Average Equity (ROE) FAUQUIER BANKSHARES, INC.
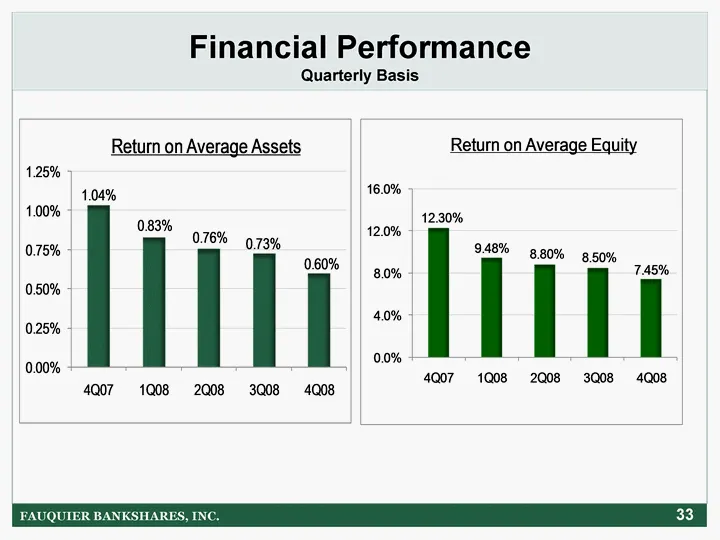
Slide 33: Financial Performance Quarterly Basis
FAUQUIER BANKSHARES, INC. Financial Performance Quarterly Basis 33
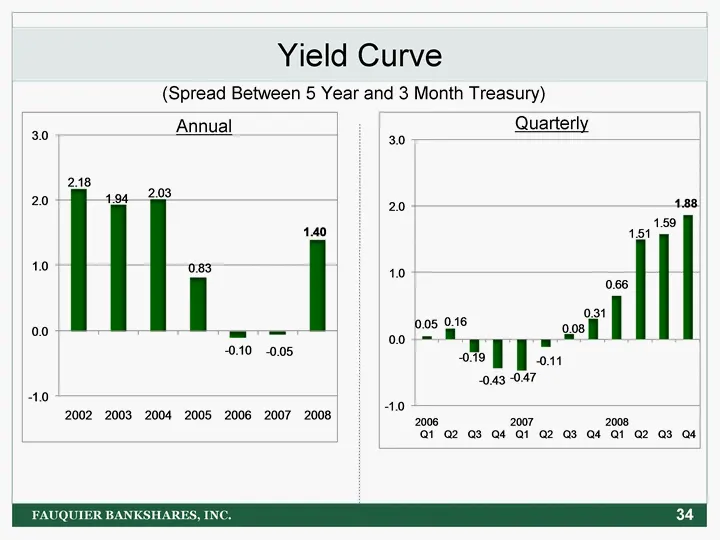
Slide 34: Yield Curve
Yield Curve FAUQUIER BANKSHARES, INC. (Spread Between 5 Year and 3 Month Treasury) Quarterly Annual 34
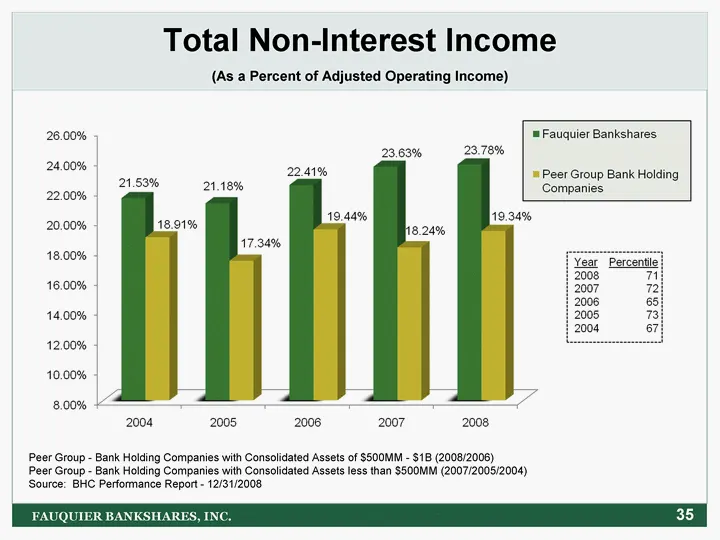
Slide 35: Total Non-Interest Income
Total Non-Interest Income (As a Percent of Adjusted Operating Income) FAUQUIER BANKSHARES, INC. 35 Peer Group - Bank Holding Companies with Consolidated Assets of $500MM - $1B (2008/2006) Peer Group - Bank Holding Companies with Consolidated Assets less than $500MM (2007/2005/2004) Source: BHC Perfo
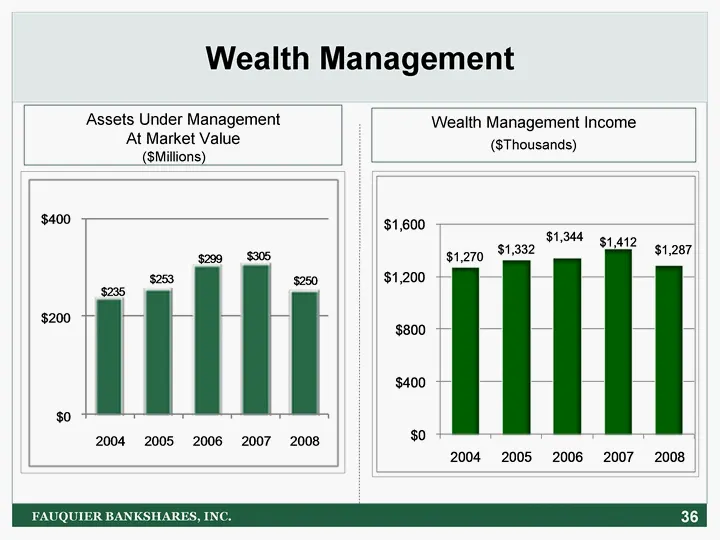
Slide 36: Wealth Management
Wealth Management ($Millions) FAUQUIER BANKSHARES, INC. Assets Under Management At Market Value Wealth Management Income ($Thousands) 36
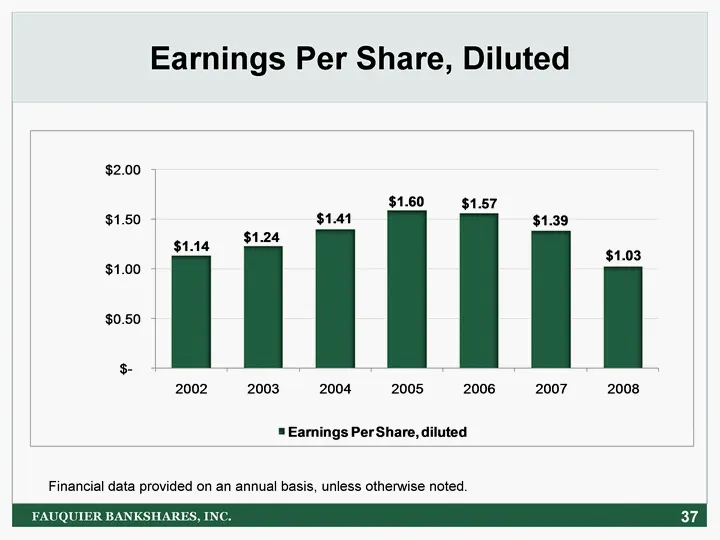
Slide 37: Earnings Per Share, Diluted
Earnings Per Share, Diluted FAUQUIER BANKSHARES, INC. Financial data provided on an annual basis, unless otherwise noted. 37
Slide 38: Building Shareholder Value
Building Shareholder Value FAUQUIER BANKSHARES, INC. 38
Slide 39: Keys to Building Shareholder Value
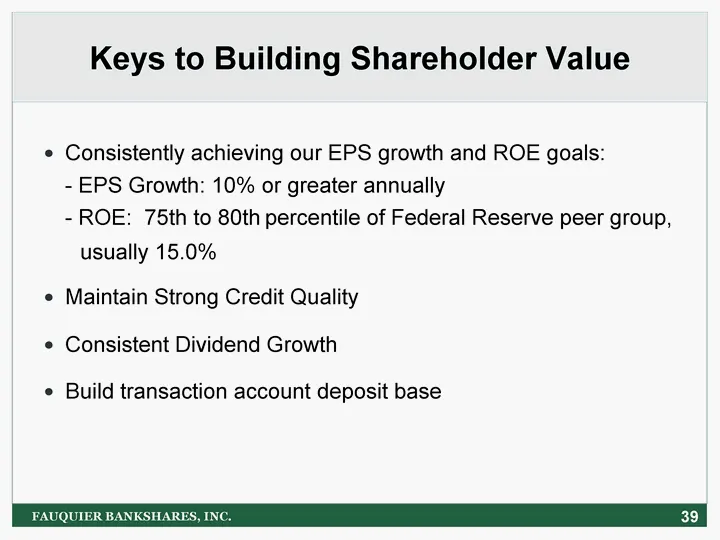
Keys to Building Shareholder Value Consistently achieving our EPS growth and ROE goals: - EPS Growth: 10% or greater annually - ROE: 75th to 80th percentile of Federal Reserve peer group, usually 15.0% Maintain Strong Credit Quality Consistent Dividend Growth Build transaction account deposit base F
Slide 40: Cash Dividends
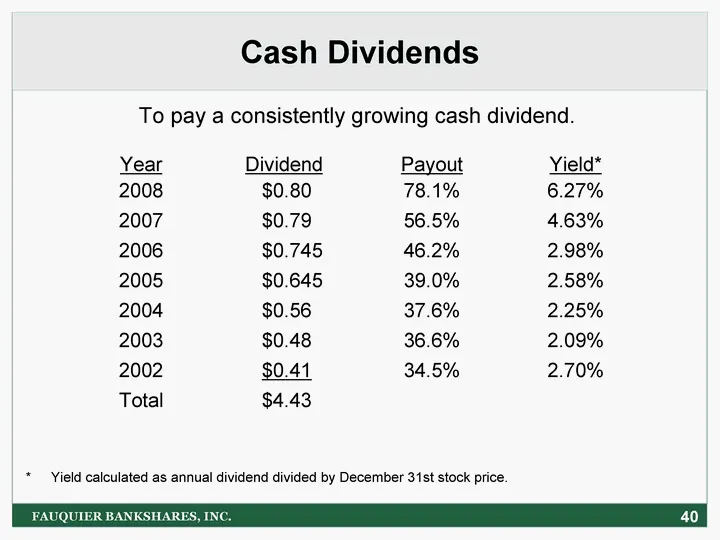
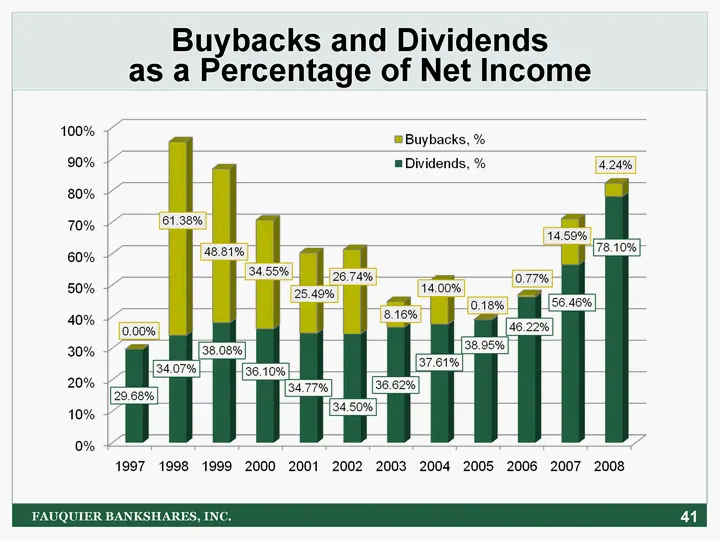
Cash Dividends To pay a consistently growing cash dividend. Year 2008 2007 2006 2005 2004 2003 2002 Total Dividend $0.800 $0.790 $0.745 $0.645 $0.560 $0.480 $0.410 $4.430 Payout 78.1% 56.5% 46.2% 39.0% 37.6% 36.6% 34.5% Yield* 6.27% 4.63% 2.98% 2.58% 2.25% 2.09% 2.70% * Yield calculated as annual di
Slide 41: Buybacks and Dividends as a Percentage of Net Income
Buybacks and Dividends as a Percentage of Net Income 41 FAUQUIER BANKSHARES, INC.
Slide 42: Stock Chart - Price/Tangible Book Value
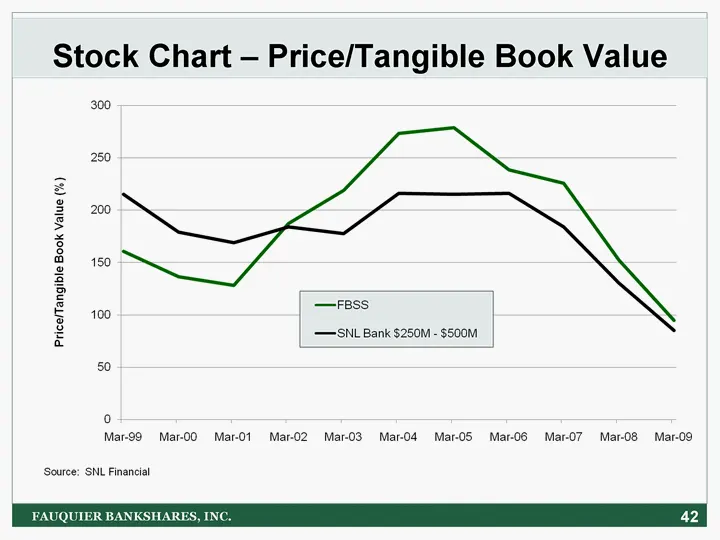
Stock Chart - Price/Tangible Book Value 42 FAUQUIER BANKSHARES, INC.
Slide 43: Stock Performance: Total Return
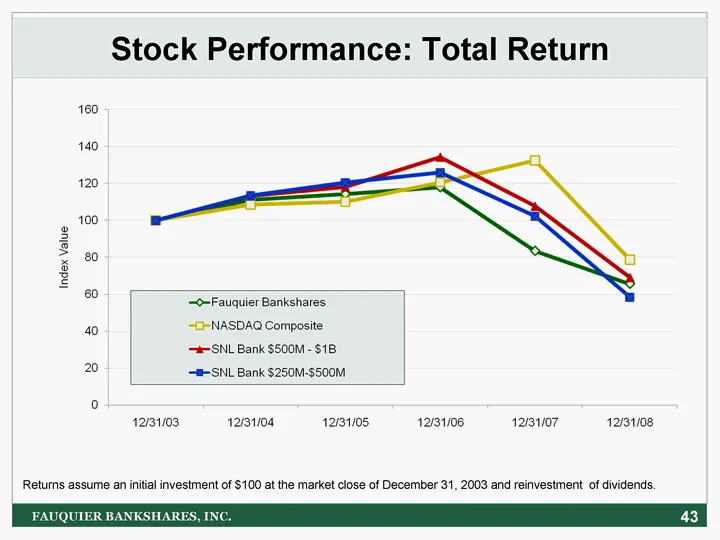
43 Stock Performance: Total Return Returns assume an initial investment of $100 at the market close of December 31, 2003 and reinvestment of dividends. FAUQUIER BANKSHARES, INC.
Slide 44: SNL Virginia Peer Group Comparison
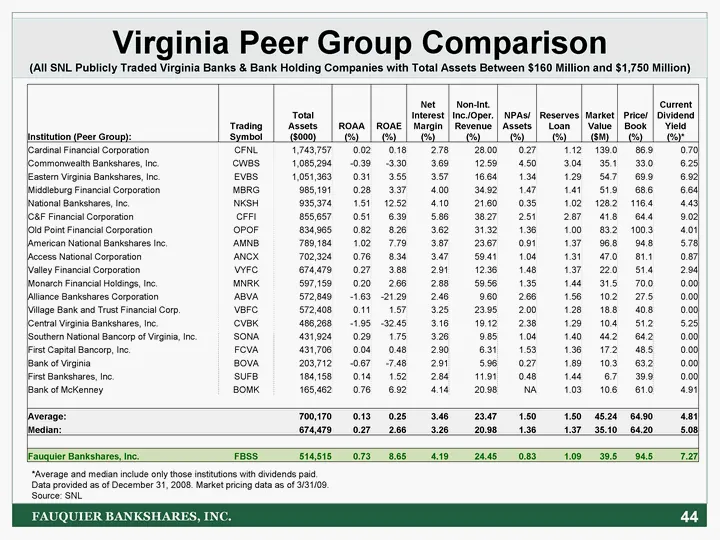
44 *Average and median include only those institutions with dividends paid. Data provided as of December 31, 2008. Market pricing data as of 3/31/09. Source: SNL Virginia Peer Group Comparison (All SNL Publicly Traded Virginia Banks & Bank Holding Companies with Total Assets Between $160 Million and
Slide 45: Contact Information
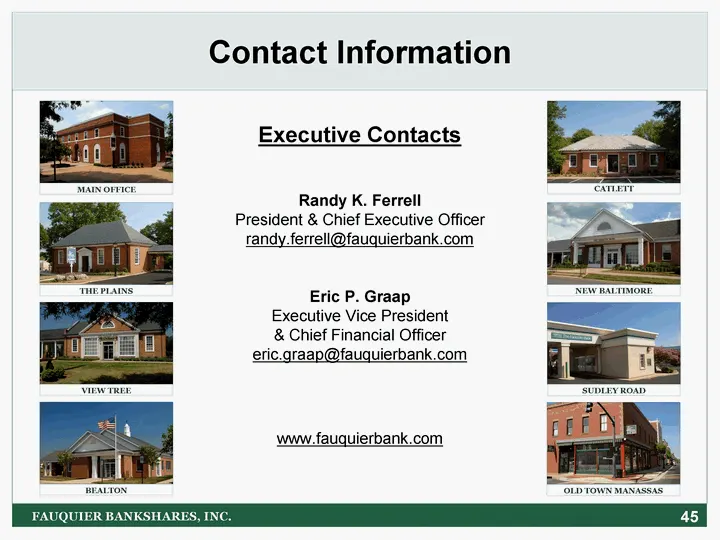
Contact Information 45 FAUQUIER BANKSHARES, INC. Executive Contacts Randy K. Ferrell President & Chief Executive Officer randy.ferrell@fauquierbank.com Eric P. Graap Executive Vice President & Chief Financial Officer eric.graap@fauquierbank.com www.fauquierbank.com MAIN OFFICE THE PLAINS VIEW TREE B
Source: SEC EDGAR · 8-K filed Apr 15, 2009
More decks from Fauquier Bankshares Inc
 Merger or Acquisition (October 2020)20 slides · Oct 1, 2020
 Shareholder Meeting (May 2020)30 slides · May 19, 2020
 Investor Presentation (August 2019)20 slides · Aug 7, 2019
 Shareholder Meeting (May 2019)31 slides · May 21, 2019
 Investor Presentation (October 2018)18 slides · Oct 22, 2018
 Shareholder Meeting (May 2018)33 slides · May 15, 2018