Barratt Redrow plc · LSE:BTRW
Barratt Redrow — Barratt Developments — FY2013 Earnings Presentation
63 slides from Barratt Redrow's earnings presentation, Sep 11, 2013
Slide 1: Results presentation Year ended 30 June 2013
Full Year 2013 1 Results presentation Year ended 30 June 2013 11 September 2013
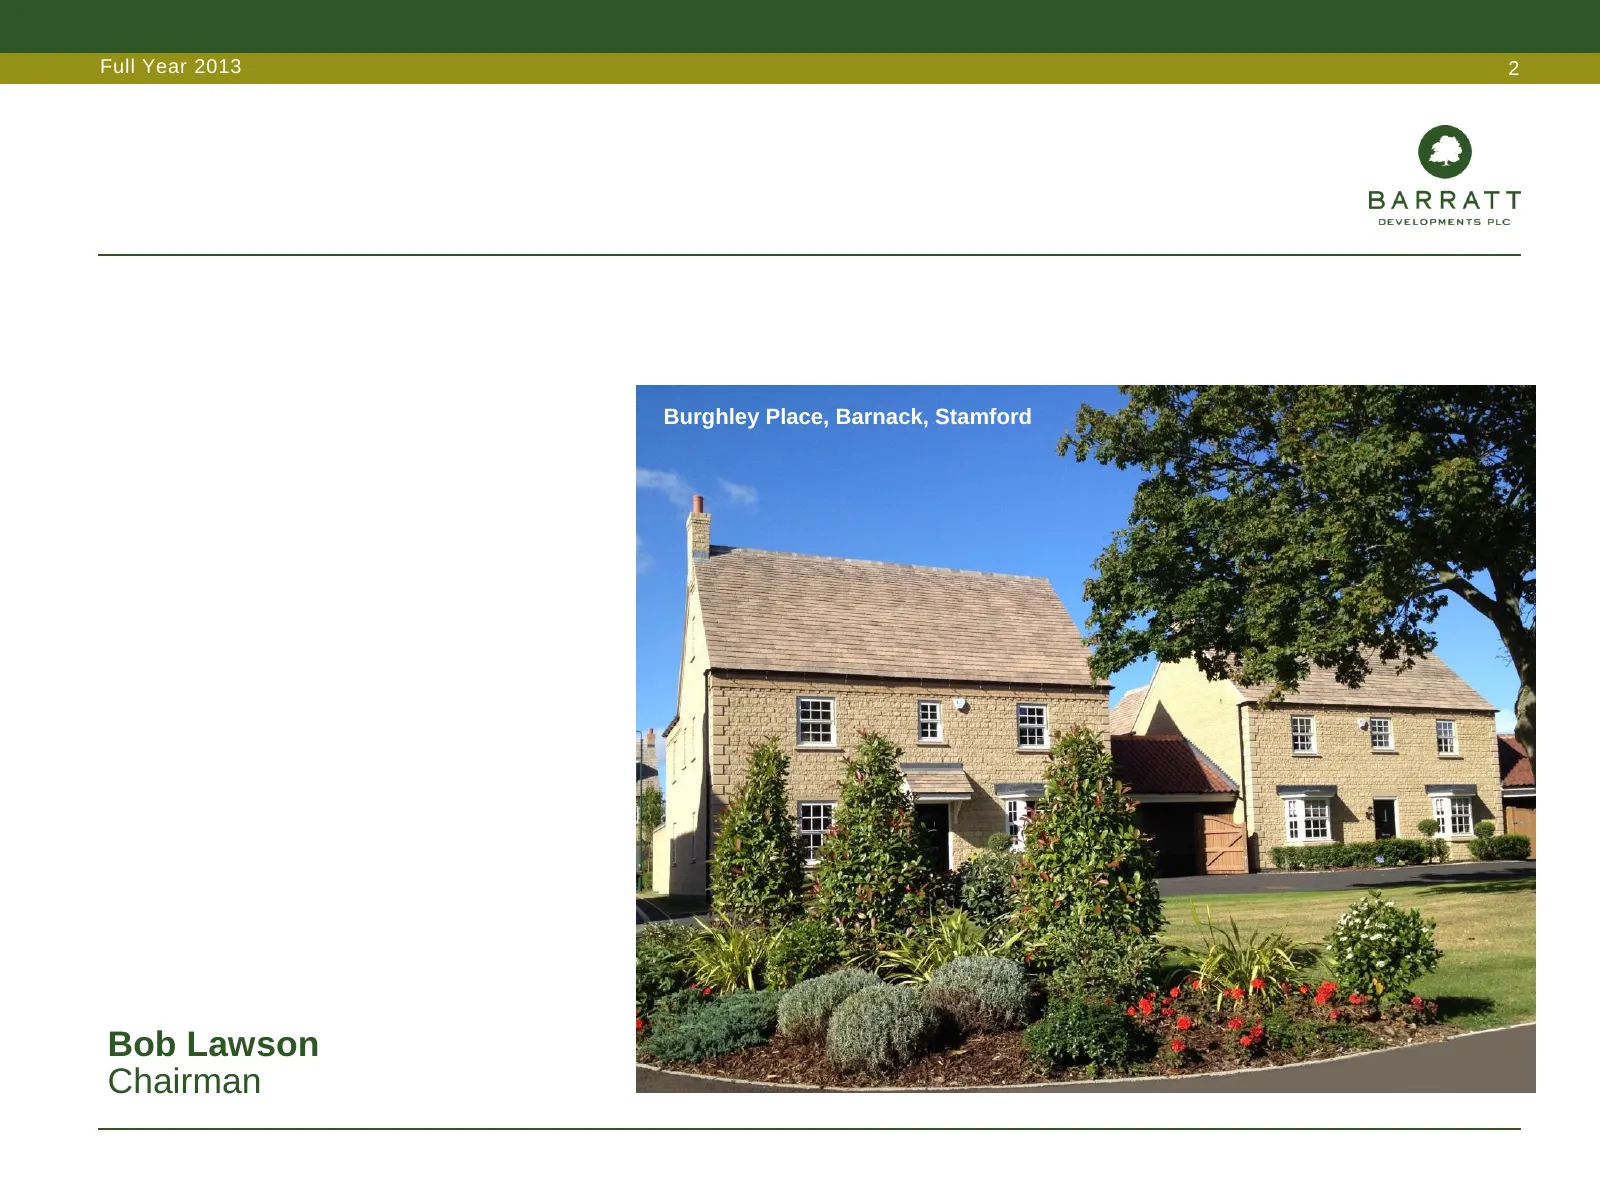
Slide 2: Bob Lawson, Chairman
Full Year 2013 2 Burghley Place, Barnack, Stamford Fulham Riverside, London Bob Lawson Chairman
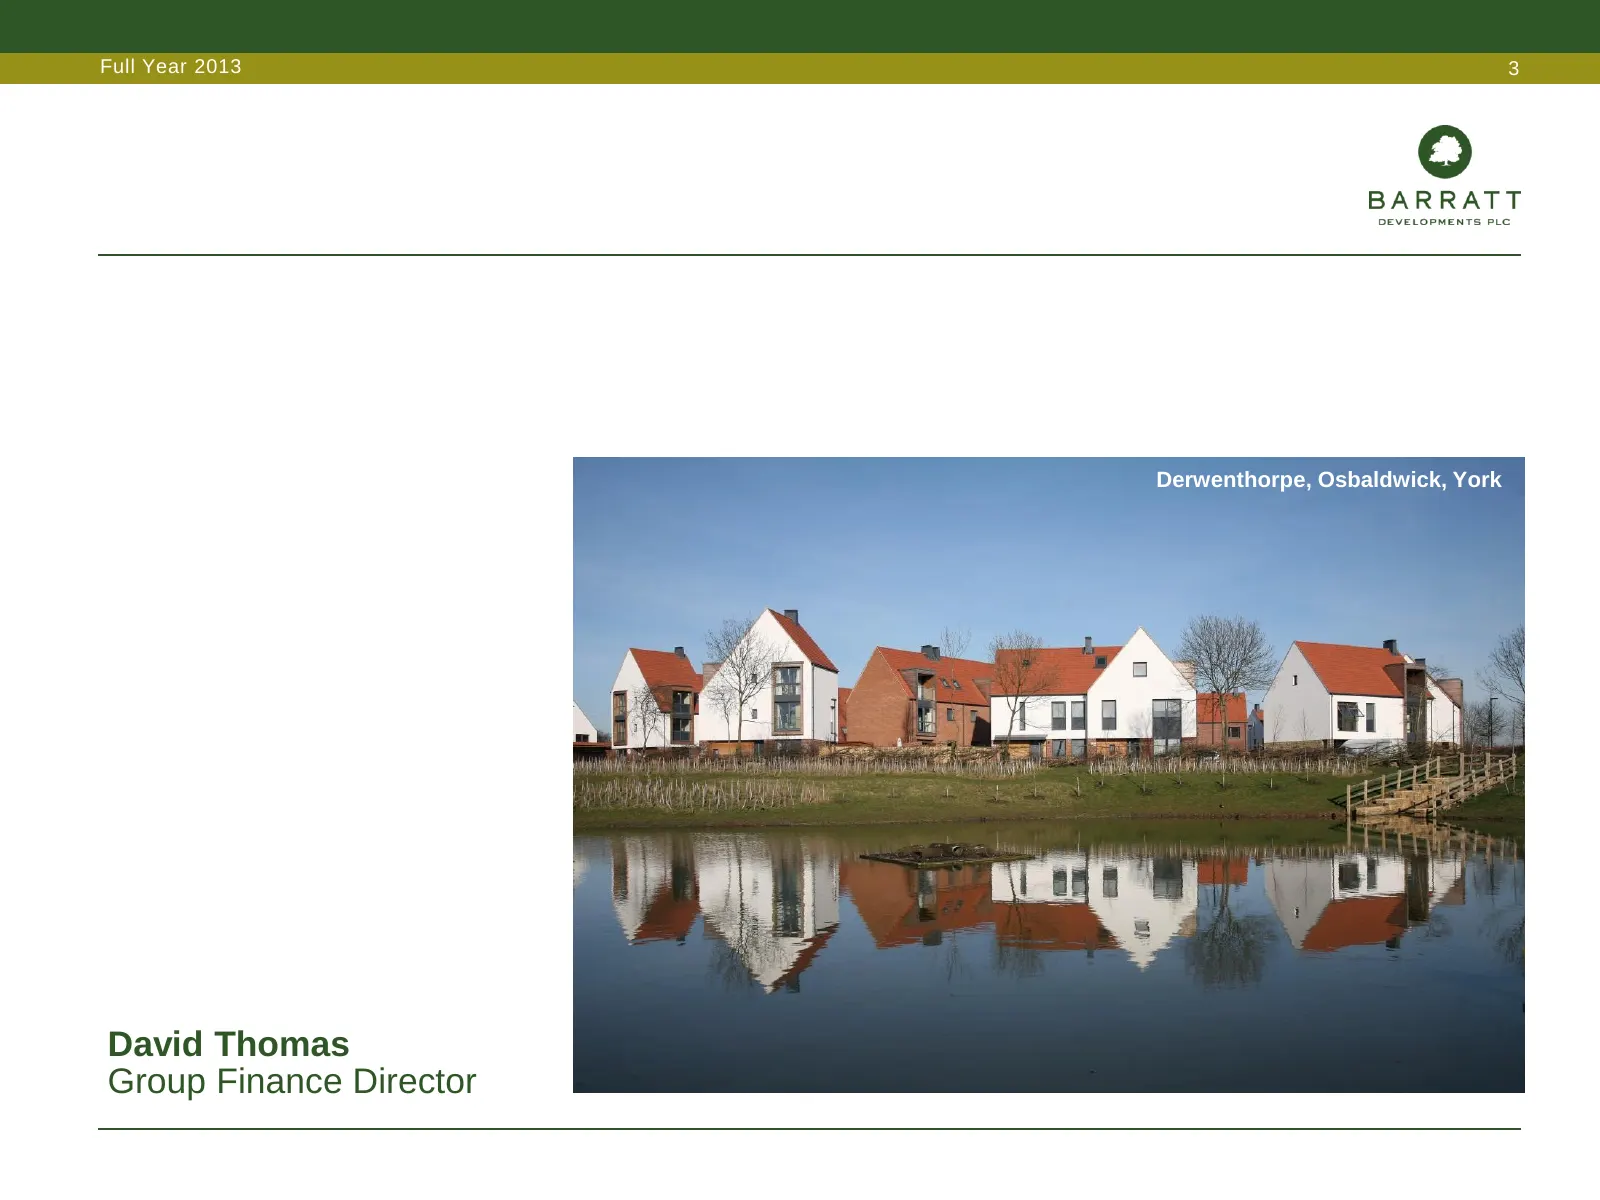
Slide 3: David Thomas, Group Finance Director
Full Year 2013 3 Derwenthorpe, Osbaldwick, York David Thomas Group Finance Director
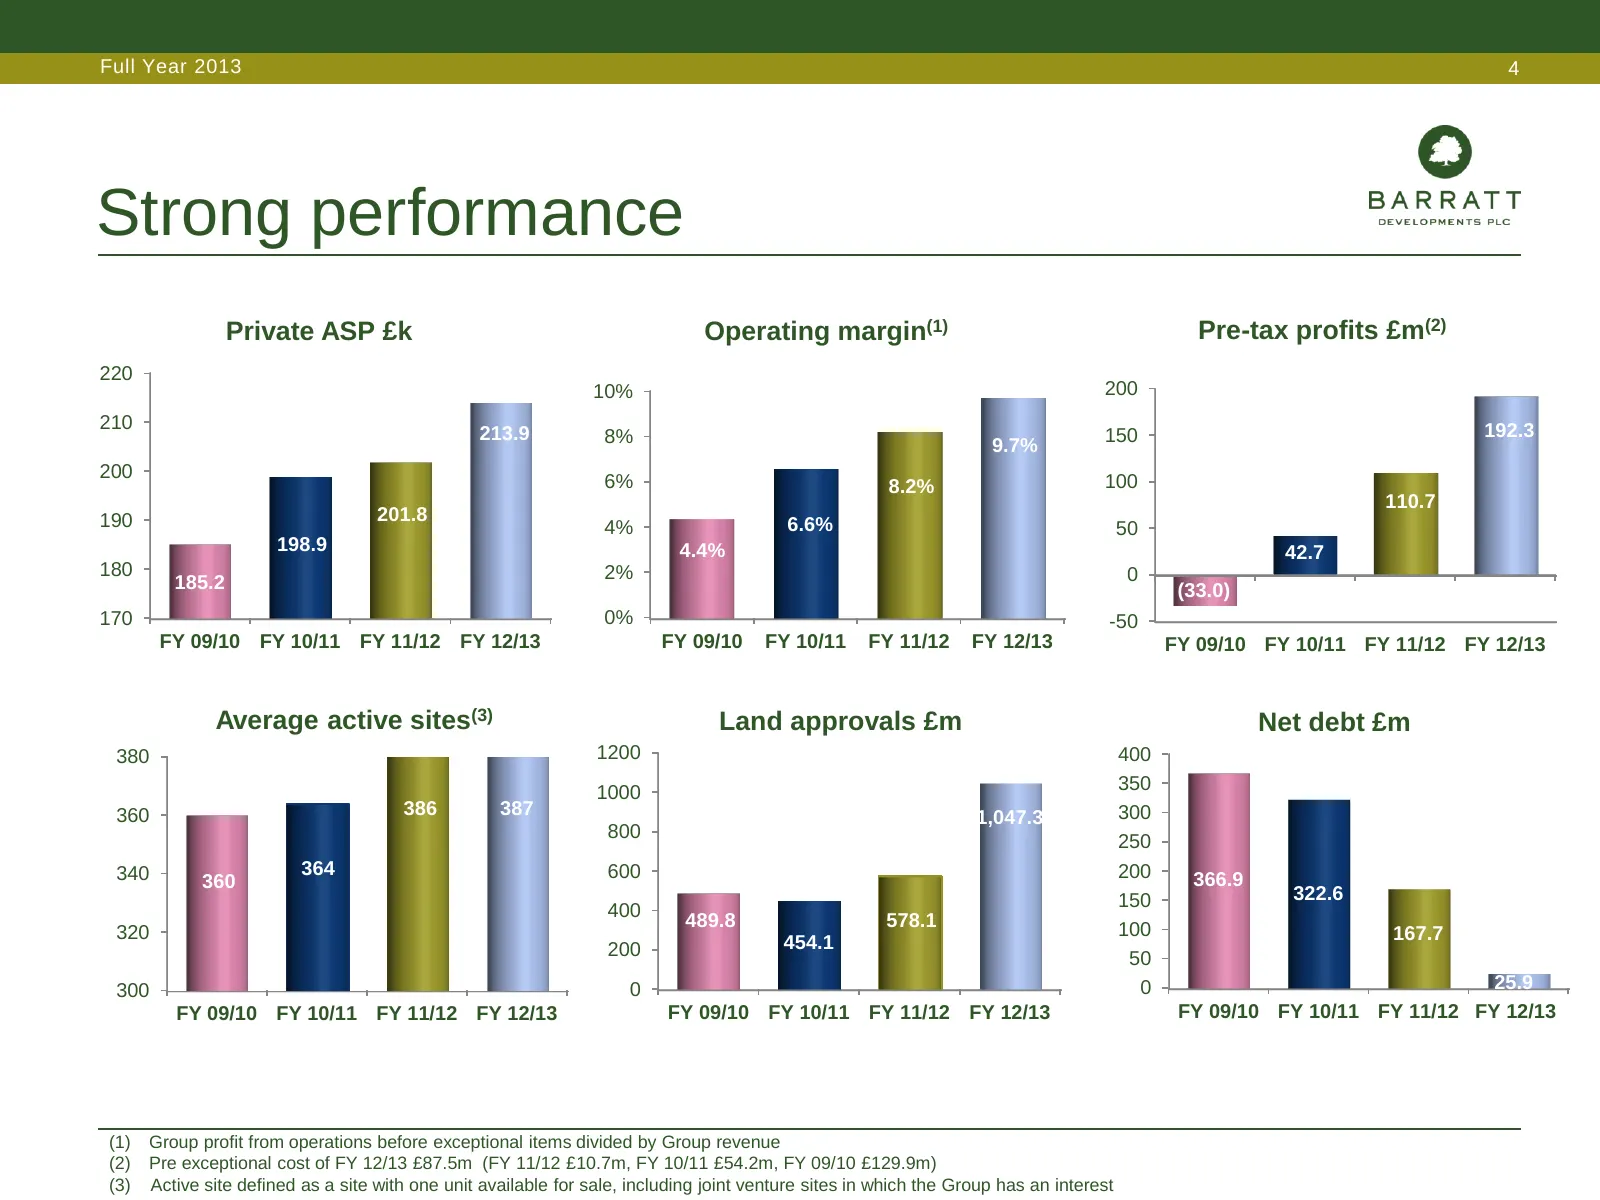
Slide 4: Strong performance
Full Year 2013 4 Strong performance Private ASP £k Operating margin(1) Pre-tax profits £m(2) 220 10% 200 210 192.3 213.9 8% 150 9.7% 200 6% 8.2% 100 110.7 190 201.8 4% 6.6% 50 198.9 4.4% 42.7 180 2% 0 185.2 (33.0) 170 0% -50 FY 09/10 FY 10/11 FY 11/12 FY 12/13 FY 09/10 FY 10/11 FY 11/12 FY 12/13 FY
Slide 5: Summary revenue drivers
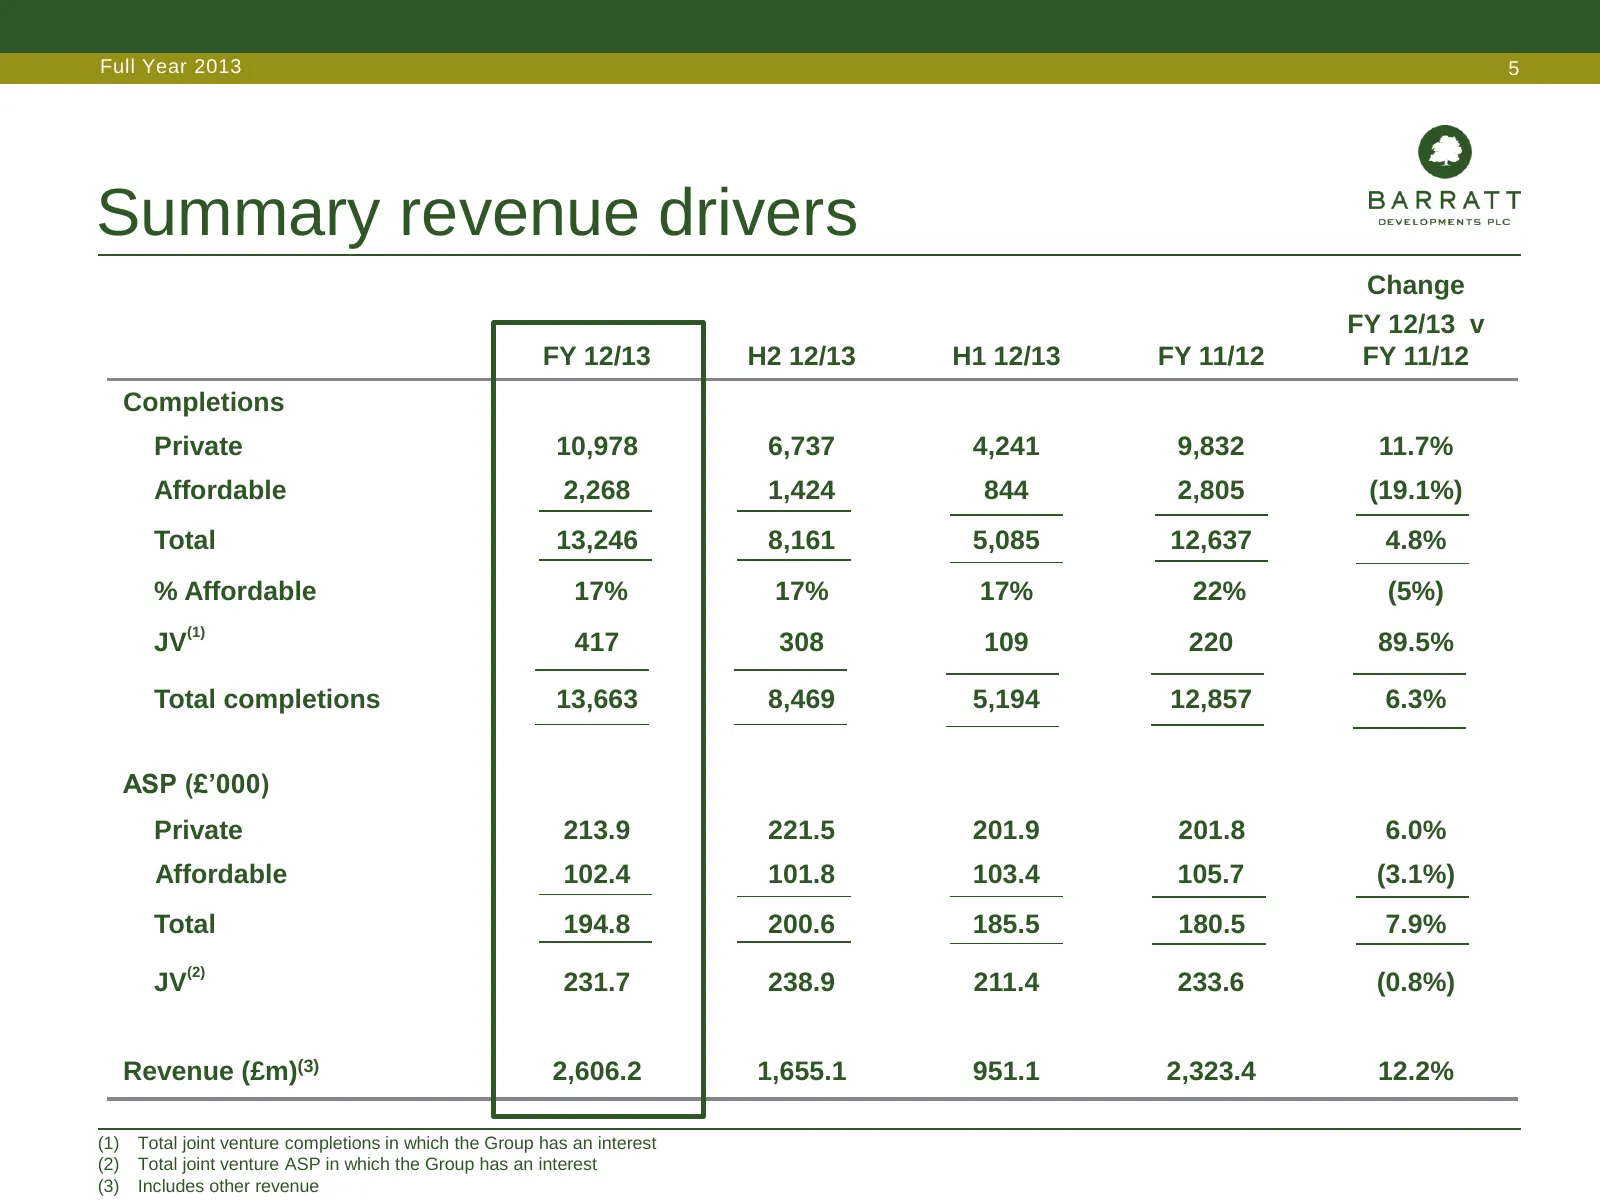
Full Year 2013 5 Summary revenue drivers Change FY 12/13 v FY 12/13 H2 12/13 H1 12/13 FY 11/12 FY 11/12 Completions Private 10,978 6,737 4,241 9,832 11.7% Affordable 2,268 1,424 844 2,805 (19.1%) Total 13,246 8,161 5,085 12,637 4.8% % Affordable 17% 17% 17% 22% (5%) JV(1) 417 308 109 220 89.5% Total
Slide 6: Profit & loss
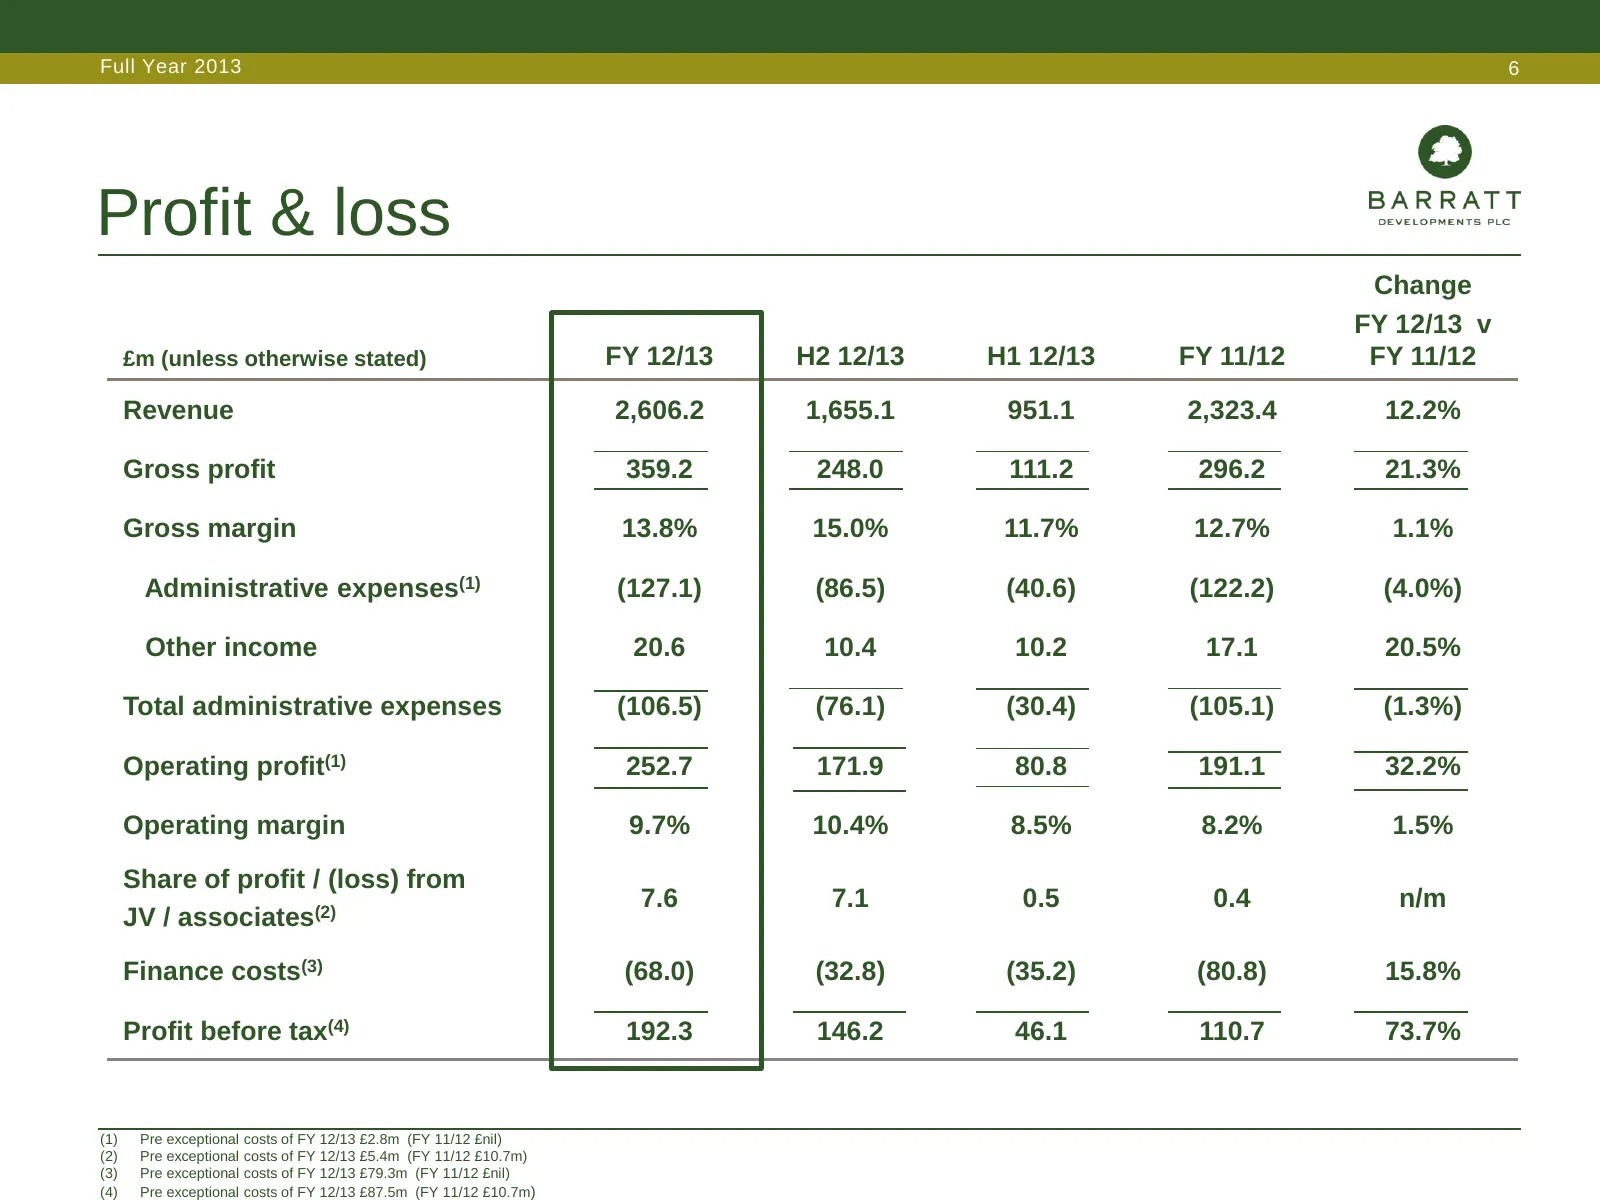
Full Year 2013 6 Profit & loss Change FY 12/13 v £m (unless otherwise stated) FY 12/13 H2 12/13 H1 12/13 FY 11/12 FY 11/12 Revenue 2,606.2 1,655.1 951.1 2,323.4 12.2% Gross profit 359.2 248.0 111.2 296.2 21.3% Gross margin 13.8% 15.0% 11.7% 12.7% 1.1% Administrative expenses(1) (127.1) (86.5) (40.6)
Slide 7: Completions by land type
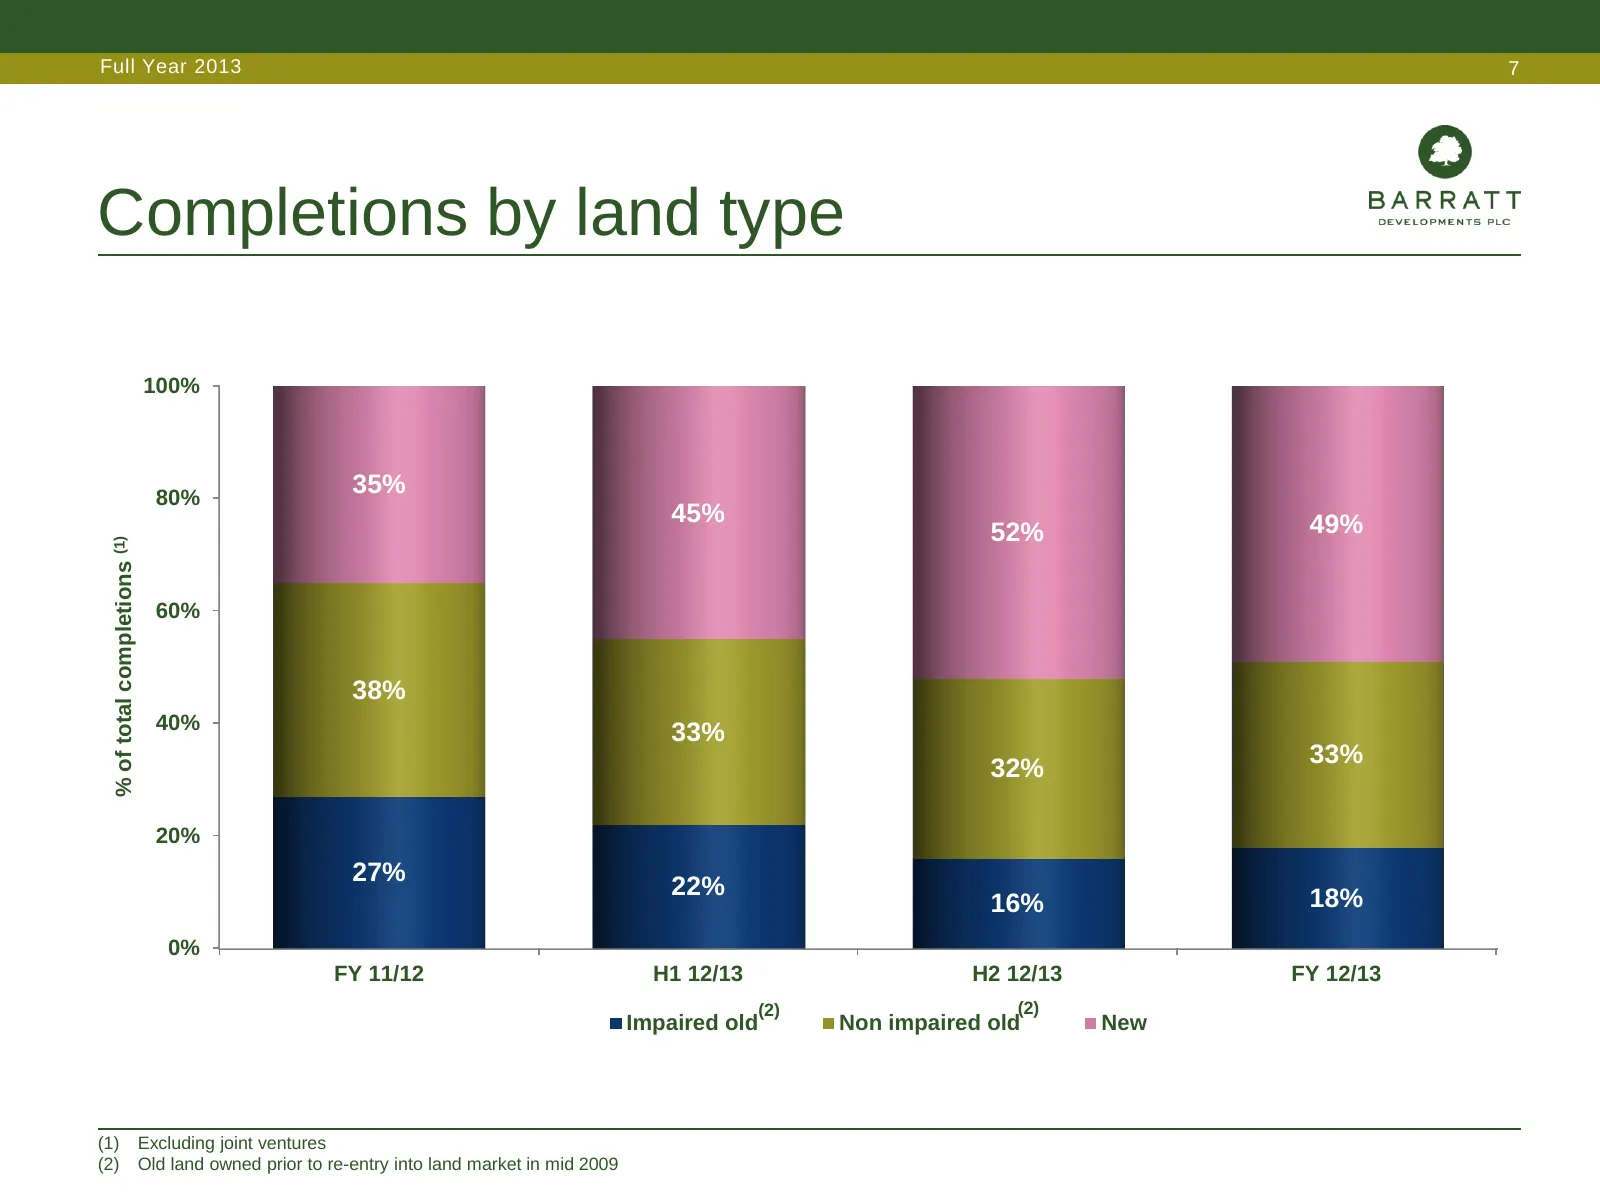
Full Year 2013 7 Completions by land type 100% 80% 35% 45% 49% 52% % of total completions (1) 60% 38% 40% 33% 33% 32% 20% 27% 22% 18% 16% 0% FY 11/12 H1 12/13 H2 12/13 FY 12/13 (2) (2) Impaired old Non impaired old New (1) Excluding joint ventures (2) Old land owned prior to re-entry into land marke
Slide 8: Pro forma profitability
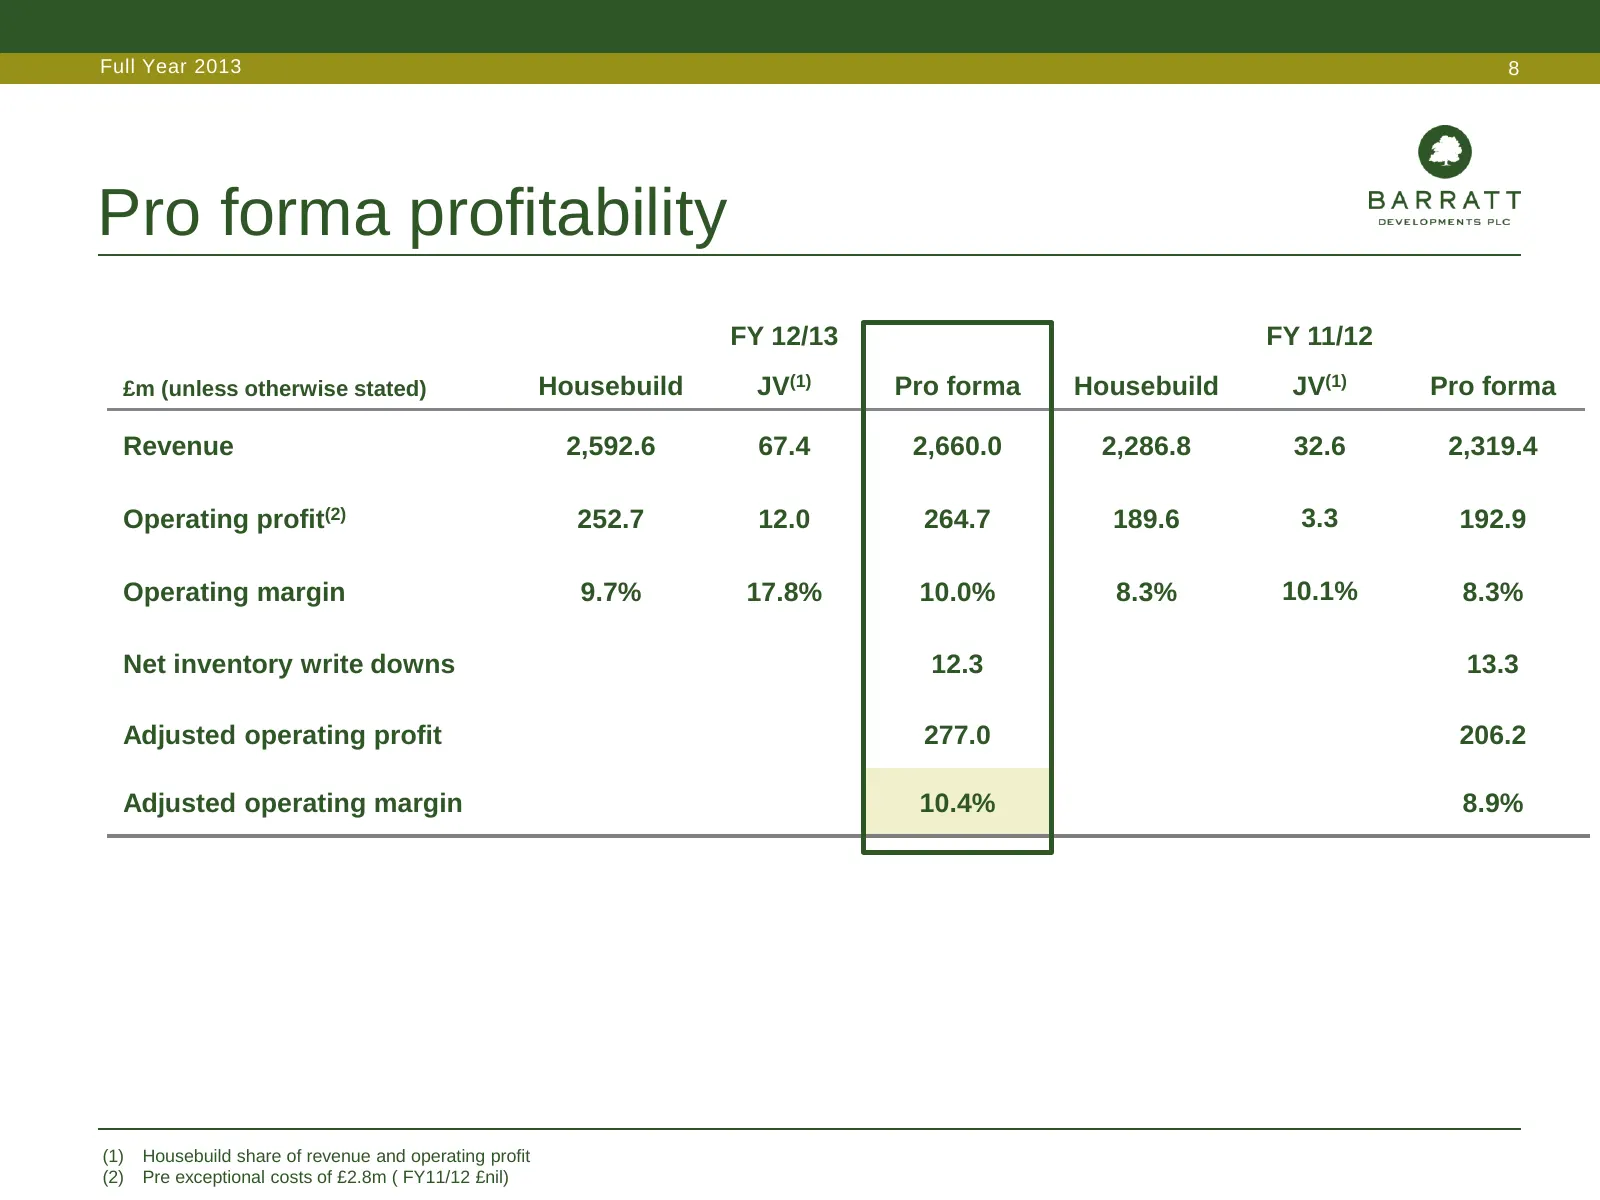
Full Year 2013 8 Pro forma profitability FY 12/13 FY 11/12 £m (unless otherwise stated) Housebuild JV(1) Pro forma Housebuild JV(1) Pro forma Revenue 2,592.6 67.4 2,660.0 2,286.8 32.6 2,319.4 Operating profit(2) 252.7 12.0 264.7 189.6 3.3 192.9 Operating margin 9.7% 17.8% 10.0% 8.3% 10.1% 8.3% Net i
Slide 9: Joint ventures - London
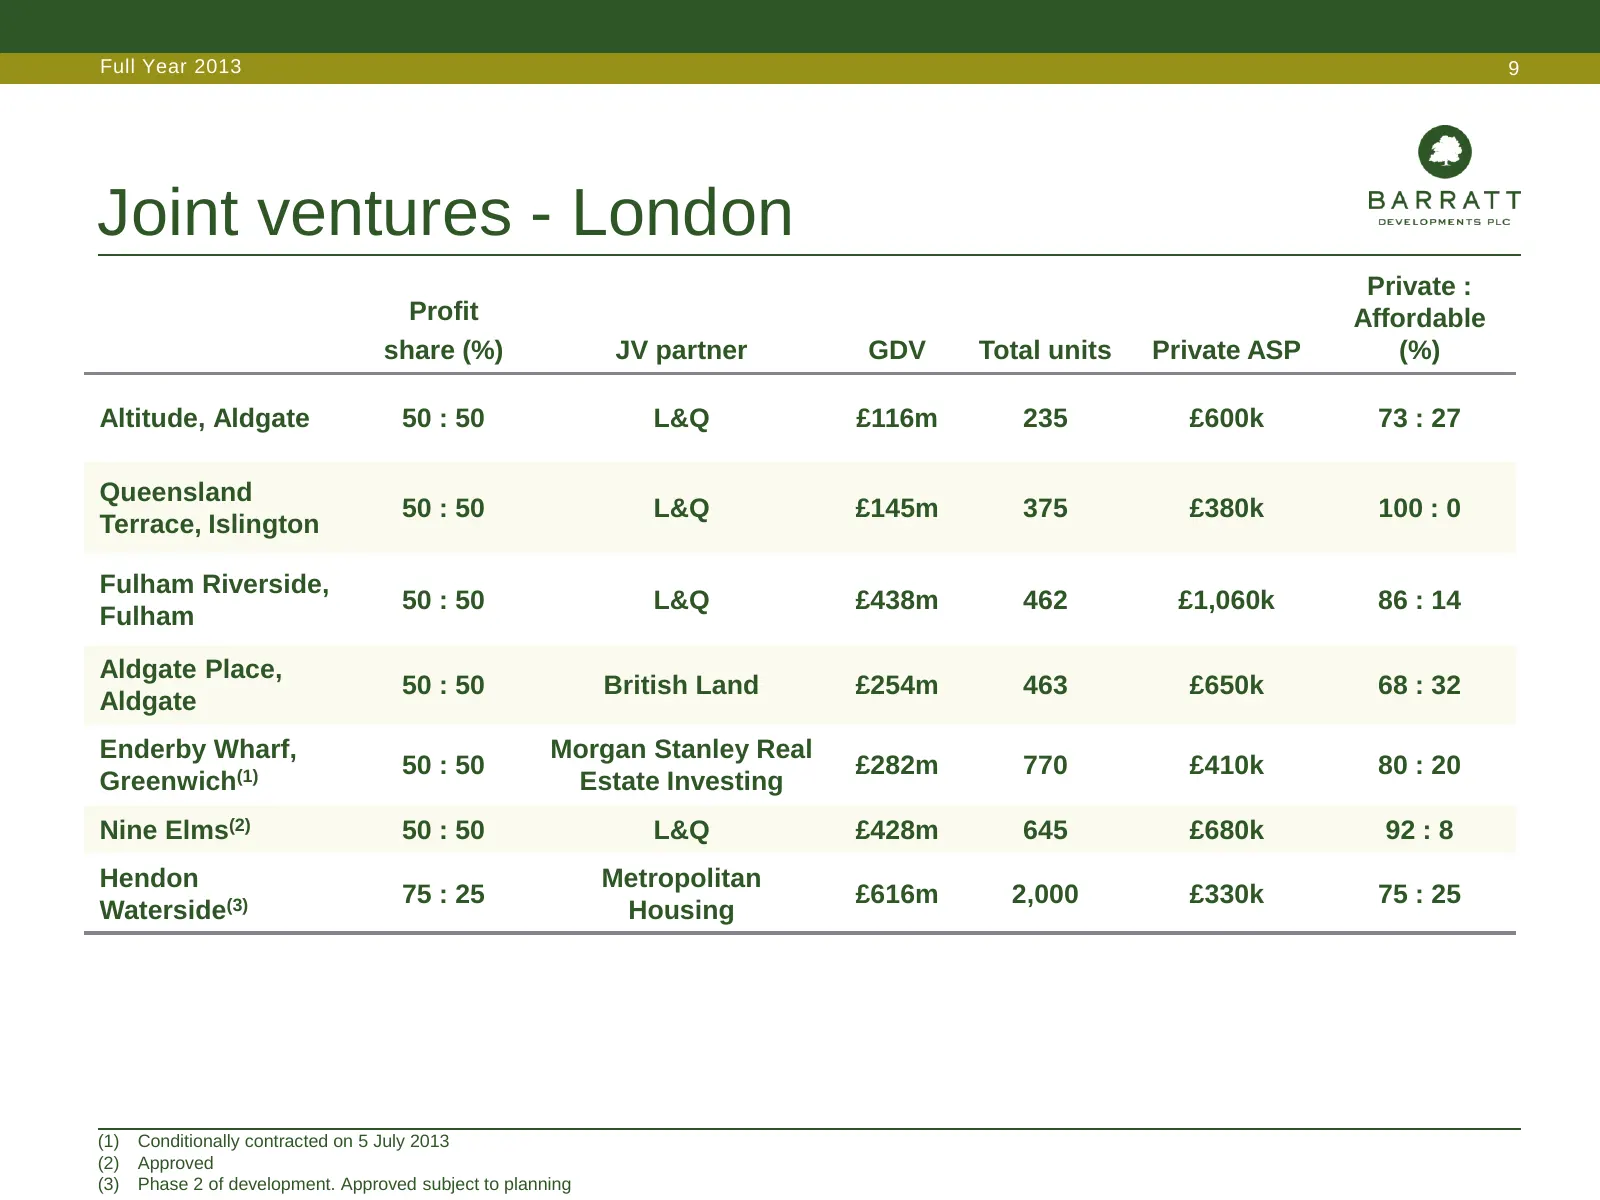
Full Year 2013 9 Joint ventures - London Private : Profit Affordable share (%) JV partner GDV Total units Private ASP (%) Altitude, Aldgate 50 : 50 L&Q £116m 235 £600k 73 : 27 Queensland 50 : 50 L&Q £145m 375 £380k 100 : 0 Terrace, Islington Fulham Riverside, 50 : 50 L&Q £438m 462 £1,060k 86 : 14 Fu
Slide 10: London joint venture delivery profile
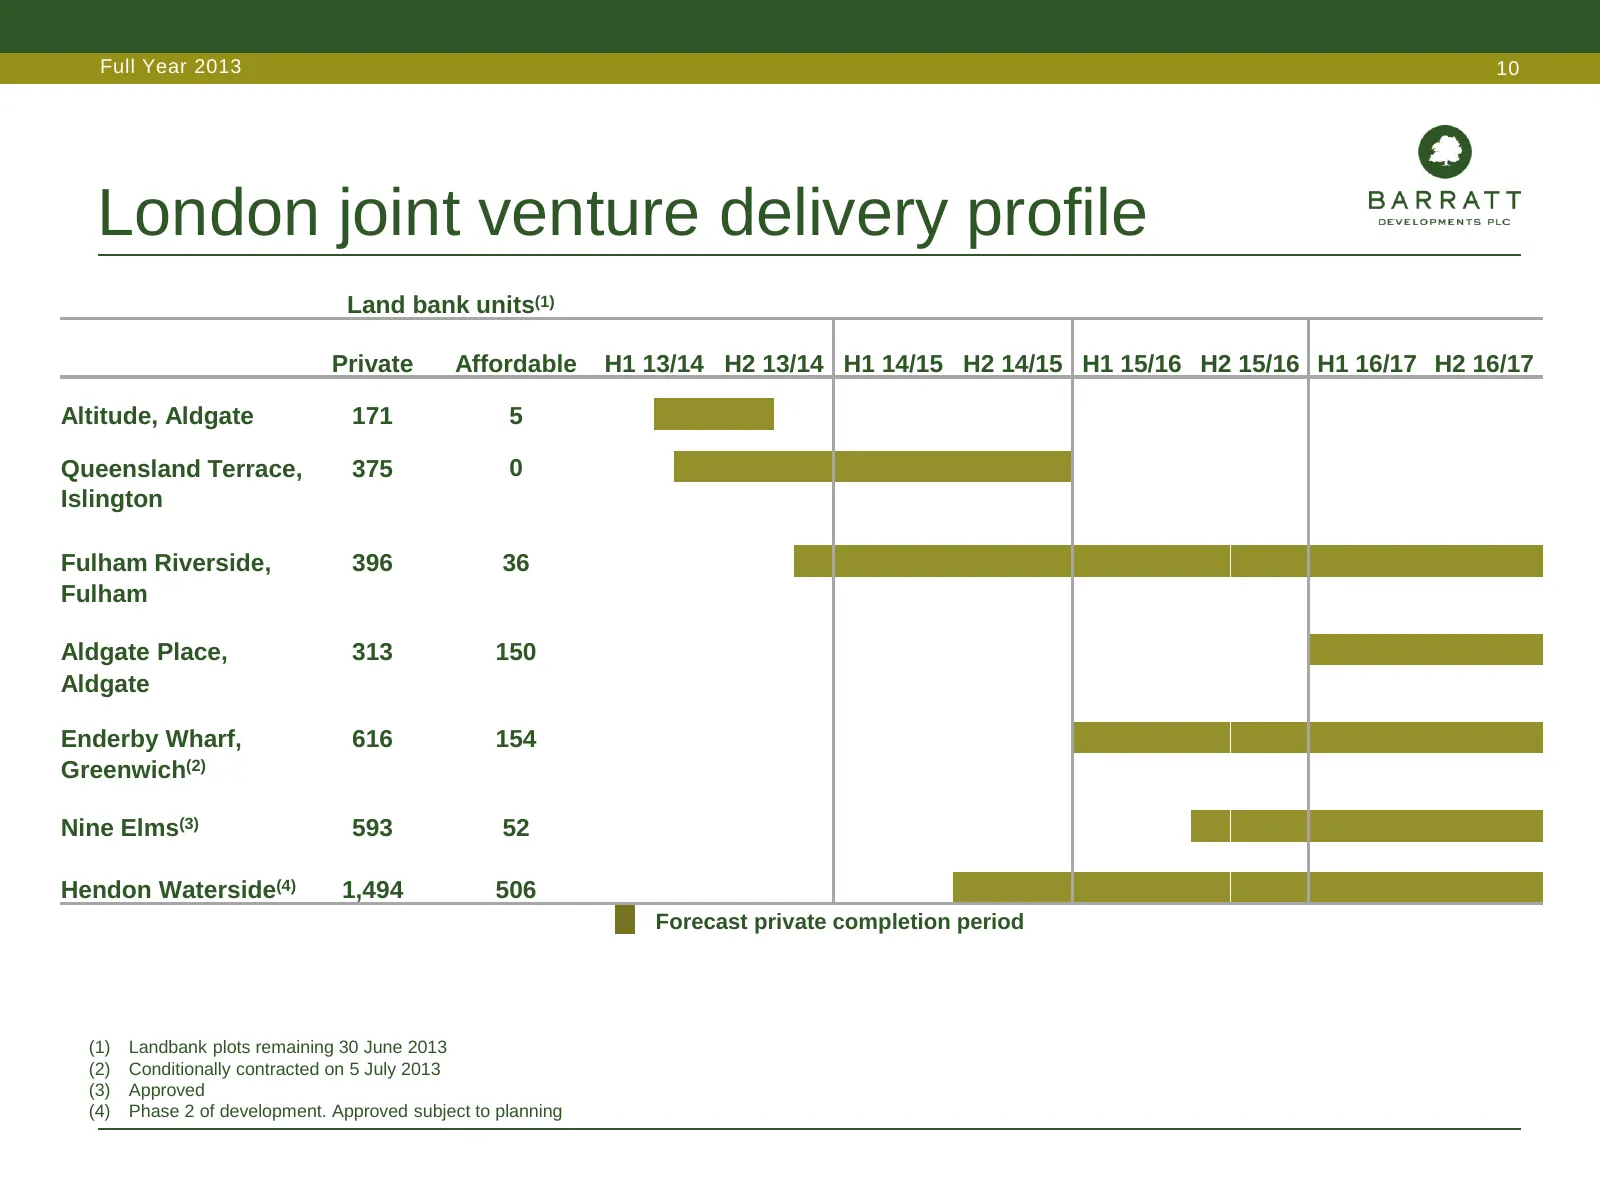
Full Year 2013 10 London joint venture delivery profile Land bank units(1) Private Affordable H1 13/14 H2 13/14 H1 14/15 H2 14/15 H1 15/16 H2 15/16 H1 16/17 H2 16/17 Altitude, Aldgate 171 5 Queensland Terrace, 375 0 Islington Fulham Riverside, 396 36 Fulham Aldgate Place, 313 150 Aldgate Enderby Wha
Slide 11: Joint ventures - performance
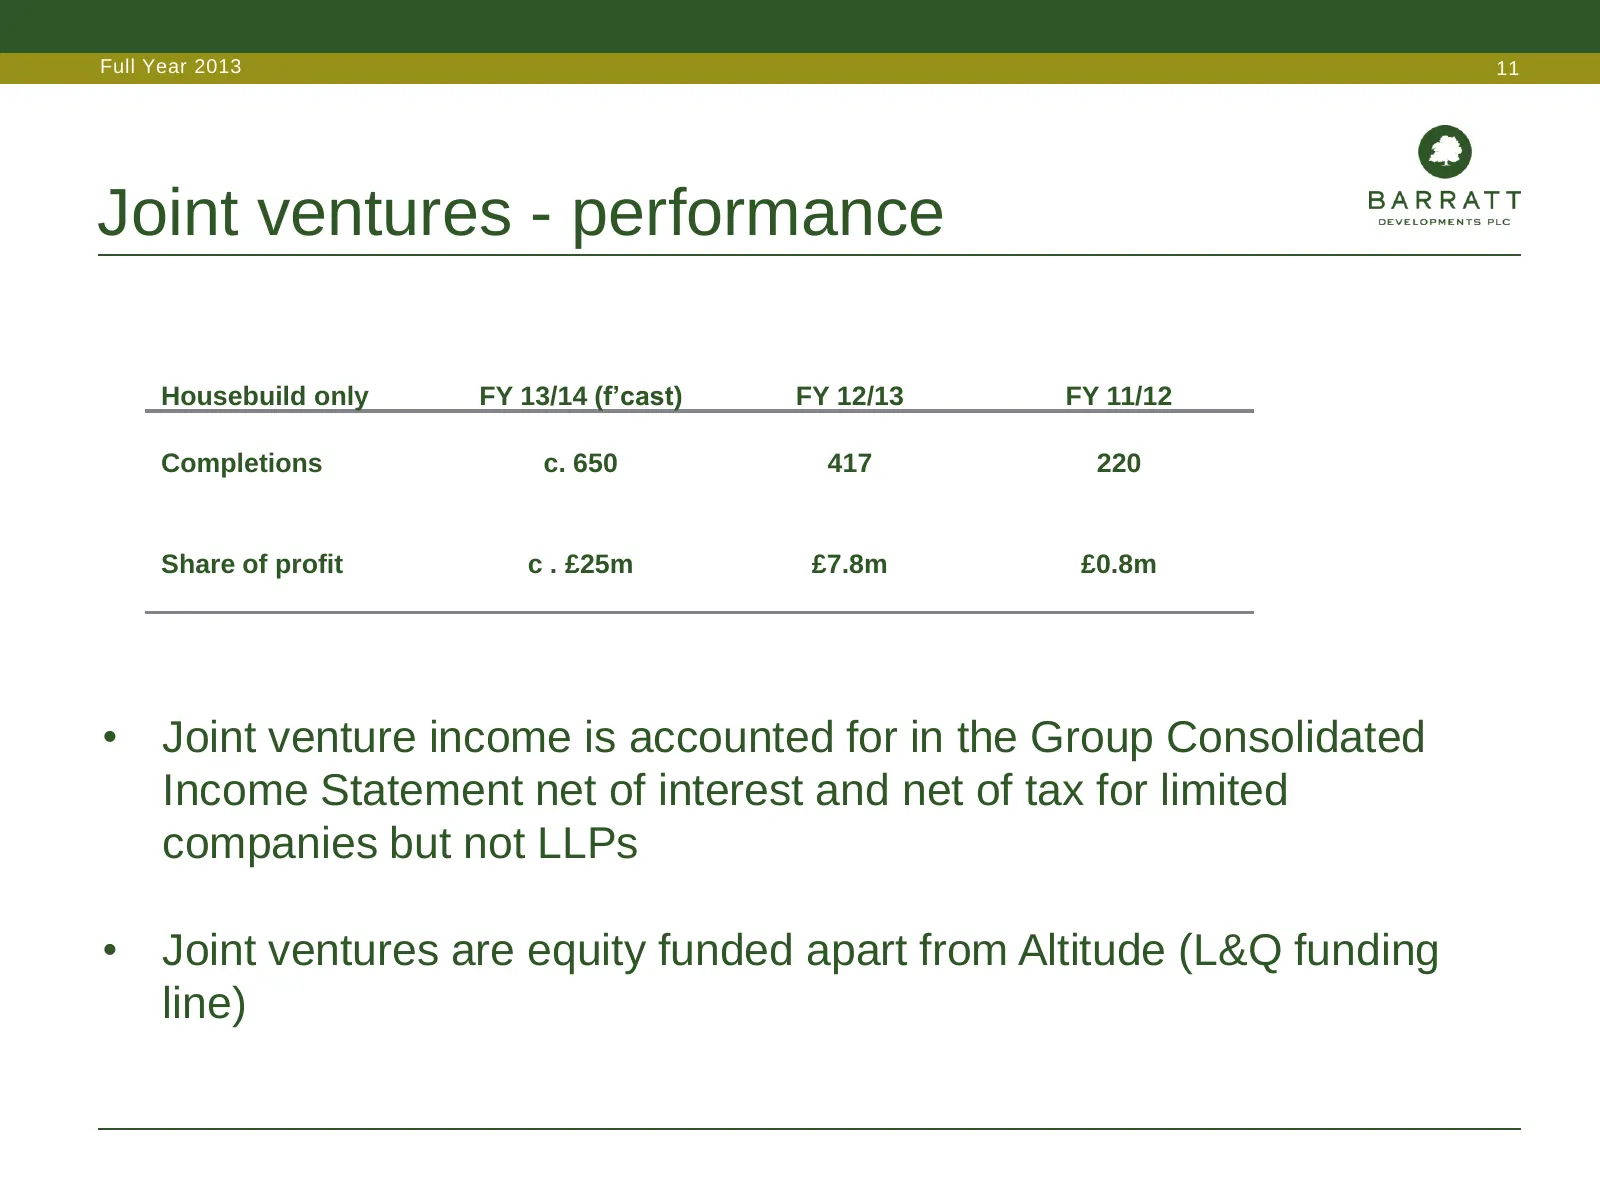
Full Year 2013 11 Joint ventures - performance Housebuild only FY 13/14 (f’cast) FY 12/13 FY 11/12 Completions c. 650 417 220 Share of profit c . £25m £7.8m £0.8m • Joint venture income is accounted for in the Group Consolidated Income Statement net of interest and net of tax for limited companies b
Slide 12: Cash flow
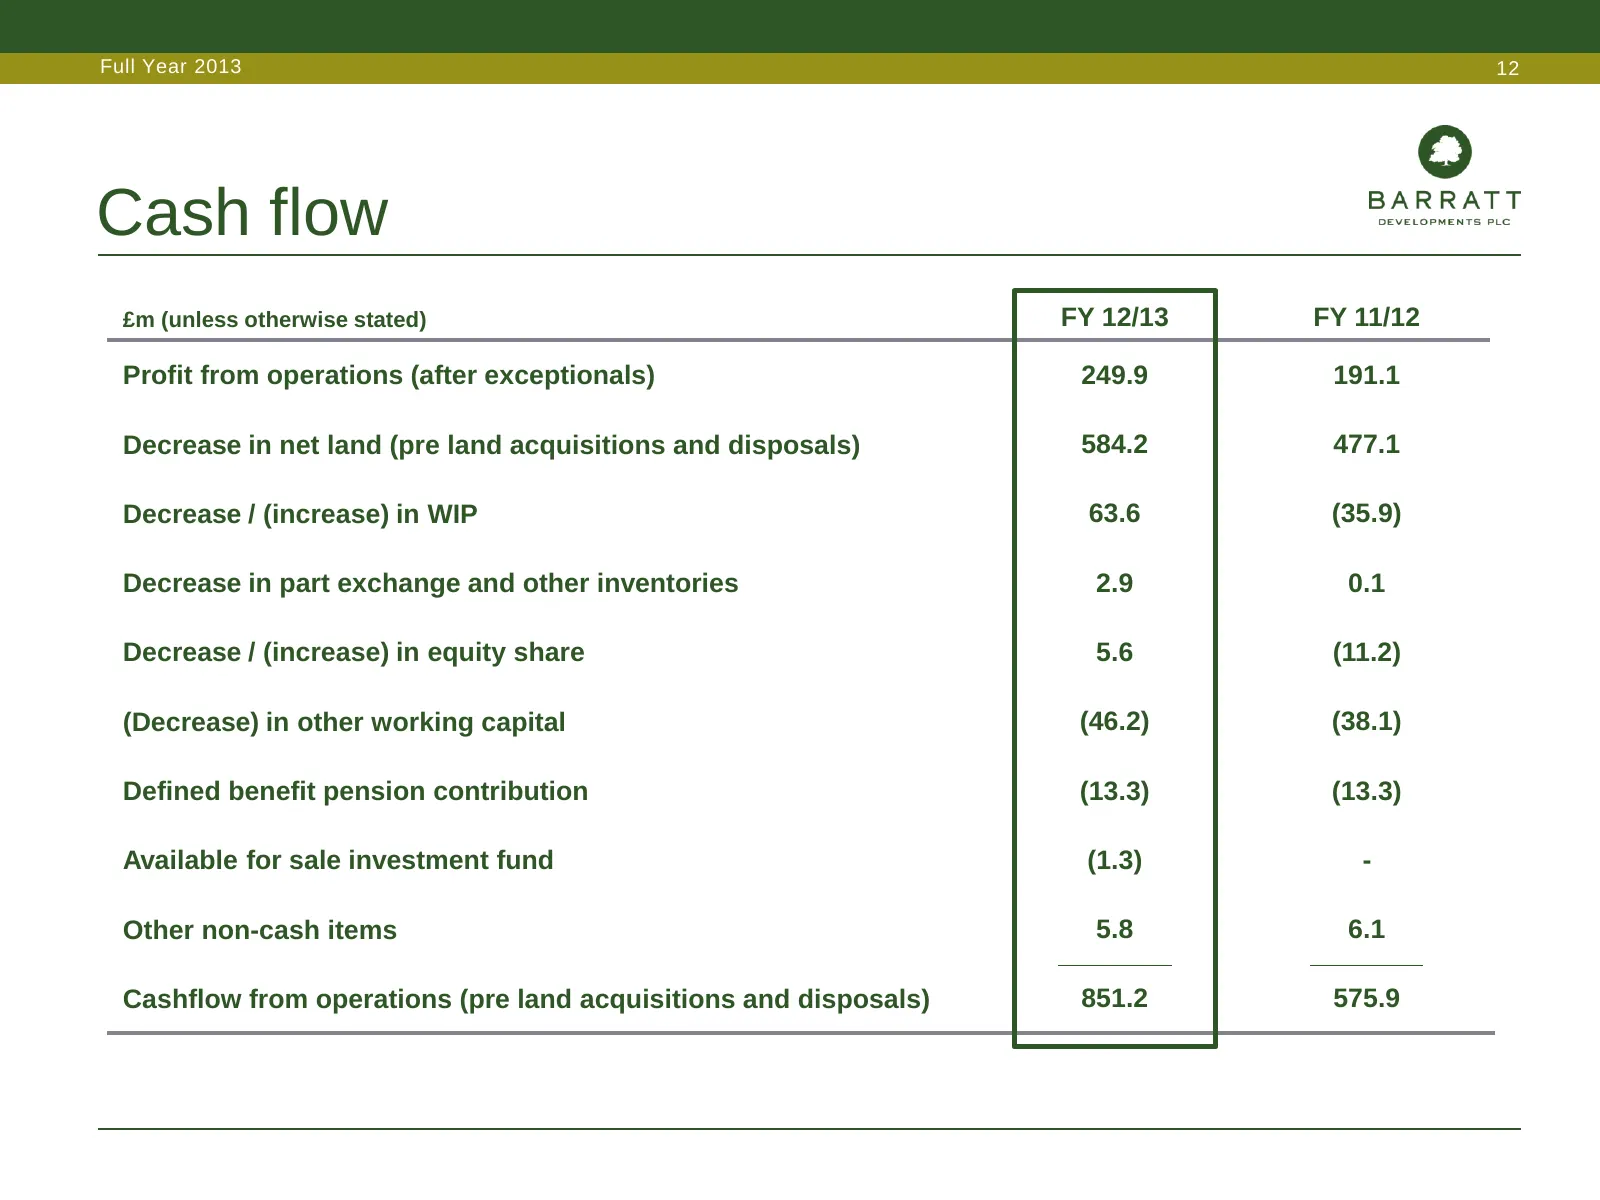
Full Year 2013 12 Cash flow £m (unless otherwise stated) FY 12/13 FY 11/12 Profit from operations (after exceptionals) 249.9 191.1 Decrease in net land (pre land acquisitions and disposals) 584.2 477.1 Decrease / (increase) in WIP 63.6 (35.9) Decrease in part exchange and other inventories 2.9 0.1 D
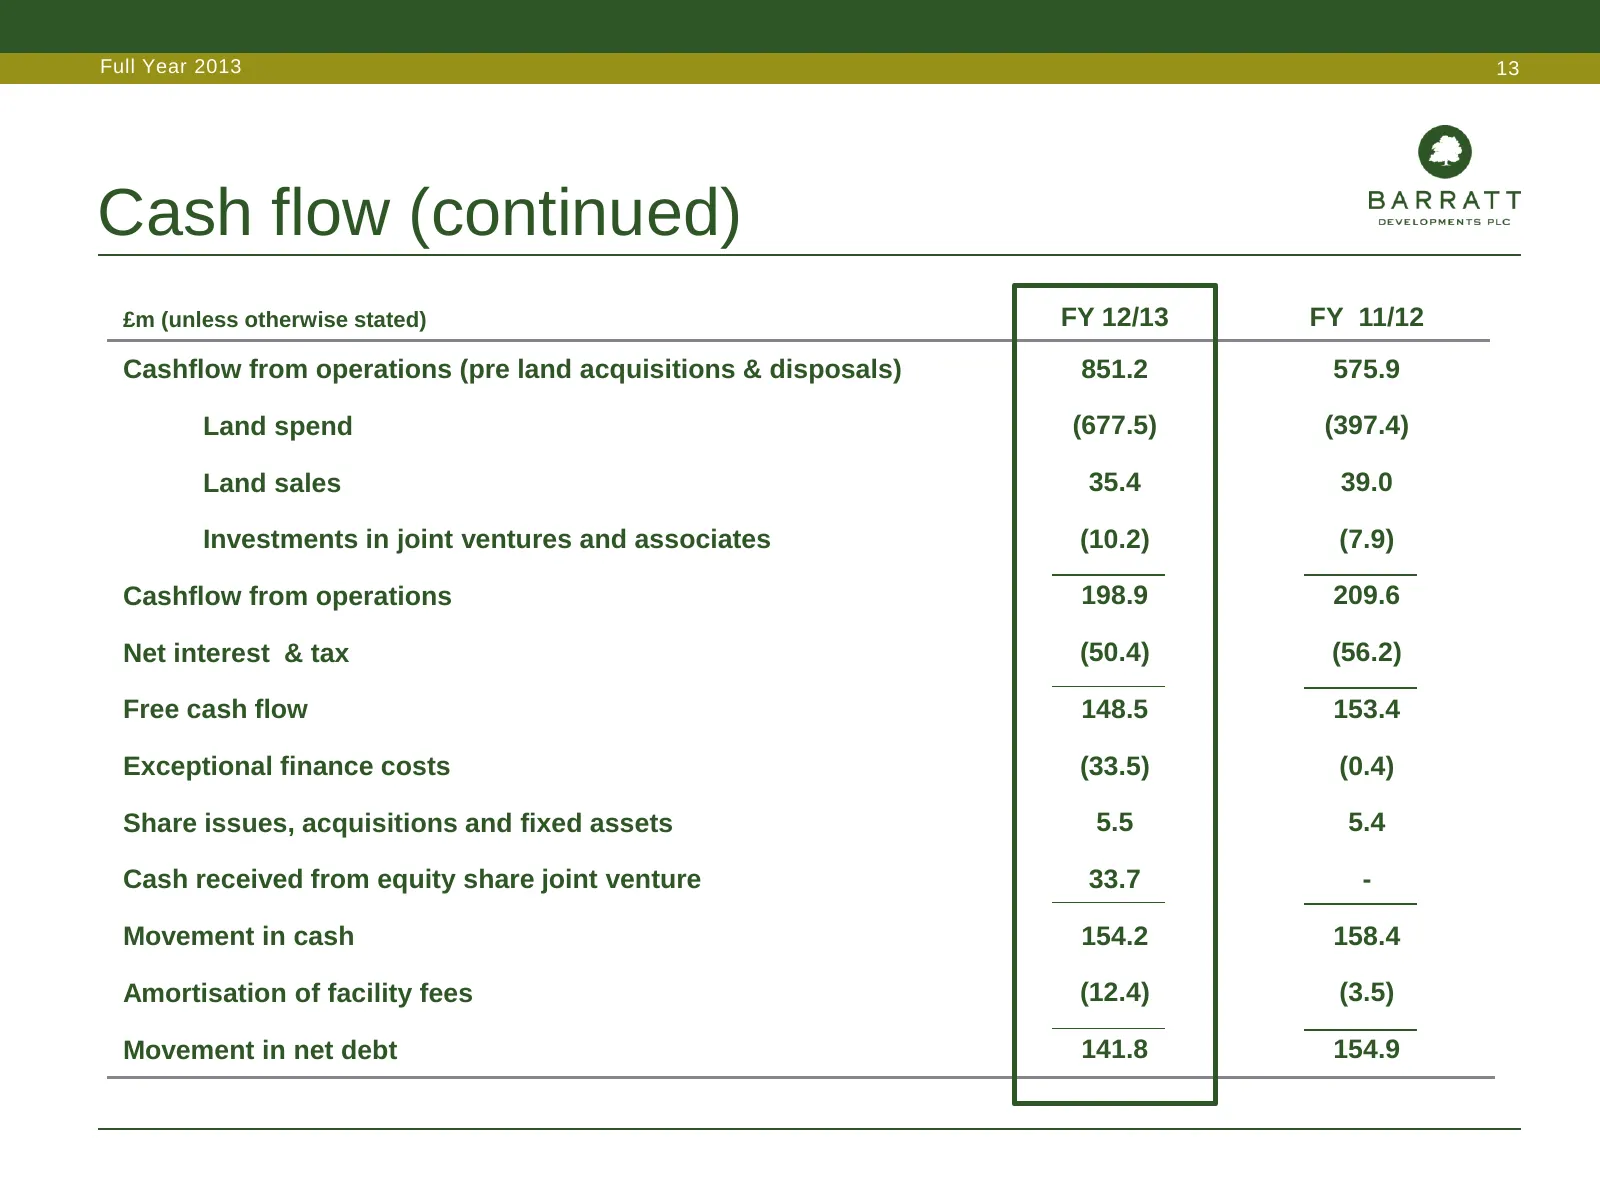
Slide 13: Cash flow (continued)
Full Year 2013 13 Cash flow (continued) £m (unless otherwise stated) FY 12/13 FY 11/12 Cashflow from operations (pre land acquisitions & disposals) 851.2 575.9 Land spend (677.5) (397.4) Land sales 35.4 39.0 Investments in joint ventures and associates (10.2) (7.9) Cashflow from operations 198.9 209
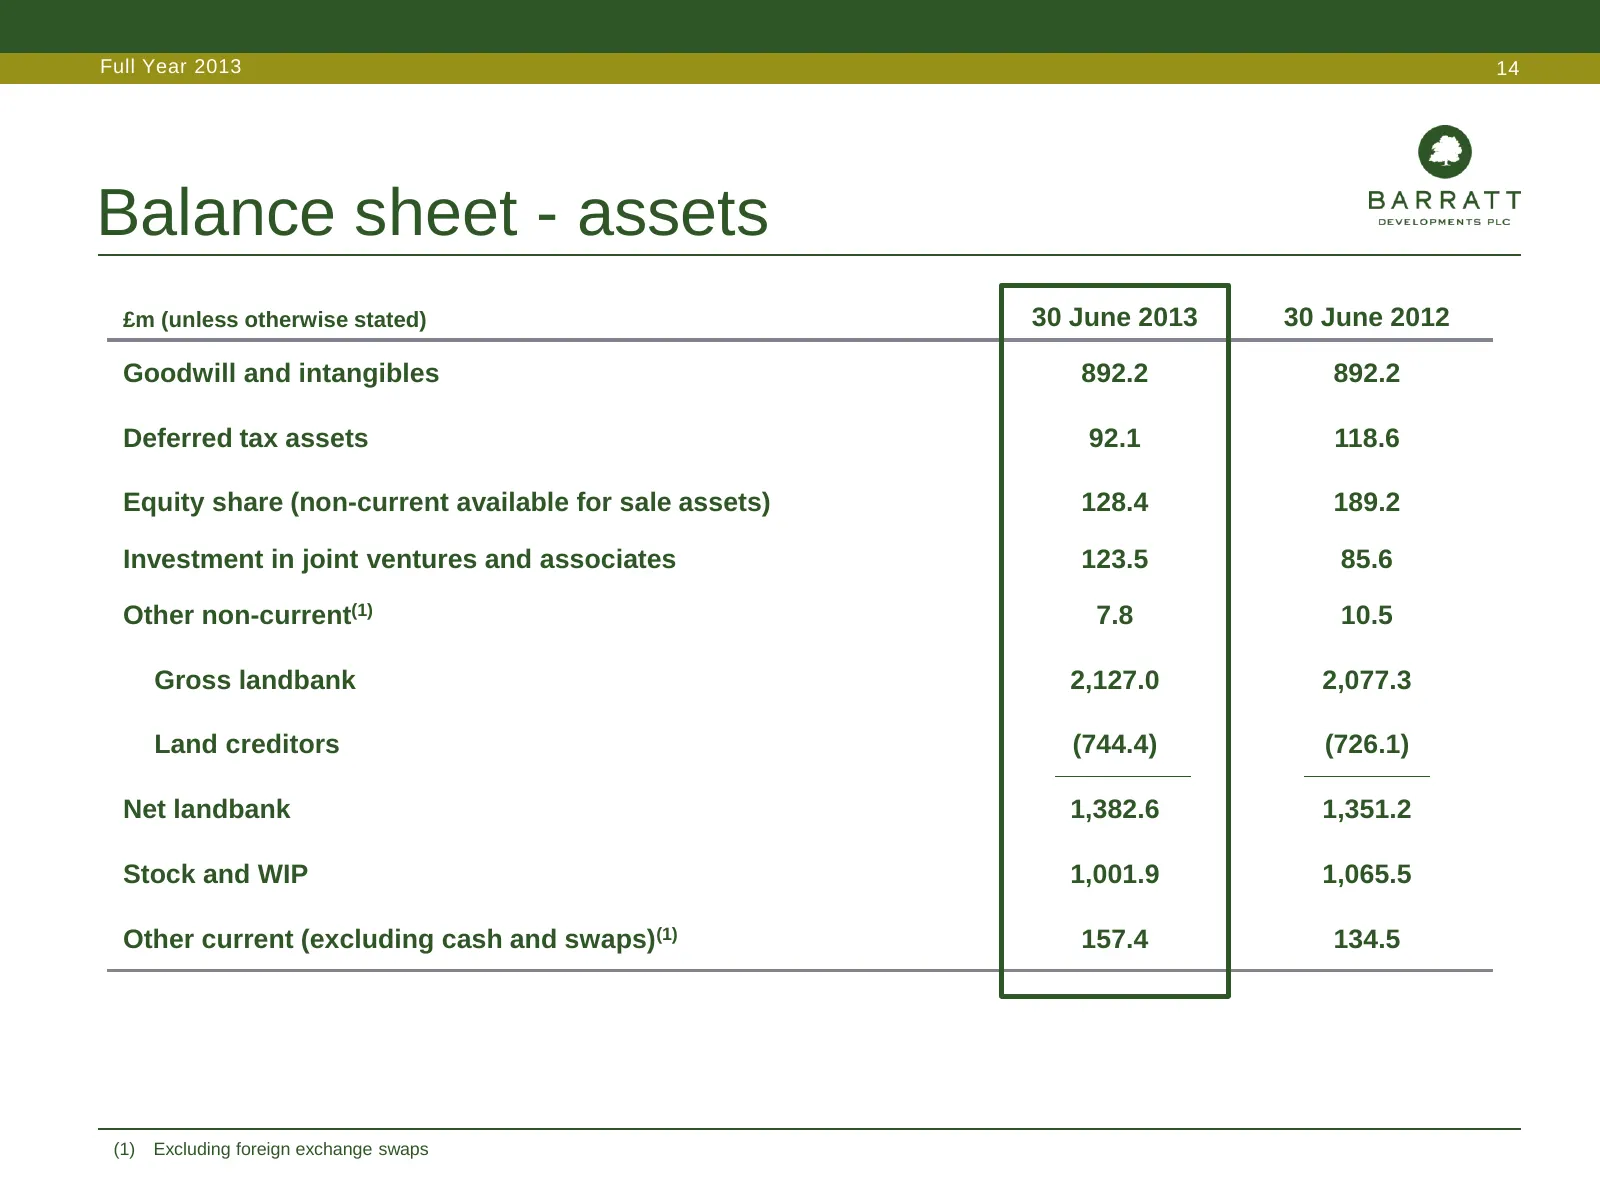
Slide 14: Balance sheet - assets
Full Year 2013 14 Balance sheet - assets £m (unless otherwise stated) 30 June 2013 30 June 2012 Goodwill and intangibles 892.2 892.2 Deferred tax assets 92.1 118.6 Equity share (non-current available for sale assets) 128.4 189.2 Investment in joint ventures and associates 123.5 85.6 Other non-curren
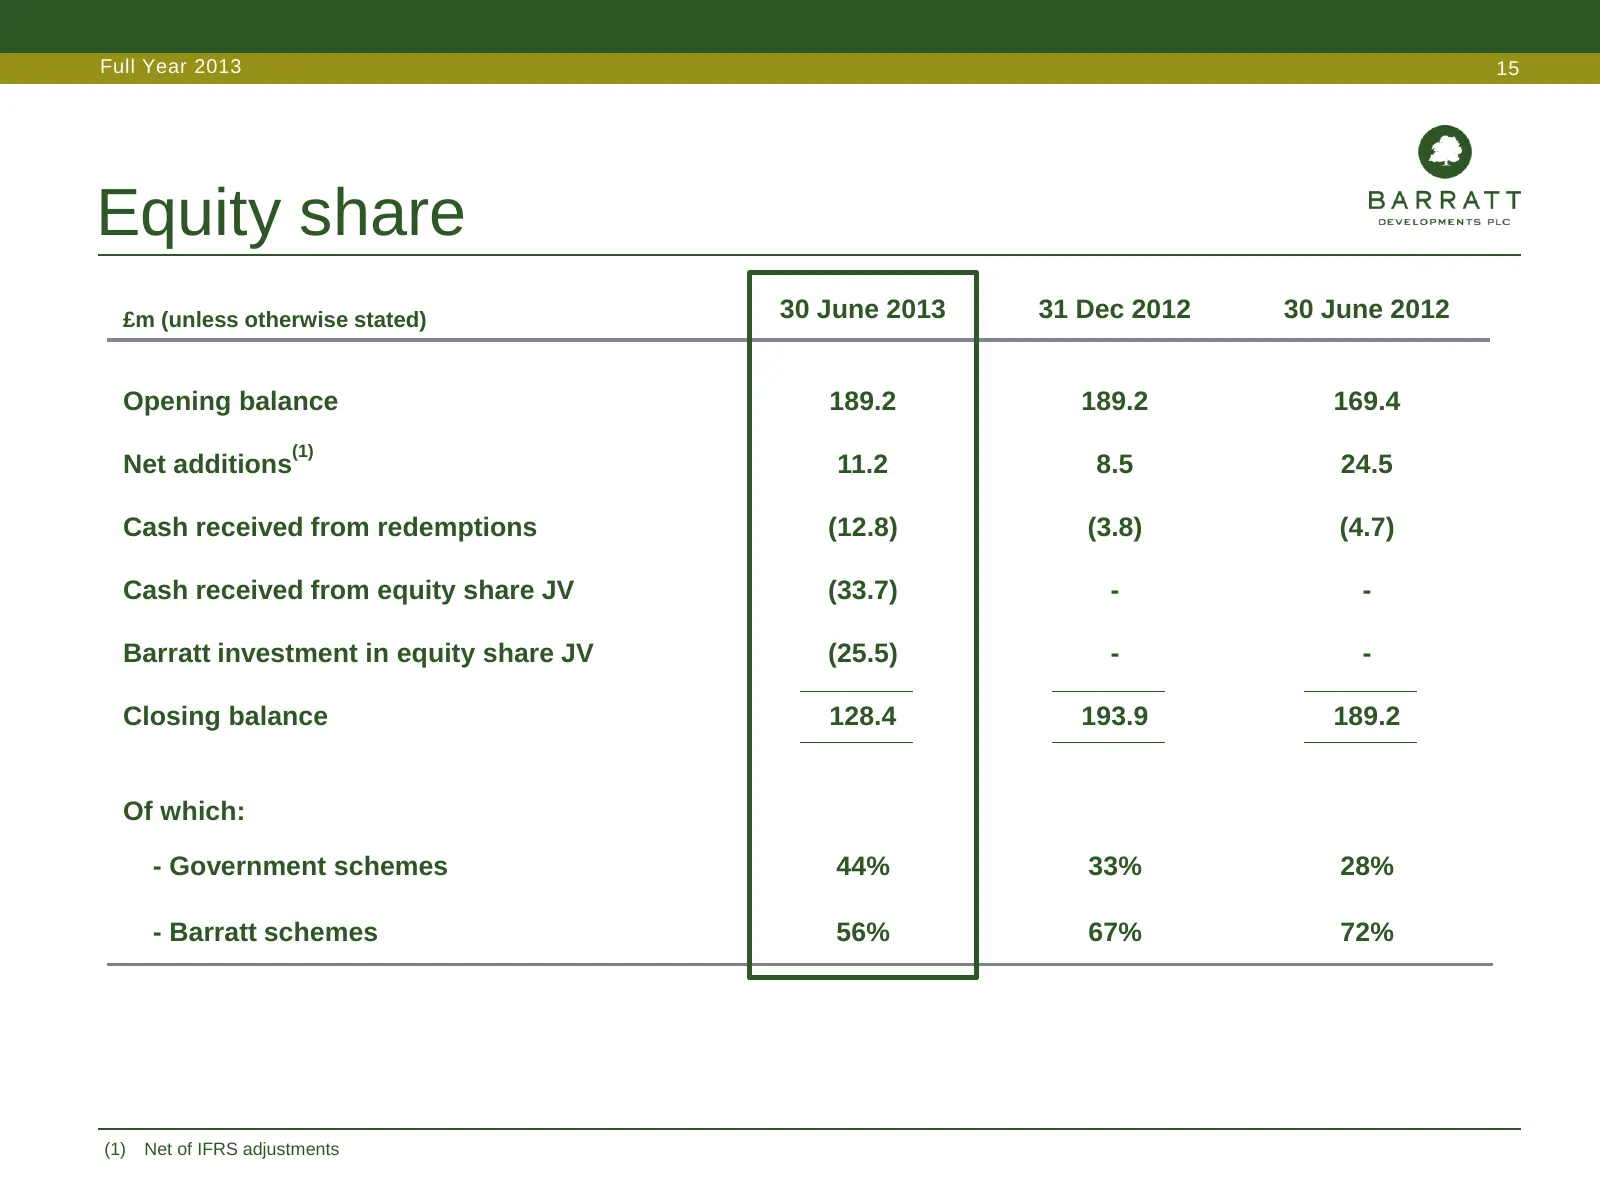
Slide 15: Equity share
Full Year 2013 15 Equity share £m (unless otherwise stated) 30 June 2013 31 Dec 2012 30 June 2012 Opening balance 189.2 189.2 169.4 (1) Net additions 11.2 8.5 24.5 Cash received from redemptions (12.8) (3.8) (4.7) Cash received from equity share JV (33.7) - - Barratt investment in equity share JV (2
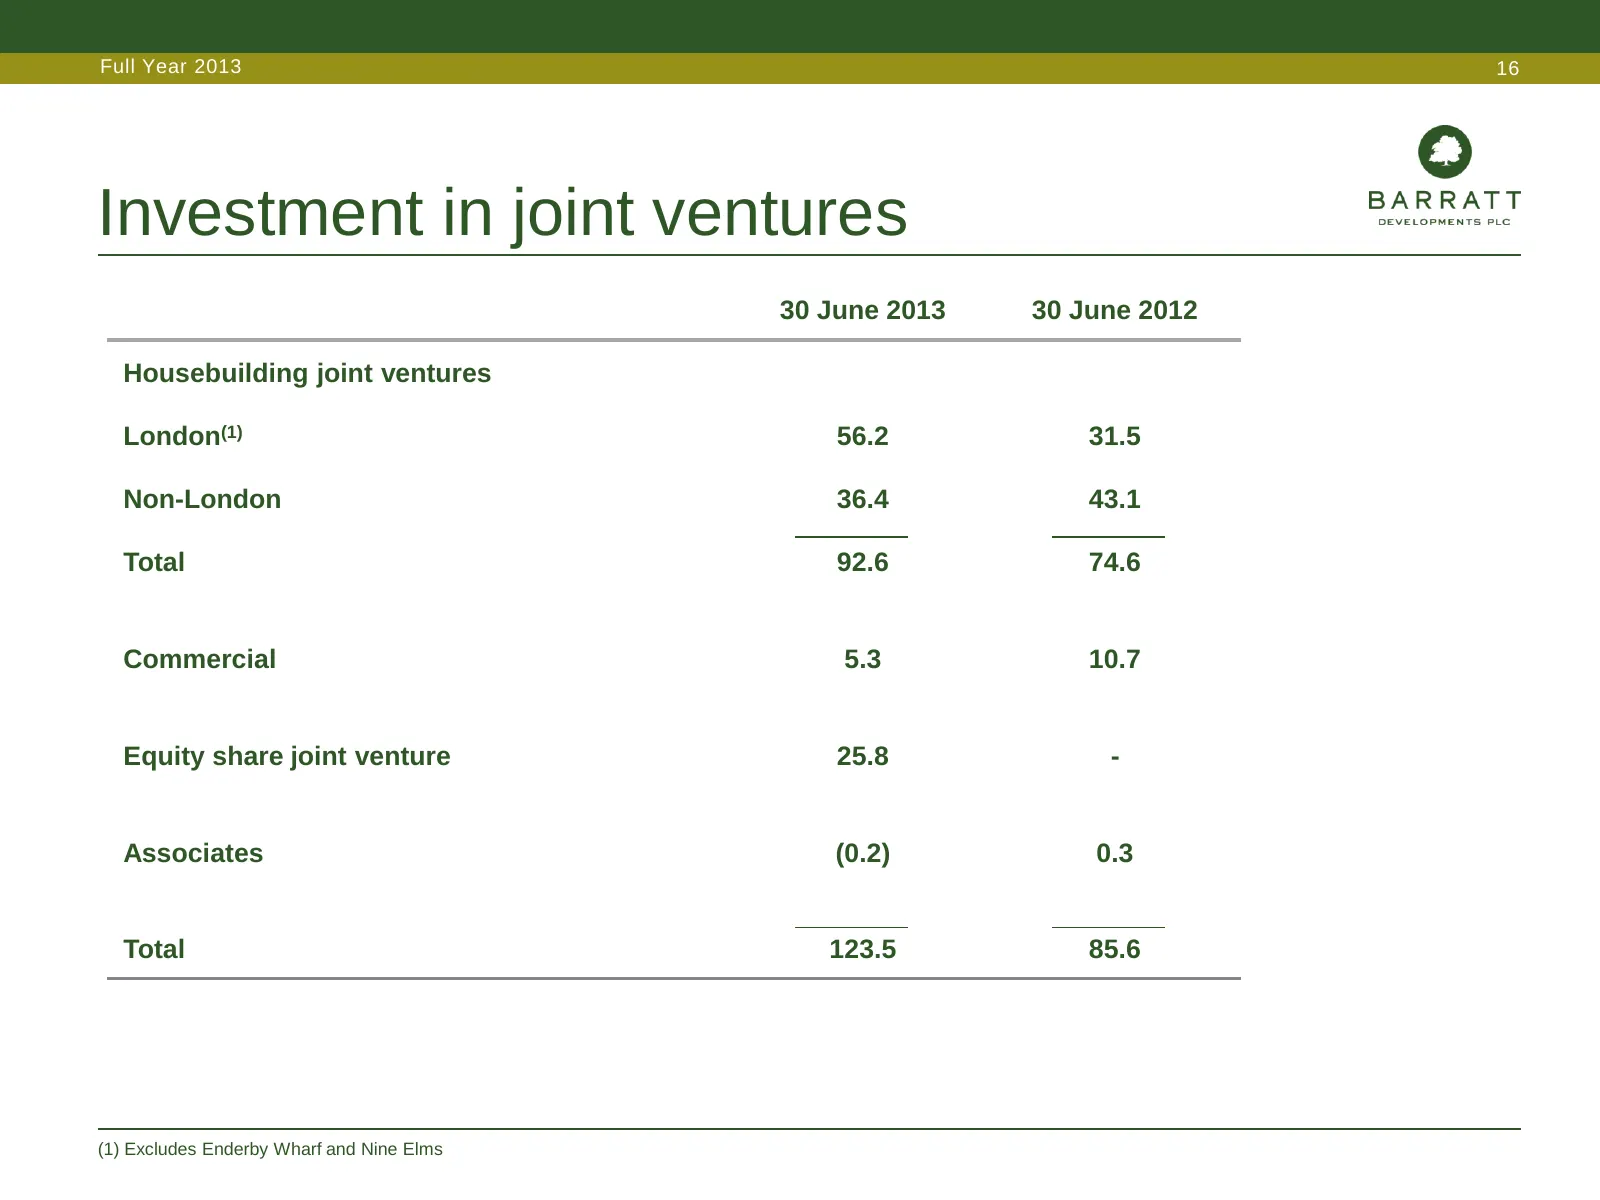
Slide 16: Investment in joint ventures
Full Year 2013 16 Investment in joint ventures 30 June 2013 30 June 2012 Housebuilding joint ventures London(1) 56.2 31.5 Non-London 36.4 43.1 Total 92.6 74.6 Commercial 5.3 10.7 Equity share joint venture 25.8 - Associates (0.2) 0.3 Total 123.5 85.6 (1) Excludes Enderby Wharf and Nine Elms
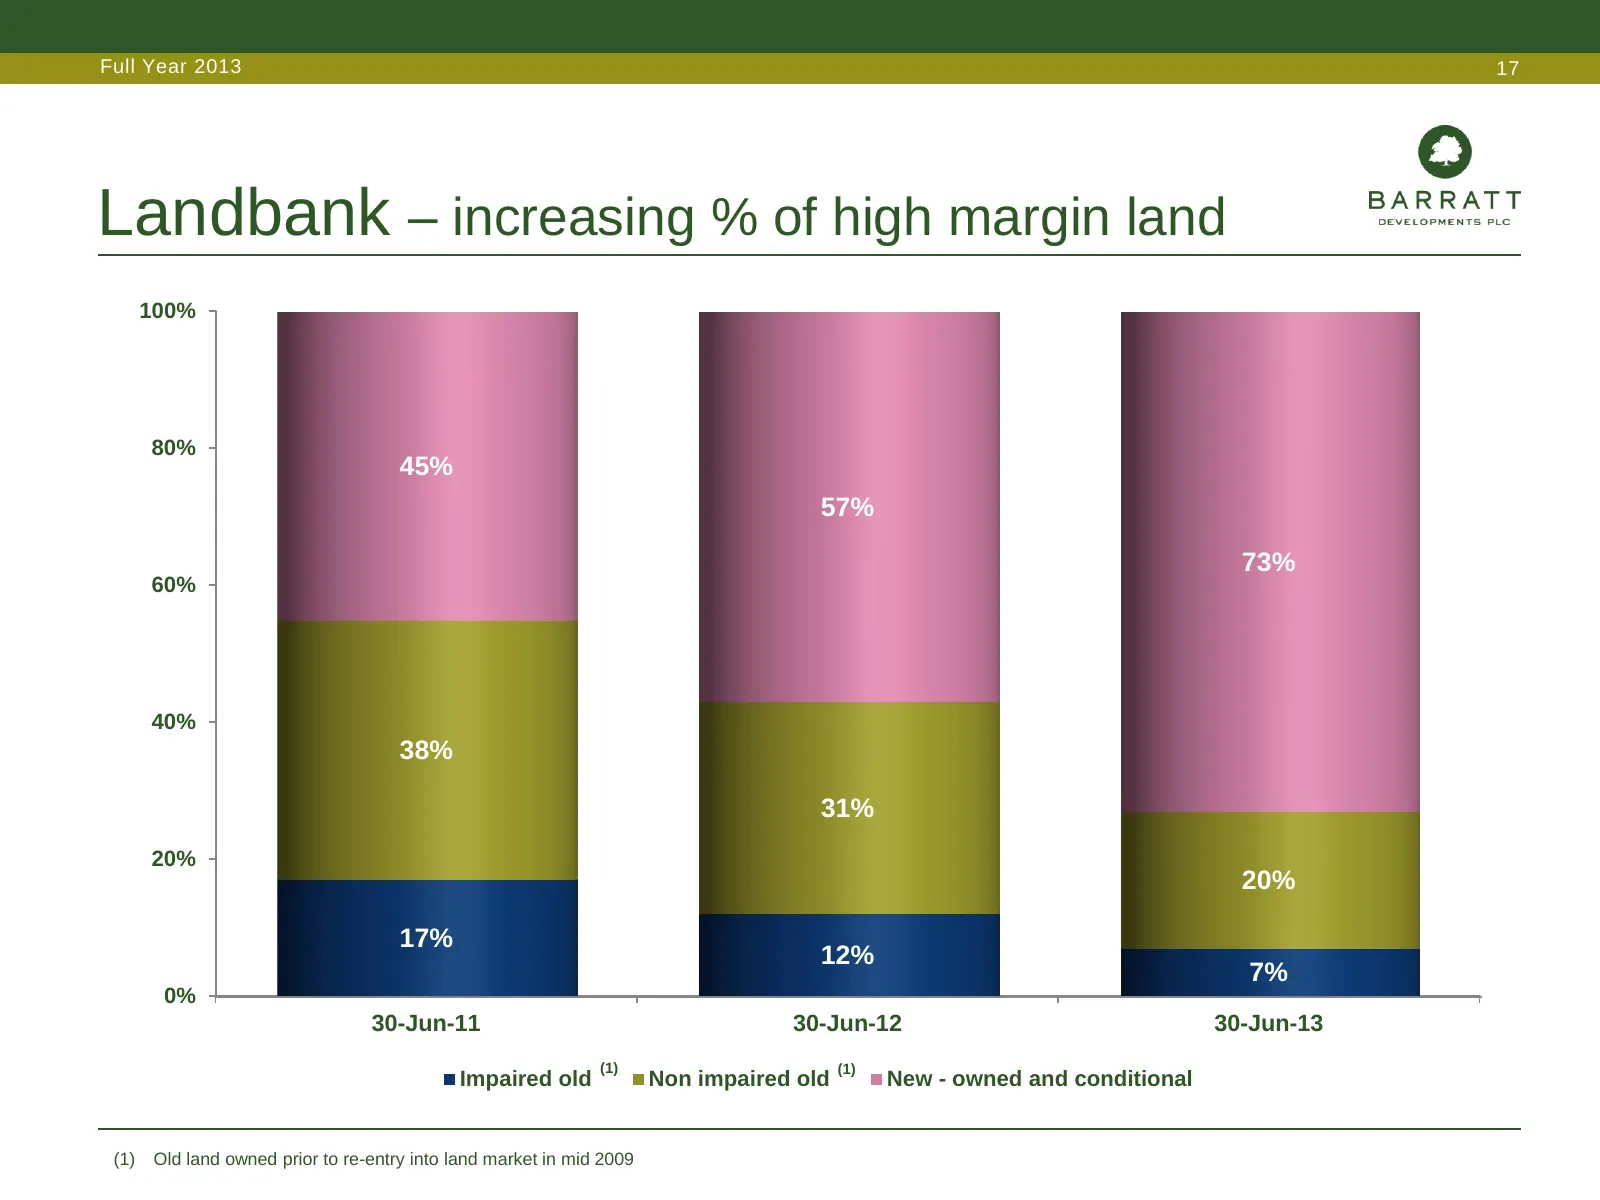
Slide 17: Landbank – increasing % of high margin land
Full Year 2013 17 Landbank – increasing % of high margin land 100% 80% 45% 57% 73% 60% 40% 38% 31% 20% 20% 17% 12% 7% 0% 30-Jun-11 30-Jun-12 30-Jun-13 (1) (1) Impaired old Non impaired old New - owned and conditional (1) Old land owned prior to re-entry into land market in mid 2009
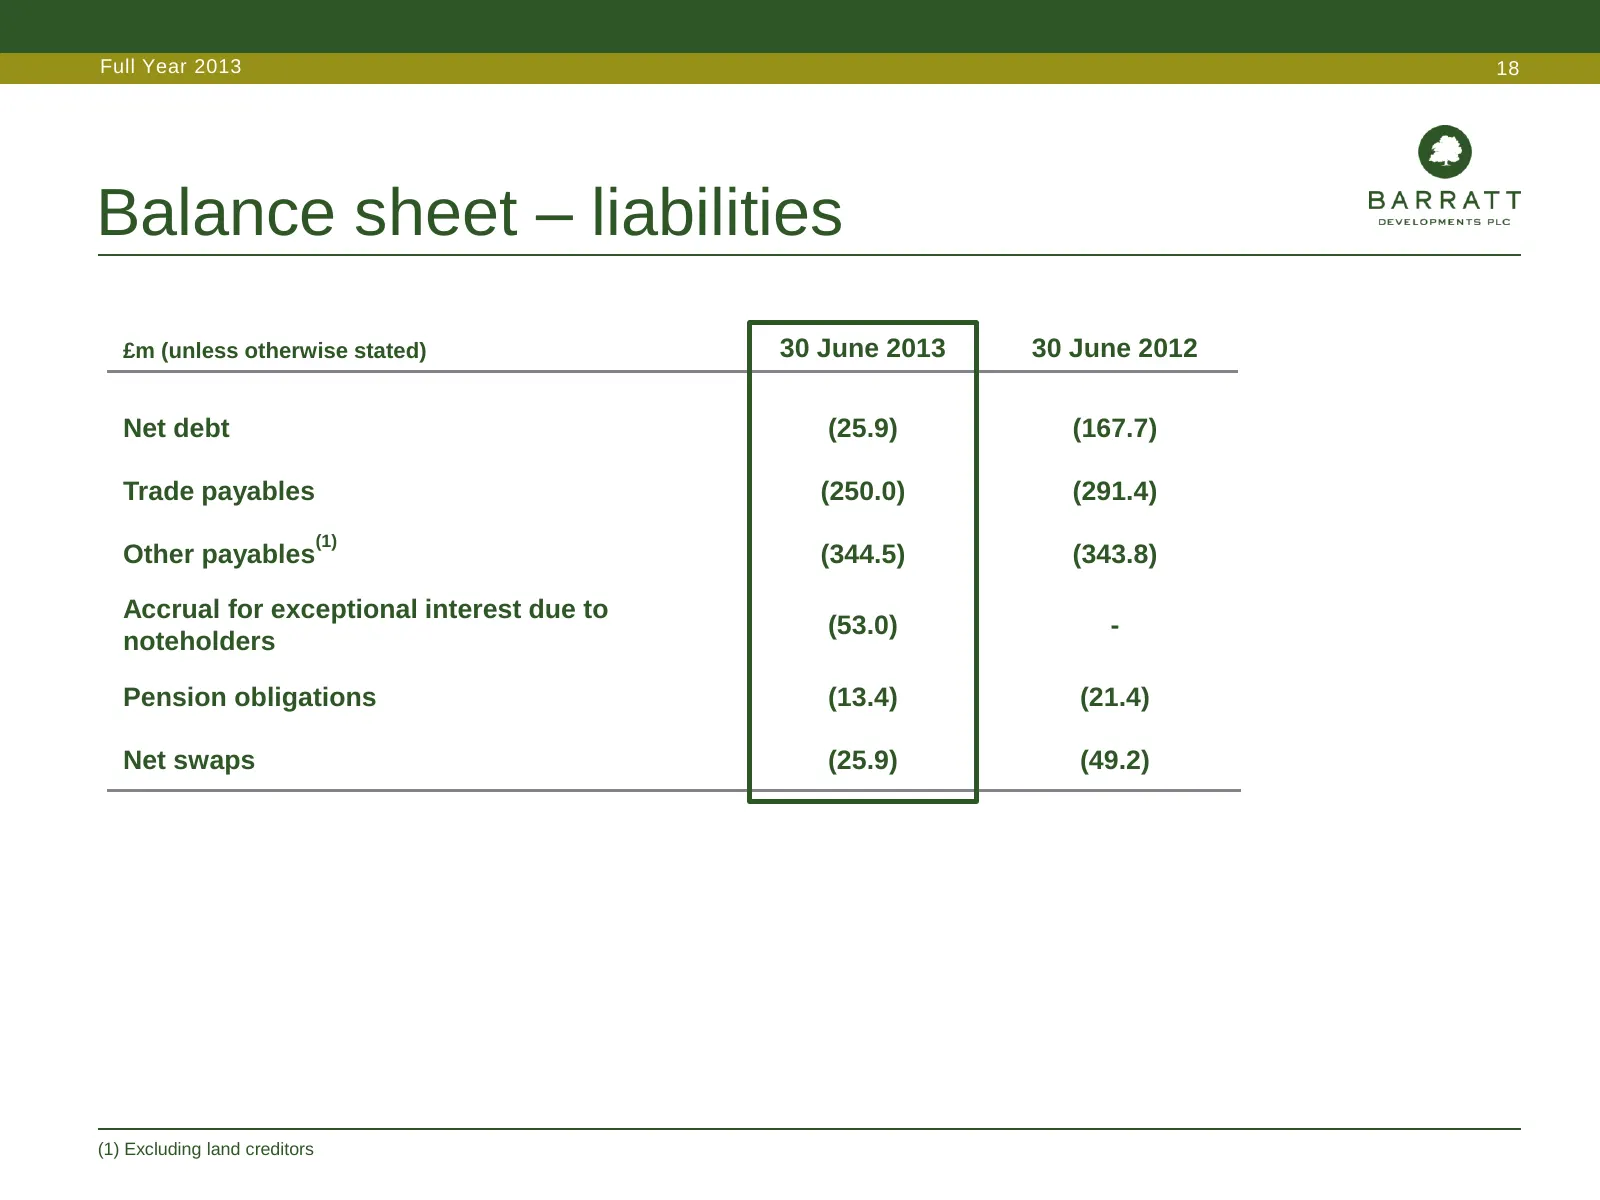
Slide 18: Balance sheet – liabilities
Full Year 2013 18 Balance sheet – liabilities £m (unless otherwise stated) 30 June 2013 30 June 2012 Net debt (25.9) (167.7) Trade payables (250.0) (291.4) (1) Other payables (344.5) (343.8) Accrual for exceptional interest due to (53.0) - noteholders Pension obligations (13.4) (21.4) Net swaps (25.
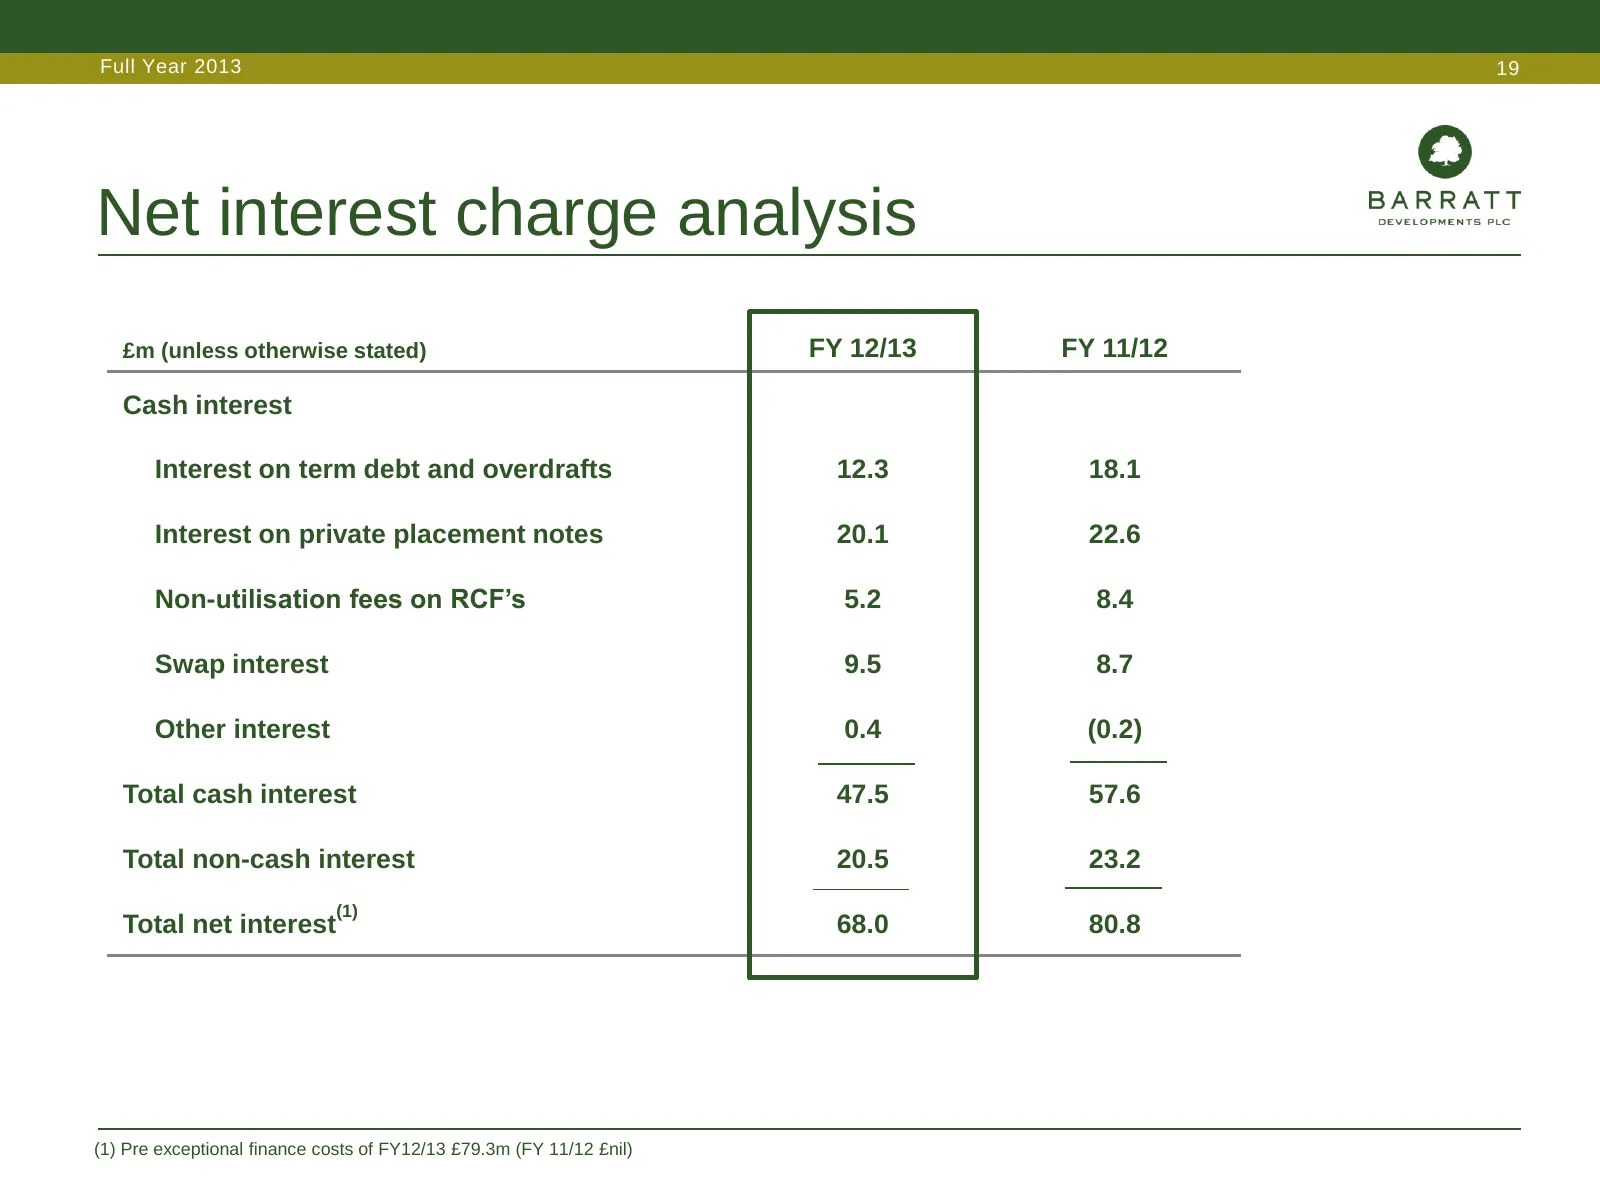
Slide 19: Net interest charge analysis
Full Year 2013 19 Net interest charge analysis £m (unless otherwise stated) FY 12/13 FY 11/12 Cash interest Interest on term debt and overdrafts 12.3 18.1 Interest on private placement notes 20.1 22.6 Non-utilisation fees on RCF’s 5.2 8.4 Swap interest 9.5 8.7 Other interest 0.4 (0.2) Total cash int
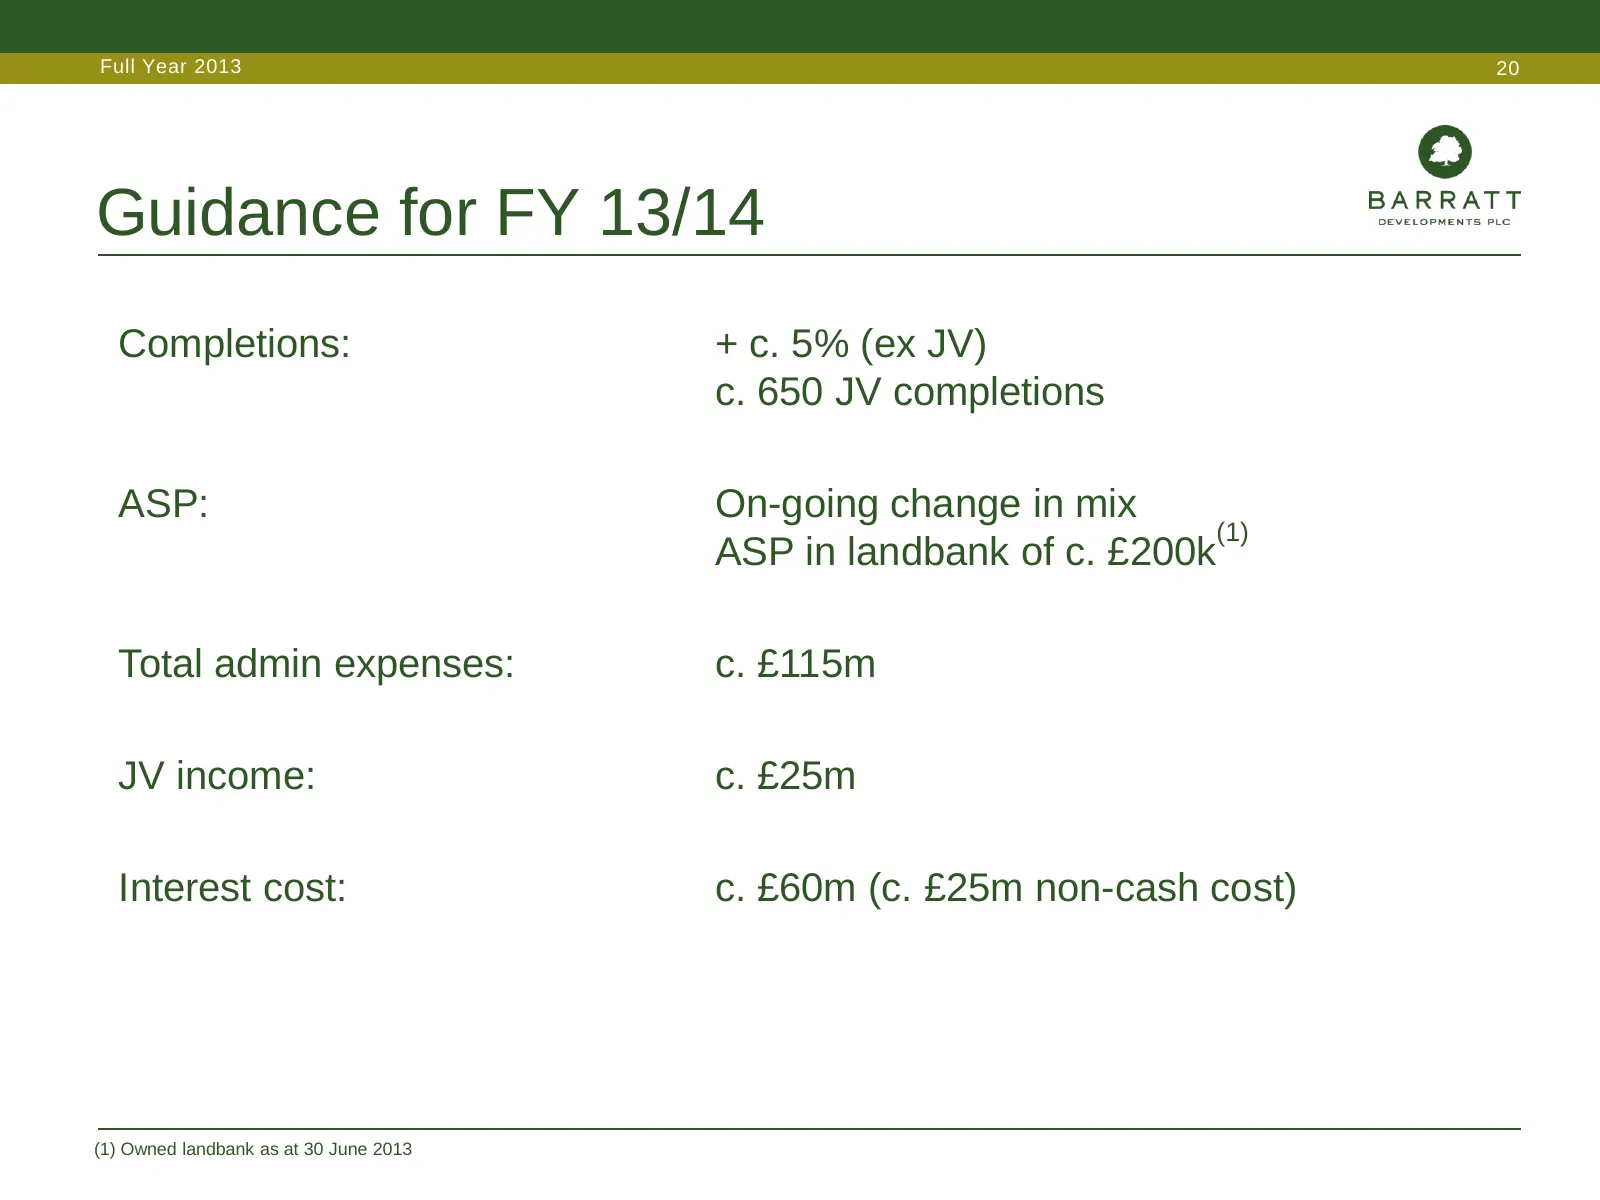
Slide 20: Guidance for FY 13/14
Full Year 2013 20 Guidance for FY 13/14 Completions: + c. 5% (ex JV) c. 650 JV completions ASP: On-going change in mix (1) ASP in landbank of c. £200k Total admin expenses: c. £115m JV income: c. £25m Interest cost: c. £60m (c. £25m non-cash cost) (1) Owned landbank as at 30 June 2013
Slide 21: Steven Boyes, Group Chief Operating Officer
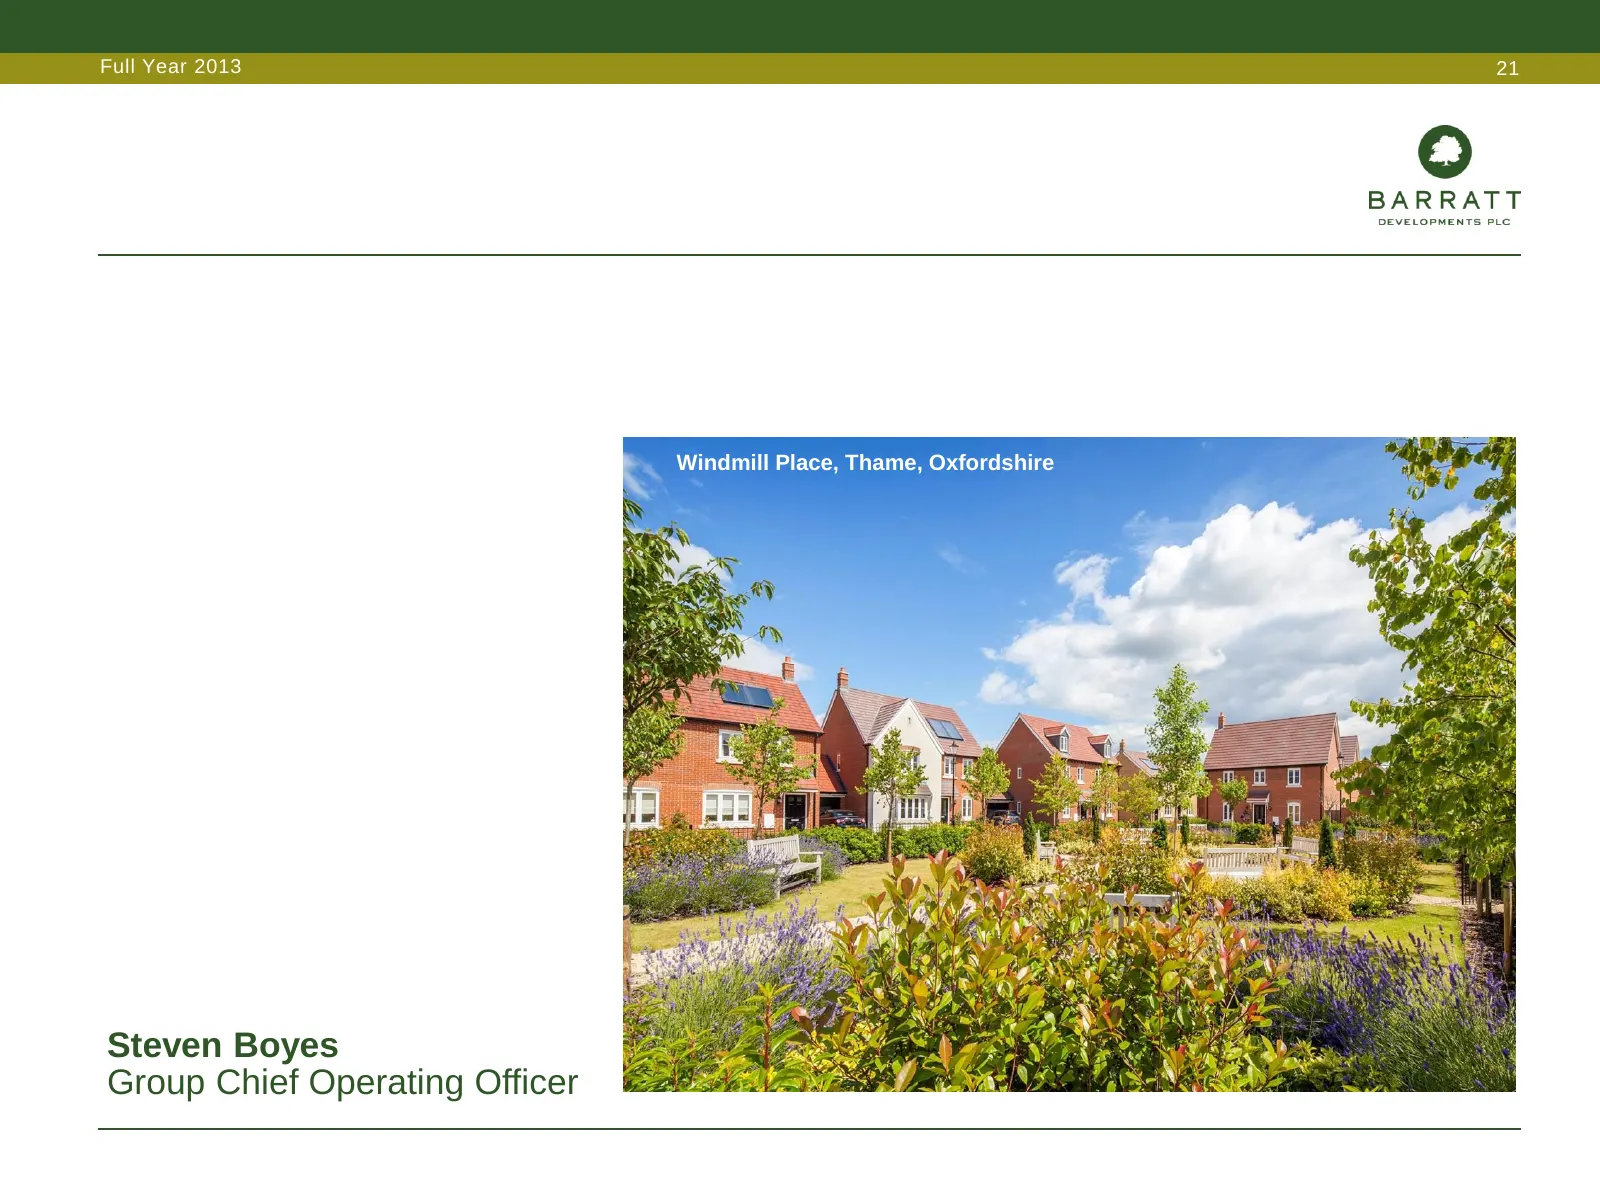
Full Year 2013 21 Windmill Place, Thame, Oxfordshire Steven Boyes Group Chief Operating Officer
Slide 22: Significantly improved performance
Full Year 2013 22 Significantly improved performance • Improved performance across all regions • Market conditions strengthened - Help to Buy accelerating recovery • Securing excellent land opportunities across all regions - significantly increased rate of land acquisition • Maintaining disciplined
Slide 23: Regional performance – private completions
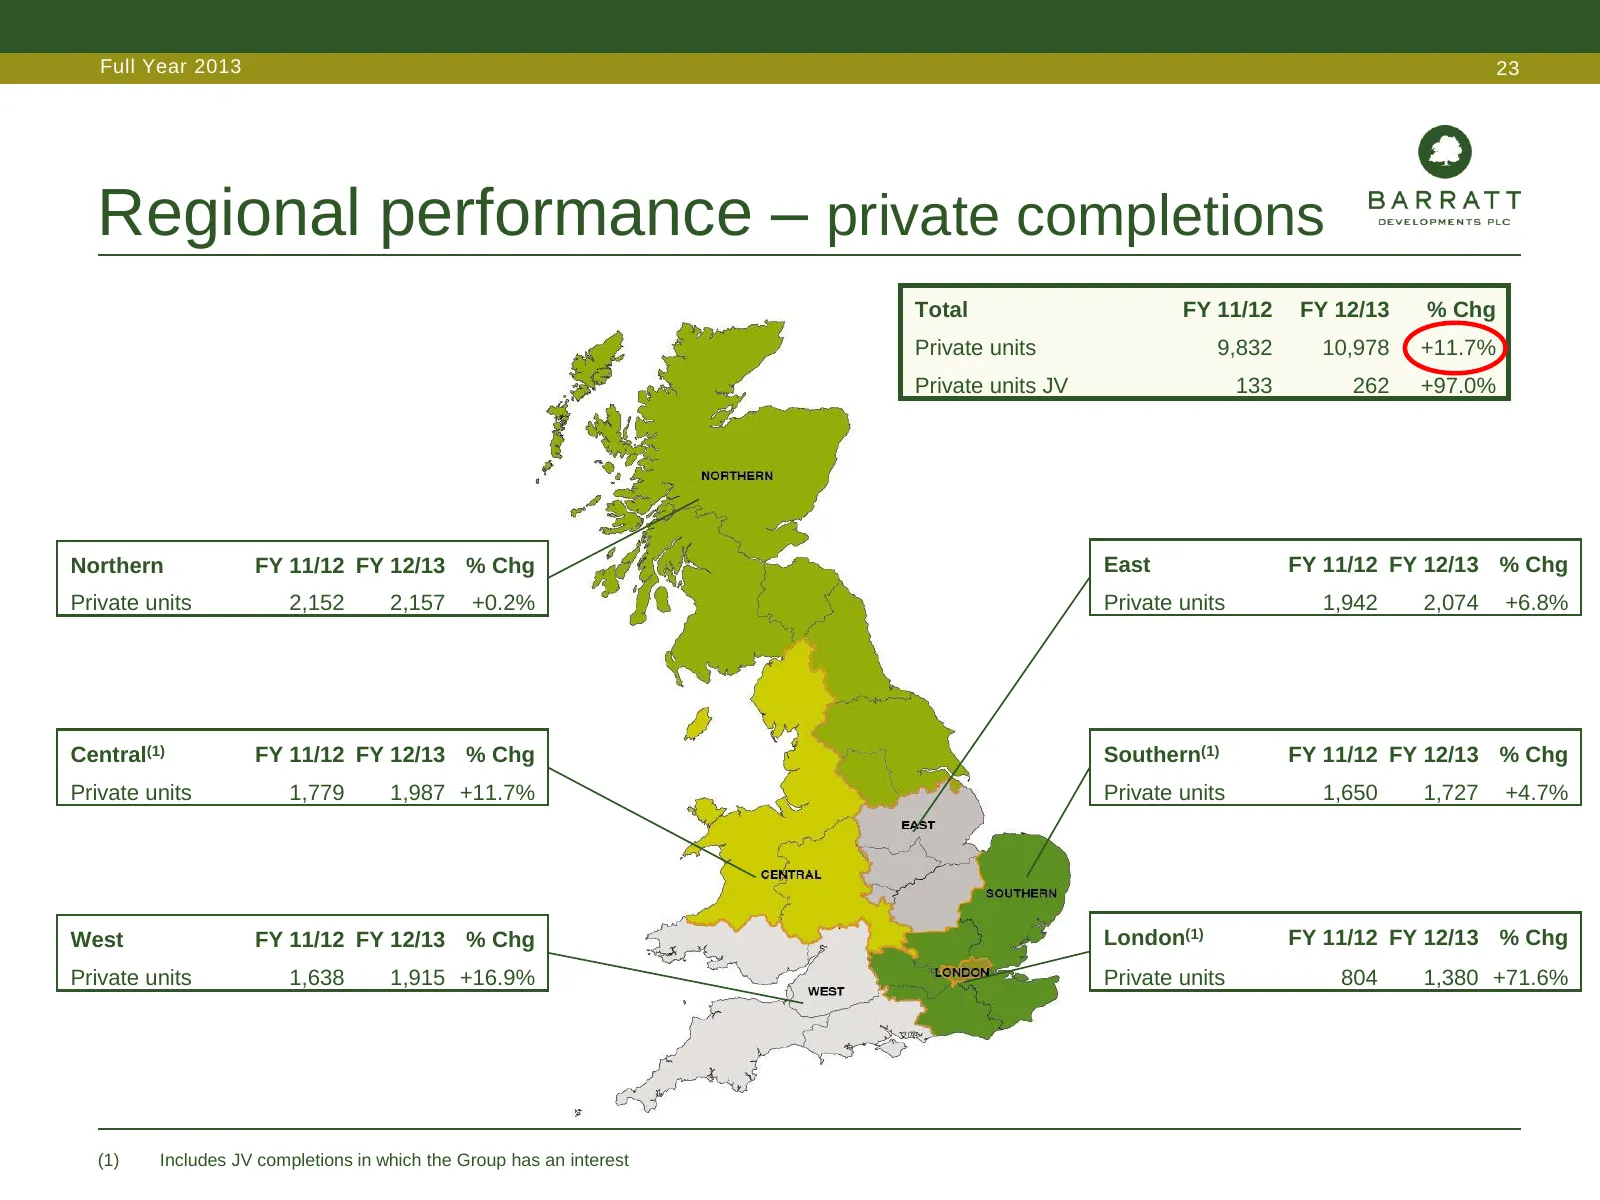
Full Year 2013 23 Regional performance – private completions Total FY 11/12 FY 12/13 % Chg Private units 9,832 10,978 +11.7% Private units JV 133 262 +97.0% Northern FY 11/12 FY 12/13 % Chg East FY 11/12 FY 12/13 % Chg Private units 2,152 2,157 +0.2% Private units 1,942 2,074 +6.8% Central(1) FY 11/
Slide 24: Regional performance – private ASP
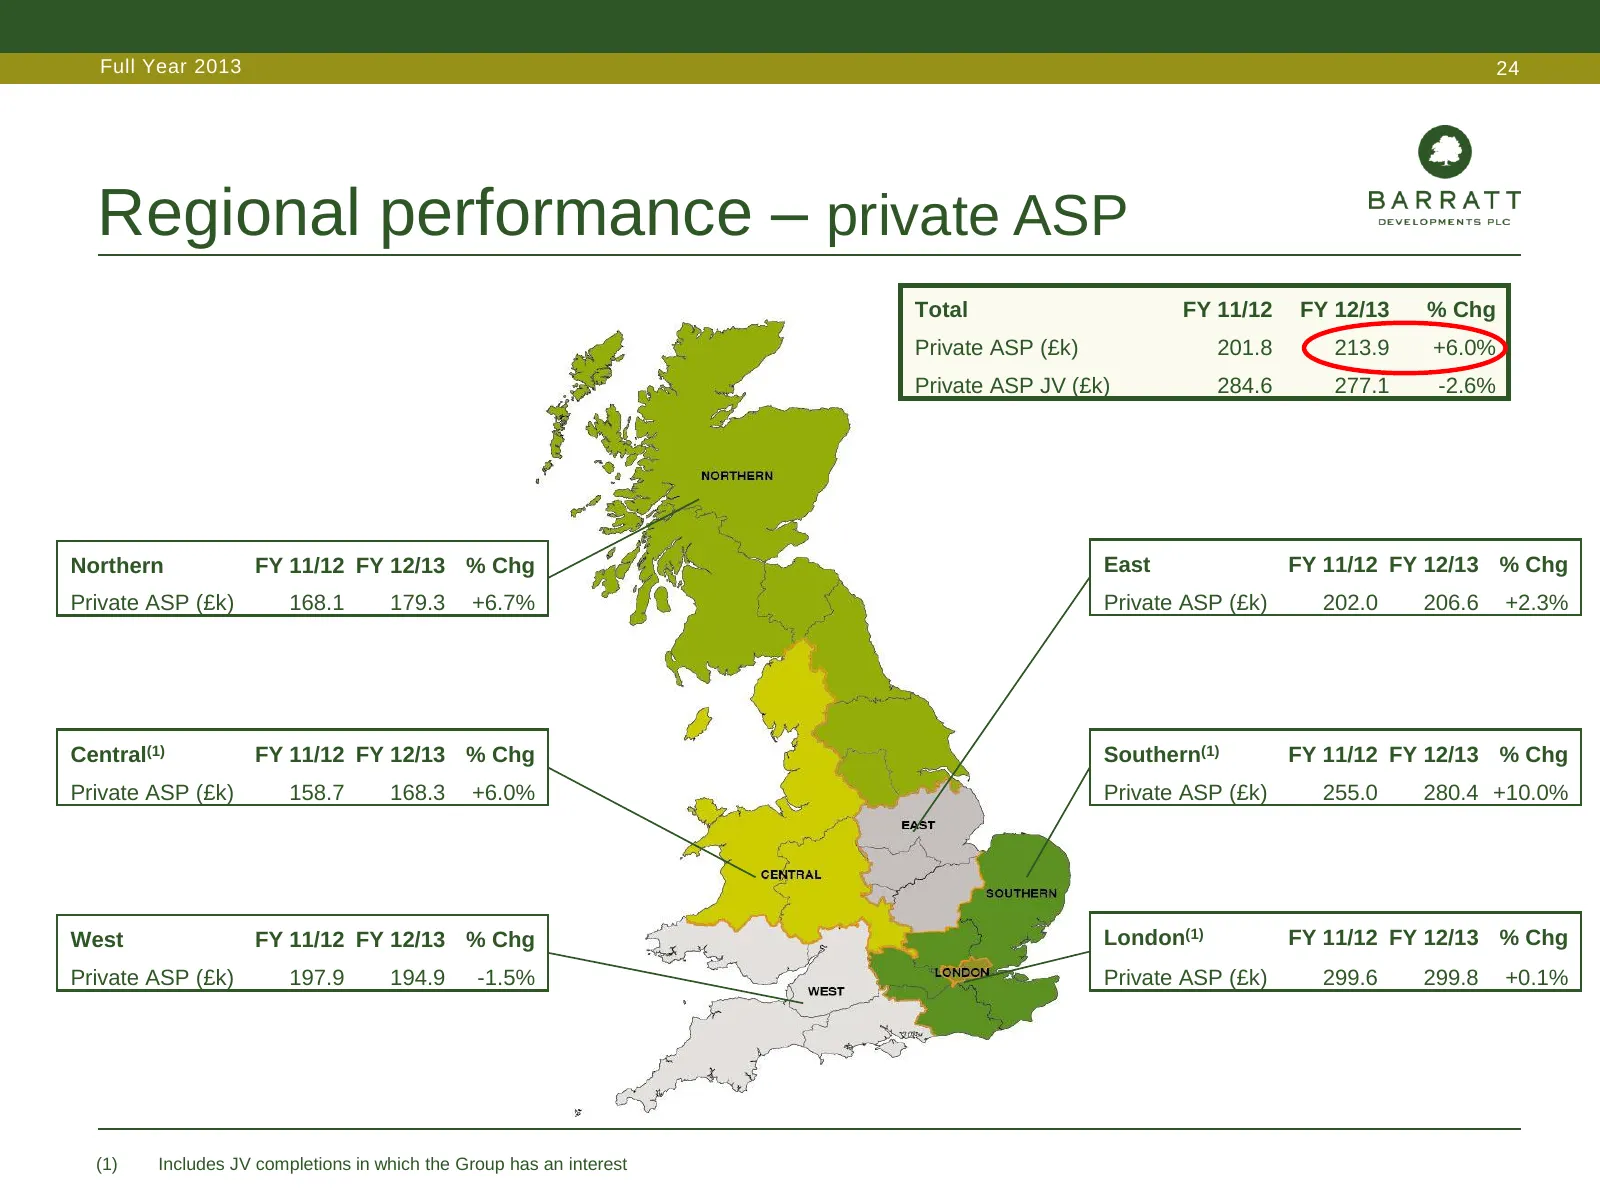
Full Year 2013 24 Regional performance – private ASP Total FY 11/12 FY 12/13 % Chg Private ASP (£k) 201.8 213.9 +6.0% Private ASP JV (£k) 284.6 277.1 -2.6% Northern FY 11/12 FY 12/13 % Chg East FY 11/12 FY 12/13 % Chg Private ASP (£k) 168.1 179.3 +6.7% Private ASP (£k) 202.0 206.6 +2.3% Central(1) F
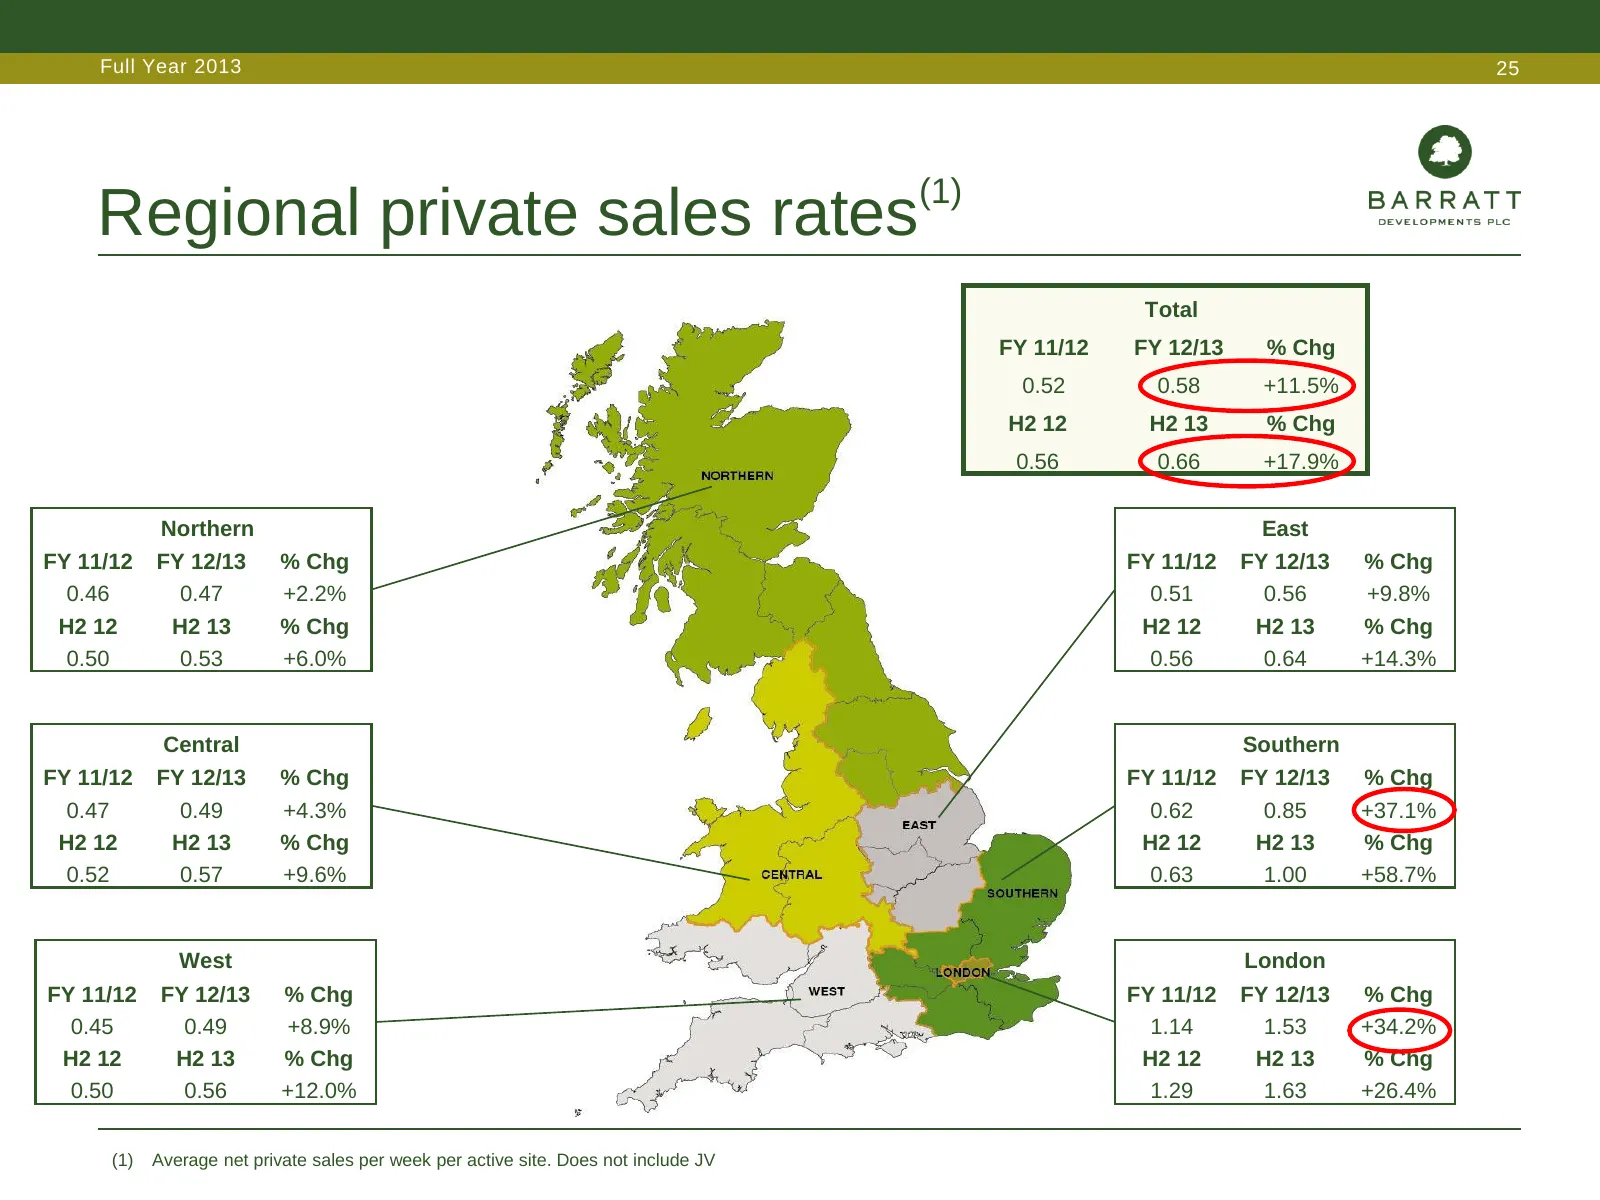
Slide 25: Regional private sales rates
Full Year 2013 25 (1) Regional private sales rates Total FY 11/12 FY 12/13 % Chg 0.52 0.58 +11.5% H2 12 H2 13 % Chg 0.56 0.66 +17.9% Northern East FY 11/12 FY 12/13 % Chg FY 11/12 FY 12/13 % Chg 0.46 0.47 +2.2% 0.51 0.56 +9.8% H2 12 H2 13 % Chg H2 12 H2 13 % Chg 0.50 0.53 +6.0% 0.56 0.64 +14.3% Cent
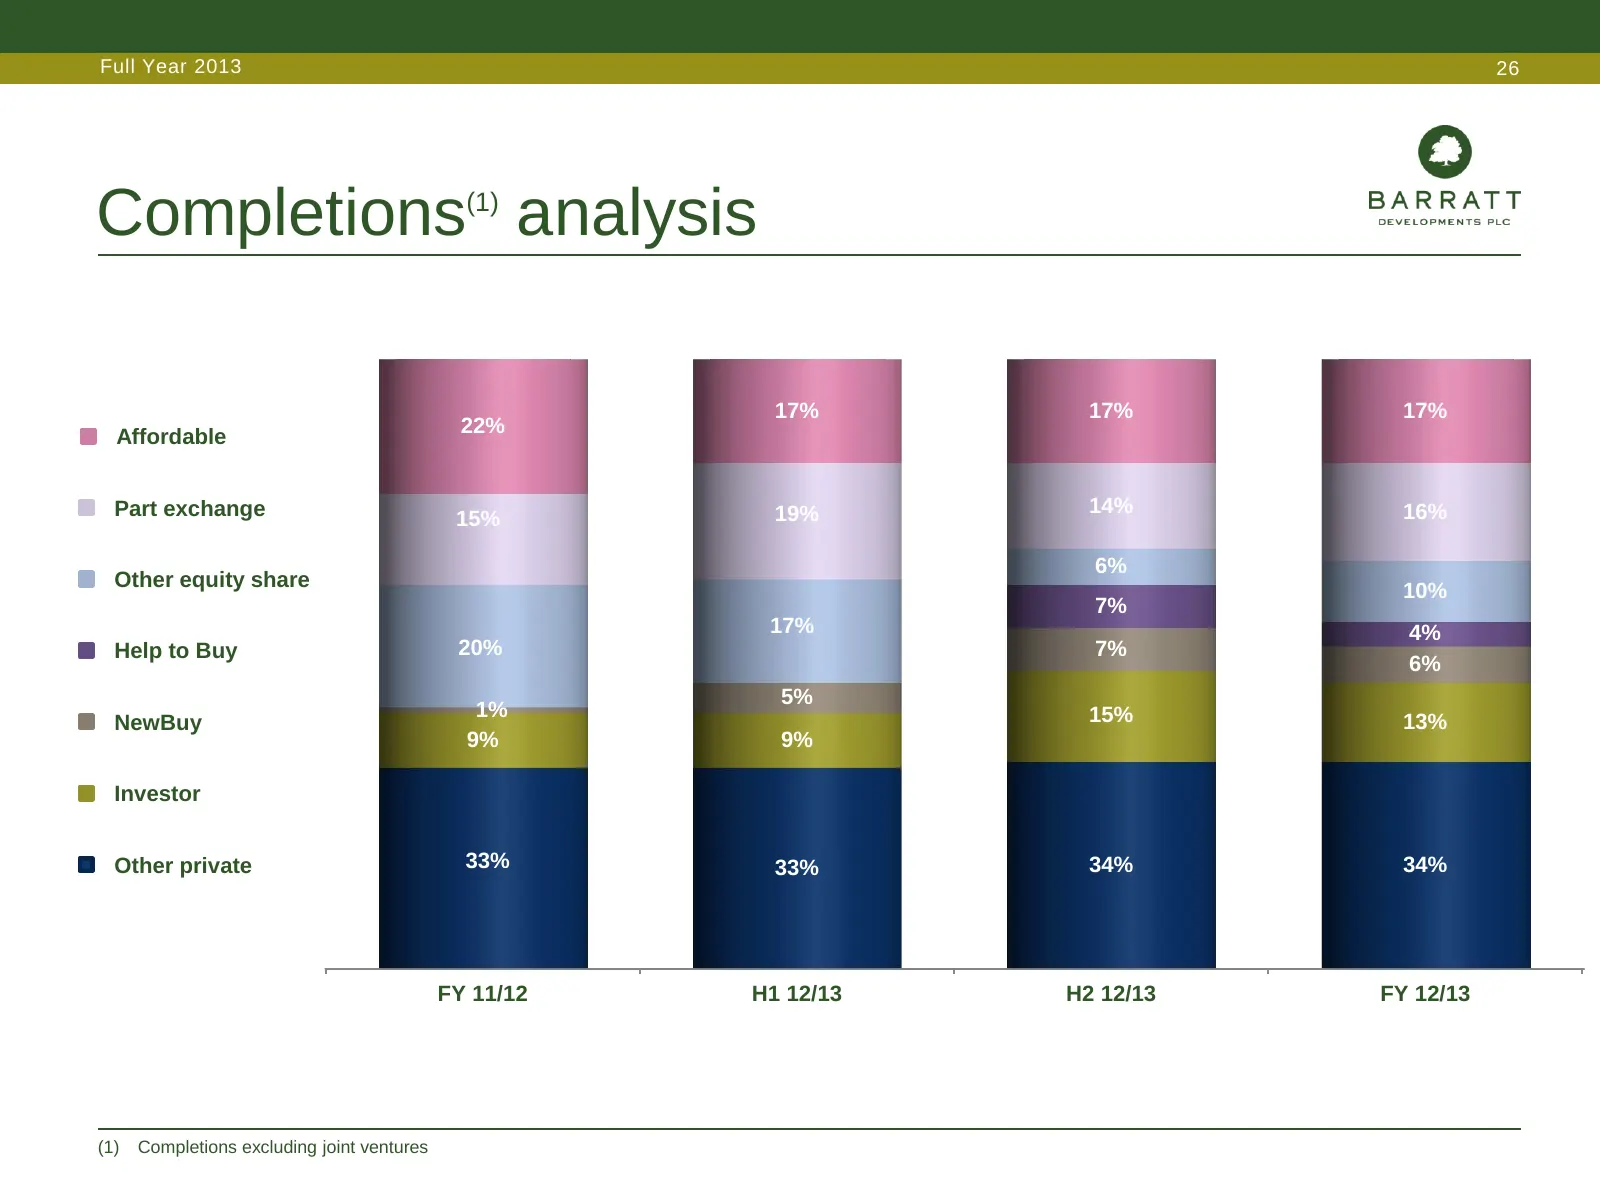
Slide 26: Completions analysis
Full Year 2013 26 Completions(1) analysis 17% 17% 17% Affordable 22% Part exchange 19% 14% 16% 15% 6% Other equity share 10% 7% 17% 4% Help to Buy 20% 7% 6% 1% 1% 5% NewBuy 15% 13% 9% 9% Investor Other private 33% 33% 34% 34% FY 11/12 H1 12/13 H2 12/13 FY 12/13 (1) Completions excluding joint ventur
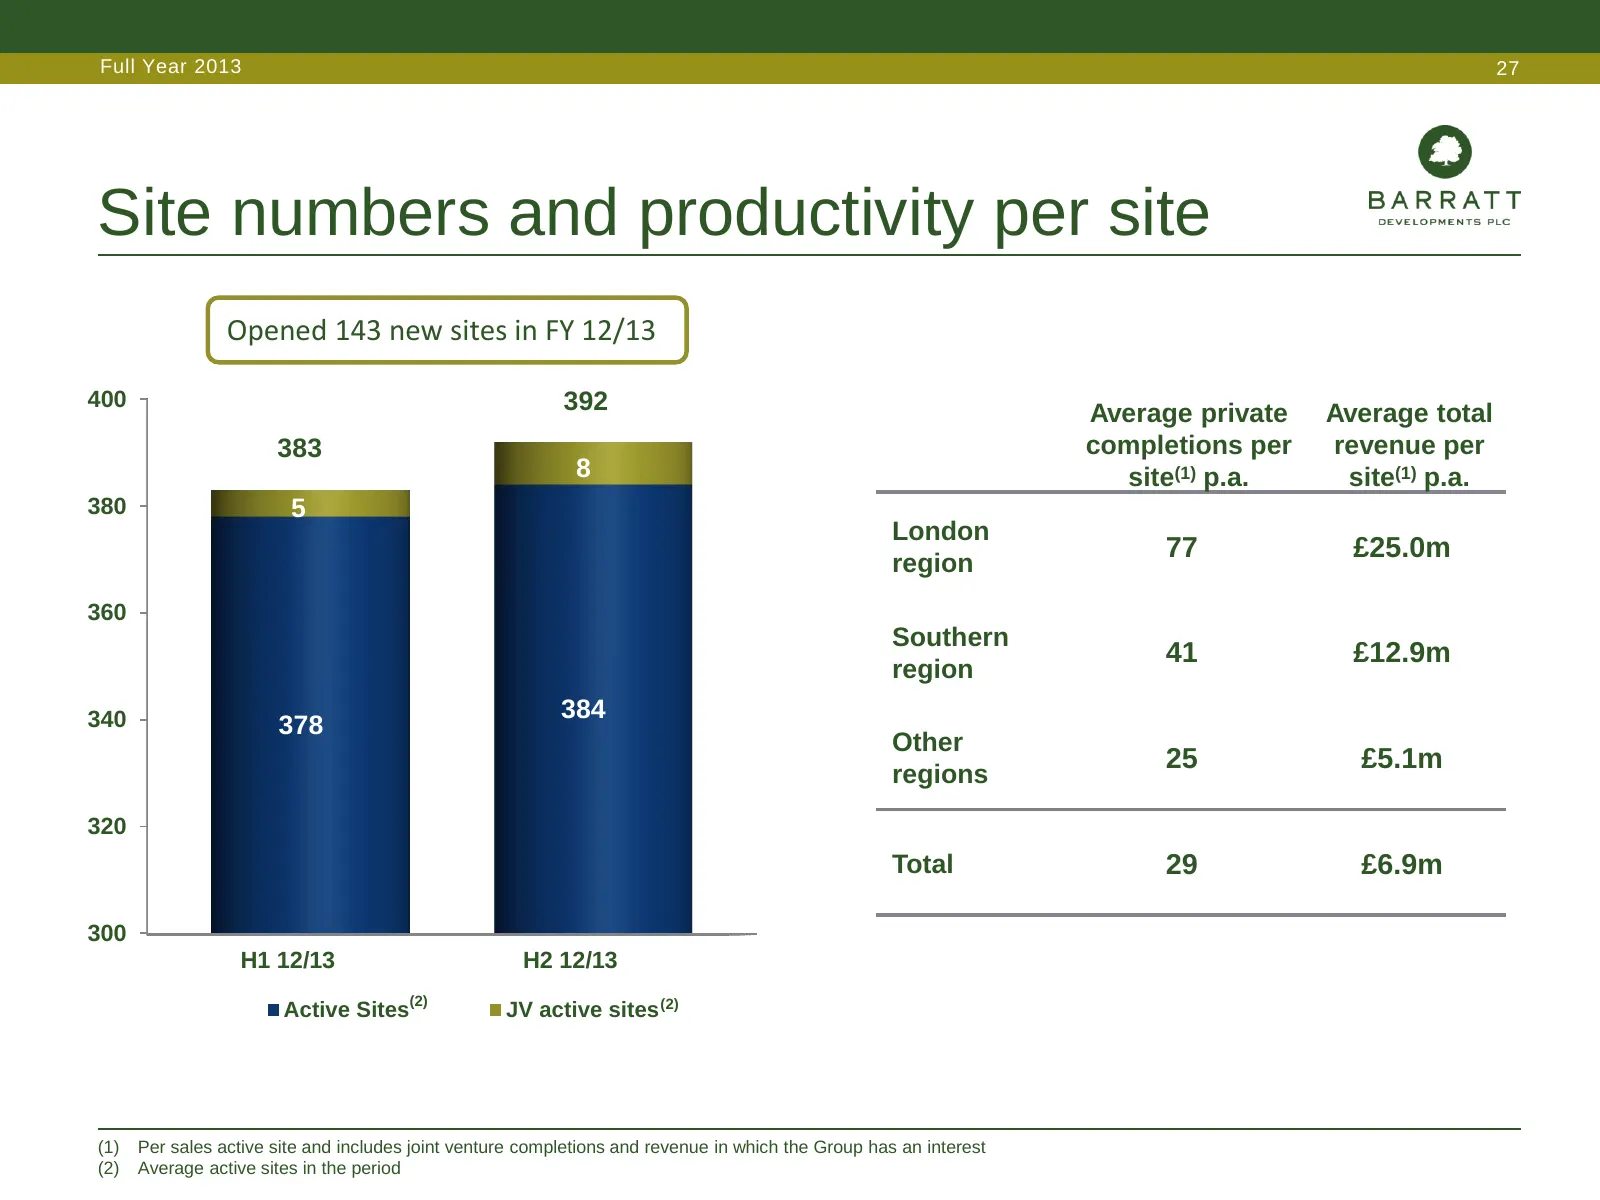
Slide 27: Site numbers and productivity per site
Full Year 2013 27 Site numbers and productivity per site Opened 143 new sites in FY 12/13 400 392 Average private Average total 383 completions per revenue per 8 site(1) p.a. site(1) p.a. 380 5 London 77 £25.0m region 360 Southern 41 £12.9m region 340 384 378 Other 25 £5.1m regions 320 Total 29 £6.9
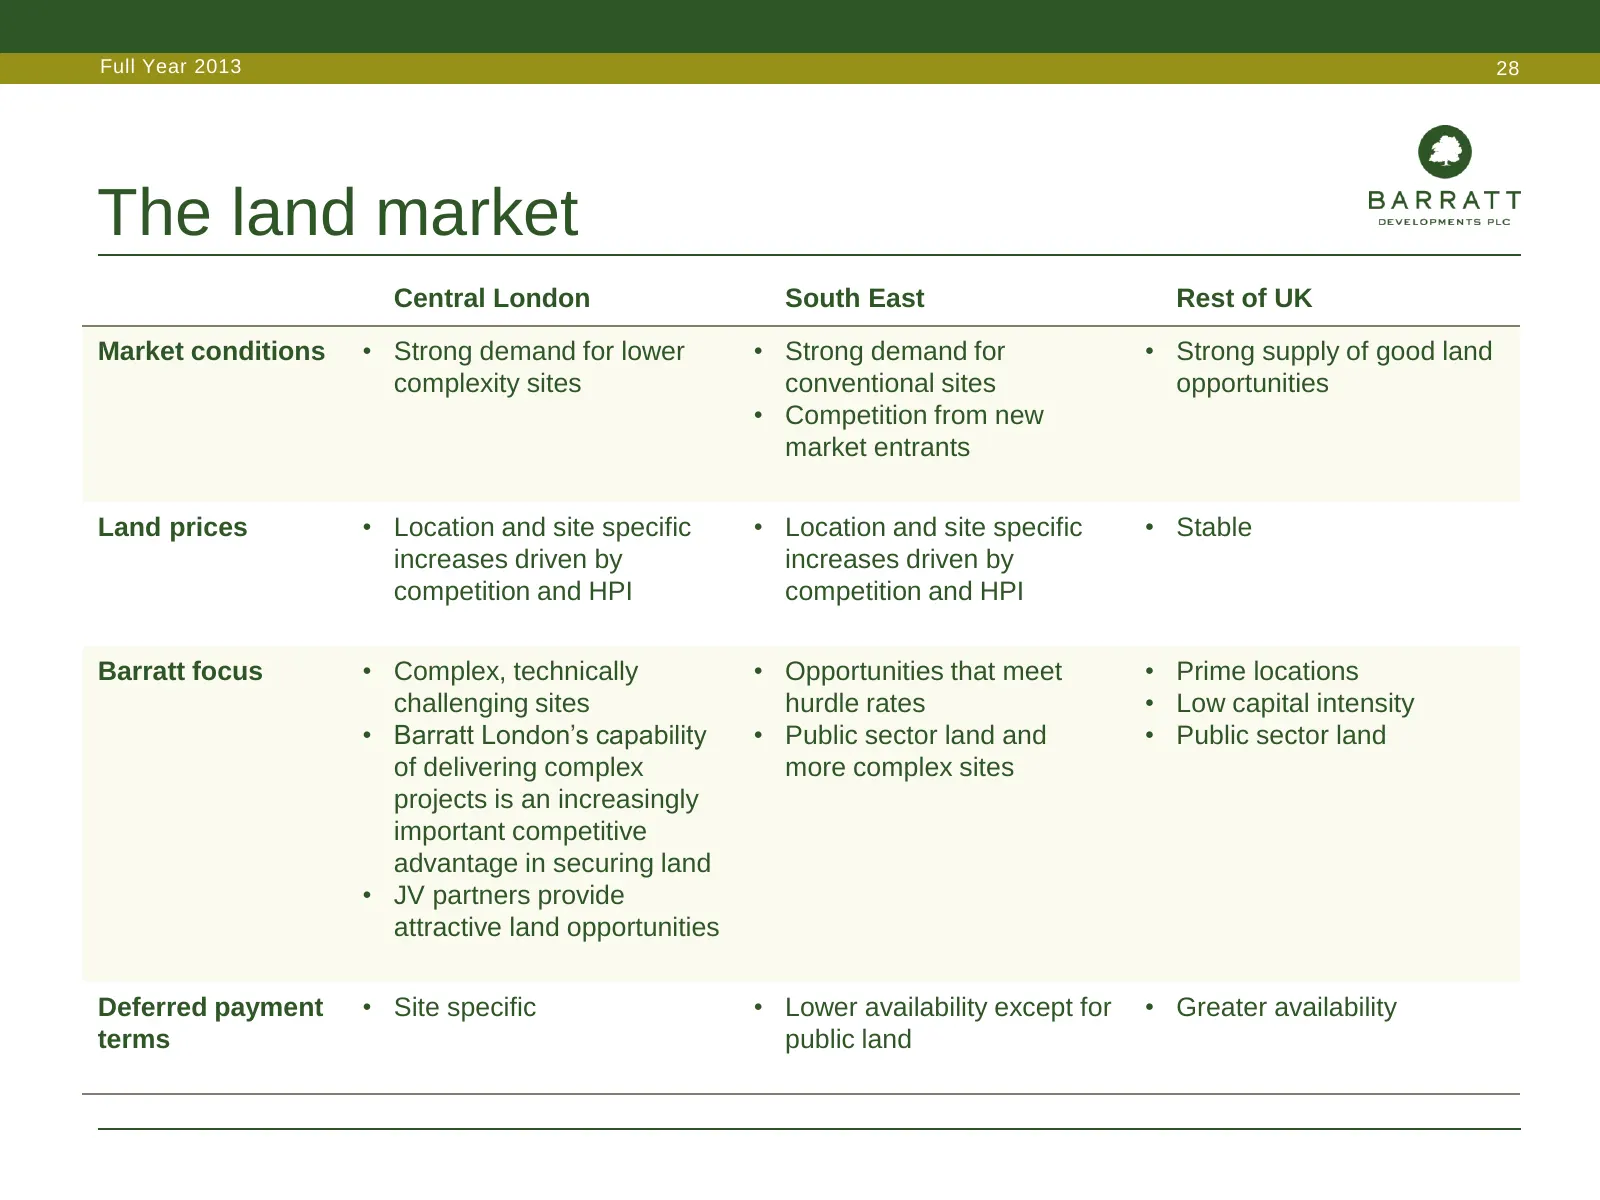
Slide 28: The land market
Full Year 2013 28 The land market Central London South East Rest of UK Market conditions • Strong demand for lower • Strong demand for • Strong supply of good land complexity sites conventional sites opportunities • Competition from new market entrants Land prices • Location and site specific • Loca
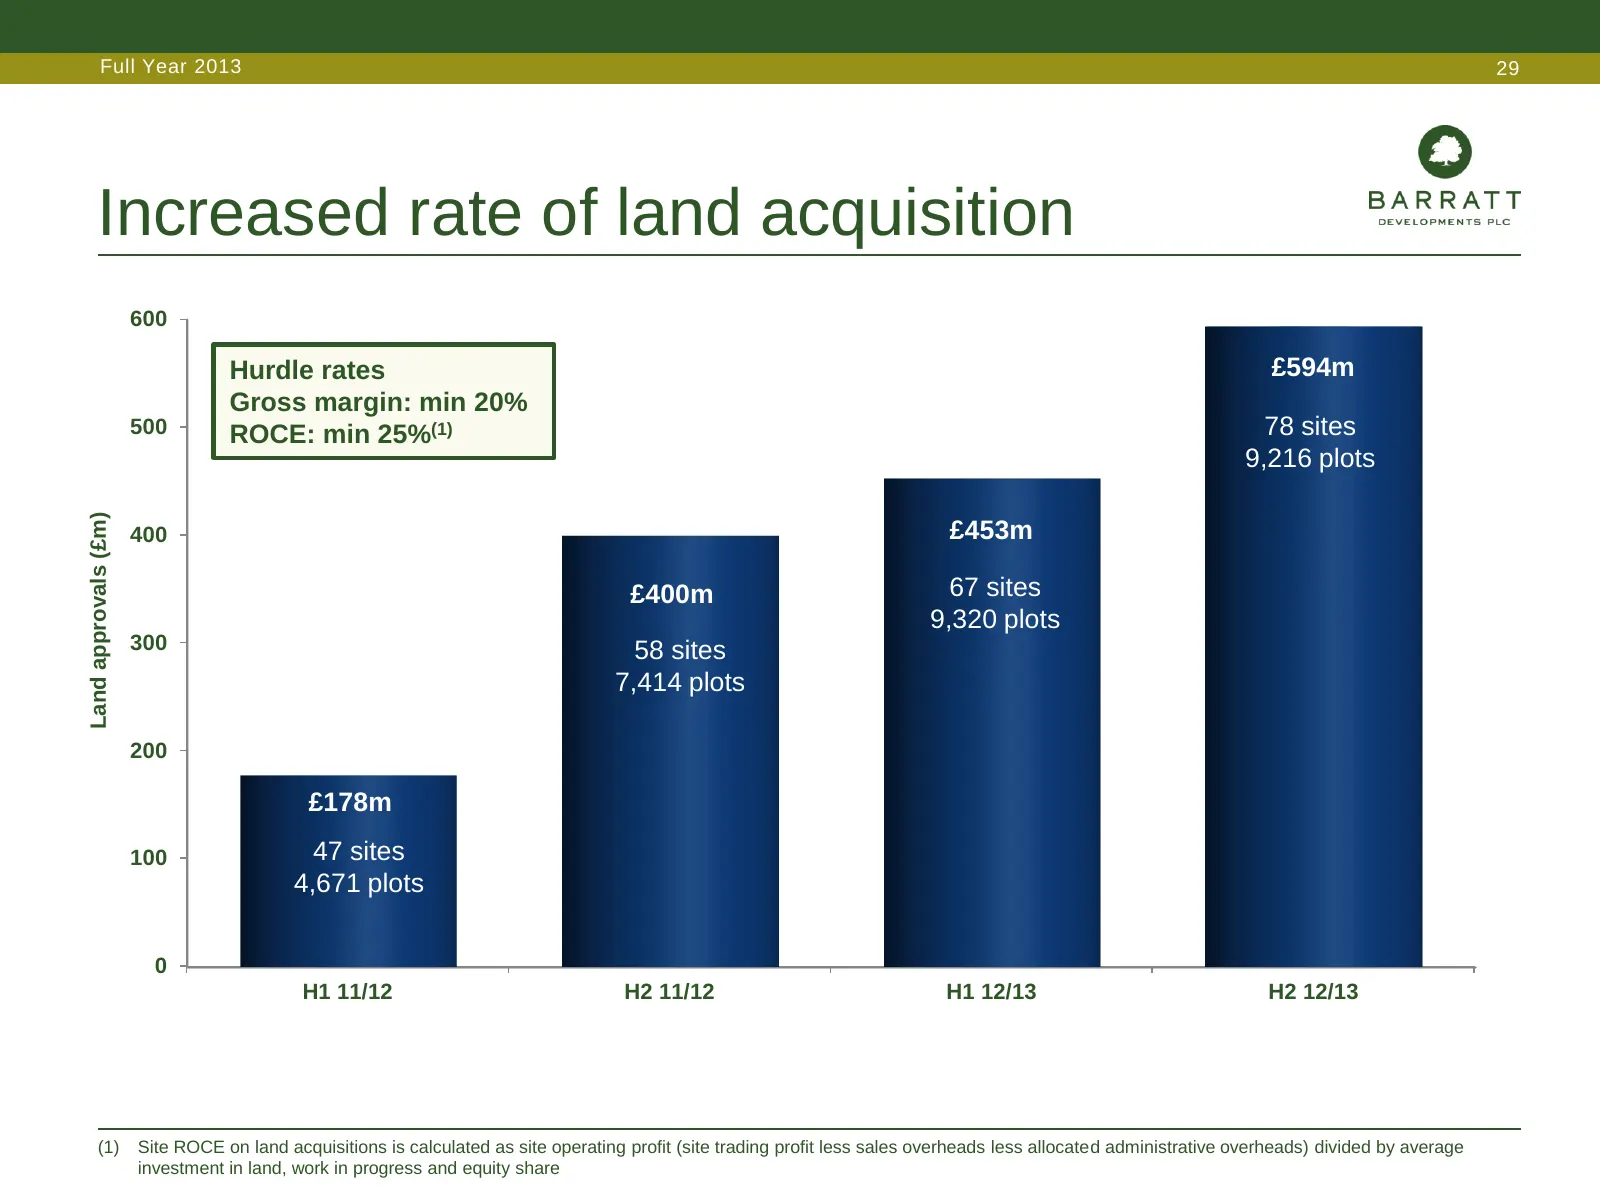
Slide 29: Increased rate of land acquisition
Full Year 2013 29 Increased rate of land acquisition 600 Hurdle rates £594m Gross margin: min 20% 500 ROCE: min 25%(1) 78 sites 9,216 plots Land approvals (£m) 400 £453m £400m 67 sites 9,320 plots 300 58 sites 7,414 plots 200 £178m 100 47 sites 4,671 plots 0 H1 11/12 H2 11/12 H1 12/13 H2 12/13 (1) S
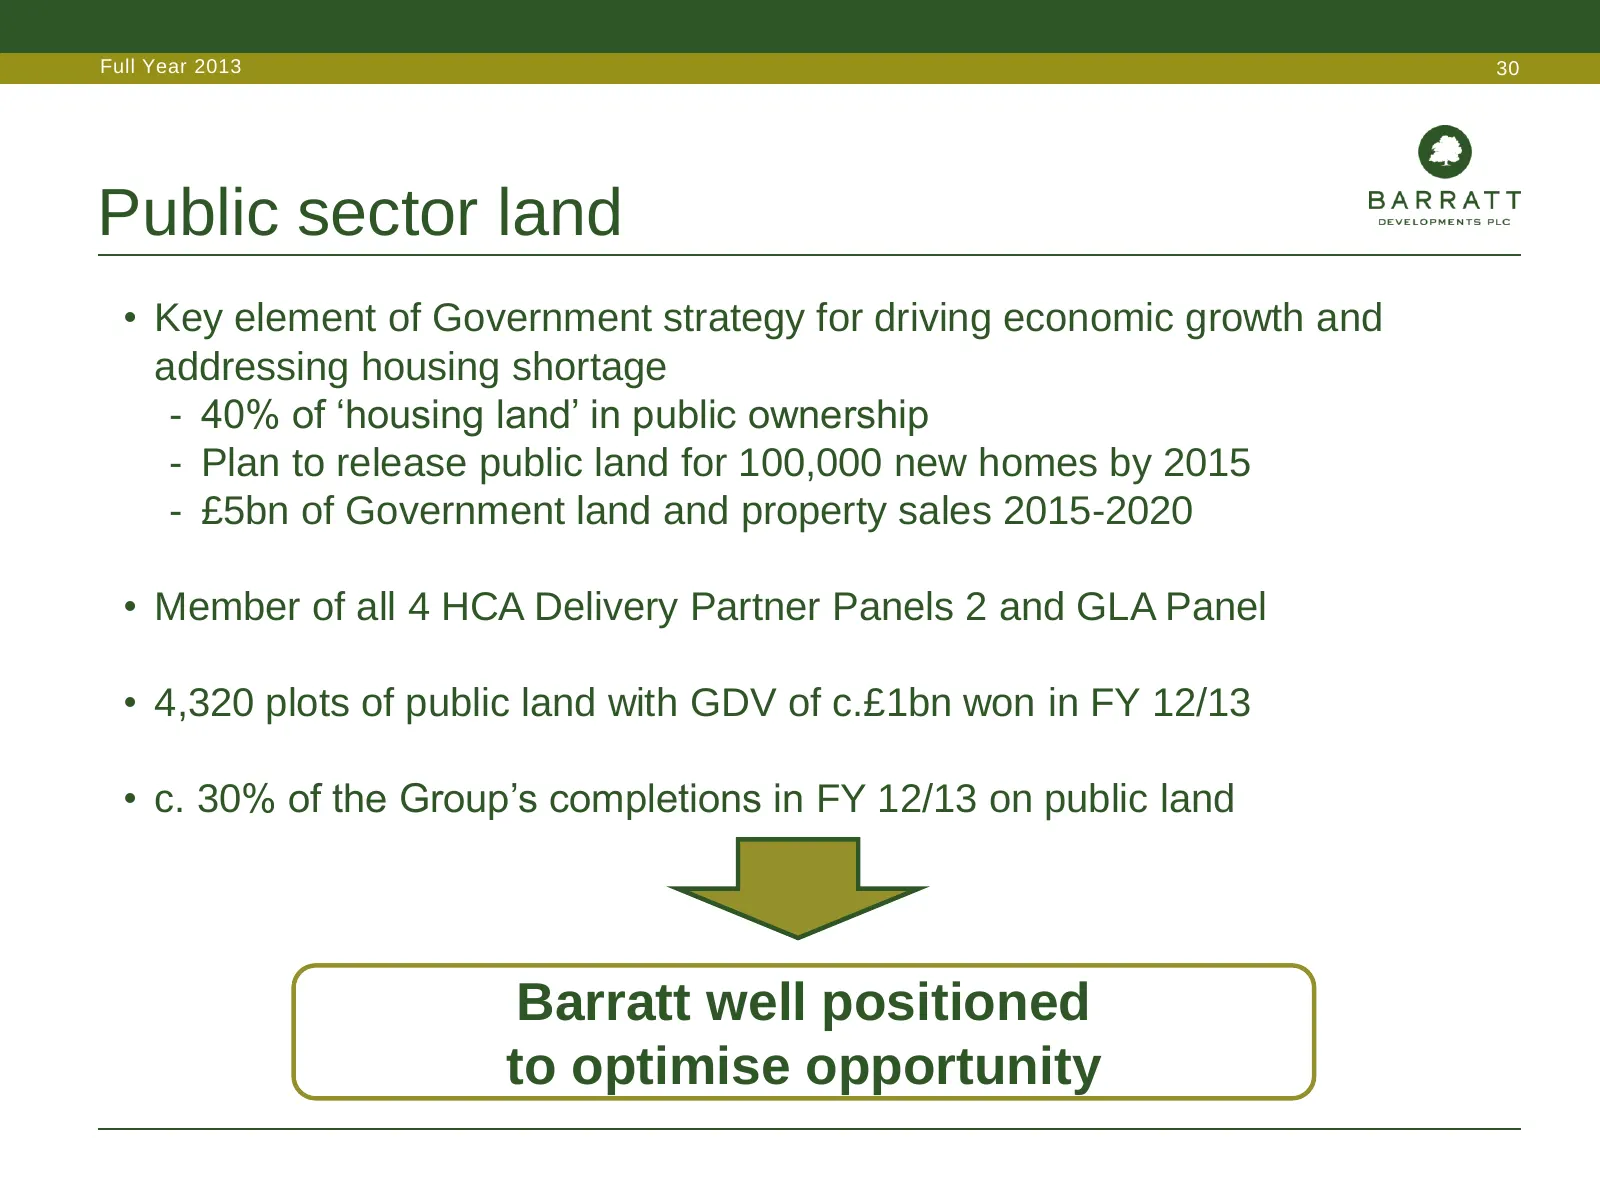
Slide 30: Public sector land
Full Year 2013 30 Public sector land • Key element of Government strategy for driving economic growth and addressing housing shortage - 40% of ‘housing land’ in public ownership - Plan to release public land for 100,000 new homes by 2015 - £5bn of Government land and property sales 2015-2020 • Membe
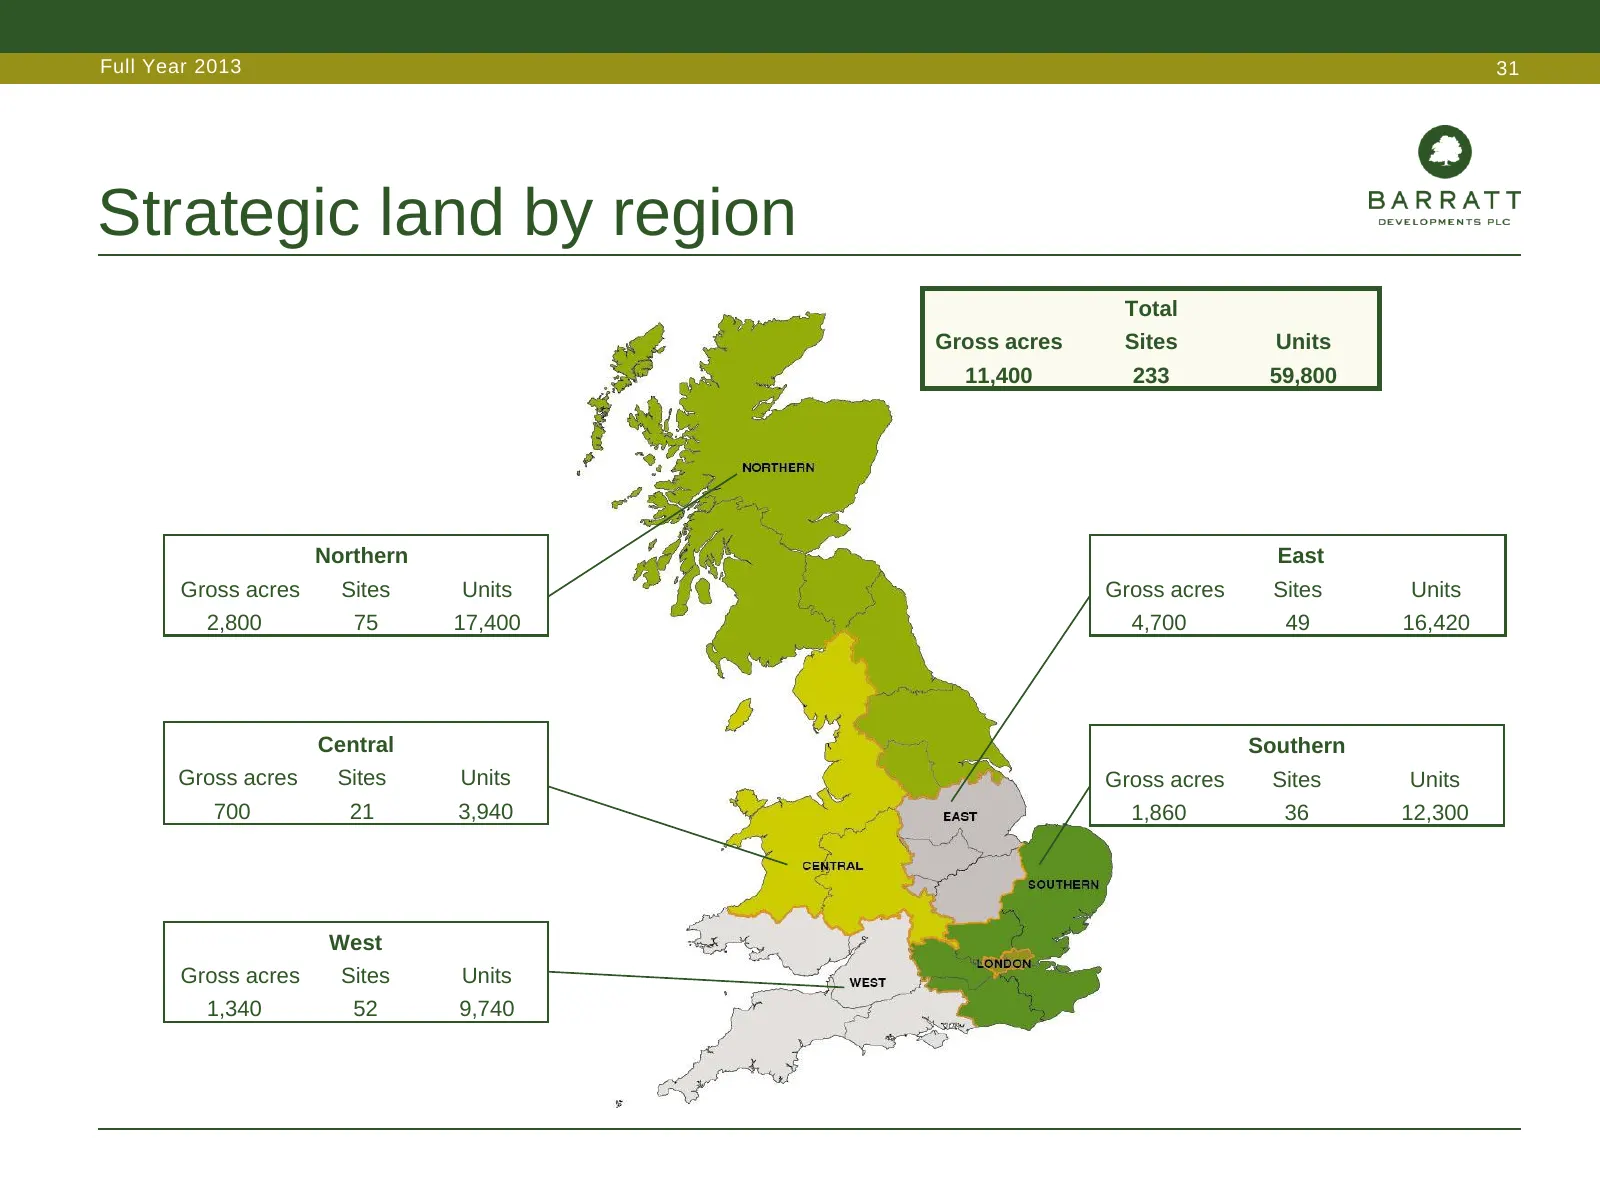
Slide 31: Strategic land by region
Full Year 2013 31 Strategic land by region Total Gross acres Sites Units 11,400 233 59,800 Northern East Gross acres Sites Units Gross acres Sites Units 2,800 75 17,400 4,700 49 16,420 Central Southern Gross acres Sites Units Gross acres Sites Units 700 21 3,940 1,860 36 12,300 West Gross acres Site
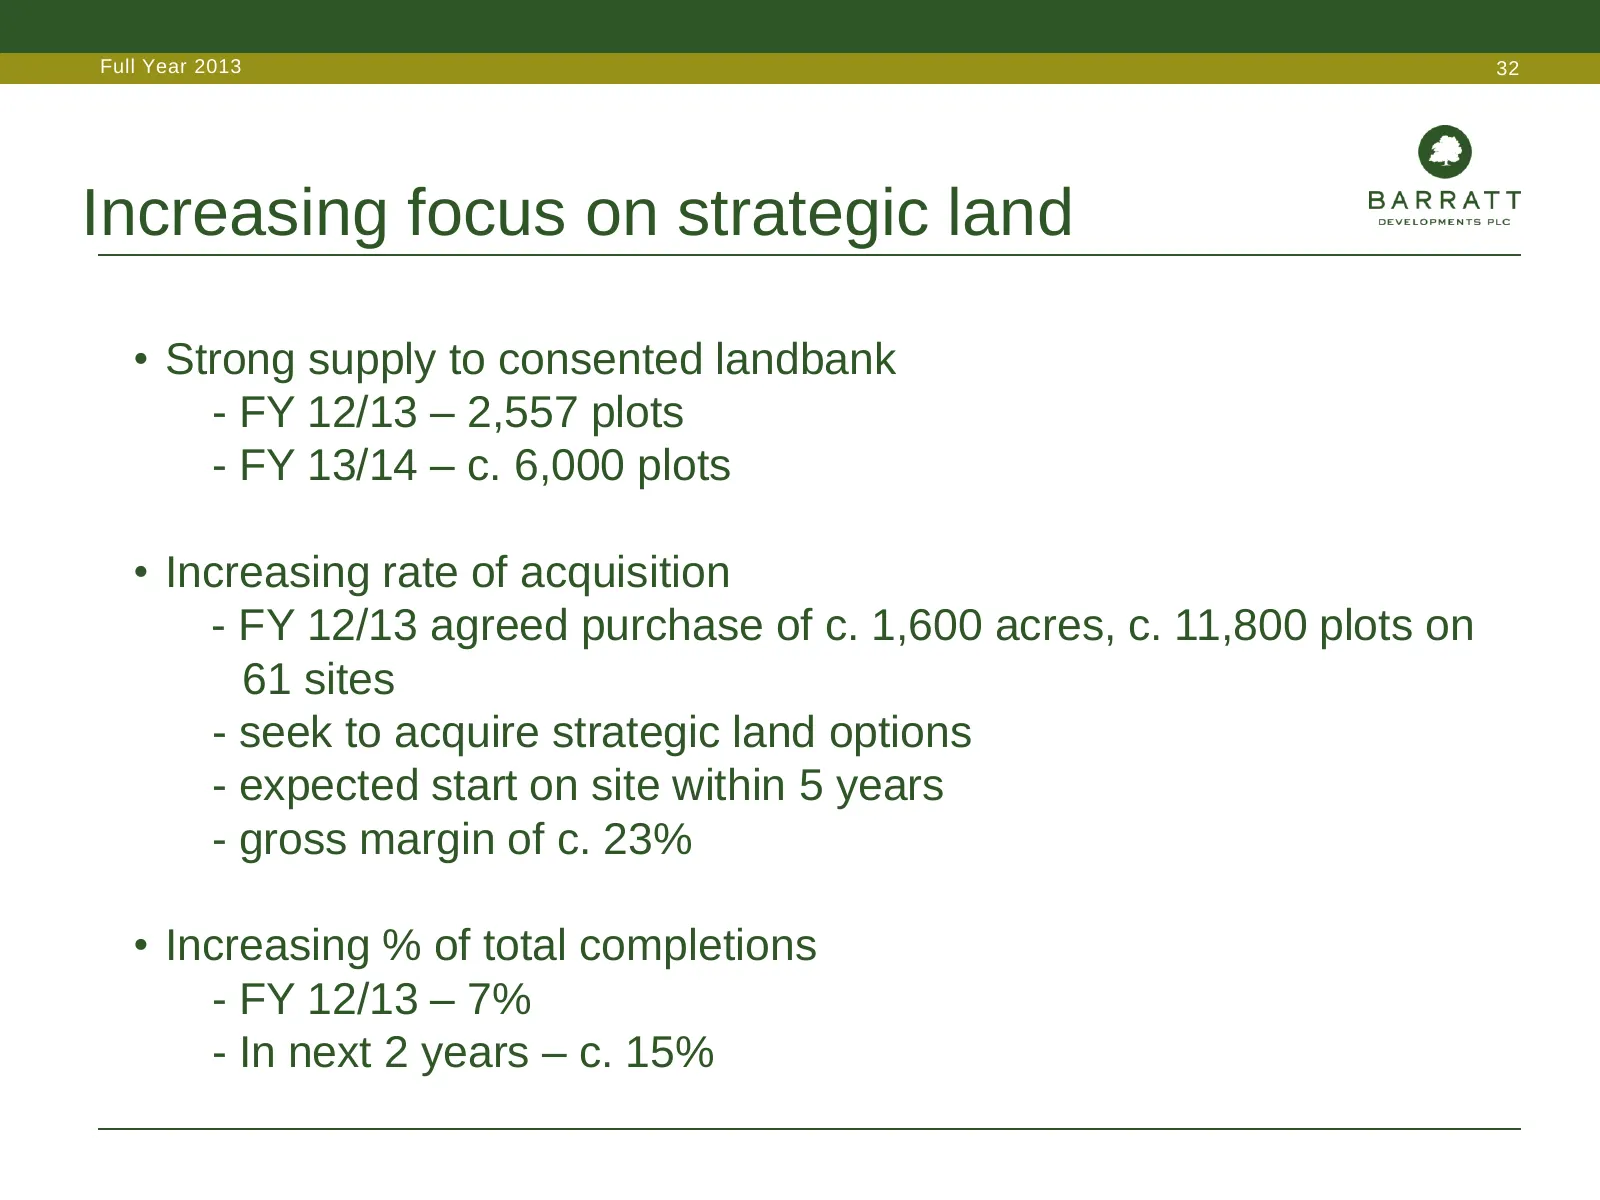
Slide 32: Increasing focus on strategic land
Full Year 2013 32 Increasing focus on strategic land • Strong supply to consented landbank - FY 12/13 – 2,557 plots - FY 13/14 – c. 6,000 plots • Increasing rate of acquisition - FY 12/13 agreed purchase of c. 1,600 acres, c. 11,800 plots on 61 sites - seek to acquire strategic land options - expect
Slide 33: National with a balanced land portfolio
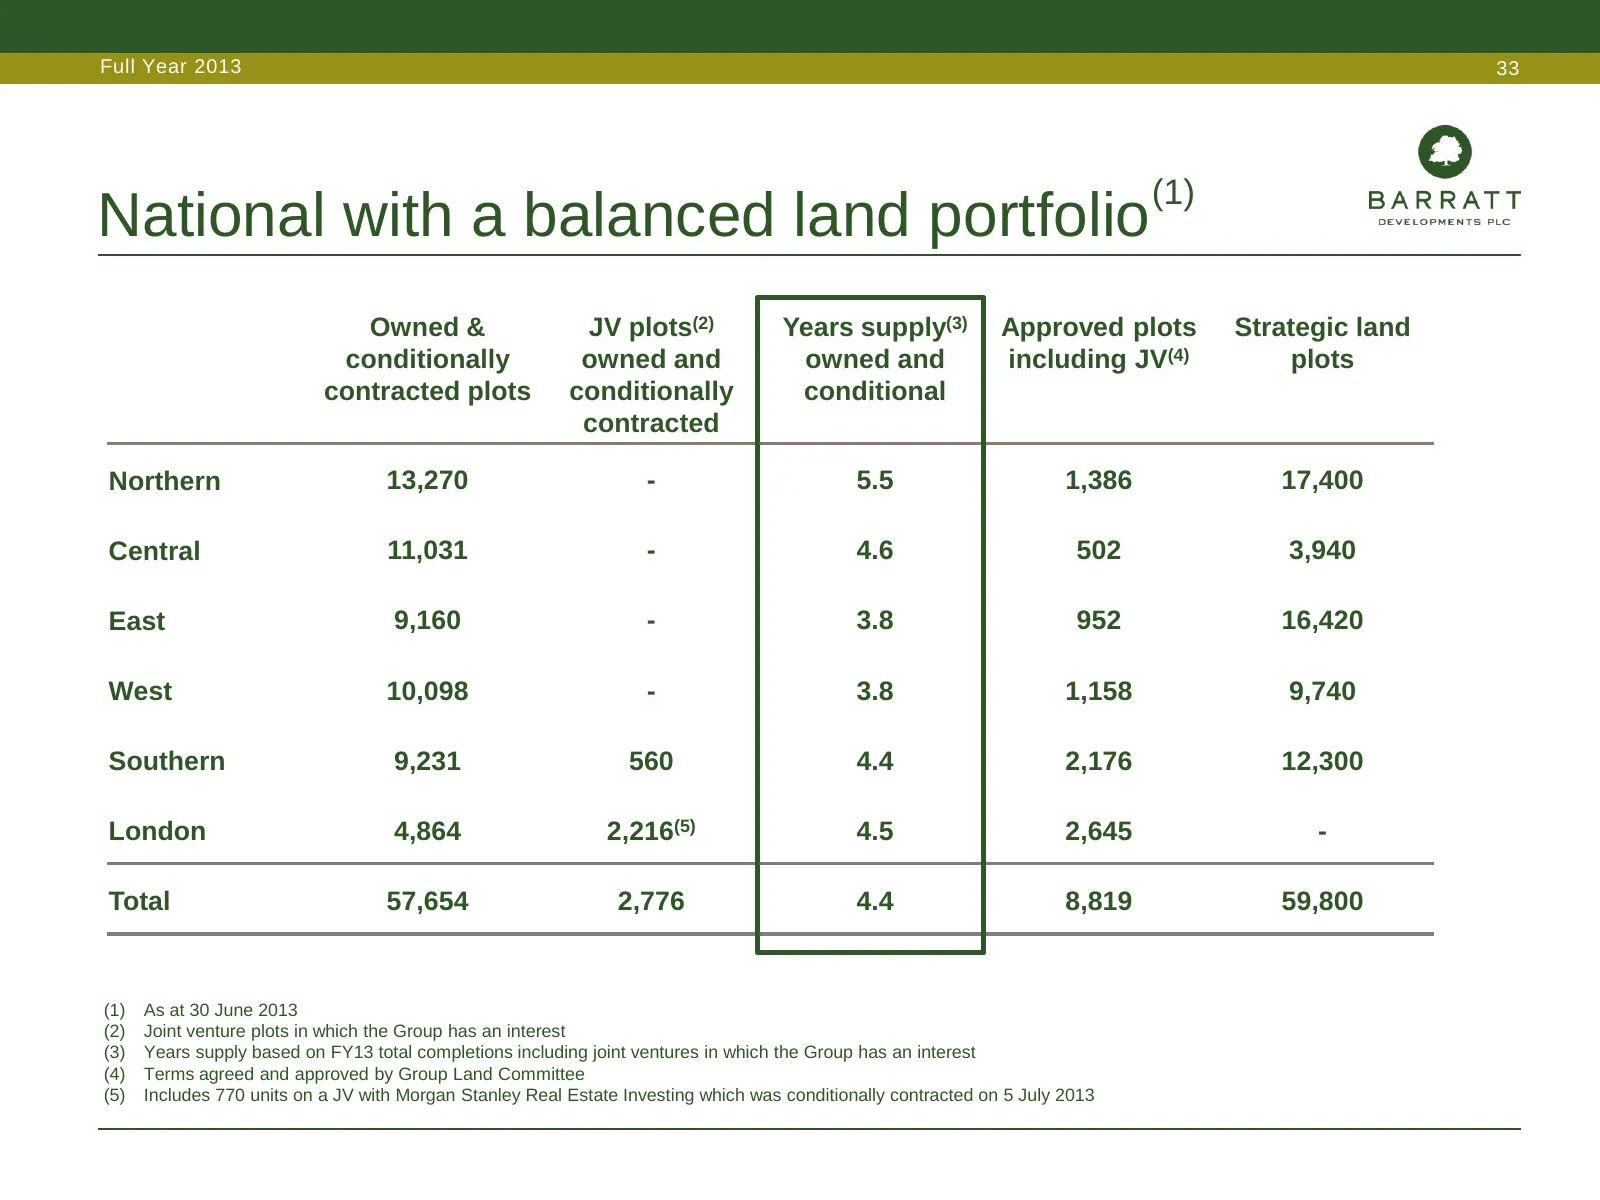
Full Year 2013 33 (1) National with a balanced land portfolio Owned & JV plots(2) Years supply(3) Approved plots Strategic land conditionally owned and owned and including JV(4) plots contracted plots conditionally conditional contracted Northern 13,270 - 5.5 1,386 17,400 Central 11,031 - 4.6 502 3,
Slide 34: Cost environment
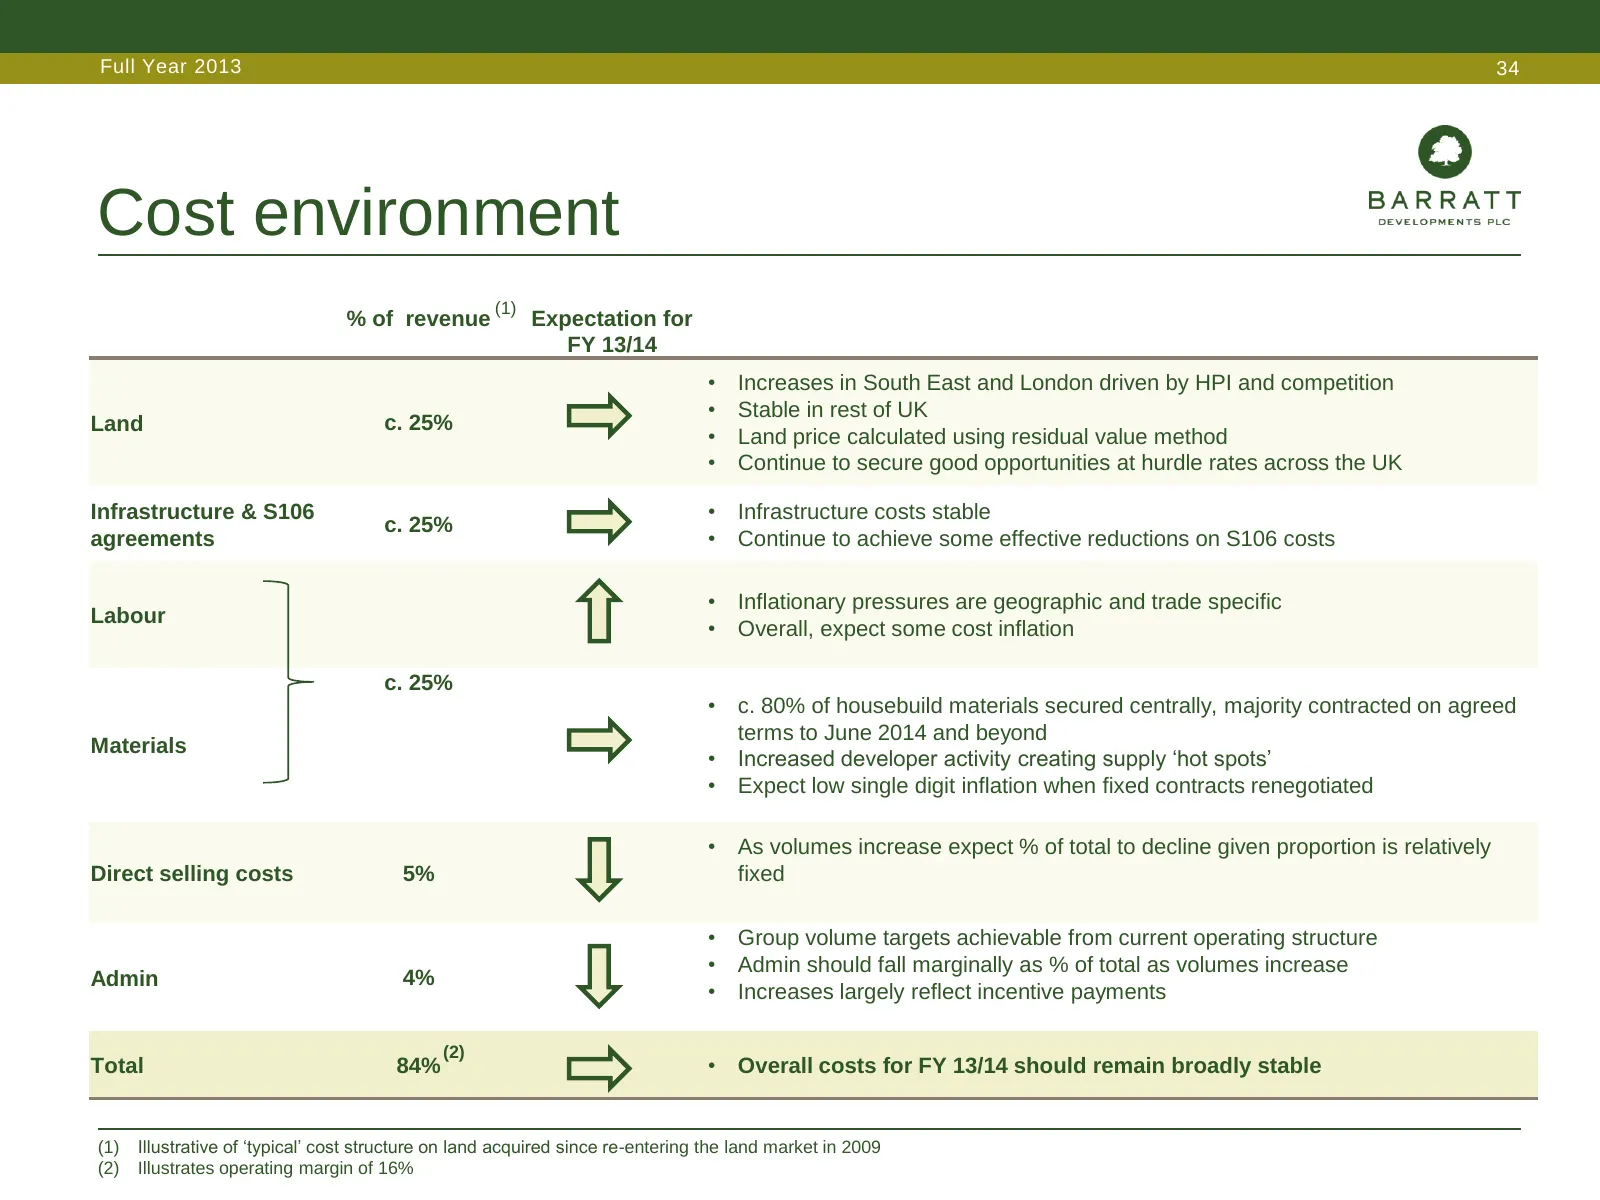
Full Year 2013 34 Cost environment (1) % of revenue Expectation for FY 13/14 • Increases in South East and London driven by HPI and competition • Stable in rest of UK Land c. 25% • Land price calculated using residual value method • Continue to secure good opportunities at hurdle rates across the UK
Slide 35: Industry leading – construction and service
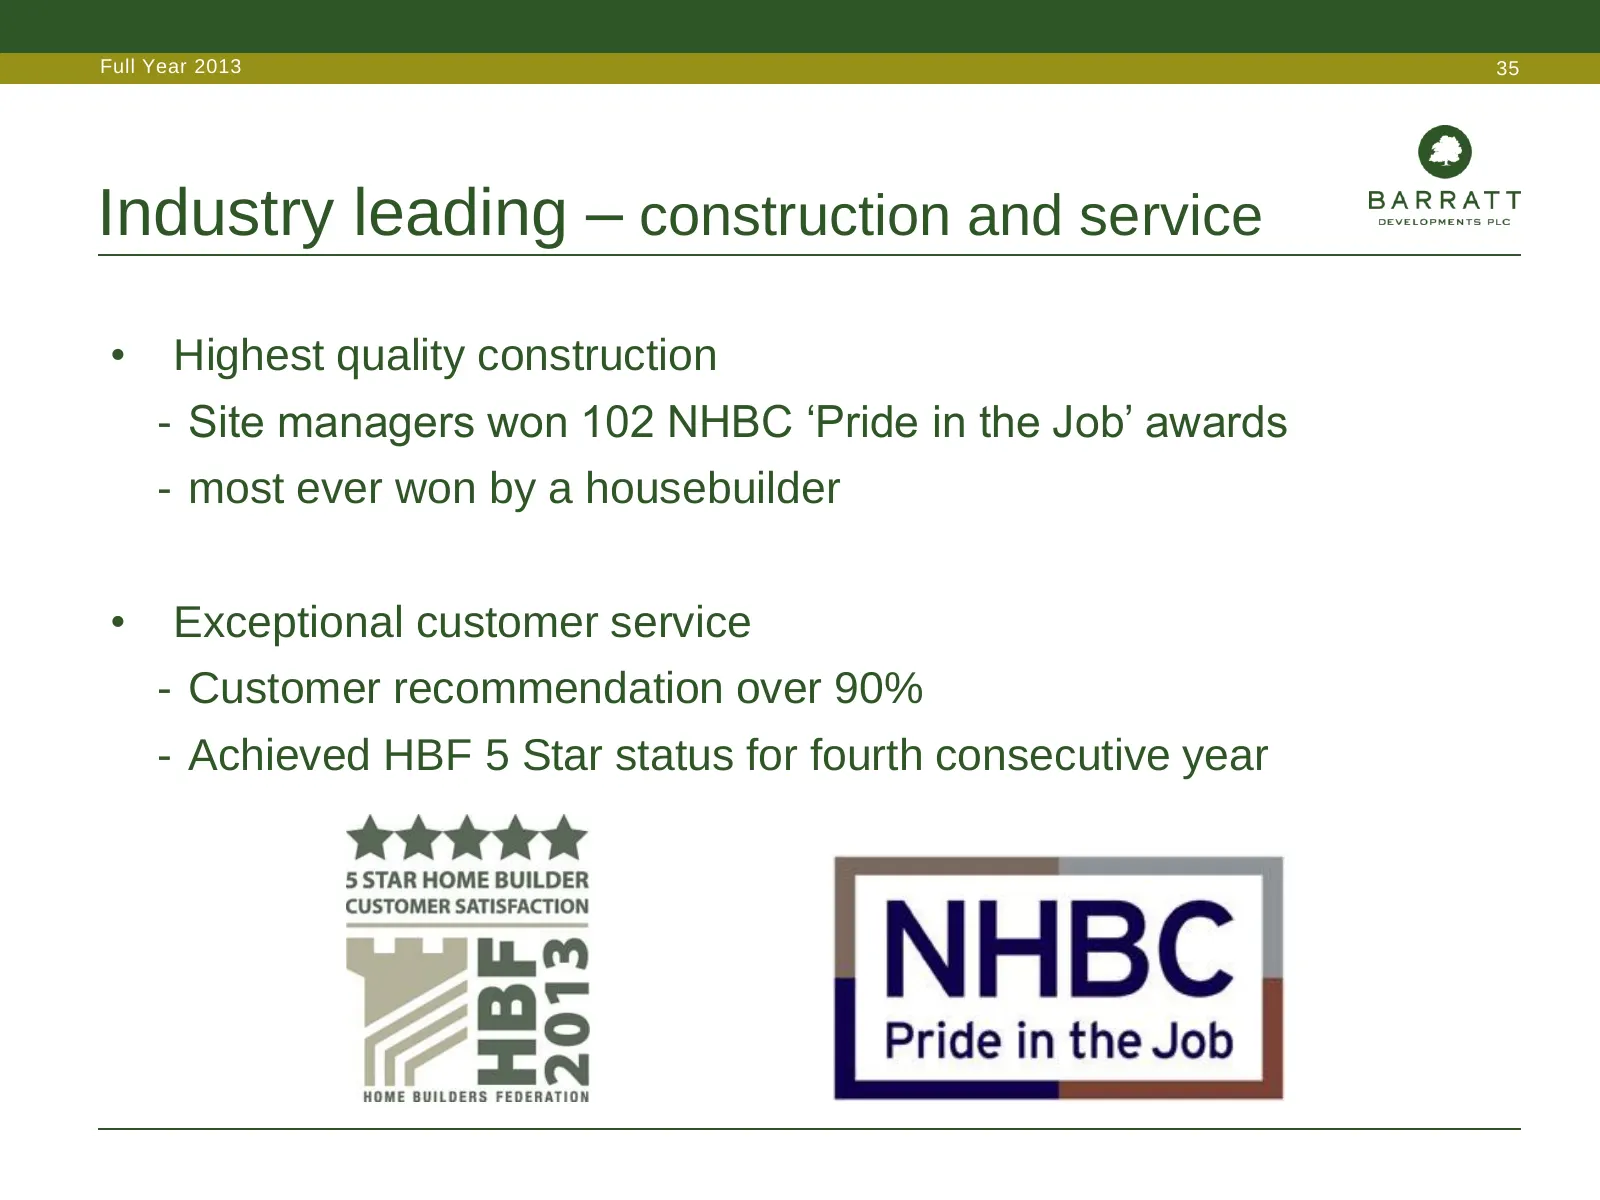
Full Year 2013 35 Industry leading – construction and service • Highest quality construction - Site managers won 102 NHBC ‘Pride in the Job’ awards - most ever won by a housebuilder • Exceptional customer service - Customer recommendation over 90% - Achieved HBF 5 Star status for fourth consecutive
Slide 36: Mark Clare, Group Chief Executive
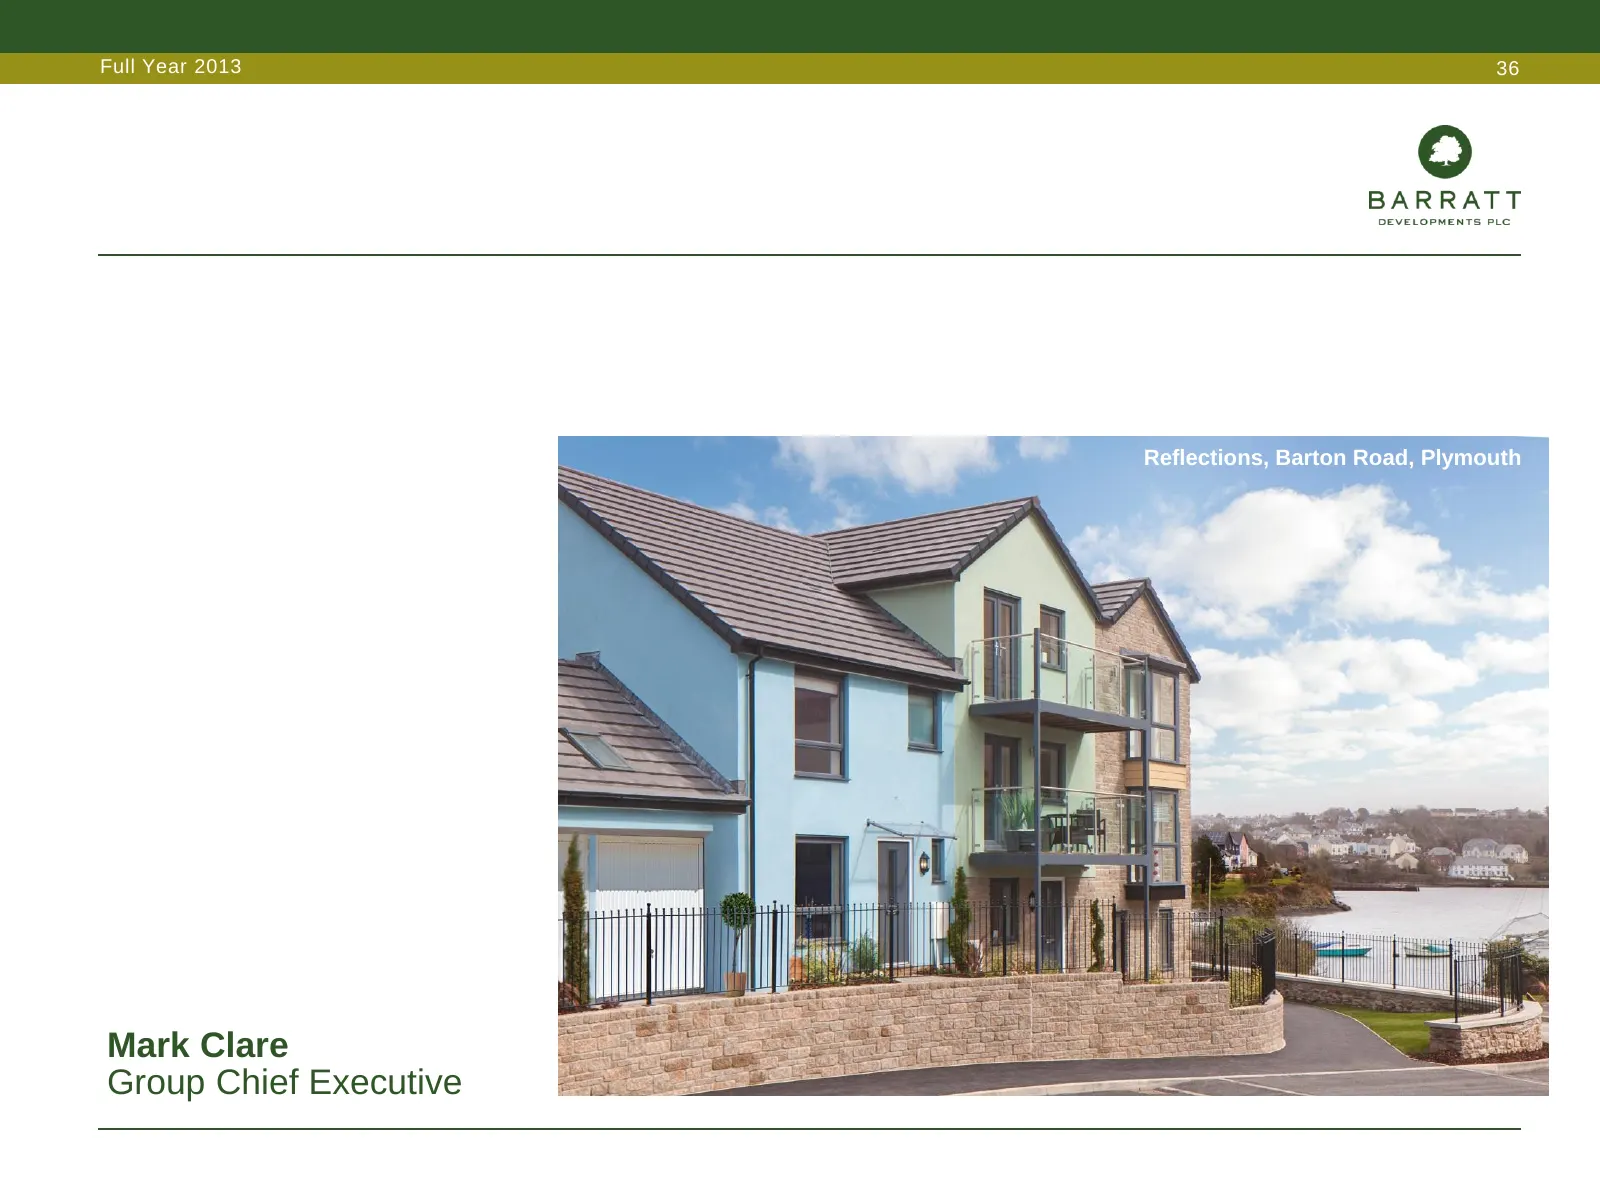
Full Year 2013 36 Reflections, Barton Road, Plymouth Mark Clare Group Chief Executive
Slide 37: Market update
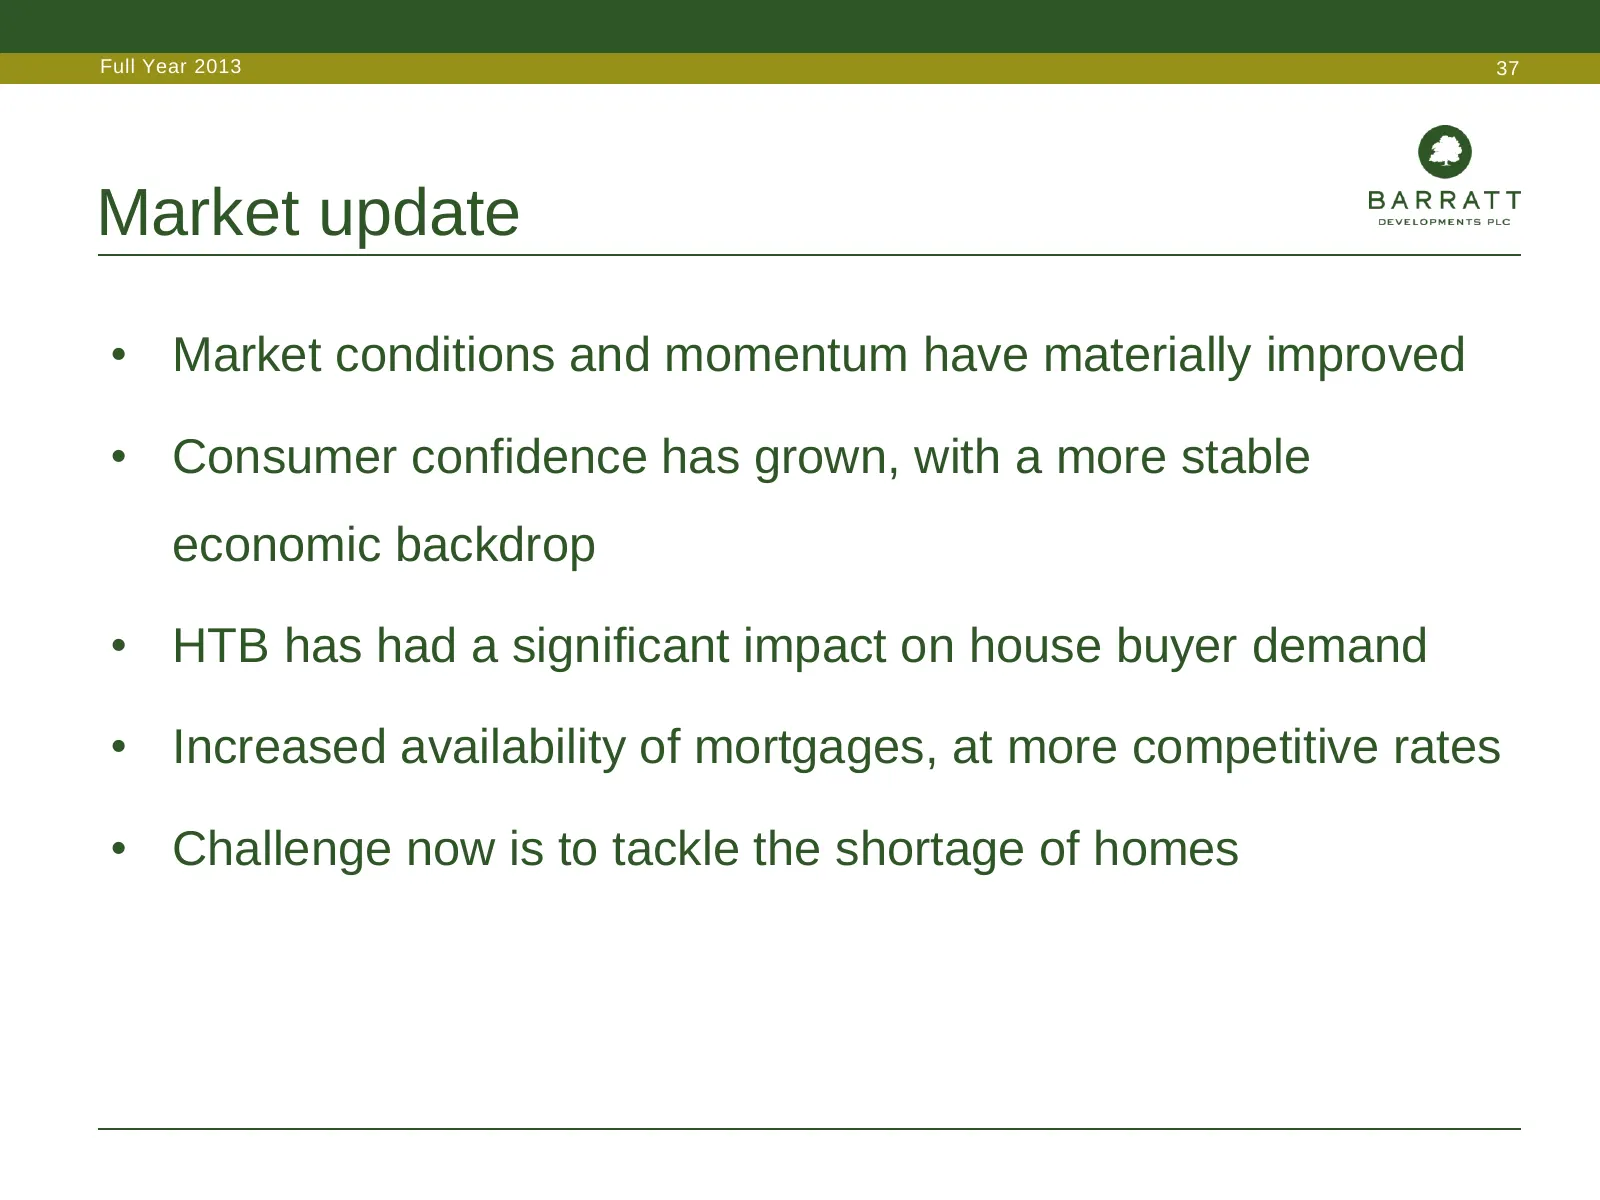
Full Year 2013 37 Market update • Market conditions and momentum have materially improved • Consumer confidence has grown, with a more stable economic backdrop • HTB has had a significant impact on house buyer demand • Increased availability of mortgages, at more competitive rates • Challenge now is
Slide 38: House prices & mortgage approvals
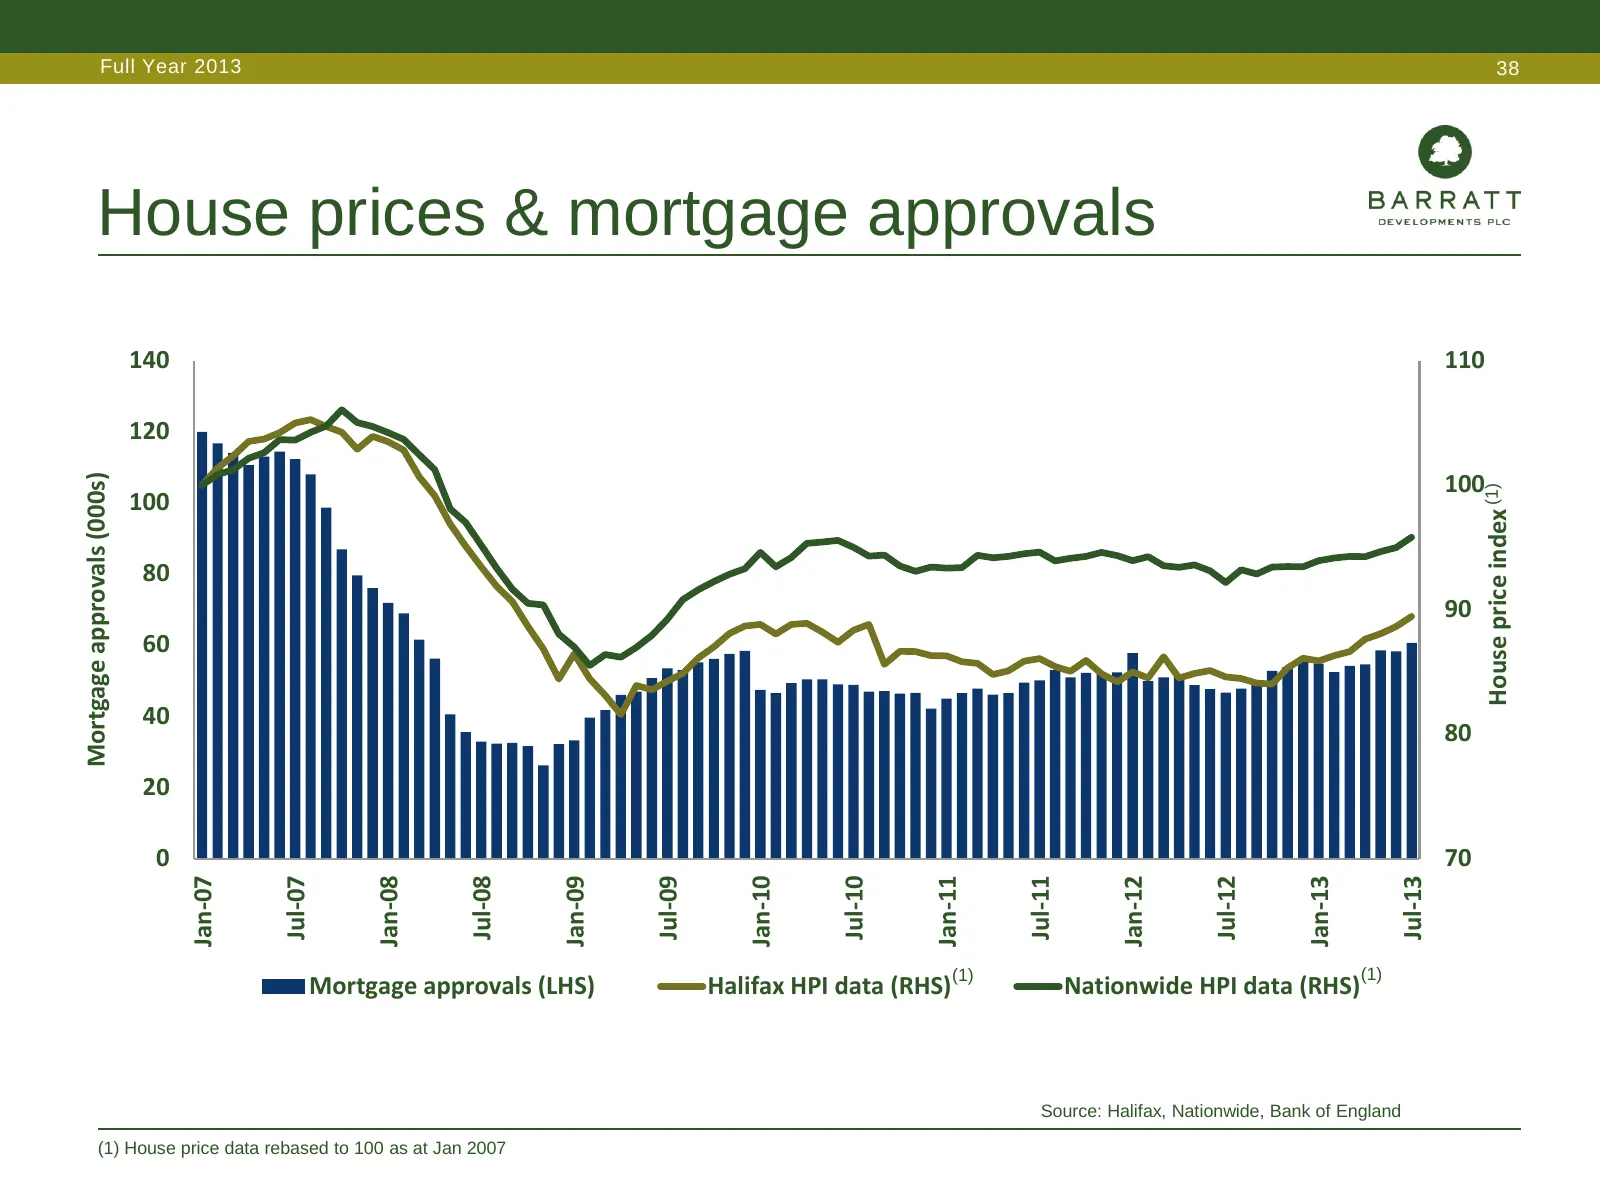
Full Year 2013 38 House prices & mortgage approvals 140 110 120 Mortgage approvals (000s) 100 House price index (1) 100 80 90 60 40 80 20 0 70 Jul-07 Jul-08 Jul-09 Jul-10 Jul-11 Jul-12 Jul-13 Jan-07 Jan-08 Jan-09 Jan-10 Jan-11 Jan-12 Jan-13 (1) Mortgage approvals (LHS) Halifax HPI data (RHS)(1) Nati
Slide 39: New build mortgage advantage
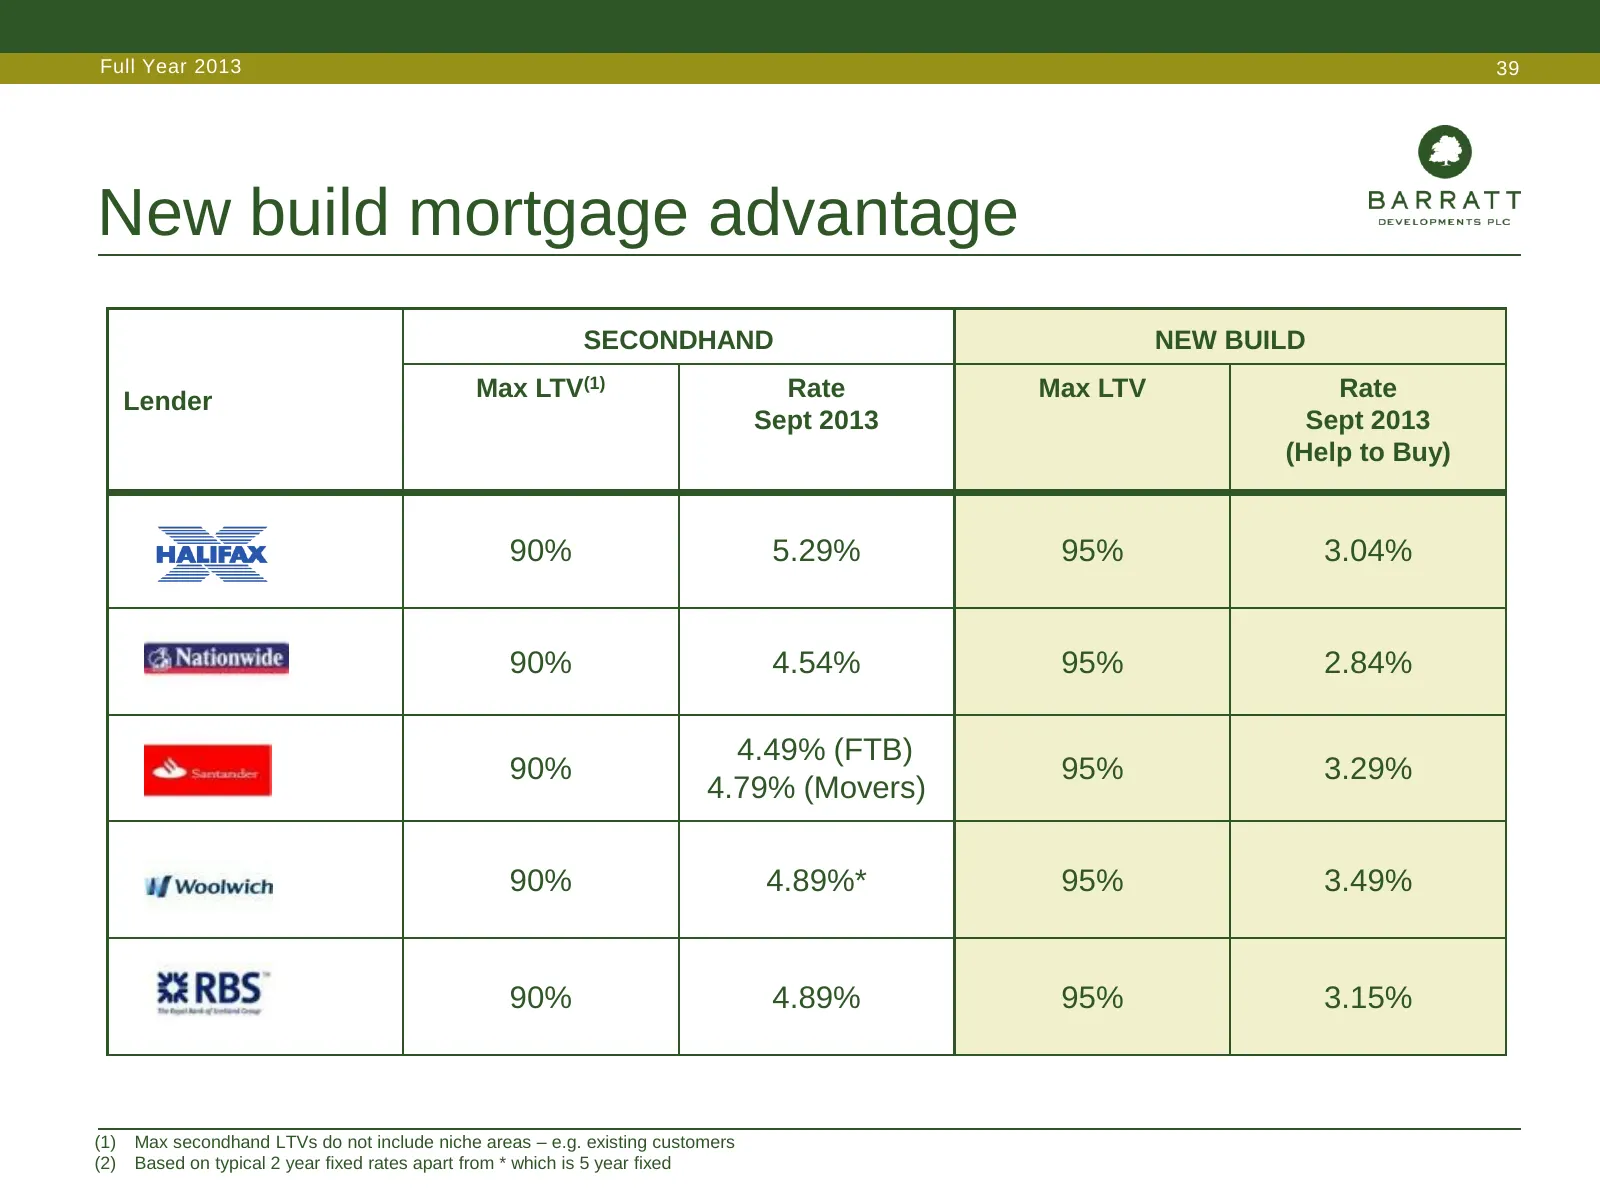
Full Year 2013 39 New build mortgage advantage SECONDHAND NEW BUILD Lender Max LTV(1) Rate Max LTV Rate Sept 2013 Sept 2013 (Help to Buy) 90% 5.29% 95% 3.04% 90% 4.54% 95% 2.84% 4.49% (FTB) 90% 95% 3.29% 4.79% (Movers) 90% 4.89%* 95% 3.49% 90% 4.89% 95% 3.15% (1) Max secondhand LTVs do not include n
Slide 40: The Group's key objectives
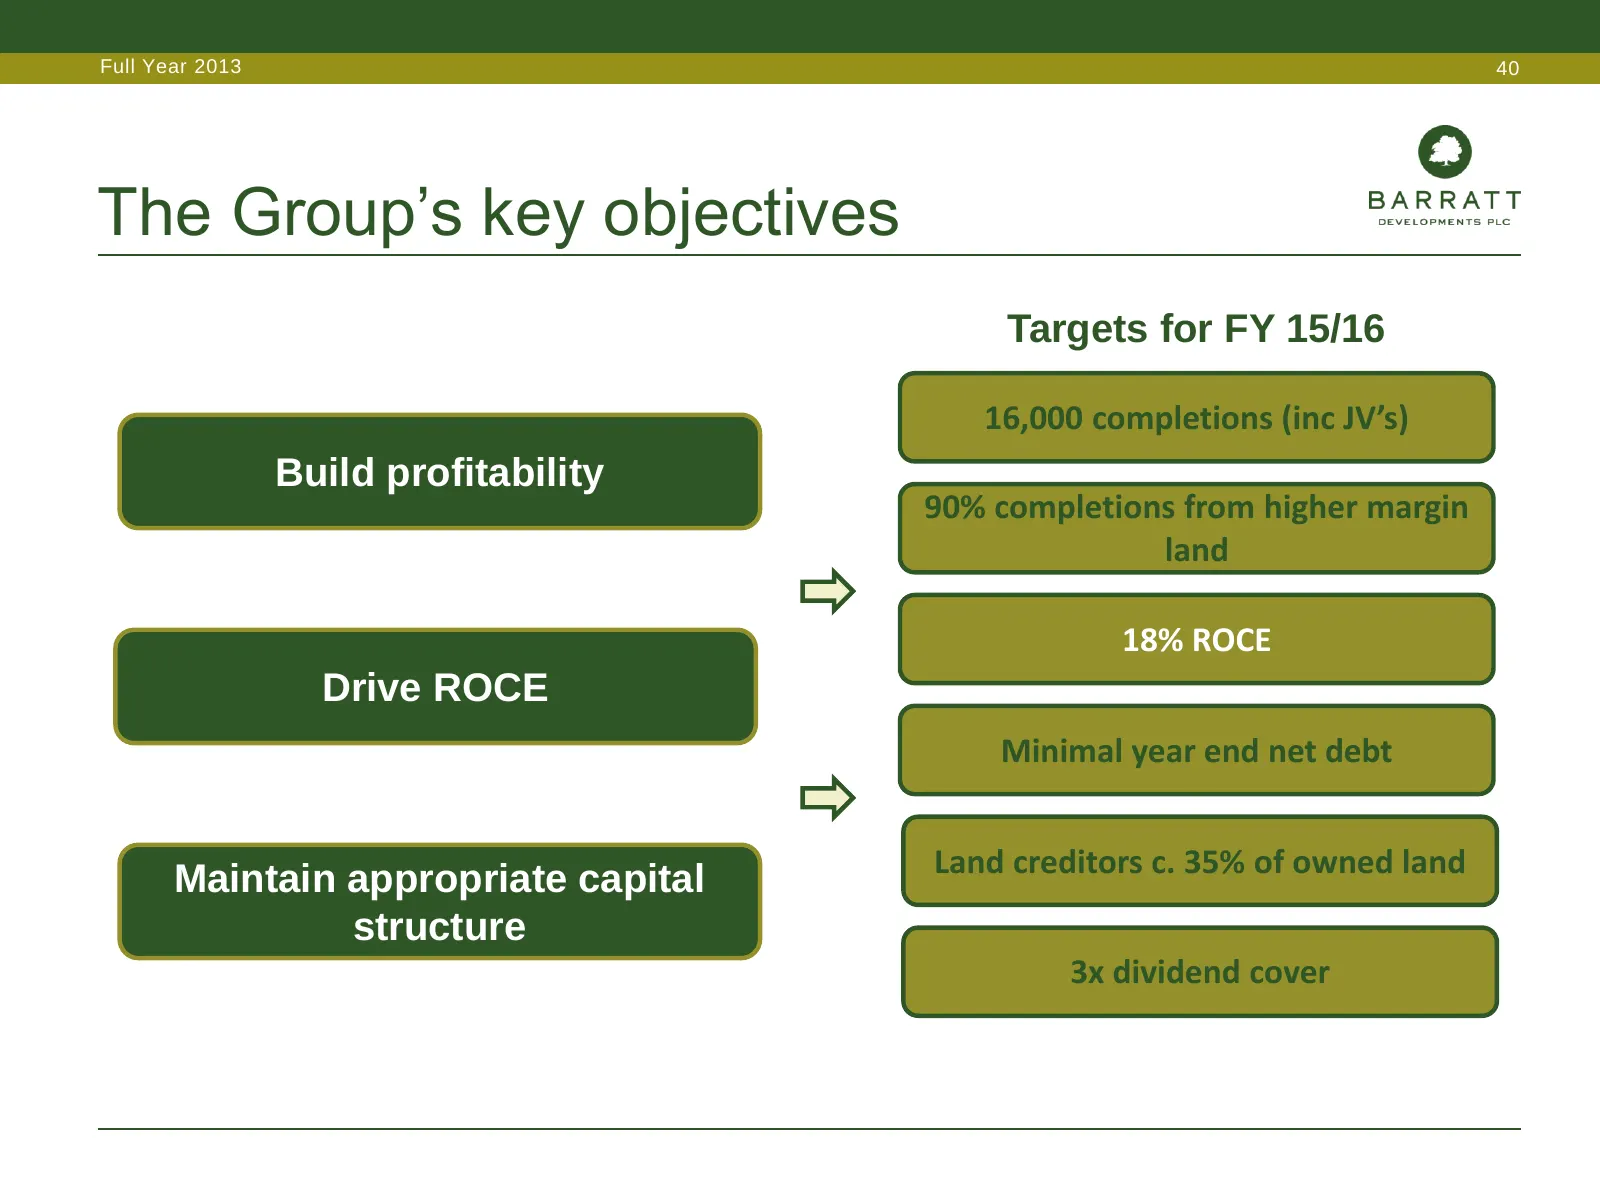
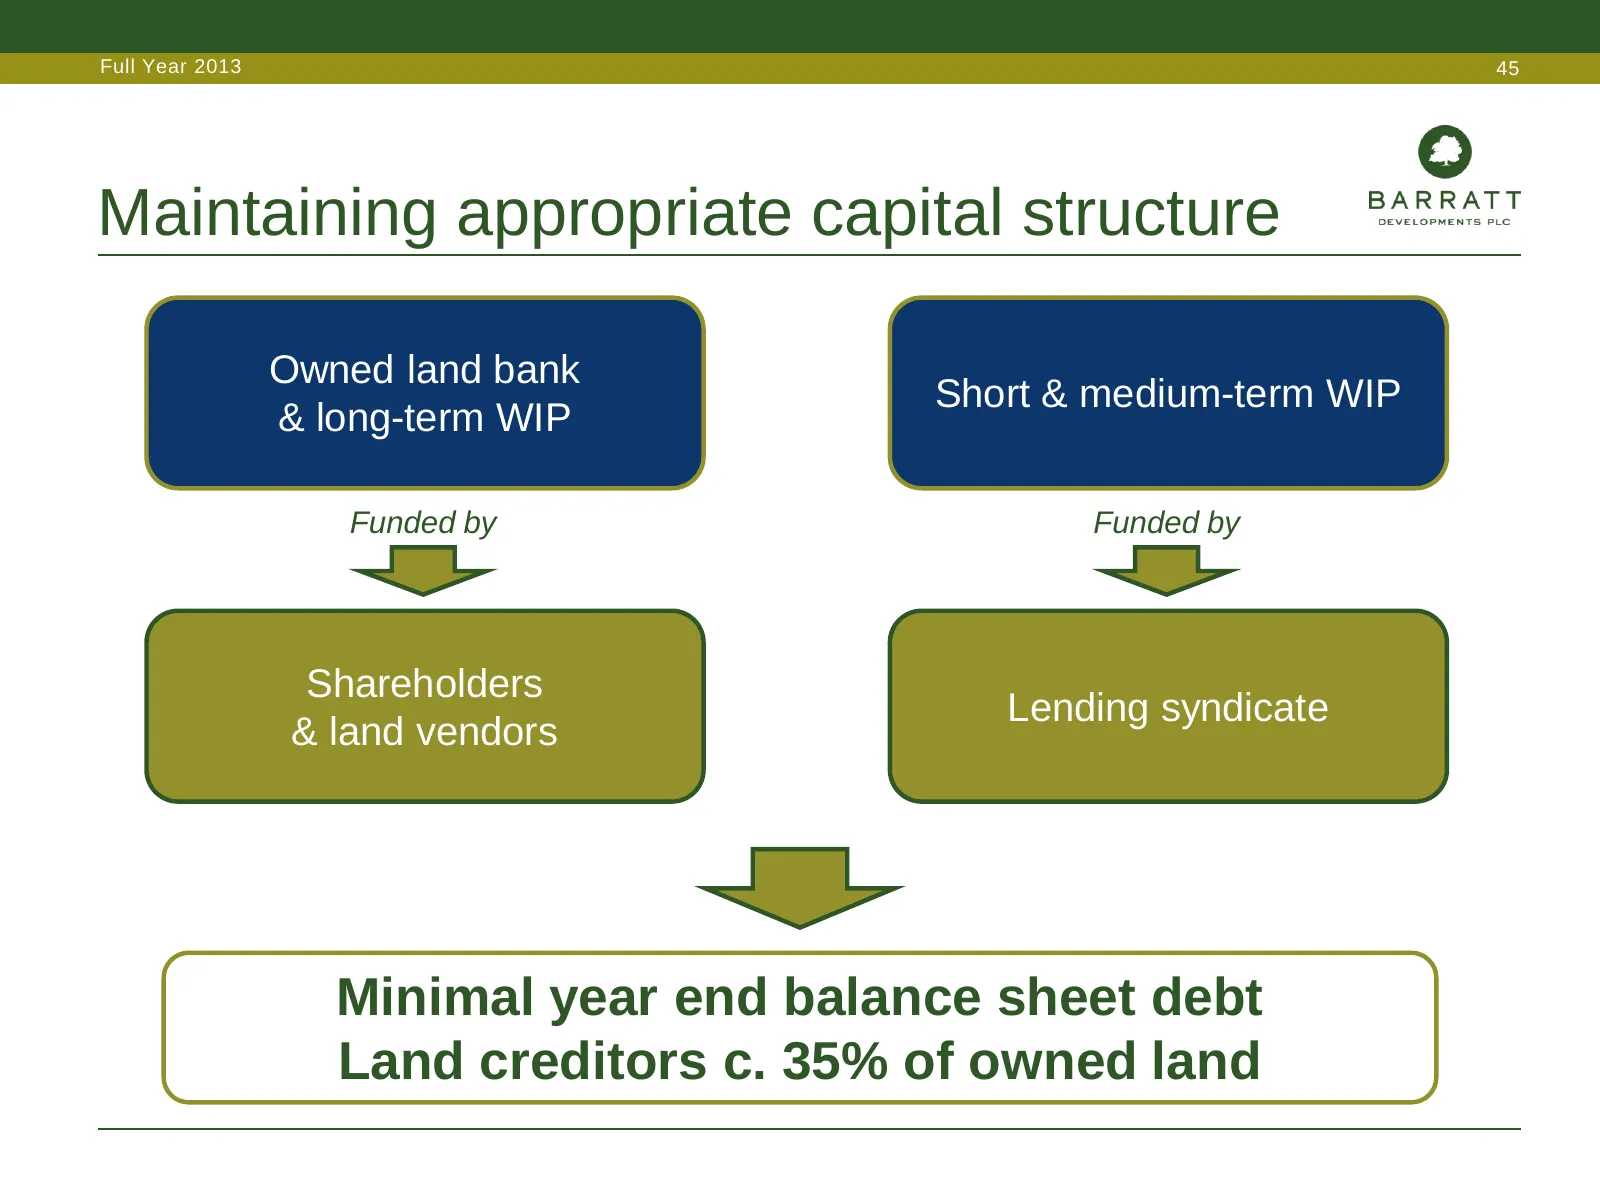
Full Year 2013 40 The Group’s key objectives Targets for FY 15/16 16,000 completions (inc JV’s) Build profitability 90% completions from higher margin land 18% ROCE Drive ROCE Minimal year end net debt Land creditors c. 35% of owned land Maintain appropriate capital structure 3x dividend cover
Slide 41: Building profitability
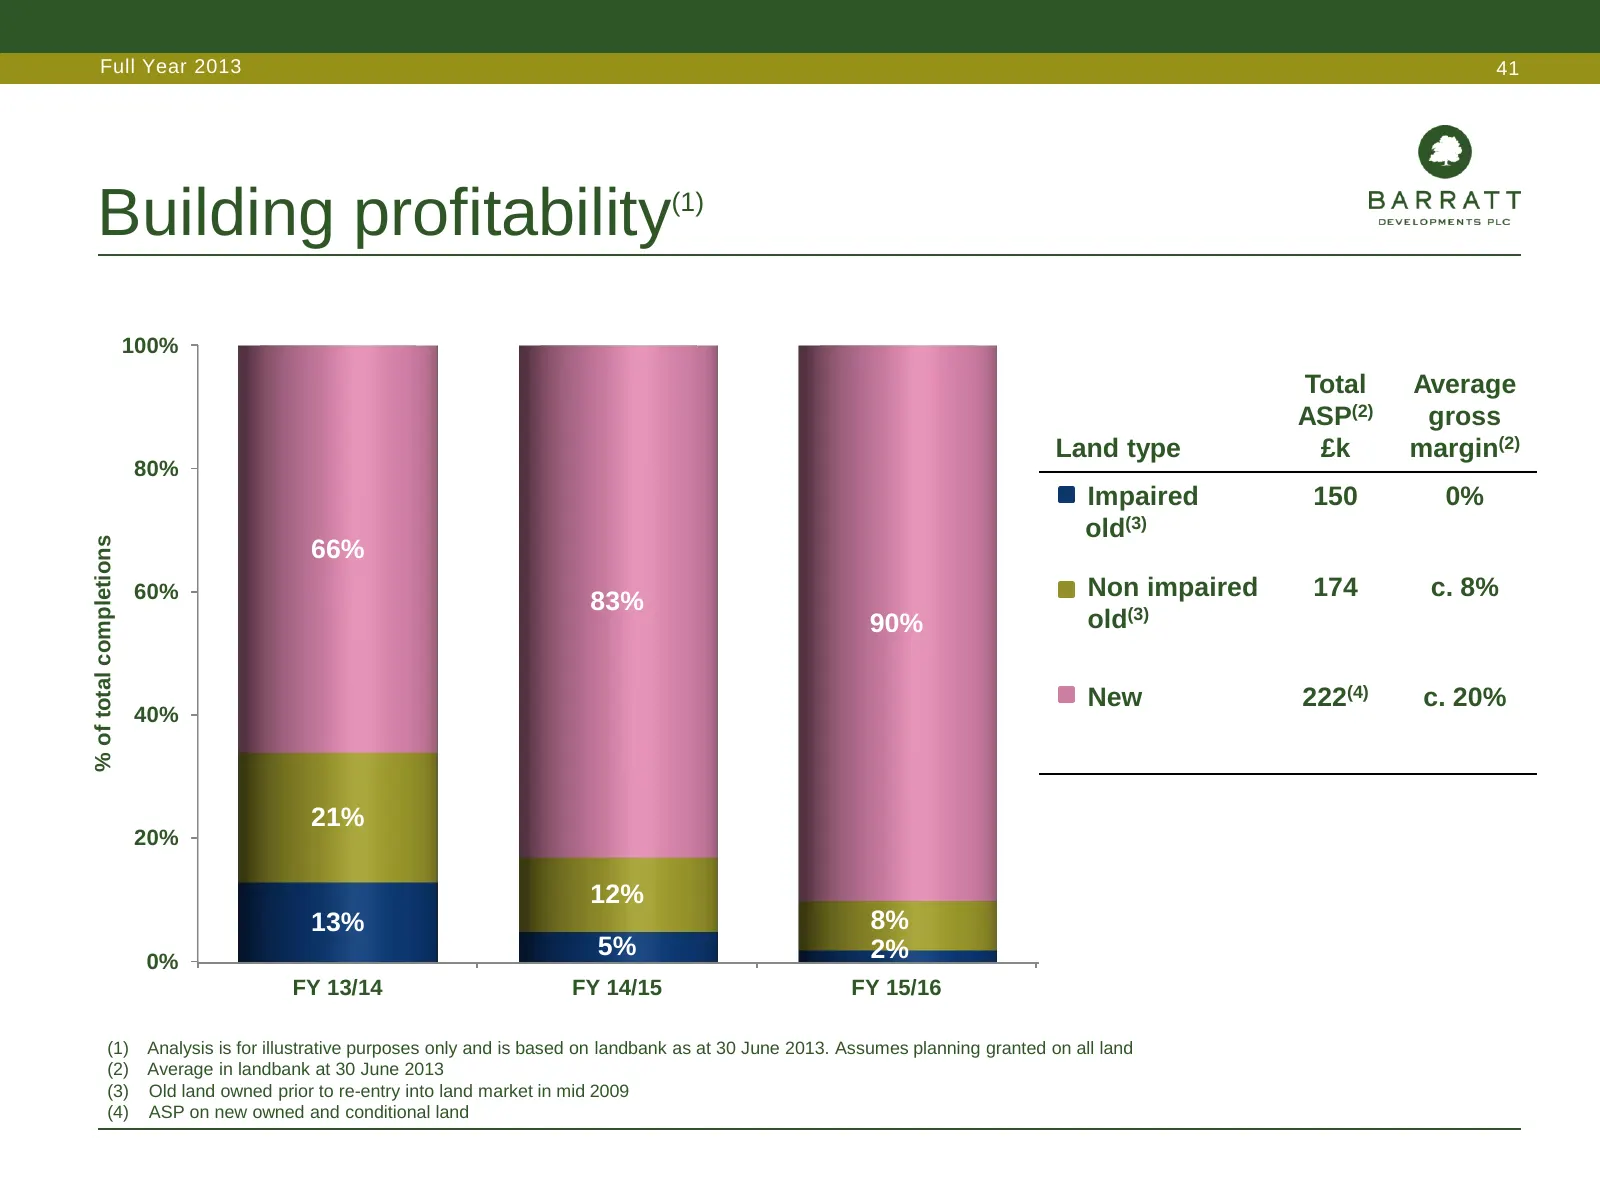
Full Year 2013 41 Building profitability(1) 100% Total Average ASP(2) gross Land type £k margin(2) 80% Impaired 150 0% old(3) % of total completions 66% 60% Non impaired 174 c. 8% 83% 90% old(3) New 222(4) c. 20% 40% 21% 20% 12% 13% 8% 5% 2% 0% FY 13/14 FY 14/15 FY 15/16 (1) Analysis is for illustra
Slide 42: Driving ROCE
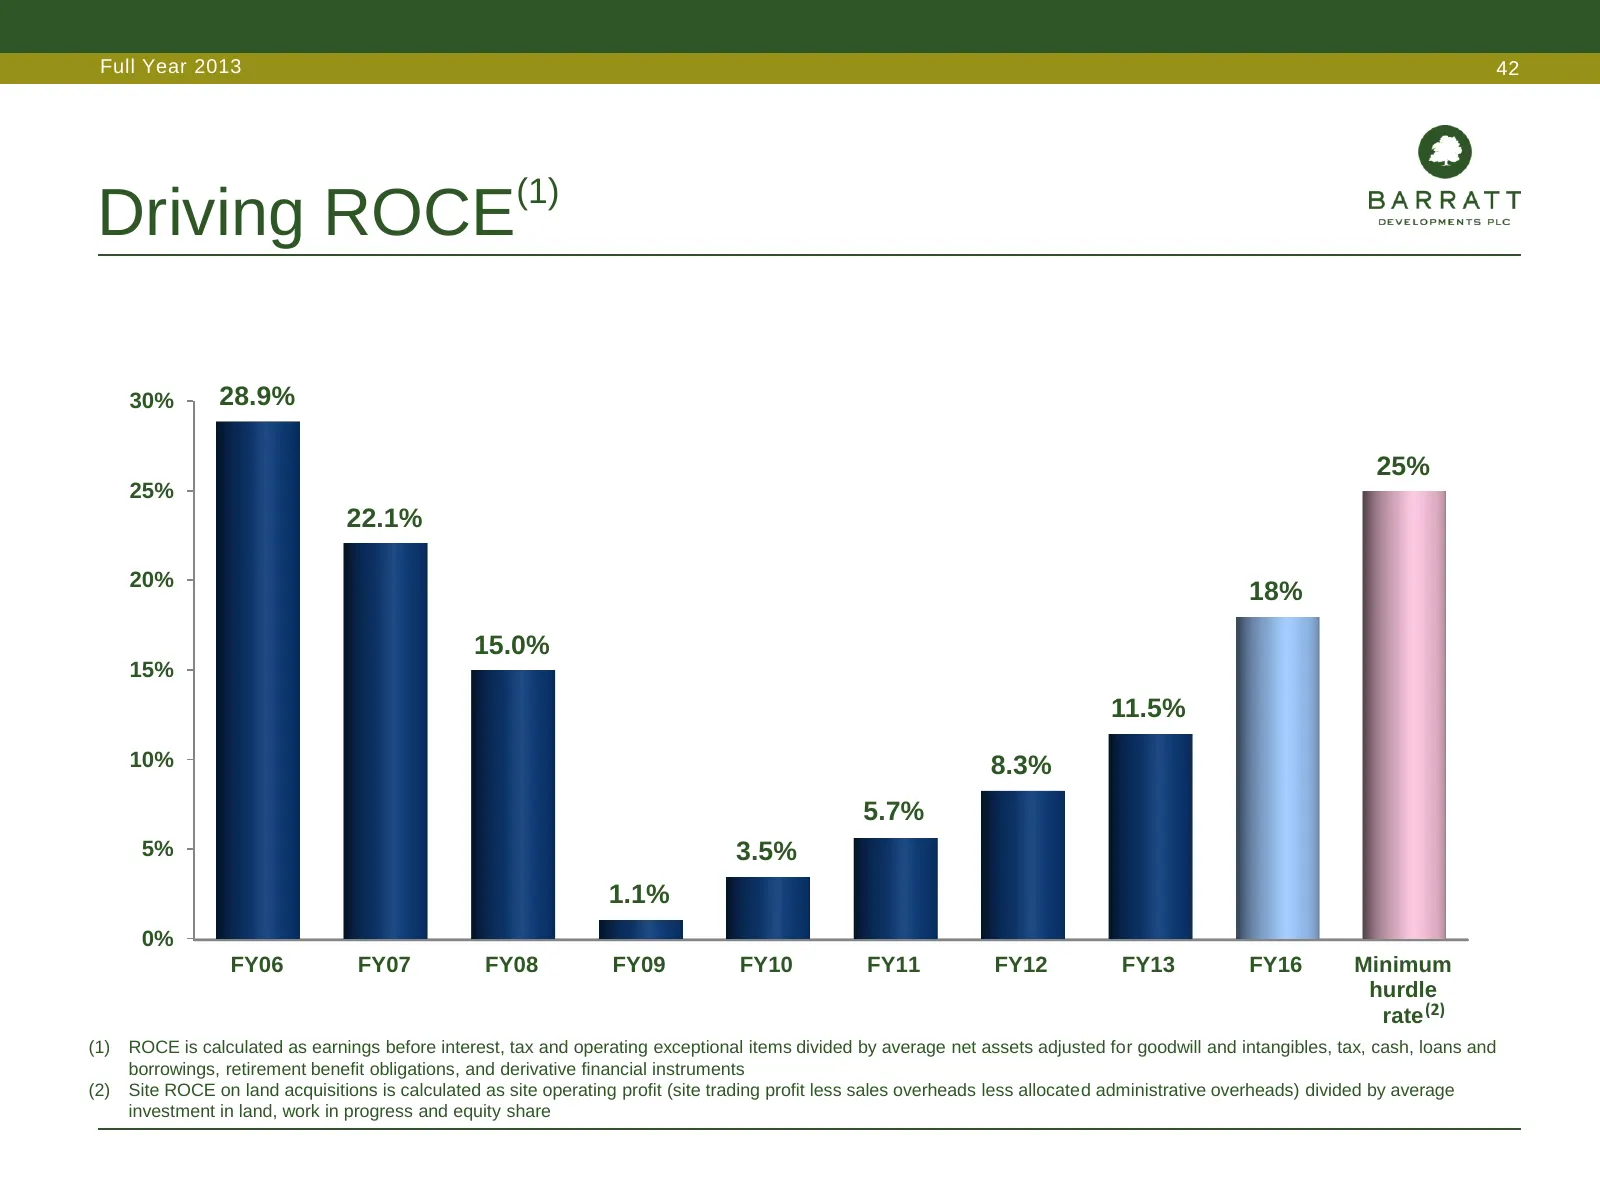
Full Year 2013 42 (1) Driving ROCE 30% 28.9% 25% 25% 22.1% 20% 18% 15.0% 15% 11.5% 10% 8.3% 5.7% 5% 3.5% 1.1% 0% FY06 FY07 FY08 FY09 FY10 FY11 FY12 FY13 FY16 Minimum hurdle rate (2) (1) ROCE is calculated as earnings before interest, tax and operating exceptional items divided by average net assets
Slide 43: Optimised operational model
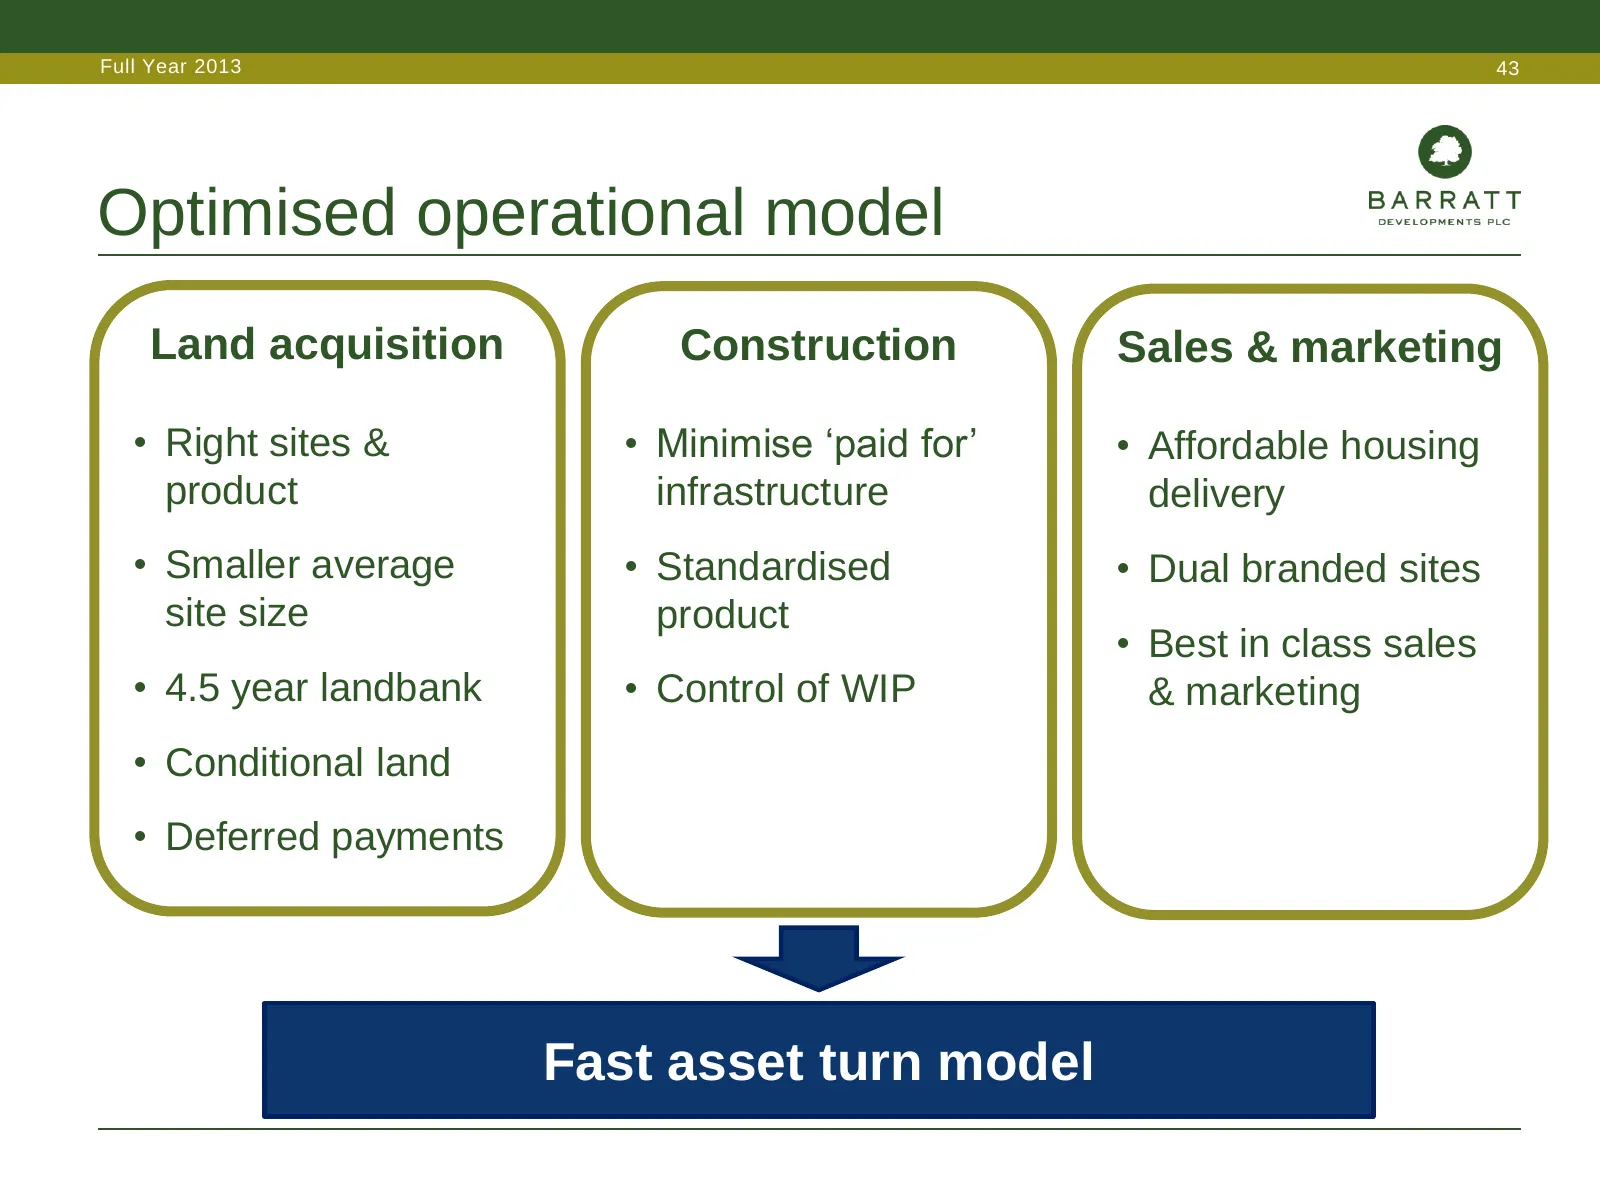
Full Year 2013 43 Optimised operational model Land acquisition Construction Sales & marketing • Right sites & • Minimise ‘paid for’ • Affordable housing product infrastructure delivery • Smaller average • Standardised • Dual branded sites site size product • Best in class sales • 4.5 year landbank •
Slide 44: Performance of new land to date
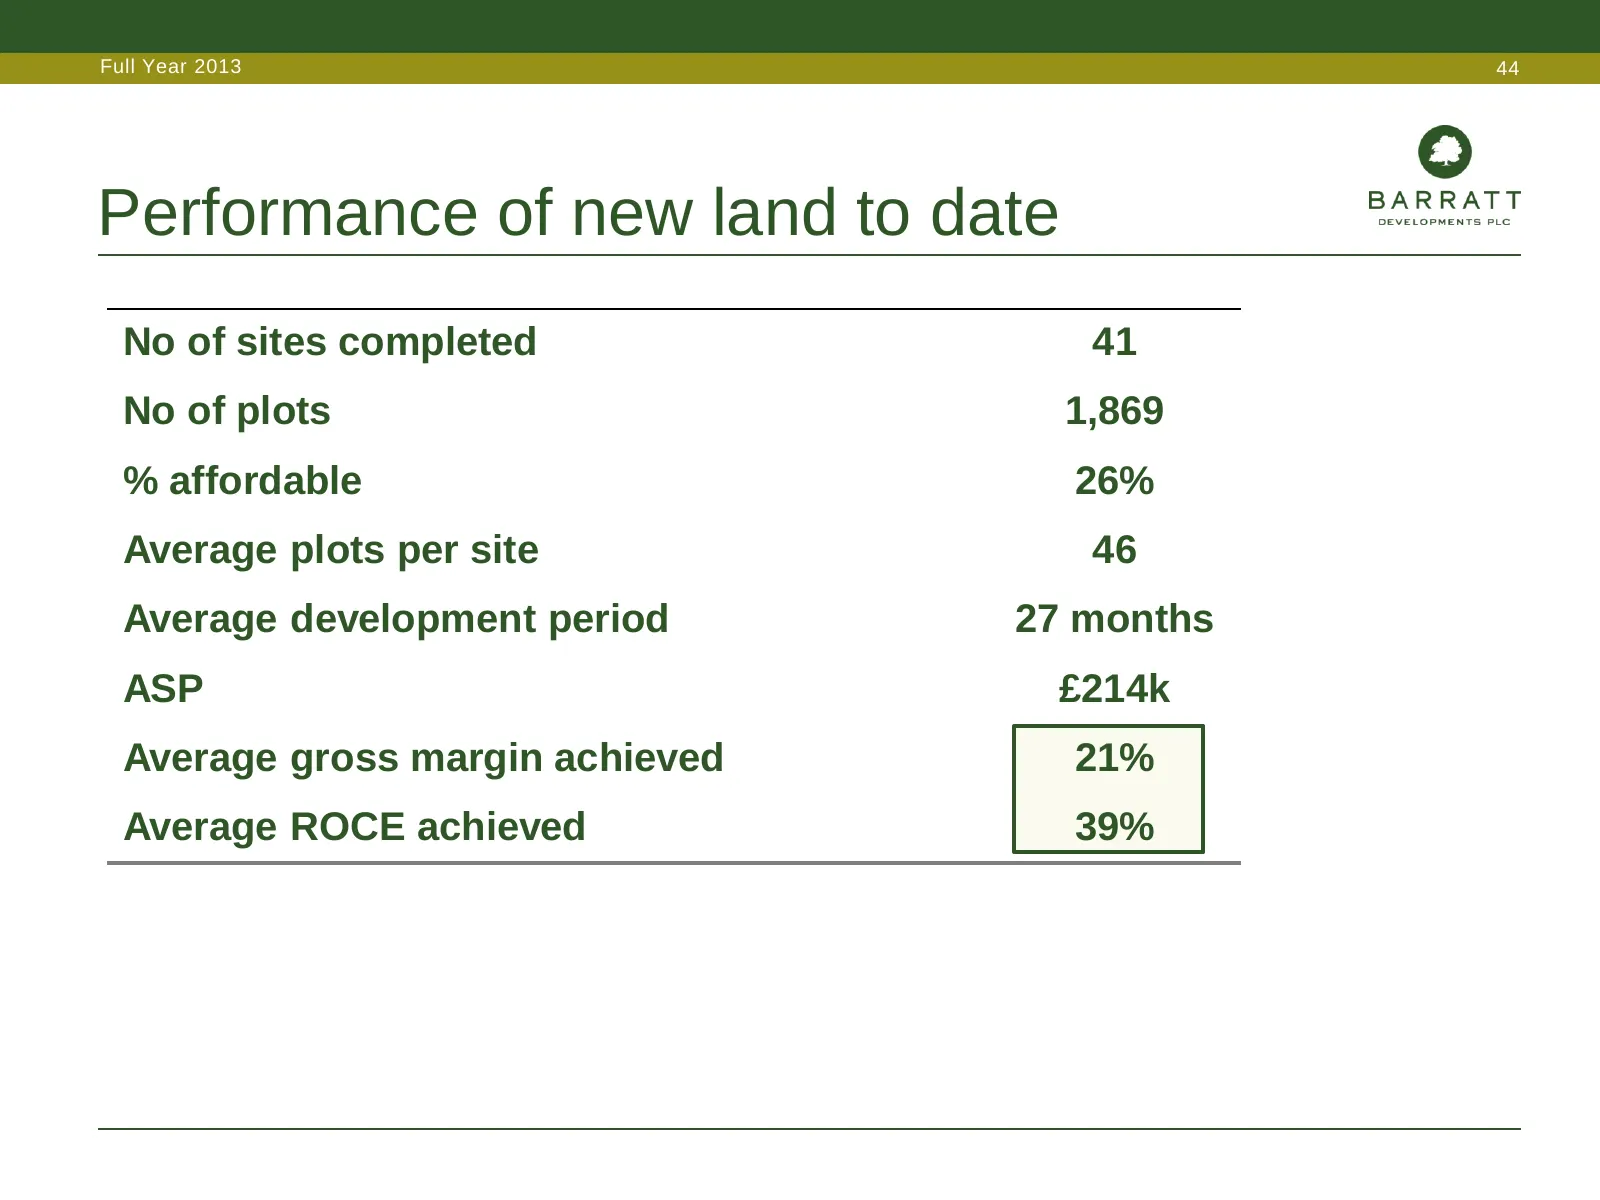
Full Year 2013 44 Performance of new land to date No of sites completed 41 No of plots 1,869 % affordable 26% Average plots per site 46 Average development period 27 months ASP £214k Average gross margin achieved 21% Average ROCE achieved 39%
Slide 45: Maintaining appropriate capital structure
Full Year 2013 45 Maintaining appropriate capital structure Owned land bank Short & medium-term WIP & long-term WIP Funded by Funded by Shareholders Lending syndicate & land vendors Minimal year end balance sheet debt Land creditors c. 35% of owned land
Slide 46: Progressive dividend policy
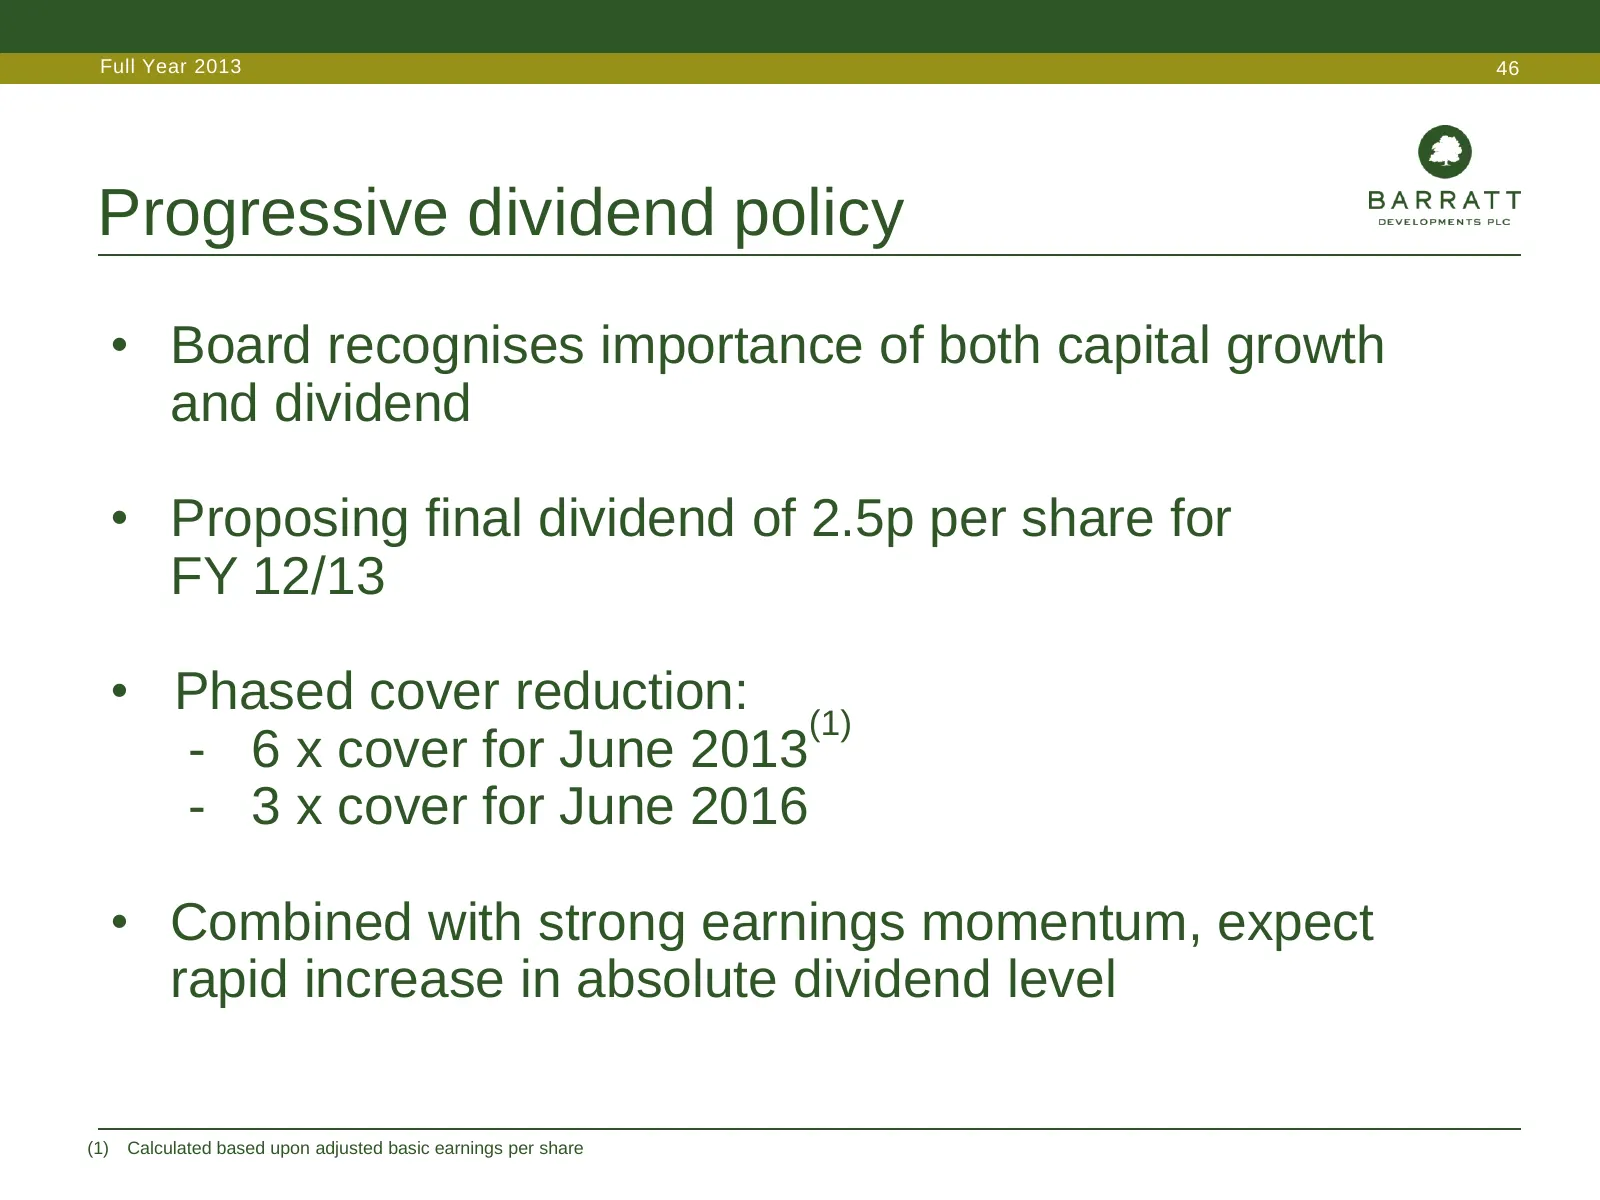
Full Year 2013 46 Progressive dividend policy • Board recognises importance of both capital growth and dividend • Proposing final dividend of 2.5p per share for FY 12/13 • Phased cover reduction: (1) - 6 x cover for June 2013 - 3 x cover for June 2016 • Combined with strong earnings momentum, expect
Slide 47: Current trading
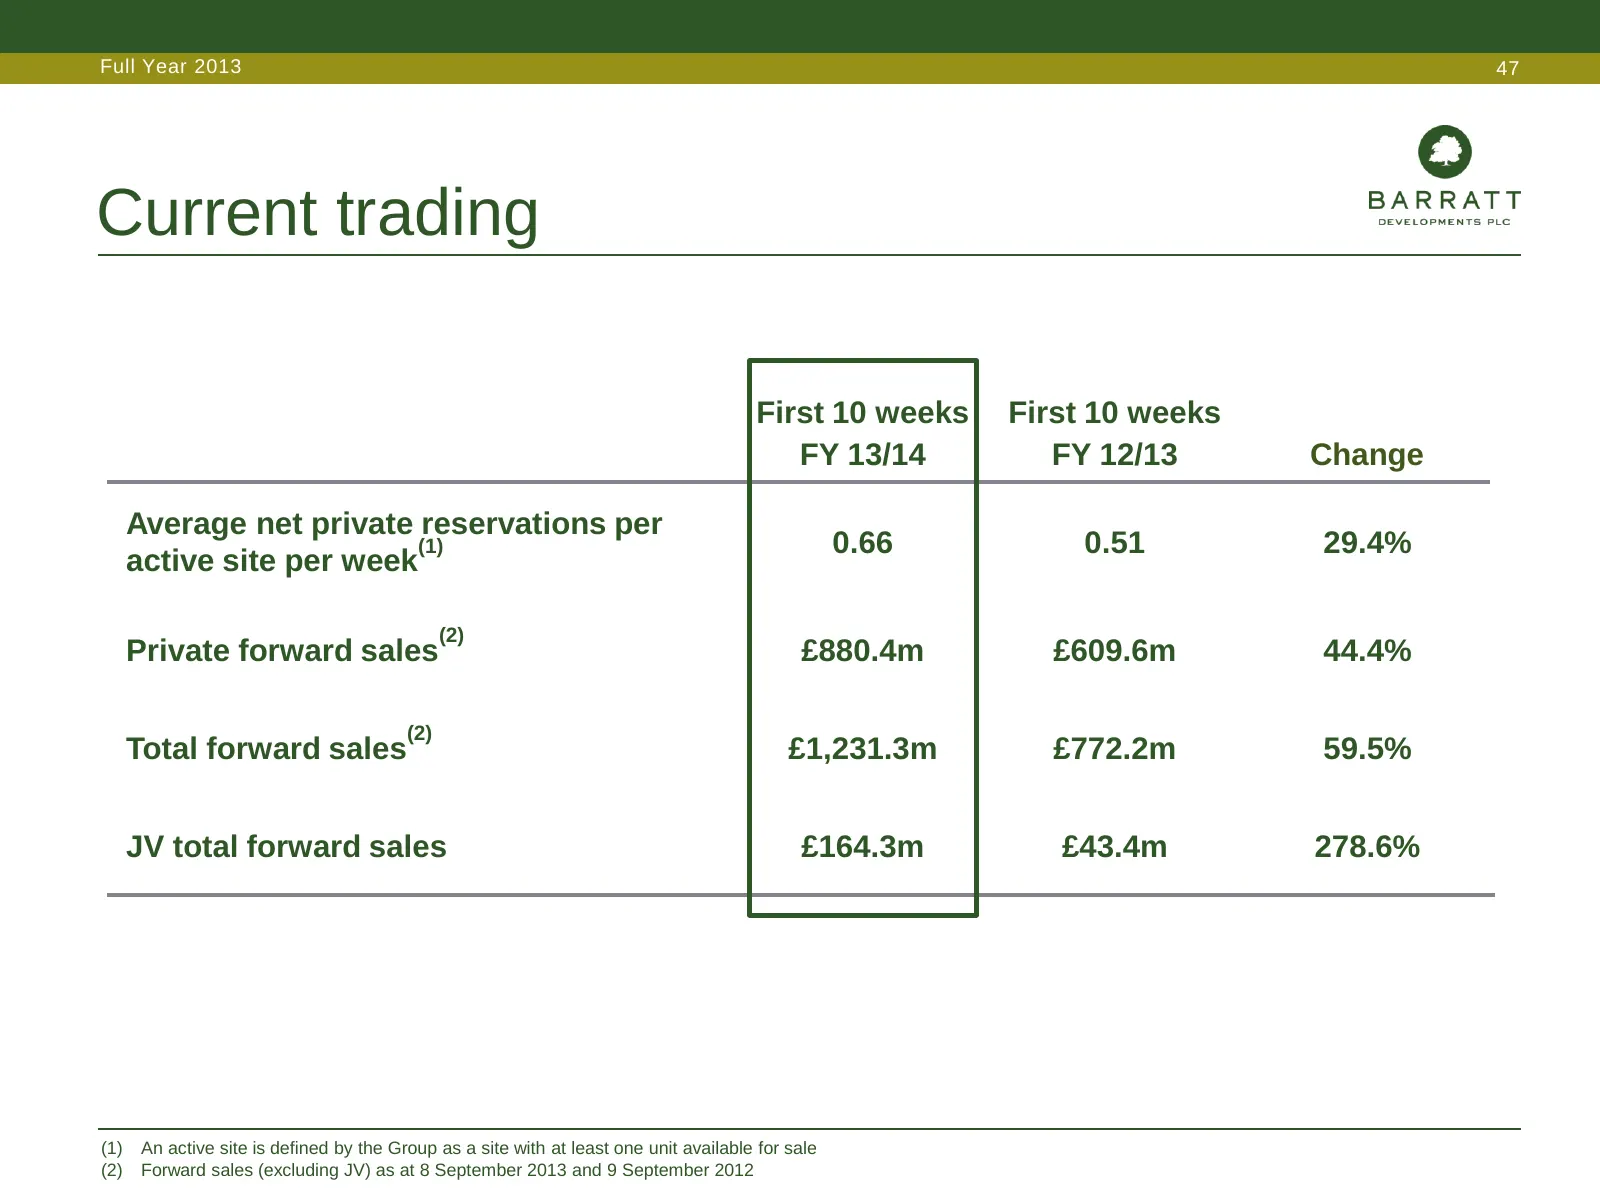
Full Year 2013 47 Current trading First 10 weeks First 10 weeks FY 13/14 FY 12/13 Change Average net private reservations per (1) 0.66 0.51 29.4% active site per week (2) Private forward sales £880.4m £609.6m 44.4% (2) Total forward sales £1,231.3m £772.2m 59.5% JV total forward sales £164.3m £43.4m
Slide 48: Positive on outlook
Full Year 2013 48 Positive on outlook • Strong market conditions • Discounts reducing • Maximising this opportunity to drive Group’s objectives harder • Confident we will deliver a substantially improved performance in FY 13/14
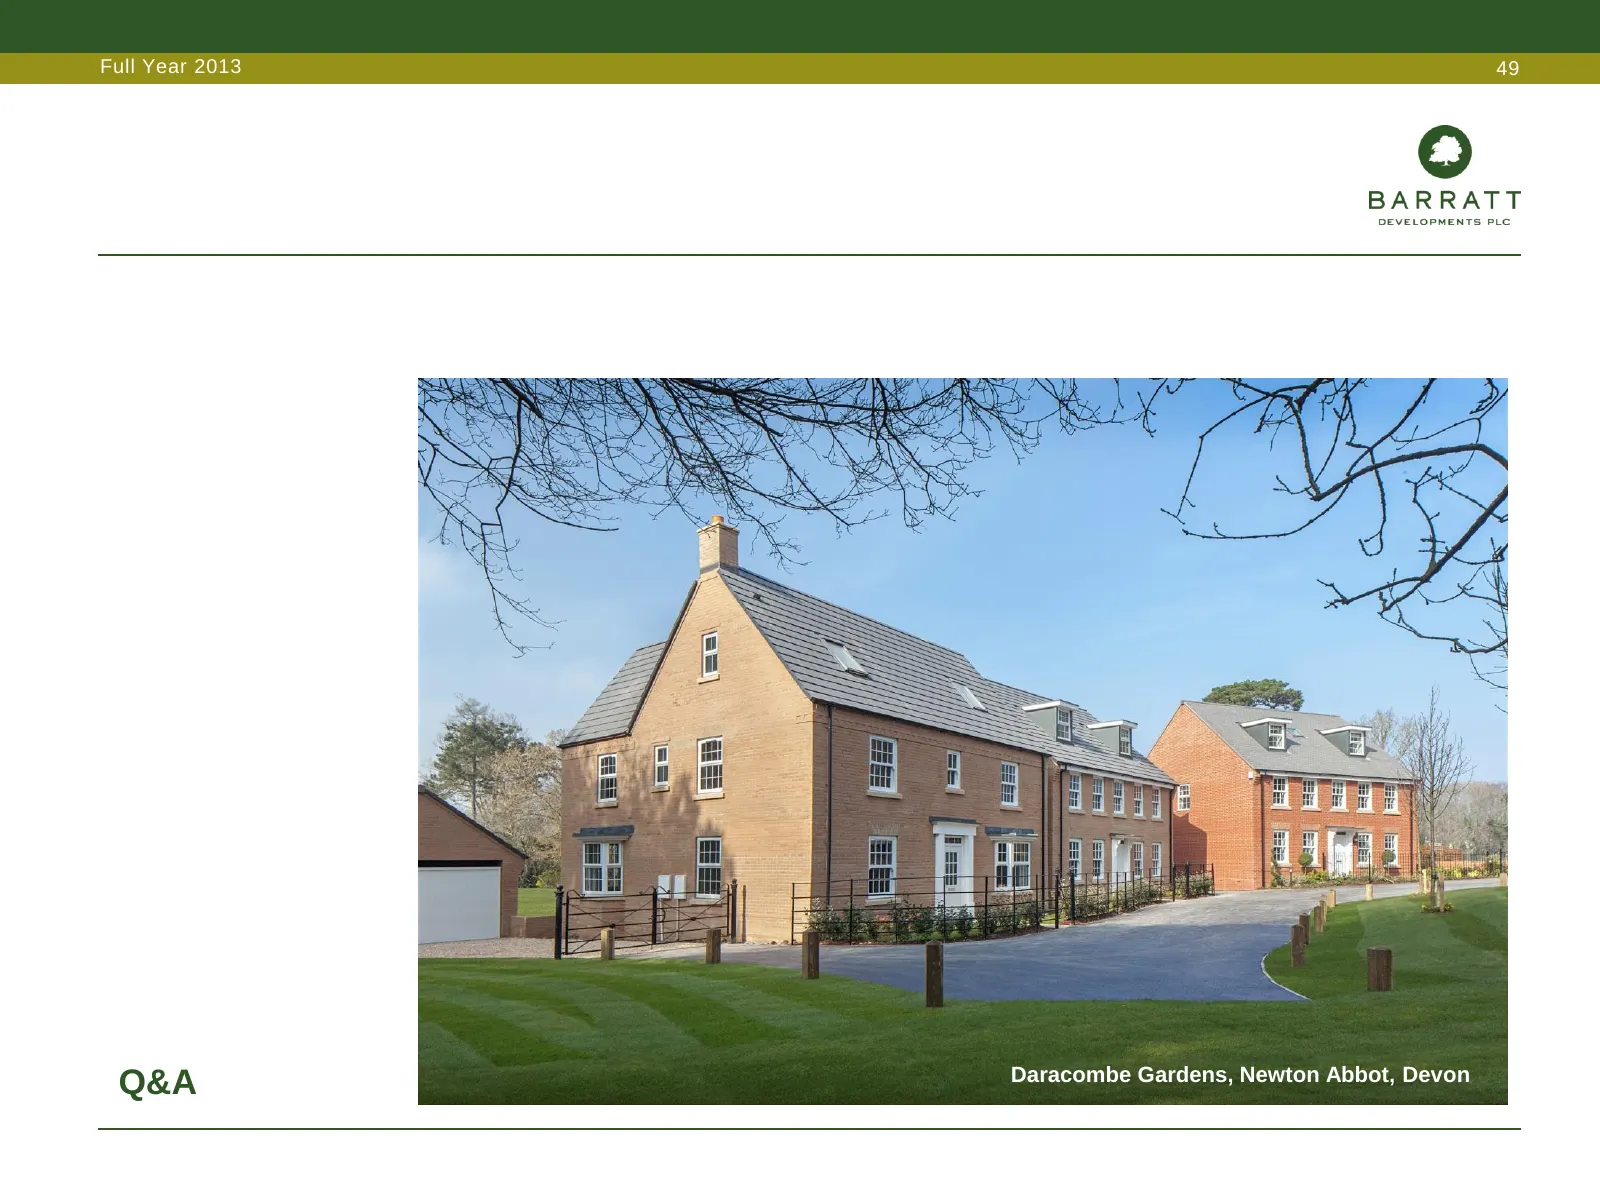
Slide 49: Q&A
Full Year 2013 49 Daracombe Gardens, Newton Abbot, Devon Q&A Old Merchant Taylors, Croxley Green
Slide 50: Appendices
Full Year 2013 50 Appendices Page • Landbank by land type 51 • Balance sheet – landbank 52 • Approved land payment profile 53 • Land creditors payment profile 54 • Land creditors by type 55 • Balance sheet – stock & WIP 56 • Net interest charge analysis – non-cash 57 • Financing arrangements 58 • Fo
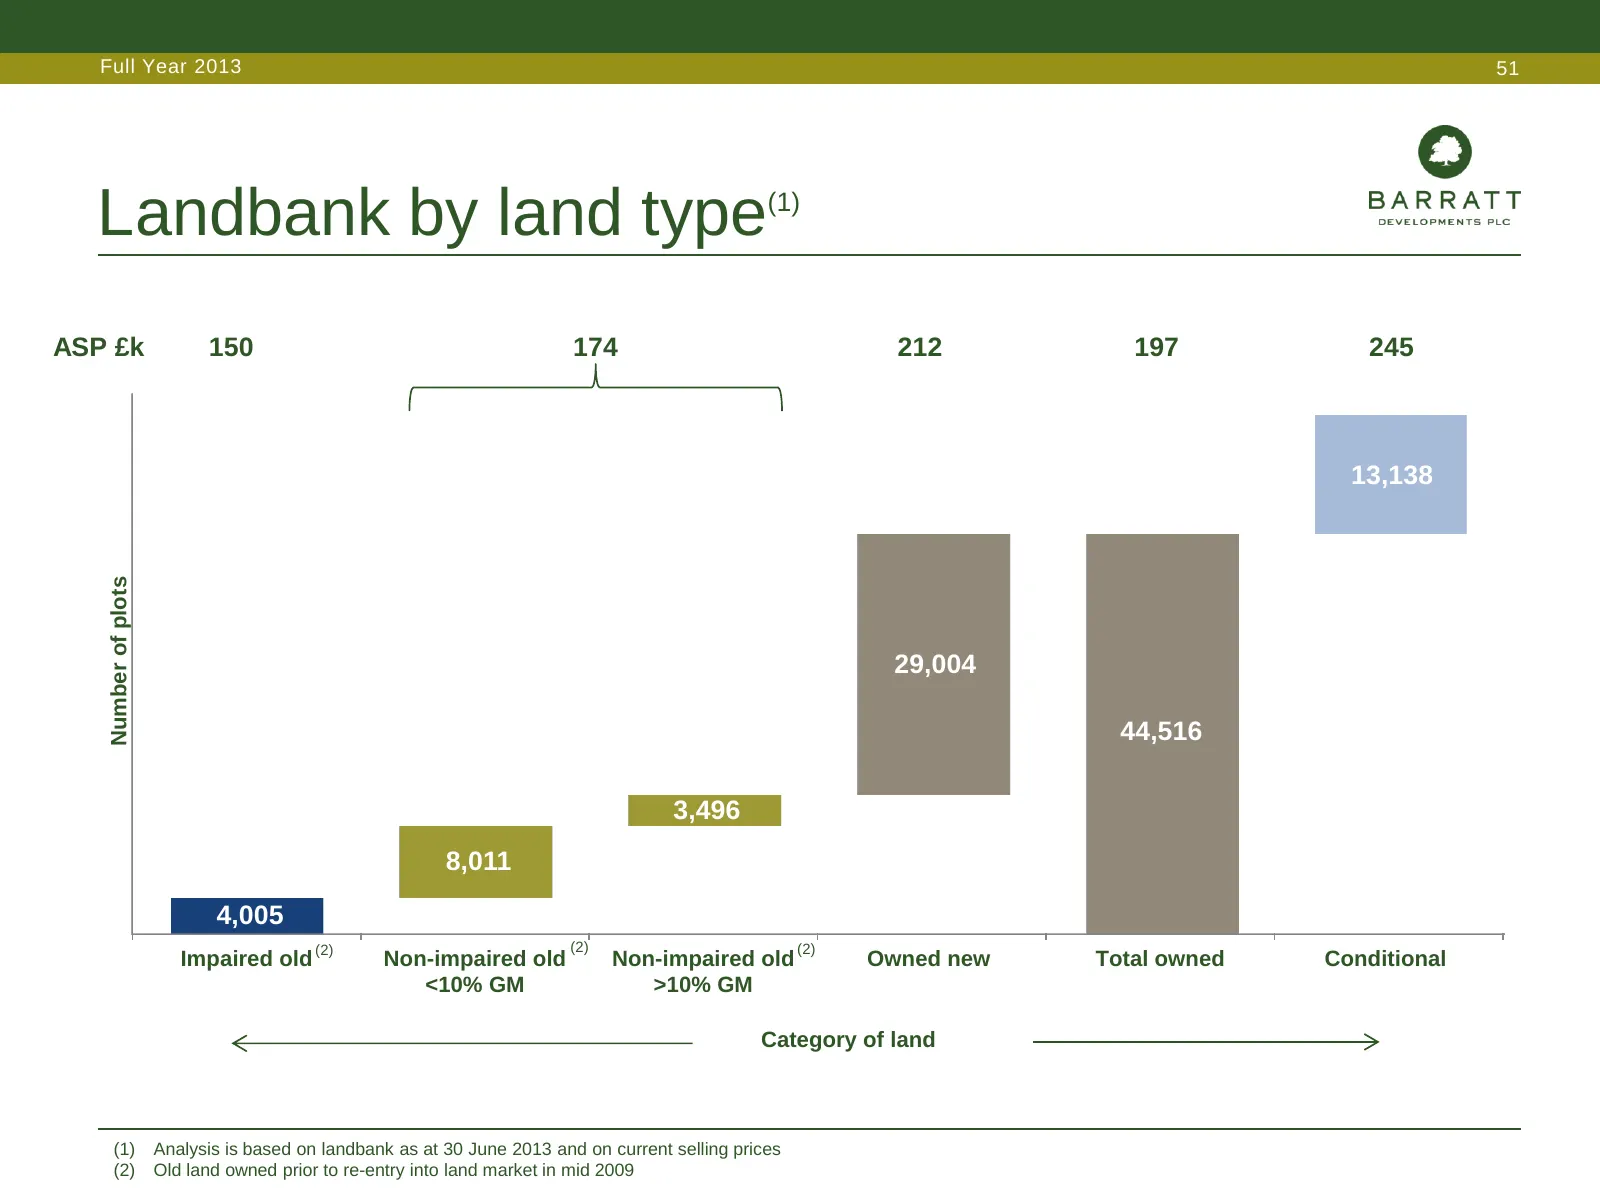
Slide 51: Landbank by land type
Full Year 2013 51 Landbank by land type (1) ASP £k 150 174 212 197 245 13,138 Number of plots 29,004 44,516 3,496 8,011 4,005 (2) (2) Impaired old (2) Non-impaired old Non-impaired old Owned new Total owned Conditional <10% GM >10% GM Category of land (1) Analysis is based on landbank as at 30 June
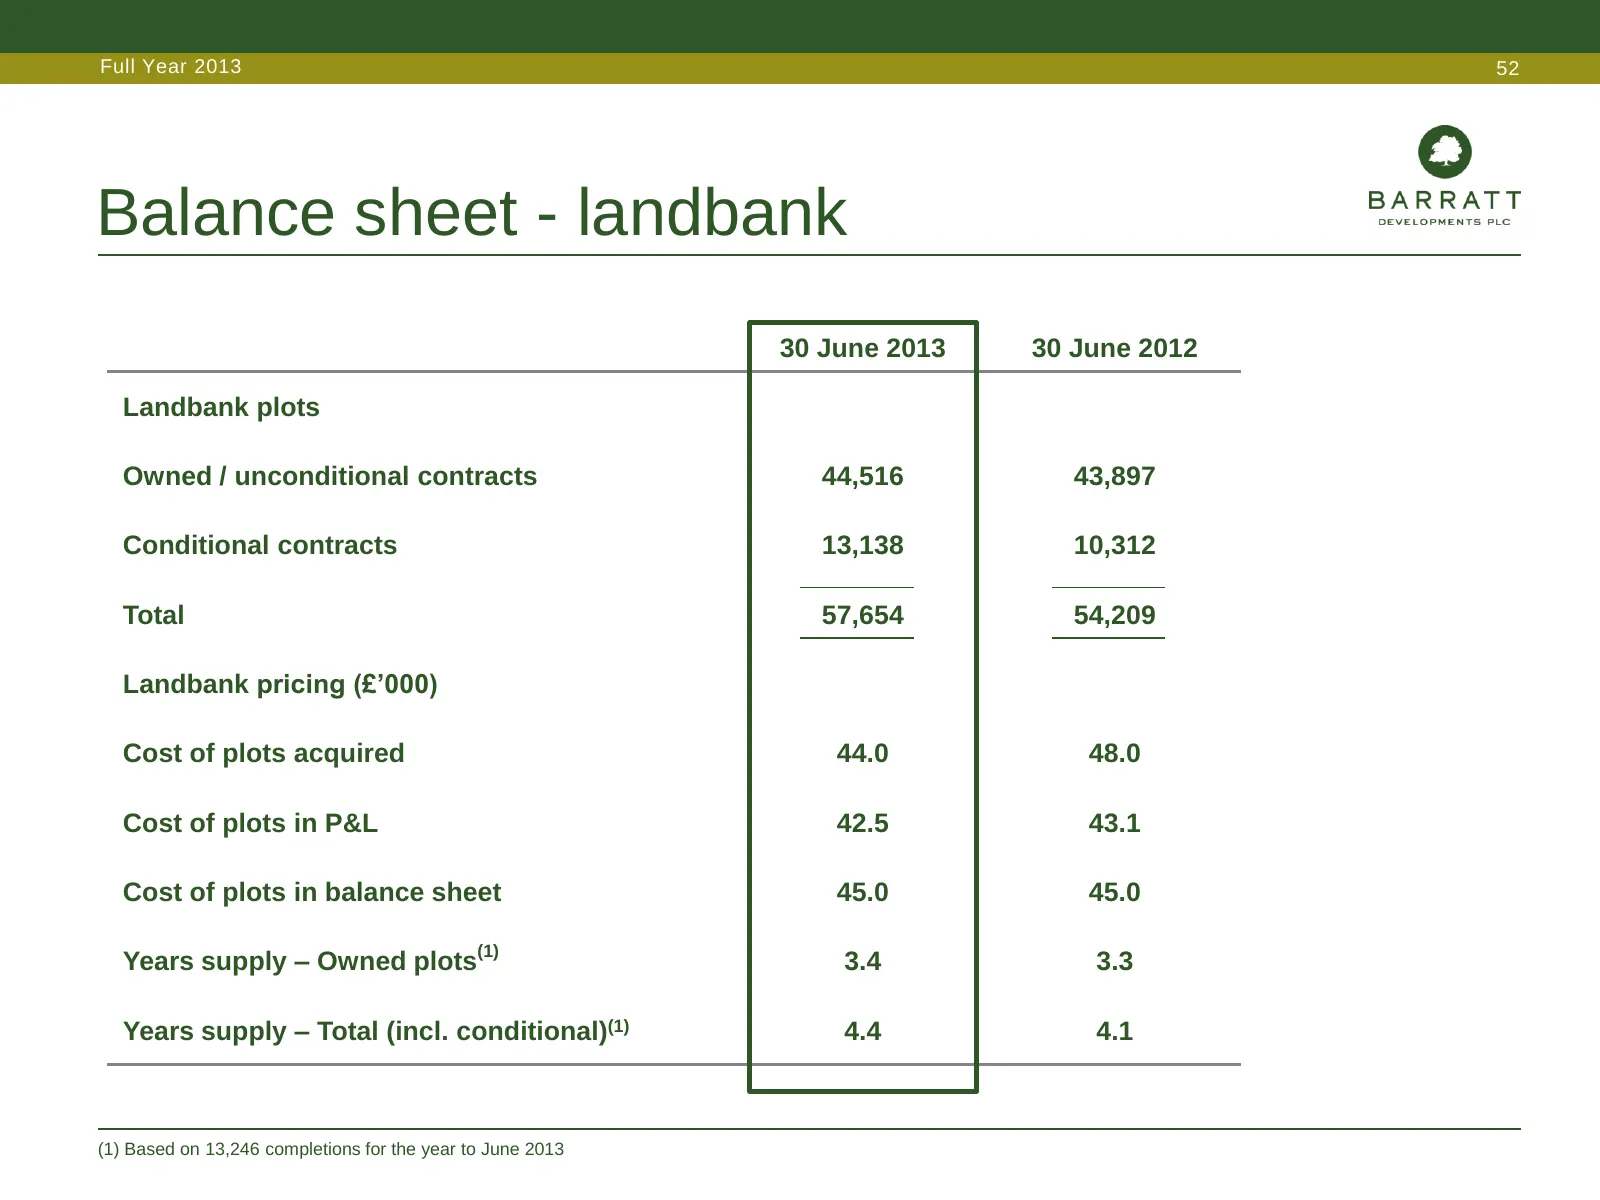
Slide 52: Balance sheet - landbank
Full Year 2013 52 Balance sheet - landbank 30 June 2013 30 June 2012 Landbank plots Owned / unconditional contracts 44,516 43,897 Conditional contracts 13,138 10,312 Total 57,654 54,209 Landbank pricing (£’000) Cost of plots acquired 44.0 48.0 Cost of plots in P&L 42.5 43.1 Cost of plots in balance
Slide 53: Approved land payment profile
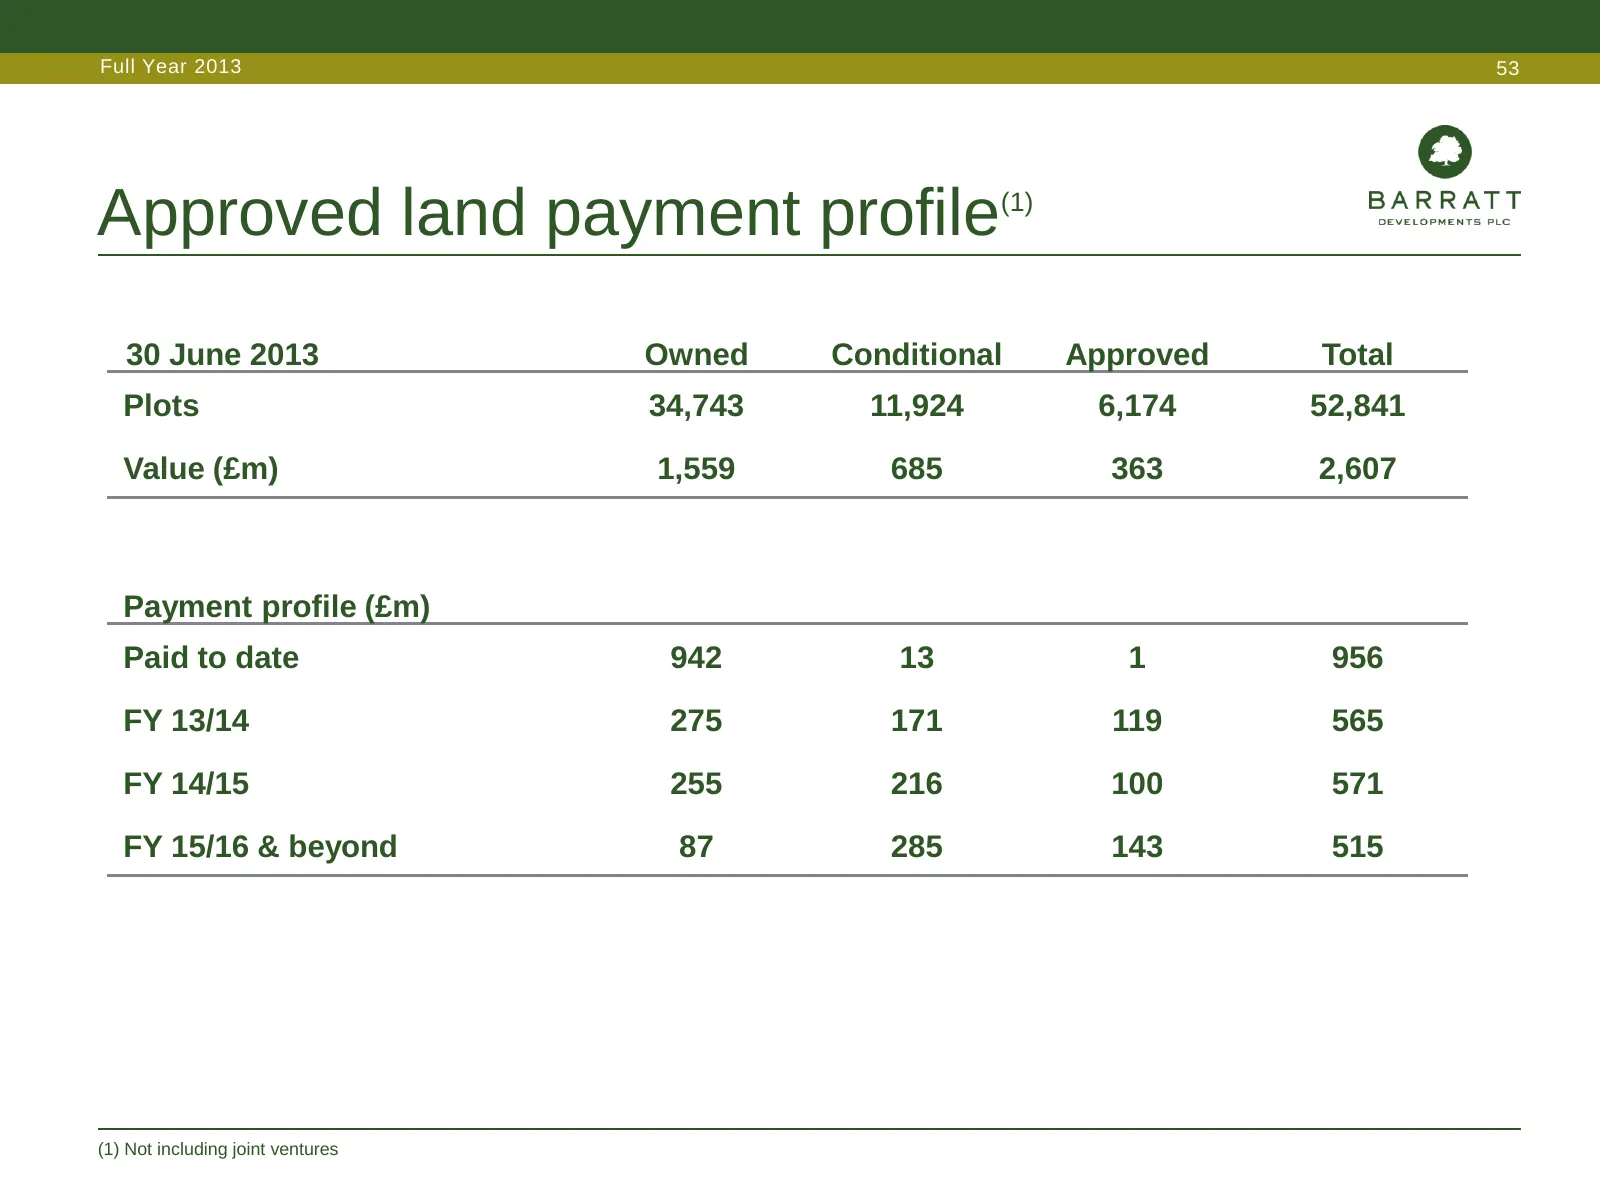
Full Year 2013 53 Approved land payment profile (1) 30 June 2013 Owned Conditional Approved Total Plots 34,743 11,924 6,174 52,841 Value (£m) 1,559 685 363 2,607 Payment profile (£m) Paid to date 942 13 1 956 FY 13/14 275 171 119 565 FY 14/15 255 216 100 571 FY 15/16 & beyond 87 285 143 515 (1) Not
Slide 54: Land creditors payment profile
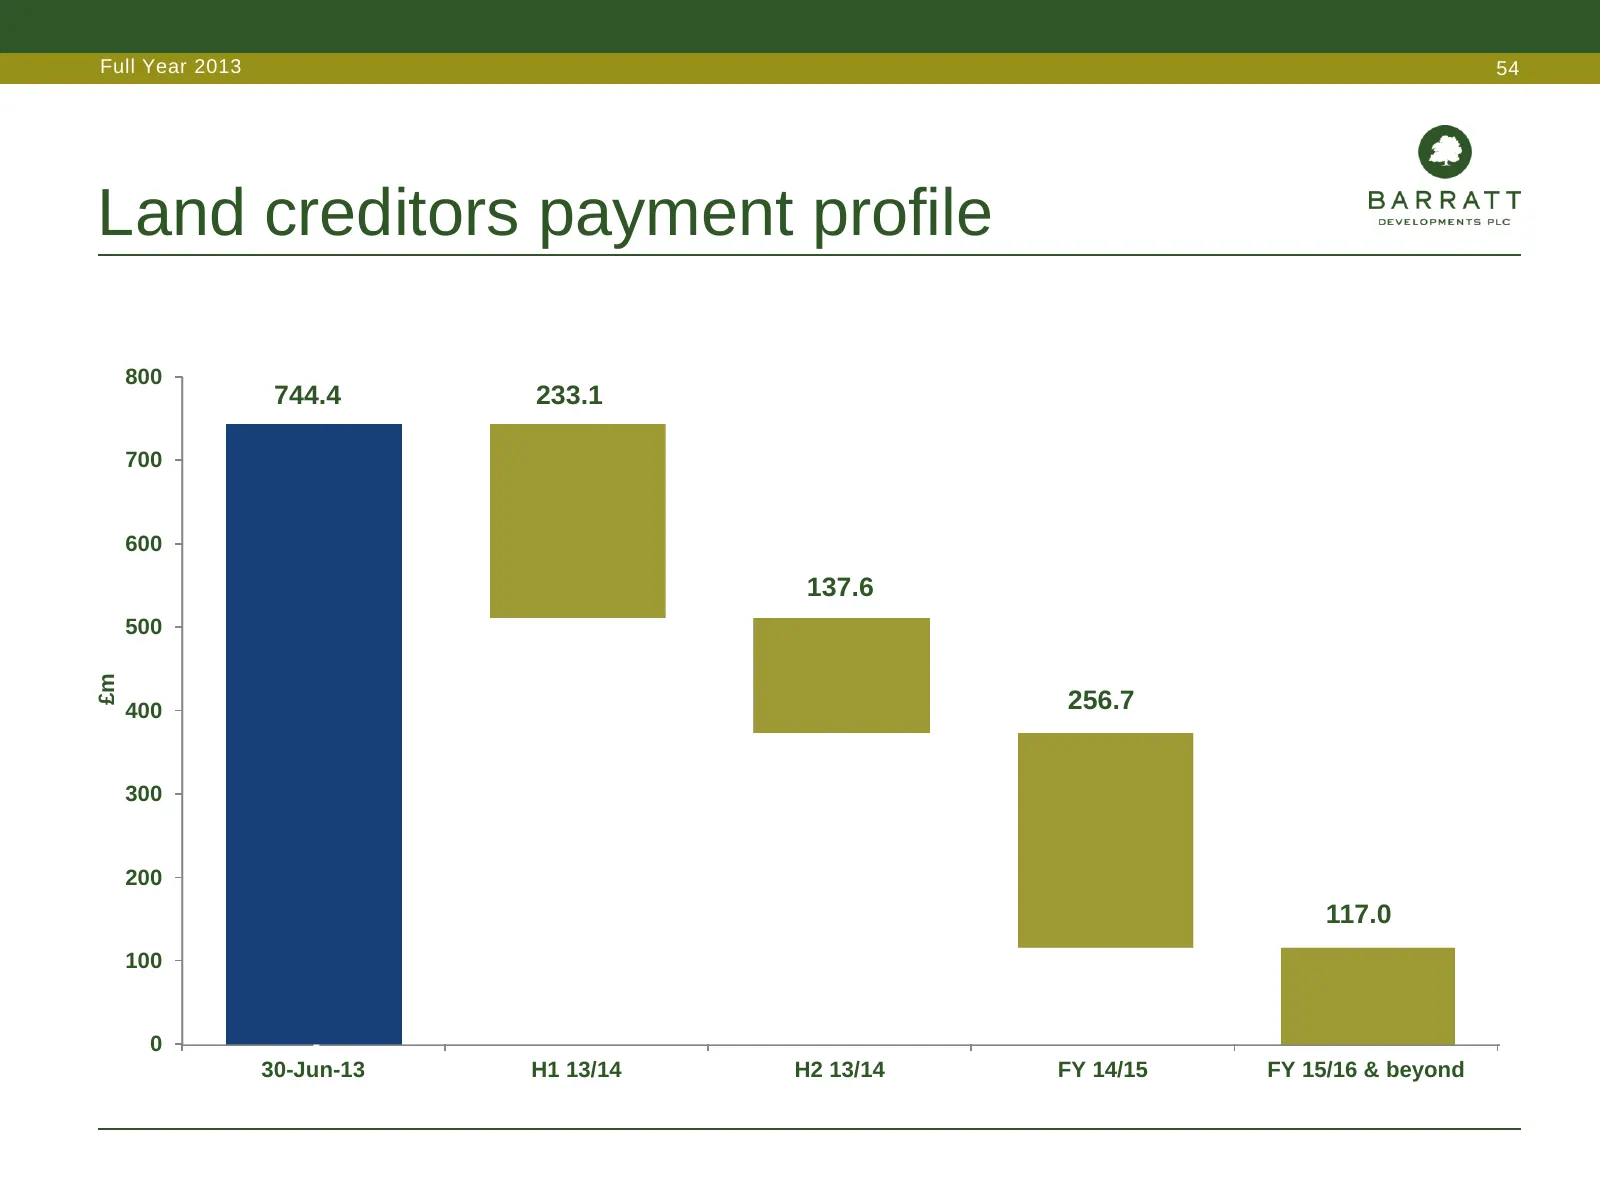
Full Year 2013 54 Land creditors payment profile 800 744.4 233.1 700 600 137.6 500 £m 400 256.7 300 200 117.0 100 0 - 30-Jun-13 H1 13/14 H2 13/14 FY 14/15 FY 15/16 & beyond
Slide 55: Land creditors by type
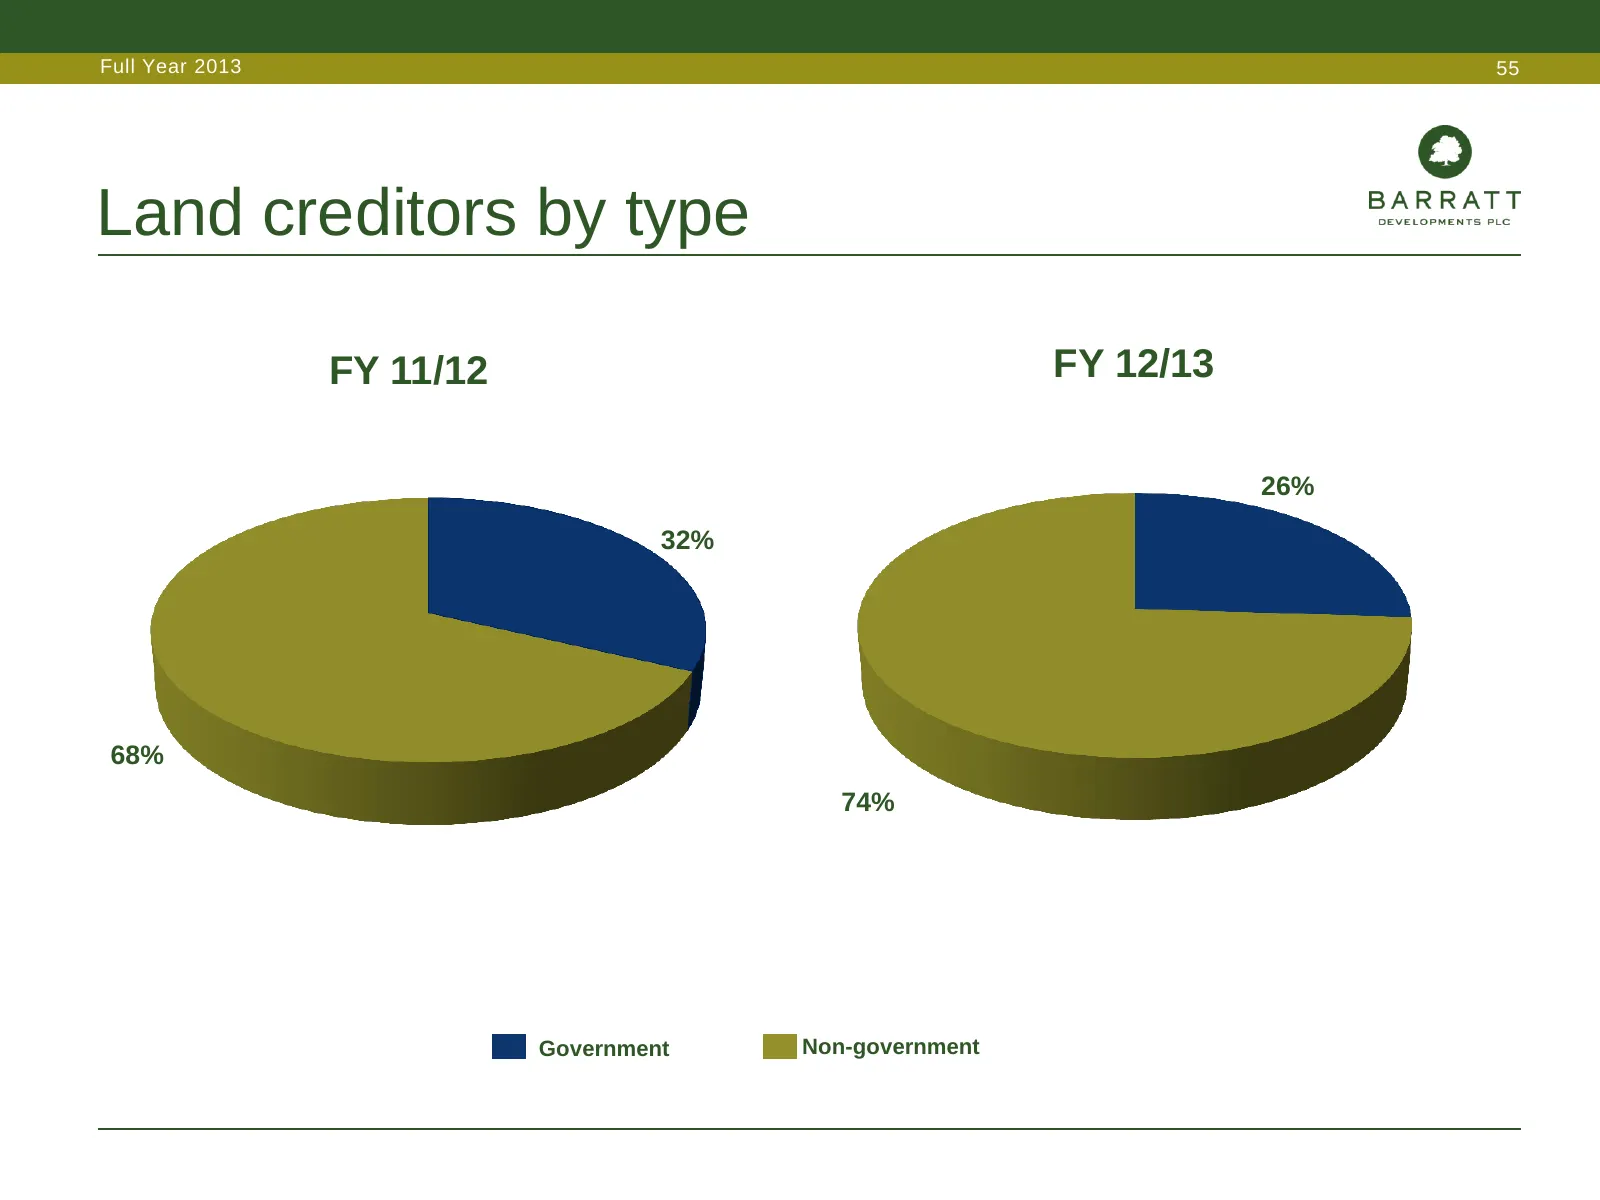
Full Year 2013 55 Land creditors by type FY 11/12 FY 12/13 26% 32% 68% 74% Government Non-government
Slide 56: Balance sheet – stock & WIP
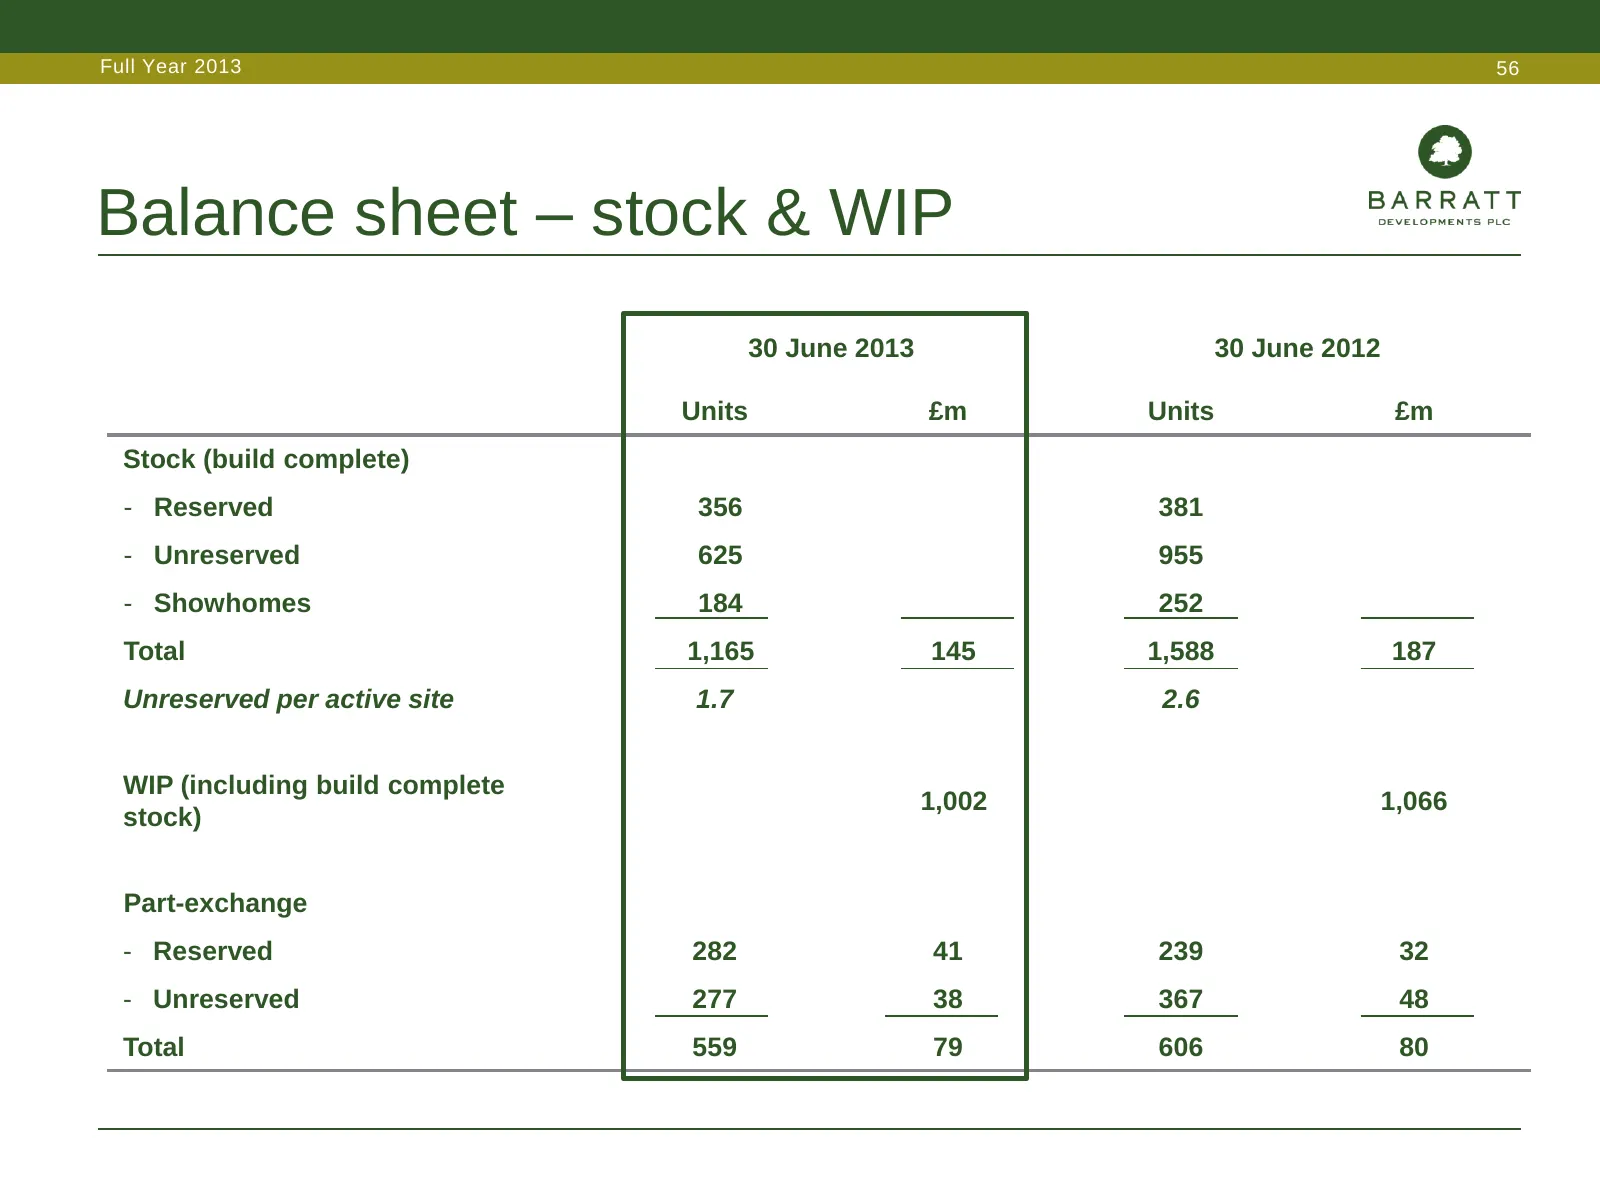
Full Year 2013 56 Balance sheet – stock & WIP 30 June 2013 30 June 2012 Units £m Units £m Stock (build complete) - Reserved 356 381 - Unreserved 625 955 - Showhomes 184 252 Total 1,165 145 1,588 187 Unreserved per active site 1.7 2.6 WIP (including build complete 1,002 1,066 stock) Part-exchange - R
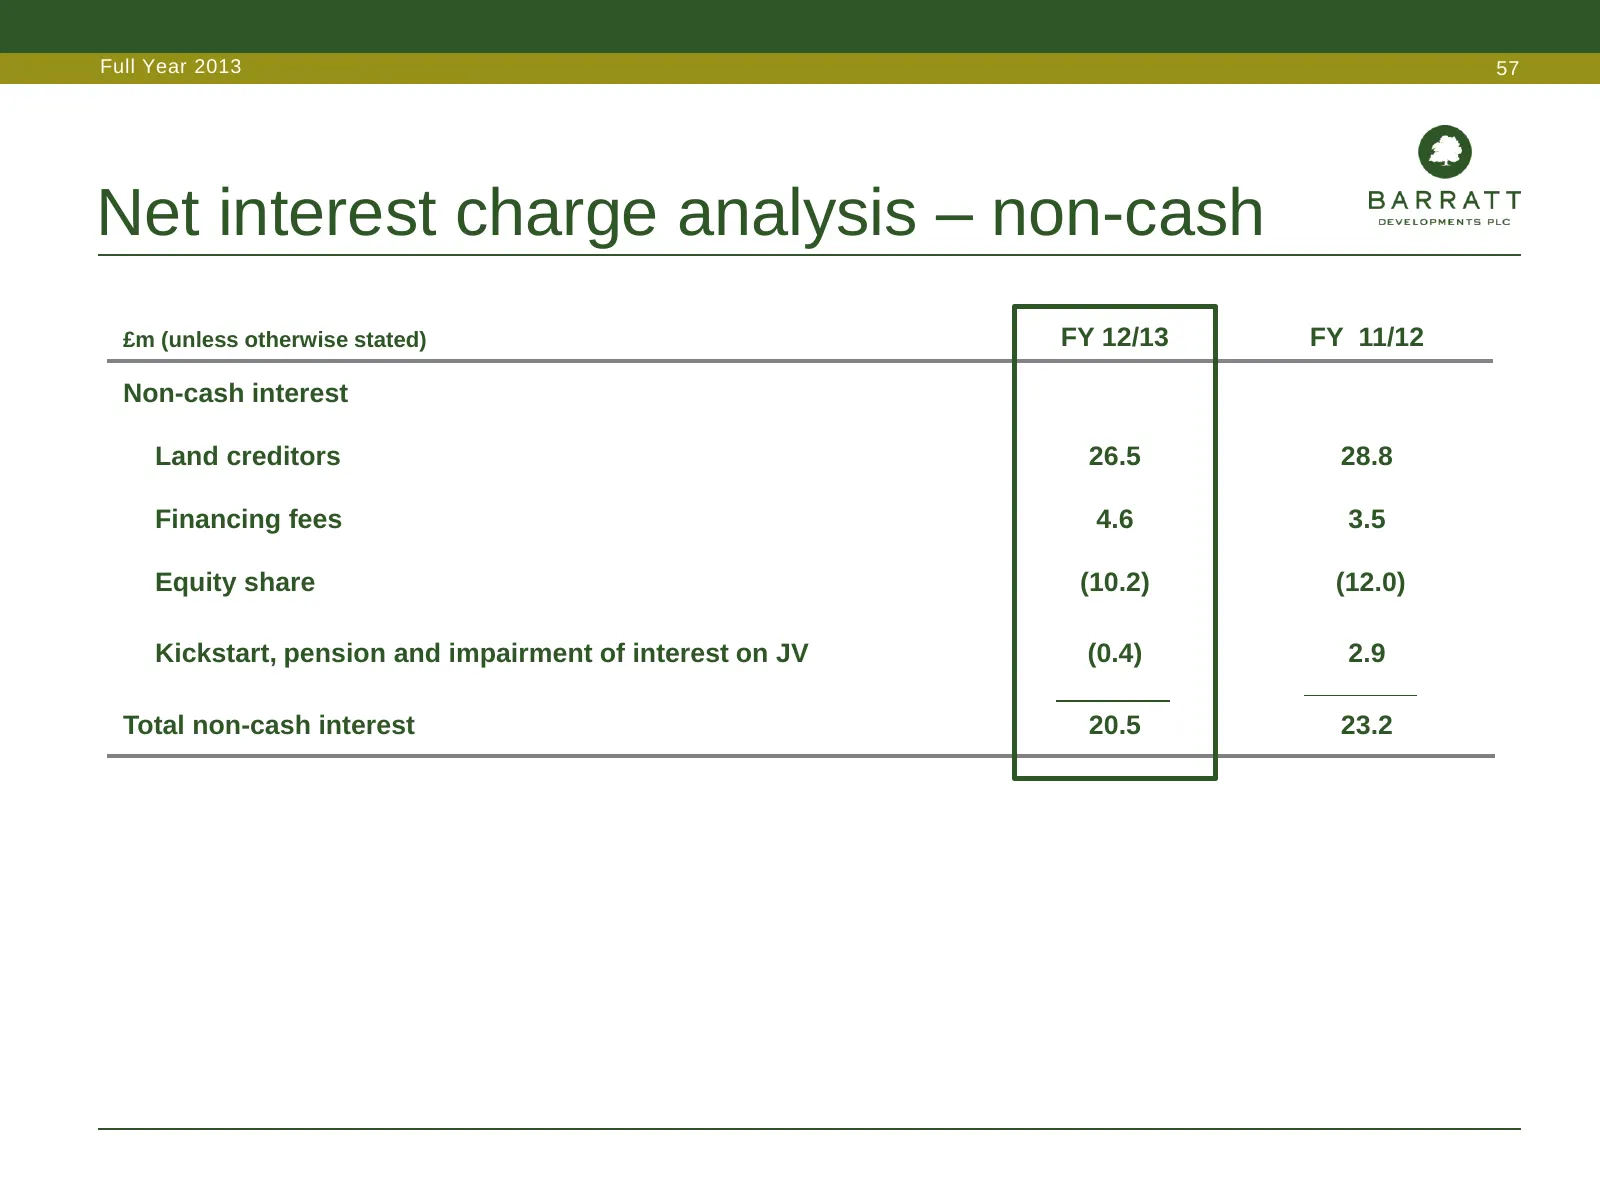
Slide 57: Net interest charge analysis – non-cash
Full Year 2013 57 Net interest charge analysis – non-cash £m (unless otherwise stated) FY 12/13 FY 11/12 Non-cash interest Land creditors 26.5 28.8 Financing fees 4.6 3.5 Equity share (10.2) (12.0) Kickstart, pension and impairment of interest on JV (0.4) 2.9 Total non-cash interest 20.5 23.2
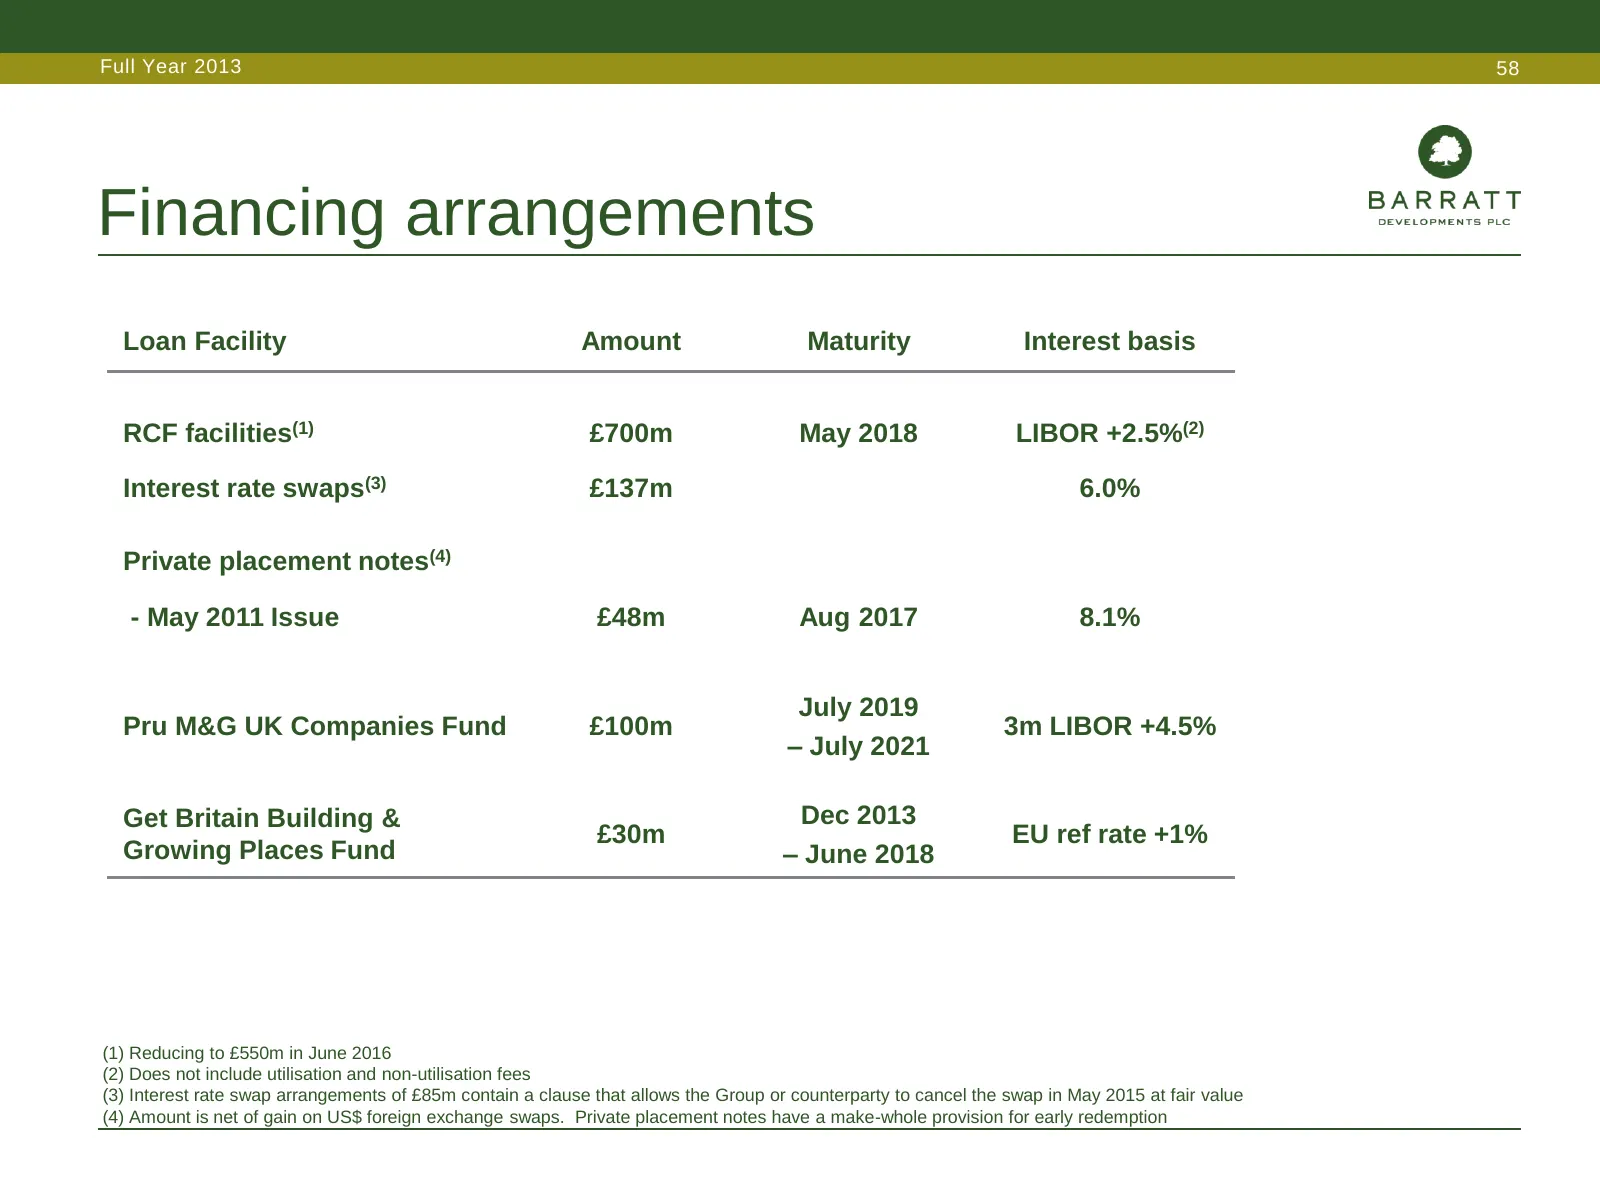
Slide 58: Financing arrangements
Full Year 2013 58 Financing arrangements Loan Facility Amount Maturity Interest basis RCF facilities(1) £700m May 2018 LIBOR +2.5%(2) Interest rate swaps(3) £137m 6.0% Private placement notes(4) - May 2011 Issue £48m Aug 2017 8.1% July 2019 Pru M&G UK Companies Fund £100m 3m LIBOR +4.5% – July 2021
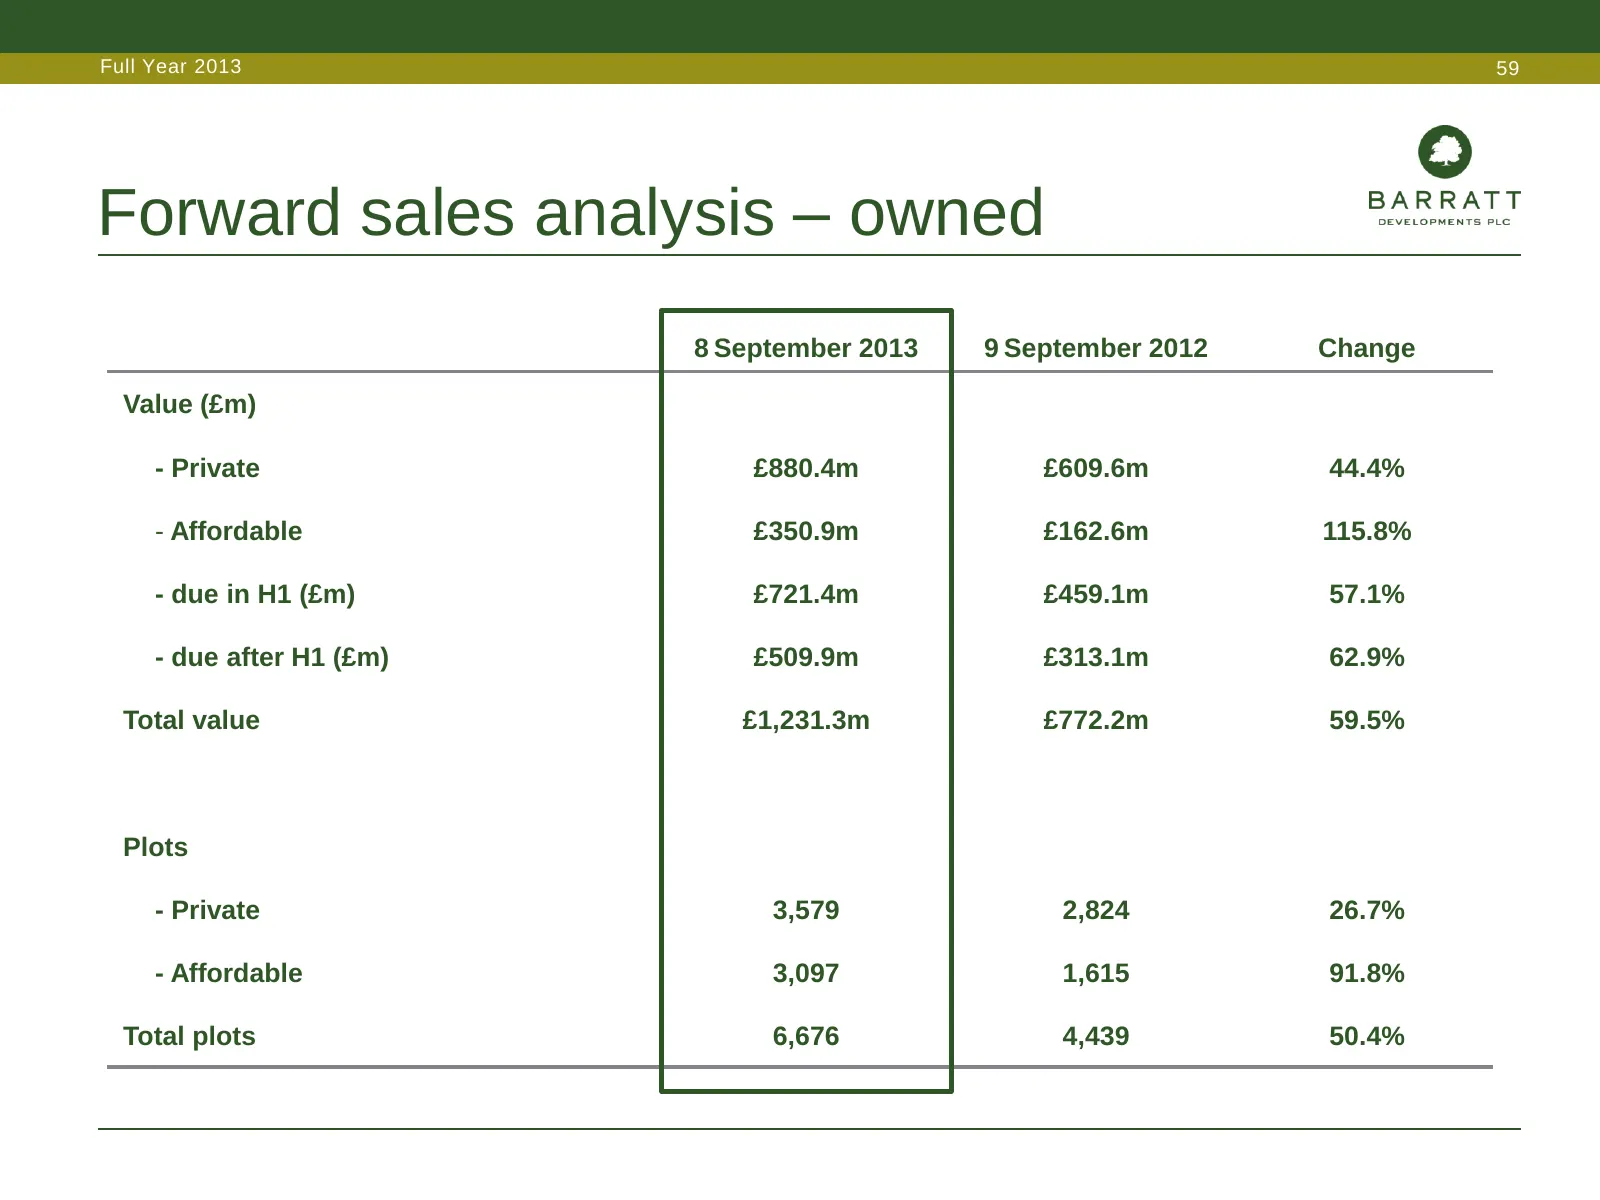
Slide 59: Forward sales analysis – owned
Full Year 2013 59 Forward sales analysis – owned 8 September 2013 9 September 2012 Change Value (£m) - Private £880.4m £609.6m 44.4% - Affordable £350.9m £162.6m 115.8% - due in H1 (£m) £721.4m £459.1m 57.1% - due after H1 (£m) £509.9m £313.1m 62.9% Total value £1,231.3m £772.2m 59.5% Plots - Privat
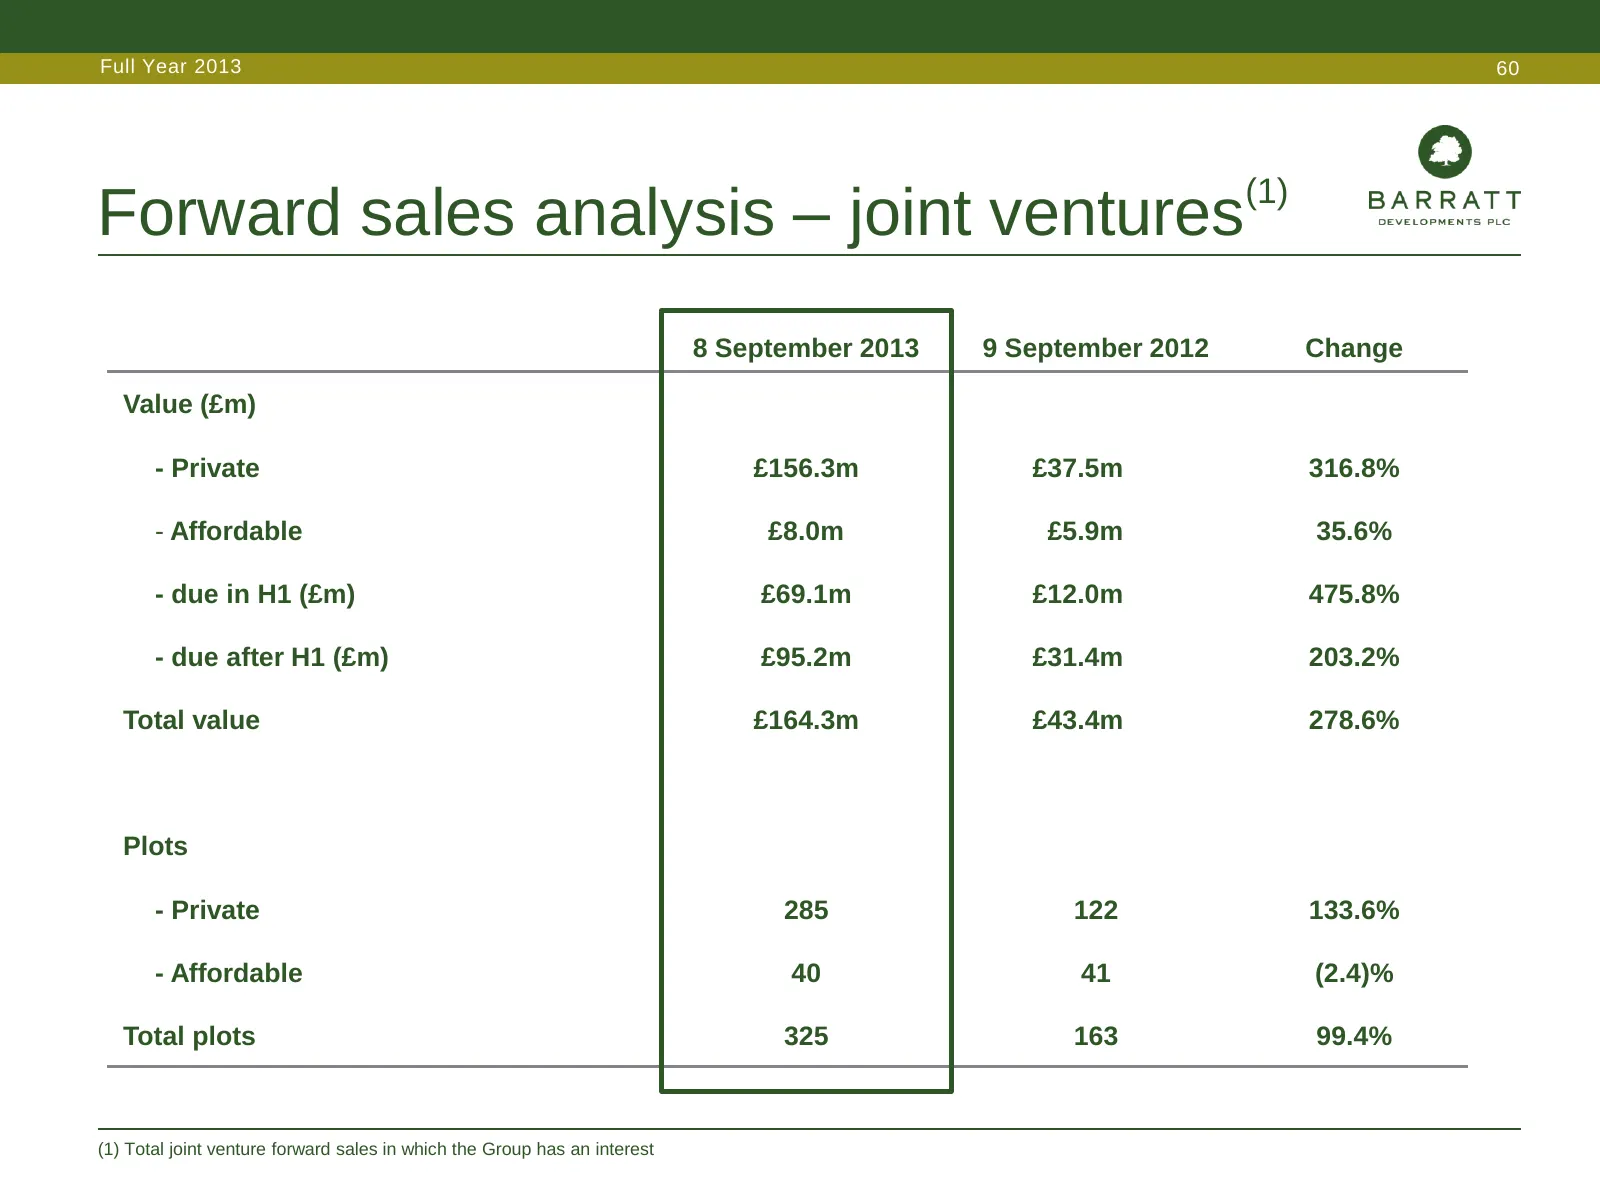
Slide 60: Forward sales analysis – joint ventures
Full Year 2013 60 Forward sales analysis – joint ventures (1) 8 September 2013 9 September 2012 Change Value (£m) - Private £156.3m £37.5m 316.8% - Affordable £8.0m £5.9m 35.6% - due in H1 (£m) £69.1m £12.0m 475.8% - due after H1 (£m) £95.2m £31.4m 203.2% Total value £164.3m £43.4m 278.6% Plots - Pr
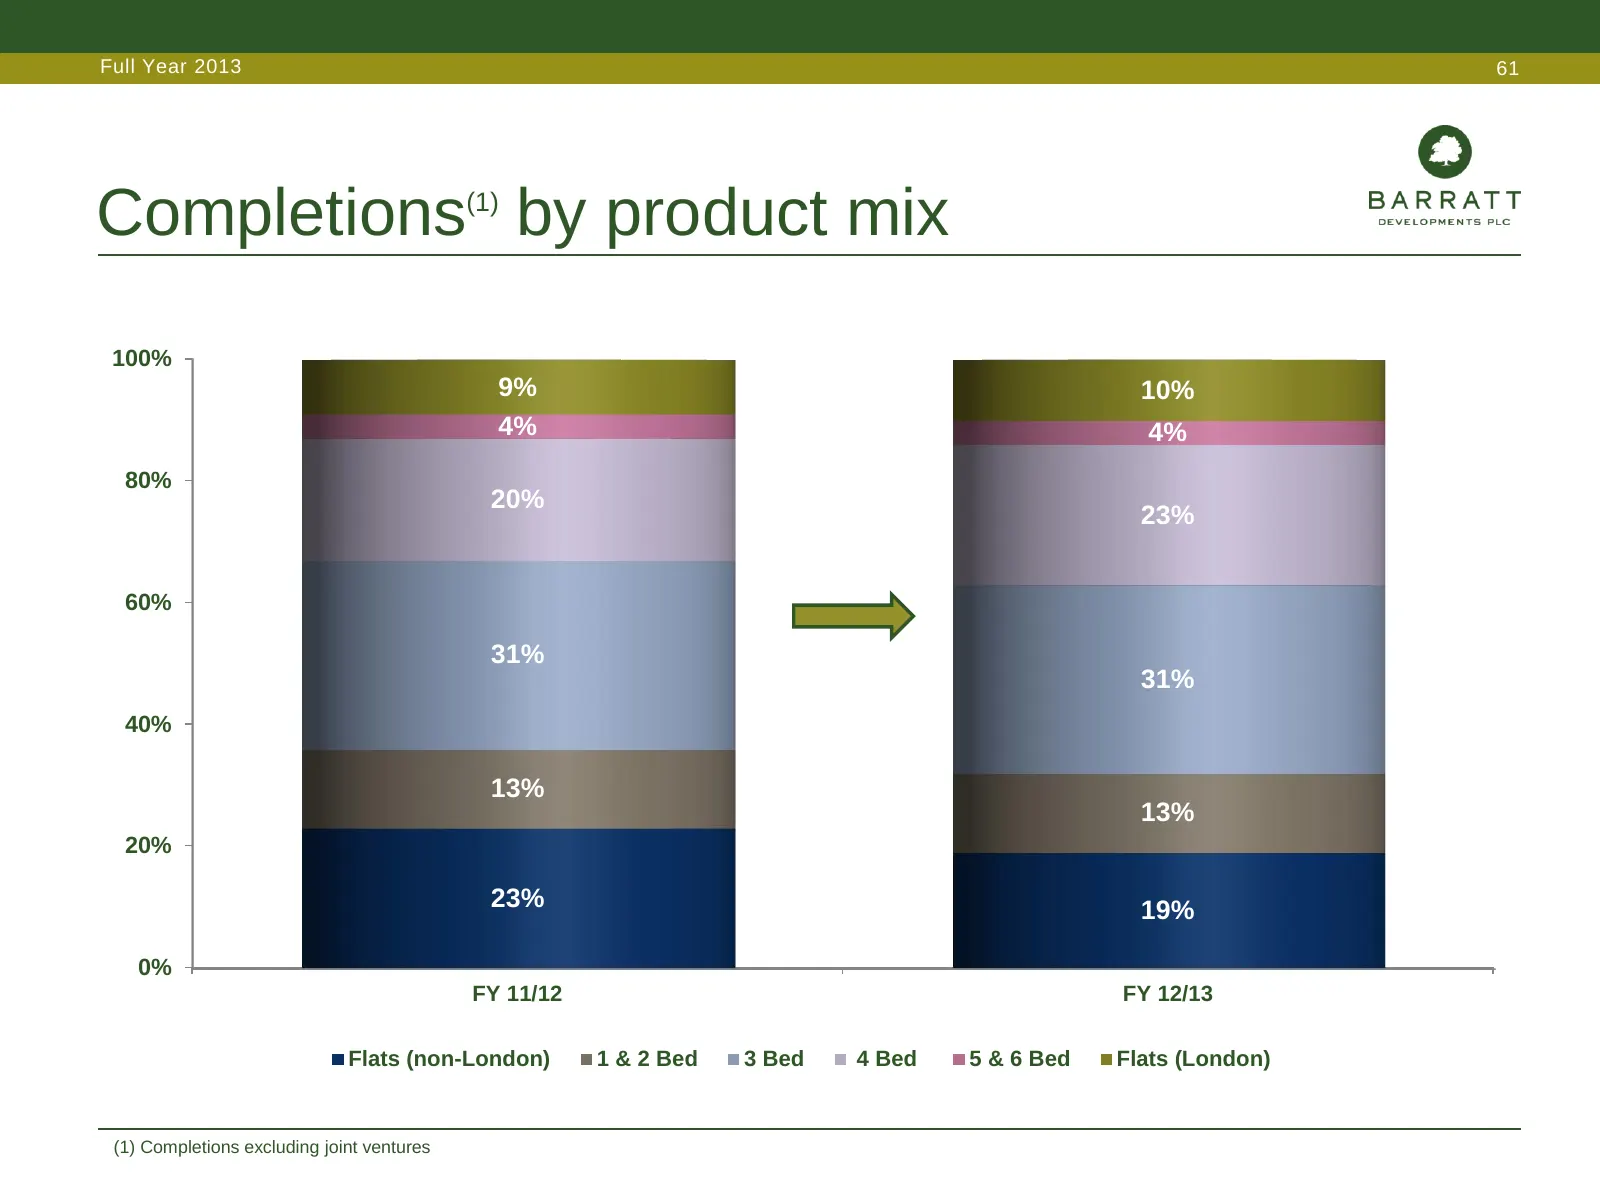
Slide 61: Completions by product mix
Full Year 2013 61 Completions(1) by product mix 100% 9% 10% 4% 4% 80% 20% 23% 60% 31% 31% 40% 13% 13% 20% 23% 19% 0% FY 11/12 FY 12/13 Flats (non-London) 1 & 2 Bed 3 Bed 4 Bed 5 & 6 Bed Flats (London) (1) Completions excluding joint ventures
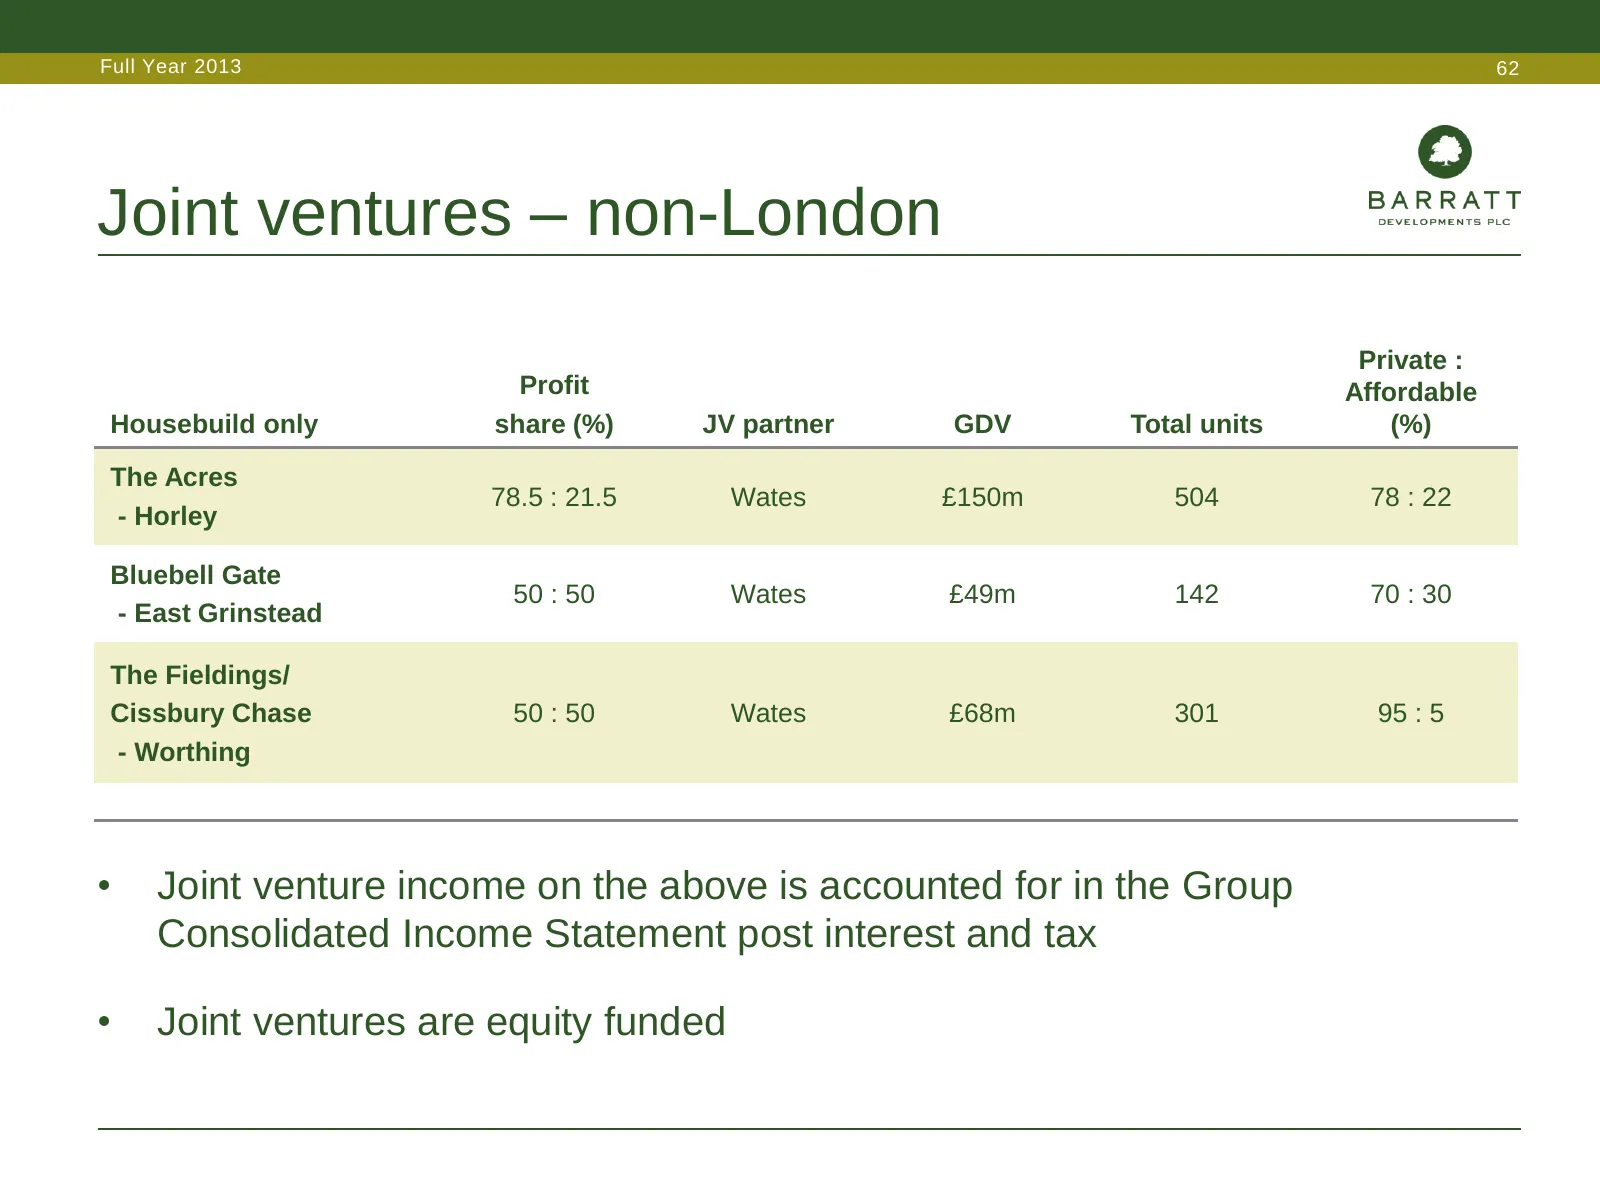
Slide 62: Joint ventures – non-London
Full Year 2013 62 Joint ventures – non-London Private : Profit Affordable Housebuild only share (%) JV partner GDV Total units (%) The Acres 78.5 : 21.5 Wates £150m 504 78 : 22 - Horley Bluebell Gate 50 : 50 Wates £49m 142 70 : 30 - East Grinstead The Fieldings/ Cissbury Chase 50 : 50 Wates £68m 301
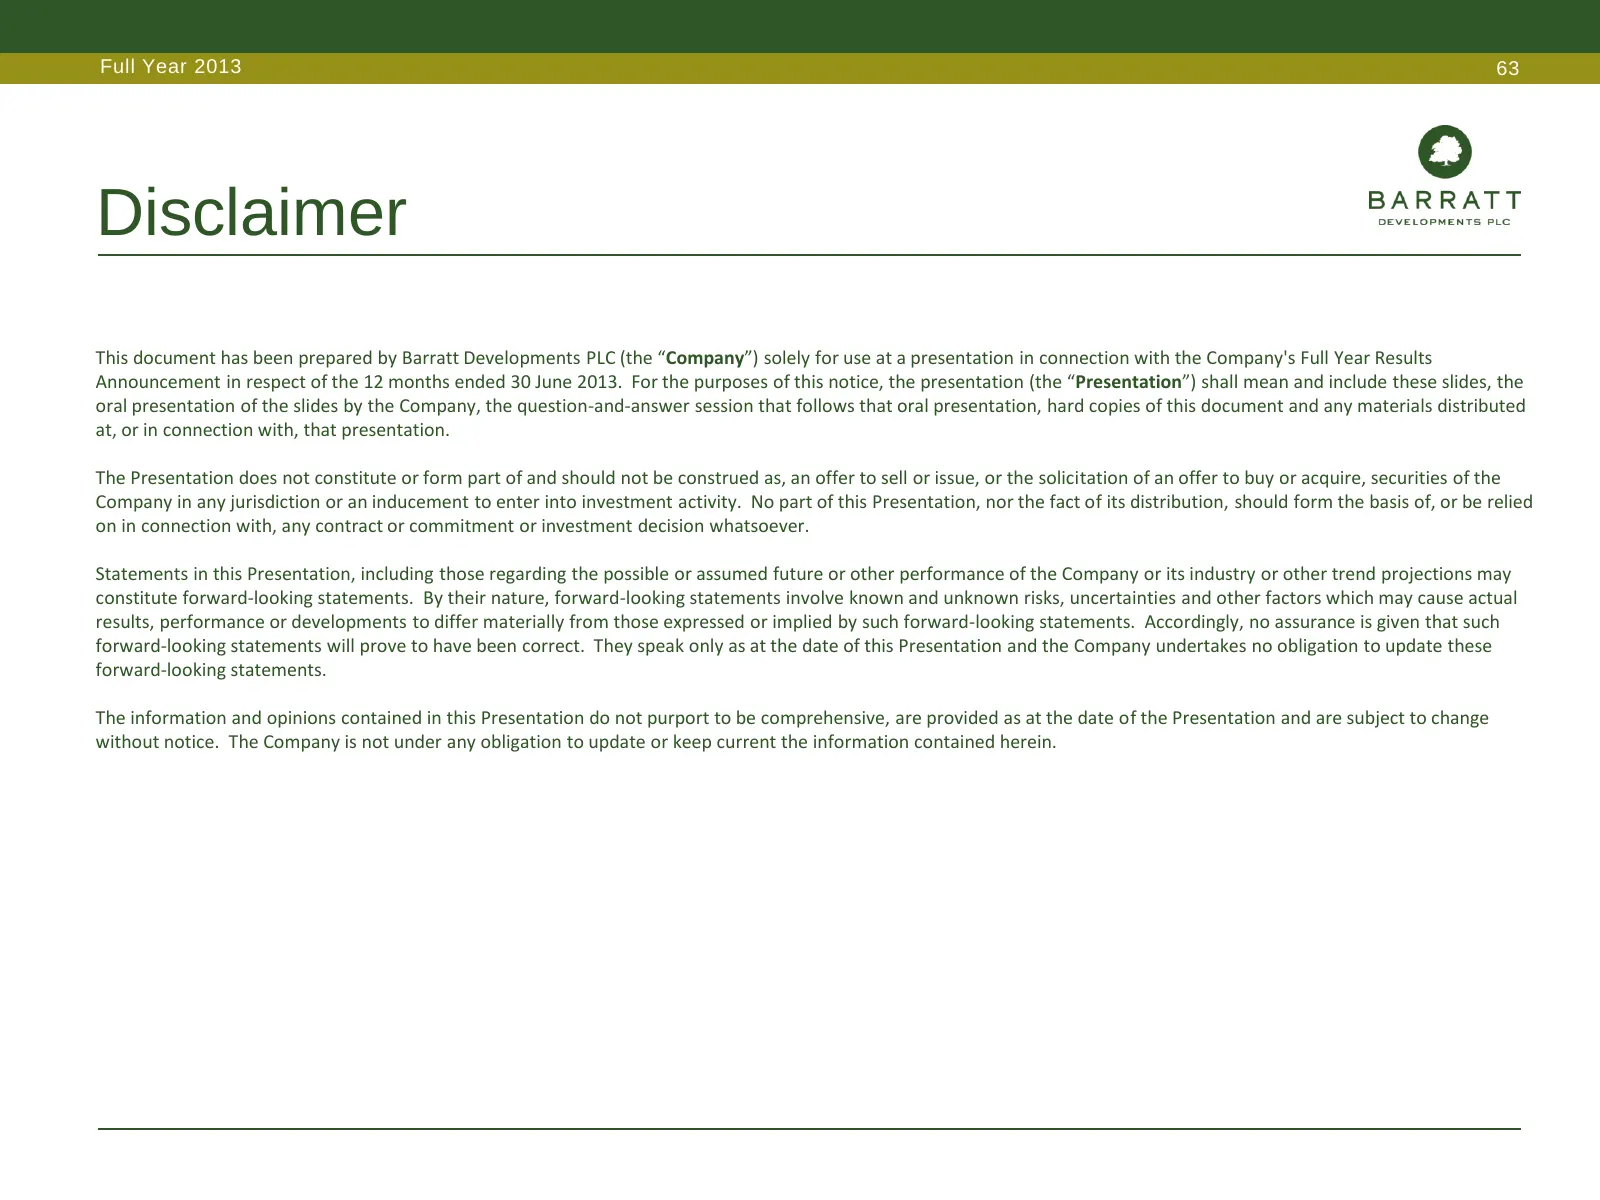
Slide 63: Disclaimer
Full Year 2013 63 Disclaimer This document has been prepared by Barratt Developments PLC (the “Company”) solely for use at a presentation in connection with the Company's Full Year Results Announcement in respect of the 12 months ended 30 June 2013. For the purposes of this notice, the presentation
Source: Internet Archive copy of barrattdevelopments.co.uk
More decks from Barratt Redrow plc
 FY2026 Earnings Presentation59 slides · Sep 16, 2026
 HY26 Earnings Presentation59 slides · Feb 11, 2026
 FY2025 Earnings Presentation60 slides · Sep 17, 2025
 Corporate Update (May 2025)30 slides · May 1, 2025
 Investor Day (February 2025)40 slides · Feb 12, 2025
 HY25 Earnings Presentation51 slides · Feb 12, 2025