Radcom Ltd. · NASDAQ:RDCM
Radcom — Q1 2017 Earnings Presentation
11 slides from Radcom's earnings presentation, 2017

Slide 1: Reference Slides: Earnings Call for Q1-17 Results
Reference Slides Earnings Call for Q1-17 Results
Slide 2: Safe Harbor Provision
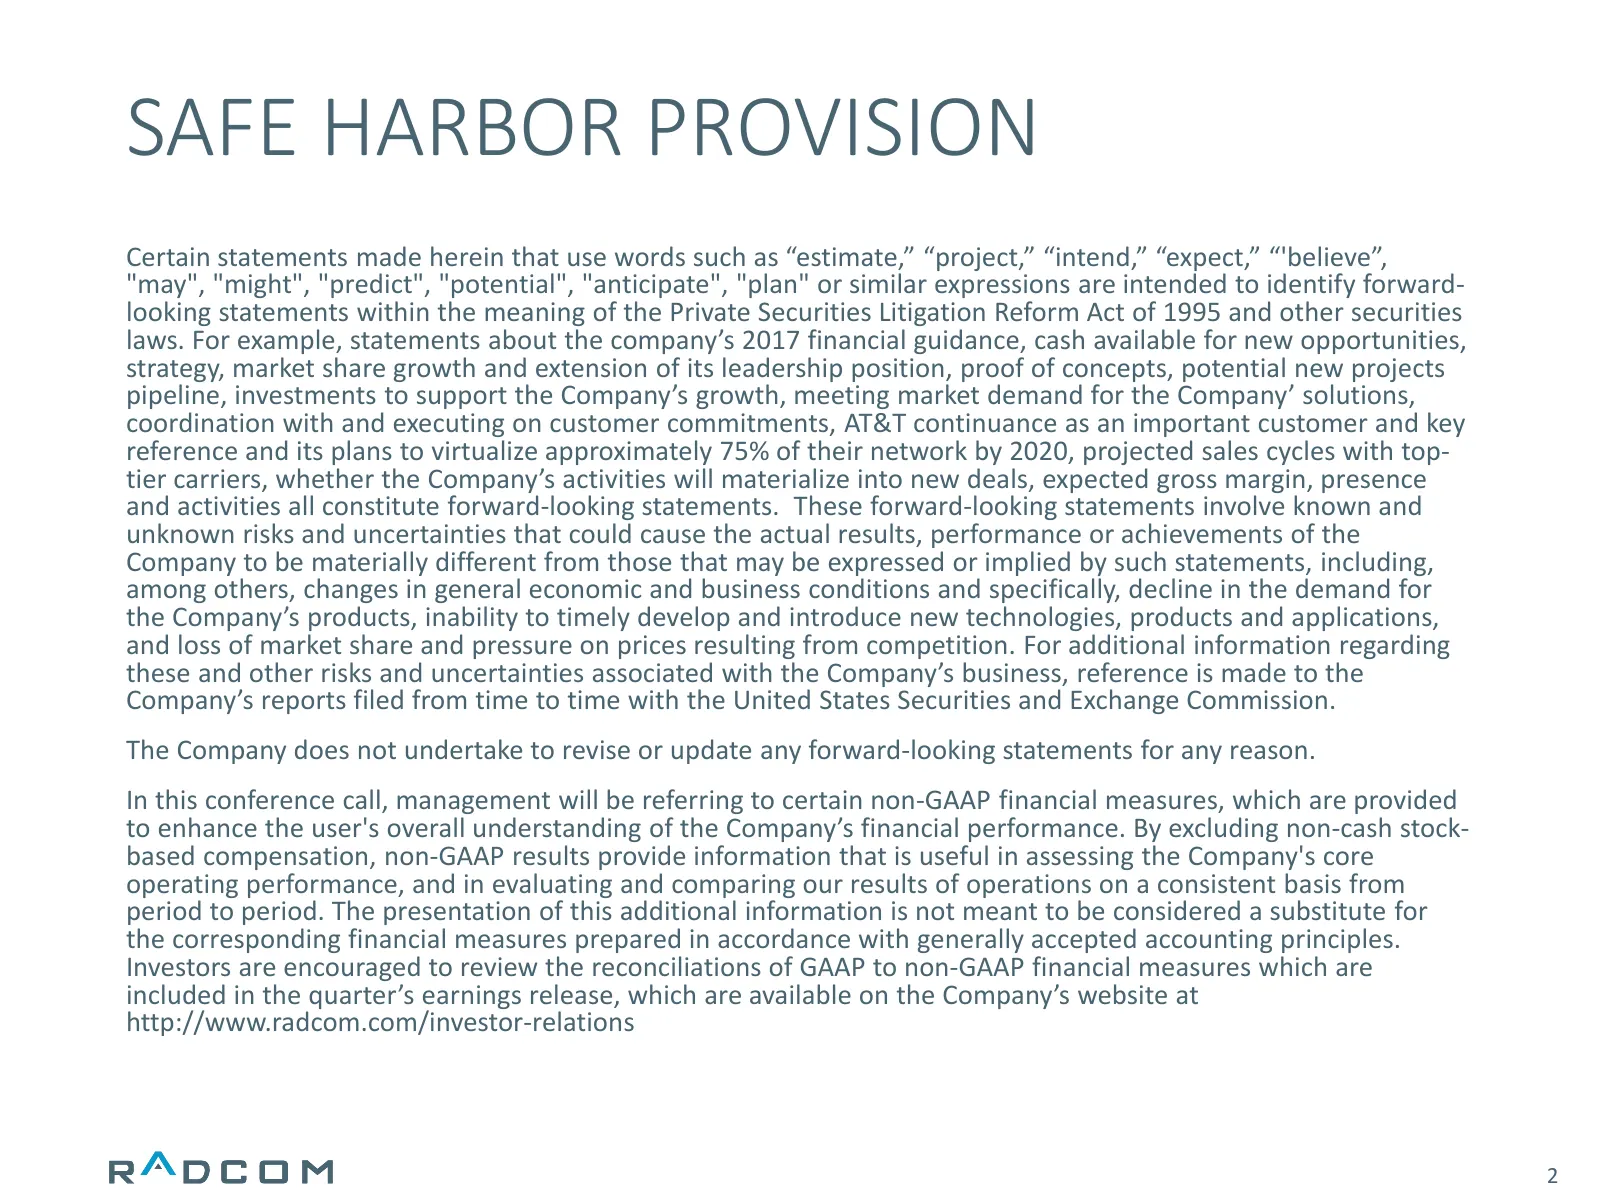
SAFE HARBOR PROVISION Certain statements made herein that use words such as “estimate,” “project,” “intend,” “expect,” “'believe”, "may", "might", "predict", "potential", "anticipate", "plan" or similar expressions are intended to identify forward- looking statements within the meaning of the Privat
Slide 3: Overview
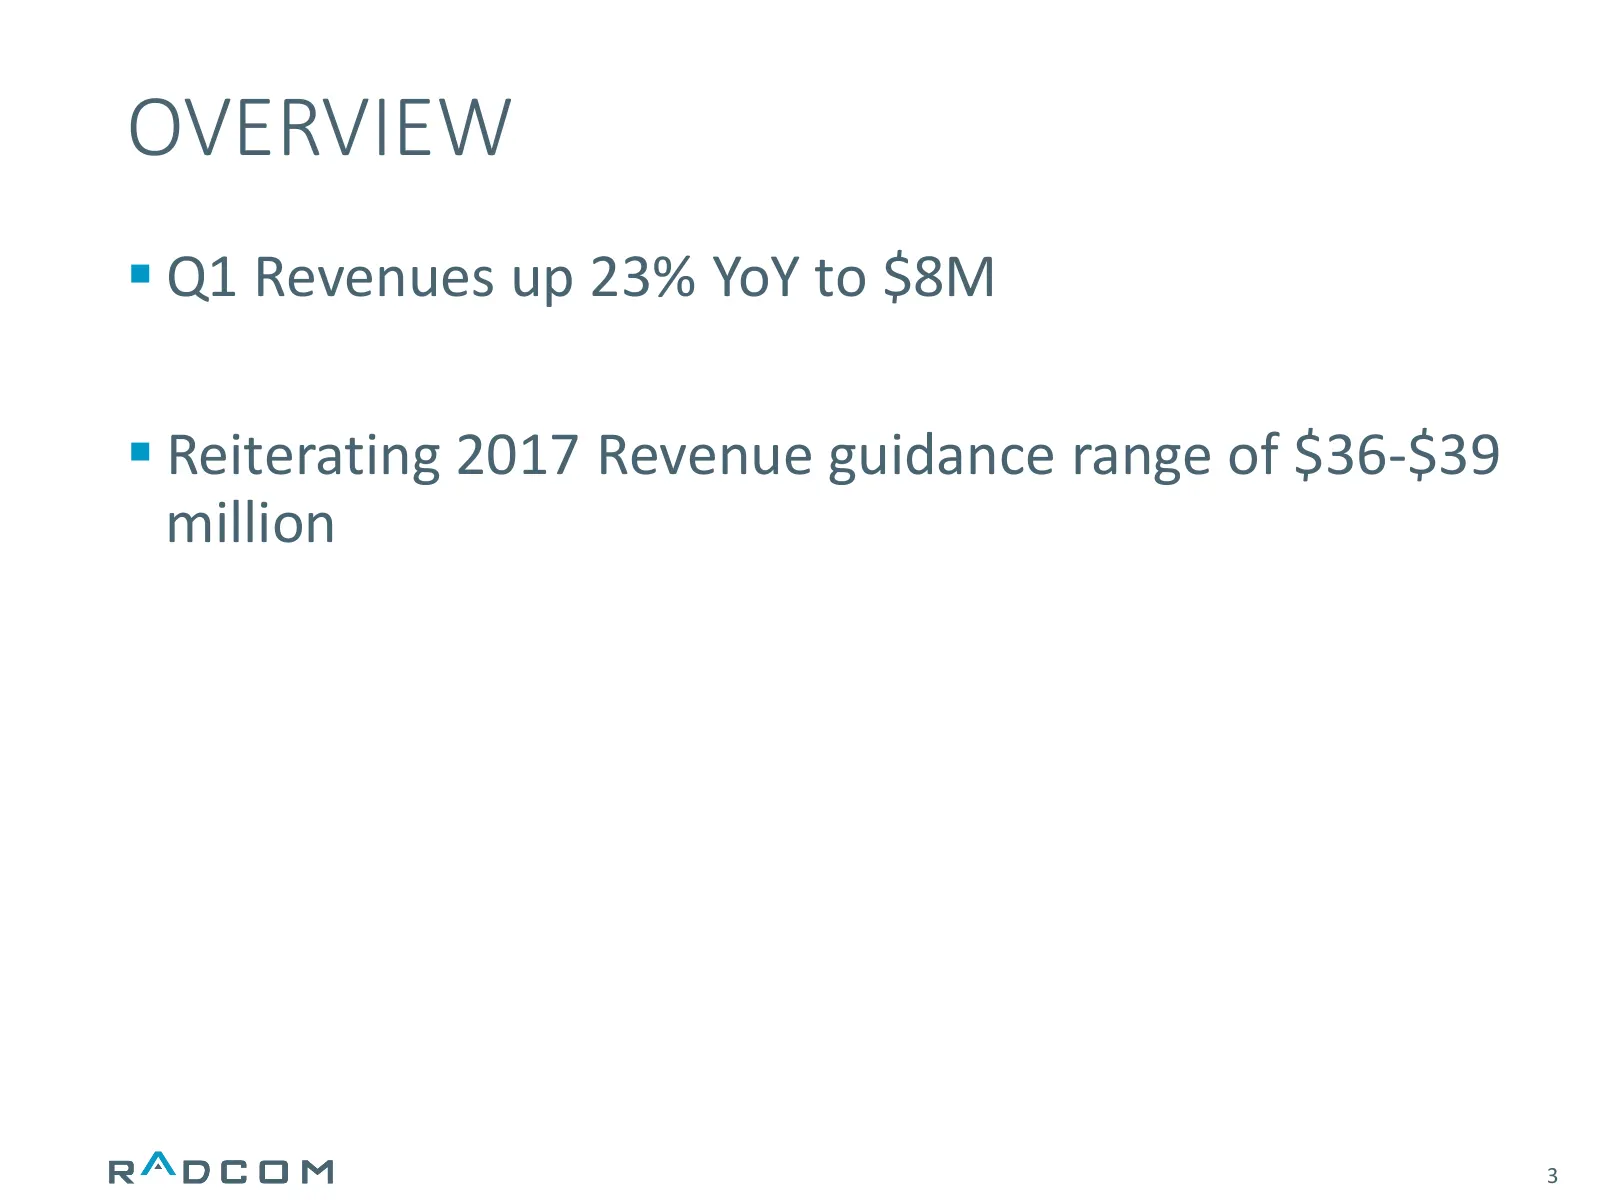
OVERVIEW Q1 Revenues up 23% YoY to $8M Reiterating 2017 Revenue guidance range of $36-$39 million 3
Slide 4: Financials: First Quarter 2017 Financial Results
FINANCIALS First Quarter 2017 Financial Results 4
Slide 5: Income Statement for Q1-17 (GAAP, US$ 1000s)
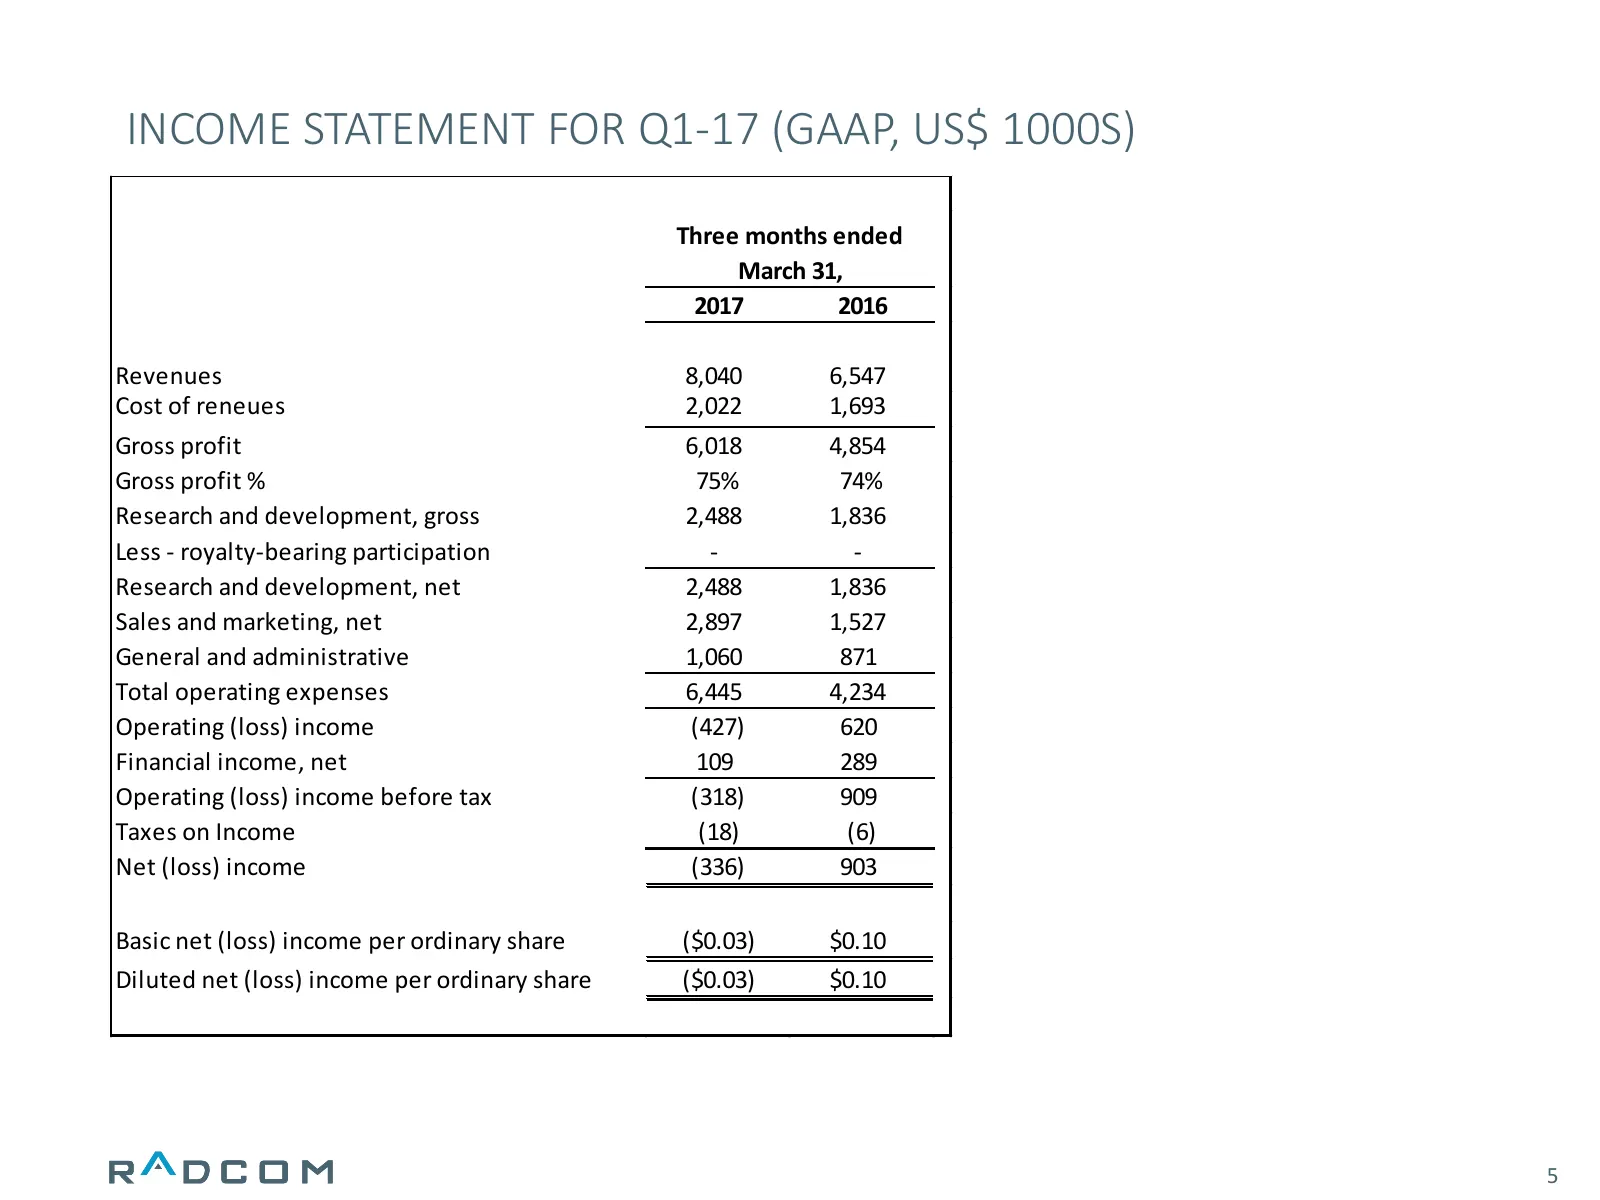
INCOME STATEMENT FOR Q1-17 (GAAP, US$ 1000S) Three months ended March 31, 2017 2016 Revenues 8,040 6,547 Cost of reneues 2,022 1,693 Gross profit 6,018 4,854 Gross profit % 75% 74% Research and development, gross 2,488 1,836 Less - royalty-bearing participation - - Research and development, net 2,48
Slide 6: Income Statement for Q1-17 (Non-GAAP, US$ 1000s)
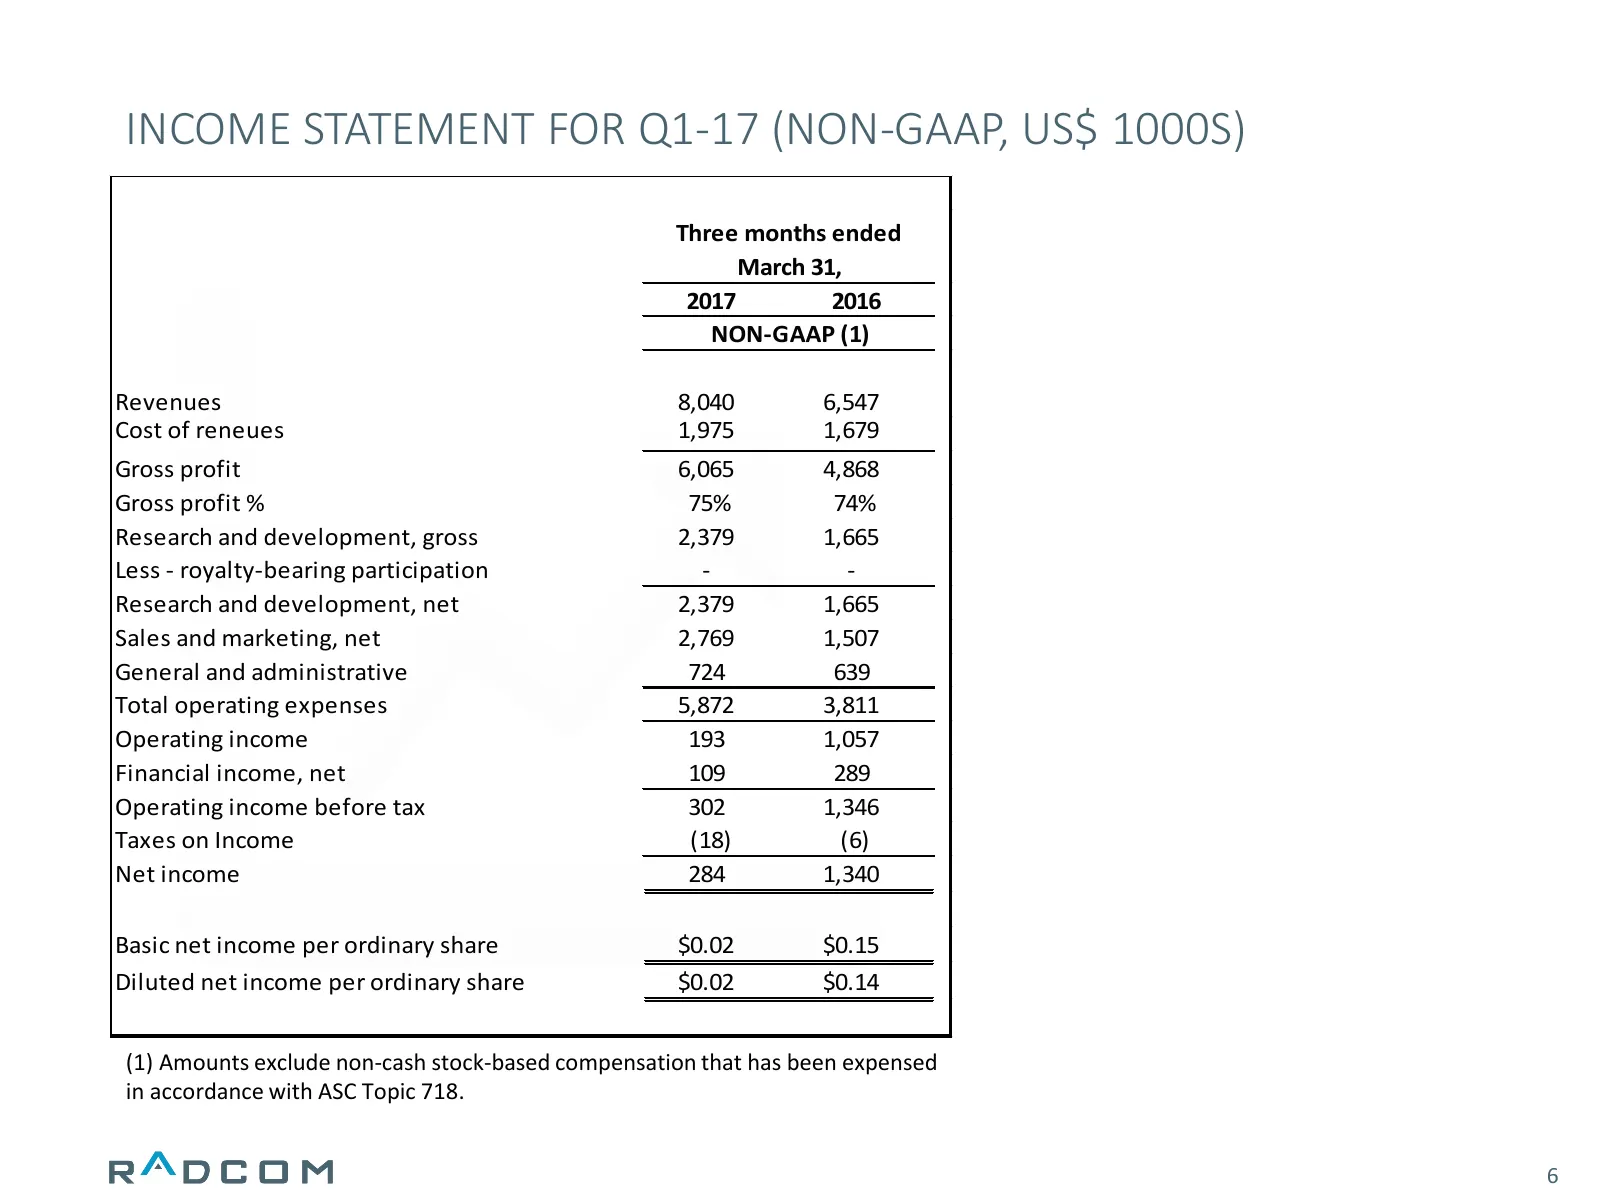
INCOME STATEMENT FOR Q1-17 (NON-GAAP, US$ 1000S) Three months ended March 31, 2017 2016 NON-GAAP (1) Revenues 8,040 6,547 Cost of reneues 1,975 1,679 Gross profit 6,065 4,868 Gross profit % 75% 74% Research and development, gross 2,379 1,665 Less - royalty-bearing participation - - Research and deve
Slide 7: Operating Expenses (GAAP, US$ 1000s)
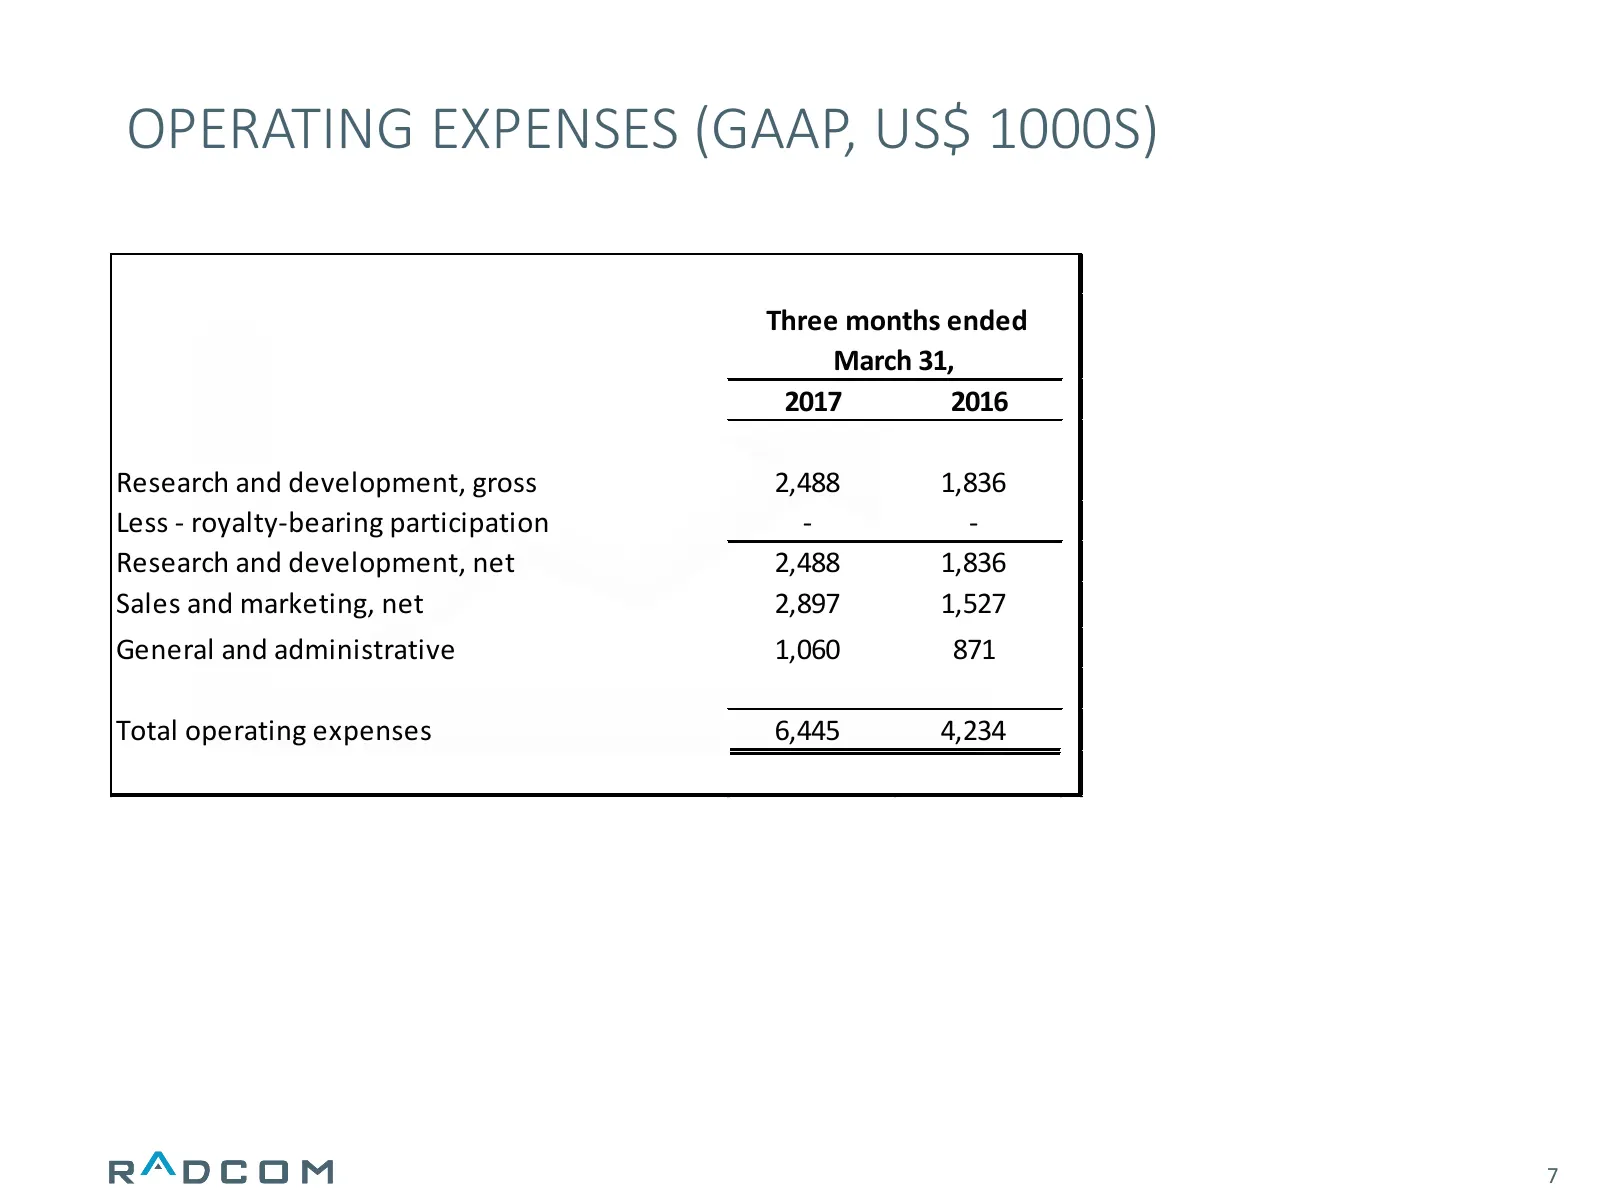
OPERATING EXPENSES (GAAP, US$ 1000S) Three months ended March 31, 2017 2016 Research and development, gross 2,488 1,836 Less - royalty-bearing participation - - Research and development, net 2,488 1,836 Sales and marketing, net 2,897 1,527 General and administrative 1,060 871 Total operating expense
Slide 8: Operating Expenses (Non-GAAP, US$ 1000s)
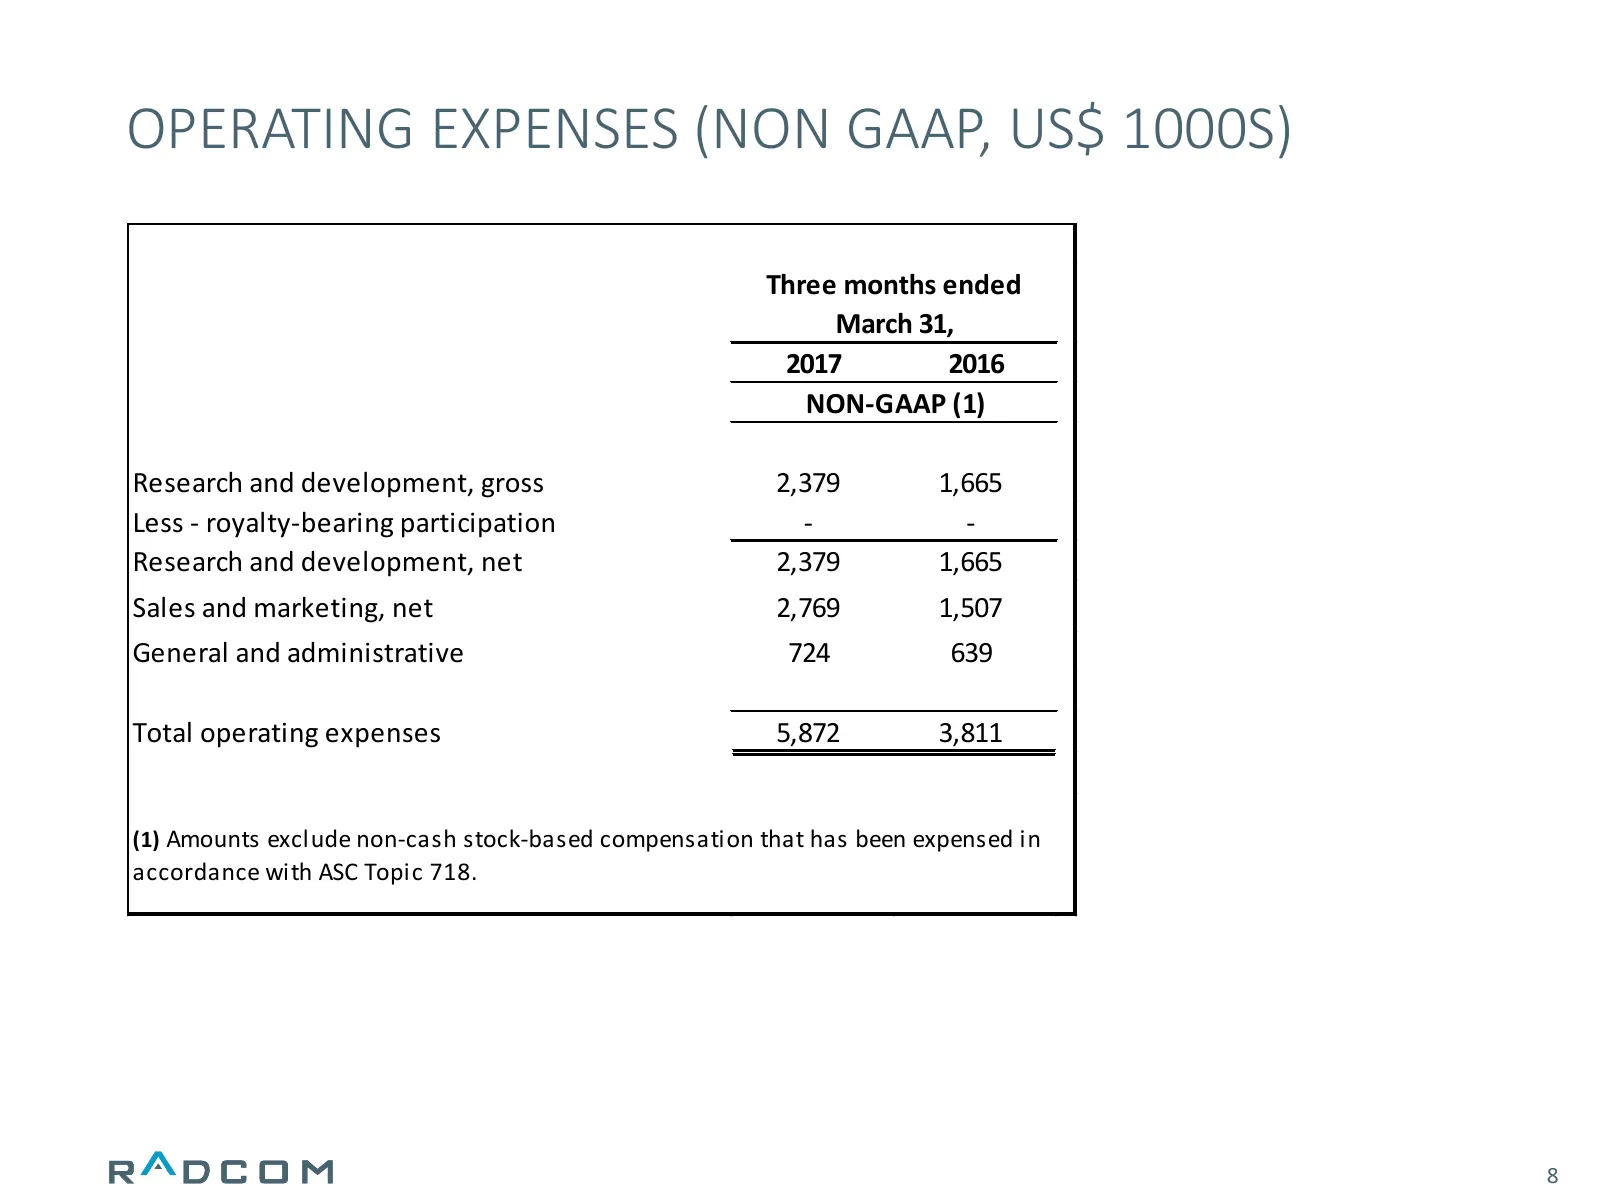
OPERATING EXPENSES (NON GAAP, US$ 1000S) Three months ended March 31, 2017 2016 NON-GAAP (1) Research and development, gross 2,379 1,665 Less - royalty-bearing participation - - Research and development, net 2,379 1,665 Sales and marketing, net 2,769 1,507 General and administrative 724 639 Total op
Slide 9: Balance Sheet (US$ 1000s)
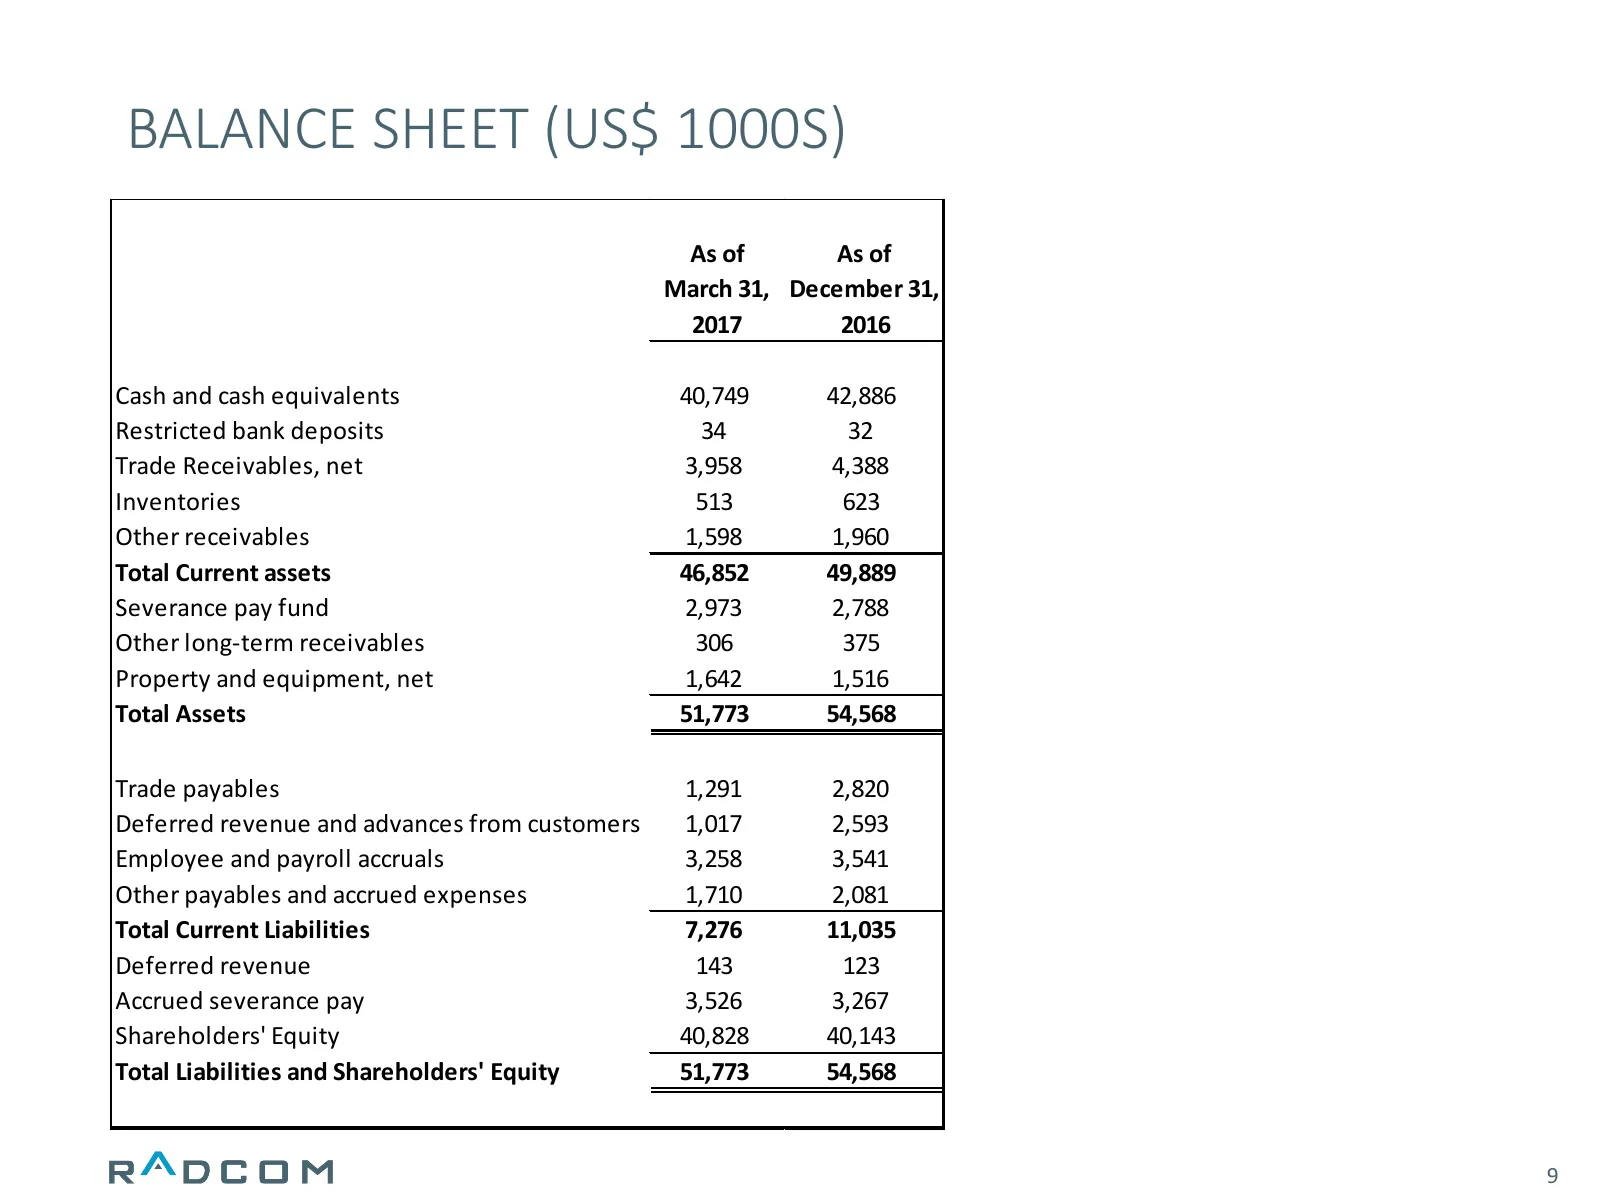
BALANCE SHEET (US$ 1000S) As of As of March 31, December 31, 2017 2016 Cash and cash equivalents 40,749 42,886 Restricted bank deposits 34 32 Trade Receivables, net 3,958 4,388 Inventories 513 623 Other receivables 1,598 1,960 Total Current assets 46,852 49,889 Severance pay fund 2,973 2,788 Other l
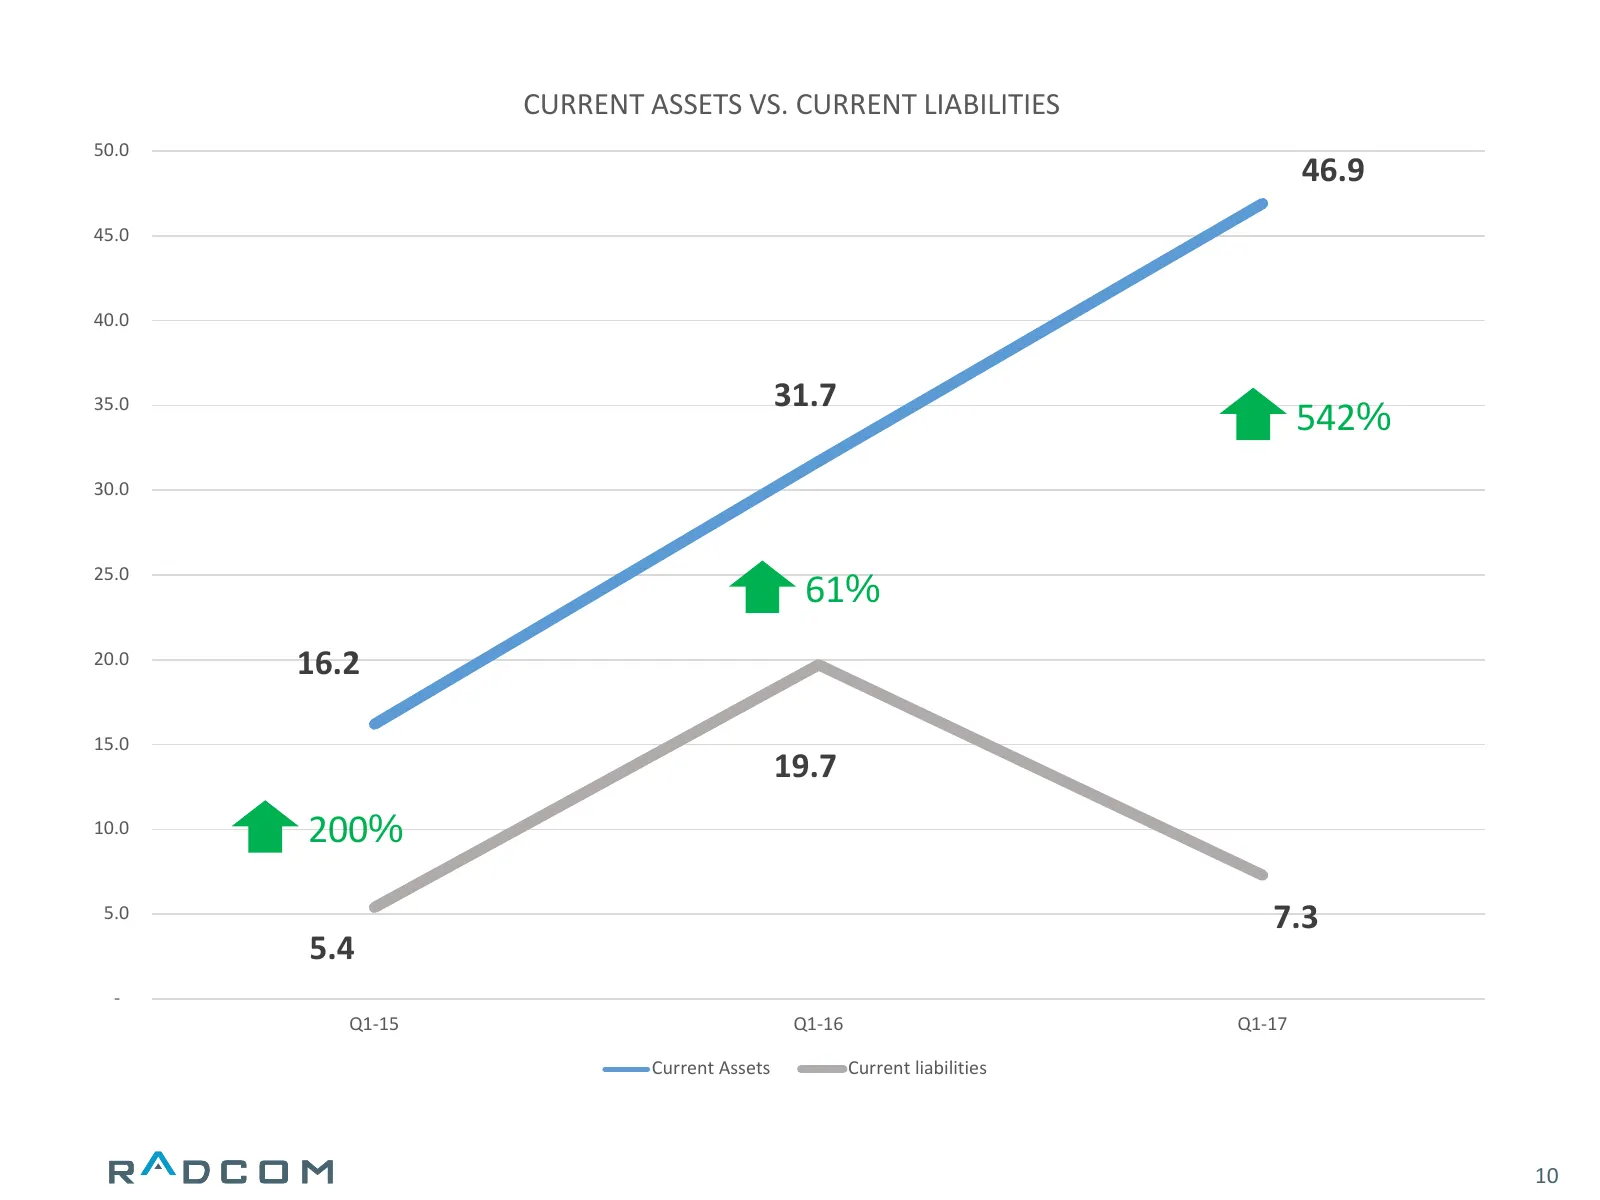
Slide 10: Current Assets vs. Current Liabilities
CURRENT ASSETS VS. CURRENT LIABILITIES 50.0 46.9 45.0 40.0 31.7 35.0 542% 30.0 25.0 61% 20.0 16.2 15.0 19.7 10.0 200% 5.0 7.3 5.4 - Q1-15 Q1-16 Q1-17 Current Assets Current liabilities 10

Slide 11: Thank You
THANK YOU
Source: Internet Archive copy of radcom.com
More decks from Radcom Ltd.
 Q3 2026 Earnings Presentation25 slides · Nov 11, 2026
 Fact Sheet (November 2026)1 slide · Nov 11, 2026
 Investor Presentation (November 2026)18 slides · November 2026
 Fact Sheet (October 2026)1 slide · October 2026
 Q2 2026 Earnings Presentation28 slides · Aug 12, 2026
 Investor Presentation (August 2026)19 slides · August 2026