Avaya — Q2 FY2019 Earnings Presentation
14 slides from Avaya's earnings presentation, May 9, 2019
Slide 1: Q2 Fiscal Year 2019 Financial Results
TEXT 0 – 0 – 0 204-0-0 127-127-127 17-114-210 80-200-74 86-183-242 247-150-70 Exhibit 99.3 Q2 FISCAL YEAR 2019 FINANCIAL RESULTS May 9, 2019 © 2019 Avaya Inc. All rights reserved © 2018 Avaya Inc. All rights reserved
Slide 2: Forward Looking Statements
TEXT 0 – 0 – 0 204-0-0 127-127-127 17-114-210 80-200-74 86-183-242 247-150-70 Forward Looking Statements Cautionary Note Regarding Forward-Looking Statements This document contains certain “forward-looking statements.” All statements other than statements of historical fact are “forward-looking” sta
Slide 3: Use of non-GAAP (Adjusted) Financial Measures
TEXT 0 – 0 – 0 204-0-0 127-127-127 17-114-210 80-200-74 86-183-242 247-150-70 Use of non-GAAP (Adjusted) Financial Measures This presentation should be read in conjunction with our third quarter fiscal 2019 earnings press release issued on May 9, 2019. Within this presentation, we refer to certain n
Slide 4: Fiscal Q2 2019 Summary
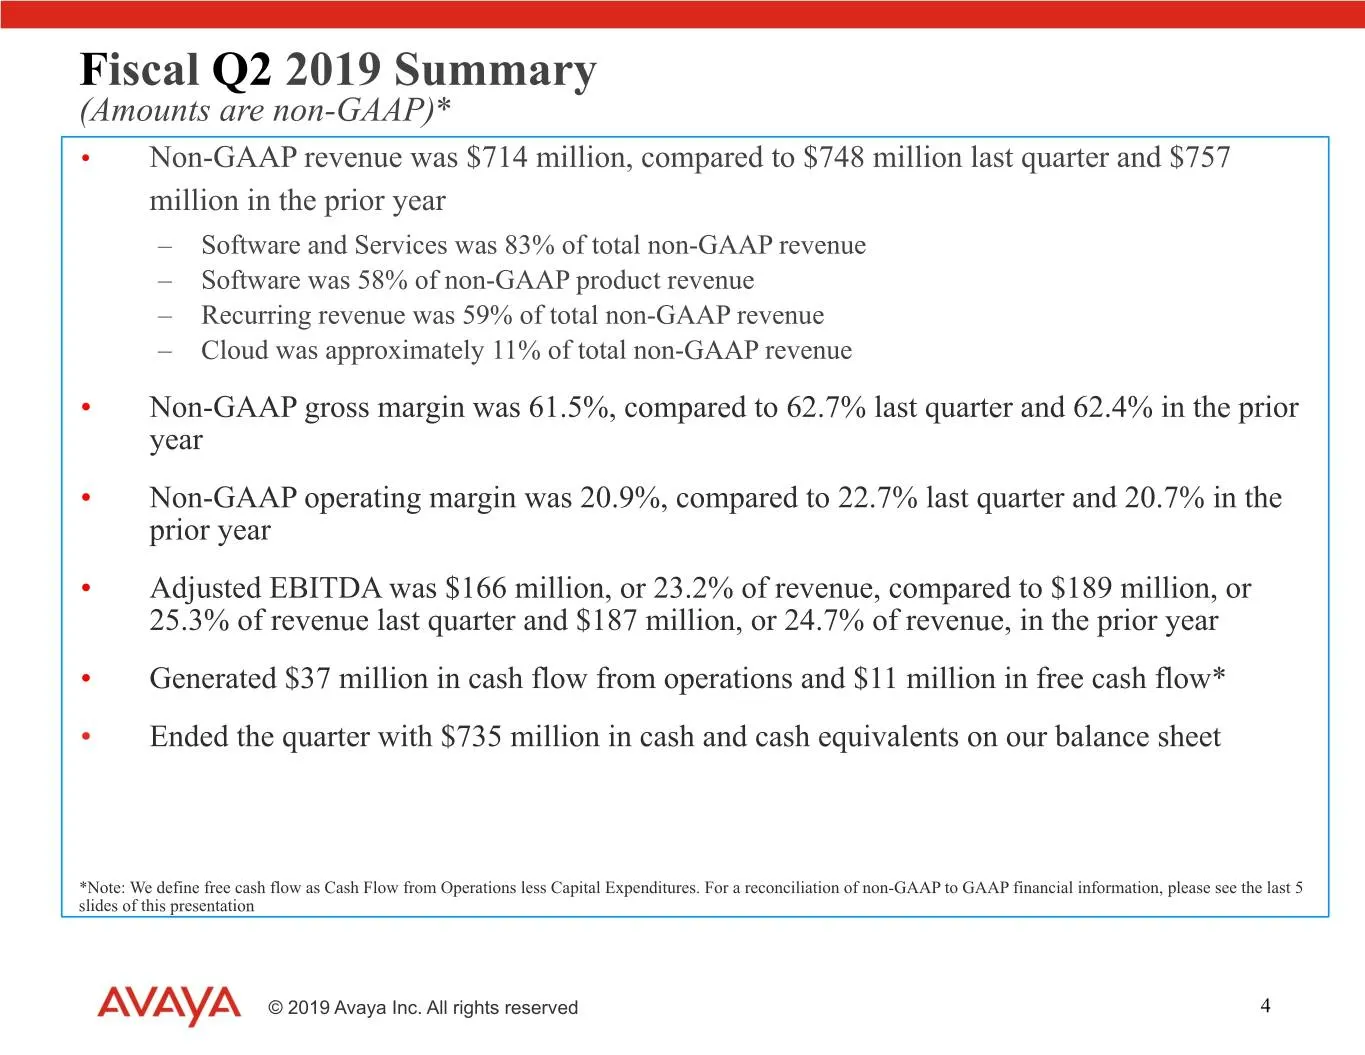
TEXT 0 – 0 – 0 204-0-0 127-127-127 17-114-210 80-200-74 86-183-242 247-150-70 Fiscal Q2 2019 Summary (Amounts are non-GAAP)* • Non-GAAP revenue was $714 million, compared to $748 million last quarter and $757 million in the prior year – Software and Services was 83% of total non-GAAP revenue – Softw
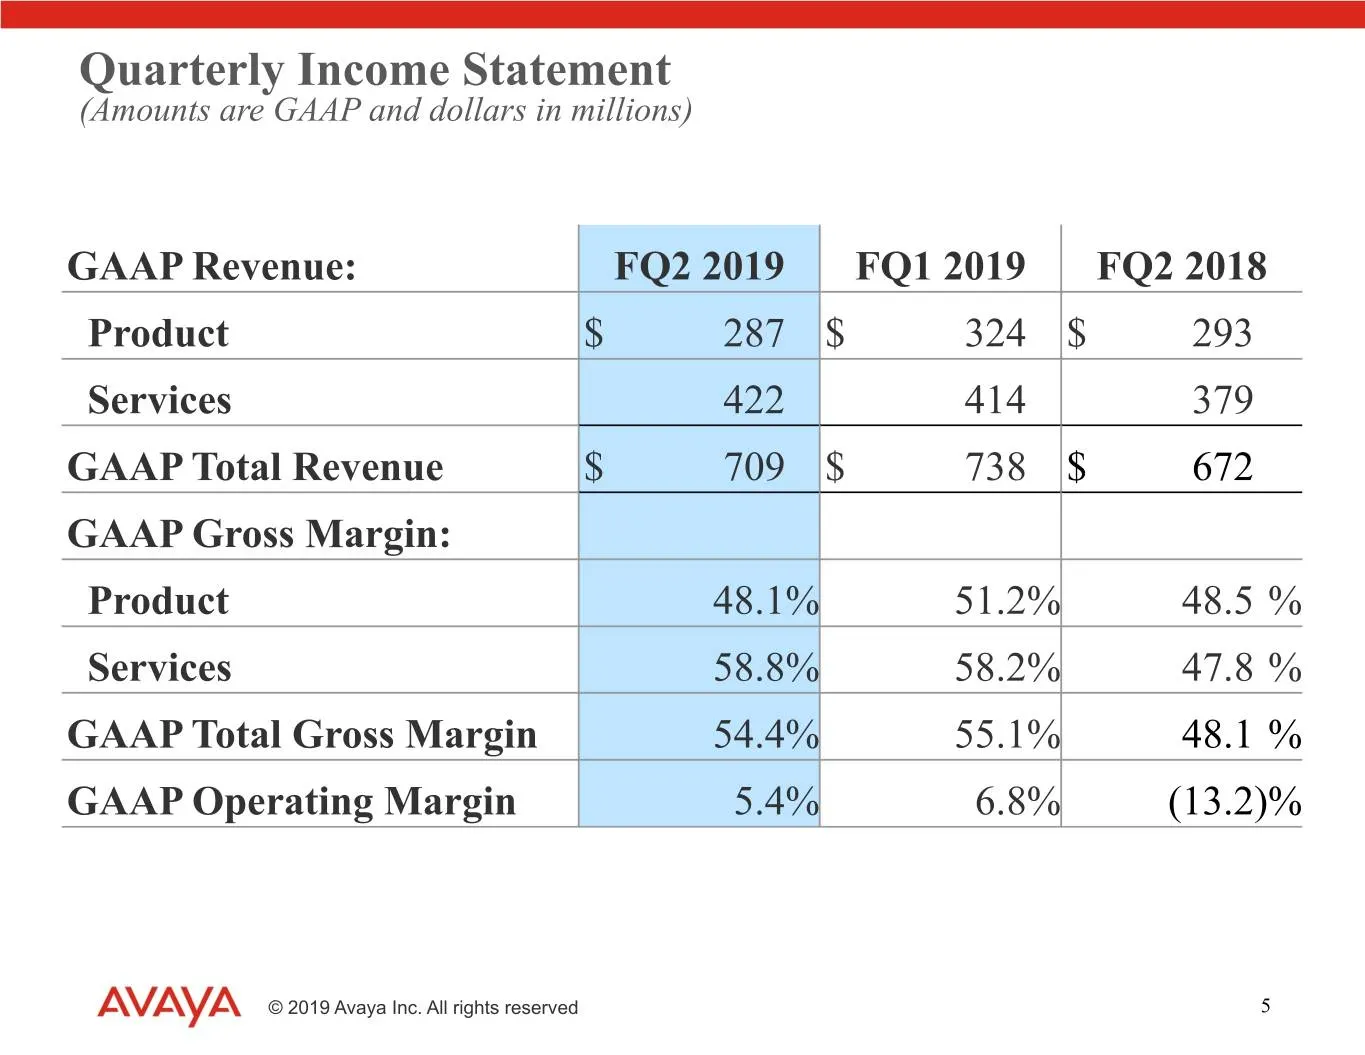
Slide 5: Quarterly Income Statement (GAAP)
TEXT 0 – 0 – 0 204-0-0 127-127-127 17-114-210 80-200-74 86-183-242 247-150-70 Quarterly Income Statement (Amounts are GAAP and dollars in millions) GAAP Revenue: FQ2 2019 FQ1 2019 FQ2 2018 Product $ 287 $ 324 $ 293 Services 422 414 379 GAAP Total Revenue $ 709 $ 738 $ 672 GAAP Gross Margin: Product
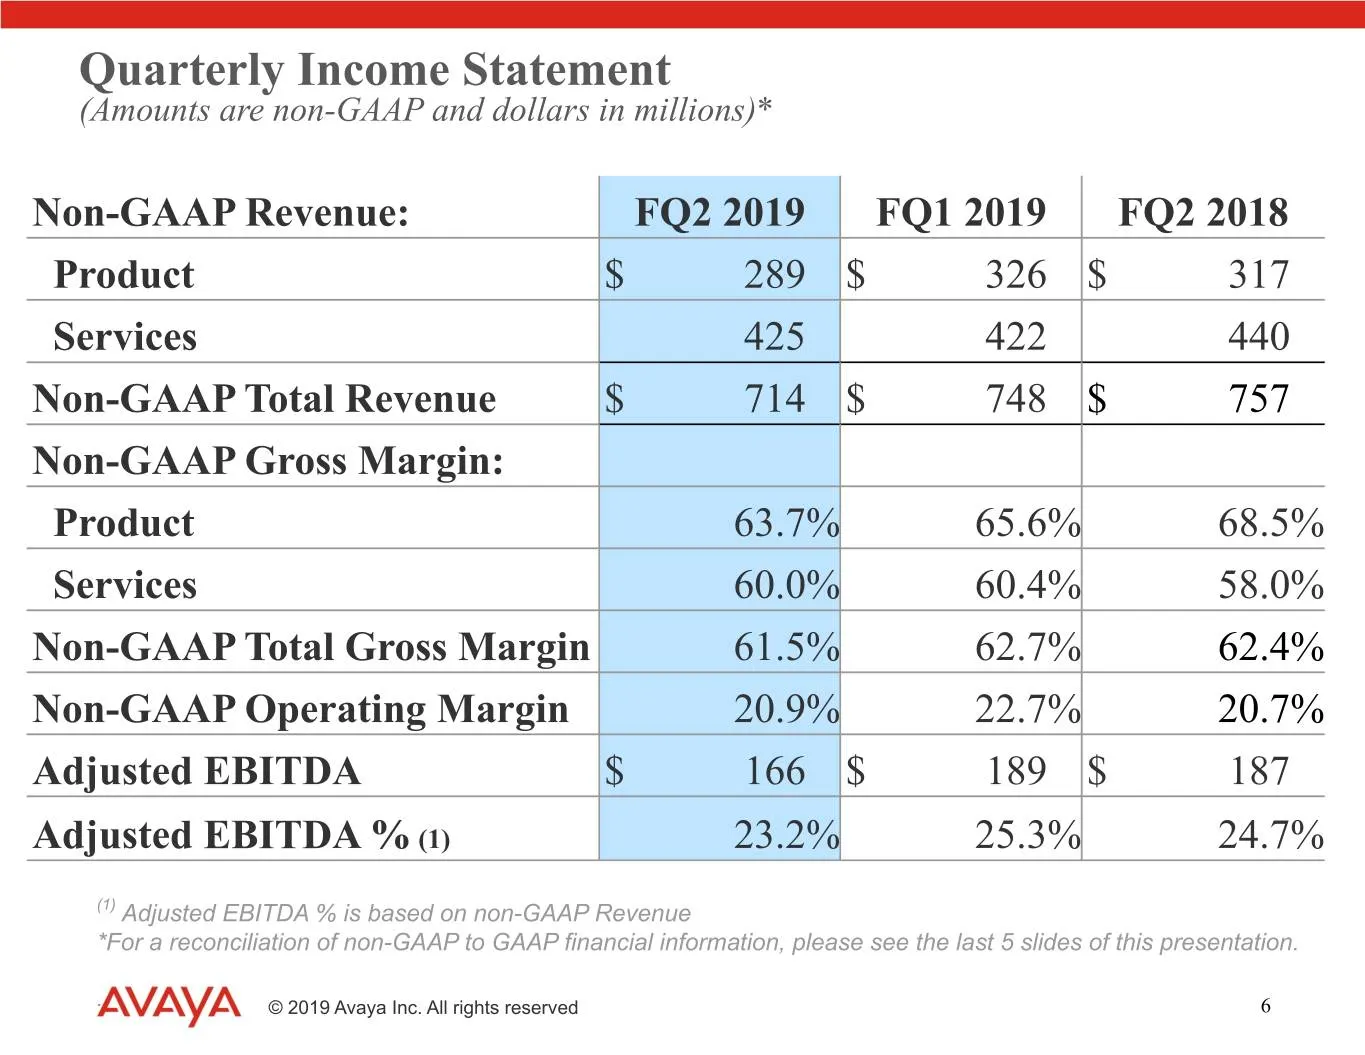
Slide 6: Quarterly Income Statement (non-GAAP)
TEXT 0 – 0 – 0 204-0-0 127-127-127 17-114-210 80-200-74 86-183-242 247-150-70 Quarterly Income Statement (Amounts are non-GAAP and dollars in millions)* Non-GAAP Revenue: FQ2 2019 FQ1 2019 FQ2 2018 Product $ 289 $ 326 $ 317 Services 425 422 440 Non-GAAP Total Revenue $ 714 $ 748 $ 757 Non-GAAP Gross
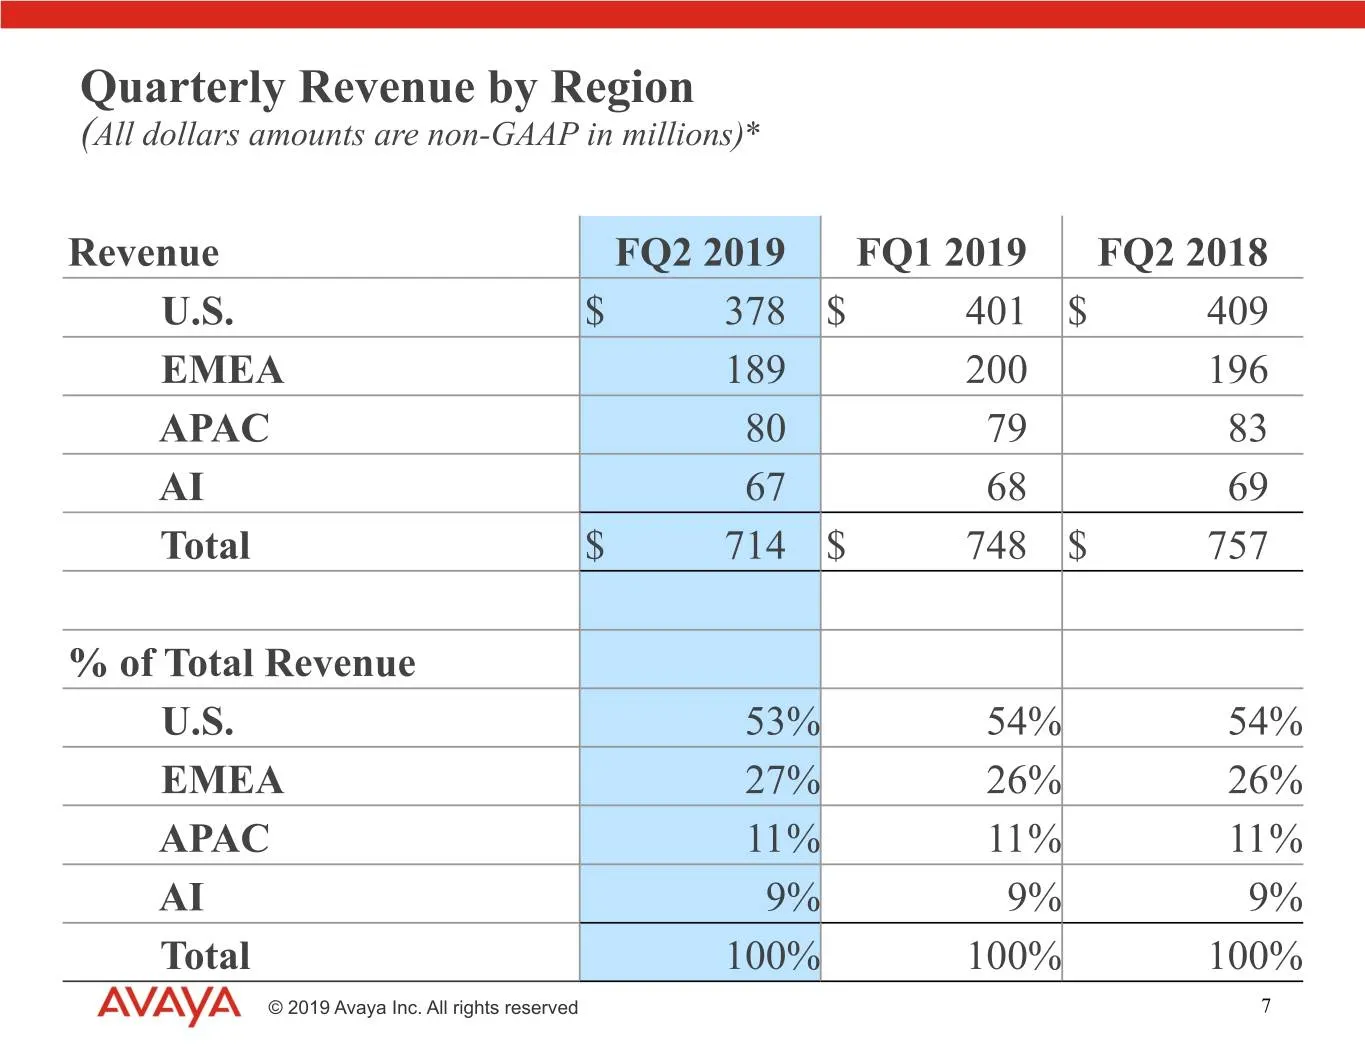
Slide 7: Quarterly Revenue by Region
TEXT 0 – 0 – 0 204-0-0 127-127-127 17-114-210 80-200-74 86-183-242 247-150-70 Quarterly Revenue by Region (All dollars amounts are non-GAAP in millions)* Revenue FQ2 2019 FQ1 2019 FQ2 2018 U.S. $ 378 $ 401 $ 409 EMEA 189 200 196 APAC 80 79 83 AI 67 68 69 Total $ 714 $ 748 $ 757 % of Total Revenue U.
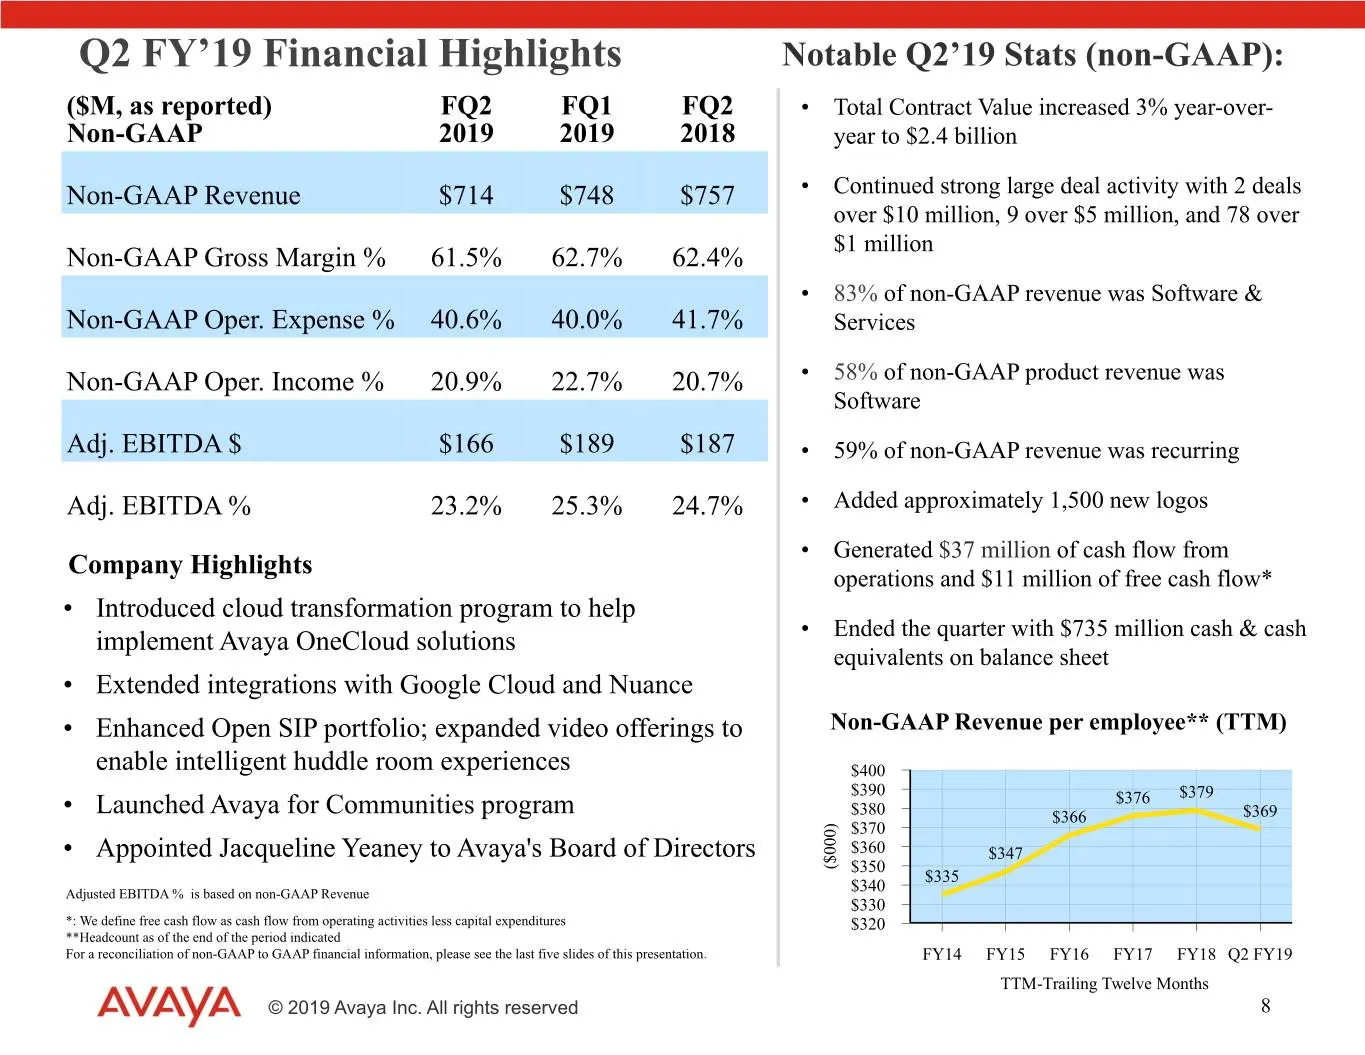
Slide 8: Q2 FY'19 Financial Highlights
TEXT 0 – 0 – 0 204-0-0 127-127-127 17-114-210 80-200-74 86-183-242 247-150-70 Q2 FY’19 Financial Highlights Notable Q2’19 Stats (non-GAAP): ($M, as reported) FQ2 FQ1 FQ2 • Total Contract Value increased 3% year-over- Non-GAAP 2019 2019 2018 year to $2.4 billion Non-GAAP Revenue $714 $748 $757 • Cont
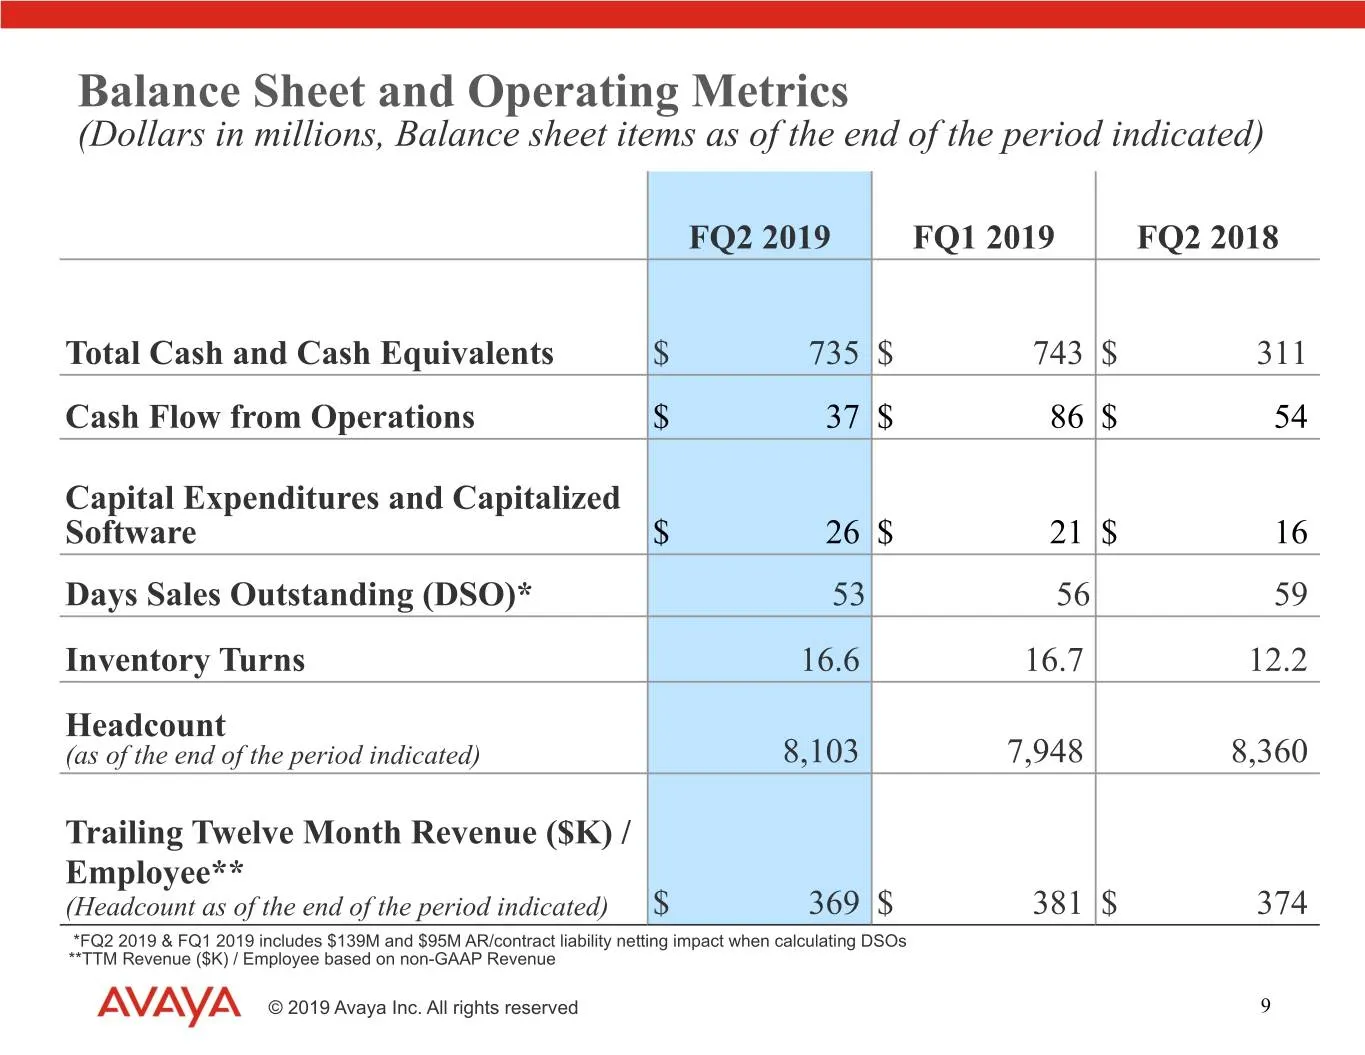
Slide 9: Balance Sheet and Operating Metrics
TEXT 0 – 0 – 0 204-0-0 127-127-127 17-114-210 80-200-74 86-183-242 247-150-70 Balance Sheet and Operating Metrics (Dollars in millions, Balance sheet items as of the end of the period indicated) FQ2 2019 FQ1 2019 FQ2 2018 Total Cash and Cash Equivalents $ 735 $ 743 $ 311 Cash Flow from Operations $
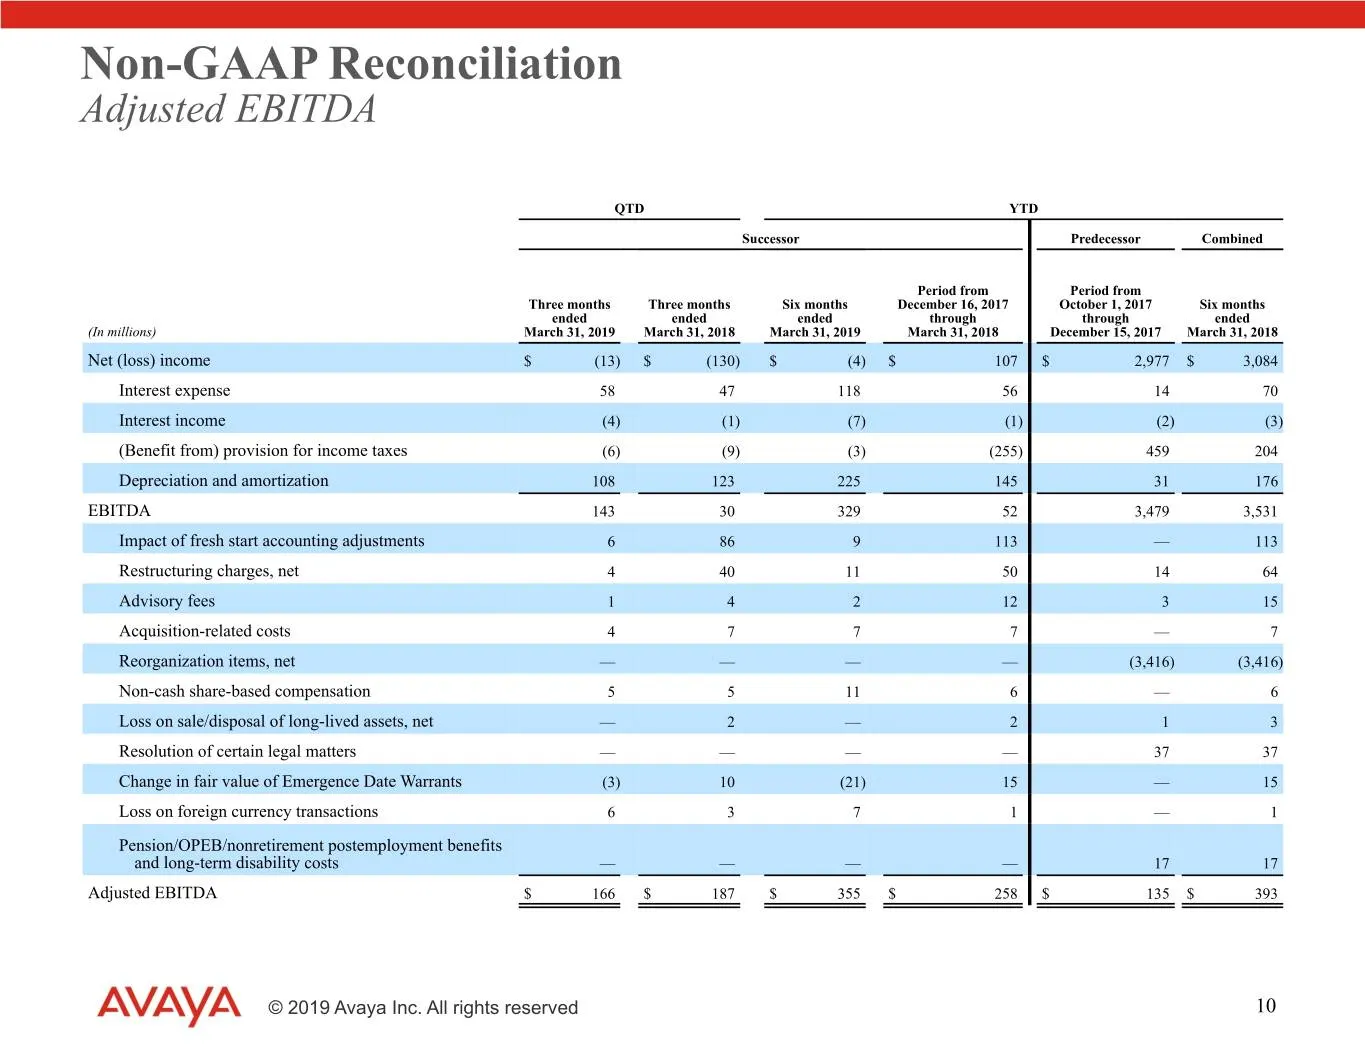
Slide 10: Non-GAAP Reconciliation Adjusted EBITDA
TEXT 0 – 0 – 0 204-0-0 127-127-127 17-114-210 80-200-74 86-183-242 247-150-70 Non-GAAP Reconciliation Adjusted EBITDA QTD YTD Successor Predecessor Combined Period from Period from Three months Three months Six months December 16, 2017 October 1, 2017 Six months ended ended ended through through end
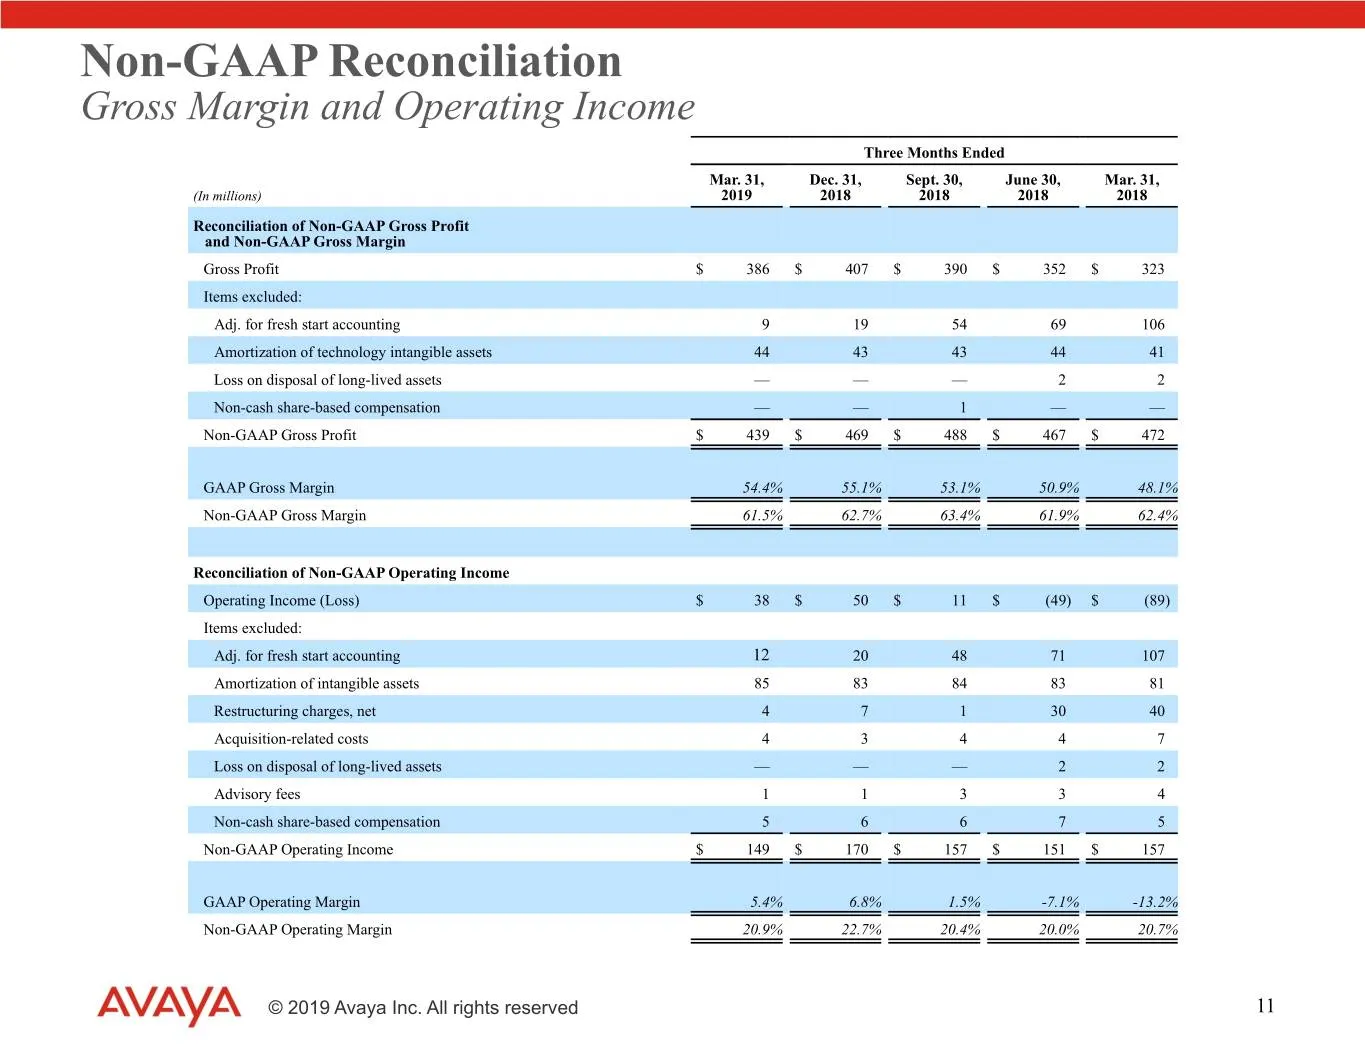
Slide 11: Non-GAAP Reconciliation Gross Margin and Operating Income
TEXT 0 – 0 – 0 204-0-0 127-127-127 17-114-210 80-200-74 86-183-242 247-150-70 Non-GAAP Reconciliation Gross Margin and Operating Income Three Months Ended Mar. 31, Dec. 31, Sept. 30, June 30, Mar. 31, (In millions) 2019 2018 2018 2018 2018 Reconciliation of Non-GAAP Gross Profit and Non-GAAP Gross M
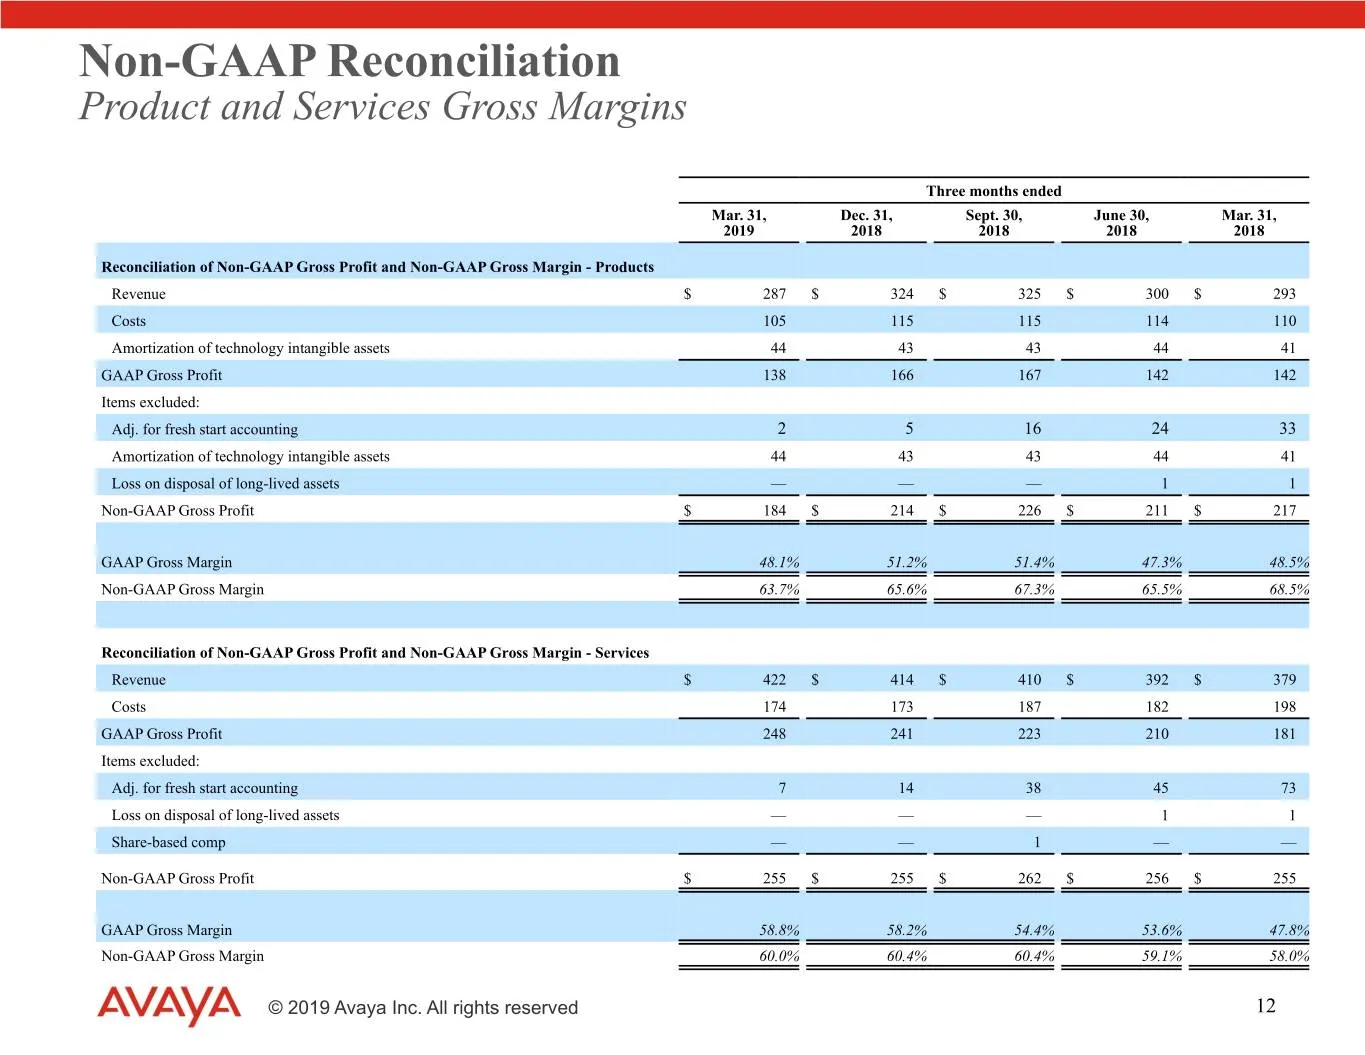
Slide 12: Non-GAAP Reconciliation Product and Services Gross Margins
TEXT 0 – 0 – 0 204-0-0 127-127-127 17-114-210 80-200-74 86-183-242 247-150-70 Non-GAAP Reconciliation Product and Services Gross Margins Three months ended Mar. 31, Dec. 31, Sept. 30, June 30, Mar. 31, 2019 2018 2018 2018 2018 Reconciliation of Non-GAAP Gross Profit and Non-GAAP Gross Margin - Produ
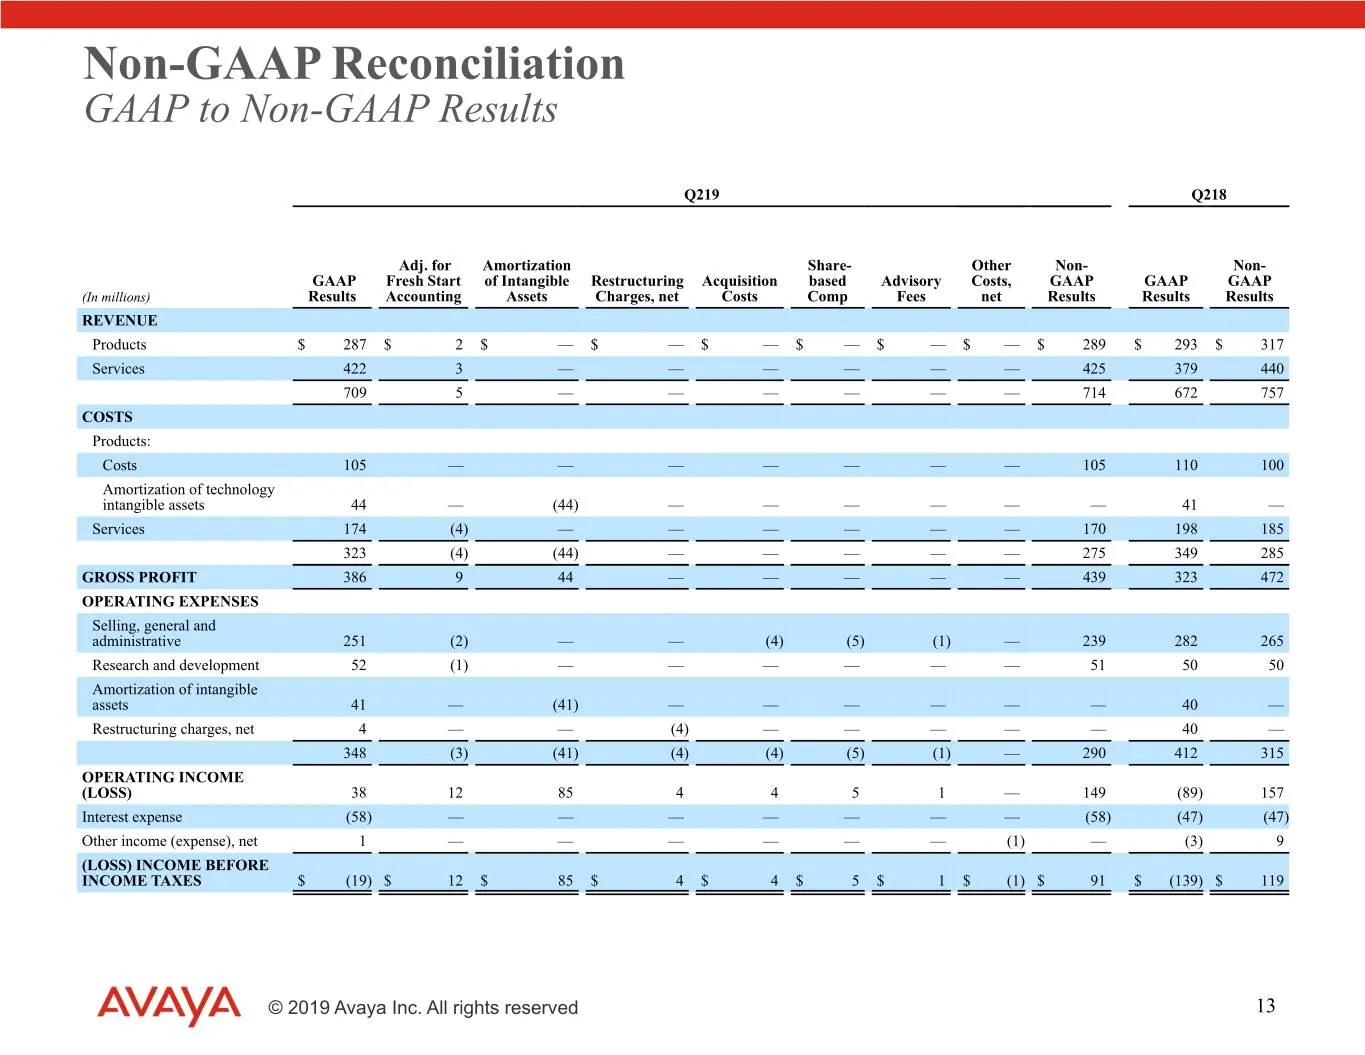
Slide 13: Non-GAAP Reconciliation GAAP to Non-GAAP Results
TEXT 0 – 0 – 0 204-0-0 127-127-127 17-114-210 80-200-74 86-183-242 247-150-70 Non-GAAP Reconciliation GAAP to Non-GAAP Results Q219 Q218 Adj. for Amortization Share- Other Non- Non- GAAP Fresh Start of Intangible Restructuring Acquisition based Advisory Costs, GAAP GAAP GAAP (In millions) Results Ac

Slide 14: 17-114-210 80-200-74 86-183-242 247-150-70
TEXT 0 – 0 – 0 204-0-0 127-127-127 17-114-210 80-200-74 86-183-242 247-150-70 © 2019 Avaya Inc. All rights reserved
Source: SEC EDGAR · 8-K filed May 9, 2019
More decks from Avaya Inc
 Corporate Update (February 2023)11 slides · Feb 14, 2023
 Q3 FY2022 Earnings Presentation26 slides · Aug 9, 2022
 Q2 FY2022 Earnings Presentation36 slides · May 10, 2022
 Q1 FY2022 Earnings Presentation36 slides · Feb 9, 2022
 Investor Day (December 2021)103 slides · December 2021
 Q4 2021 Earnings Presentation38 slides · Nov 22, 2021