Mitel Networks — Investor Day (February 2018)
140 slides from Mitel Networks's investor day presentation, Feb 27, 2018

Slide 1: Mitel 2018 Financial Analyst Day
Mitel 2018 Financial Analyst Day Lotte New York Palace Hotel February 27, 2018 Exhibit 99.1
Slide 2: Safe Harbor Statement
Safe Harbor Statement Forward Looking Statements Some of the statements in this presentation are forward-looking statements (or forward-looking information) within the meaning of applicable U.S. and Canadian securities laws. These include statements using the words believe, target, outlook, may, wil
Slide 3: Non-GAAP Financial Measurements
Non-GAAP Financial Measurements In an effort to provide investors with additional information regarding the company's results as determined by generally accepted accounting principles (GAAP), the company also discusses, in its earnings press release, earnings presentation materials and Analyst Day p
Slide 4: Agenda
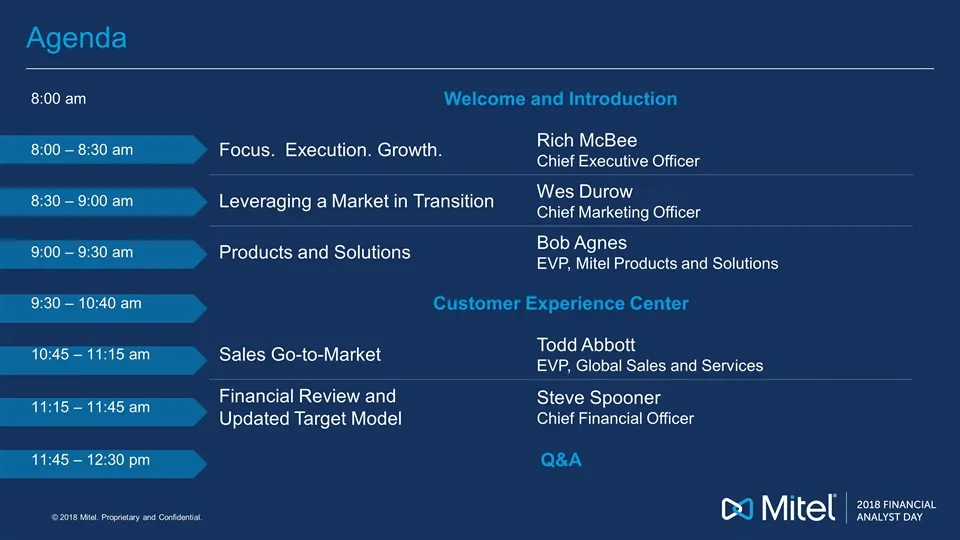
Agenda 8:00 am Welcome and Introduction 8:00 – 8:30 am Focus. Execution. Growth. Rich McBee Chief Executive Officer 8:30 – 9:00 am Leveraging a Market in Transition Wes Durow Chief Marketing Officer 9:00 – 9:30 am Products and Solutions Bob Agnes EVP, Mitel Products and Solutions 9:30 – 10:40 am Cus
Slide 5: Mitel Focus. Execution. Growth.
Mitel Focus. Execution. Growth. Rich McBee President and CEO

Slide 6: Welcome to NYC
Welcome to NYC
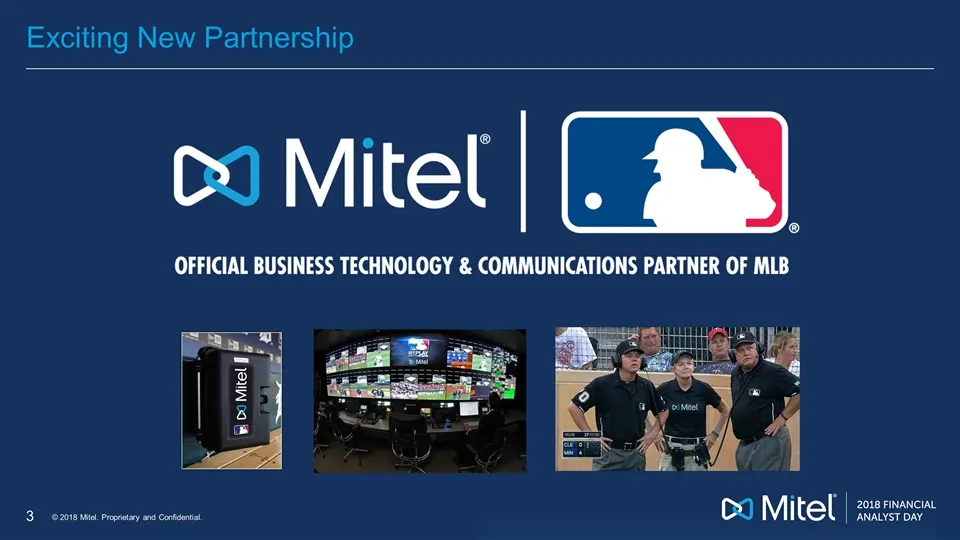
Slide 7: Exciting New Partnership
Exciting New Partnership 00 Mitel OFFICIAL BUSINESS TECHNOLOGY & COMMUNICATIONS PARTNER OF MLB & & Boo #00 Mitel Cd Mitel | zzgesc"

Slide 8: Year of BIG Change 2017
Year of BIG Change 2017
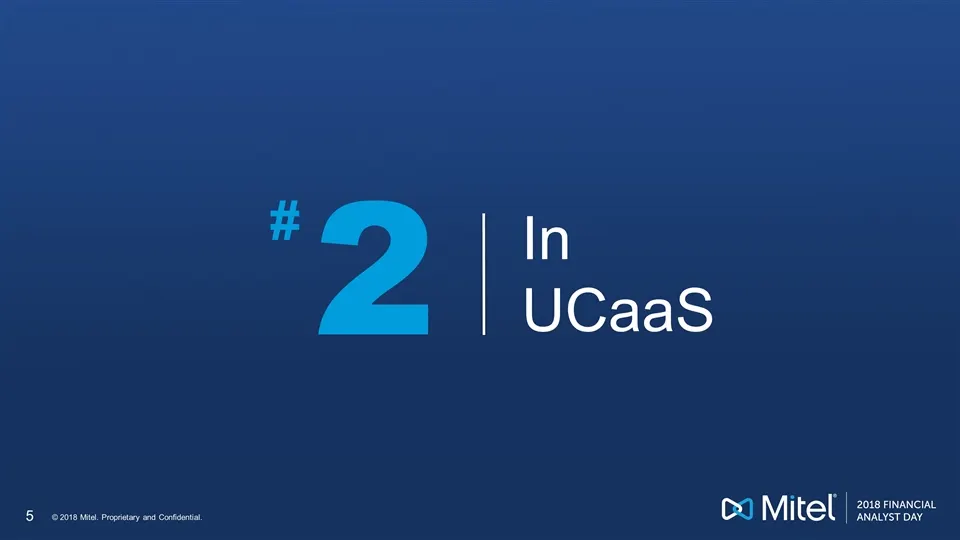
Slide 9: UCaaS
‘2\! UCaaS soy psn oe Cd Mitel |
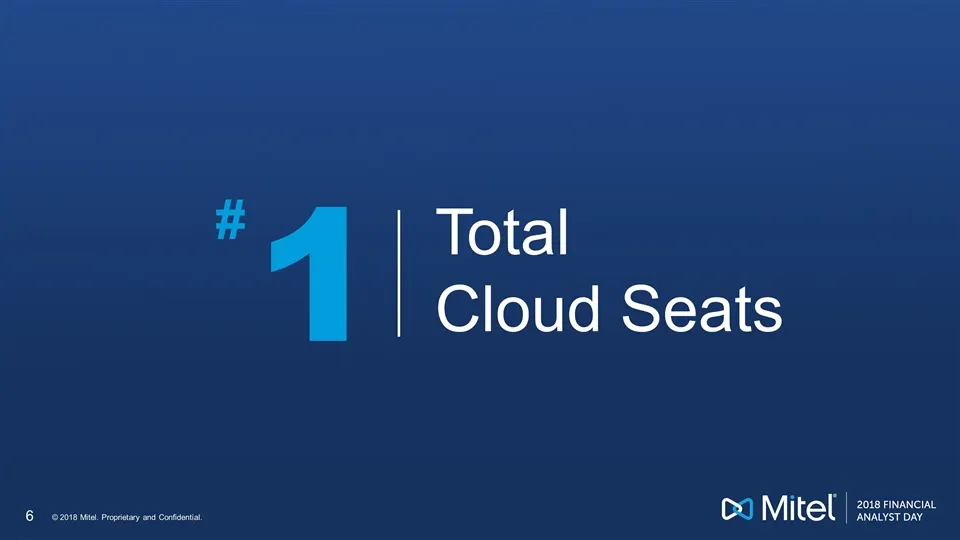
Slide 10: Total Cloud Seats
Total Cloud Seats 1 #

Slide 11: 2018 Financial Analyst Day
2018 FINANCIAL
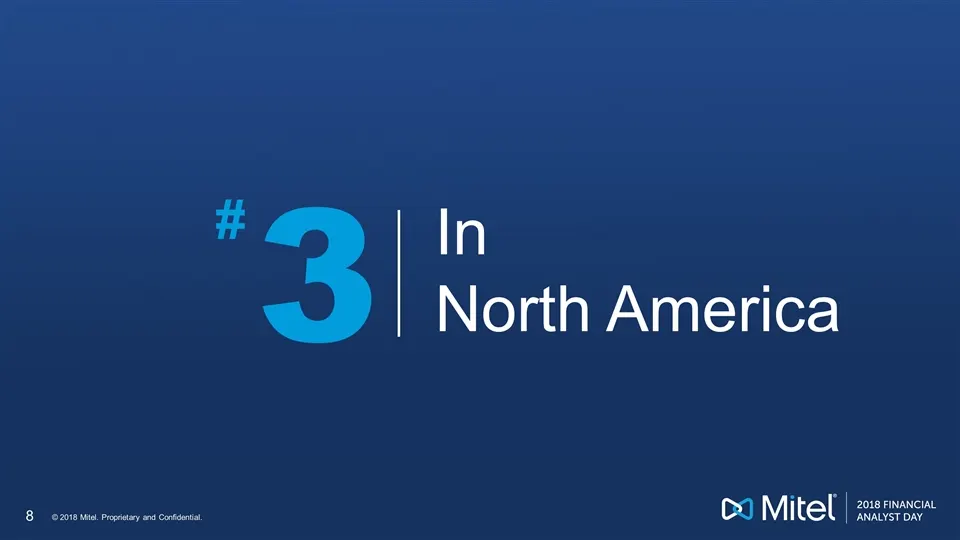
Slide 12: North America
"3 LN North America Cd Mitel | 2 2018 FINANCIAL

Slide 13: Years in a Row Gartner UC MQ Leader
Years in a Row 4 Gartner UC MQ Leader
Slide 14: Global Users
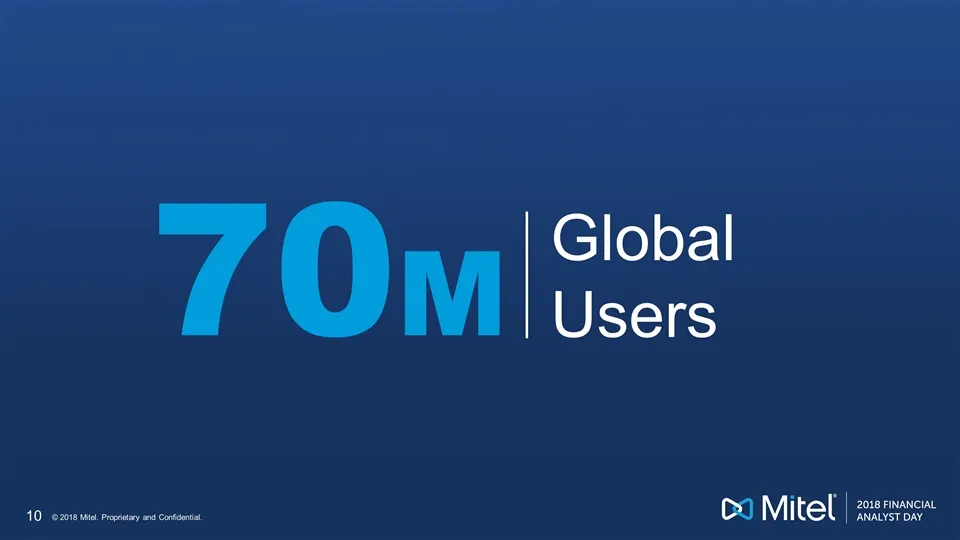
70m (©2018 Mtl. Prony ad Conkdont Global Users
Slide 15: Million Global Users by Region
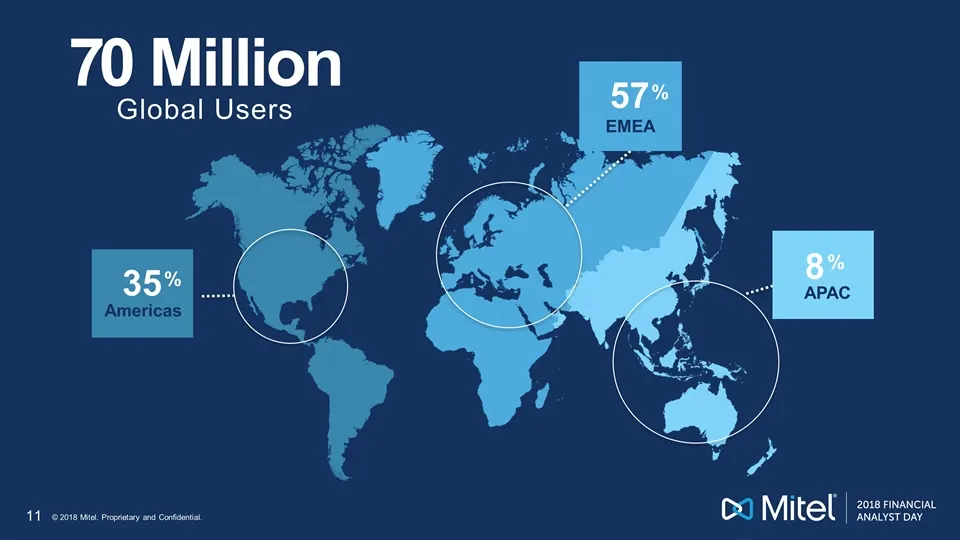
70 Million Global Users Americas 35 % APAC 8 % EMEA 57 %
Slide 16: New Scale, New Strength
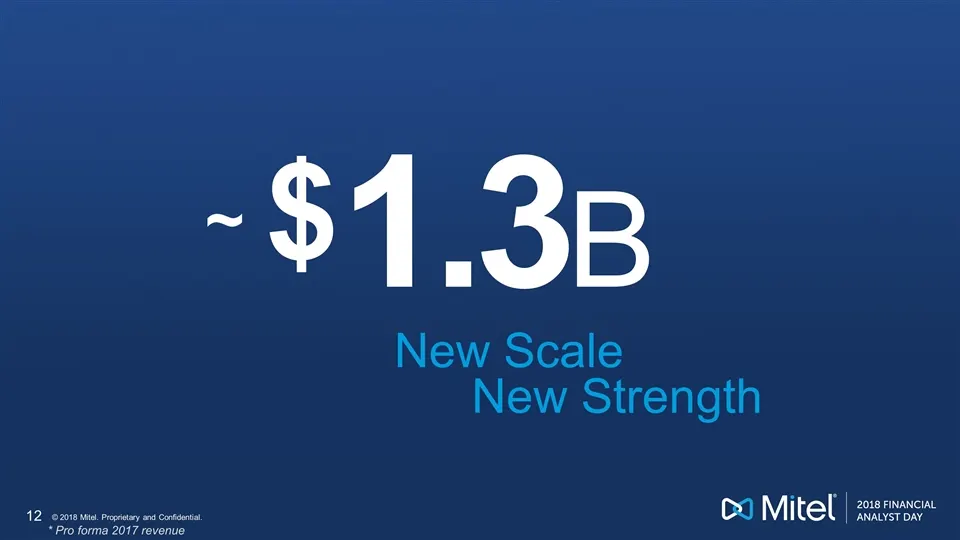
1.3B * Pro forma 2017 revenue $ ~ New Scale New Strength
Slide 17: Mitel Today
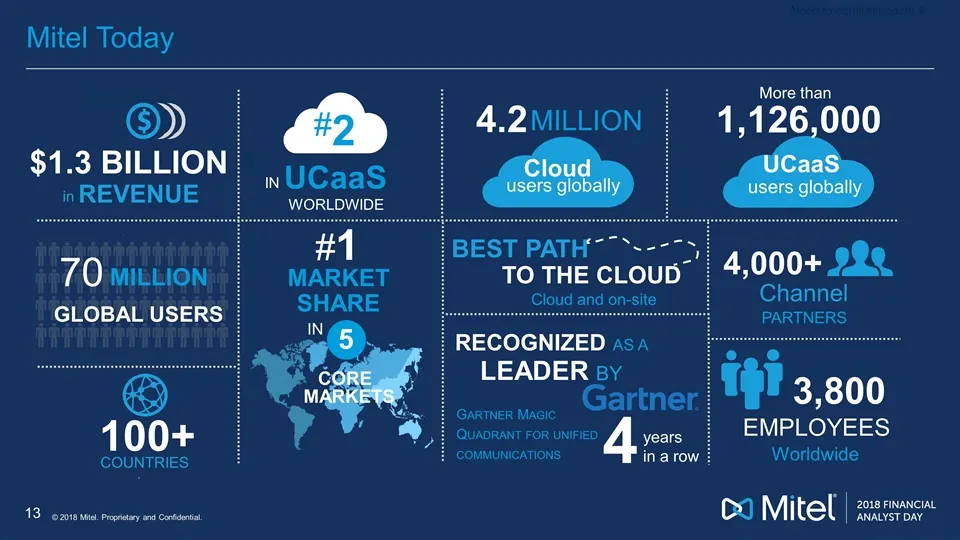
Mitel Today 70 MILLION GLOBAL USERS Operating in 100+ COUNTRIES Channel 4,000+ PARTNERS 3,800 EMPLOYEES Worldwide MARKETS #1 MARKET SHARE IN 5 CORE $ $1.3 BILLION in REVENUE 4.2 Cloud users globally MILLION RECOGNIZED AS A LEADER BY Gartner Magic Quadrant for unified communications 4 years in a row
Slide 18: BIG Year Ahead
2018 | BIG Year Ahead Cd Mitel | 2
Slide 19: Every customer will move to some kind of Cloud
Every customer will move to some kind of Cloud
Slide 20: Mitel's strategy is to make everything Cloud-Capable
Mitel’s strategy is to make everything Cloud-Capable
Slide 21: Strategy & Action
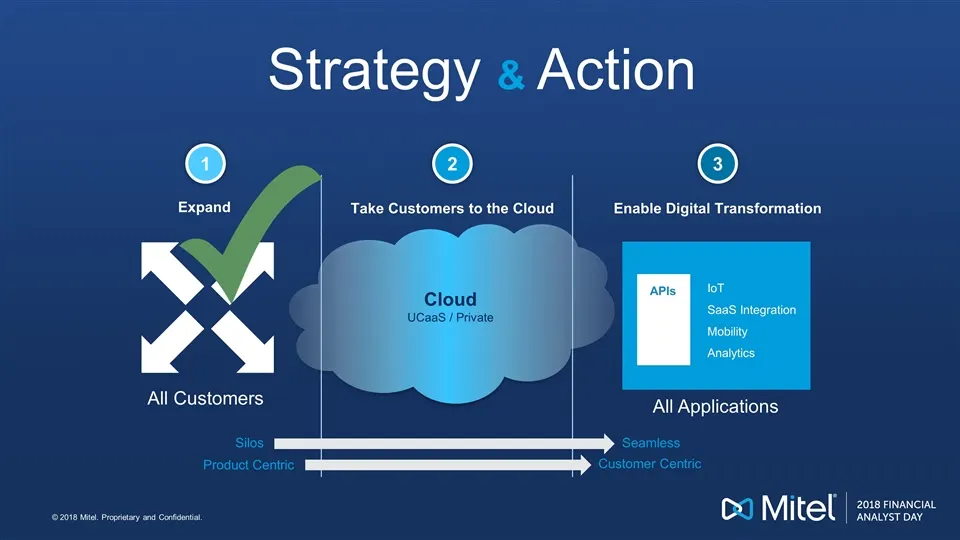
Strategy & Action Expand All Applications Seamless Enable Digital Transformation Take Customers to the Cloud 1 2 3 IoT SaaS Integration Mobility Analytics APIs All Customers Silos Cloud UCaaS / Private Product Centric Customer Centric
Slide 22: Focus. Execution. Growth.
‘ocuSs- . Execution Growth
Slide 23: 2018: Crossing the V – Transitioning to Revenue Growth
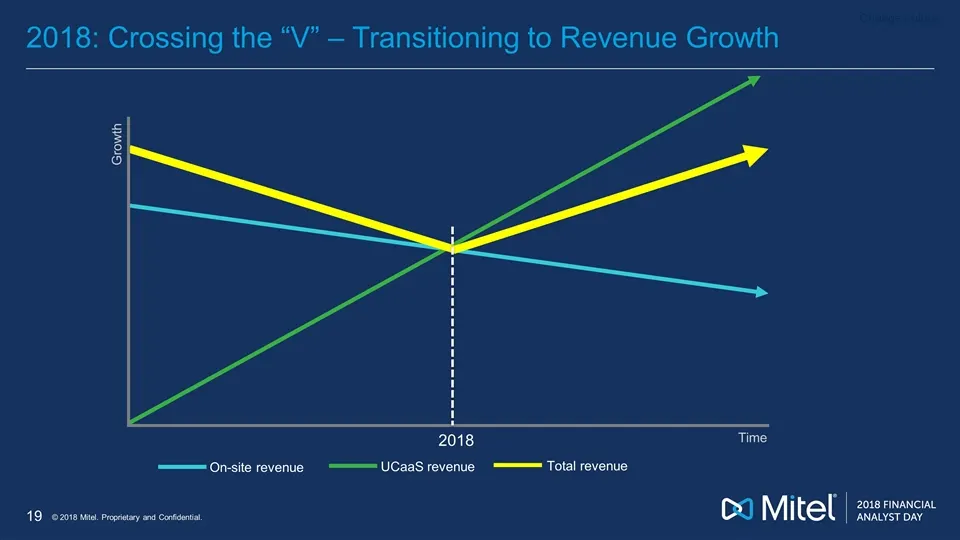
2018: Crossing the “V” – Transitioning to Revenue Growth Time 2018 On-site revenue UCaaS revenue Total revenue Growth Change colors
Slide 24: Why Mitel
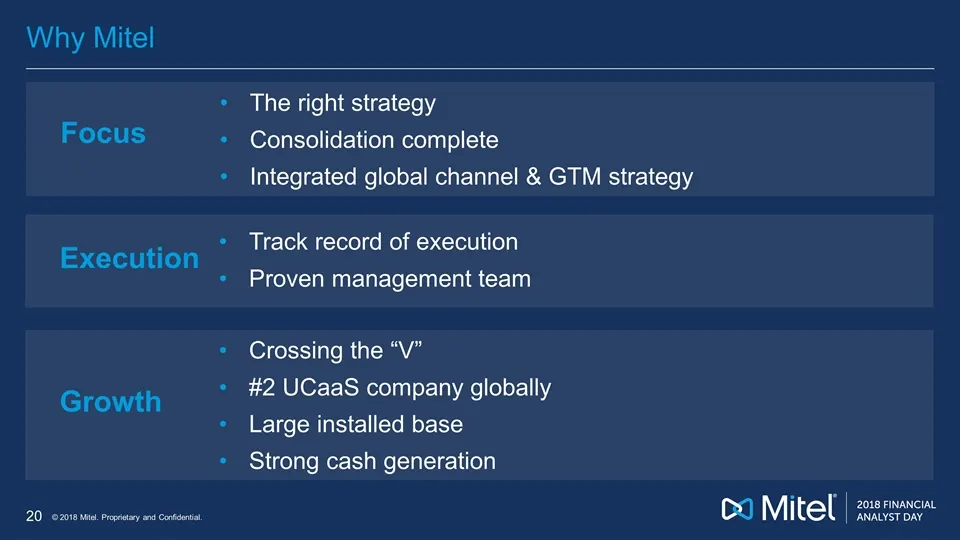
Why Mitel The right strategy Consolidation complete Integrated global channel & GTM strategy Focus Crossing the “V” #2 UCaaS company globally Large installed base Strong cash generation Growth Track record of execution Proven management team Execution

Slide 25: 2018 Financial Analyst Day
2018 FINANCIAL ANALYST DAY Co Mitel

Slide 26: Leveraging A Market In Transition
Leveraging A Market In Transition Wes Durow Chief Marketing Officer
Slide 27: Market Overview
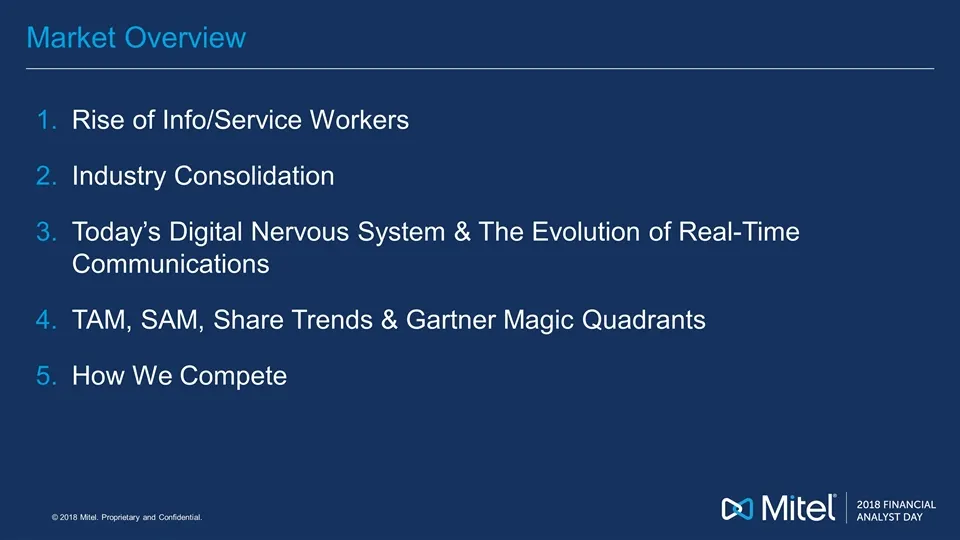
Market Overview Rise of Info/Service Workers Industry Consolidation Today’s Digital Nervous System & The Evolution of Real-Time Communications TAM, SAM, Share Trends & Gartner Magic Quadrants How We Compete
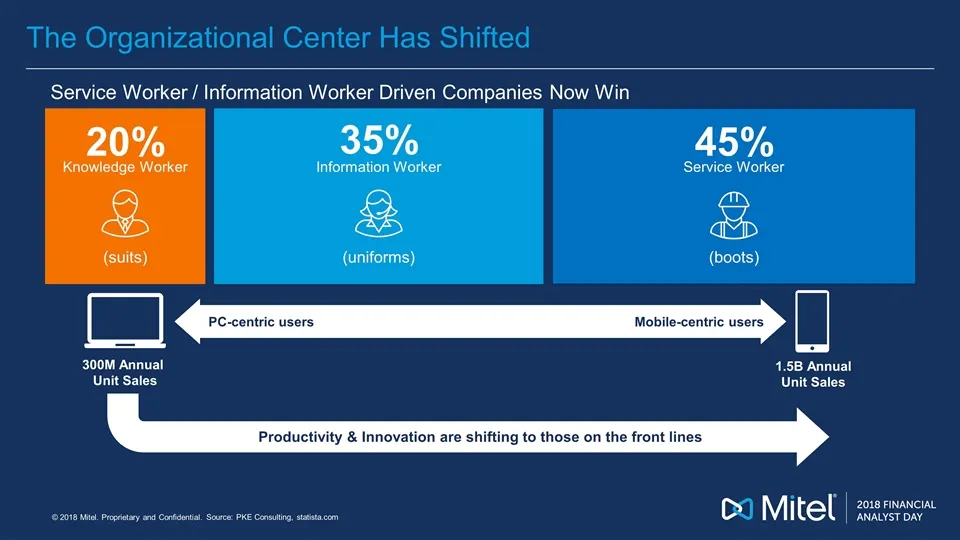
Slide 28: The Organizational Center Has Shifted
(boots) 45% Service Worker The Organizational Center Has Shifted Service Worker / Information Worker Driven Companies Now Win Source: PKE Consulting, statista.com Productivity & Innovation are shifting to those on the front lines PC-centric users Mobile-centric users 300M Annual Unit Sales 1.5B Annu
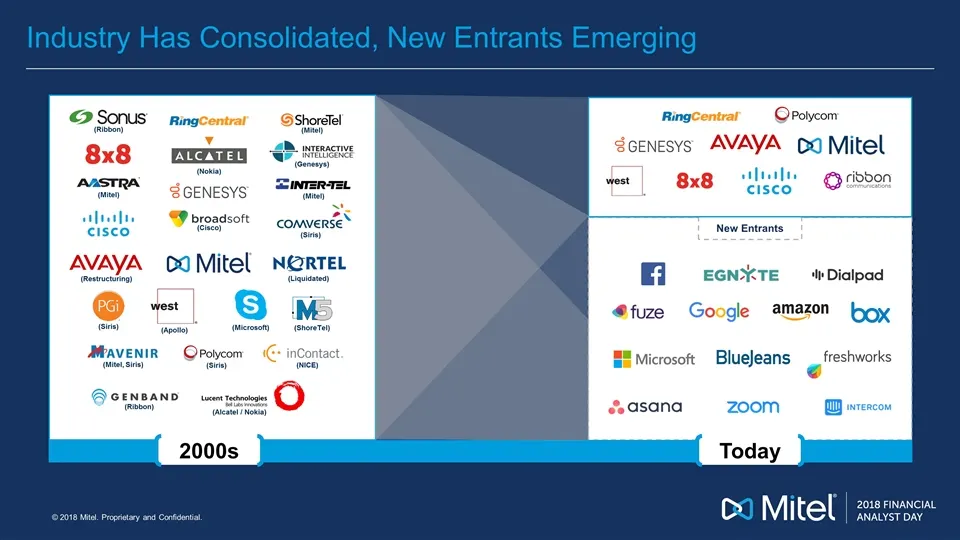
Slide 29: Industry Has Consolidated, New Entrants Emerging
Industry Has Consolidated, New Entrants Emerging New Entrants Today 2000s (Mitel) (Mitel) (Mitel) (Genesys) (NICE) (ShoreTel) (Liquidated) (Alcatel / Nokia) (Nokia) (Ribbon) (Mitel, Siris) (Siris) (Restructuring) (Siris) (Microsoft) (Siris) (Apollo) (Cisco) (Ribbon)
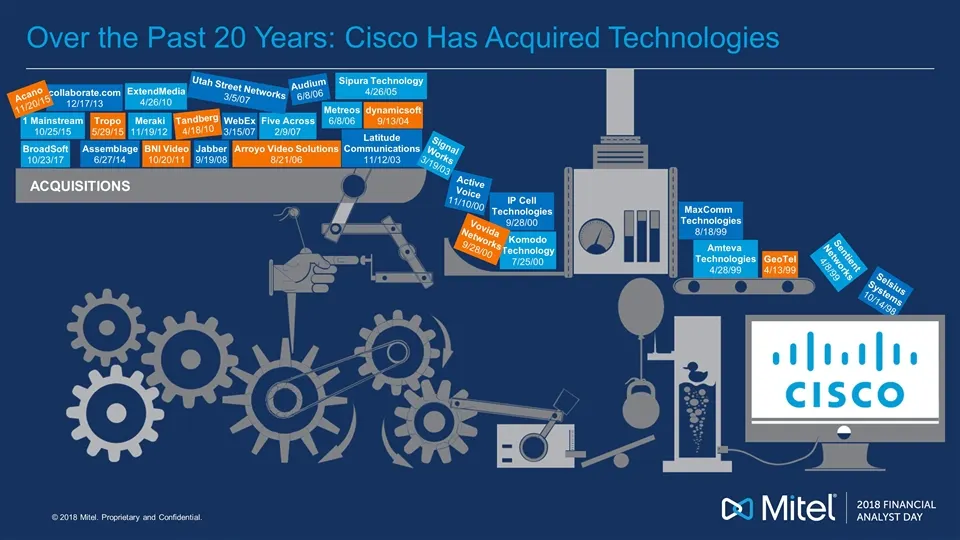
Slide 30: Cisco Acquisitions Over the Past 20 Years
Selsius Systems 10/14/98 Latitude Communications 11/12/03 dynamicsoft 9/13/04 Sipura Technology 4/26/05 Metreos 6/8/06 Arroyo Video Solutions 8/21/06 Five Across 2/9/07 Audium 6/8/06 Utah Street Networks 3/5/07 WebEx 3/15/07 Jabber 9/19/08 Tandberg 4/18/10 ExtendMedia 4/26/10 BNI Video 10/20/11 Mera
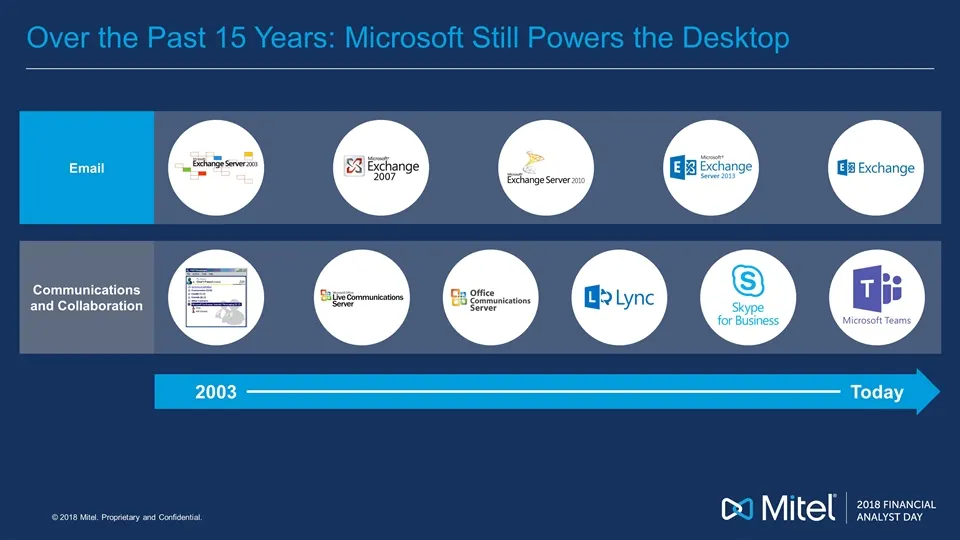
Slide 31: Microsoft Still Powers the Desktop
Over the Past 15 Years: Microsoft Still Powers the Desktop Email Communications and Collaboration 2003 Today
Slide 32: Mitel Has Acquired Land to Move to the Cloud
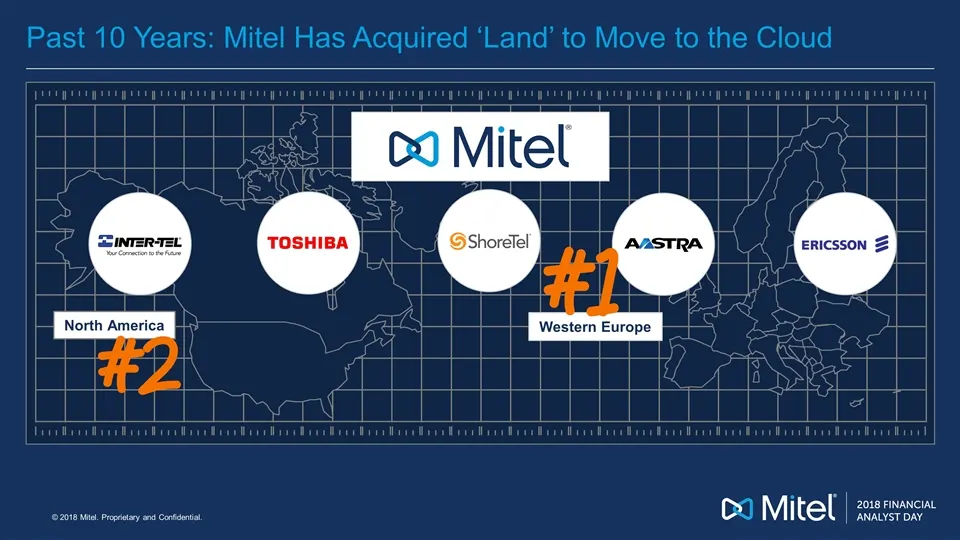
North America Past 10 Years: Mitel Has Acquired ‘Land’ to Move to the Cloud Western Europe
Slide 33: Industry-Specific SaaS Solutions
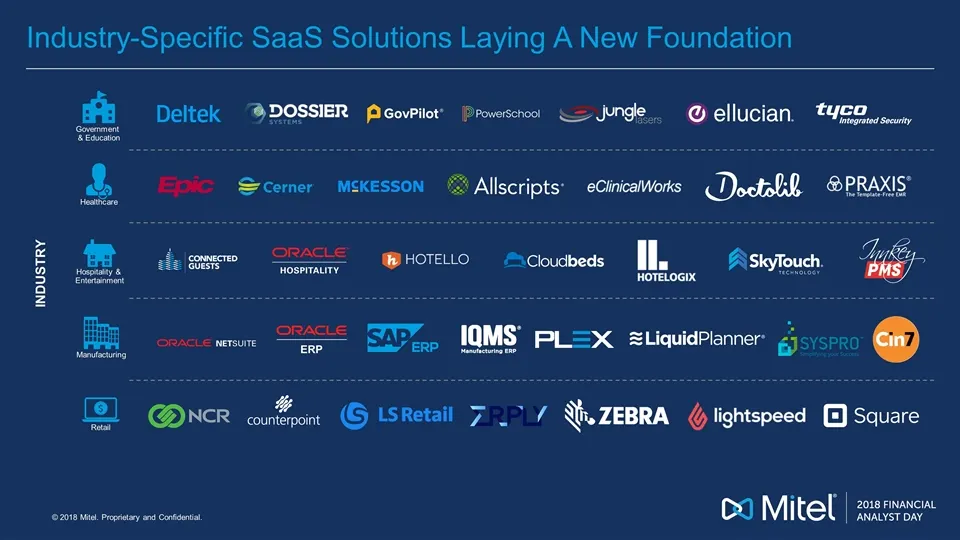
Industry-Specific SaaS Solutions Laying A New Foundation INDUSTRY Government & Education Healthcare Hospitality & Entertainment Manufacturing Retail
Slide 34: Evolution of Real-Time Communications
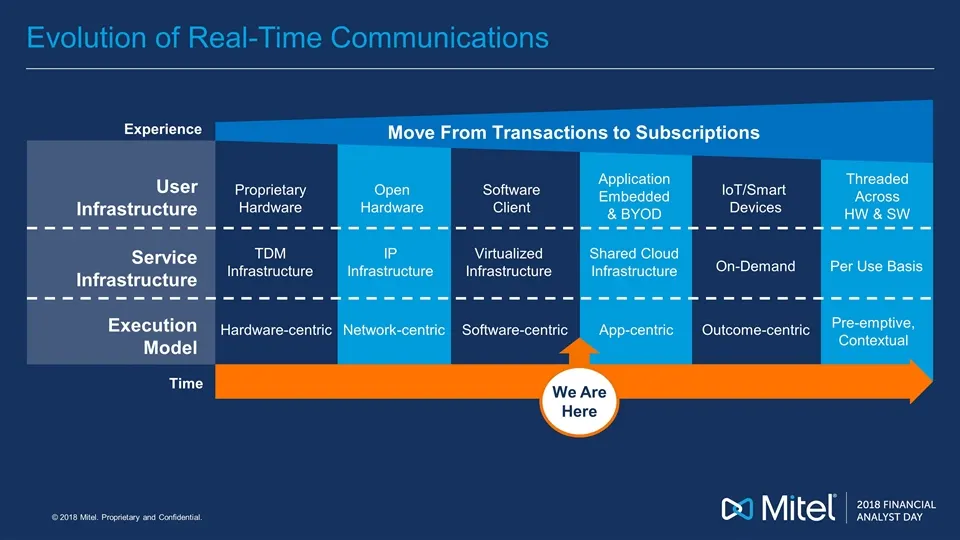
Evolution of Real-Time Communications Time Experience TDM Infrastructure IP Infrastructure Virtualized Infrastructure Shared Cloud Infrastructure On-Demand Per Use Basis Service Infrastructure Hardware-centric Network-centric Software-centric App-centric Outcome-centric Pre-emptive, Contextual Execu
Slide 35: IoT Adds a Third Circle to Real-Time Communications
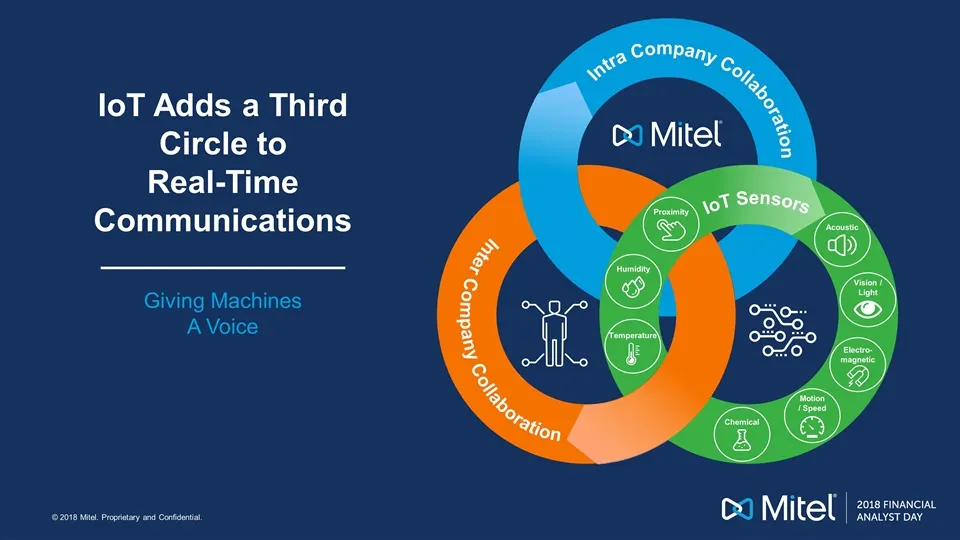
IoT Adds a Third Circle to Real-Time Communications Giving Machines A Voice Intra Company Collaboration Inter Company Collaboration IoT Sensors Acoustic Vision / Light Electro- magnetic Motion / Speed Chemical Temperature Humidity Proximity
Slide 36: On-Site vs. UCaaS Growth
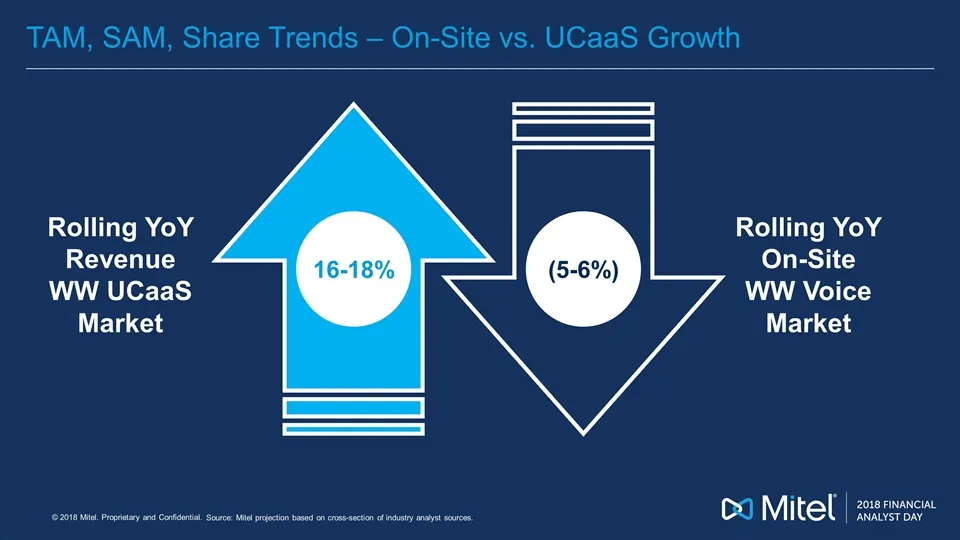
TAM, SAM, Share Trends – On-Site vs. UCaaS Growth 16-18% Rolling YoY Revenue WW UCaaS Market Rolling YoY On-Site WW Voice Market (5-6%) Source: Mitel projection based on cross-section of industry analyst sources.
Slide 37: Total Addressable Market
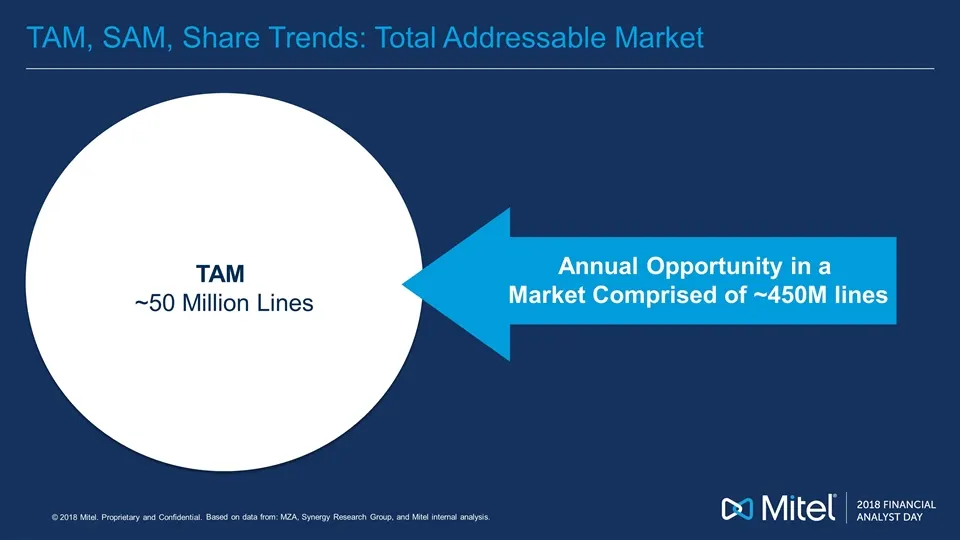
TAM, SAM, Share Trends: Total Addressable Market TAM ~50 Million Lines Based on data from: MZA, Synergy Research Group, and Mitel internal analysis. Annual Opportunity in a Market Comprised of ~450M lines
Slide 38: Serviceable Addressable Market
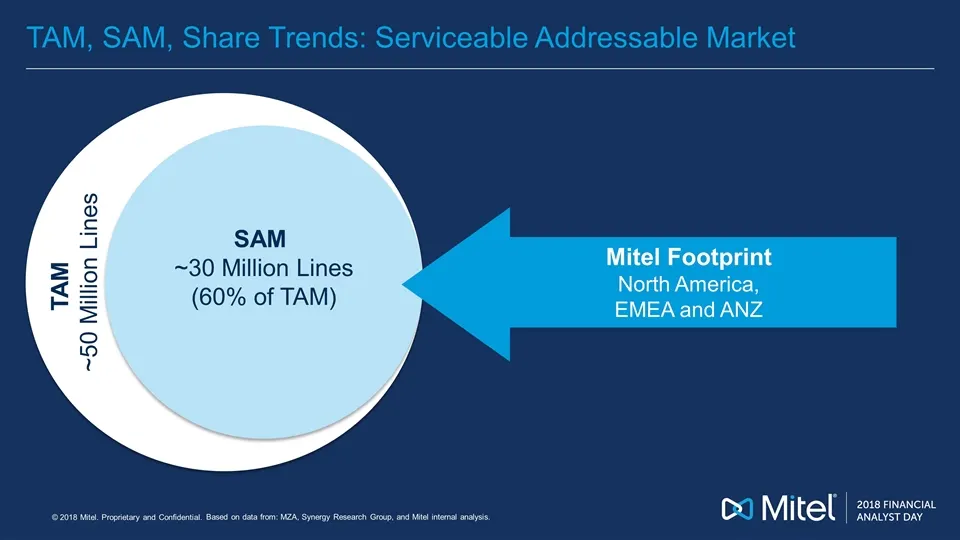
TAM, SAM, Share Trends: Serviceable Addressable Market SAM ~30 Million Lines (60% of TAM) Mitel Footprint North America, EMEA and ANZ TAM ~50 Million Lines Based on data from: MZA, Synergy Research Group, and Mitel internal analysis.
Slide 39: Target Market
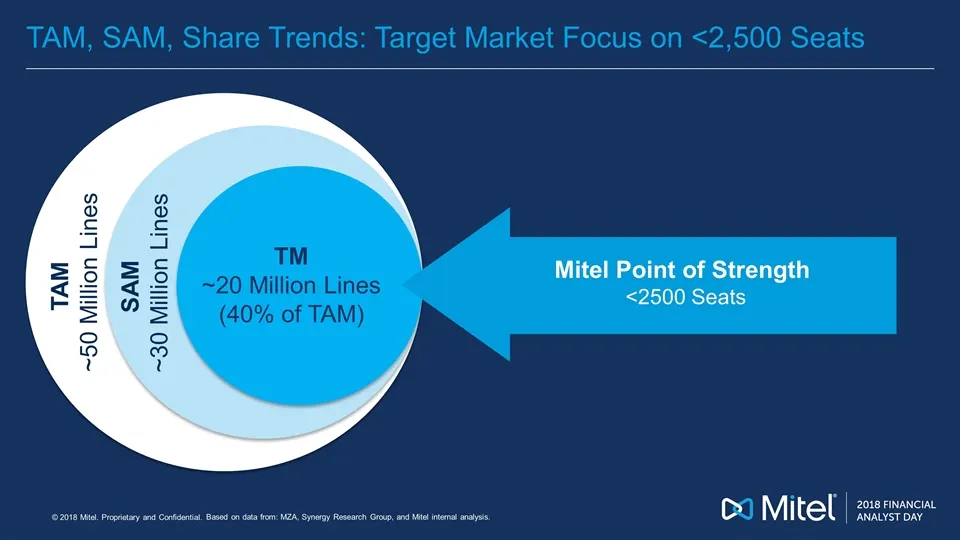
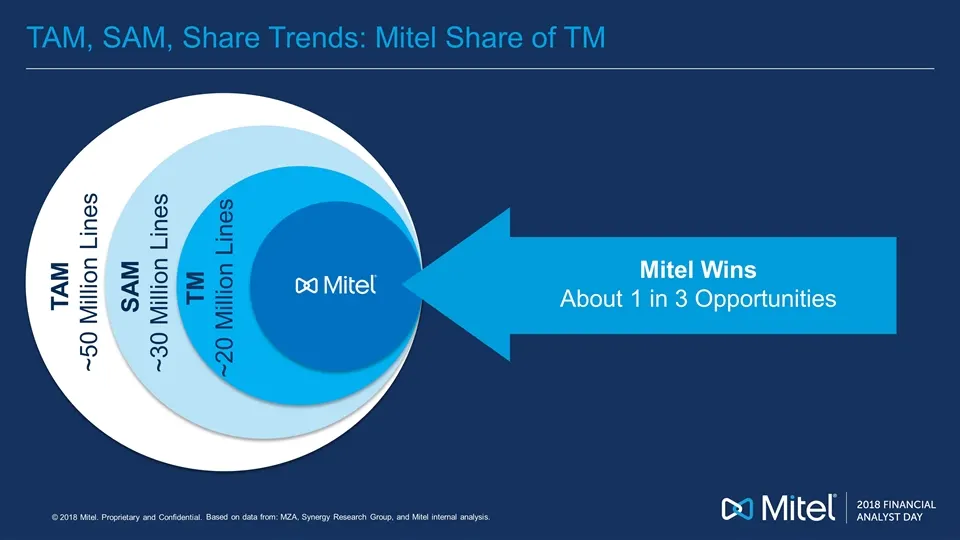
TAM, SAM, Share Trends: Target Market Focus on <2,500 Seats TAM – 48,698,000 Lines TM ~20 Million Lines (40% of TAM) SAM ~30 Million Lines TAM ~50 Million Lines Mitel Point of Strength <2500 Seats Based on data from: MZA, Synergy Research Group, and Mitel internal analysis.
Slide 40: Mitel Share of Target Market
TAM, SAM, Share Trends: Mitel Share of TM TAM – 48,698,000 Lines TM ~20 Million Lines SAM ~30 Million Lines TAM ~50 Million Lines Mitel Wins About 1 in 3 Opportunities Based on data from: MZA, Synergy Research Group, and Mitel internal analysis.
Slide 41: Cloud Market Growth & Segment Leaders
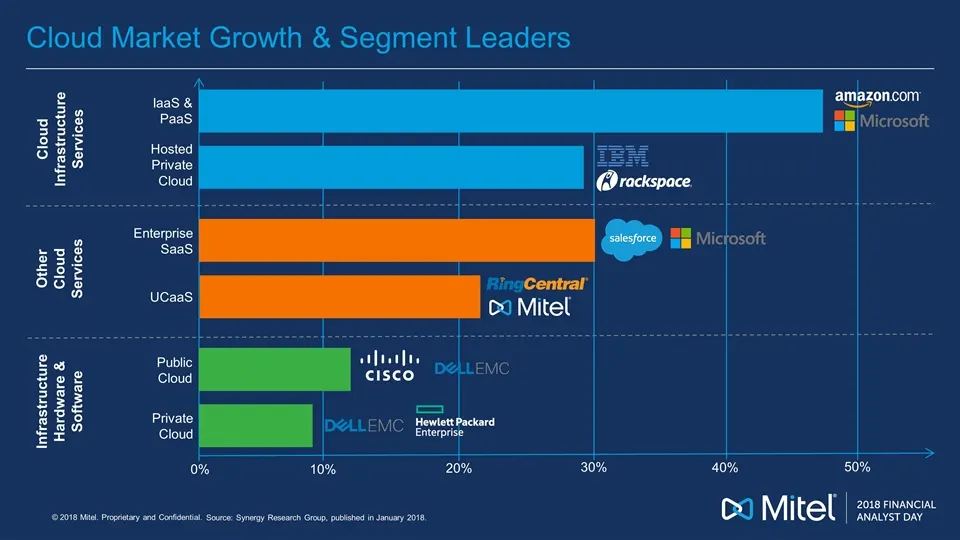
Cloud Market Growth & Segment Leaders Cloud Infrastructure Services Other Cloud Services Infrastructure Hardware & Software IaaS & PaaS Hosted Private Cloud Enterprise SaaS UCaaS Public Cloud Private Cloud 0% 10% 20% 30% 40% 50% Source: Synergy Research Group, published in January 2018.
Slide 42: Mitel Ranks 2nd in UCaaS Subscribers
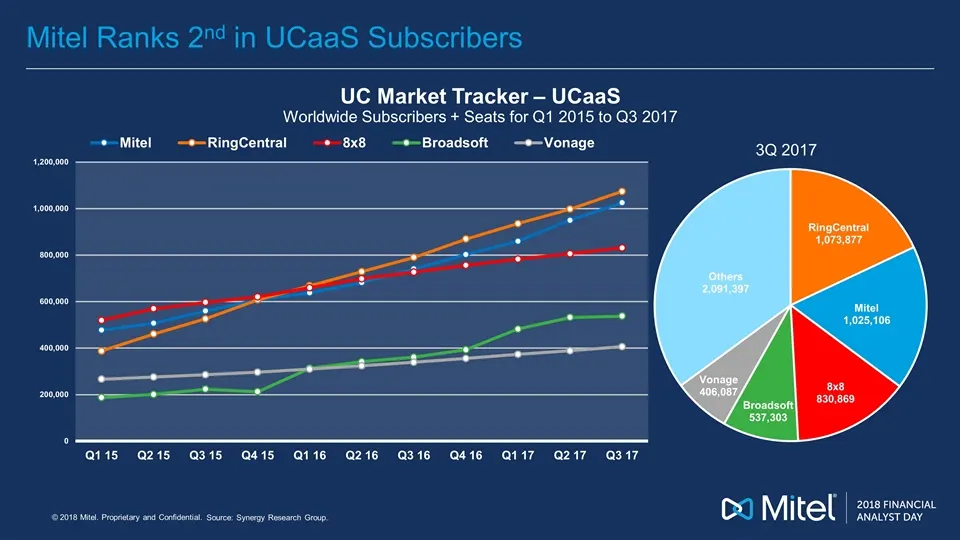
Mitel Ranks 2nd in UCaaS Subscribers UC Market Tracker – UCaaS Worldwide Subscribers + Seats for Q1 2015 to Q3 2017 3Q 2017 Source: Synergy Research Group.
Slide 43: Leadership Recognition
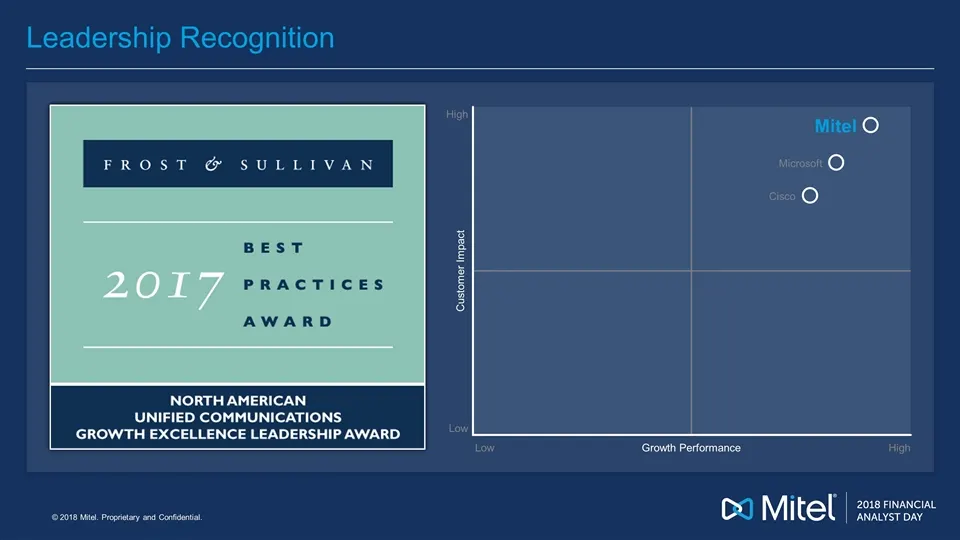
Leadership Recognition Customer Impact High Low High Low Growth Performance Cisco Microsoft Mitel
Slide 44: Mitel PBX/IP PBX Licenses Share
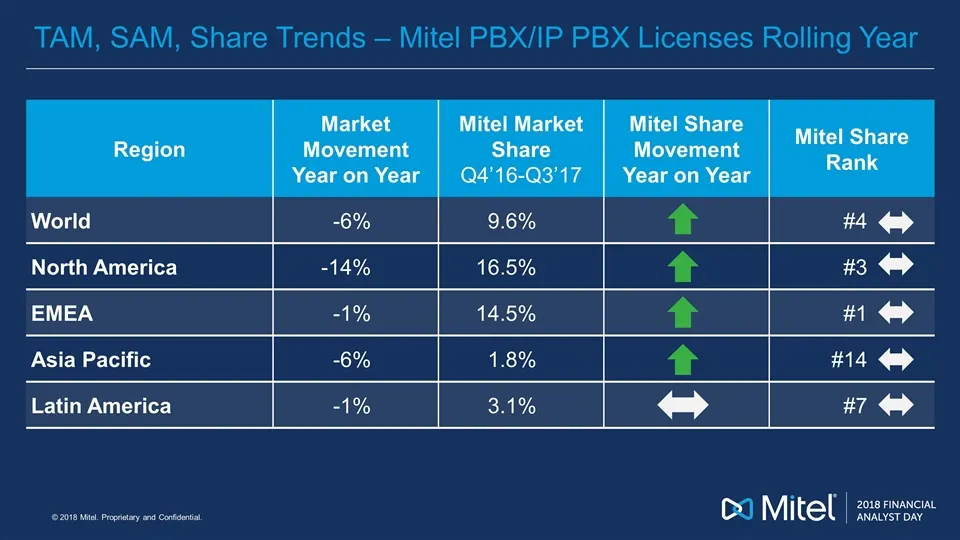
TAM, SAM, Share Trends – Mitel PBX/IP PBX Licenses Rolling Year Region Market Movement Year on Year Mitel Market Share Q4’16-Q3’17 Mitel Share Movement Year on Year Mitel Share Rank World -6% 9.6% #4 North America -14% 16.5% #3 EMEA -1% 14.5% #1 Asia Pacific -6% 1.8% #14 Latin America -1% 3.1% #7
Slide 45: Gartner Magic Quadrants for 2017
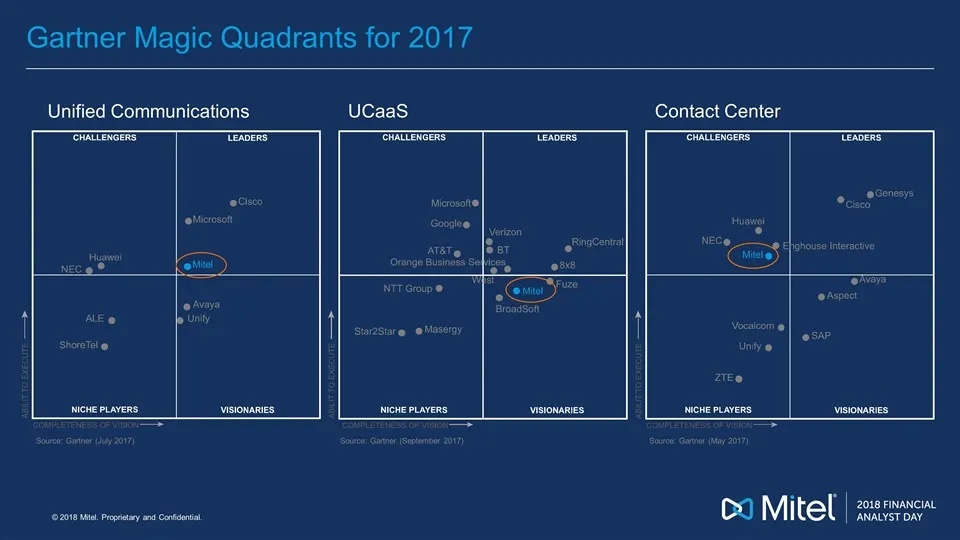
Gartner Magic Quadrants for 2017 Contact Center Source: Gartner (May 2017) UCaaS Source: Gartner (September 2017) Unified Communications Source: Gartner (July 2017)

Slide 46: How We Compete
How We Compete Cd Mitel | zee"
Slide 47: Competitor Attack Strategies
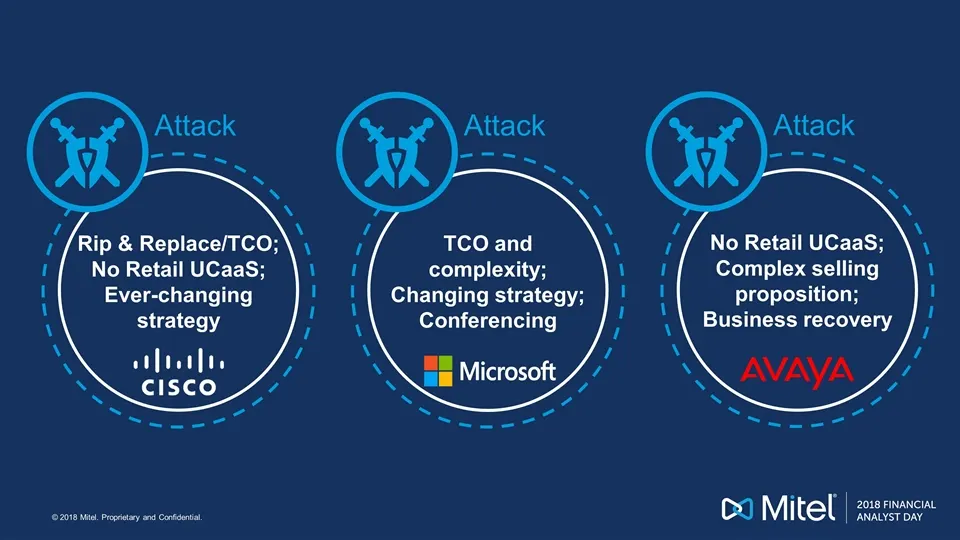
Attack Rip & Replace/TCO; No Retail UCaaS; Ever-changing strategy Attack No Retail UCaaS; Complex selling proposition; Business recovery Attack TCO and complexity; Changing strategy; Conferencing
Slide 48: Competitor Attack Strategies
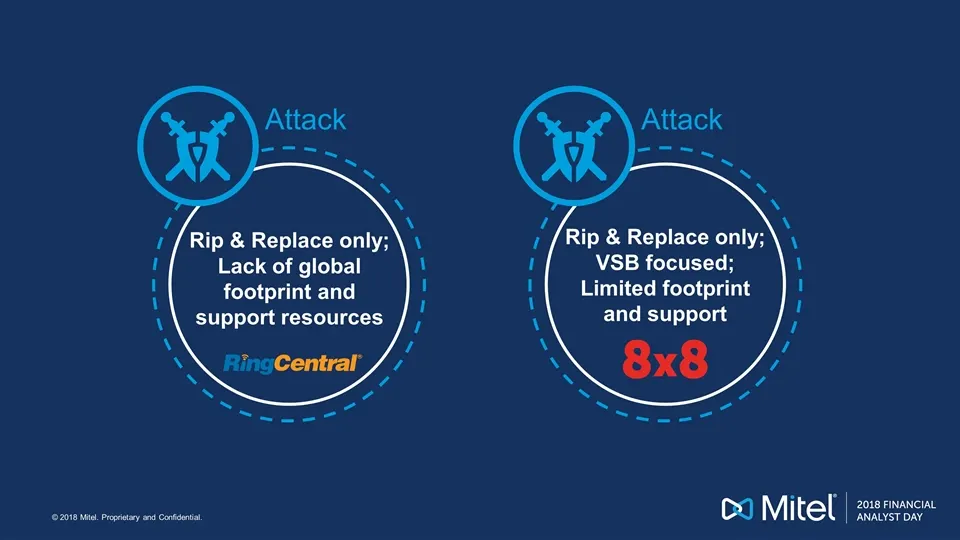
Attack Rip & Replace only; Lack of global footprint and support resources Attack Rip & Replace only; VSB focused; Limited footprint and support
Slide 49: Summary
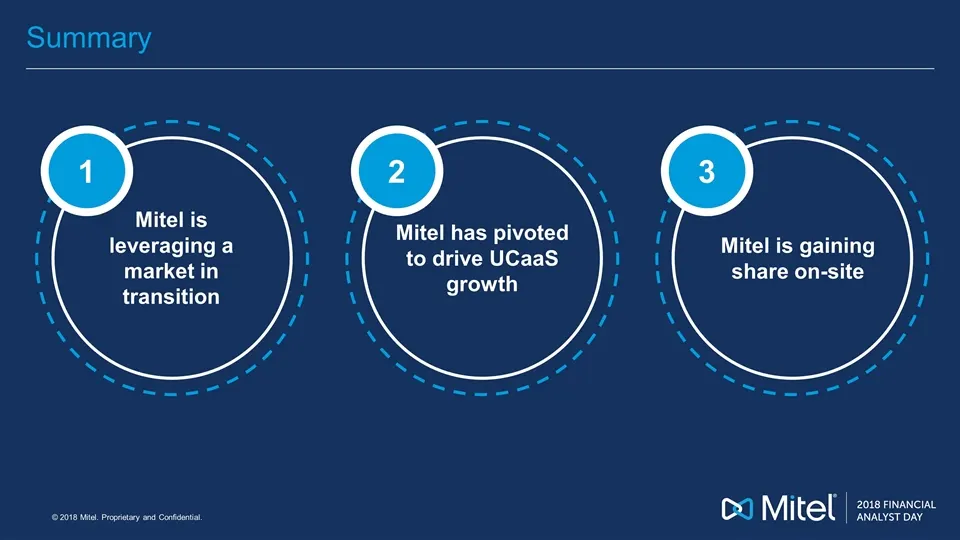
Summary 1 2 3 Mitel is leveraging a market in transition Mitel is gaining share on-site Mitel has pivoted to drive UCaaS growth

Slide 50: 2018 Financial Analyst Day
2018 FINANCIAL ANALYST DAY Co Mitel
Slide 51: Products and Solutions
Products and Solutions Bob Agnes EVP, Mitel Products and Solutions
Slide 52: Agenda
Agenda Technology and market Portfolio Innovation through CloudLink
Slide 53: Every customer will move to some kind of Cloud
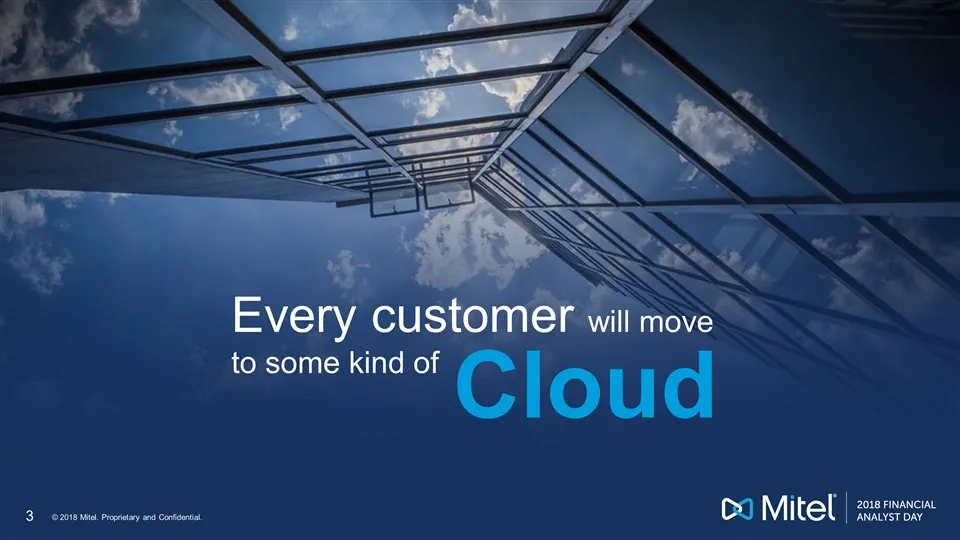
Every customer will move to some kind of Cloud
Slide 54: Mitel's strategy is to make everything Cloud-Capable
Mitel’s strategy is to make everything Cloud-Capable
Slide 55: Private, Public, Hybrid Cloud
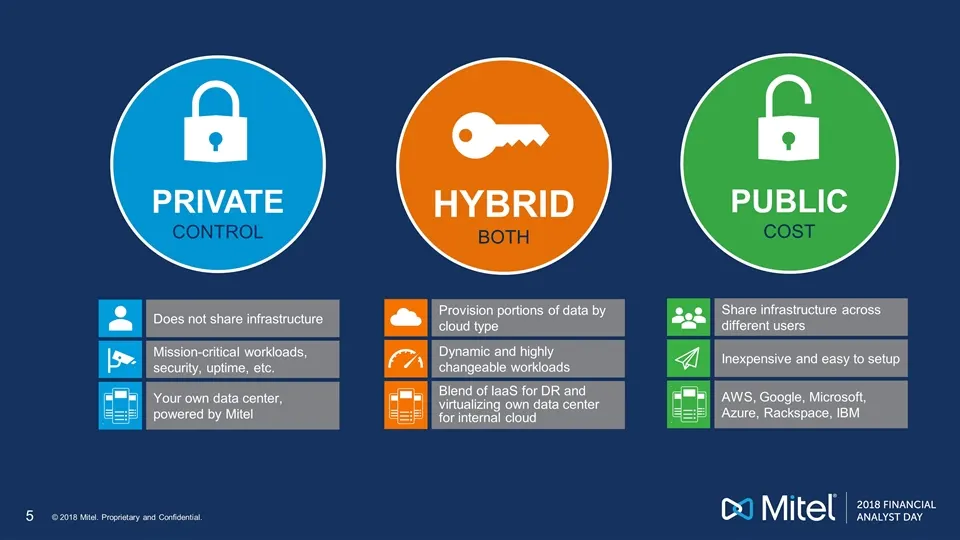
PRIVATE CONTROL HYBRID BOTH Does not share infrastructure Mission-critical workloads, security, uptime, etc. Your own data center, powered by Mitel Provision portions of data by cloud type Dynamic and highly changeable workloads Blend of IaaS for DR and virtualizing own data center for internal clou
Slide 56: Multi-Tenant vs Multi-Instance
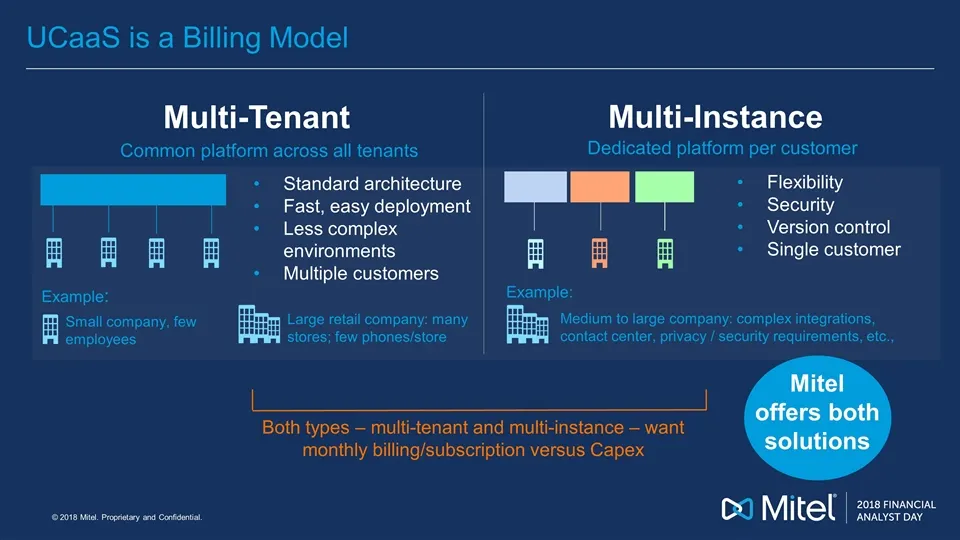
Standard architecture Fast, easy deployment Less complex environments Multiple customers Multi-Tenant Flexibility Security Version control Single customer Multi-Instance UCaaS is a Billing Model Common platform across all tenants Dedicated platform per customer Example: Small company, few employees
Slide 57: Customer Segmentation
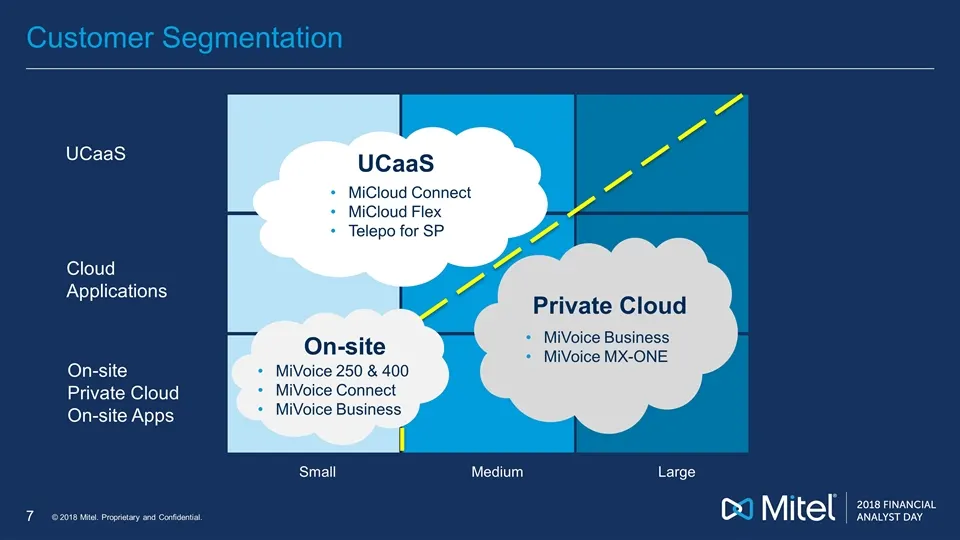
Customer Segmentation Small Medium Large On-site Private Cloud On-site Apps UCaaS Cloud Applications On-site MiVoice 250 & 400 MiVoice Connect MiVoice Business Private Cloud MiVoice Business MiVoice MX-ONE UCaaS MiCloud Connect MiCloud Flex Telepo for SP
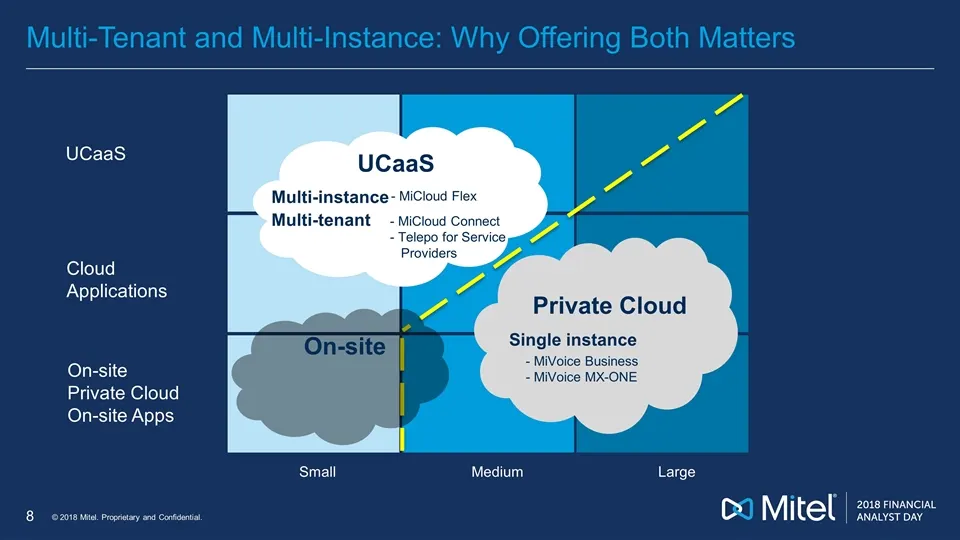
Slide 58: Multi-Tenant and Multi-Instance: Why Offering Both Matters
Multi-Tenant and Multi-Instance: Why Offering Both Matters Small Medium Large On-site Private Cloud On-site Apps UCaaS Cloud Applications On-site UCaaS - MiCloud Flex Multi-instance Multi-tenant - MiCloud Connect - Telepo for Service Providers Private Cloud Single instance - MiVoice Business - MiVoi
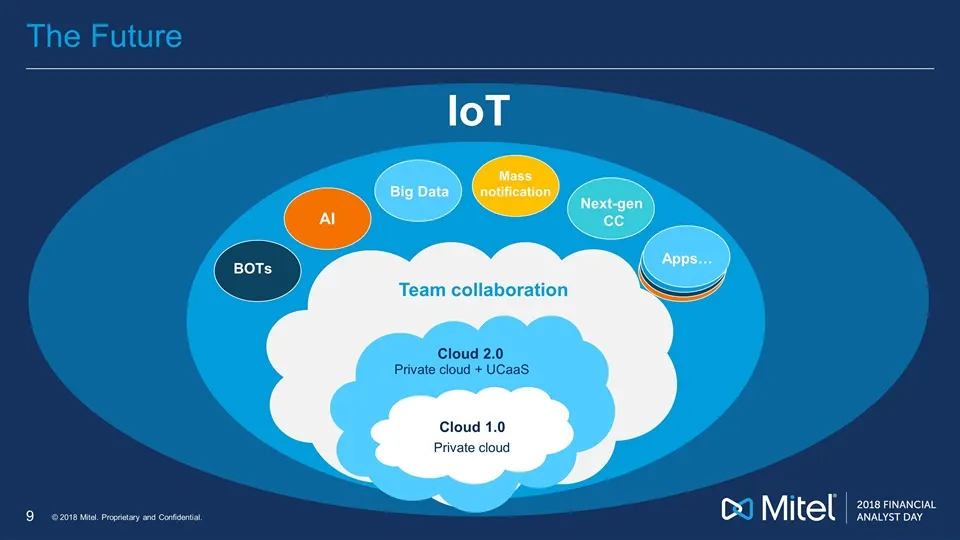
Slide 59: Cloud 1.0 to Cloud 2.0
IoT BOTs AI Big Data Mass notification Next-gen CC Apps… Team collaboration The Future Cloud 2.0 Private cloud + UCaaS Cloud 1.0 Private cloud
Slide 60: Industry-Leading Portfolio
Industry-Leading Portfolio
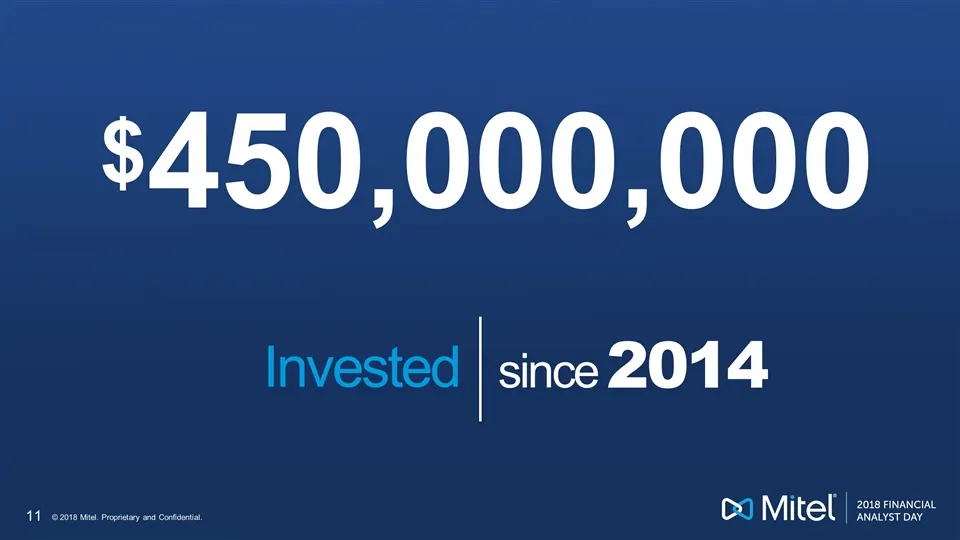
Slide 61: $450M Invested Since 2014
2014 $450,000,000 since Invested
Slide 62: Delivering Seamless Cloud Solutions
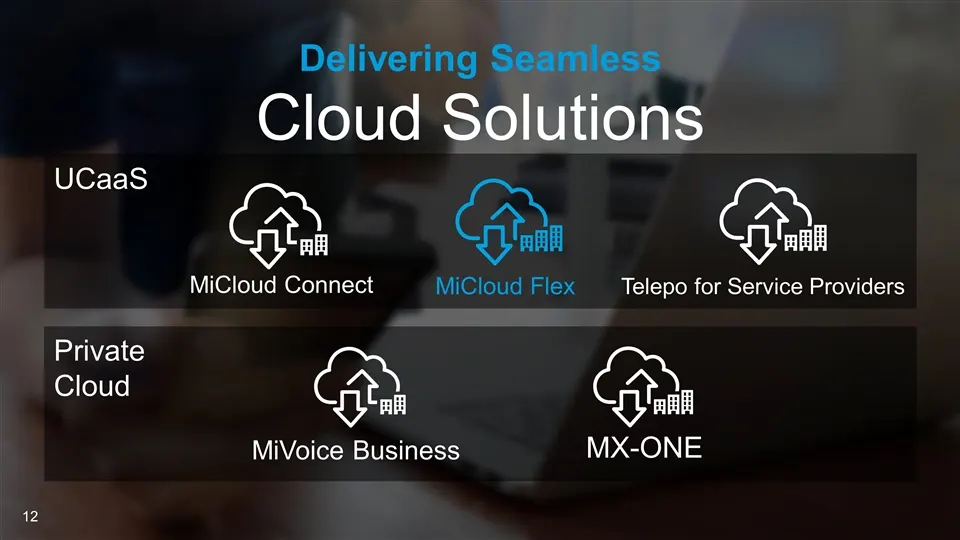
Delivering Seamless Cloud Solutions MiCloud Connect MiCloud Flex Telepo for Service Providers UCaaS Private Cloud MiVoice Business MX-ONE

Slide 63: Delivering Seamless On-Site Solutions
MiVoice Connect MiVoice Business MiVoice 250 & 400 Delivering Seamless On-Site Solutions MX-ONE
Slide 64: Delivering Seamless Contact Center Solutions
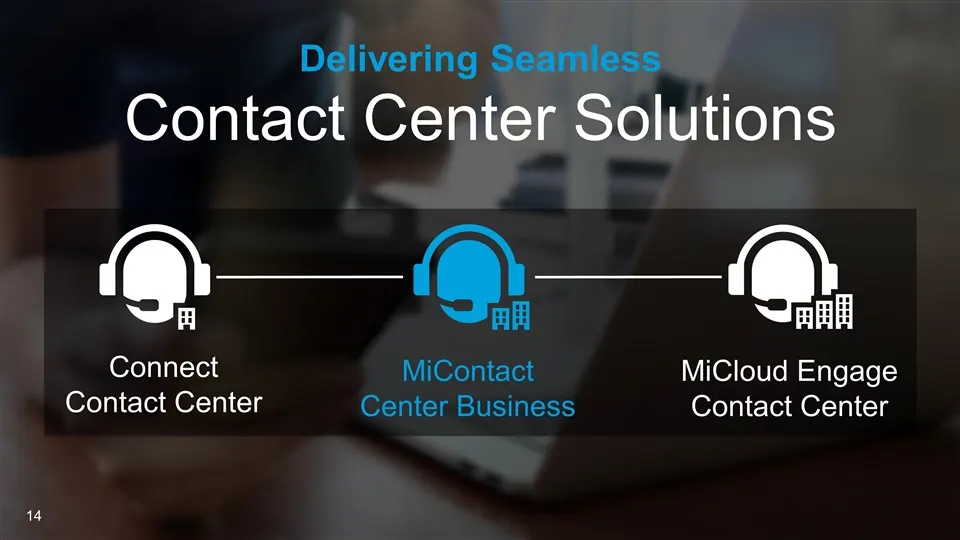
MiContact Center Business MiCloud Engage Contact Center Connect Contact Center Delivering Seamless Contact Center Solutions
Slide 65: Market-Leading 2017 Collaboration Launches
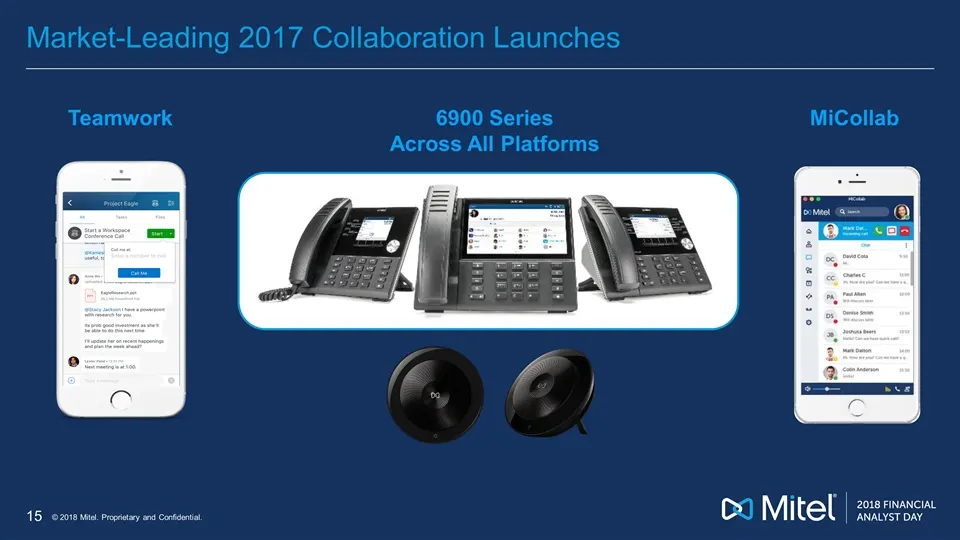
MiCollab 6900 Series Across All Platforms Teamwork Market-Leading 2017 Collaboration Launches
Slide 66: How we take everyone to the Cloud
How we take everyone to the Cloud Mitel INNOVATION
Slide 67: Cloud-Enable Everything We Sell
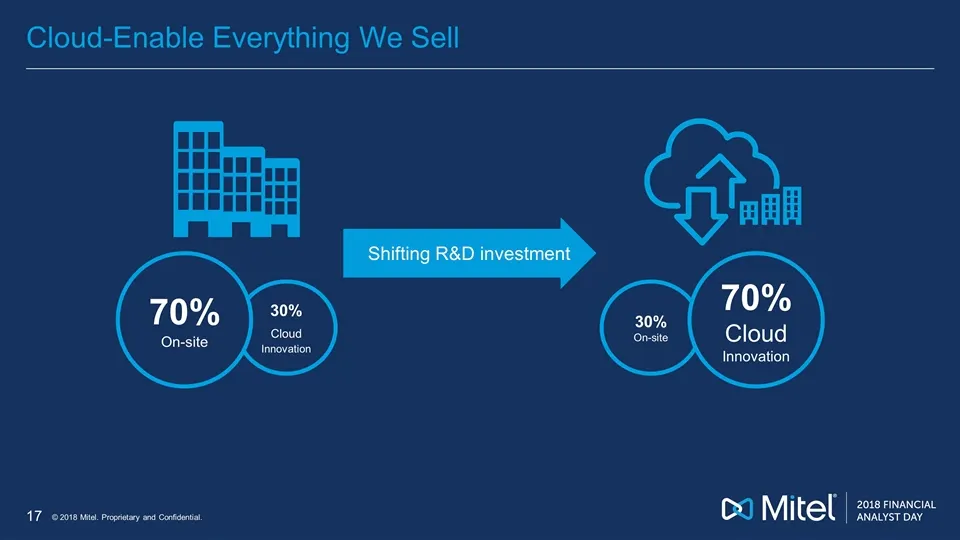
Cloud-Enable Everything We Sell 30% Cloud Innovation 70% On-site 30% On-site 70% Cloud Innovation Shifting R&D investment
Slide 68: Take Everyone to the Cloud
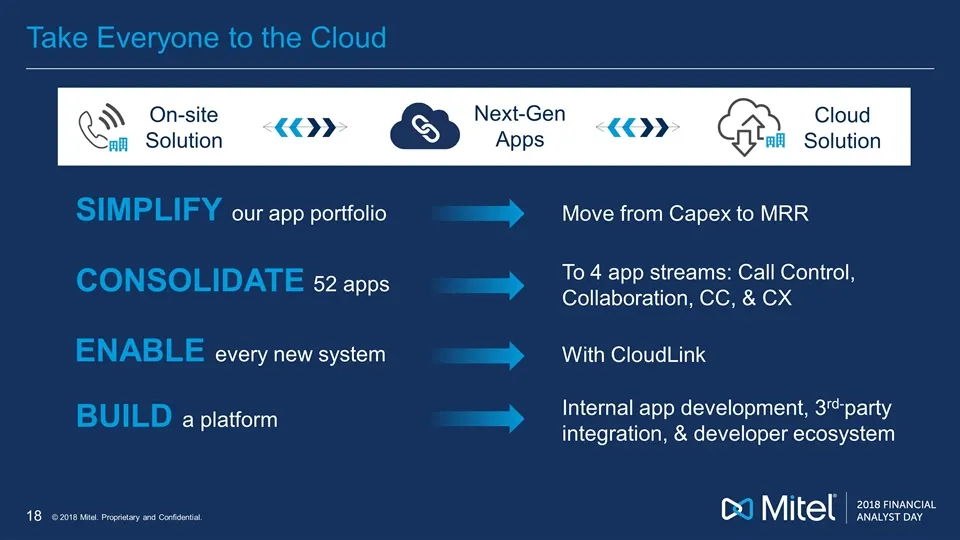
On-site Solution Cloud Solution Next-Gen Apps Take Everyone to the Cloud SIMPLIFY our app portfolio CONSOLIDATE 52 apps BUILD a platform ENABLE every new system To 4 app streams: Call Control, Collaboration, CC, & CX Move from Capex to MRR Internal app development, 3rd-party integration, & developer
Slide 69: Technology Partners
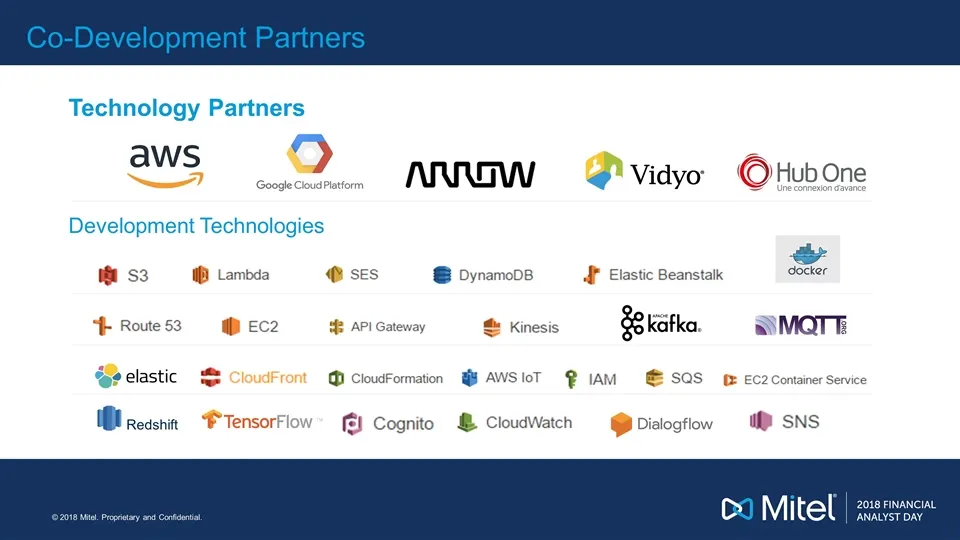
Technology Partners Development Technologies Redshift Co-Development Partners
Slide 70: Partners Developing On Our Platforms
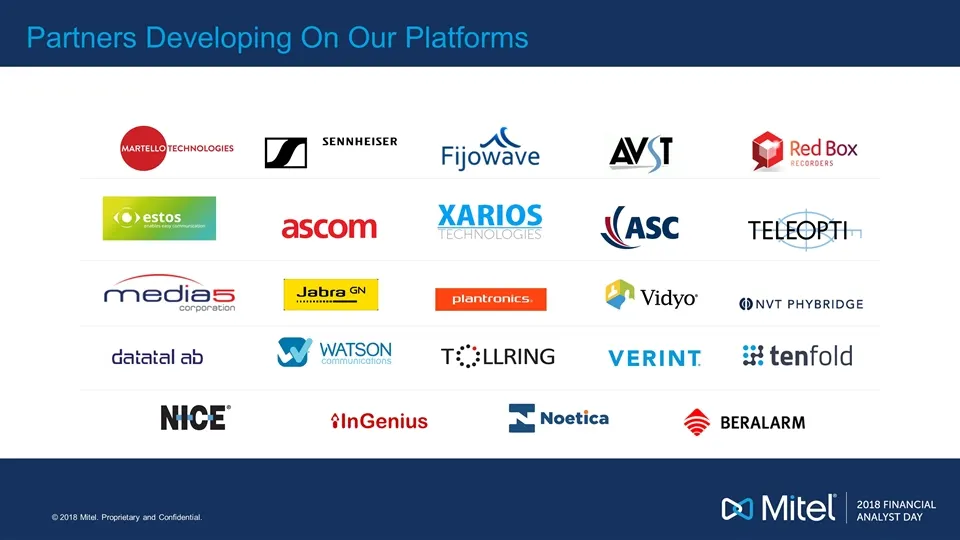
Partners Developing On Our Platforms
Slide 71: Mitel CloudLink Enabling Speed and Efficiency
Mitel CloudLink Enabling Speed and Efficiency
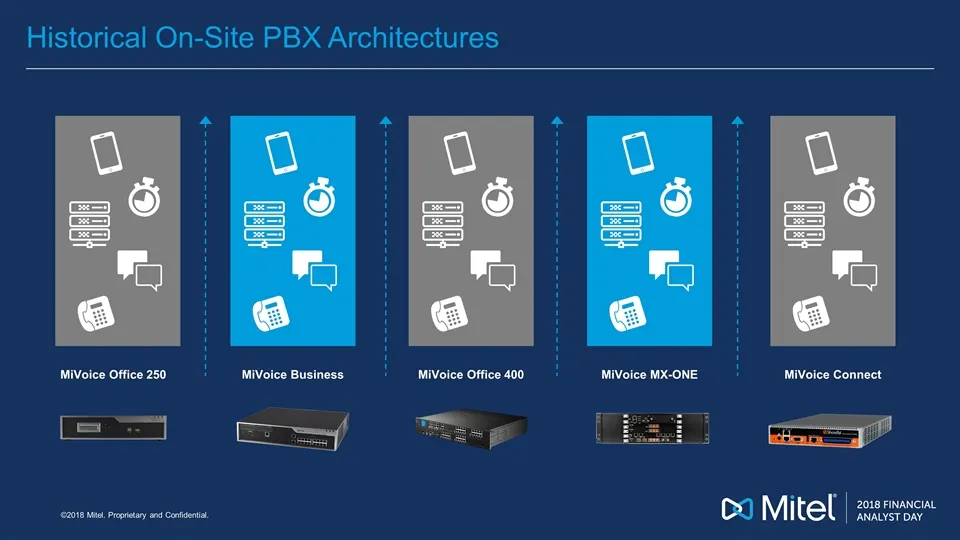
Slide 72: Historical On-Site PBX Architectures
Historical On-Site PBX Architectures MiVoice Office 250 MiVoice Business MiVoice Office 400 MiVoice MX-ONE MiVoice Connect
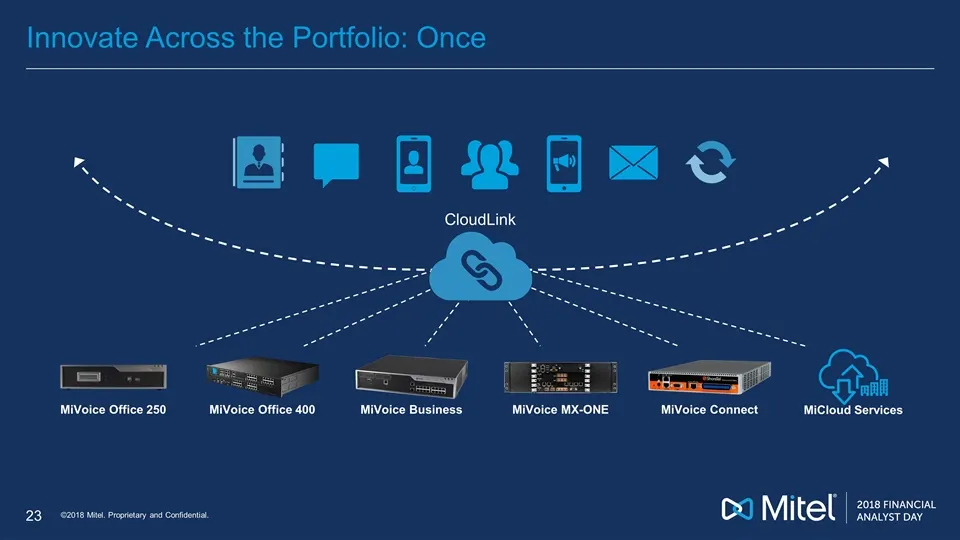
Slide 73: Innovate Across the Portfolio: Once
Innovate Across the Portfolio: Once CloudLink MiVoice Office 250 MiVoice Business MiVoice Office 400 MiVoice Connect MiVoice MX-ONE MiCloud Services
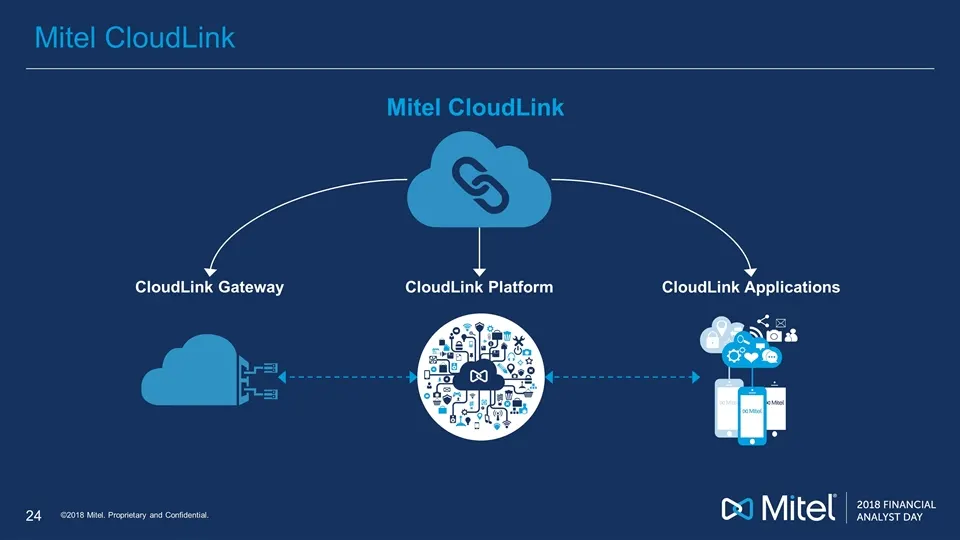
Slide 74: Mitel CloudLink
Mitel CloudLink Mitel CloudLink CloudLink Platform CloudLink Gateway CloudLink Applications
Slide 75: CloudLink Connects the Base to the Future
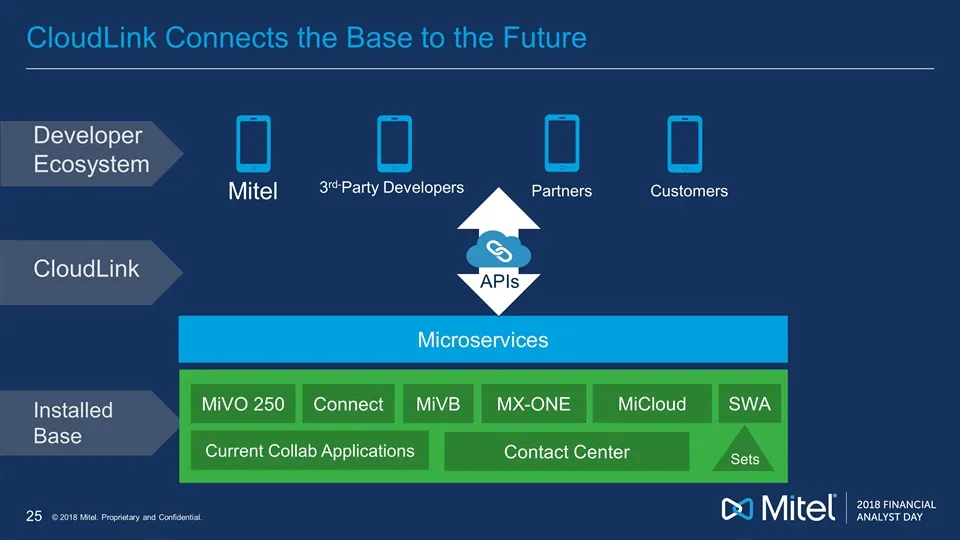
CloudLink Connects the Base to the Future Microservices MiVB MX-ONE MiVO 250 Connect Current Collab Applications Contact Center Sets MiCloud SWA Developer Ecosystem CloudLink Installed Base Mitel 3rd-Party Developers Partners Customers APIs
Slide 76: Mitel OfficeLink
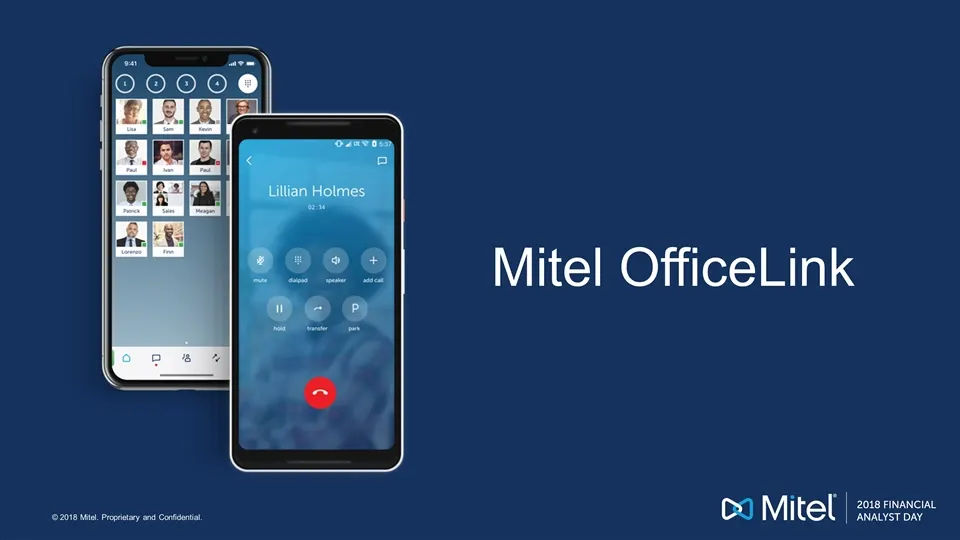
(©2018 Mtl. Prony ad Conkdont Mitel OfficeLink Cd Mitel |
Slide 77: Summary
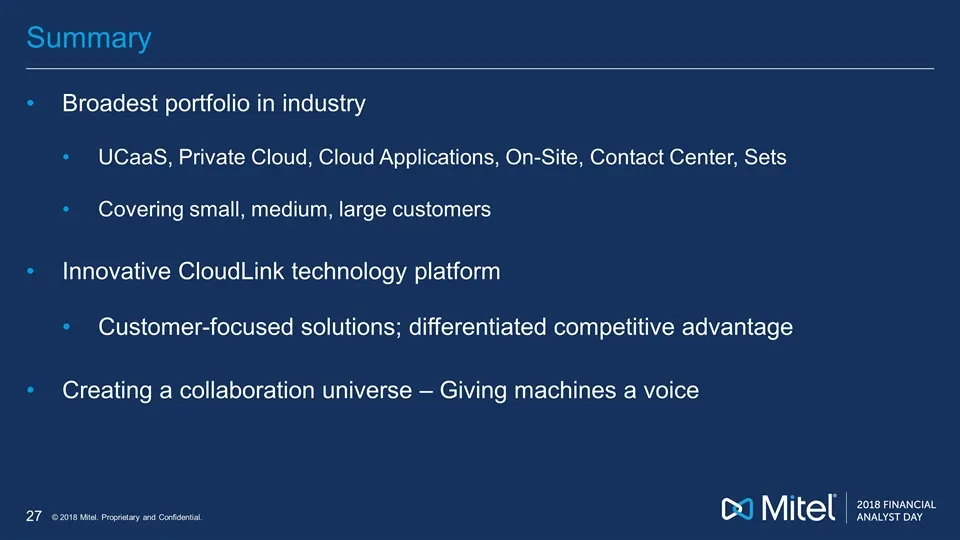
Summary Broadest portfolio in industry UCaaS, Private Cloud, Cloud Applications, On-Site, Contact Center, Sets Covering small, medium, large customers Innovative CloudLink technology platform Customer-focused solutions; differentiated competitive advantage Creating a collaboration universe – Giving

Slide 78: 2018 Financial Analyst Day
2018 FINANCIAL ANALYST DAY Co Mitel

Slide 79: Sales Go-to-Market
Sales Go-to-Market Todd Abbott EVP, Global Sales and Services
Slide 80: 2018 – Year of Transformation
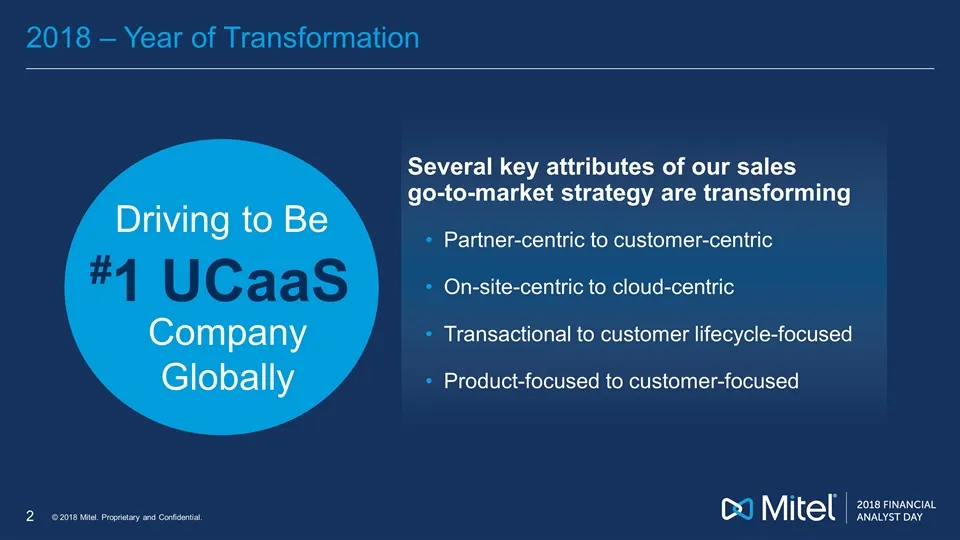
2018 – Year of Transformation Several key attributes of our sales go-to-market strategy are transforming Partner-centric to customer-centric On-site-centric to cloud-centric Transactional to customer lifecycle-focused Product-focused to customer-focused Company Globally Driving to Be #1 UCaaS
Slide 81: Evolution of Mitel Sales Coverage Strategy
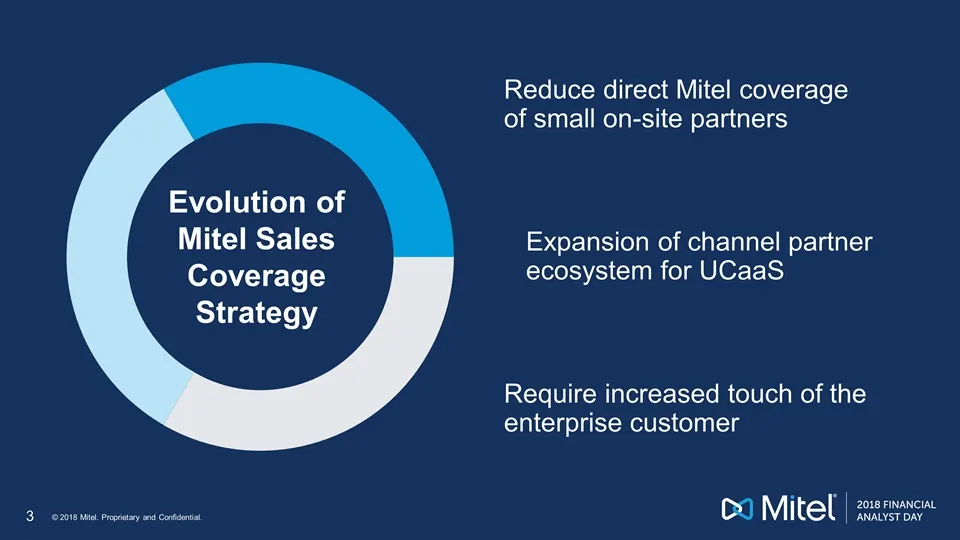
Expansion of channel partner ecosystem for UCaaS Require increased touch of the enterprise customer Reduce direct Mitel coverage of small on-site partners Evolution of Mitel Sales Coverage Strategy
Slide 82: Transforming Sales Go-To-Market
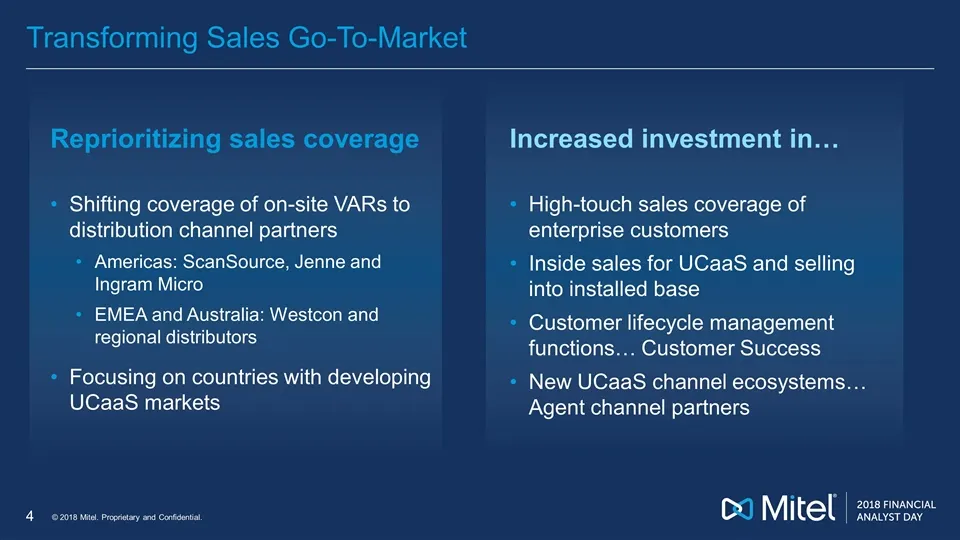
Transforming Sales Go-To-Market High-touch sales coverage of enterprise customers Inside sales for UCaaS and selling into installed base Customer lifecycle management functions… Customer Success New UCaaS channel ecosystems… Agent channel partners Shifting coverage of on-site VARs to distribution ch
Slide 83: 2017 On-Site Channel Revenue Mix
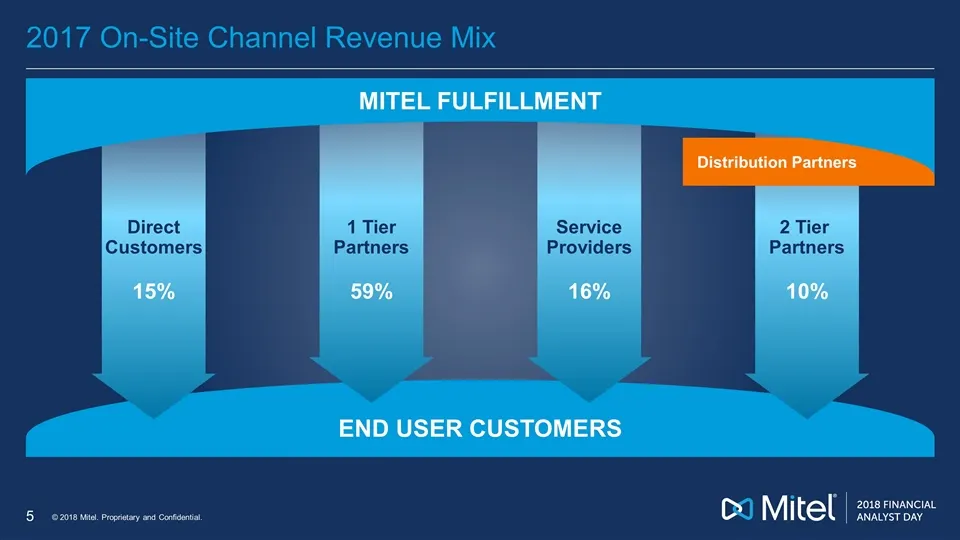
15% Direct Customers 10% 2 Tier Partners 1 Tier Partners 59% Service Providers 16% 2017 On-Site Channel Revenue Mix END USER CUSTOMERS Distribution Partners MITEL FULFILLMENT
Slide 84: Global Channel Partner Program
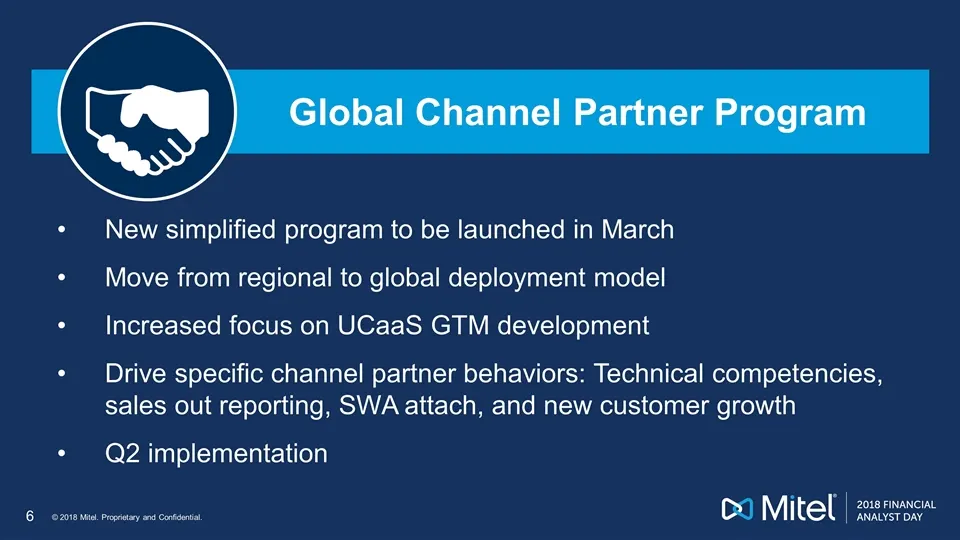
Global Channel Partner Program March Announce – April Implementation New simplified program to be launched in March Move from regional to global deployment model Increased focus on UCaaS GTM development Drive specific channel partner behaviors: Technical competencies, sales out reporting, SWA attach
Slide 85: 2018 On-Site Channel Revenue Mix
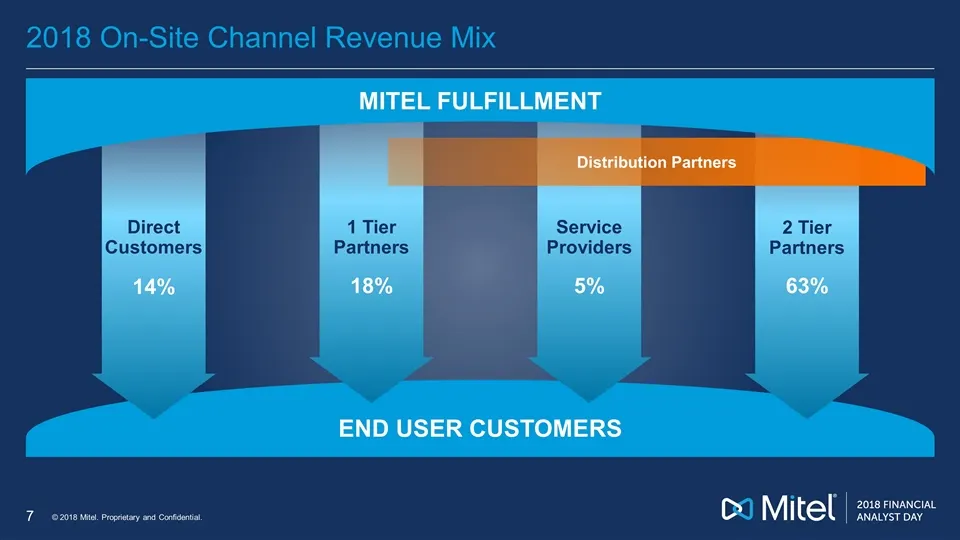
14% Direct Customers 63% 2 Tier Partners 1 Tier Partners 18% Service Providers 5% 2018 On-Site Channel Revenue Mix END USER CUSTOMERS Distribution Partners MITEL FULFILLMENT
Slide 86: Evolution of UC Cloud Markets
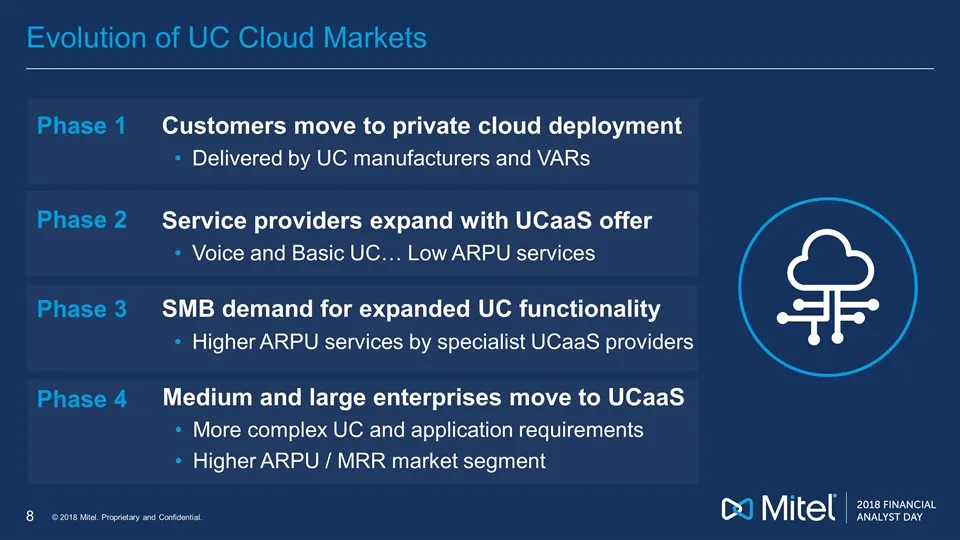
Evolution of UC Cloud Markets Phase 1 Customers move to private cloud deployment Delivered by UC manufacturers and VARs Phase 2 Service providers expand with UCaaS offer Voice and Basic UC… Low ARPU services Phase 3 SMB demand for expanded UC functionality Higher ARPU services by specialist UCaaS pr
Slide 87: Continue to drive private cloud penetration
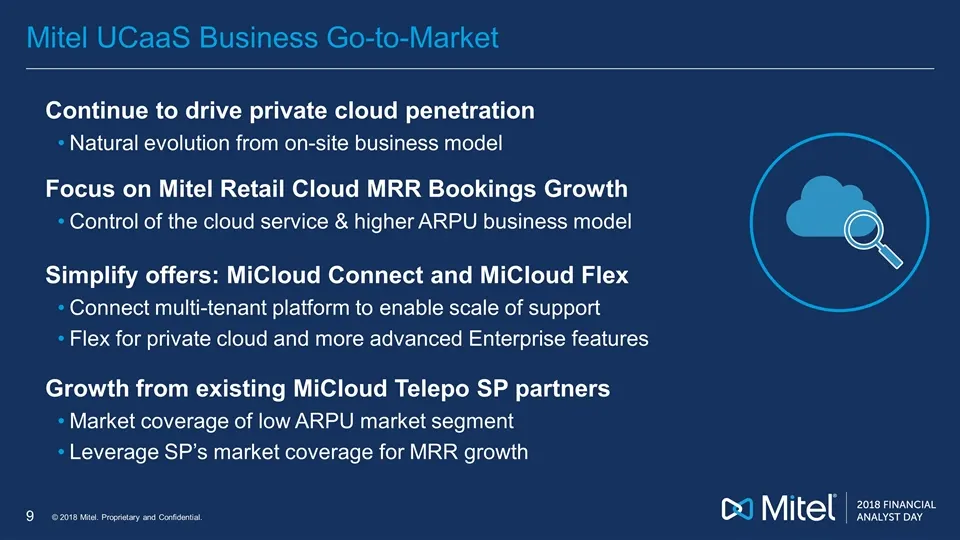
Continue to drive private cloud penetration Natural evolution from on-site business model Focus on Mitel Retail Cloud MRR Bookings Growth Control of the cloud service & higher ARPU business model Simplify offers: MiCloud Connect and MiCloud Flex Connect multi-tenant platform to enable scale of suppo
Slide 88: Cloud – Focus on Driving MRR
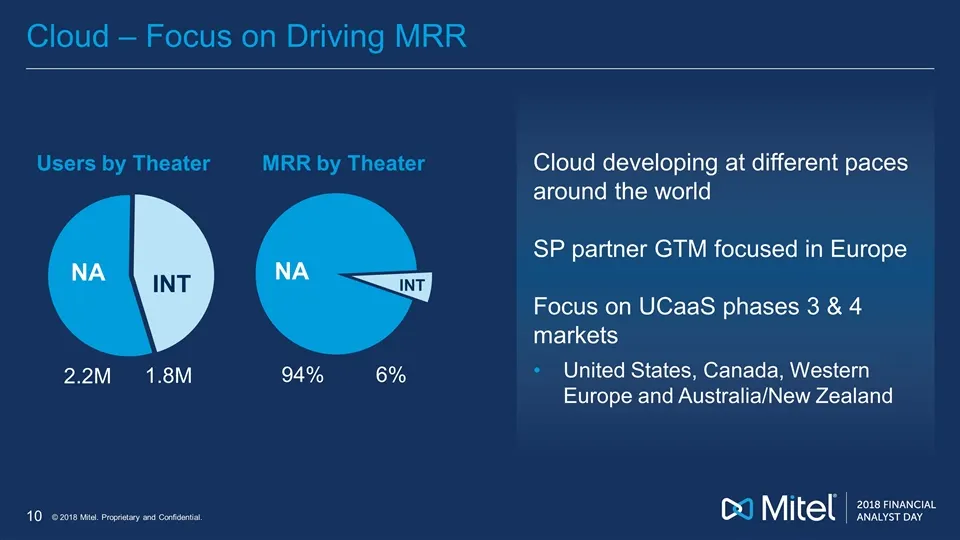
Cloud – Focus on Driving MRR MRR by Theater Users by Theater INT NA 1.8M 2.2M NA 94% 6% Cloud developing at different paces around the world SP partner GTM focused in Europe Focus on UCaaS phases 3 & 4 markets United States, Canada, Western Europe and Australia/New Zealand INT
Slide 89: Sales Team Evolution: On-Site to Cloud Focused
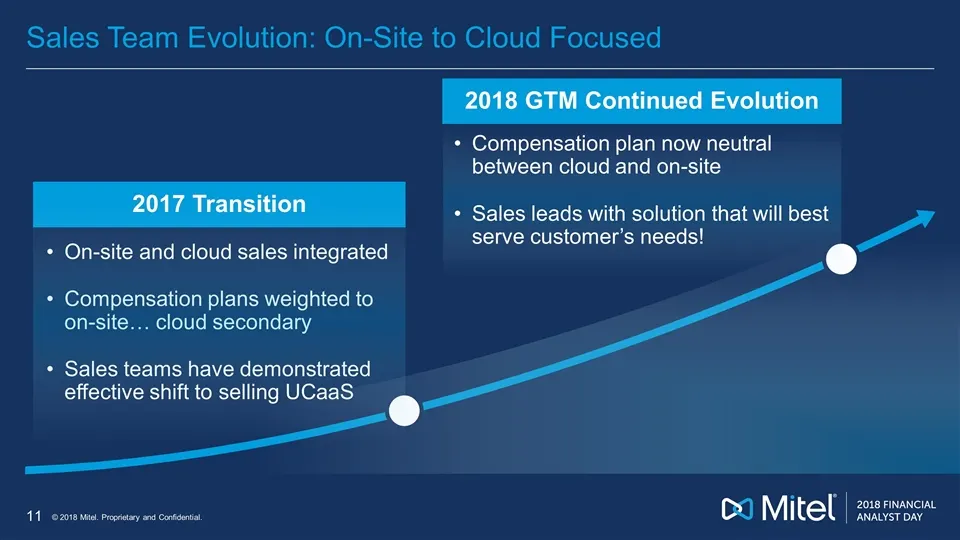
Sales Team Evolution: On-Site to Cloud Focused 2018 GTM Continued Evolution On-site and cloud sales integrated Compensation plans weighted to on-site… cloud secondary Sales teams have demonstrated effective shift to selling UCaaS 2017 Transition Compensation plan now neutral between cloud and on-sit
Slide 90: Million Global Users
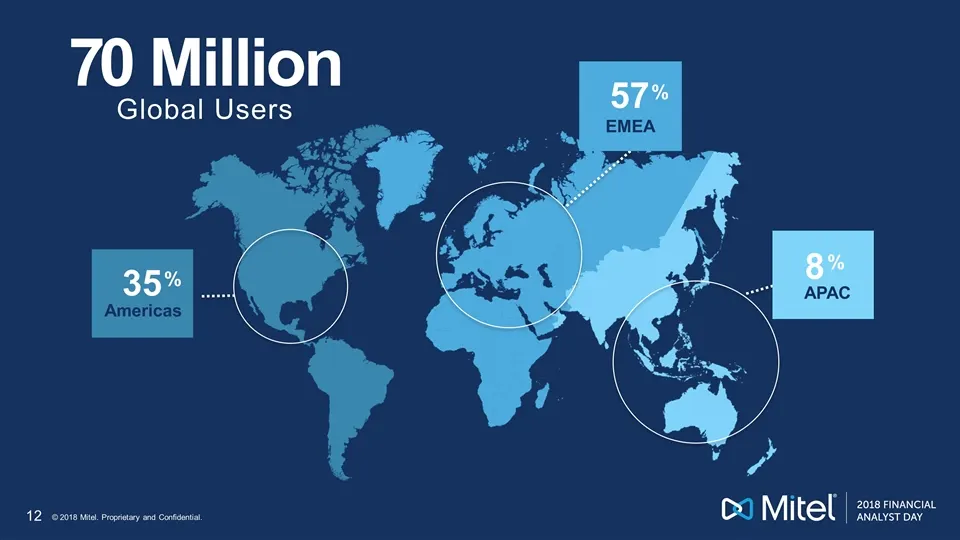
70 Million Global Users Americas 35 % APAC 8 % EMEA 57 %
Slide 91: Leverage of Installed Base
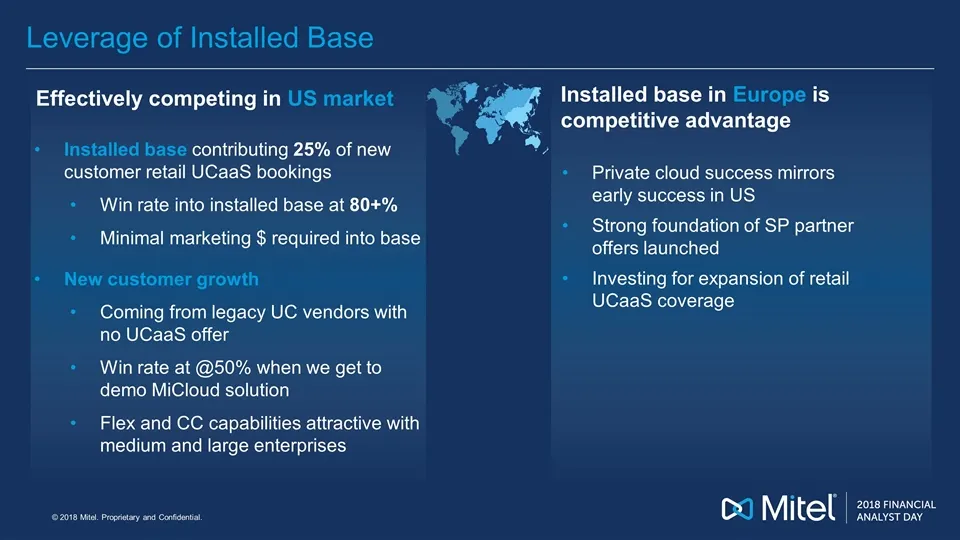
Leverage of Installed Base Private cloud success mirrors early success in US Strong foundation of SP partner offers launched Investing for expansion of retail UCaaS coverage Effectively competing in US market Installed base in Europe is competitive advantage Installed base contributing 25% of new cu
Slide 92: On-Site Competitors Exposed Without UCaaS Offers
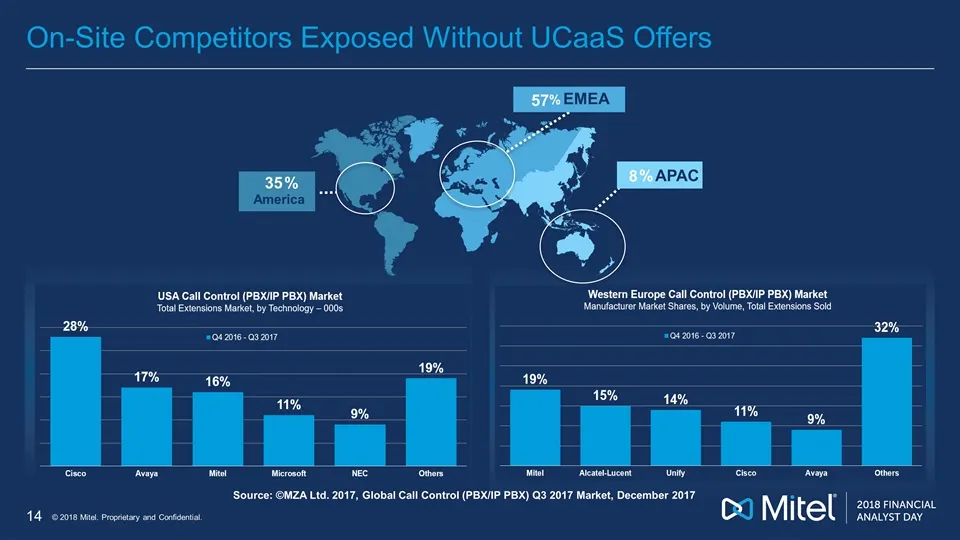
On-Site Competitors Exposed Without UCaaS Offers Americas 35 % APAC 8 % EMEA 57 % Source: ©MZA Ltd. 2017, Global Call Control (PBX/IP PBX) Q3 2017 Market, December 2017
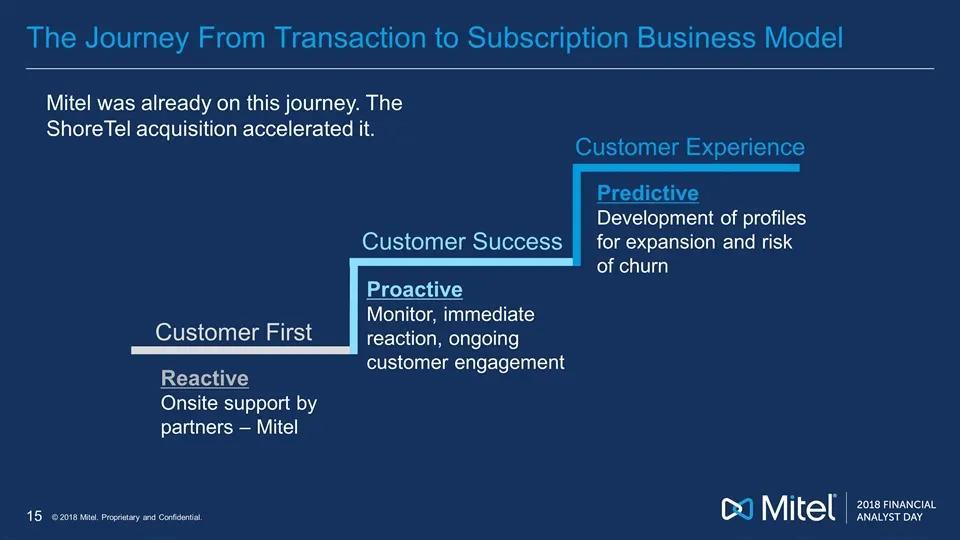
Slide 93: The Journey From Transaction to Subscription Business Model
The Journey From Transaction to Subscription Business Model Customer First Customer Success Customer Experience Reactive Onsite support by partners – Mitel Proactive Monitor, immediate reaction, ongoing customer engagement Predictive Development of profiles for expansion and risk of churn Mitel was
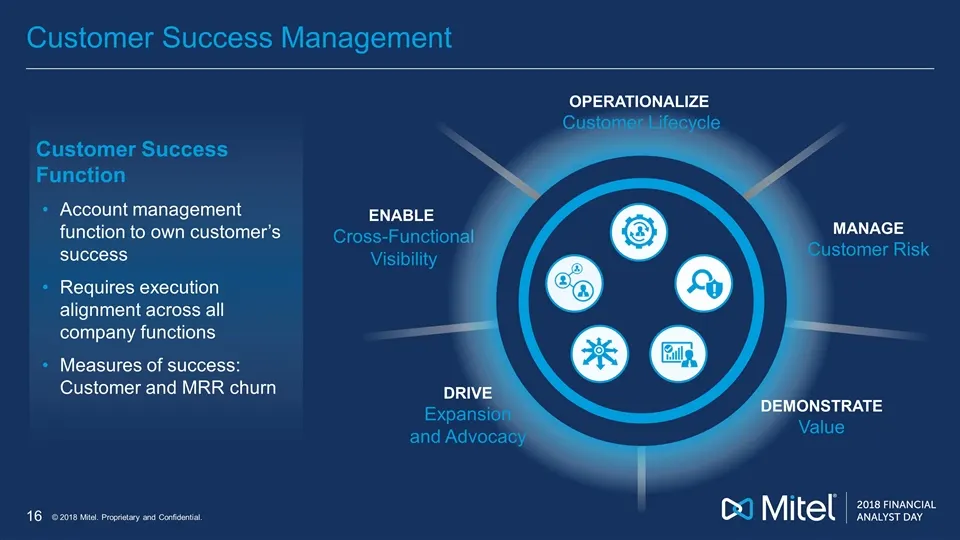
Slide 94: Customer Success Management
Customer Success Management ENABLE Cross-Functional Visibility OPERATIONALIZE Customer Lifecycle MANAGE Customer Risk DEMONSTRATE Value DRIVE Expansion and Advocacy Customer Success Function Account management function to own customer’s success Requires execution alignment across all company functio
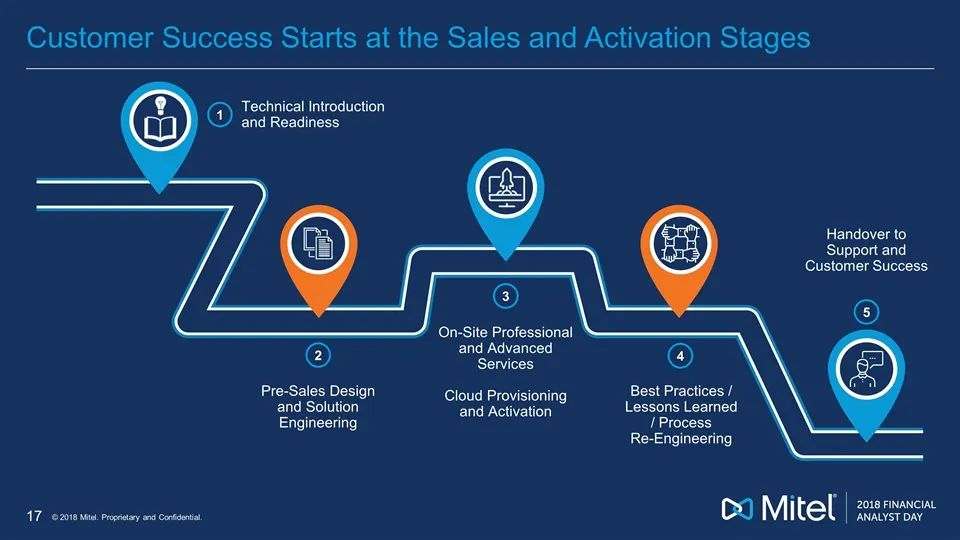
Slide 95: Customer Success Starts at the Sales and Activation Stages
Customer Success Starts at the Sales and Activation Stages Technical Introduction and Readiness Pre-Sales Design and Solution Engineering Handover to Support and Customer Success 1 2 5 Best Practices / Lessons Learned / Process Re-Engineering 4 On-Site Professional and Advanced Services Cloud Provis
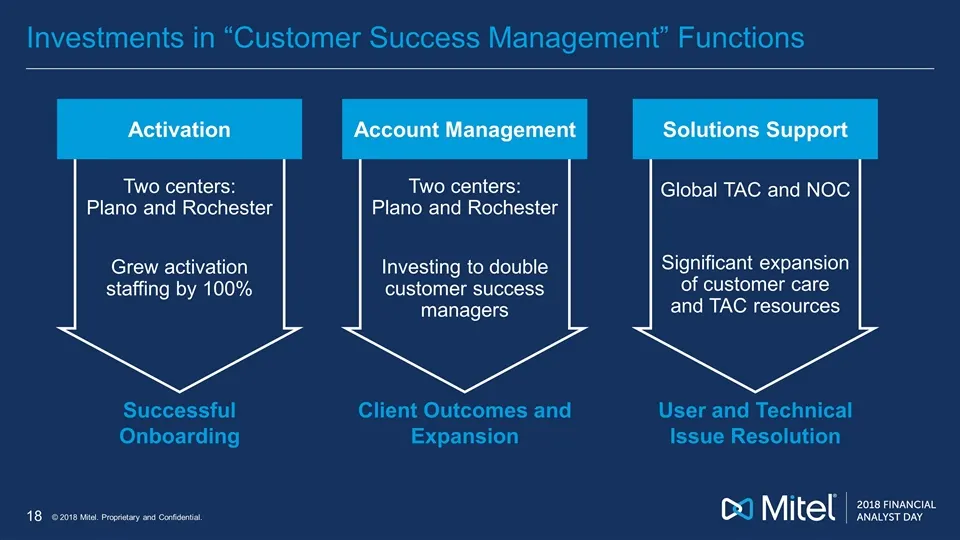
Slide 96: Investments in Customer Success Management Functions
Investments in “Customer Success Management” Functions Two centers: Plano and Rochester Investing to double customer success managers Client Outcomes and Expansion Account Management Activation Two centers: Plano and Rochester Grew activation staffing by 100% Successful Onboarding Global TAC and NOC
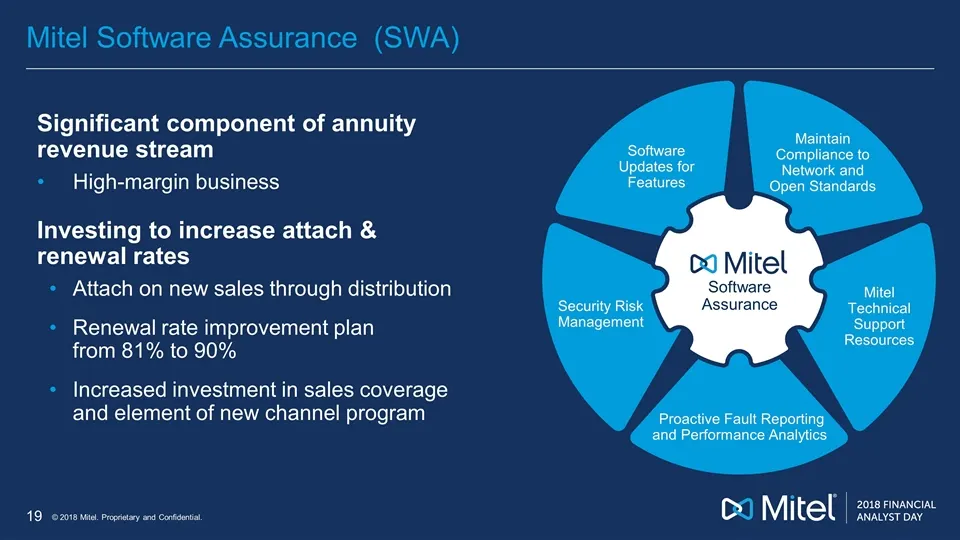
Slide 97: Mitel Software Assurance (SWA)
Mitel Software Assurance (SWA) Software Assurance Proactive Fault Reporting and Performance Analytics Mitel Technical Support Resources Software Updates for Features Maintain Compliance to Network and Open Standards Security Risk Management Significant component of annuity revenue stream High-margin
Slide 98: Closing Thoughts
Closing Thoughts 2017 demonstrated effective sales GTM shift to cloud New senior sales and support leadership in place 2018 Cloud portfolio simplified and positioned for growth Investments in expanded cloud sales coverage Investing in customer success management functions Positioned well for retail

Slide 99: 2018 Financial Analyst Day
2018 FINANCIAL ANALYST DAY Co Mitel
Slide 100: Financial Overview
Financial Overview Steve Spooner Chief Financial Officer
Slide 101: What we want you to take away today
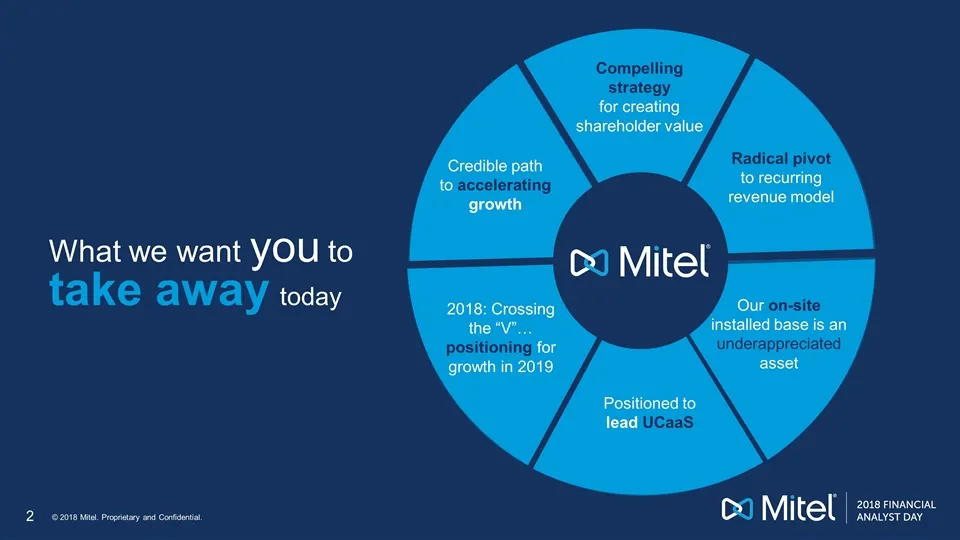
What we want you to take away today Compelling strategy for creating shareholder value Radical pivot to recurring revenue model Our on-site installed base is an underappreciated asset Positioned to lead UCaaS 2018: Crossing the “V”… positioning for growth in 2019 Credible path to accelerating growth
Slide 102: Mitel Offers Solutions Others Cannot
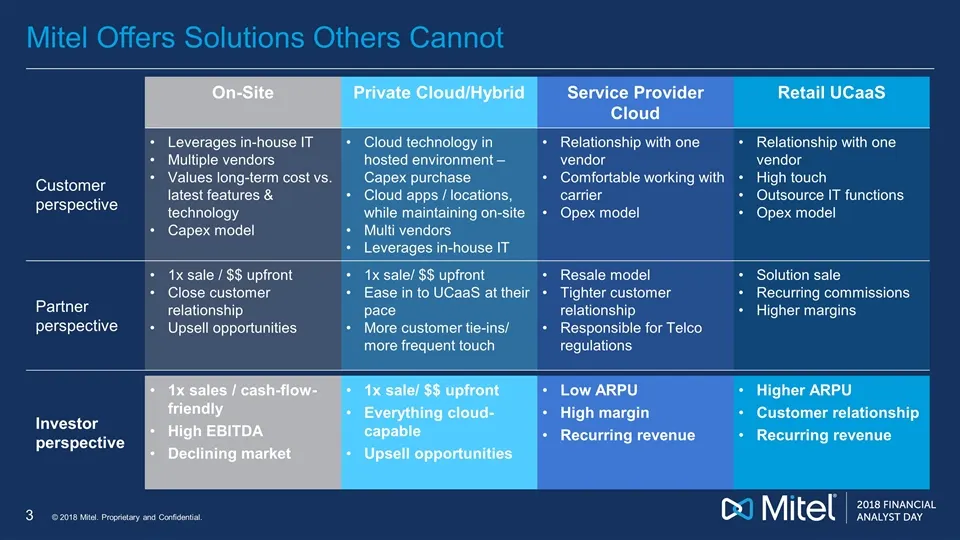
Mitel Offers Solutions Others Cannot On-Site Private Cloud/Hybrid Service Provider Cloud Retail UCaaS Customer perspective Leverages in-house IT Multiple vendors Values long-term cost vs. latest features & technology Capex model Cloud technology in hosted environment – Capex purchase Cloud apps / lo
Slide 103: Growing Retail UCaaS Mix
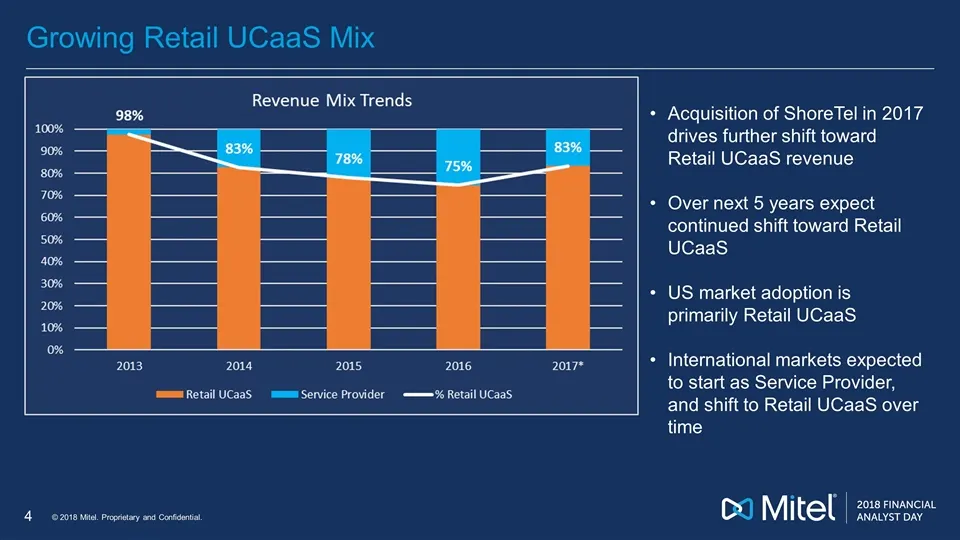
Growing Retail UCaaS Mix Acquisition of ShoreTel in 2017 drives further shift toward Retail UCaaS revenue Over next 5 years expect continued shift toward Retail UCaaS US market adoption is primarily Retail UCaaS International markets expected to start as Service Provider, and shift to Retail UCaaS o
Slide 104: Unit Economics
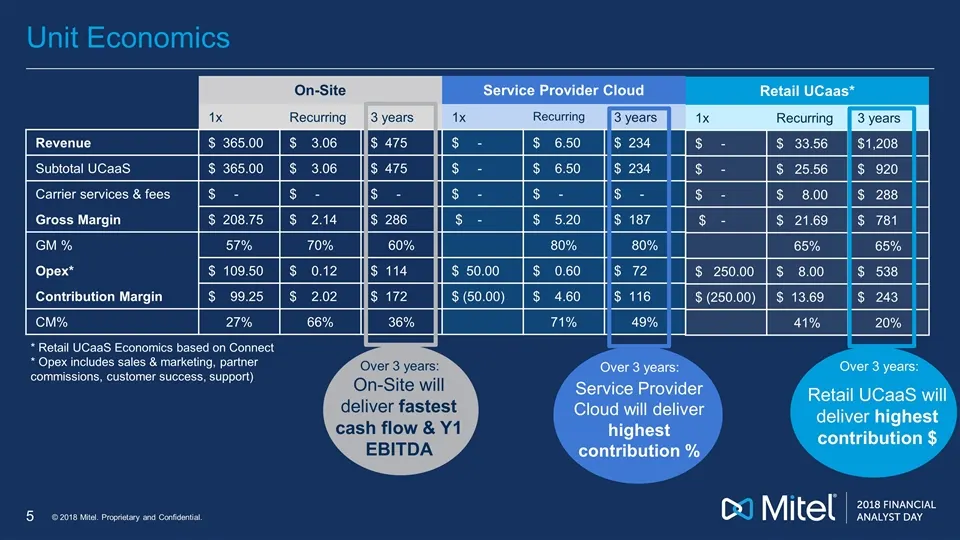
Unit Economics On-Site 1x Recurring 3 years Revenue $ 365.00 $ 3.06 $ 475 Subtotal UCaaS $ 365.00 $ 3.06 $ 475 Carrier services & fees $ - $ - $ - Gross Margin $ 208.75 $ 2.14 $ 286 GM % 57% 70% 60% Opex* $ 109.50 $ 0.12 $ 114 Contribution Margin $ 99.25 $ 2.02 $ 172 CM% 27% 66% 36% Service Provider
Slide 105: UCaaS Drives Superior Revenue Streams
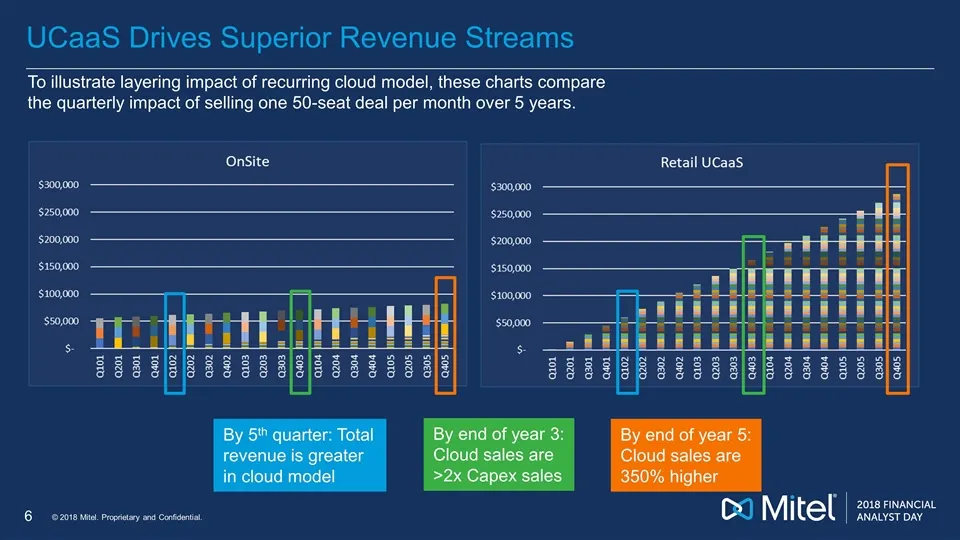
UCaaS Drives Superior Revenue Streams To illustrate layering impact of recurring cloud model, these charts compare the quarterly impact of selling one 50-seat deal per month over 5 years. By 5th quarter: Total revenue is greater in cloud model By end of year 3: Cloud sales are >2x Capex sales By end
Slide 106: UCaaS Drives Superior Profitability
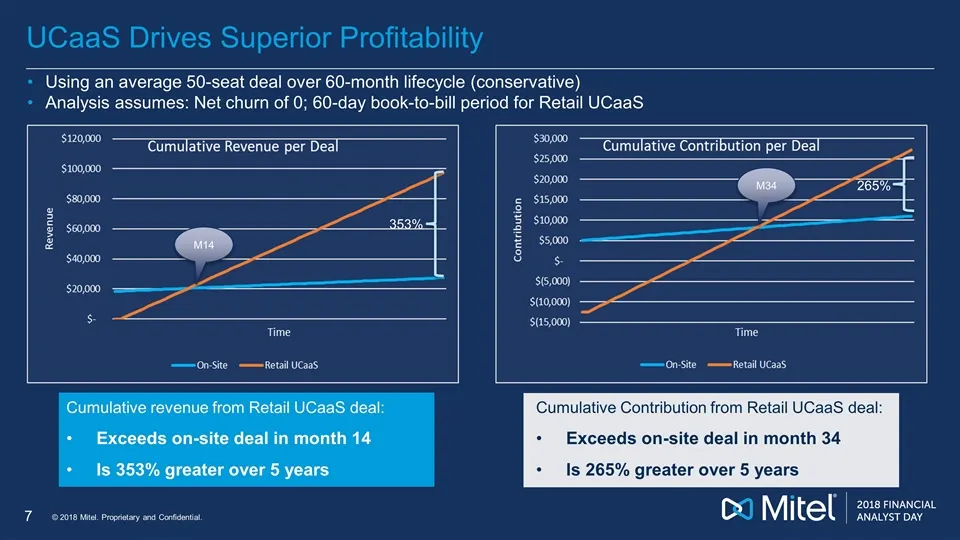
UCaaS Drives Superior Profitability Using an average 50-seat deal over 60-month lifecycle (conservative) Analysis assumes: Net churn of 0; 60-day book-to-bill period for Retail UCaaS Cumulative revenue from Retail UCaaS deal: Exceeds on-site deal in month 14 Is 353% greater over 5 years Cumulative C
Slide 107: We've Reached Exit Velocity: Growth Going Forward
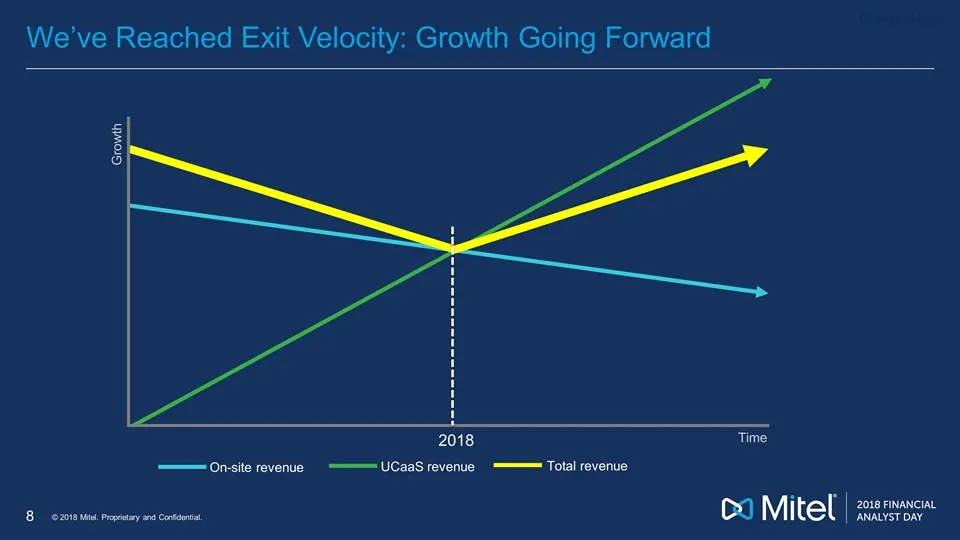
We’ve Reached Exit Velocity: Growth Going Forward Time 2018 On-site revenue UCaaS revenue Total revenue Growth Change colors
Slide 108: Conversion of Installed Base – In the Early Innings
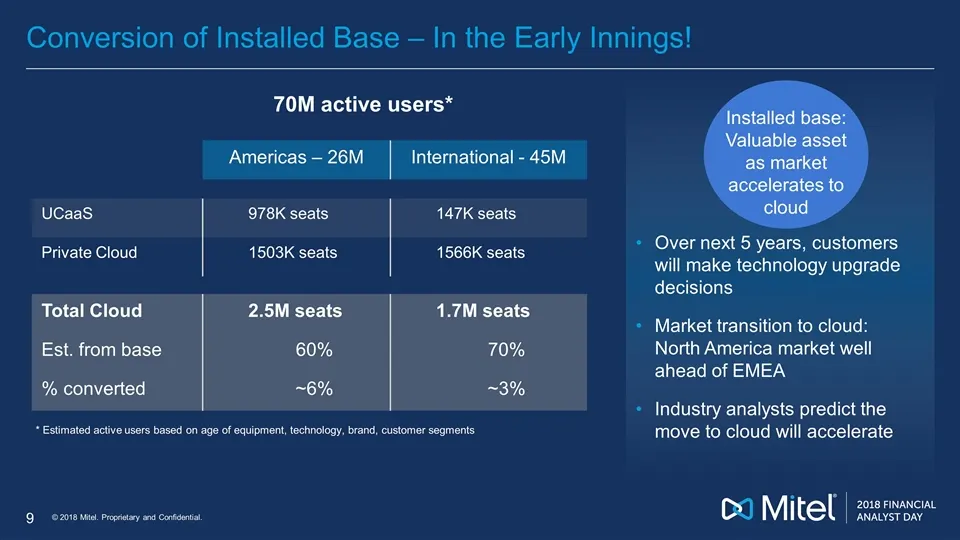
Conversion of Installed Base – In the Early Innings! 70M active users* Americas – 26M International - 45M UCaaS 978K seats 147K seats Private Cloud 1503K seats 1566K seats Total Cloud 2.5M seats 1.7M seats Est. from base 60% 70% % converted ~6% ~3% Over next 5 years, customers will make technology u
Slide 109: Transformation to Cloud Will Accelerate
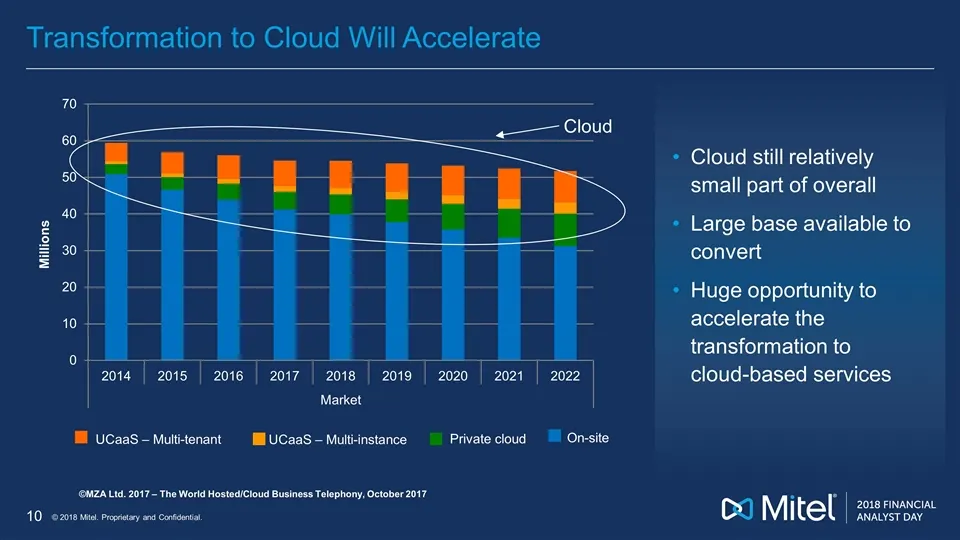
Transformation to Cloud Will Accelerate Cloud ©MZA Ltd. 2017 – The World Hosted/Cloud Business Telephony, October 2017 Cloud still relatively small part of overall Large base available to convert Huge opportunity to accelerate the transformation to cloud-based services UCaaS – Multi-tenant UCaaS – M
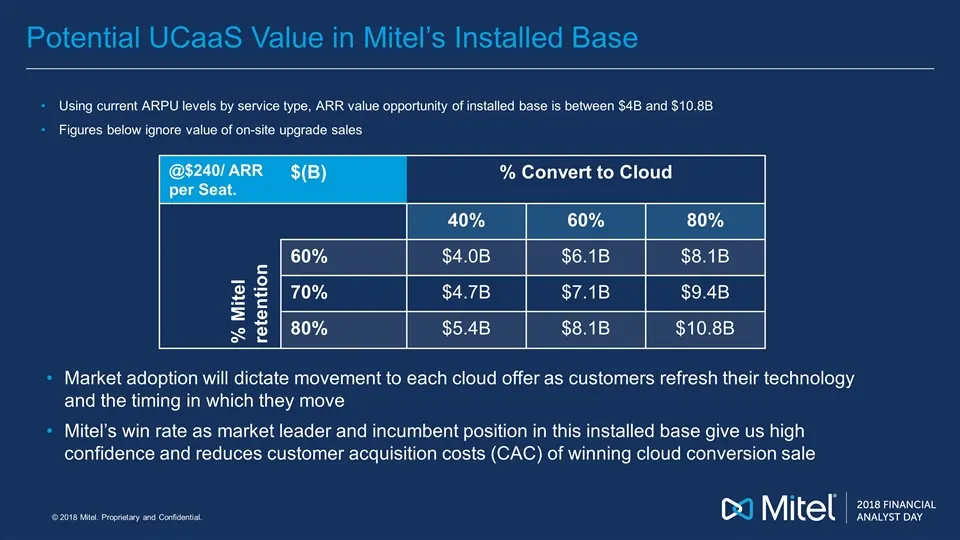
Slide 110: Potential UCaaS Value in Mitel's Installed Base
Potential UCaaS Value in Mitel’s Installed Base Market adoption will dictate movement to each cloud offer as customers refresh their technology and the timing in which they move Mitel’s win rate as market leader and incumbent position in this installed base give us high confidence and reduces custom
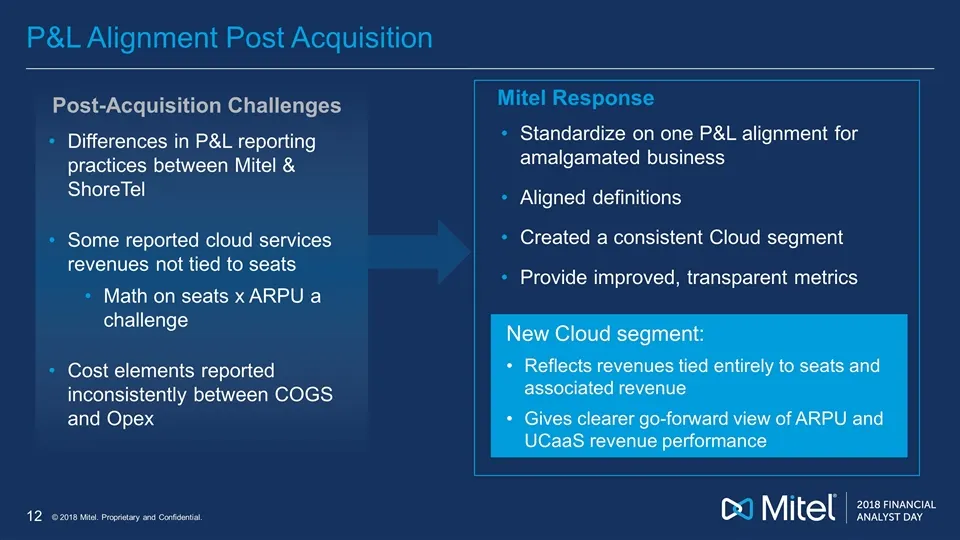
Slide 111: P&L Alignment Post Acquisition
P&L Alignment Post Acquisition Differences in P&L reporting practices between Mitel & ShoreTel Some reported cloud services revenues not tied to seats Math on seats x ARPU a challenge Cost elements reported inconsistently between COGS and Opex Standardize on one P&L alignment for amalgamated busines
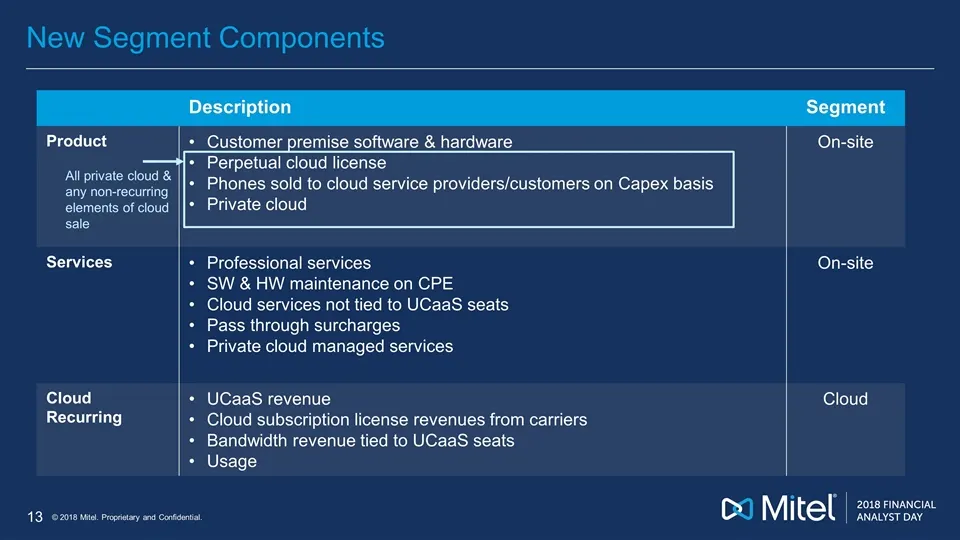
Slide 112: New Segment Components
New Segment Components Description Segment Product Customer premise software & hardware Perpetual cloud license Phones sold to cloud service providers/customers on Capex basis Private cloud On-site Services Professional services SW & HW maintenance on CPE Cloud services not tied to UCaaS seats Pass
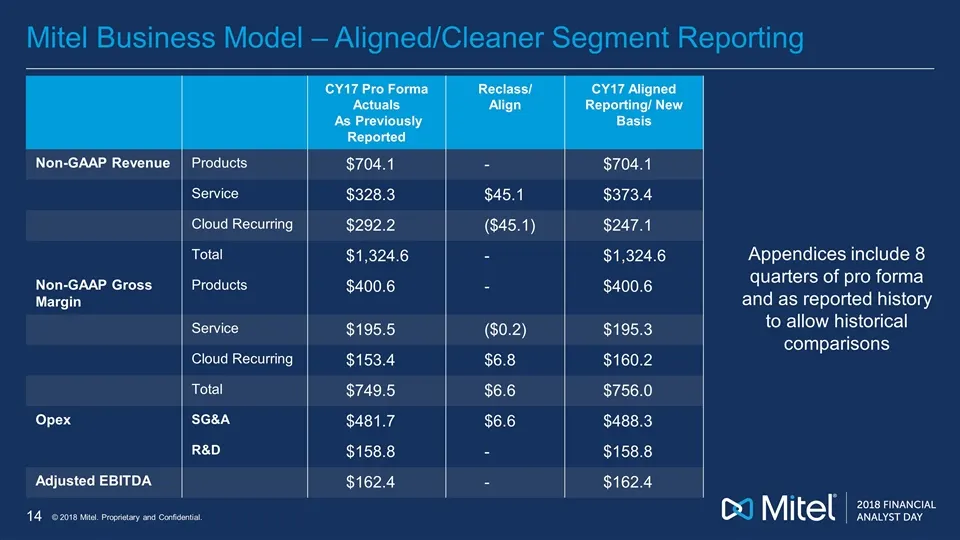
Slide 113: Aligned/Cleaner Segment Reporting
Mitel Business Model – Aligned/Cleaner Segment Reporting CY17 Pro Forma Actuals As Previously Reported Reclass/ Align CY17 Aligned Reporting/ New Basis Non-GAAP Revenue Products $704.1 - $704.1 Service $328.3 $45.1 $373.4 Cloud Recurring $292.2 ($45.1) $247.1 Total $1,324.6 - $1,324.6 Non-GAAP Gross
Slide 114: 2017 Cloud Metrics Summary
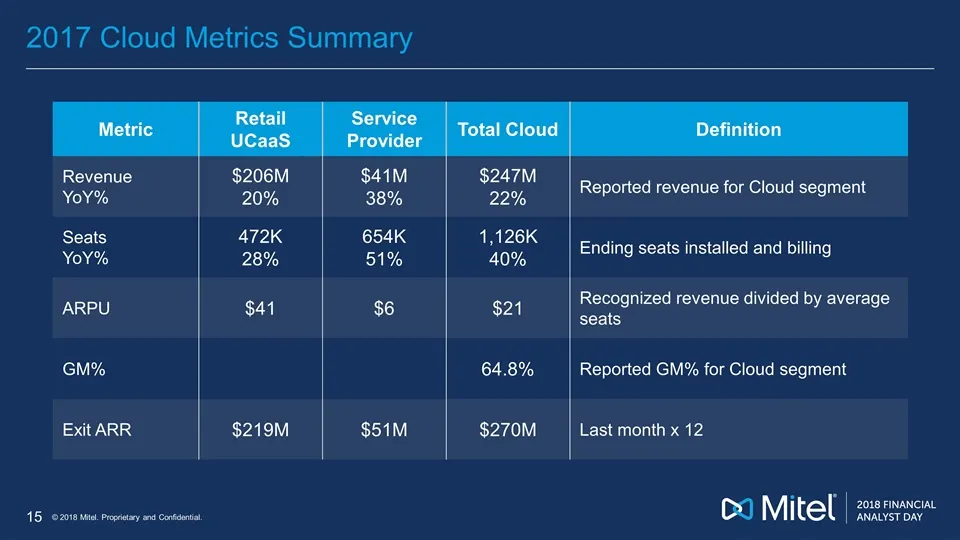
2017 Cloud Metrics Summary Metric Retail UCaaS Service Provider Total Cloud Definition Revenue YoY% $206M 20% $41M 38% $247M 22% Reported revenue for Cloud segment Seats YoY% 472K 28% 654K 51% 1,126K 40% Ending seats installed and billing ARPU $41 $6 $21 Recognized revenue divided by average seats G
Slide 115: Mix – Key Driver of Seat vs Revenue Growth in CY17
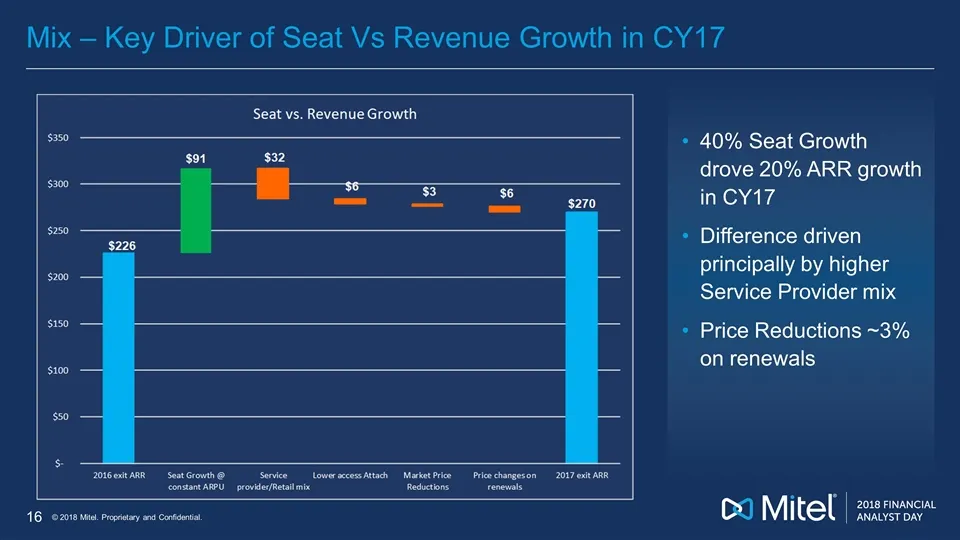
Mix – Key Driver of Seat Vs Revenue Growth in CY17 40% Seat Growth drove 20% ARR growth in CY17 Difference driven principally by higher Service Provider mix Price Reductions ~3% on renewals
Slide 116: Synergies: Now Tracking to $75M
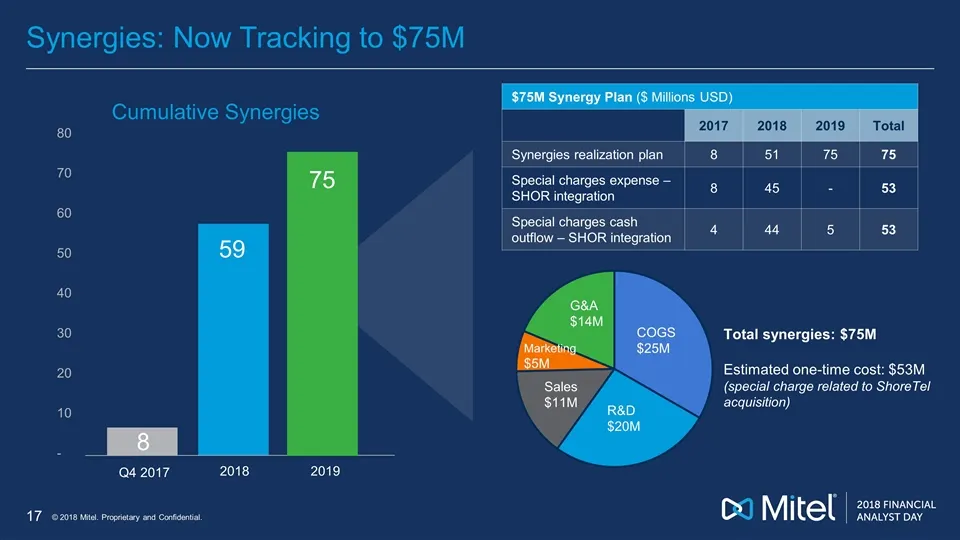
Synergies: Now Tracking to $75M $75M Synergy Plan ($ Millions USD) 2017 2018 2019 Total Synergies realization plan 8 51 75 75 Special charges expense – SHOR integration 8 45 - 53 Special charges cash outflow – SHOR integration 4 44 5 53 80 70 60 50 40 30 20 10 - Q4 2017 8 59 Cumulative Synergies 201
Slide 117: Synergy and Special Charges
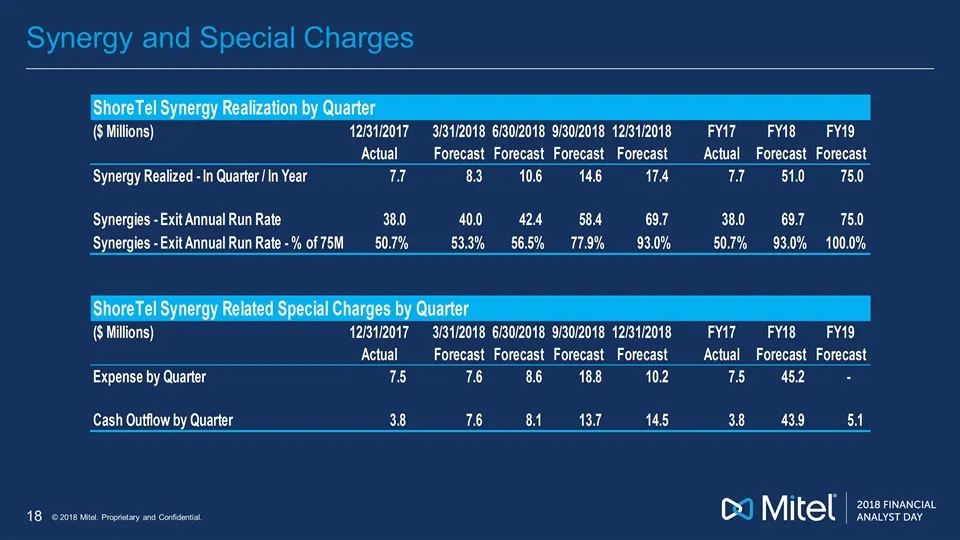
Synergy and Special Charges ($ Millions) 1213112017 3/31/2018 6/30/2018 9/30/2018 12/31/2018 FYi7—FY18 “Y19 al Forecast Forecast Forecast Forecast Actual Forecast Forecast 83 10.6 14.6 174 1 51.0 75.0 ‘Synergy Realized - In Quarter/In Year Synergies - Exit Annual Run Rate 38.0 40.0 424 58.4 69.7 38.
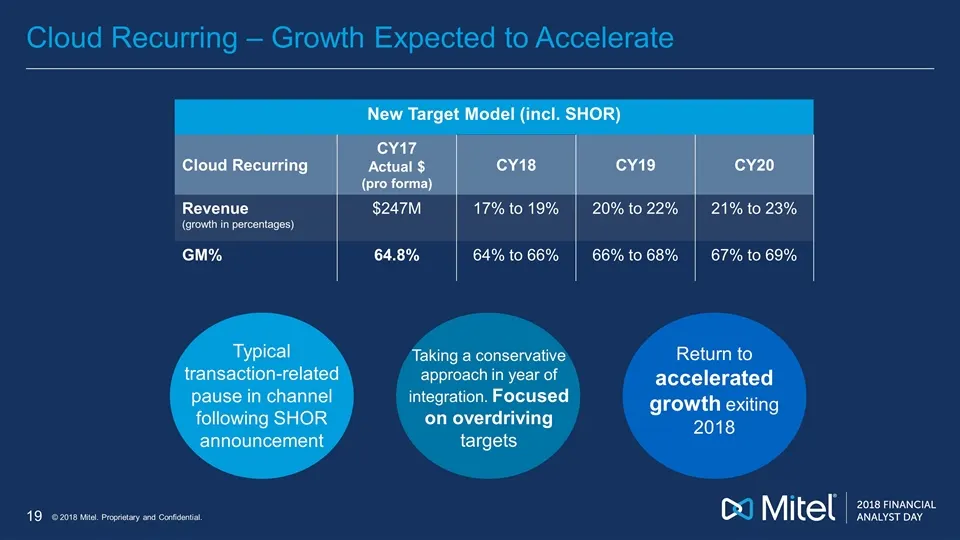
Slide 118: Cloud Recurring – Growth Expected to Accelerate
Cloud Recurring – Growth Expected to Accelerate New Target Model (incl. SHOR) Cloud Recurring CY17 Actual $ (pro forma) CY18 CY19 CY20 Revenue (growth in percentages) $247M 17% to 19% 20% to 22% 21% to 23% GM% 64.8% 64% to 66% 66% to 68% 67% to 69% Typical transaction-related pause in channel follow
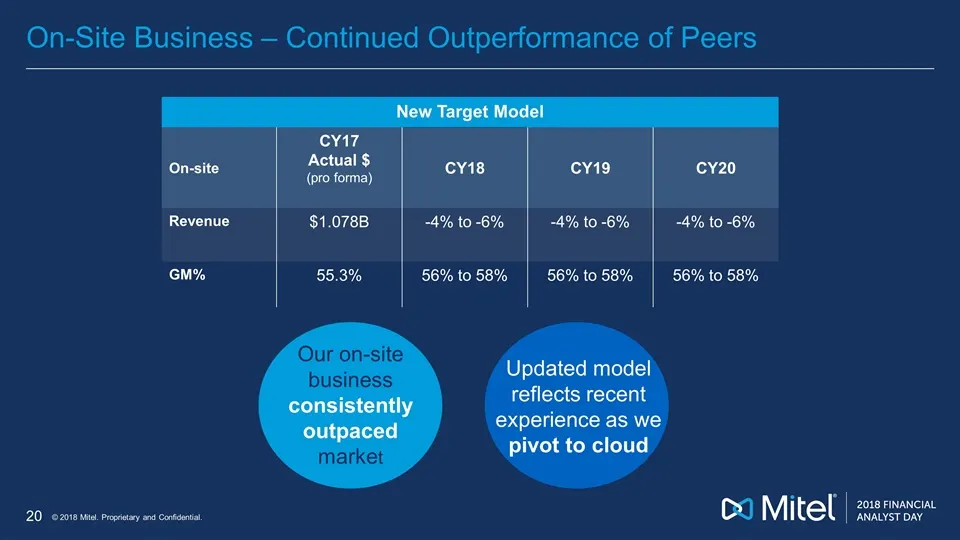
Slide 119: On-Site Business – Continued Outperformance of Peers
On-Site Business – Continued Outperformance of Peers New Target Model On-site CY17 Actual $ (pro forma) CY18 CY19 CY20 Revenue $1.078B -4% to -6% -4% to -6% -4% to -6% GM% 55.3% 56% to 58% 56% to 58% 56% to 58% Our on-site business consistently outpaced market Updated model reflects recent experienc
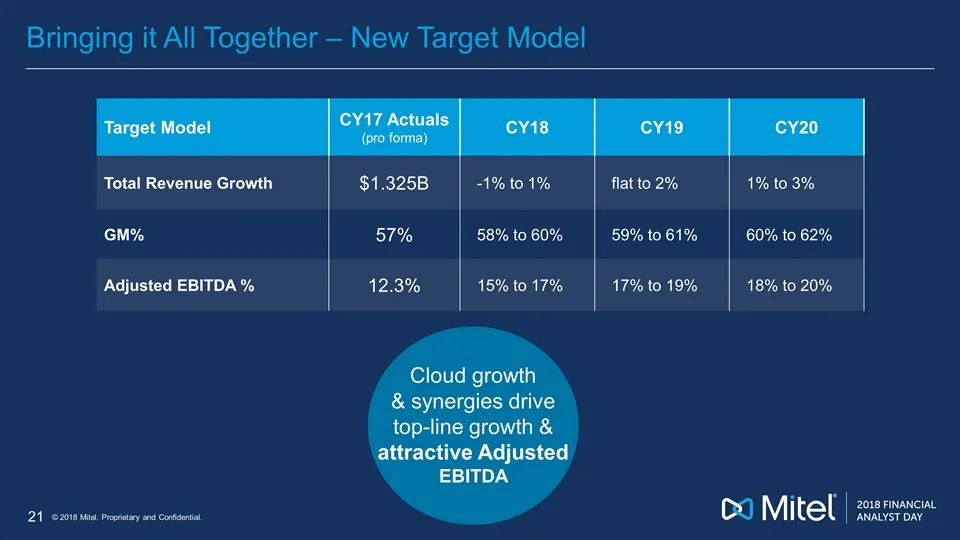
Slide 120: Bringing it All Together – New Target Model
Bringing it All Together – New Target Model Target Model CY17 Actuals (pro forma) CY18 CY19 CY20 Total Revenue Growth $1.325B -1% to 1% flat to 2% 1% to 3% GM% 57% 58% to 60% 59% to 61% 60% to 62% Adjusted EBITDA % 12.3% 15% to 17% 17% to 19% 18% to 20% Cloud growth & synergies drive top-line growth
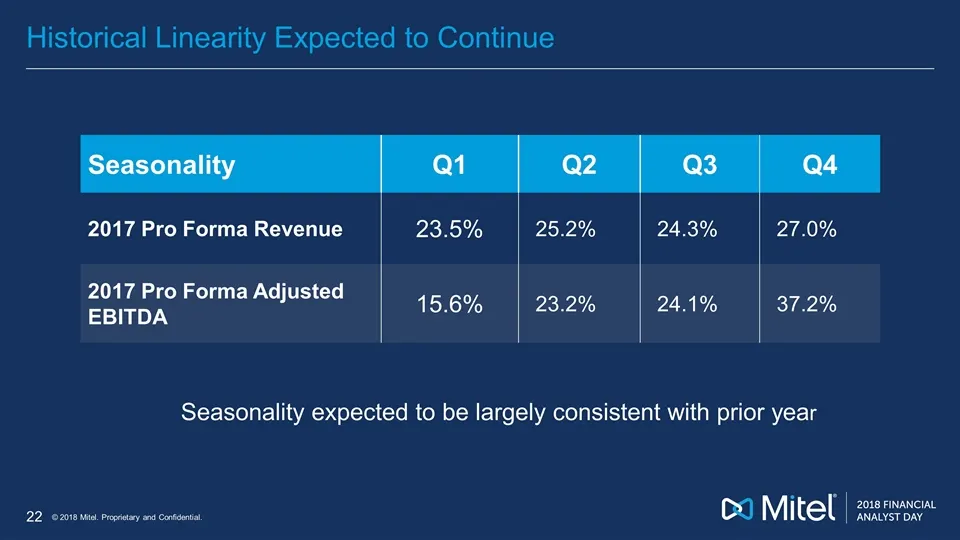
Slide 121: Historical Linearity Expected to Continue
Historical Linearity Expected to Continue Seasonality Q1 Q2 Q3 Q4 2017 Pro Forma Revenue 23.5% 25.2% 24.3% 27.0% 2017 Pro Forma Adjusted EBITDA 15.6% 23.2% 24.1% 37.2% Seasonality expected to be largely consistent with prior year
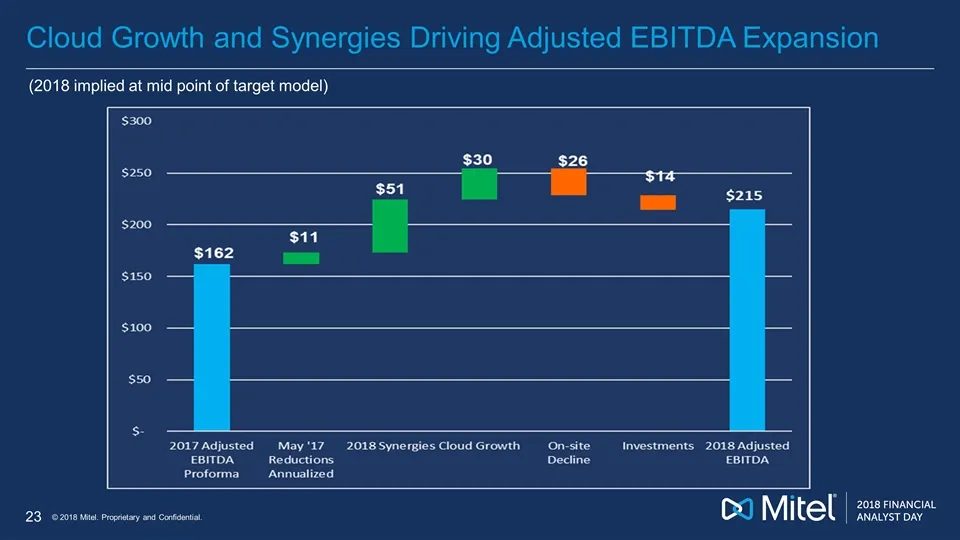
Slide 122: Cloud Growth and Synergies Driving Adjusted EBITDA Expansion
Cloud Growth and Synergies Driving Adjusted EBITDA Expansion (2018 implied at mid point of target model)
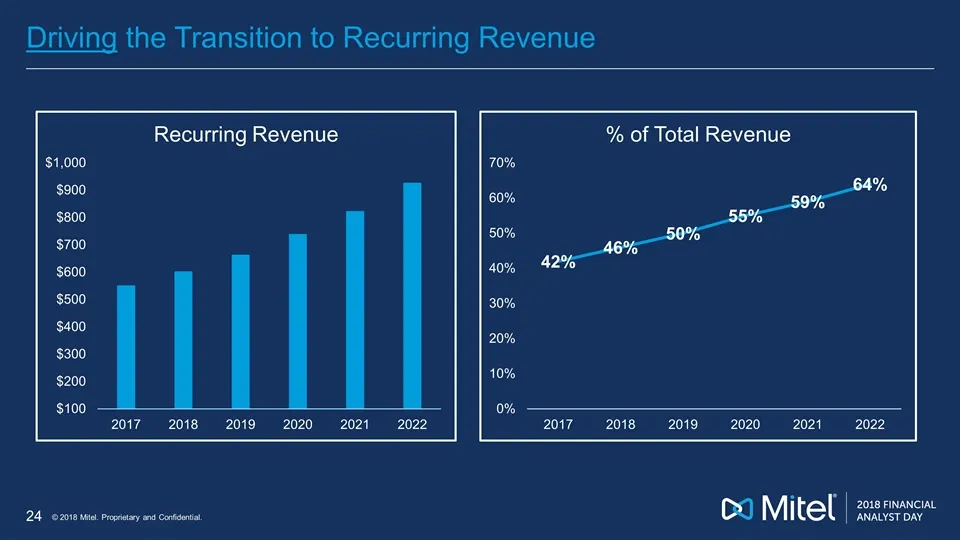
Slide 123: Driving the Transition to Recurring Revenue
Driving the Transition to Recurring Revenue
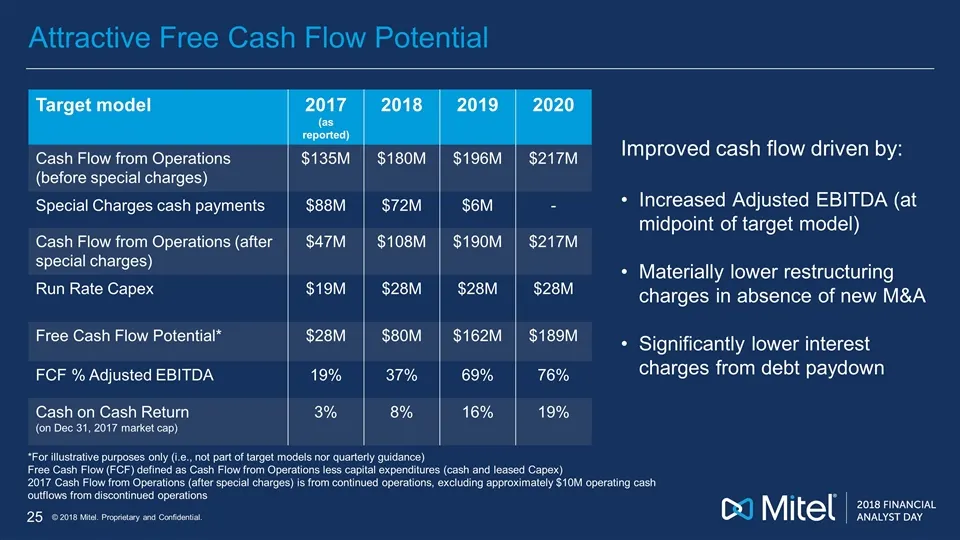
Slide 124: Attractive Free Cash Flow Potential
Attractive Free Cash Flow Potential Target model 2017 (as reported) 2018 2019 2020 Cash Flow from Operations (before special charges) $135M $180M $196M $217M Special Charges cash payments $88M $72M $6M - Cash Flow from Operations (after special charges) $47M $108M $190M $217M Run Rate Capex $19M $28
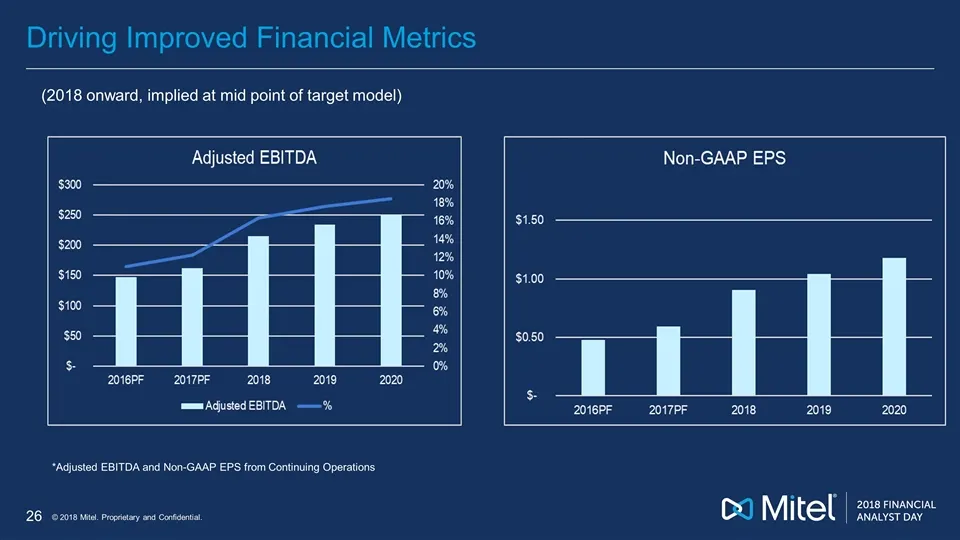
Slide 125: Driving Improved Financial Metrics
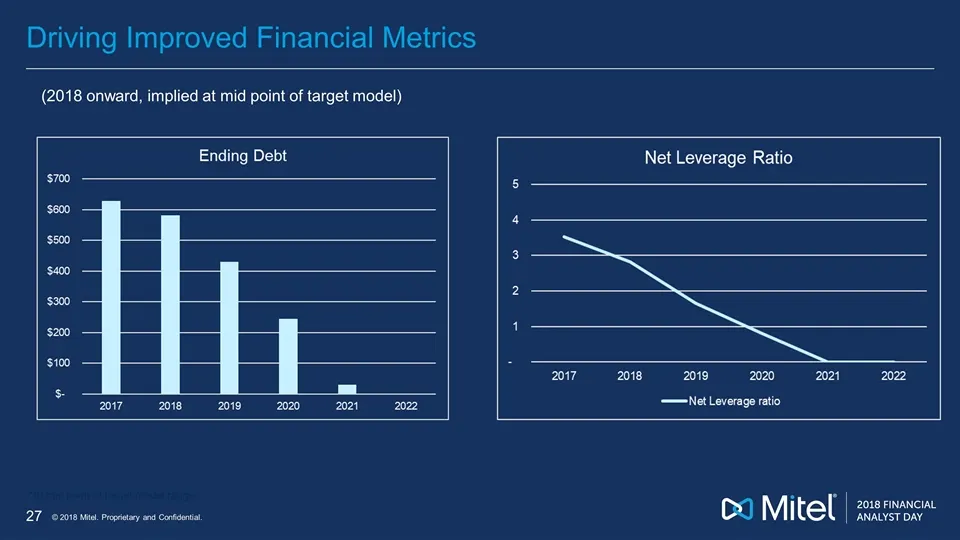
Driving Improved Financial Metrics (2018 onward, implied at mid point of target model) *Adjusted EBITDA and Non-GAAP EPS from Continuing Operations
Slide 126: Driving Improved Financial Metrics
Driving Improved Financial Metrics *At mid point of target model range (2018 onward, implied at mid point of target model)
Slide 127: Capital Allocation Priorities
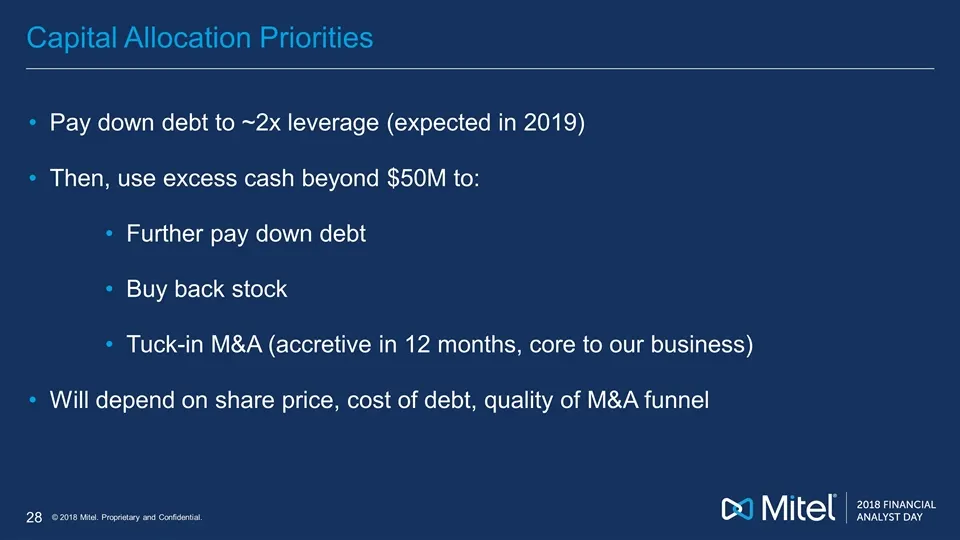
Capital Allocation Priorities Pay down debt to ~2x leverage (expected in 2019) Then, use excess cash beyond $50M to: Further pay down debt Buy back stock Tuck-in M&A (accretive in 12 months, core to our business) Will depend on share price, cost of debt, quality of M&A funnel
Slide 128: Compelling strategy for creating shareholder value
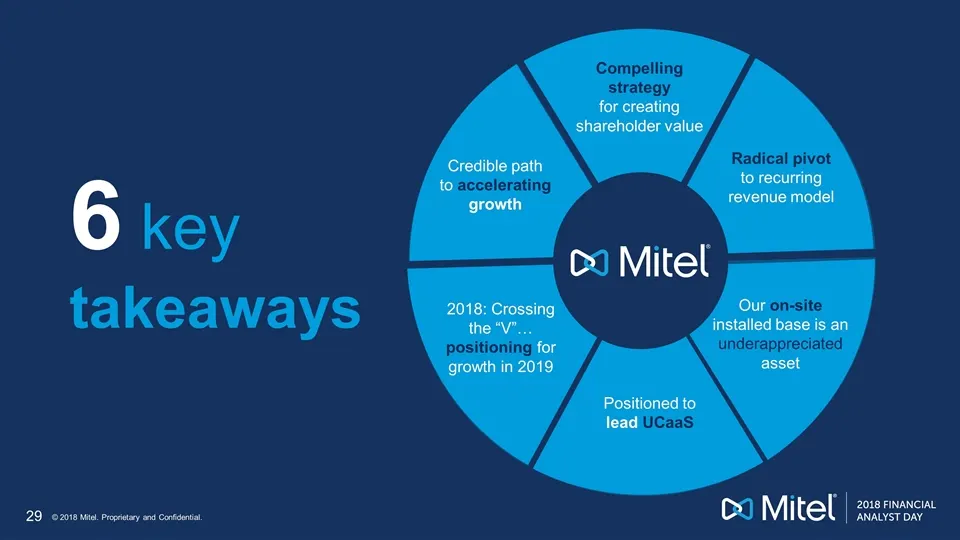
Compelling strategy for creating shareholder value Radical pivot to recurring revenue model Our on-site installed base is an underappreciated asset Positioned to lead UCaaS 2018: Crossing the “V”… positioning for growth in 2019 Credible path to accelerating growth 6 key takeaways

Slide 129: 2018 Financial Analyst Day
2018 FINANCIAL ANALYST DAY Co Mitel
Slide 130: Financial Appendix
Financial Appendix Cd Mitel | zee"
Slide 131: ASC606
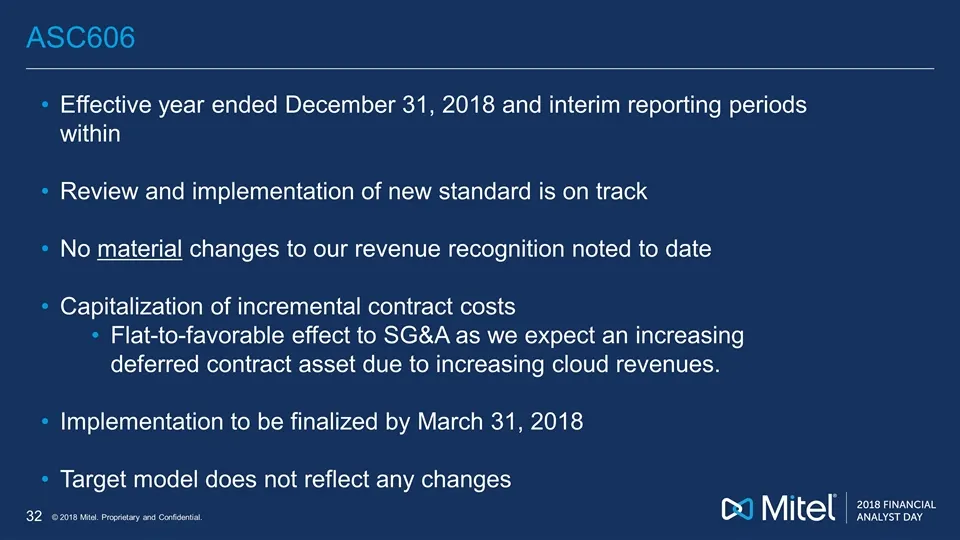
ASC606 Effective year ended December 31, 2018 and interim reporting periods within Review and implementation of new standard is on track No material changes to our revenue recognition noted to date Capitalization of incremental contract costs Flat-to-favorable effect to SG&A as we expect an increasi
Slide 132: Statement of Operations – Updated Segments (Proforma)
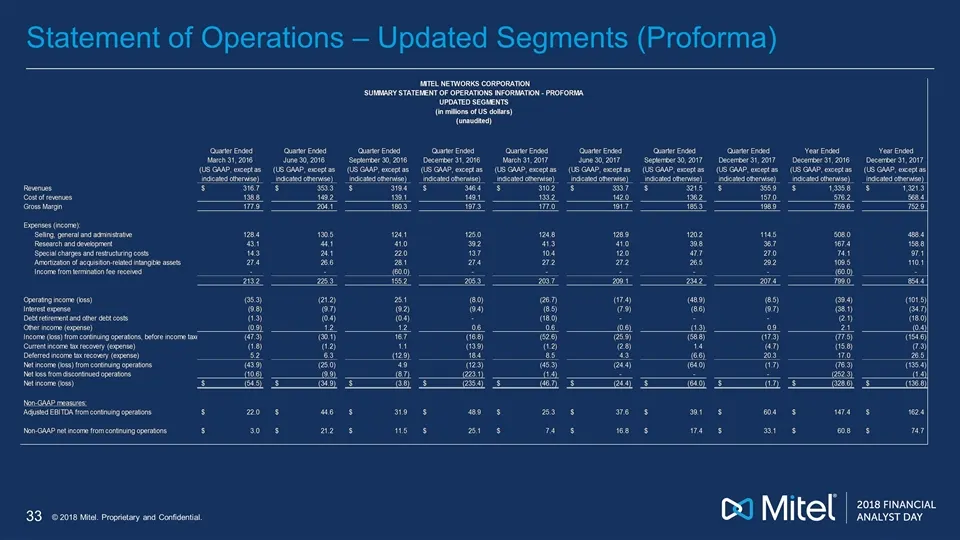
Statement of Operations – Updated Segments (Proforma)
Slide 133: Updated Segments (Proforma)
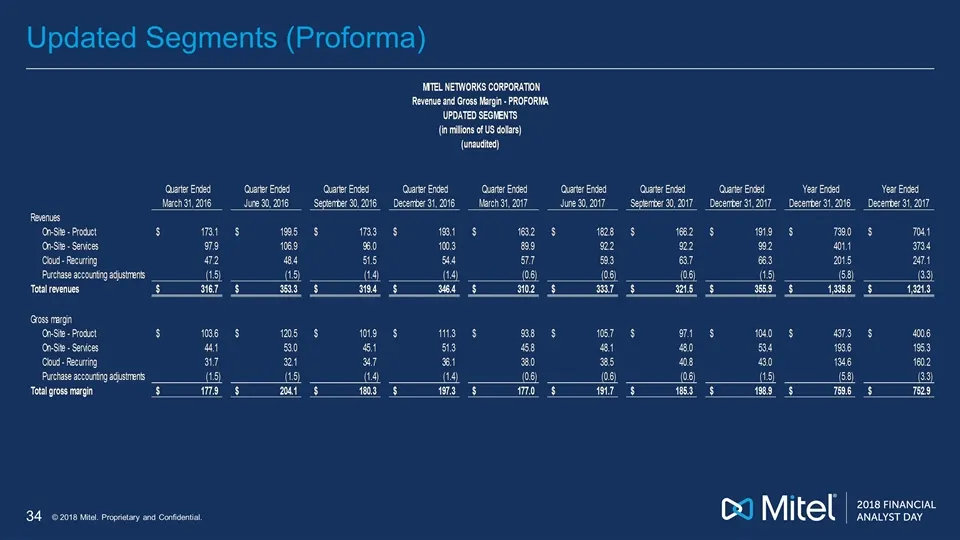
Updated Segments (Proforma)
Slide 134: Reconciliation of Net Loss to Non-GAAP Net Income (Proforma)
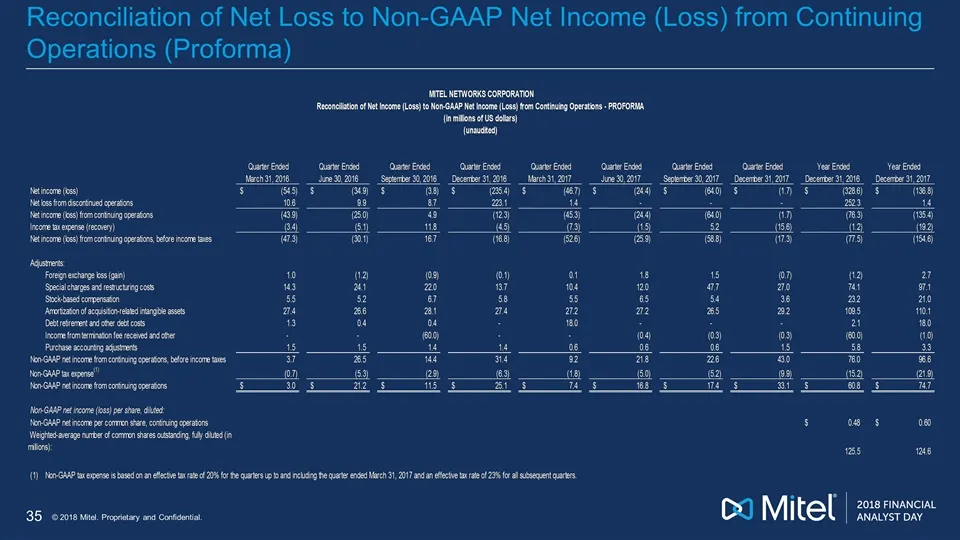
Reconciliation of Net Loss to Non-GAAP Net Income (Loss) from Continuing Operations (Proforma)
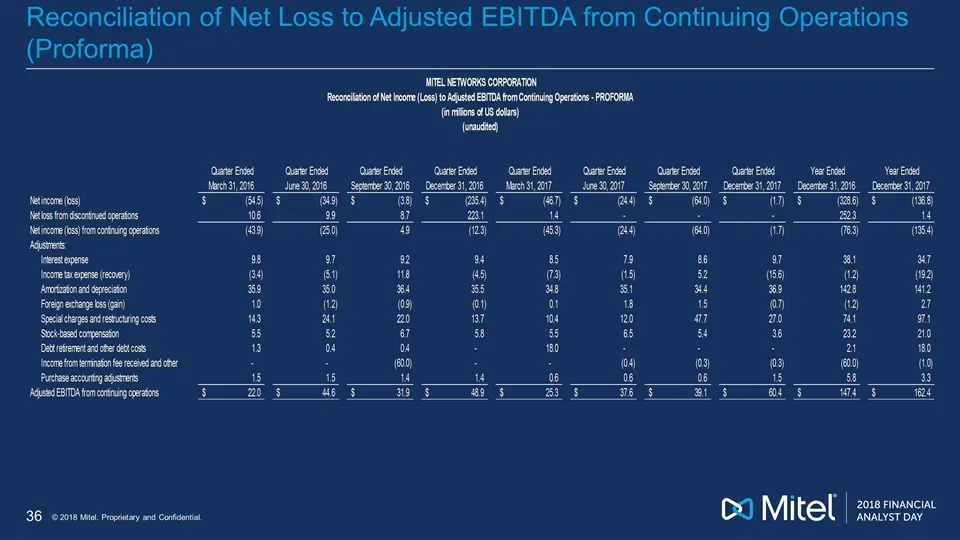
Slide 135: Reconciliation of Net Loss to Adjusted EBITDA (Proforma)
Reconciliation of Net Loss to Adjusted EBITDA from Continuing Operations (Proforma)
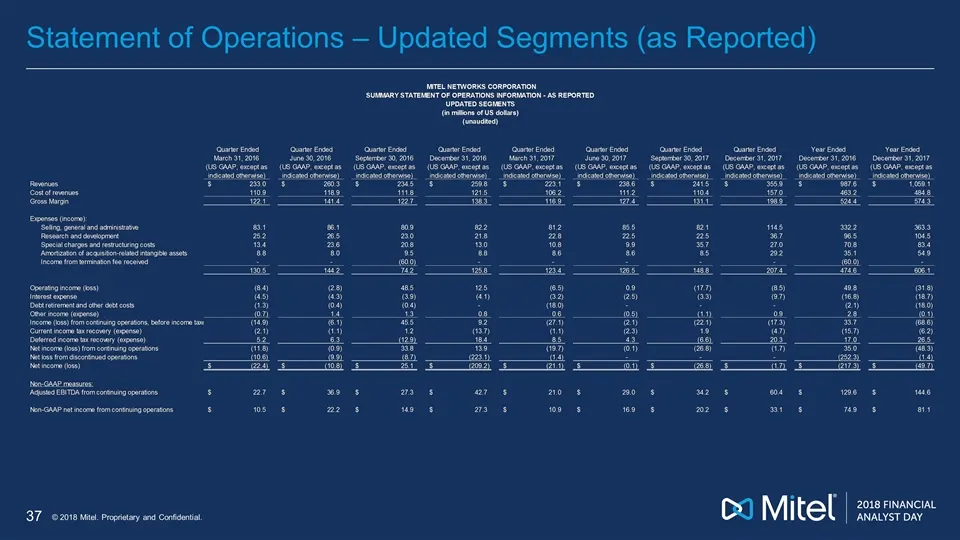
Slide 136: Statement of Operations – Updated Segments (as Reported)
Statement of Operations – Updated Segments (as Reported)
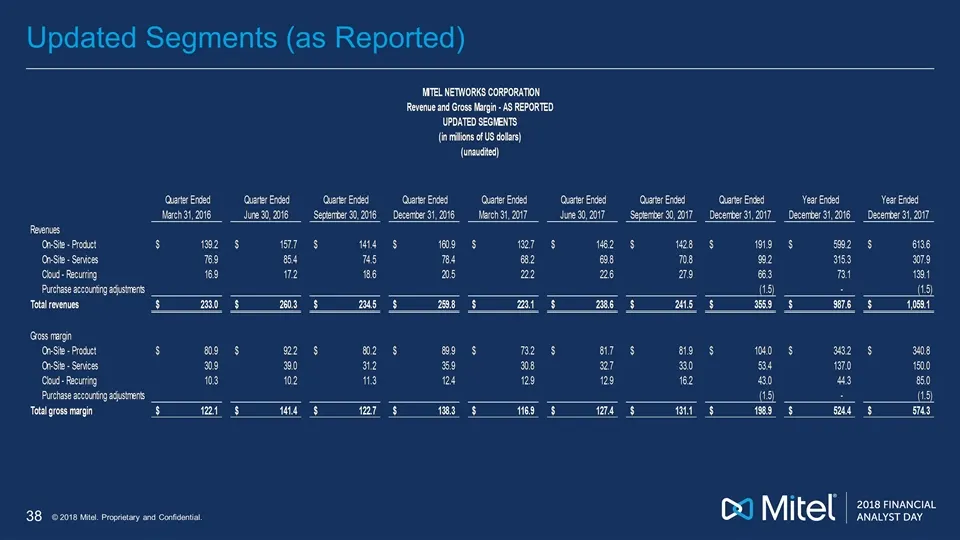
Slide 137: Updated Segments (as Reported)
Updated Segments (as Reported)
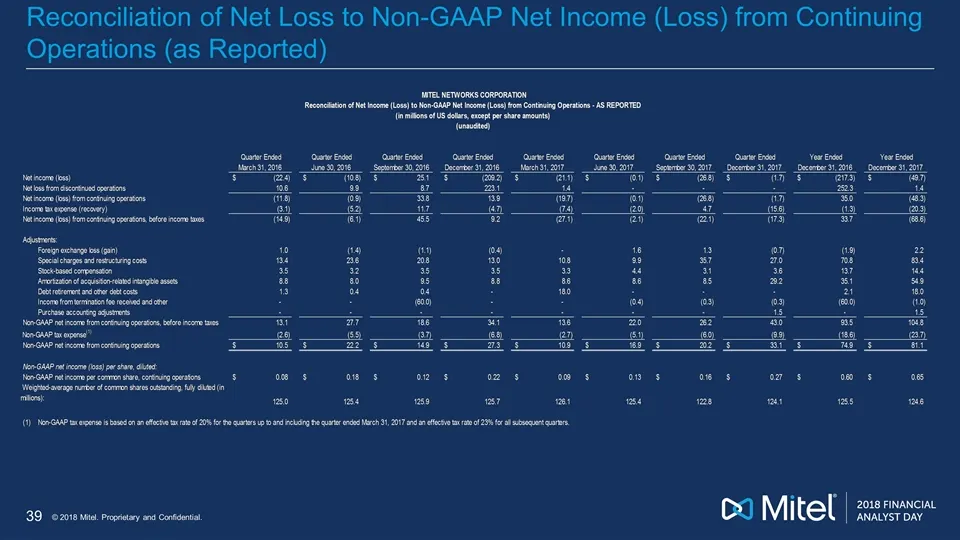
Slide 138: Reconciliation of Net Loss to Non-GAAP Net Income (as Reported)
Reconciliation of Net Loss to Non-GAAP Net Income (Loss) from Continuing Operations (as Reported)
Slide 139: Reconciliation of Net Loss to Adjusted EBITDA (as Reported)
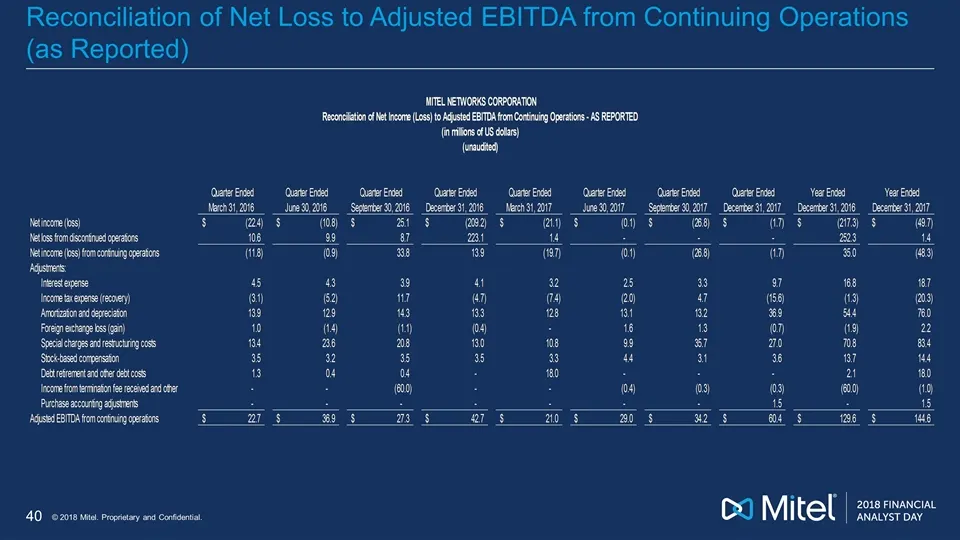
Reconciliation of Net Loss to Adjusted EBITDA from Continuing Operations (as Reported)
Slide 140: Reconciliation of 2018 – 2020 Target Model
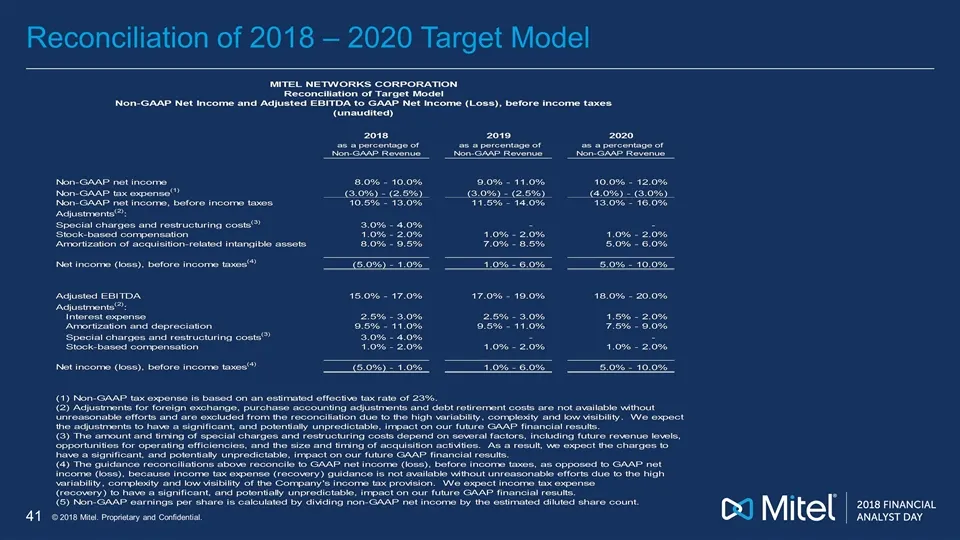
Reconciliation of 2018 – 2020 Target Model
Source: SEC EDGAR · 8-K filed Feb 27, 2018
More decks from Mitel Networks Corp.
 Q4 2017 Earnings Presentation17 slides · Feb 22, 2018
 Q3 2017 Earnings Presentation17 slides · Nov 2, 2017
 Oppenheimer 20th Annual Technology, Internet & Communications Conference (August 2017)25 slides · Aug 9, 2017
 Q2 2017 Earnings Presentation30 slides · Jul 27, 2017
 Q1 2017 Earnings Presentation19 slides · May 3, 2017
 Investor Day (March 2017)117 slides · Mar 7, 2017