National Financial Partners Corp
National Financial Partners — Merrill Lynch Insurance Conference 2007
33 slides from National Financial Partners's conference presentation, Feb 15, 2007
Slide 1: Merrill Lynch Insurance Conference February 15, 2007
Merrill Lynch Insurance Conference February 15, 2007
Slide 2: Related to Forward-Looking Statements
RELATED TO FORWARD-LOOKING STATEMENTS Certain items in this presentation and in today’s discussion, including matters relating to revenue, net income, Cash earnings, Cash earnings per diluted share, acquisitions, capital structure or growth rates and other financial measurements and non-financial st
Slide 3: Related to Non-GAAP Financial Information
RELATED TO NON-GAAP FINANCIAL INFORMATION The historical and forward-looking financial information in this presentation includes performance measures called Cash earnings and Cash earnings per diluted share (“Cash EPS”), both of which are based on methodologies other than Generally Accepted Accounti
Slide 4: Reconciliation Net Income to Cash Earnings
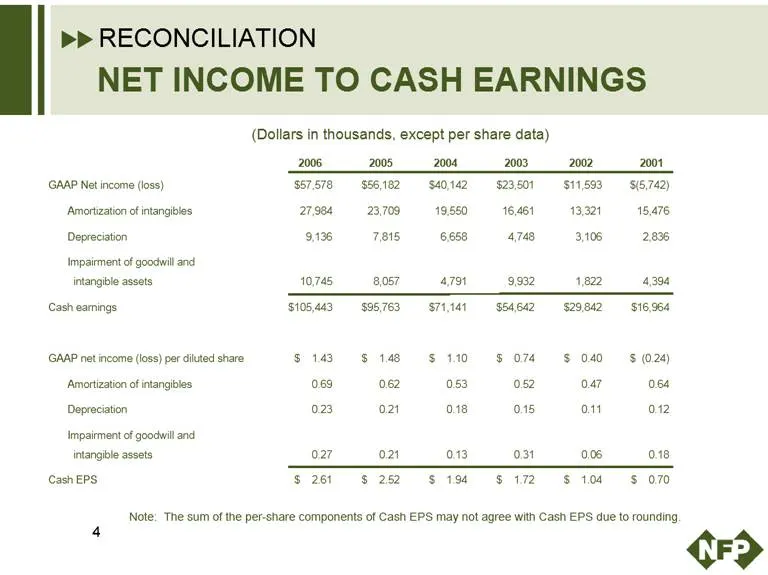
RECONCILIATION NET INCOME TO CASH EARNINGS (Dollars in thousands, except per share data) 2006 2005 2004 2003 2002 2001 GAAP Net income (loss) $57,578 $56,182 $40,142 $23,501 $11,593 $(5,742) Amortization of intangibles 27,984 23,709 19,550 16,461 13,321 15,476 Depreciation 9,136 7,815 6,658 4,748 3,
Slide 5: National Financial Partners Overview
NATIONAL FINANCIAL PARTNERS OVERVIEW History and Background “Same Store” or Organic Revenue Growth Acquisition Strategy Capital Management and Financial Results 5
Slide 6: History Built on Independence
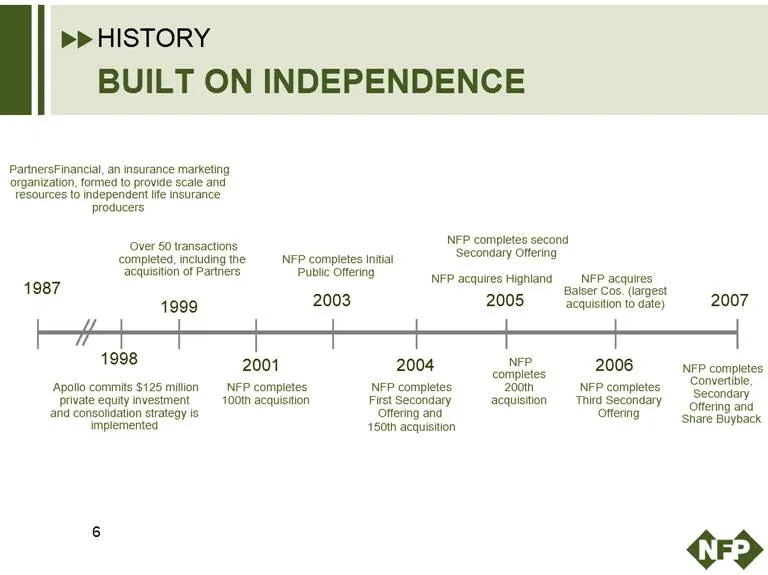
HISTORY BUILT ON INDEPENDENCE 1987 1998 1999 2001 2003 2004 2005 2006 2007 PartnersFinancial, an insurance marketing organization, formed to provide scale and resources to independent life insurance producers Apollo commits $125 million private equity investment and consolidation strategy is impleme
Slide 7: Background: Premier Distribution Company
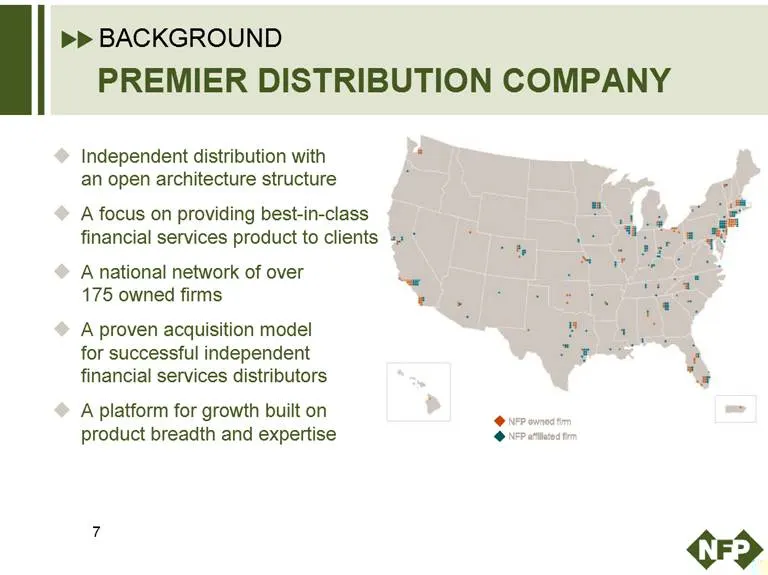
BACKGROUND PREMIER DISTRIBUTION COMPANY Independent distribution with an open architecture structure A focus on providing best-in-class financial services product to clients A national network of over 175 owned firms A proven acquisition model for successful independent financial services distributo
Slide 8: NFP Business Mix: Current Diversification
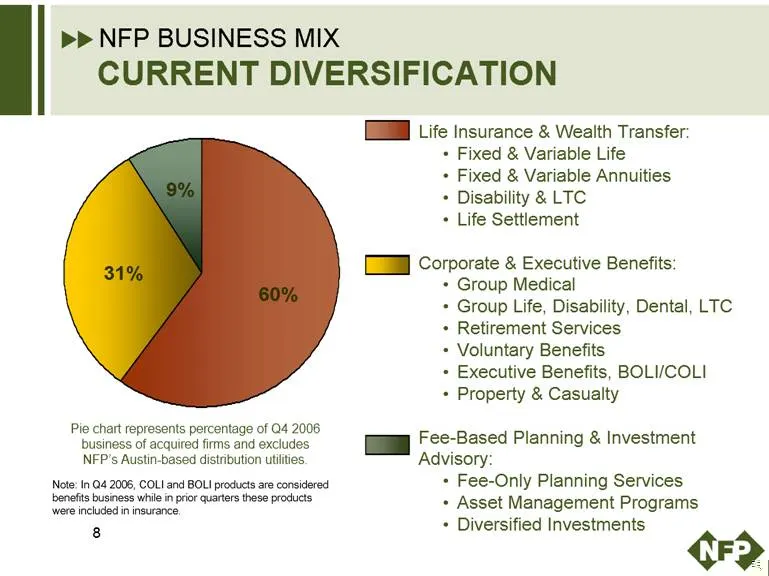
NFP BUSINESS MIX CURRENT DIVERSIFICATION Life Insurance & Wealth Transfer: Fixed & Variable Life Fixed & Variable Annuities Disability & LTC Life Settlement Corporate & Executive Benefits: Group Medical Group Life, Disability, Dental, LTC Retirement Services Voluntary Benefits Executive Benefits, BO
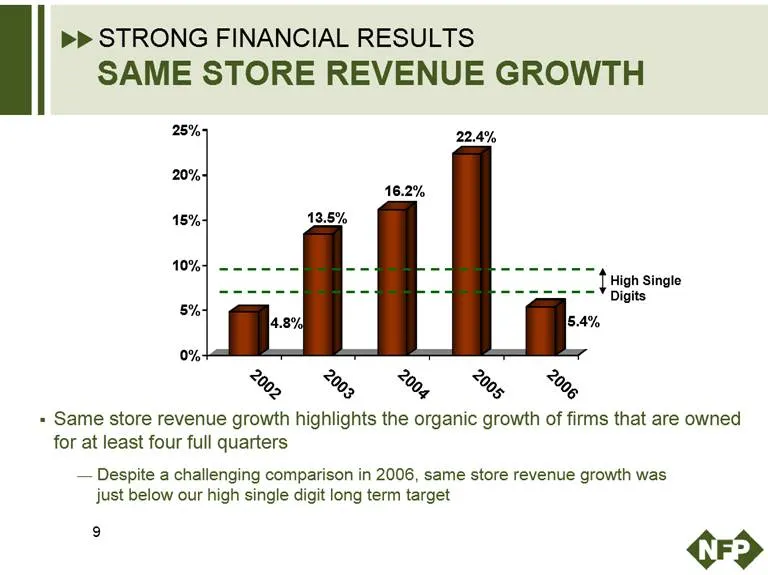
Slide 9: Strong Financial Results: Same Store Revenue Growth
STRONG FINANCIAL RESULTS SAME STORE REVENUE GROWTH 0% 5% 10% 15% 20% 25% 4.8% 13.5% 16.2% 22.4% 5.4% High Single Digits 2002 2003 2004 2005 2006 Same store revenue growth highlights the organic growth of firms that are owned for at least four full quarters – Despite a challenging comparison in 2006,
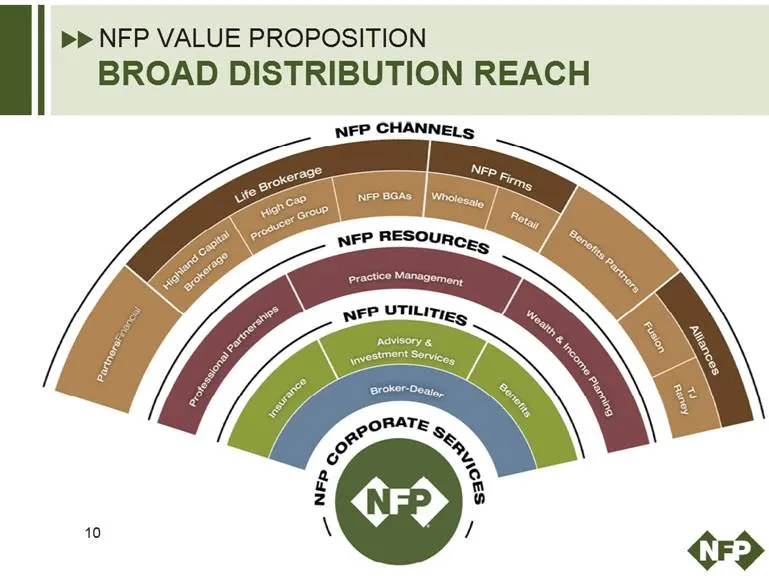
Slide 10: NFP Value Proposition: Broad Distribution Reach
NFP VALUE PROPOSITION BROAD DISTRIBUTION REACH NFP CHANNELS PartnersFinancial Life Brokerage Highland Capital Brokerage High Cap Producer Group NFP BGAs NFP Firms Wholesale Retail Benefits Partners Alliances Fusion TJ Raney NFP RESOURCES Professional Partnerships Practice Management Wealth & Income
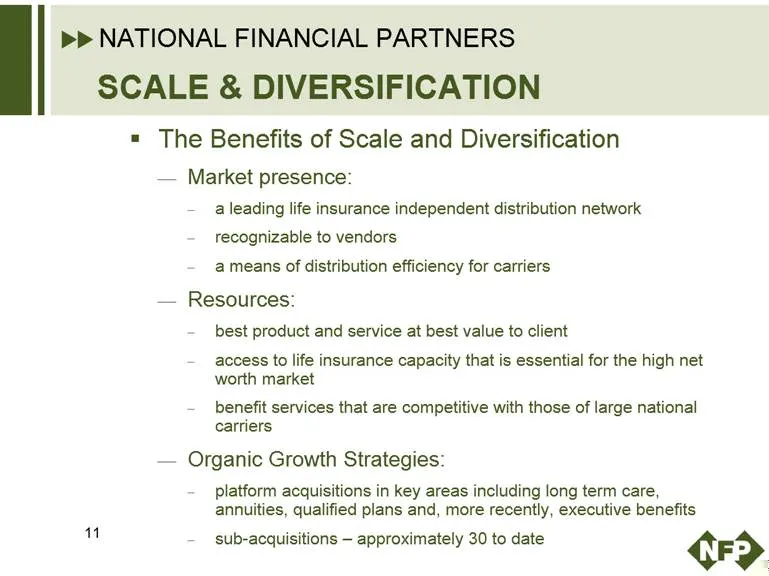
Slide 11: Scale & Diversification
NATIONAL FINANCIAL PARTNERS SCALE & DIVERSIFICATION The Benefits of Scale and Diversification Market presence: a leading life insurance independent distribution network recognizable to vendors a means of distribution efficiency for carriers Resources: best product and service at best value to client
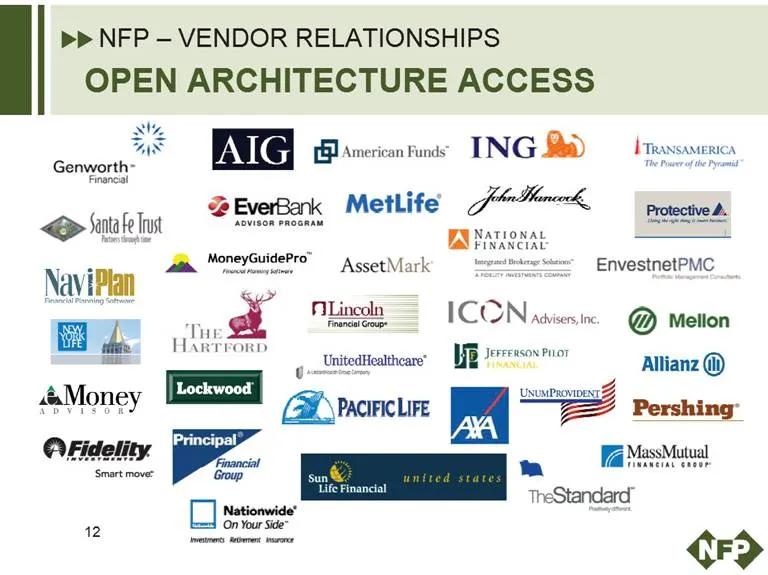
Slide 12: NFP – Vendor Relationships: Open Architecture Access
NFP – VENDOR RELATIONSHIPS OPEN ARCHITECTURE ACCESS 12
Slide 13: The Future of NFP: Diversification Progress
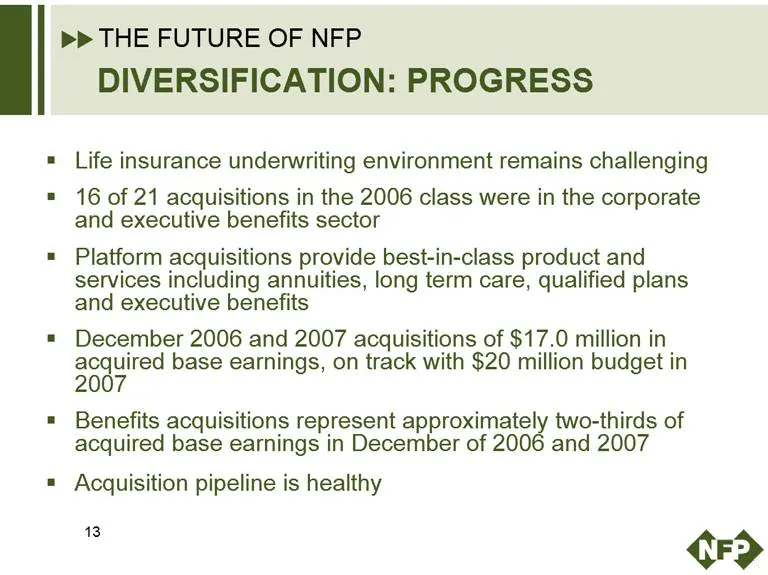
THE FUTURE OF NFP DIVERSIFICATION: PROGRESS Life insurance underwriting environment remains challenging 16 of 21 acquisitions in the 2006 class were in the corporate and executive benefits sector Platform acquisitions provide best-in-class product and services including annuities, long term care, qu
Slide 14: NFP – Acquisition Strategy: A Core Competency
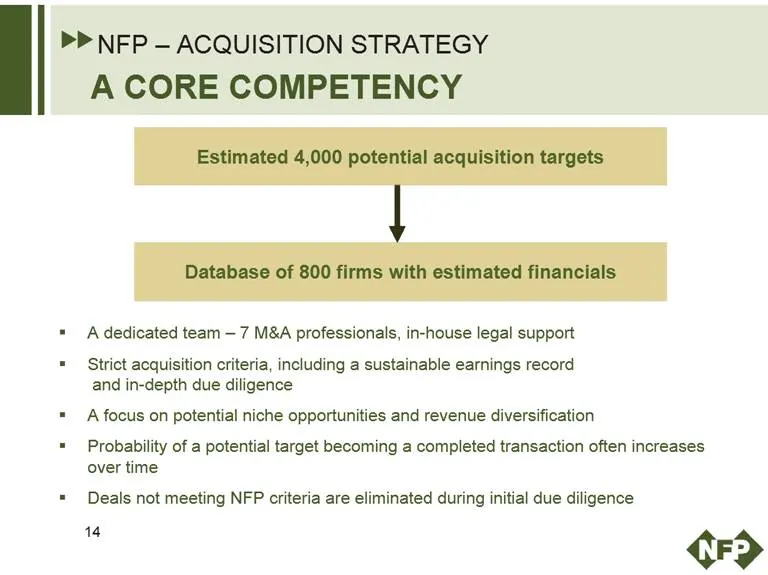
NFP – ACQUISITION STRATEGY A CORE COMPETENCY Estimated 4,000 potential acquisition targets Database of 800 firms with estimated financials A dedicated team – 7 M&A professionals, in-house legal support Strict acquisition criteria, including a sustainable earnings record and in-depth due diligence A
Slide 15: Acquisition Strategy: Key Strengths
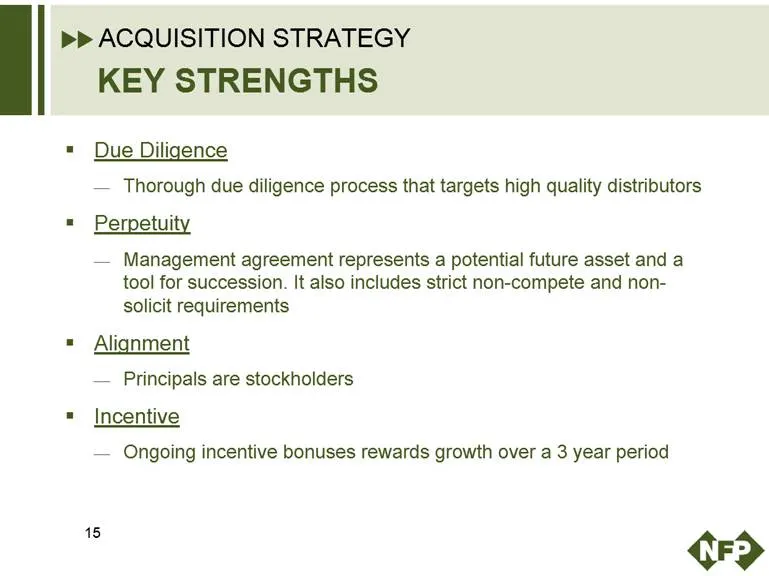
ACQUISITION STRATEGY KEY STRENGTHS Due Diligence Thorough due diligence process that targets high quality distributors Perpetuity Management agreement represents a potential future asset and a tool for succession. It also includes strict non-compete and non-solicit requirements Alignment Principals
Slide 16: Acquisition Strategy: Strong Track Record
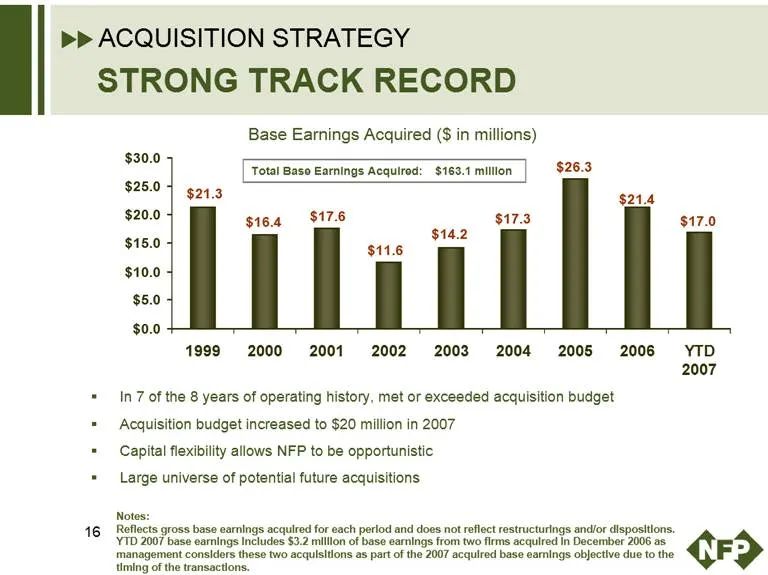
ACQUISITION STRATEGY STRONG TRACK RECORD Base Earnings Acquired ($ in millions) Total Base Earnings Acquired: $163.1 million In 7 of the 8 years of operating history, met or exceeded acquisition budget Acquisition budget increased to $20 million in 2007 Capital flexibility allows NFP to be opportuni
Slide 17: Acquisition Strategy: Transaction Features
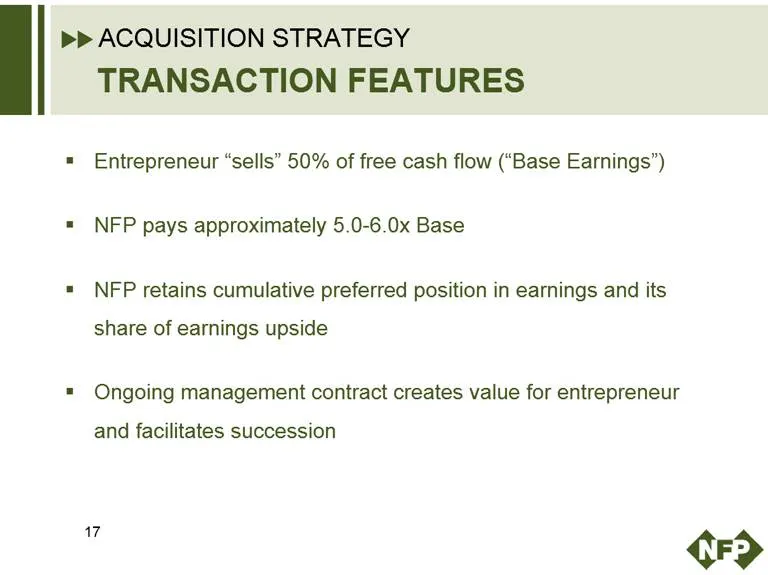
ACQUISITION STRATEGY TRANSACTION FEATURES Entrepreneur “sells” 50% of free cash flow (“Base Earnings”) NFP pays approximately 5.0-6.0x Base NFP retains cumulative preferred position in earnings and its share of earnings upside Ongoing management contract creates value for entrepreneur and facilitate
Slide 18: Acquisition Strategy: Valuation
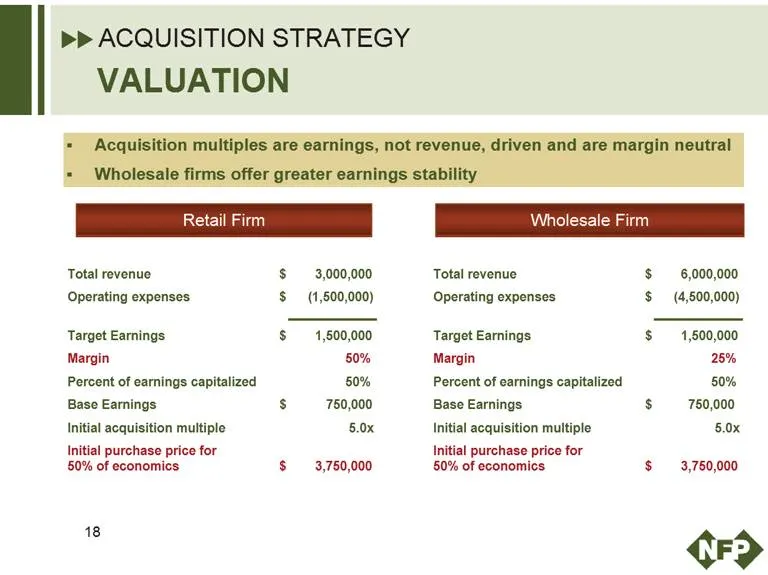
ACQUISITION STRATEGY VALUATION Acquisition multiples are earnings, not revenue, driven and are margin neutral Wholesale firms offer greater earnings stability Retail Firm Wholesale Firm Total revenue $3,000,000 Operating expenses $ (1,500,000) Target Earnings $1,500,000 Margin 50% Percent of earning
Slide 19: Acquisition Strategy: Model
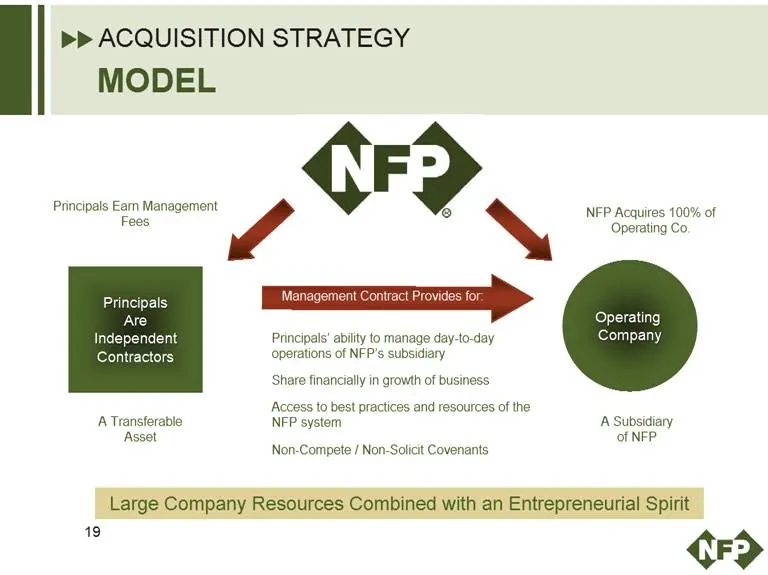
ACQUISITION STRATEGY MODEL Principals Earn Management Fees NFP Acquires 100% of Operating Co. Principals Are Independent Contractors A Transferable Asset Management Contract Provides for: Operating Company A Subsidiary of NFP Principals’ ability to manage day-to-day operations of NFP’s subsidiary Sh
Slide 20: NFP Model: Typical Initial Earnout
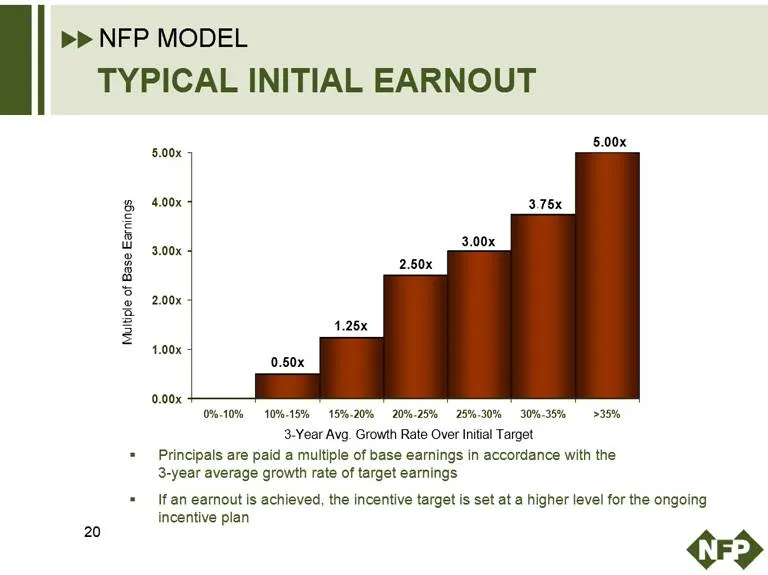
NFP MODEL TYPICAL INITIAL EARNOUT Principals are paid a multiple of base earnings in accordance with the 3-year average growth rate of target earnings If an earnout is achieved, the incentive target is set at a higher level for the ongoing incentive plan Multiple of Base Earnings 0.00x 1.00x 2.00x 3
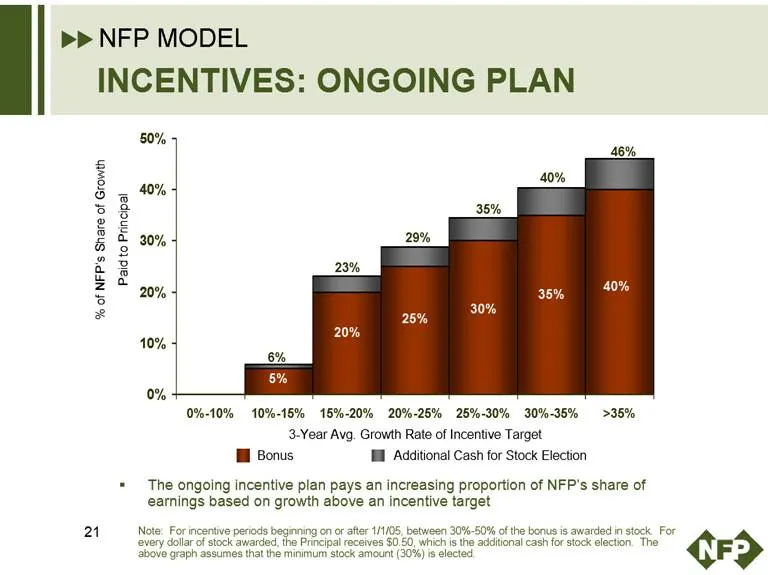
Slide 21: NFP Model: Incentives: Ongoing Plan
NFP MODEL INCENTIVES: ONGOING PLAN % of NFP’s Share of Growth Paid to Principal 0% 10% 20% 30% 40% 50% 3-year Avg. Growth Rate of Incentive Target 5% 6% 20% 23% 25% 29% 30% 35% 35% 40% 40% 46% 0%-10% 10%-15% 15%-20% 20%-25% 25%-30% 30%-35% >35% Bonus Additional Cash for Stock Election The ongoing in
Slide 22: Review Financial Results
REVIEW FINANCIAL RESULTS Mark Biderman, Chief Financial Officer 22
Slide 23: Capital Management Activity: Rationale for Recent Transactions
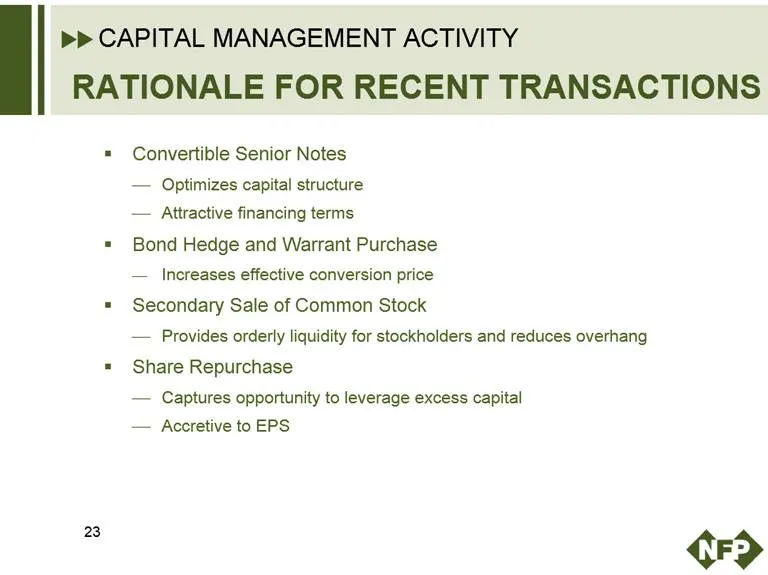
CAPITAL MANAGEMENT ACTIVITY RATIONALE FOR RECENT TRANSACTIONS Convertible Senior Notes Optimizes capital structure Attractive financing terms Bond Hedge and Warrant Purchase Increases effective conversion price Secondary Sale of Common Stock Provides orderly liquidity for stockholders and reduces ov
Slide 24: Capital Management Activity: Sources and Uses
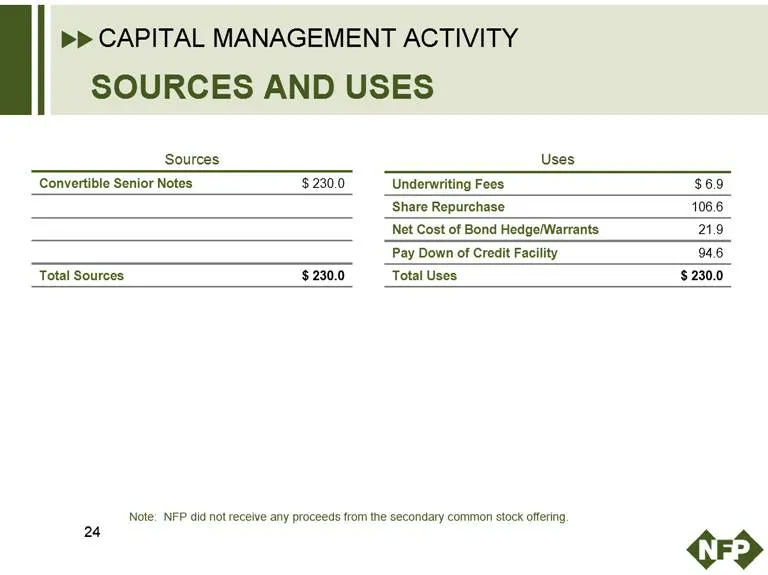
CAPITAL MANAGEMENT ACTIVITY SOURCES AND USES Sources Convertible Senior Notes $ 230.0 Total Sources $ 230.0 Uses Underwriting Fees $ 6.9 Share Repurchase 106.6 Net Cost of Bond Hedge/Warrants 21.9 Pay Down of Credit Facility 94.6 Total Uses $ 230.0 Note: NFP did not receive any proceeds from the sec
Slide 25: Strong Financial Results: Revenue & Gross Margin Growth
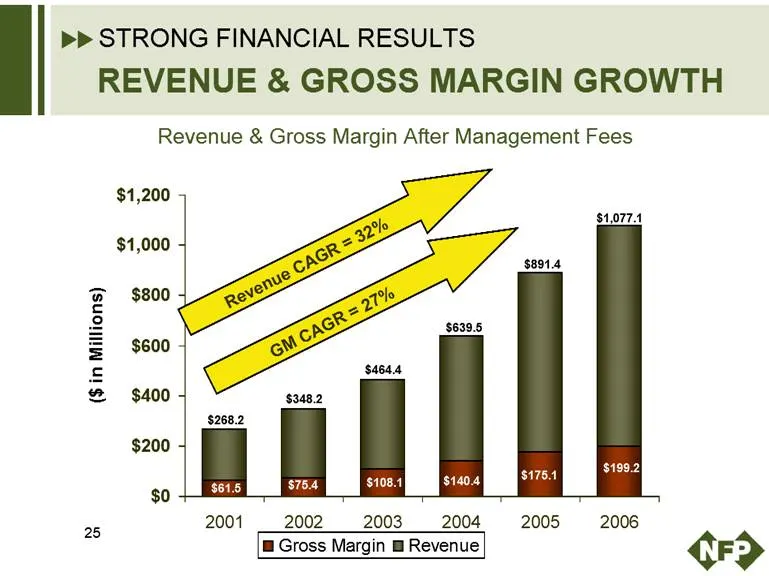
STRONG FINANCIAL RESULTS REVENUE & GROSS MARGIN GROWTH Revenue & Gross Margin After Management Fees Revenue CAGR = 32% GM CAGR = 27% ($ in Millions) $0 $200 $400 $600 $800 $1,000 $1,200 $61.5 $268.2 $75.4 $348.2 $108.1 $464.4 $639.5 $140.4 $175.1 $891.4 $1,077.1, $199.2 2001 2002 2003 2004 2005 2006
Slide 26: Strong Financial Results: Gross Margin Percentage
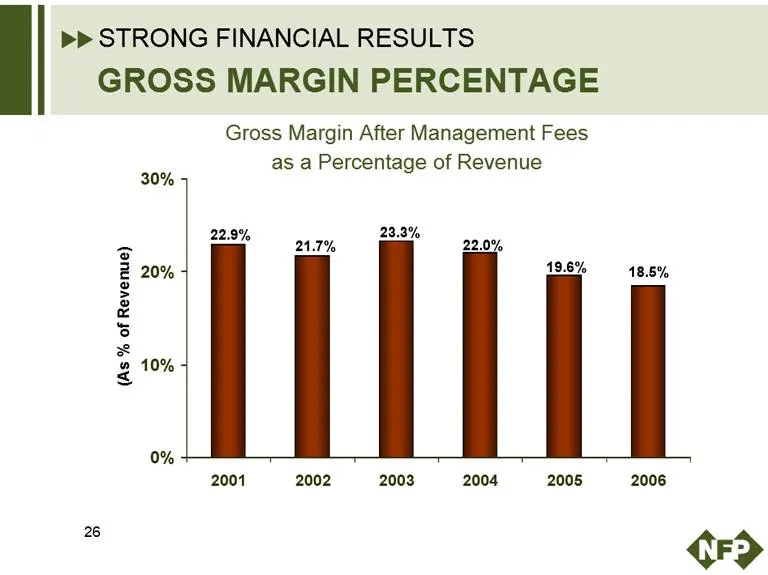
STRONG FINANCIAL RESULTS GROSS MARGIN PERCENTAGE Gross Margin After Management Fees as a Percentage of Revenue (As % of Revenue) 0% 10% 20% 30% 22.9% 21.7% 23.3% 22.0% 19.6% 18.5% 2001 2002 2003 2004 2005 2006 26
Slide 27: Strong Financial Results: Commissions & Fees Expense %
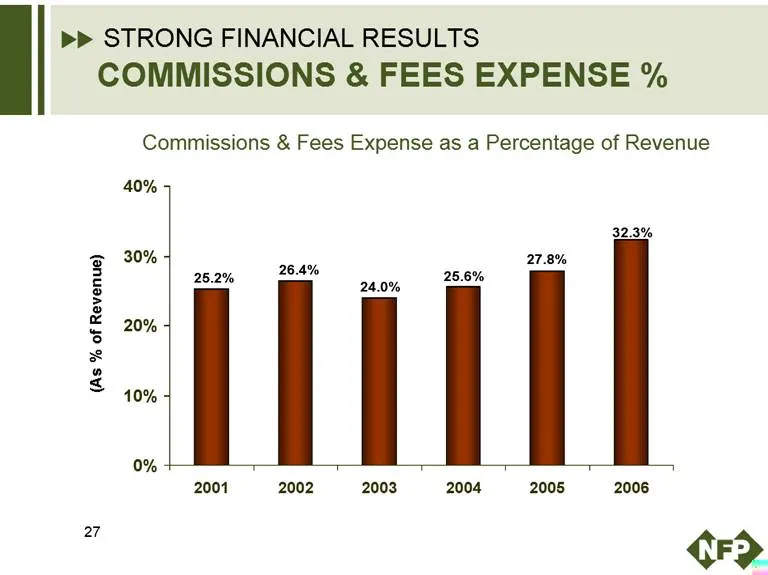
STRONG FINANCIAL RESULTS COMMISSIONS & FEES EXPENSE % Commissions & Fees Expense as a Percentage of Revenue (As % of Revenue) 0% 10% 20% 30% 2001 2002 2003 2004 2005 2006 25.2% 26.4% 24.0% 25.6% 27.8% 32.3% 27
Slide 28: Strong Financial Results: Operating Expense %
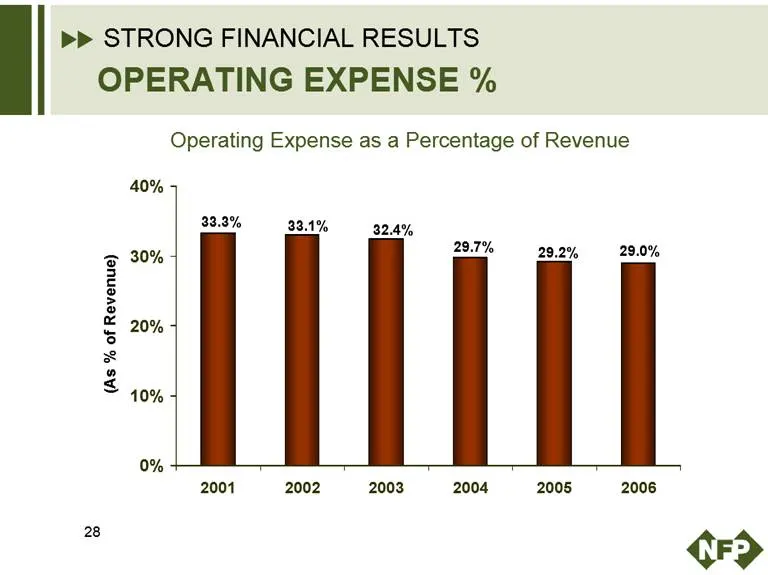
STRONG FINANCIAL RESULTS OPERATING EXPENSE % Operating Expense as a Percentage of Revenue (As % of Revenue) 0% 10% 20% 30% 40% 2001 2002 2003 2004 2005 2006 33.3% 33.1% 32.4% 29.7% 29.2% 29.0% 28
Slide 29: Strong Financial Results: Management Fee Percentage
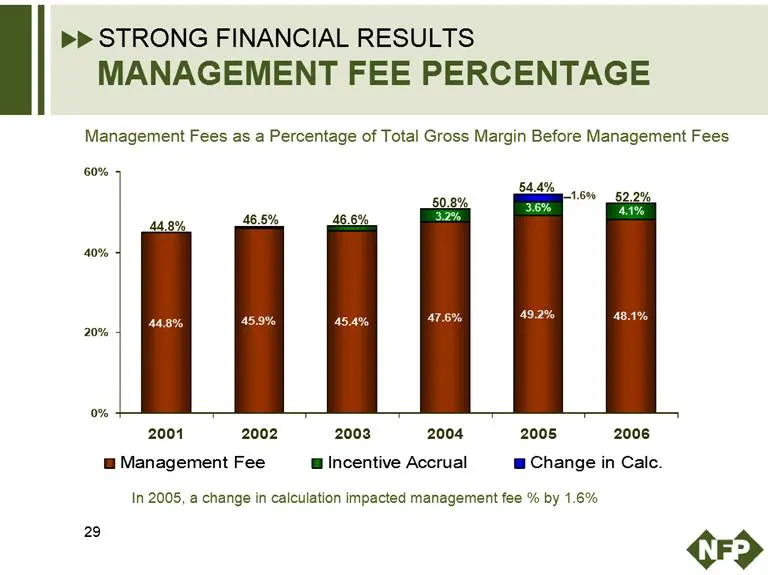
STRONG FINANCIAL RESULTS MANAGEMENT FEE PERCENTAGE Management Fees as a Percentage of Total Gross Margin Before Management Fees 2001 2002 2003 2004 2005 2006 0% 20% 40% 60% 44.8% 44.8% 45.9% 46.5% 46.6% 45.4% 47.6% 3.2% 50.8% 49.2% 3.6% 1.6% 54.4% 48.1% 4.1% 52.2% Management Fee Incentive Accrual Ch
Slide 30: Strong Financial Results: Management Fee Percentage Example
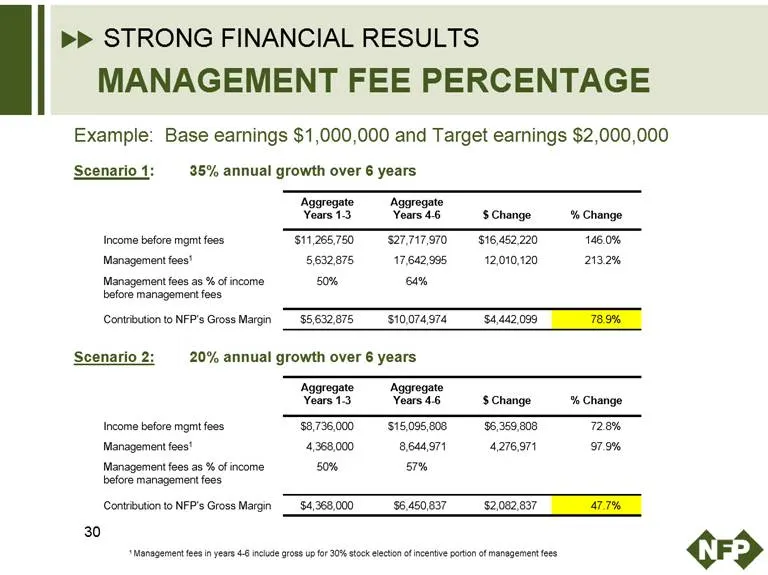
STRONG FINANCIAL RESULTS MANAGEMENT FEE PERCENTAGE Example: Base earnings $1,000,000 and Target earnings $2,000,000 Scenario 1: 35% annual growth over 6 years Aggregate Years 1-3 Aggregate Years 4-6 $ Change % Change Income before mgmt fees $11,265,750 $27,717,970 $16,452,220 146.0% Management fees1
Slide 31: Strong Financial Results: Cash Earnings Growth
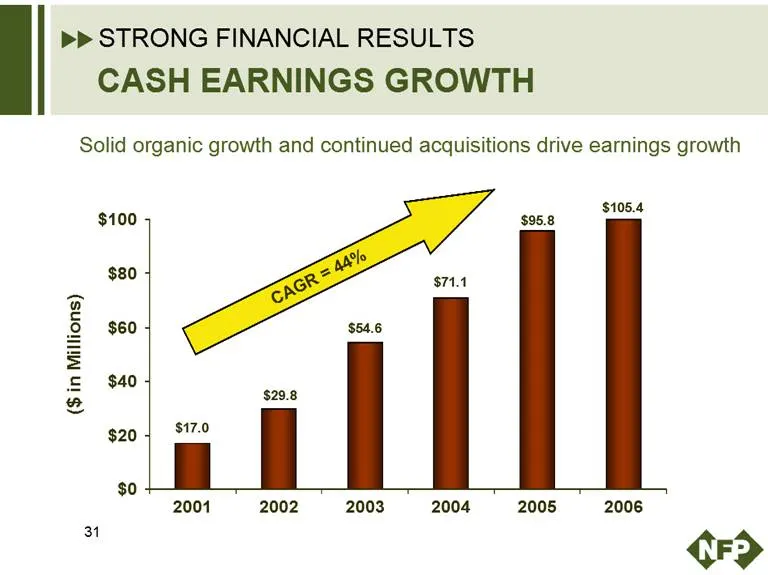
STRONG FINANCIAL RESULTS CASH EARNINGS GROWTH Solid organic growth and continued acquisitions drive earnings growth ($ in Millions) CAGR=44% $0 $20 $40 $60 $80 $100 $17.0 $29.8 $54.6 $71.1 $95.8 $105.4 2001 2002 2003 2004 2005 2006 31
Slide 32: The Future of NFP: Foundation for Future
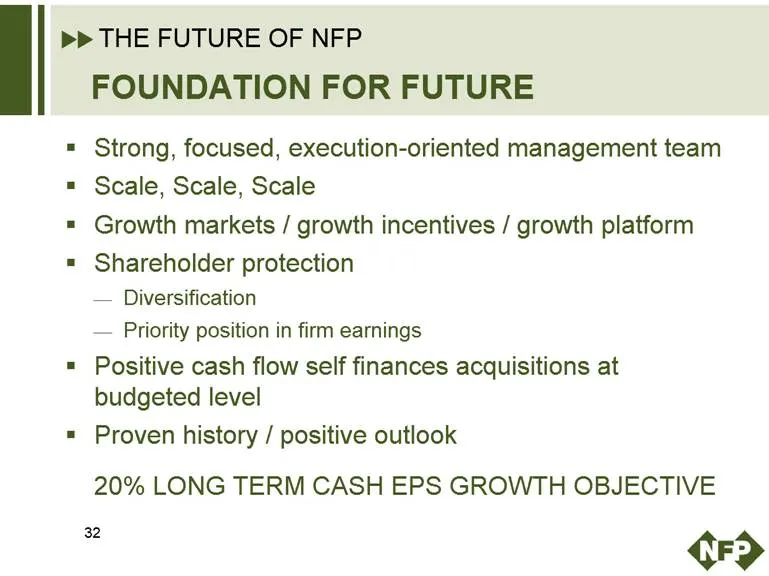
THE FUTURE OF NFP FOUNDATION FOR FUTURE Strong, focused, execution-oriented management team Scale, Scale, Scale Growth markets / growth incentives / growth platform Shareholder protection Diversification Priority position in firm earnings Positive cash flow self finances acquisitions at budgeted lev

Slide 33: National Financial Partners
Cro NATIONAL FINANCIAL PARTNERS
Source: SEC EDGAR · 8-K filed Feb 15, 2007
More decks from National Financial Partners Corp
 Q4 2012 Earnings Presentation19 slides · Feb 15, 2013
 Q3 2012 Earnings Presentation18 slides · Oct 31, 2012
 Q2 2012 Earnings Presentation19 slides · Jul 31, 2012
 Q1 2012 Earnings Presentation19 slides · Apr 27, 2012
 Q4 2011 Earnings Presentation18 slides · Feb 8, 2012
 Q3 2011 Earnings Presentation19 slides · Oct 28, 2011