South Jersey Industries — Q3 2019 Earnings Presentation
14 slides from South Jersey Industries's earnings presentation, Nov 6, 2019

Slide 1: Third Quarter 2019 Earnings Presentation
Third Quarter 2019 Earnings Presentation November 7, 2019
Slide 2: Forward-Looking Statements and Use of Non-GAAP Measures
Forward-Looking Statements and Use of Non-GAAP Measures Certain statements contained in this presentation may qualify as “forward-looking statements” within the meaning of Section 27A of the Securities Act of 1933 and Section 21E of the Securities Exchange Act of 1934. All statements other than stat
Slide 3: Financial Performance | 3Q'19 Summary
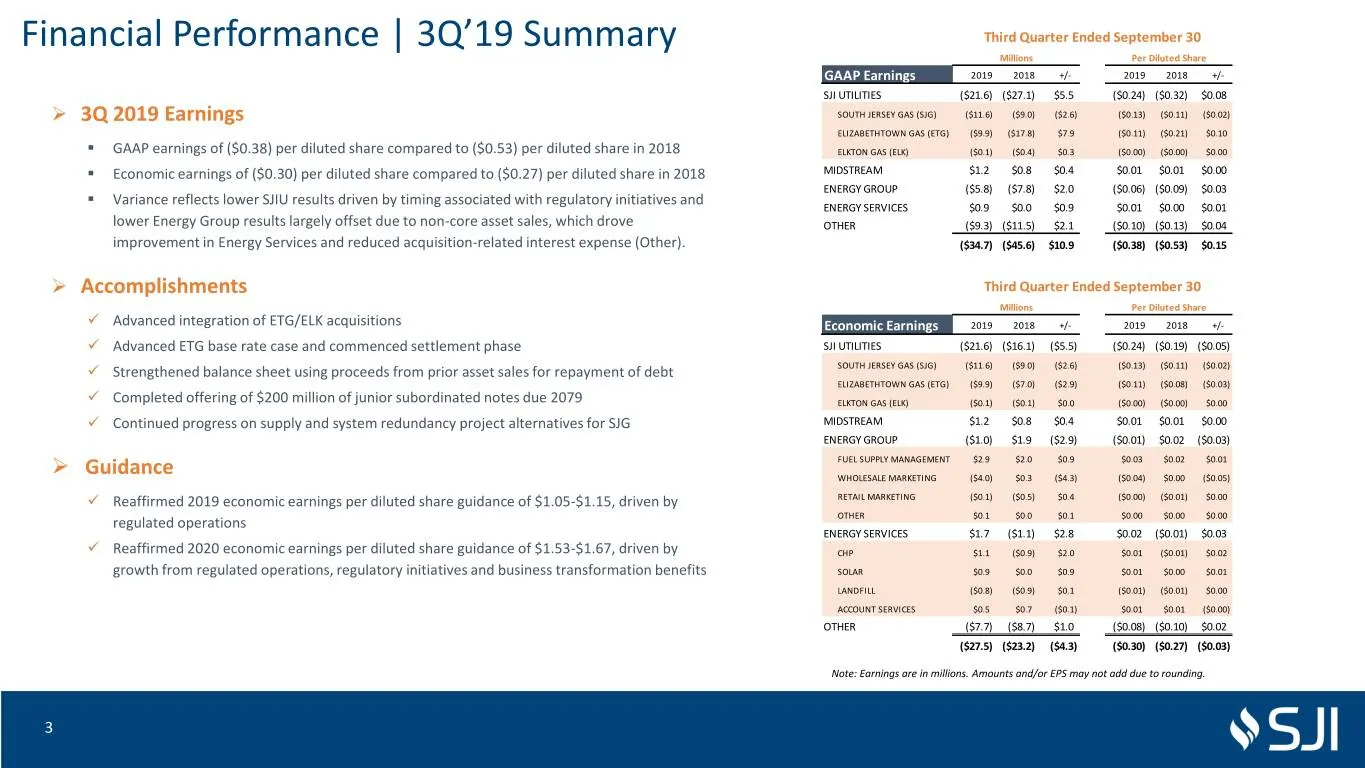
Financial Performance | 3Q’19 Summary Third Quarter Ended September 30 Millions Per Diluted Share GAAP Earnings 2019 2018 +/- 2019 2018 +/- SJI UTILITIES ($21.6) ($27.1) $5.5 ($0.24) ($0.32) $0.08 ➢ 3Q 2019 Earnings SOUTH JERSEY GAS (SJG) ($11.6) ($9.0) ($2.6) ($0.13) ($0.11) ($0.02) ELIZABETHTOWN G
Slide 4: Economic Earnings Bridge | Q3'18 to Q3'19
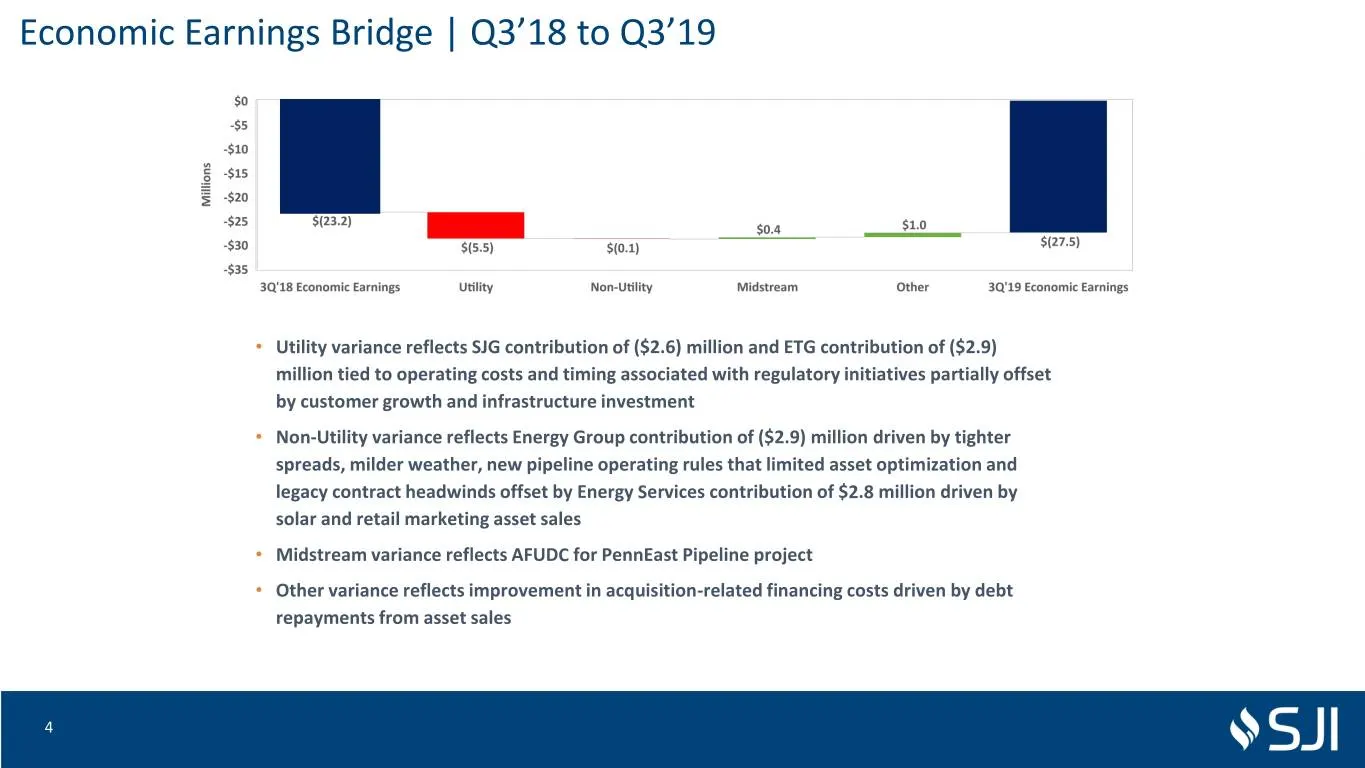
Economic Earnings Bridge | Q3’18 to Q3’19 • Utility variance reflects SJG contribution of ($2.6) million and ETG contribution of ($2.9) million tied to operating costs and timing associated with regulatory initiatives partially offset by customer growth and infrastructure investment • Non-Utility va
Slide 5: Financial Performance | YTD'19 Summary
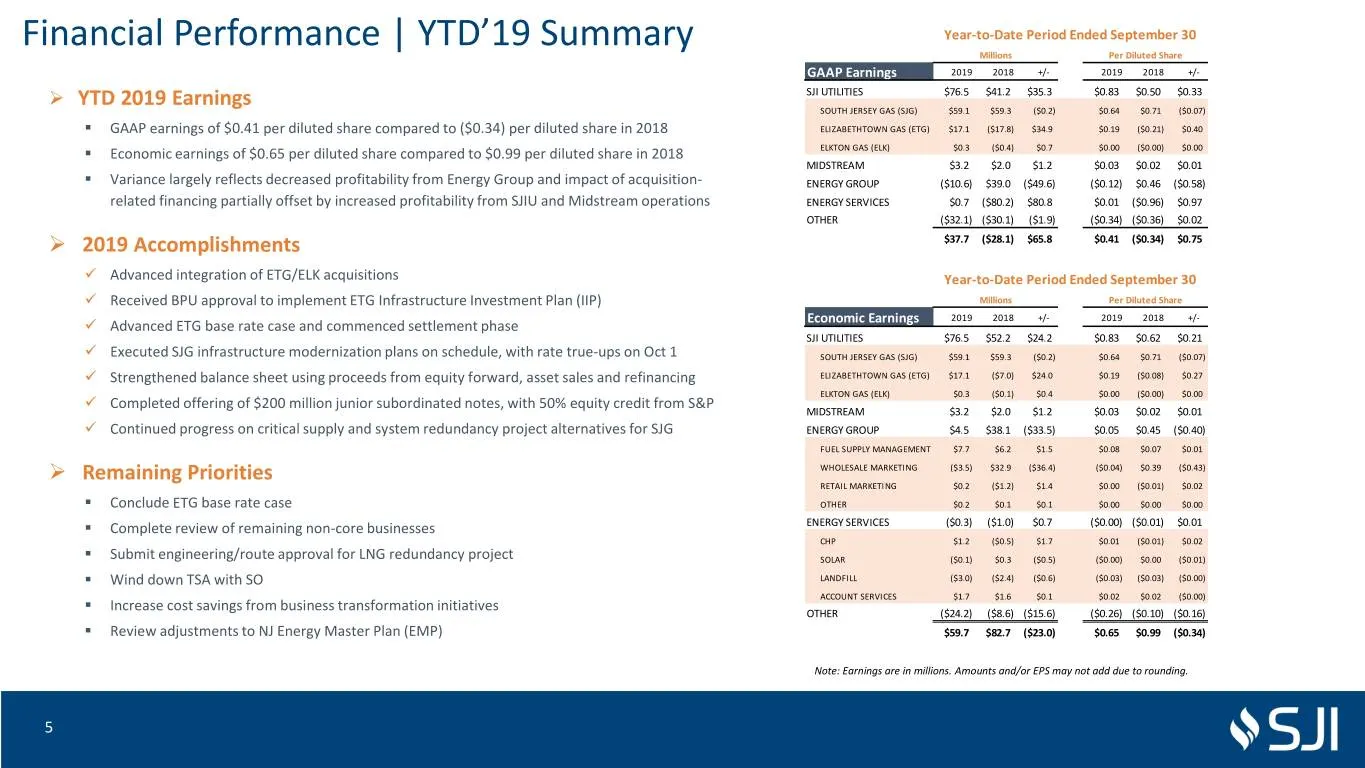
Financial Performance | YTD’19 Summary Year-to-Date Period Ended September 30 Millions Per Diluted Share GAAP Earnings 2019 2018 +/- 2019 2018 +/- ➢ YTD 2019 Earnings SJI UTILITIES $76.5 $41.2 $35.3 $0.83 $0.50 $0.33 SOUTH JERSEY GAS (SJG) $59.1 $59.3 ($0.2) $0.64 $0.71 ($0.07) ▪ GAAP earnings of $0
Slide 6: Economic Earnings Bridge | YTD'18 to YTD'19
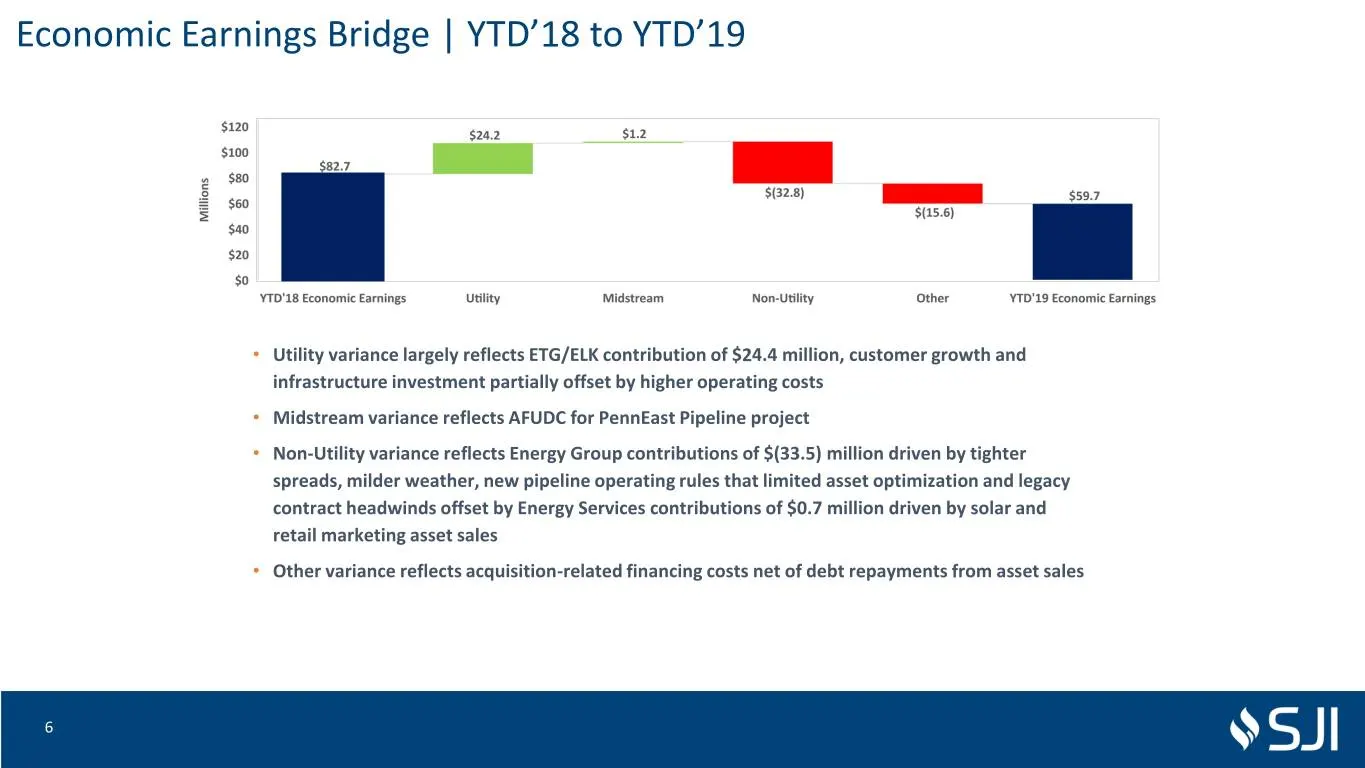
Economic Earnings Bridge | YTD’18 to YTD’19 • Utility variance largely reflects ETG/ELK contribution of $24.4 million, customer growth and infrastructure investment partially offset by higher operating costs • Midstream variance reflects AFUDC for PennEast Pipeline project • Non-Utility variance ref
Slide 7: Regulatory Initiatives | ETG Base Rate Case
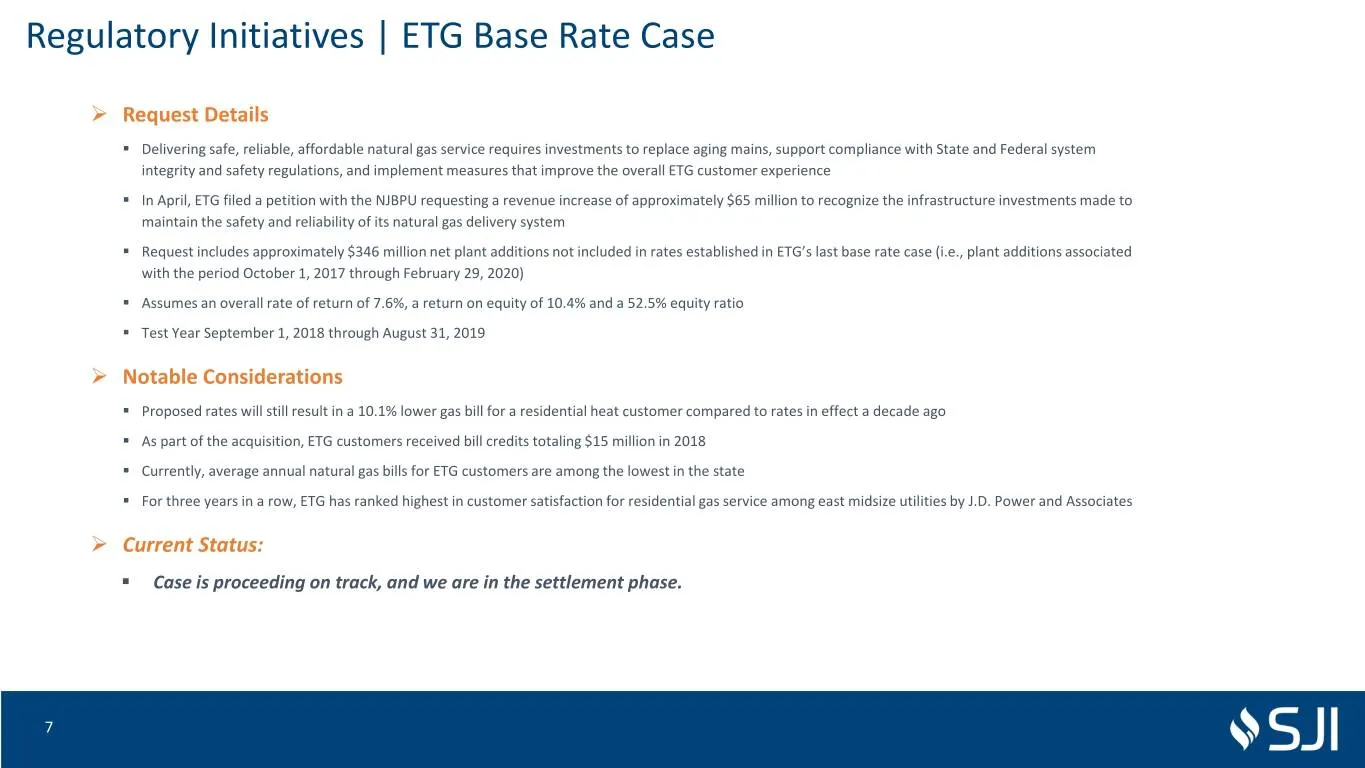
Regulatory Initiatives | ETG Base Rate Case ➢ Request Details ▪ Delivering safe, reliable, affordable natural gas service requires investments to replace aging mains, support compliance with State and Federal system integrity and safety regulations, and implement measures that improve the overall ET
Slide 8: Regulatory Initiatives | 2019/2020
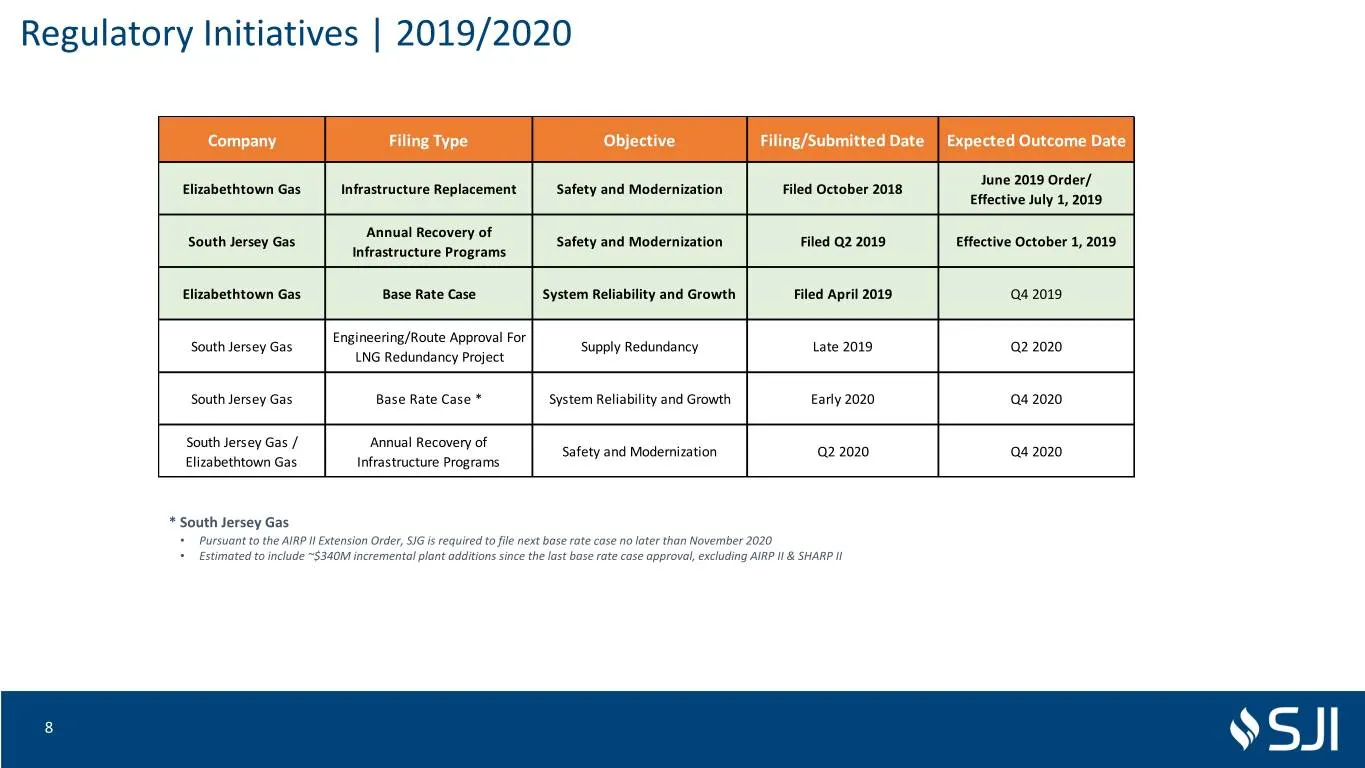
Regulatory Initiatives | 2019/2020 Company Filing Type Objective Filing/Submitted Date Expected Outcome Date June 2019 Order/ Elizabethtown Gas Infrastructure Replacement Safety and Modernization Filed October 2018 Effective July 1, 2019 Annual Recovery of South Jersey Gas Safety and Modernization F
Slide 9: Midstream | PennEast Pipeline
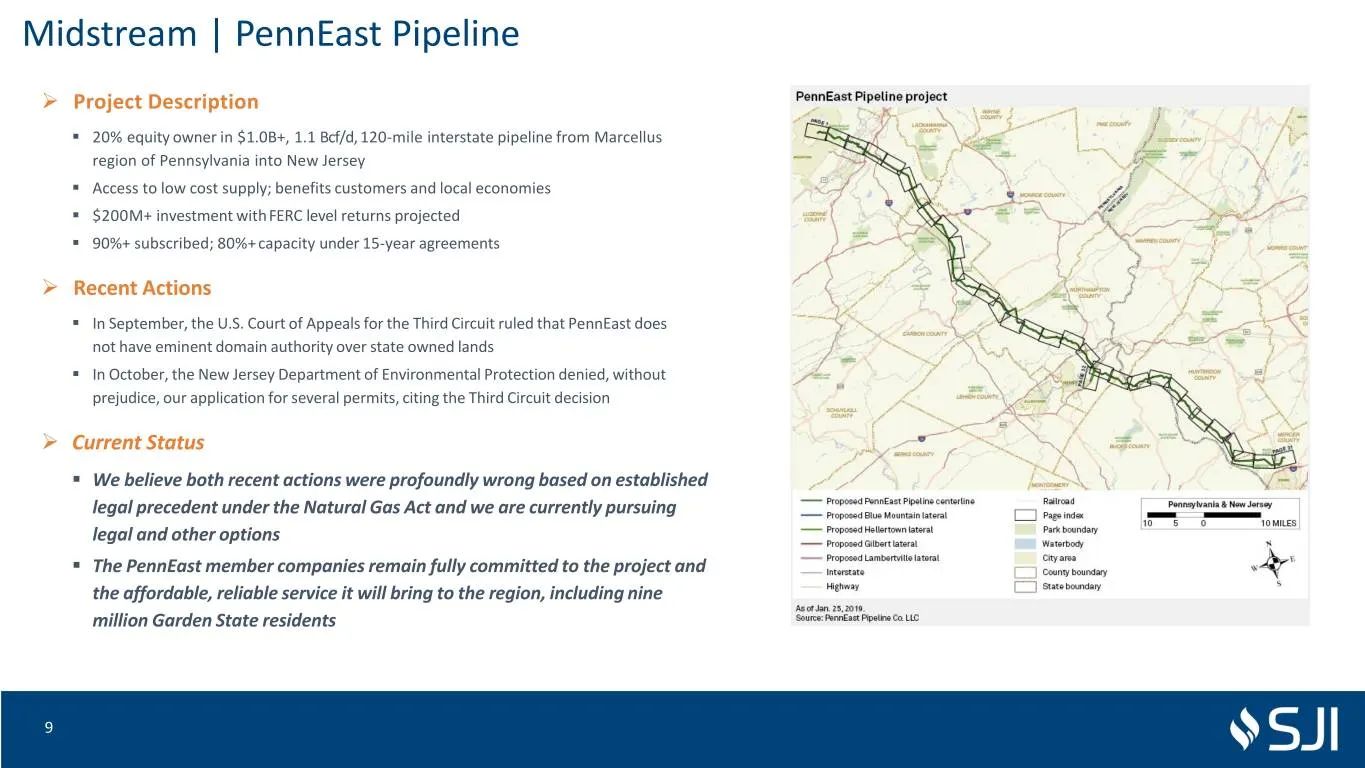
Midstream | PennEast Pipeline ➢ Project Description ▪ 20% equity owner in $1.0B+, 1.1 Bcf/d, 120-mile interstate pipeline from Marcellus region of Pennsylvania into New Jersey ▪ Access to low cost supply; benefits customers and local economies ▪ $200M+ investment withFERC level returns projected ▪ 9
Slide 10: Financial Guidance | Reaffirmed 2019 Guidance
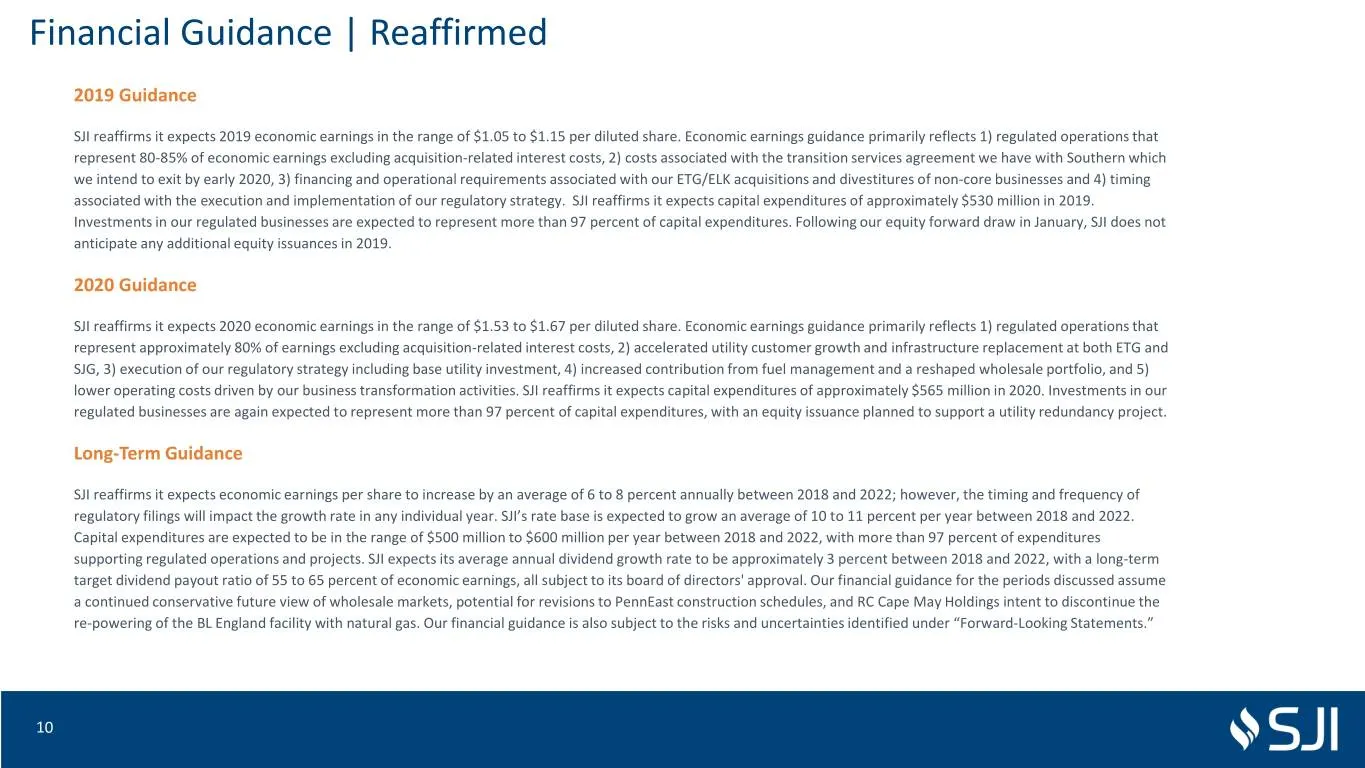
Financial Guidance | Reaffirmed 2019 Guidance SJI reaffirms it expects 2019 economic earnings in the range of $1.05 to $1.15 per diluted share. Economic earnings guidance primarily reflects 1) regulated operations that represent 80-85% of economic earnings excluding acquisition-related interest cost
Slide 11: Guidance | Economic Earnings Bridge - 2018 to 2019 Midpoints
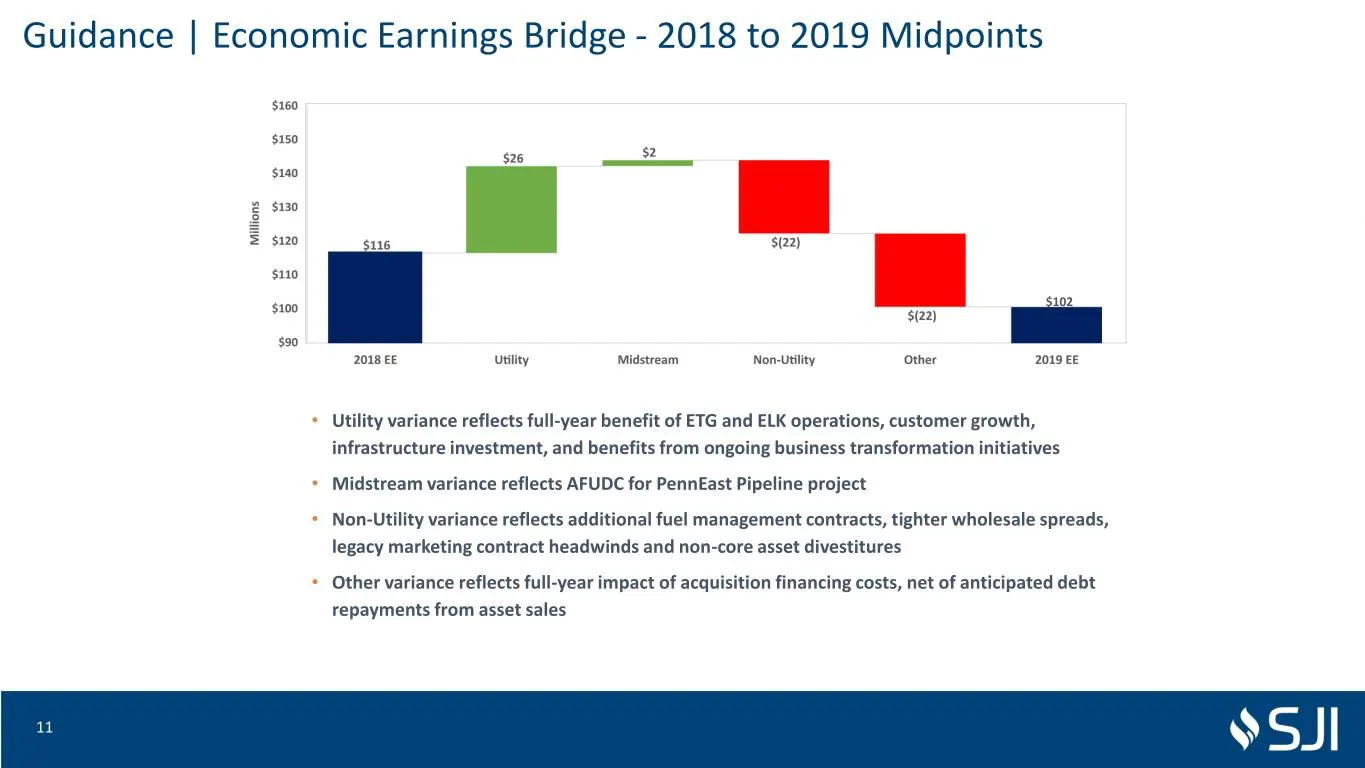
Guidance | Economic Earnings Bridge - 2018 to 2019 Midpoints $102 • Utility variance reflects full-year benefit of ETG and ELK operations, customer growth, infrastructure investment, and benefits from ongoing business transformation initiatives • Midstream variance reflects AFUDC for PennEast Pipeli
Slide 12: Guidance | Economic Earnings Bridge - 2019 to 2020 Midpoints
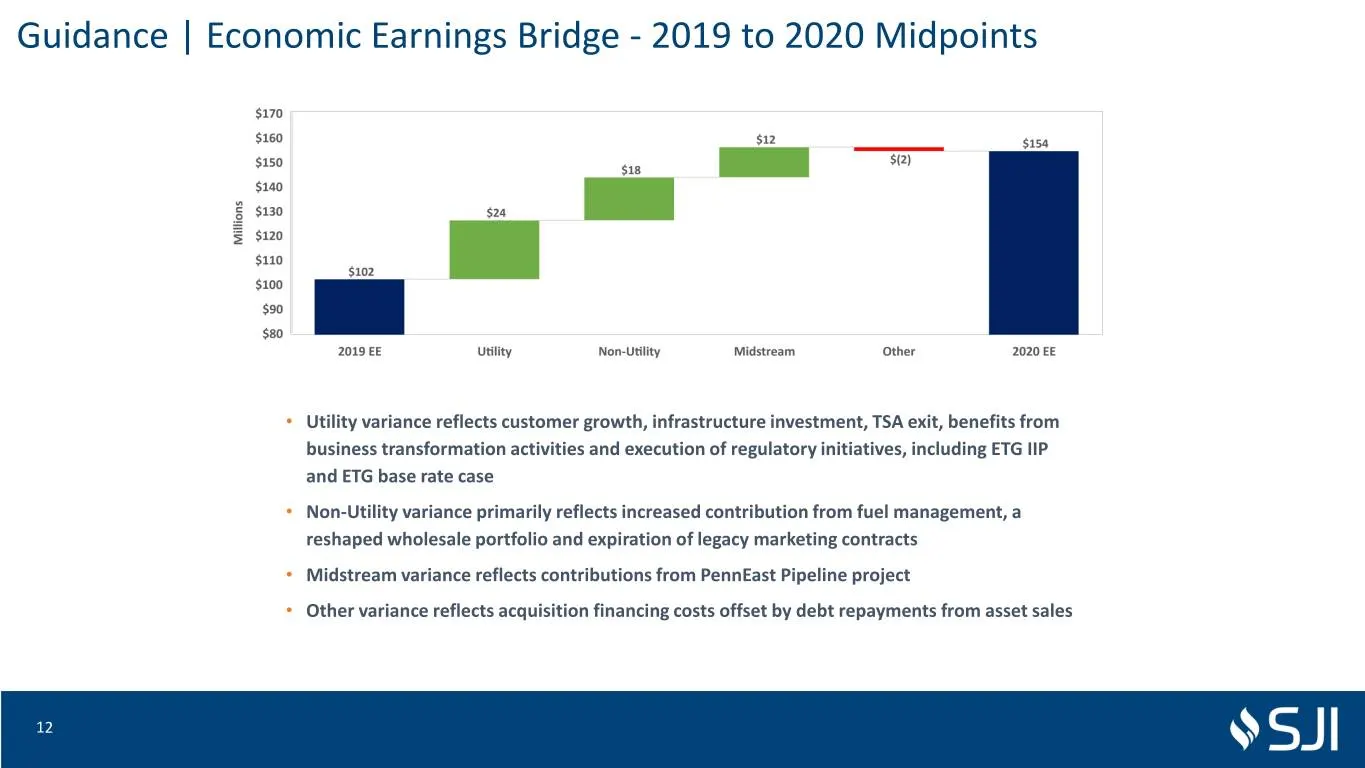
Guidance | Economic Earnings Bridge - 2019 to 2020 Midpoints • Utility variance reflects customer growth, infrastructure investment, TSA exit, benefits from business transformation activities and execution of regulatory initiatives, including ETG IIP and ETG base rate case • Non-Utility variance pri
Slide 13: Non-GAAP Financial Measures
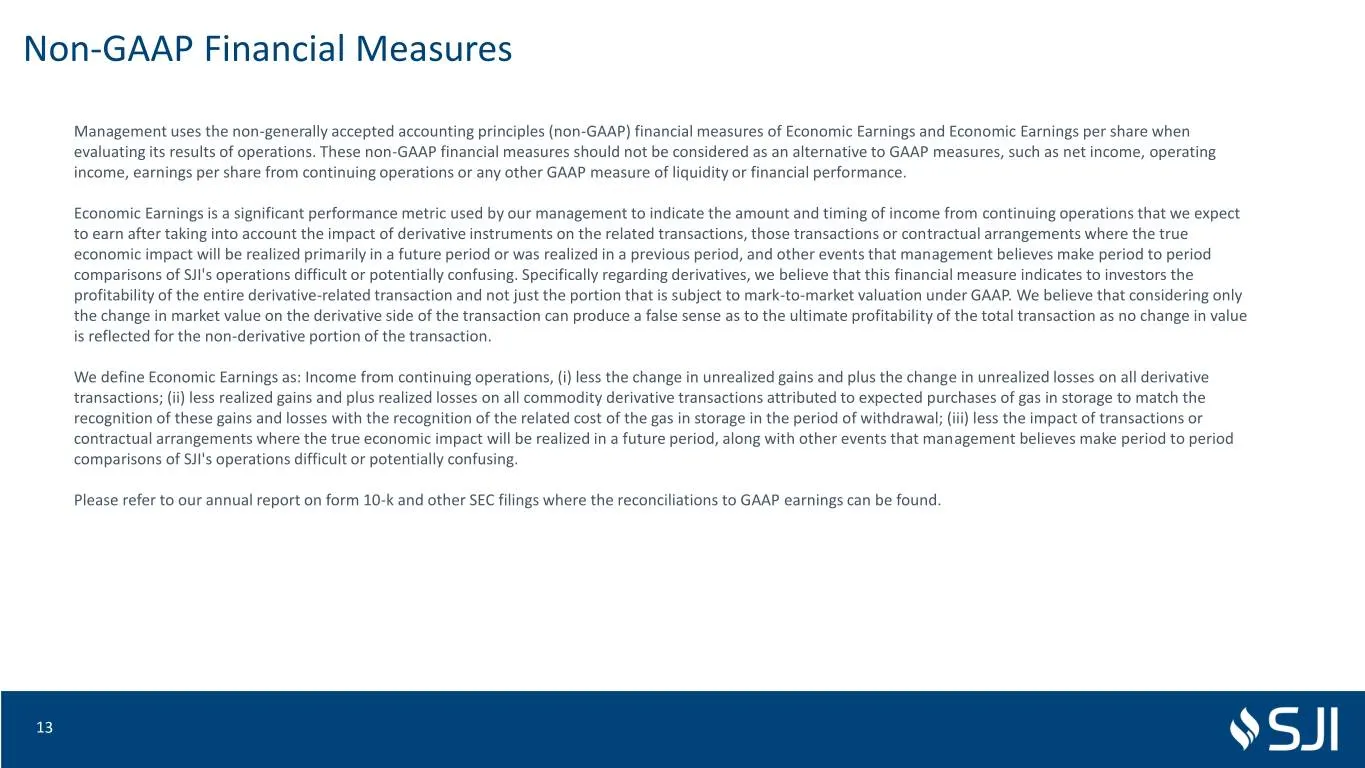
Non-GAAP Financial Measures Management uses the non-generally accepted accounting principles (non-GAAP) financial measures of Economic Earnings and Economic Earnings per share when evaluating its results of operations. These non-GAAP financial measures should not be considered as an alternative to G

Slide 14
Source: SEC EDGAR · 8-K filed Nov 6, 2019
More decks from South Jersey Industries Inc
 FY2021 Earnings Presentation29 slides · Feb 24, 2022
 Q3 2021 Earnings Presentation31 slides · Nov 3, 2021
 Q2 2021 Earnings Presentation31 slides · Aug 4, 2021
 Investor Day (May 2021)88 slides · May 6, 2021
 FY2020 Earnings Presentation31 slides · Feb 24, 2021
 Q3 2020 Earnings Presentation37 slides · Nov 4, 2020