Vishay Precision Group, Inc. · NYSE:VPG
Vishay Precision — Q3 2026 Earnings Presentation
19 slides from Vishay Precision's earnings presentation, Nov 4, 2026

Slide 1: 3Q26 Earnings Call
3Q26 Earnings Call November 4, 2026
Slide 2: Safe Harbor Statement
SAFE HARBOR STATEMENT From time to time, information provided by us, including, but not limited to, statements in this presentation, or other statements made by or on our behalf, may contain or constitute "forward-looking" information within the meaning of the Private Securities Litigation Reform Ac
Slide 3: 2026 IEEPA Tariff Refunds to Customers
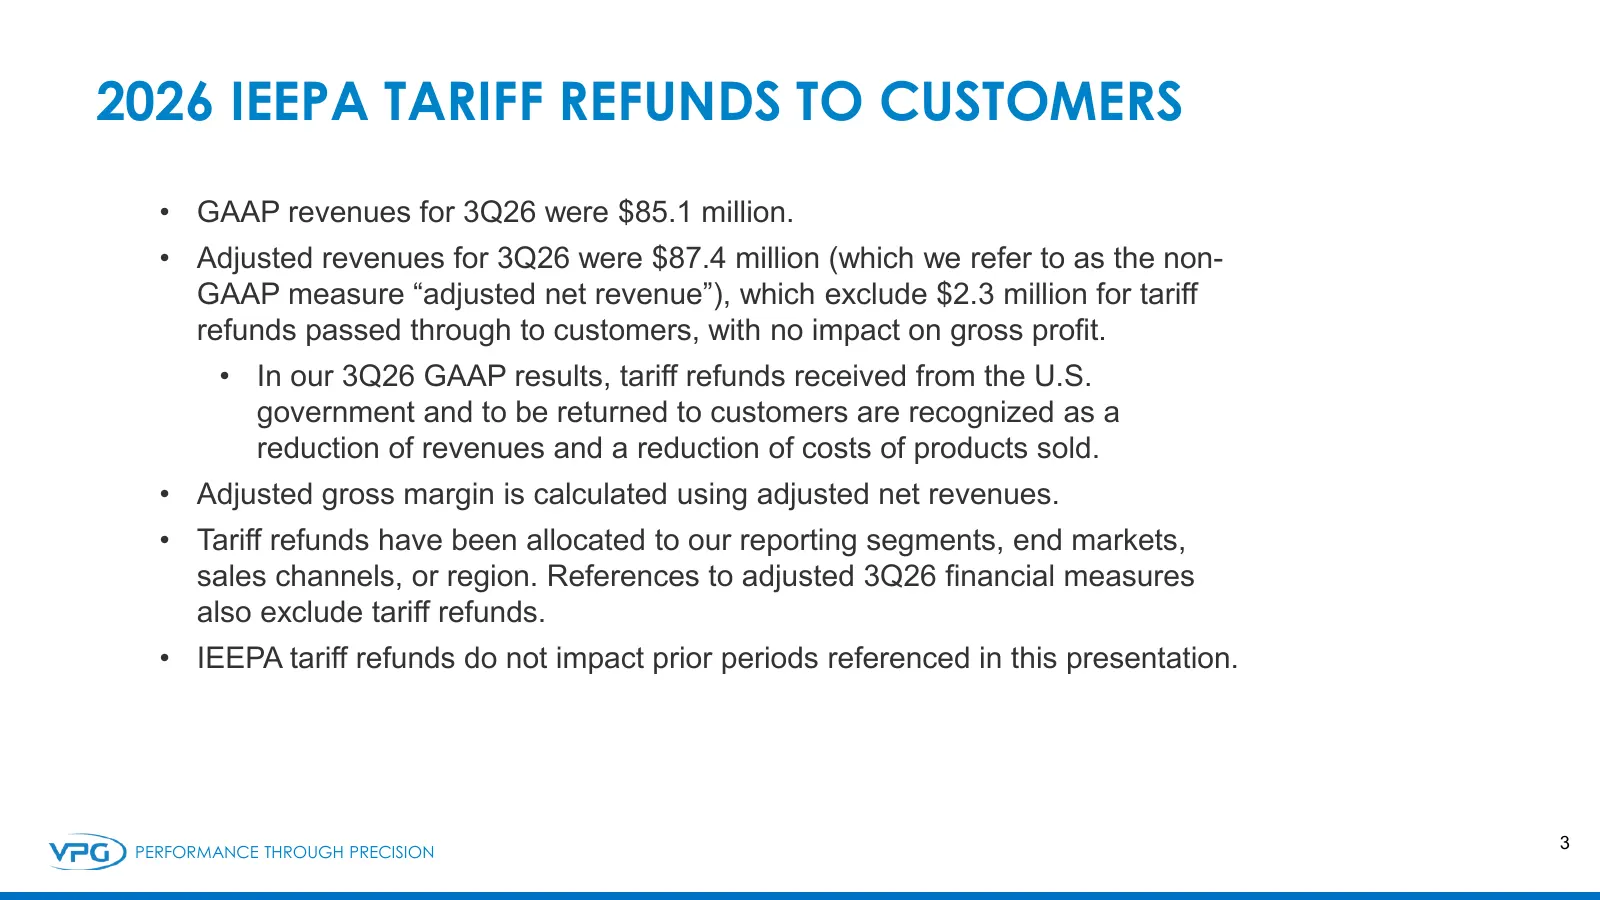
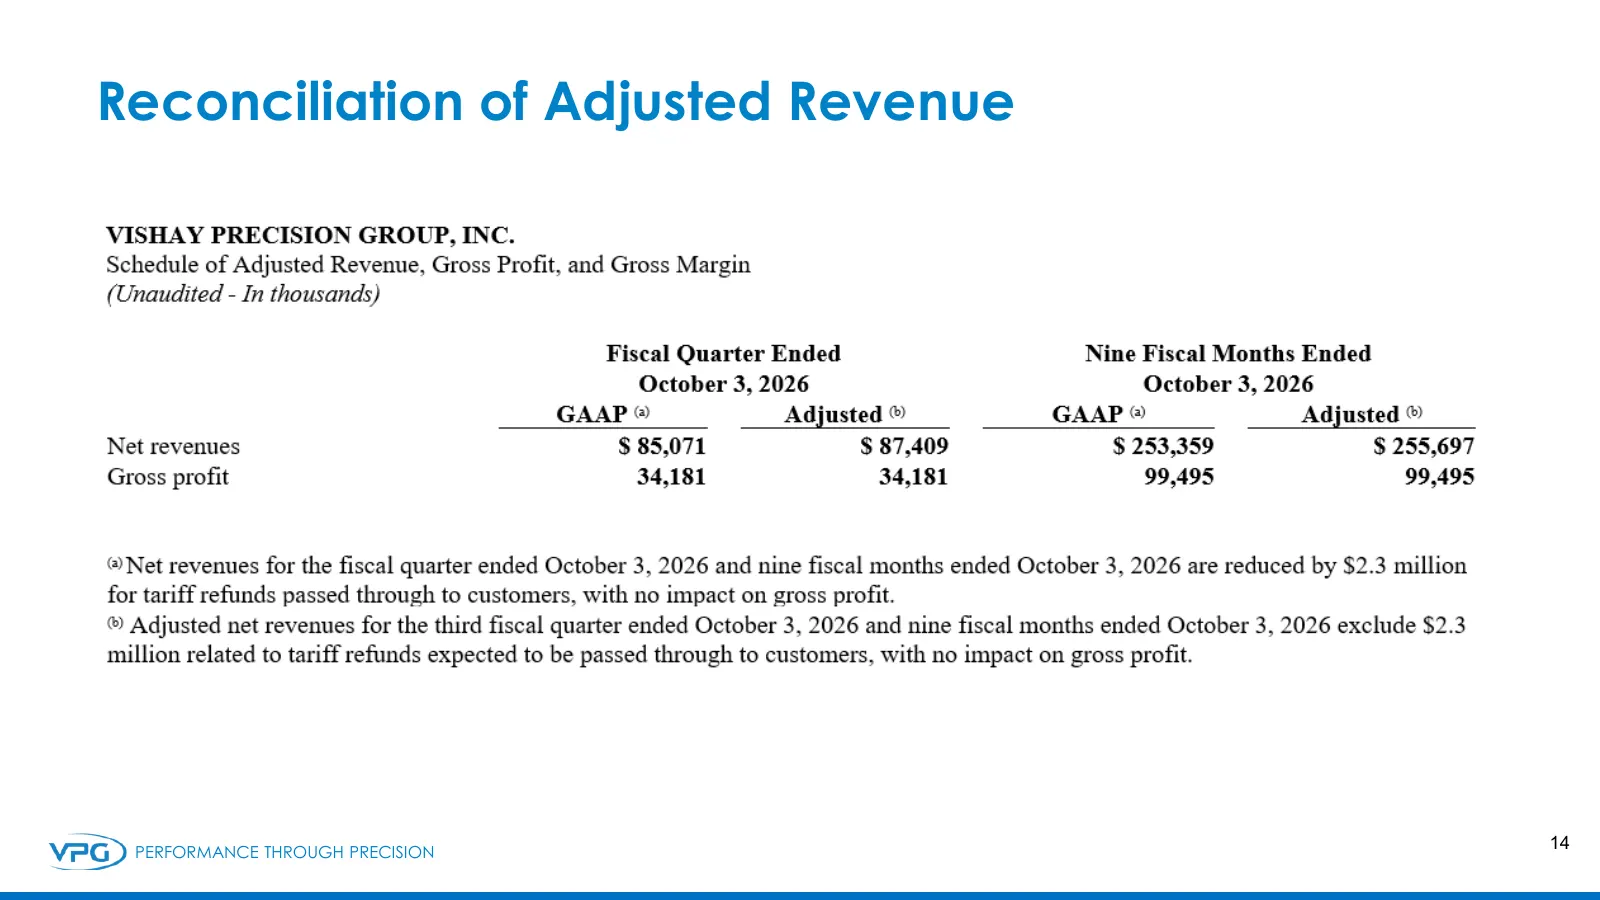
2026 IEEPA TARIFF REFUNDS TO CUSTOMERS • GAAP revenues for 3Q26 were $85.1 million. • Adjusted revenues for 3Q26 were $87.4 million (which we refer to as the non- GAAP measure “adjusted net revenue”), which exclude $2.3 million for tariff refunds passed through to customers, with no impact on gross
Slide 4: Fiscal Third Quarter 2026 Highlights
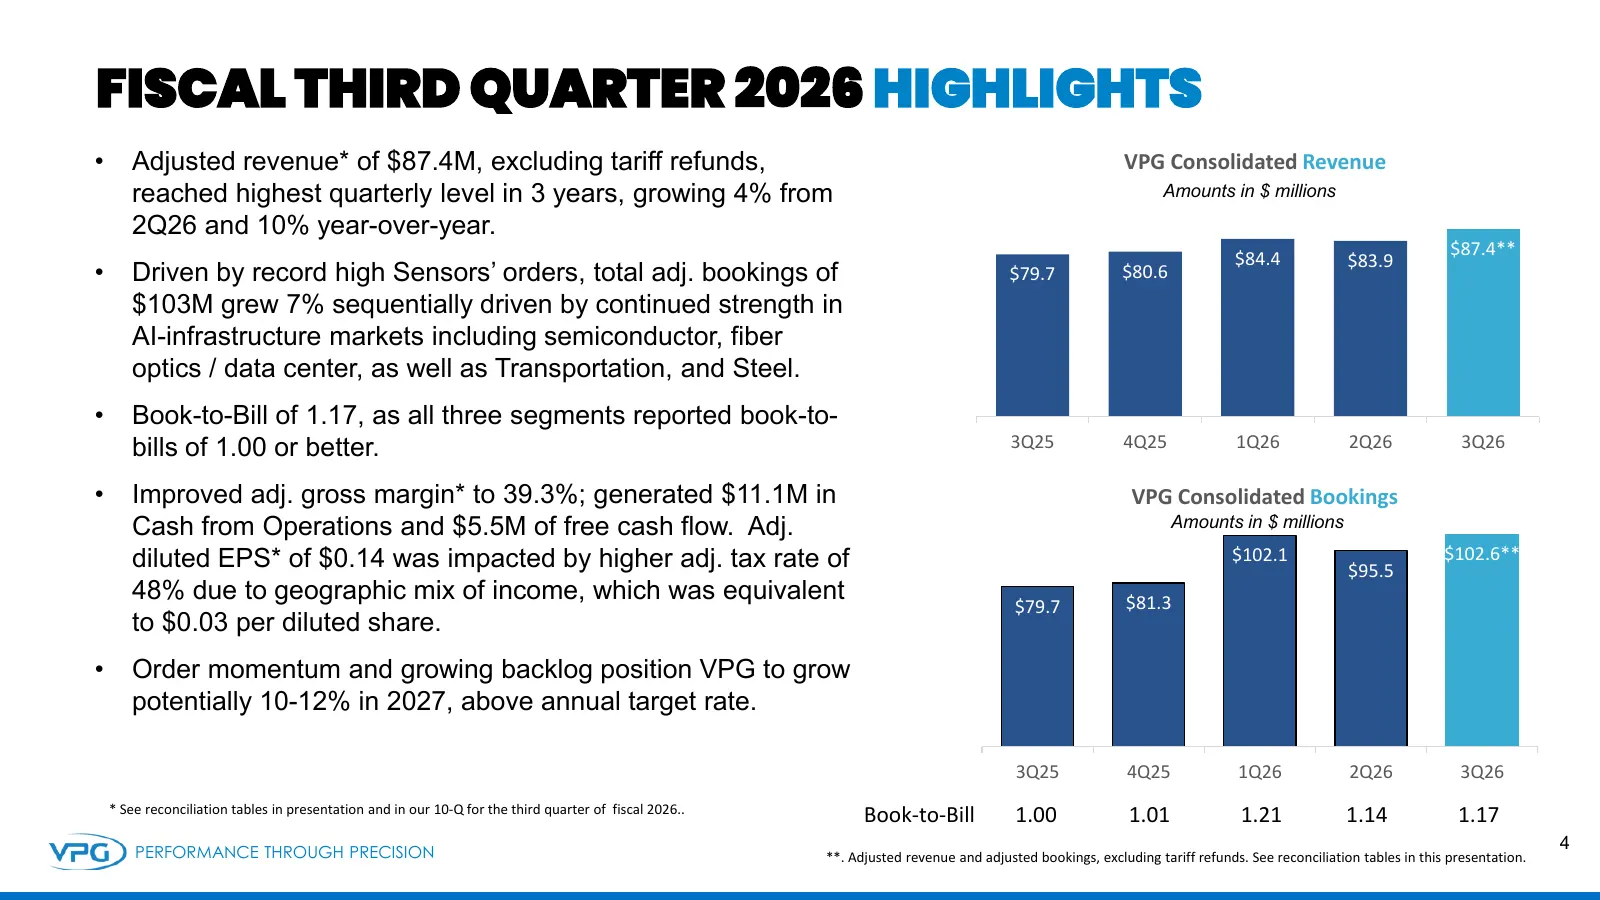
FISCAL THIRD QUARTER 2026 HIGHLIGHTS • Adjusted revenue* of $87.4M, excluding tariff refunds, VPG Consolidated Revenue reached highest quarterly level in 3 years, growing 4% from Amounts in $ millions 2Q26 and 10% year-over-year. $84.4 $87.4** $83.9 • Driven by record high Sensors’ orders, total adj
Slide 5: Sensors – Sales & Bookings
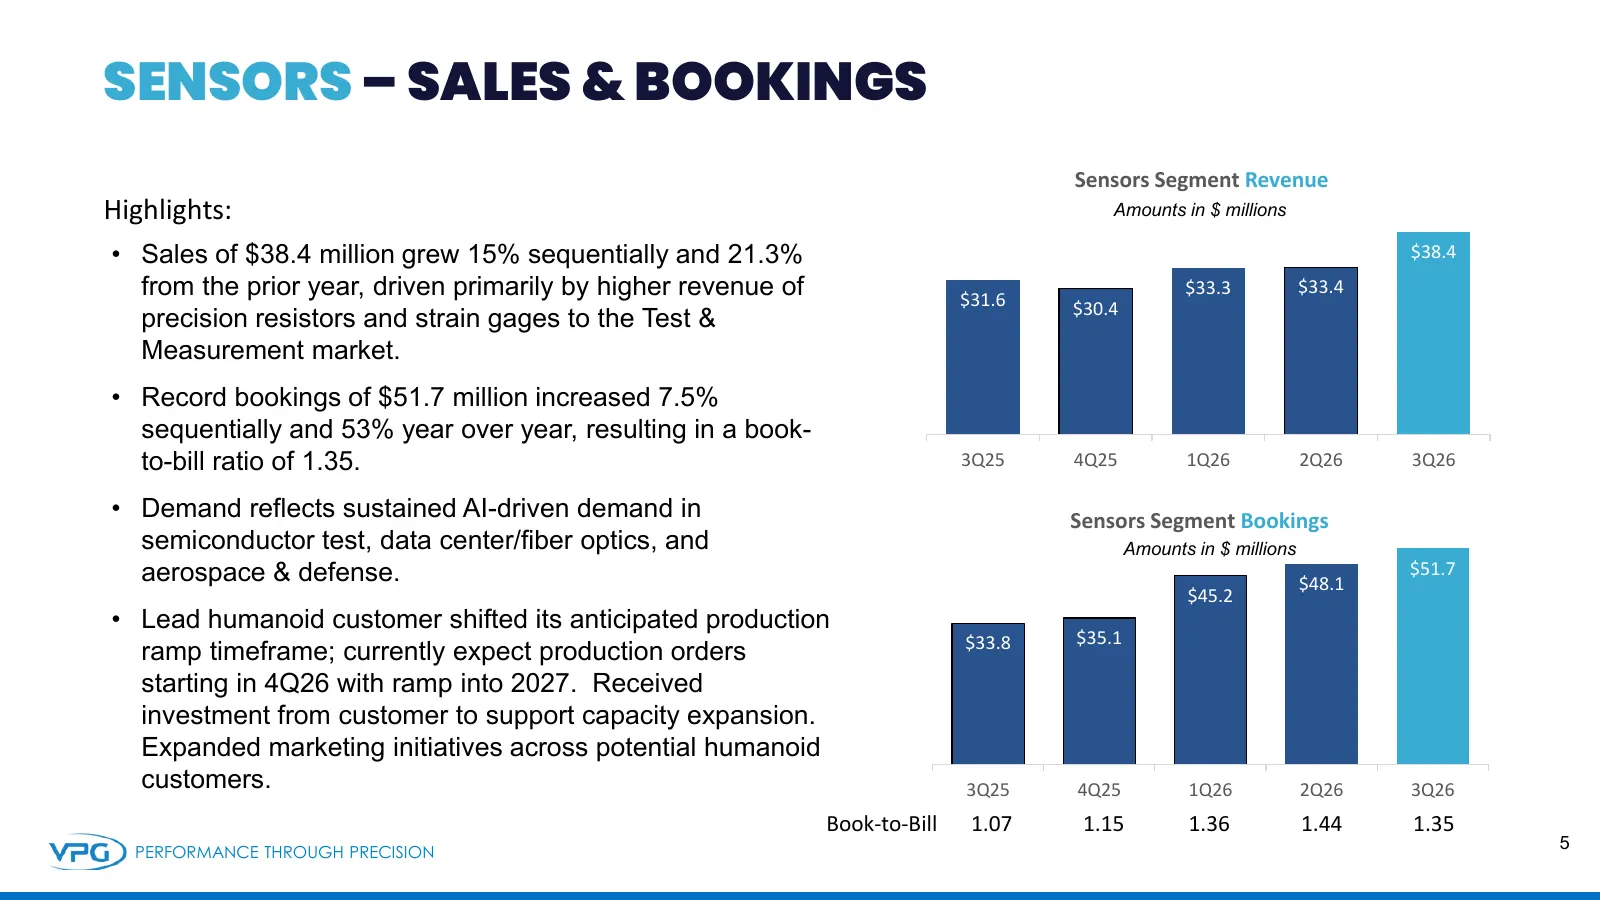
SENSORS – SALES & BOOKINGS Sensors Segment Revenue Highlights: Amounts in $ millions • Sales of $38.4 million grew 15% sequentially and 21.3% $38.4 from the prior year, driven primarily by higher revenue of $31.6 $33.3 $33.4 $30.4 precision resistors and strain gages to the Test & Measurement market
Slide 6: Weighing Solutions – Sales & Bookings
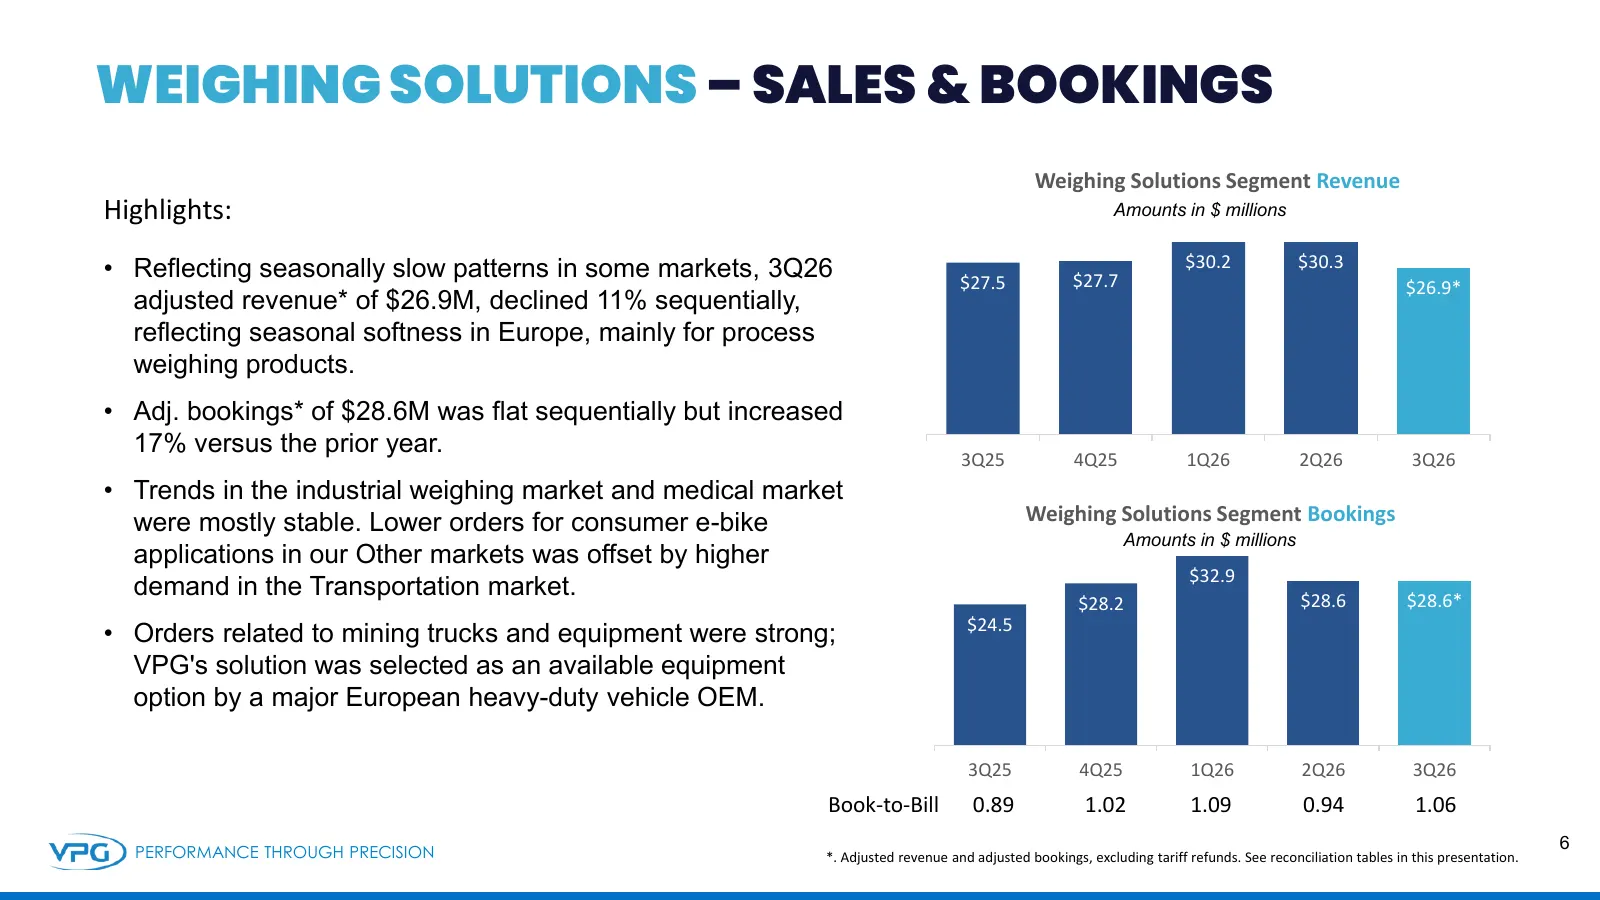
WEIGHING SOLUTIONS – SALES & BOOKINGS Weighing Solutions Segment Revenue Highlights: Amounts in $ millions • Reflecting seasonally slow patterns in some markets, 3Q26 $27.5 $27.7 $30.2 $30.3 $26.9* adjusted revenue* of $26.9M, declined 11% sequentially, reflecting seasonal softness in Europe, mainly
Slide 7: Measurement Systems – Sales & Bookings
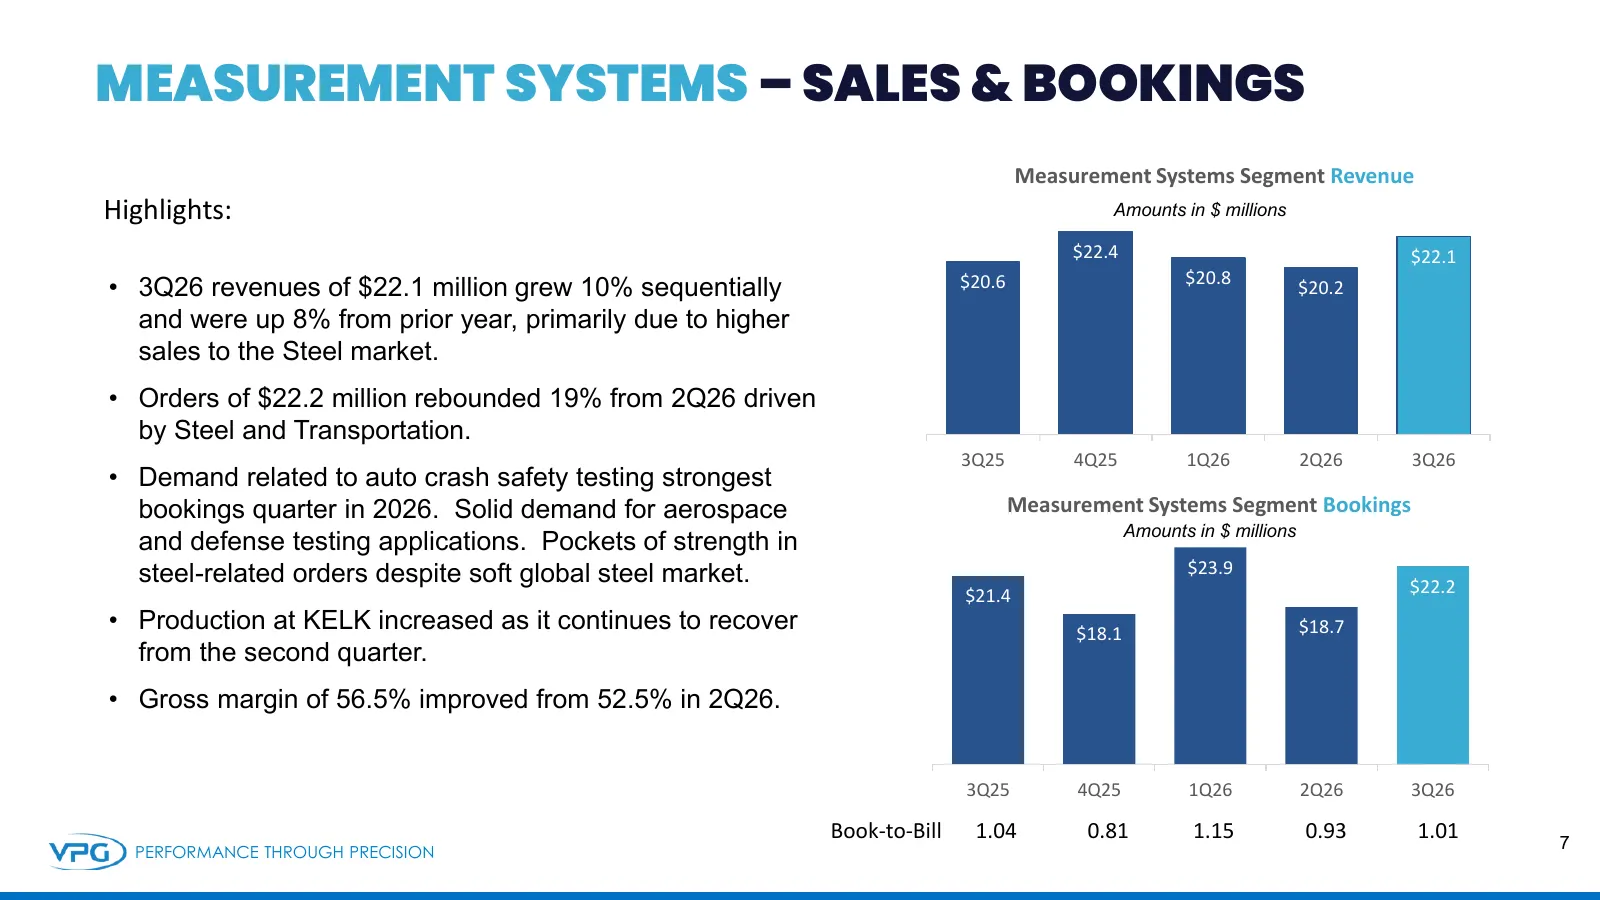
MEASUREMENT SYSTEMS – SALES & BOOKINGS Measurement Systems Segment Revenue Highlights: Amounts in $ millions $22.4 $22.1 $20.8 • 3Q26 revenues of $22.1 million grew 10% sequentially $20.6 $20.2 and were up 8% from prior year, primarily due to higher sales to the Steel market. • Orders of $22.2 milli
Slide 8: Update - VPG's Key Priorities
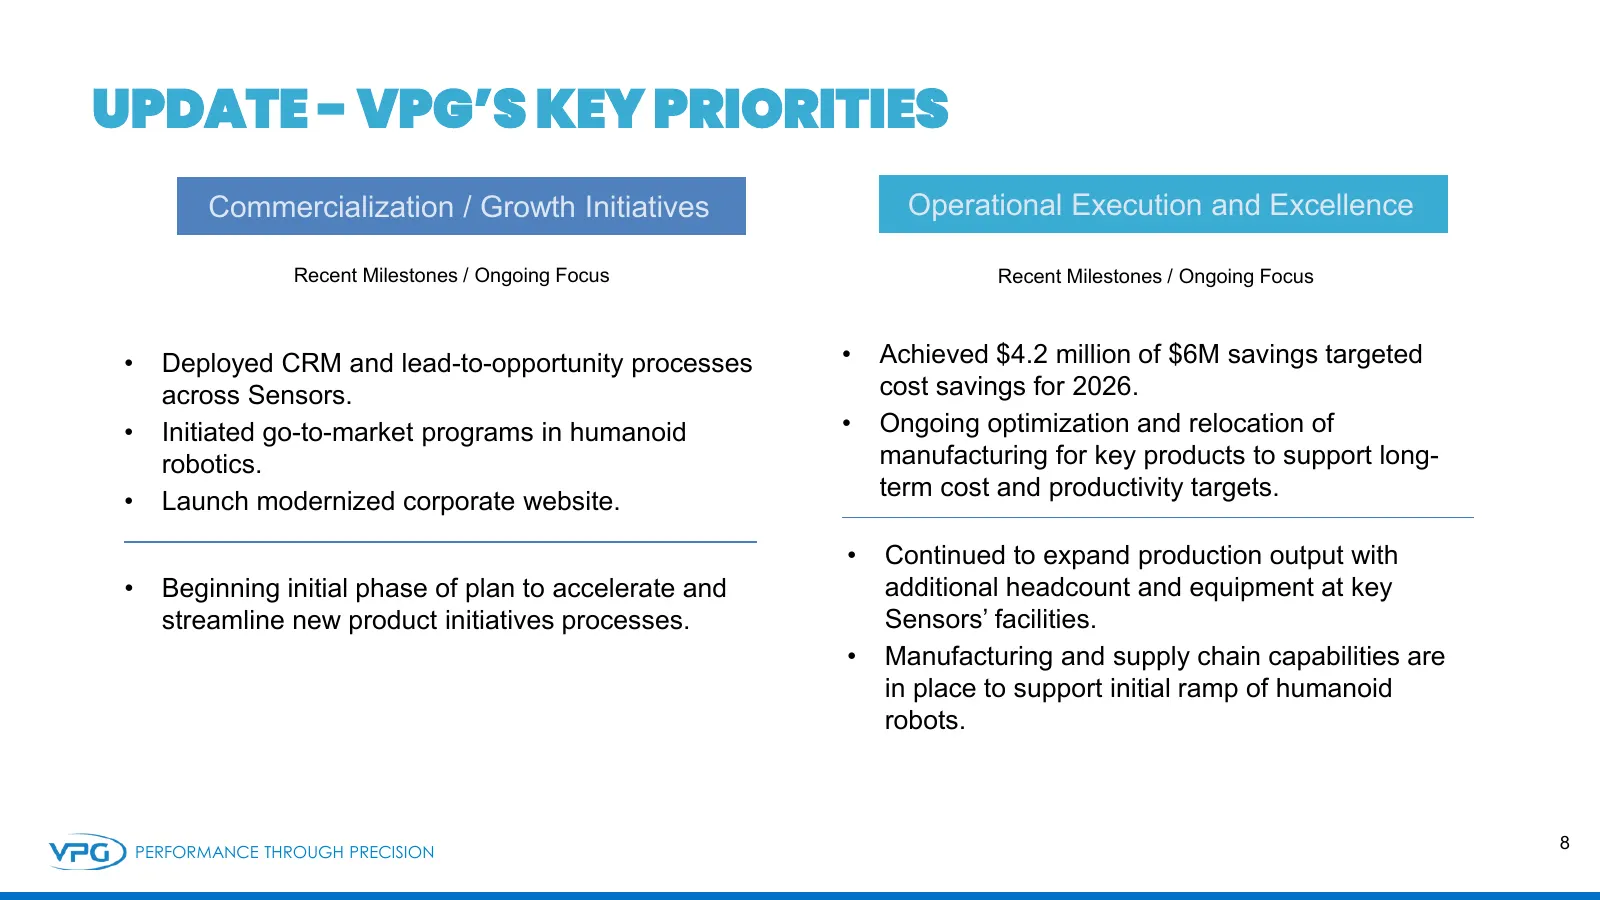
UPDATE - VPG’S KEY PRIORITIES Commercialization / Growth Initiatives Operational Execution and Excellence Recent Milestones / Ongoing Focus Recent Milestones / Ongoing Focus • Deployed CRM and lead-to-opportunity processes • Achieved $4.2 million of $6M savings targeted across Sensors. cost savings
Slide 9: Financials – Gross Margin
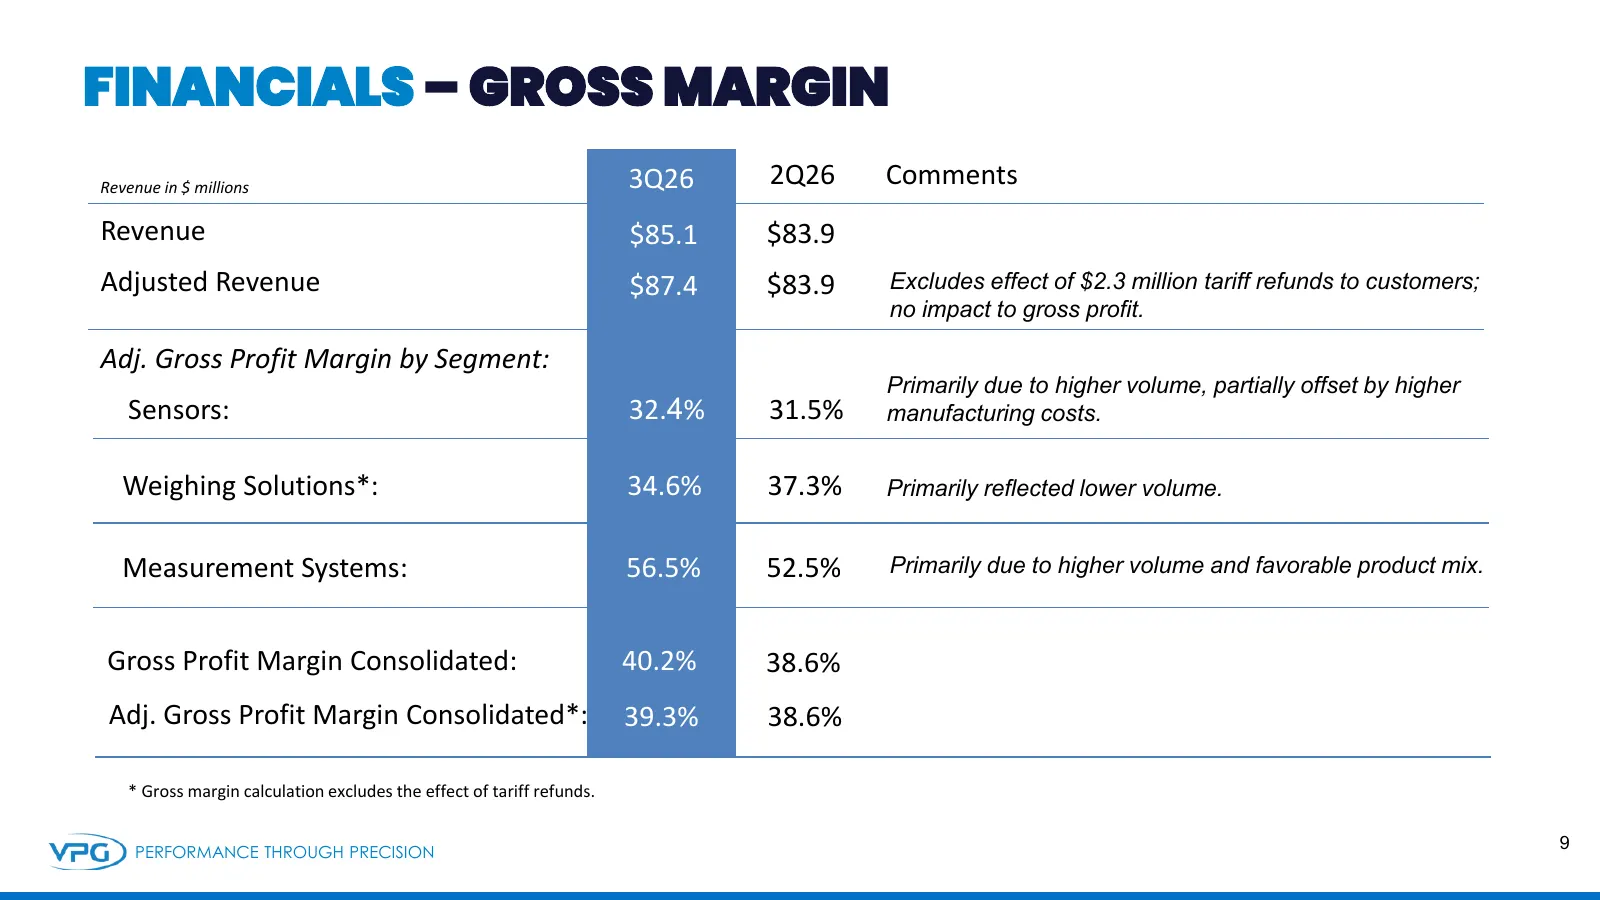
FINANCIALS – GROSS MARGIN Revenue in $ millions 3Q26 2Q26 Comments Revenue $85.1 $83.9 Adjusted Revenue $87.4 $83.9 Excludes effect of $2.3 million tariff refunds to customers; no impact to gross profit. Adj. Gross Profit Margin by Segment: Primarily due to higher volume, partially offset by higher
Slide 10: Financials – Income Statement
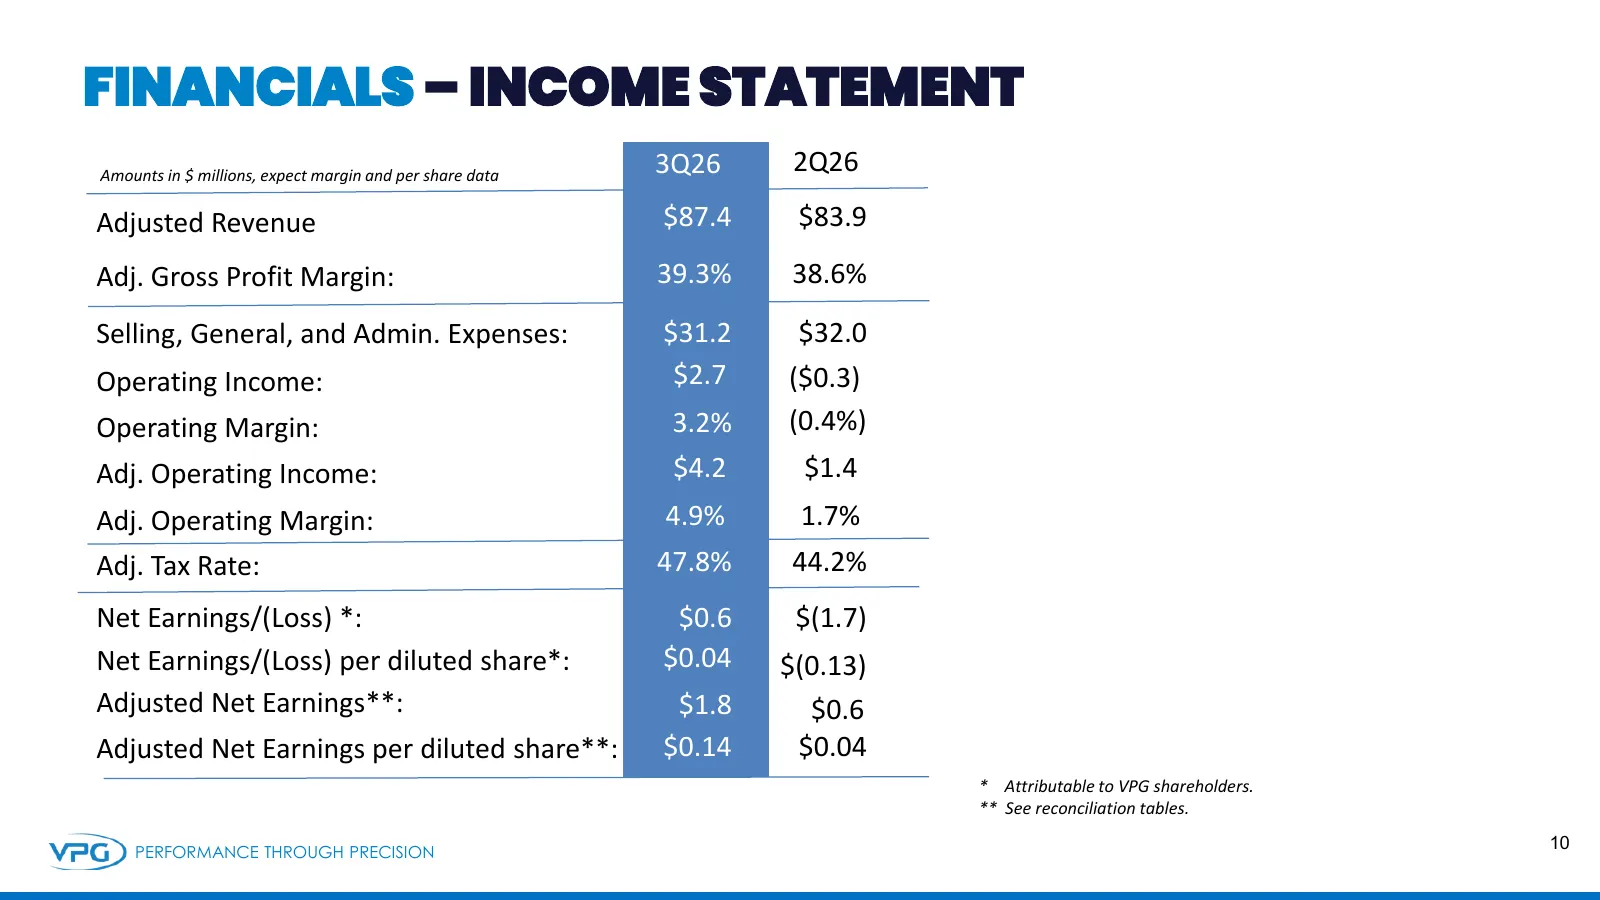
FINANCIALS – INCOME STATEMENT Amounts in $ millions, expect margin and per share data 3Q26 2Q26 Adjusted Revenue $87.4 $83.9 Adj. Gross Profit Margin: 39.3% 38.6% Selling, General, and Admin. Expenses: $31.2 $32.0 Operating Income: $2.7 ($0.3) Operating Margin: 3.2% (0.4%) Adj. Operating Income: $4.
Slide 11: Financials – Cash Flow / Balance Sheet
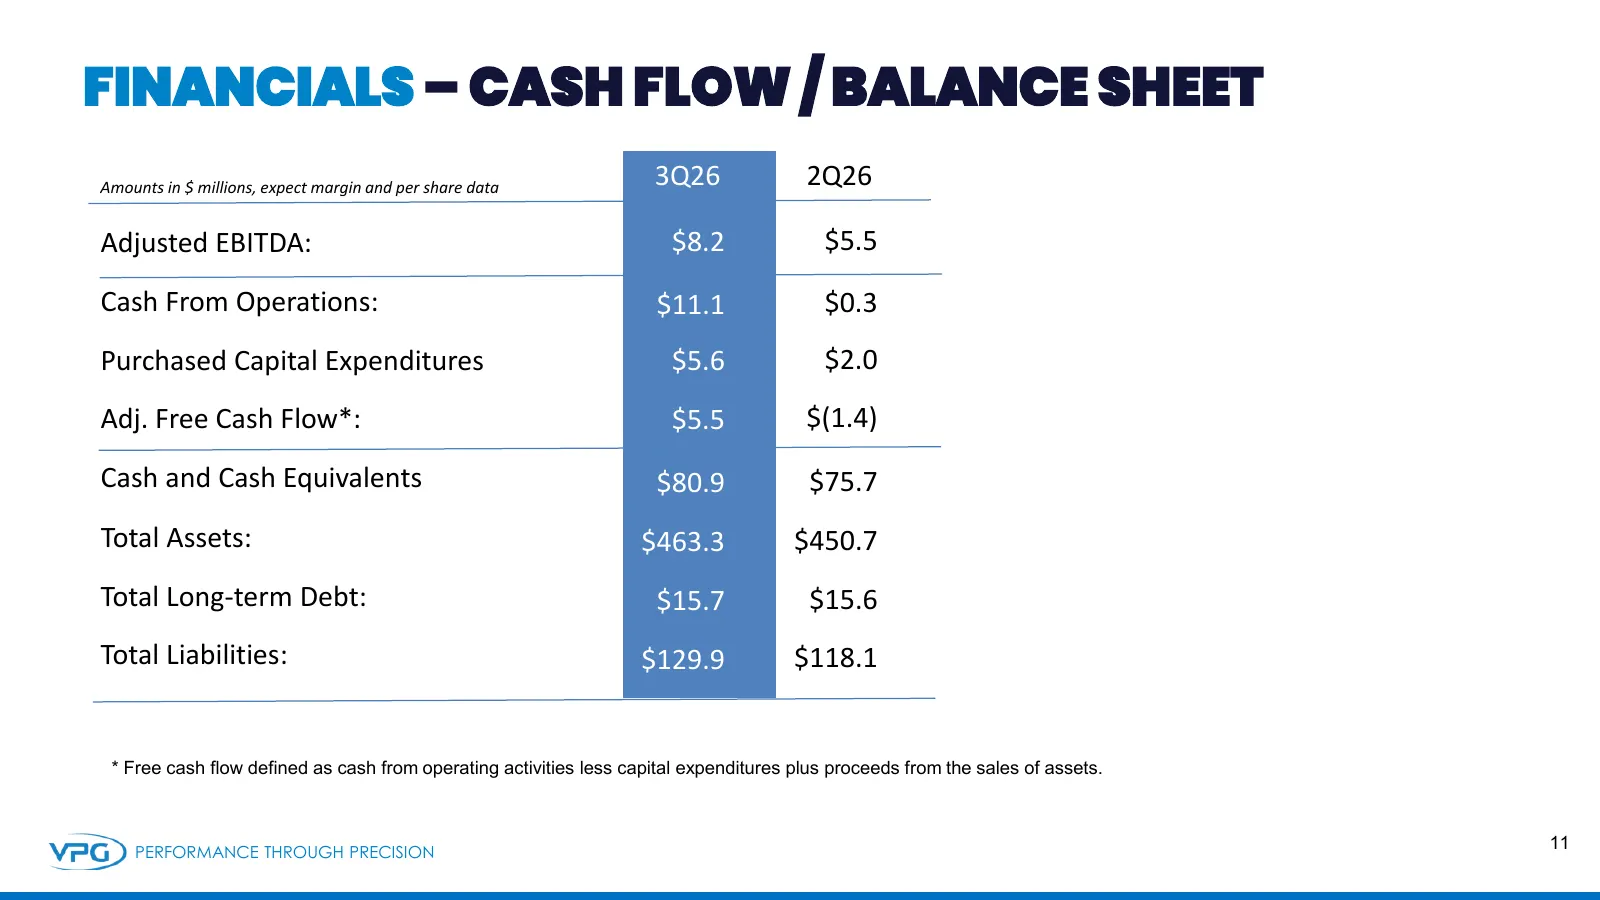
FINANCIALS – CASH FLOW / BALANCE SHEET Amounts in $ millions, expect margin and per share data 3Q26 2Q26 Adjusted EBITDA: $8.2 $5.5 Cash From Operations: $11.1 $0.3 Purchased Capital Expenditures $5.6 $2.0 Adj. Free Cash Flow*: $5.5 $(1.4) Cash and Cash Equivalents $80.9 $75.7 Total Assets: $463.3 $

Slide 12: Q&A
Q&A PERFORMANCE THROUGH PRECISION 12 12

Slide 13: Appendix
Appendix PERFORMANCE THROUGH PRECISION 13 13
Slide 14: Reconciliation of Adjusted Revenue
Reconciliation of Adjusted Revenue PERFORMANCE THROUGH PRECISION 14
Slide 15: Reconciliation of Adjusted Gross Profit, Operating Income, Net Earnings and Diluted EPS
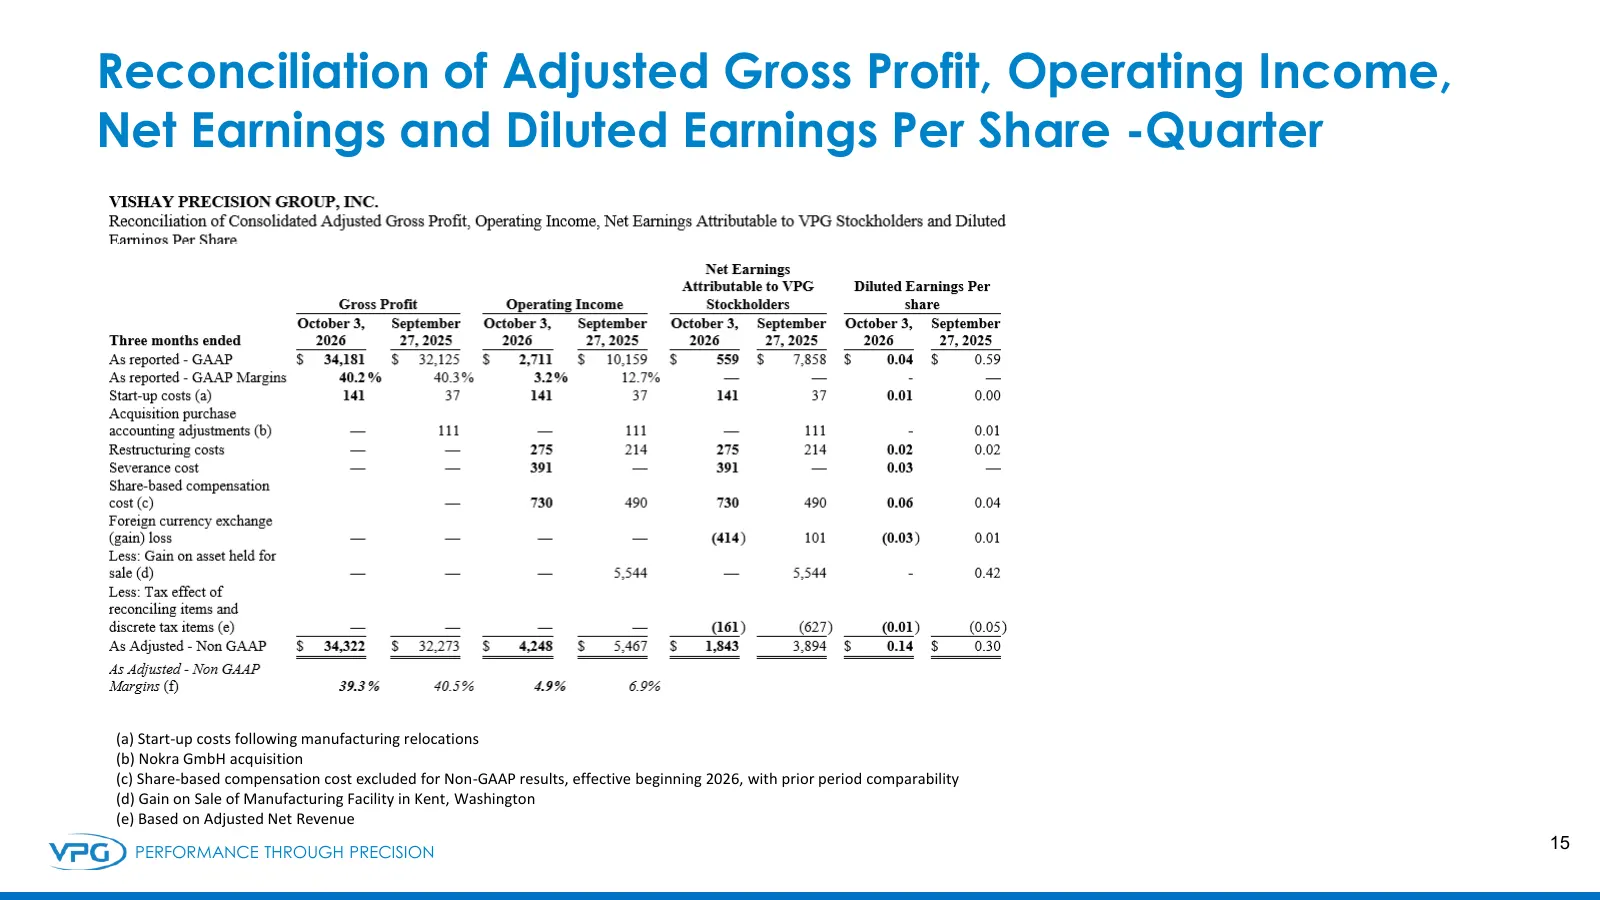
Reconciliation of Adjusted Gross Profit, Operating Income, Net Earnings and Diluted Earnings Per Share -Quarter (a) Start-up costs following manufacturing relocations (b) Nokra GmbH acquisition (c) Share-based compensation cost excluded for Non-GAAP results, effective beginning 2026, with prior peri
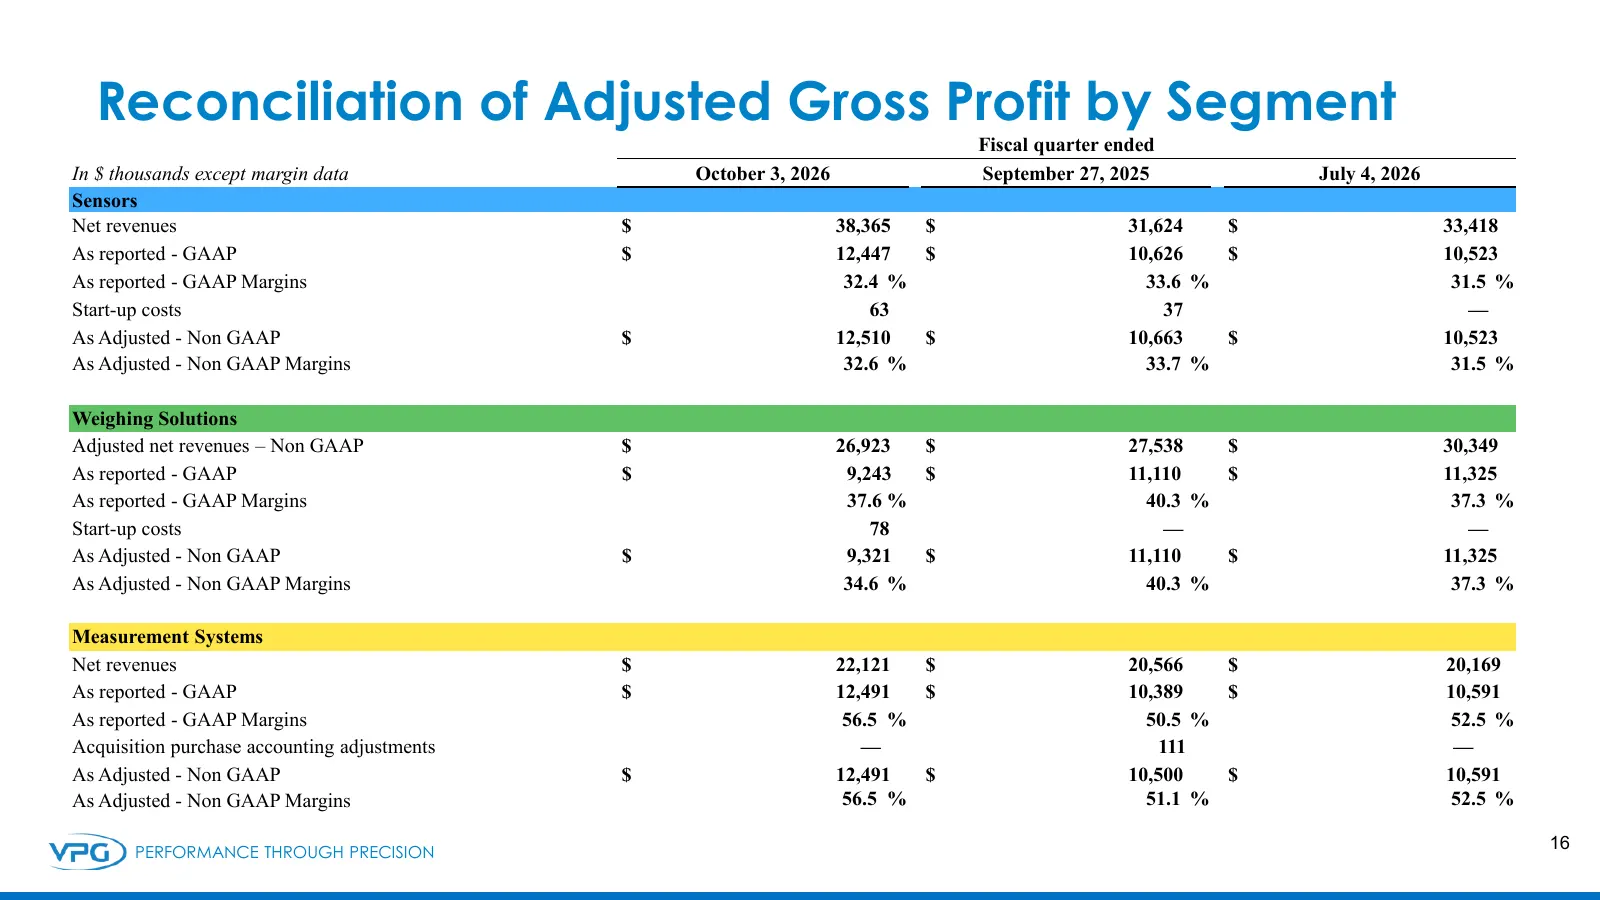
Slide 16: Reconciliation of Adjusted Gross Profit by Segment
Reconciliation of Adjusted Gross Profit by Segment Fiscal quarter ended In $ thousands except margin data October 3, 2026 September 27, 2025 July 4, 2026 Sensors Net revenues $ 38,365 $ 31,624 $ 33,418 As reported - GAAP $ 12,447 $ 10,626 $ 10,523 As reported - GAAP Margins 32.4 % 33.6 % 31.5 % Star
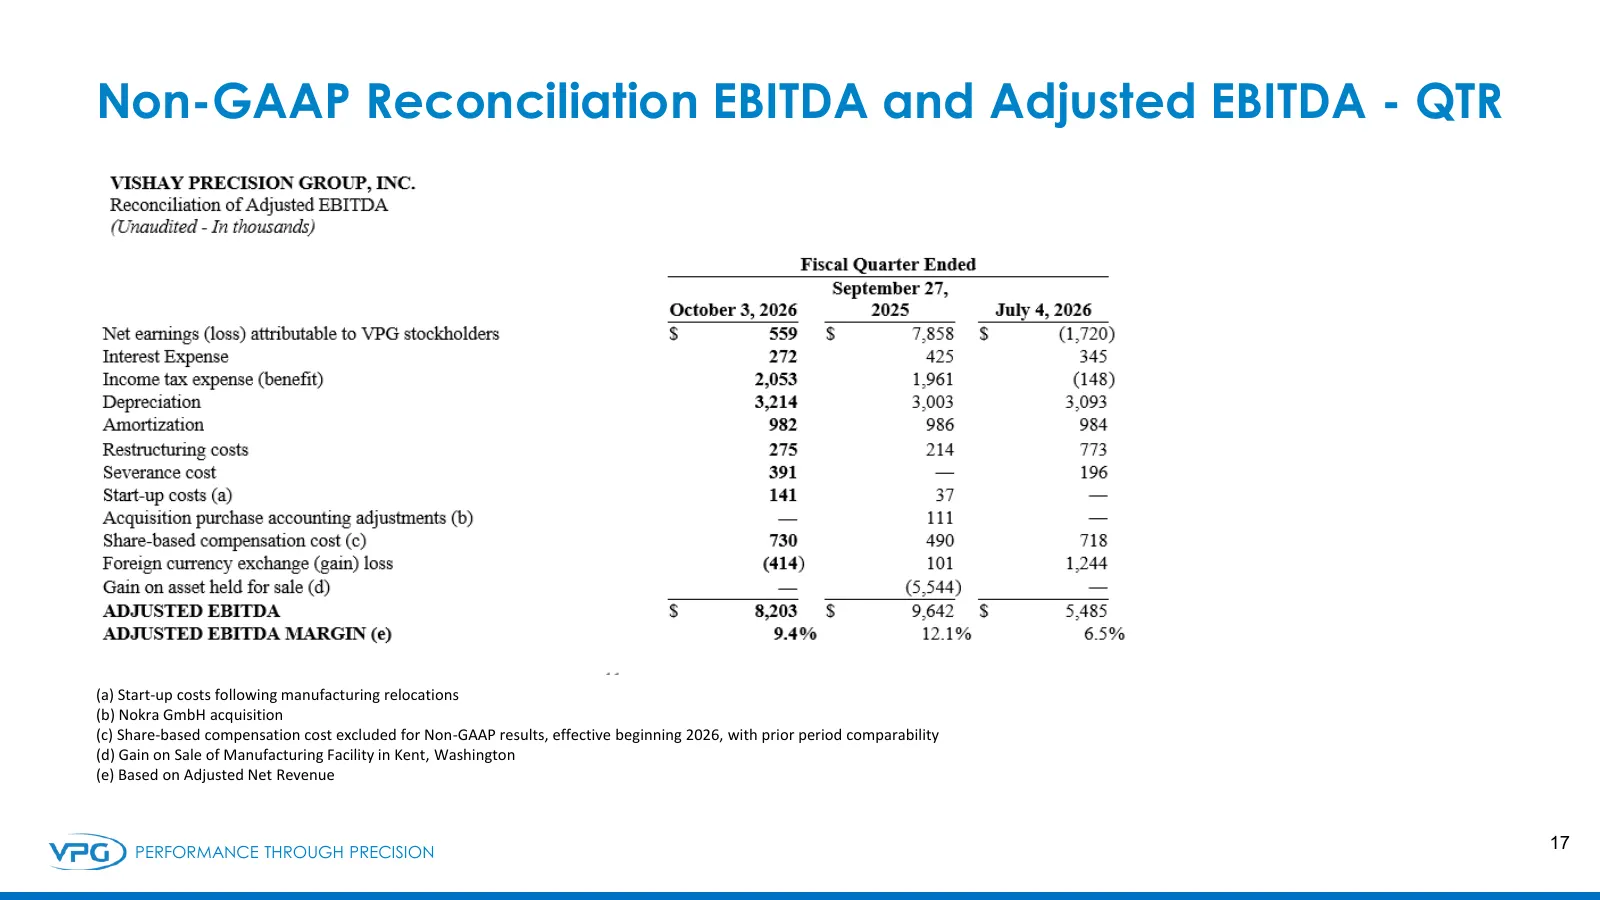
Slide 17: Non-GAAP Reconciliation EBITDA and Adjusted EBITDA - QTR
Non-GAAP Reconciliation EBITDA and Adjusted EBITDA - QTR (a) Start-up costs following manufacturing relocations (b) Nokra GmbH acquisition (c) Share-based compensation cost excluded for Non-GAAP results, effective beginning 2026, with prior period comparability (d) Gain on Sale of Manufacturing Faci
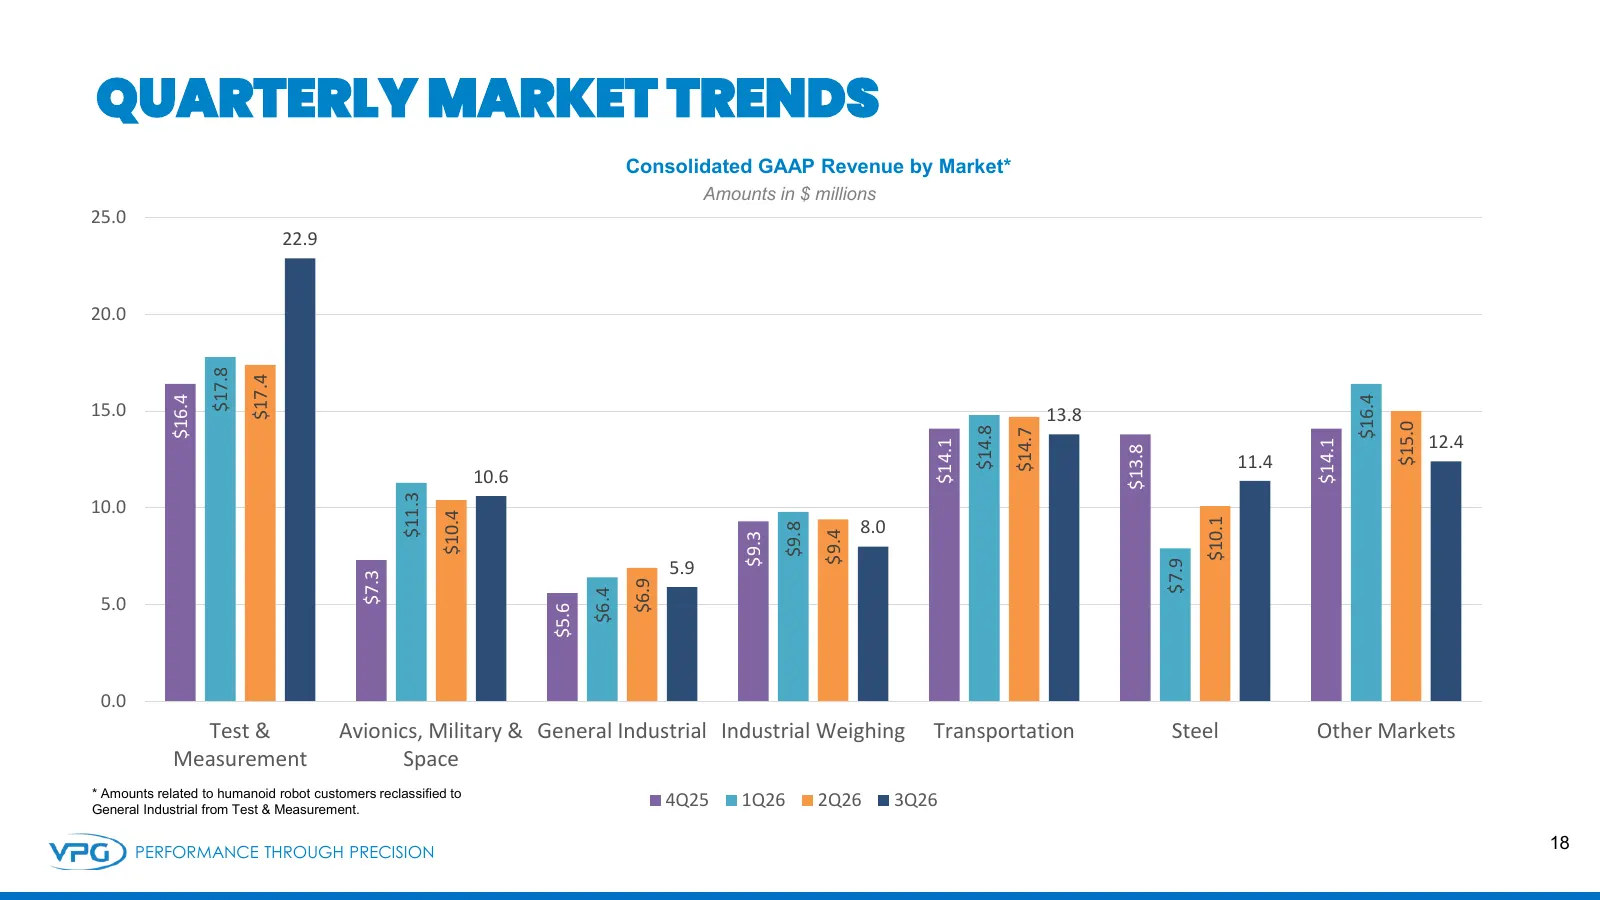
Slide 18: Quarterly Market Trends
QUARTERLY MARKET TRENDS Consolidated GAAP Revenue by Market* Amounts in $ millions 25.0 22.9 20.0 $17.8 $17.4 $16.4 $16.4 15.0 13.8 $15.0 $14.8 $14.7 12.4 $14.1 $14.1 $13.8 11.4 10.6 $11.3 10.0 $10.4 $10.1 8.0 $9.8 $9.4 $9.3 $7.9 5.9 $7.3 $6.9 5.0 $6.4 $5.6 0.0 Test & Avionics, Military & General In
Slide 19: VPG Sustainability
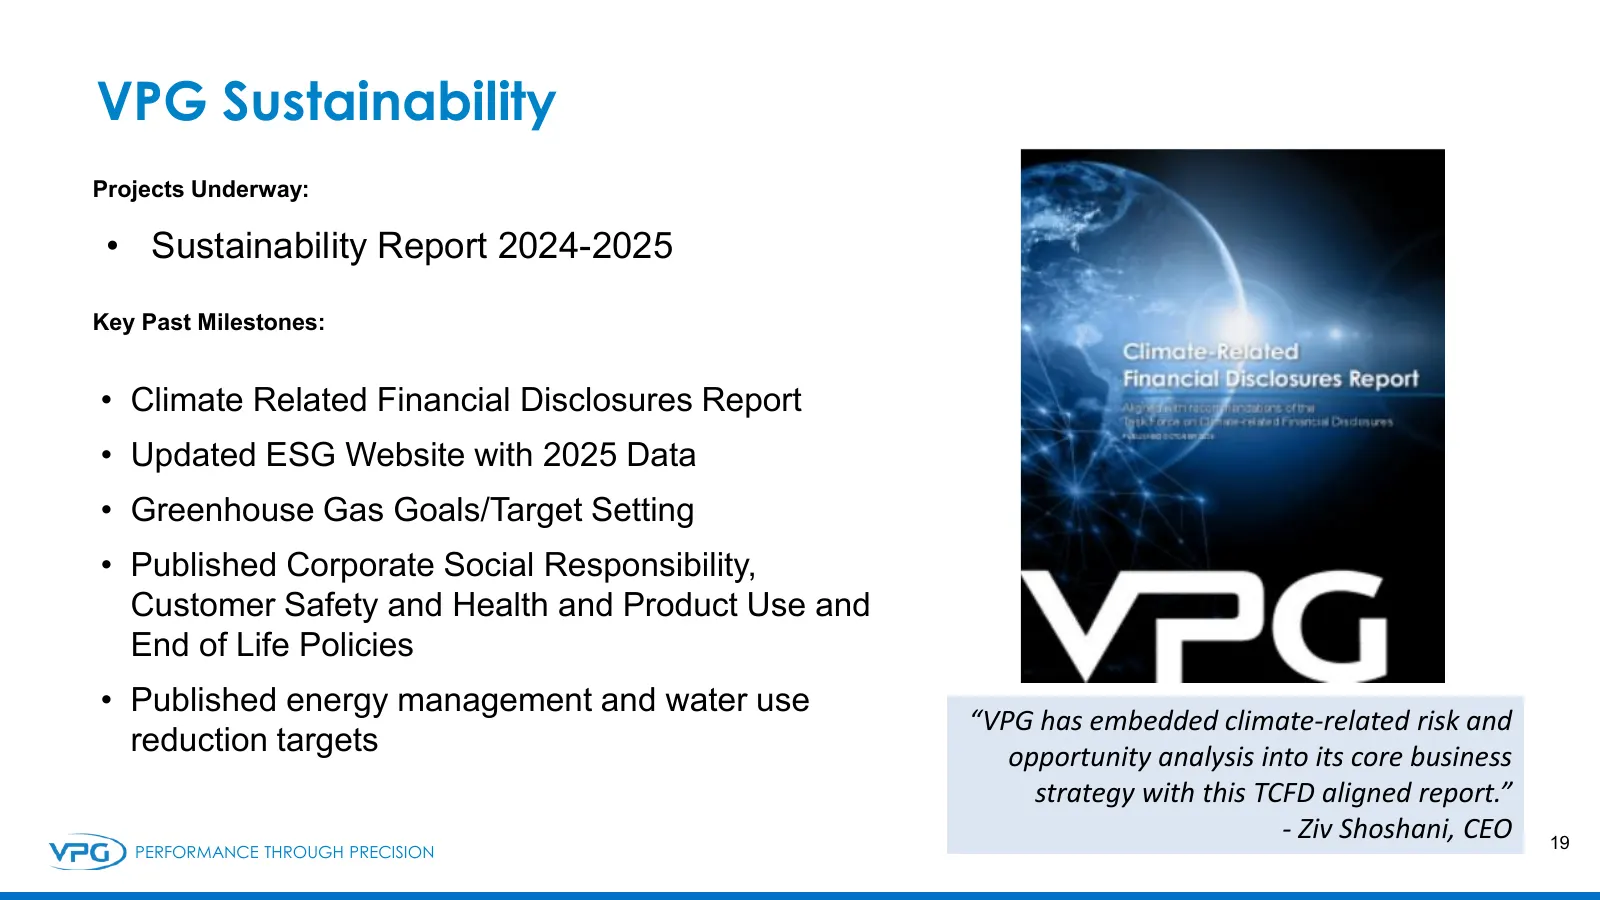
VPG Sustainability Projects Underway: • Sustainability Report 2024-2025 Key Past Milestones: • Climate Related Financial Disclosures Report • Updated ESG Website with 2025 Data • Greenhouse Gas Goals/Target Setting • Published Corporate Social Responsibility, Customer Safety and Health and Product U
Source: 6ix earnings call
More decks from Vishay Precision Group, Inc.
 Q2 2026 Earnings Presentation18 slides · Aug 5, 2026
 Q1 2026 Earnings Presentation18 slides · May 12, 2026
 Q4 2025 Earnings Presentation15 slides · Feb 11, 2026
 Q2 2025 Earnings Presentation17 slides · Aug 5, 2025
 Q1 2025 Earnings Presentation17 slides · May 6, 2025
 Q4 2024 Earnings Presentation19 slides · Feb 12, 2025