Azenta, Inc. · NASDAQ:AZTA
Azenta — Baird 2023 Global Healthcare Conference
32 slides from Azenta's conference presentation, Sep 12, 2023

Slide 1: Baird 2023 Global Healthcare Conference
Azenta Life Sciences Baird 2023 Global Healthcare Conference September 12, 2023
Slide 2: Safe Harbor Statement
Safe Harbor Statement “Safe Harbor” Statement under the U.S. Private Securities Litigation Reform Act of 1995; certain matters in this presentation, including forecasts of future demand and future Company performance, are forward-looking statements that are subject to risks and uncertainties that co
Slide 3: Agenda
AGENDA High Value Portfolio of Market Leading Offerings in Cold Chain of Custody and Sample Management Azenta – An Established Life Sciences Company with a Strong Track Record Developing and Serving Attractive High Growth End Markets Creating Value – On the Path to Sustained Growth and Higher Profit
Slide 4: Azenta is Enabling Life Sciences Organizations to Bring Breakthrough Therapies to Market Faster
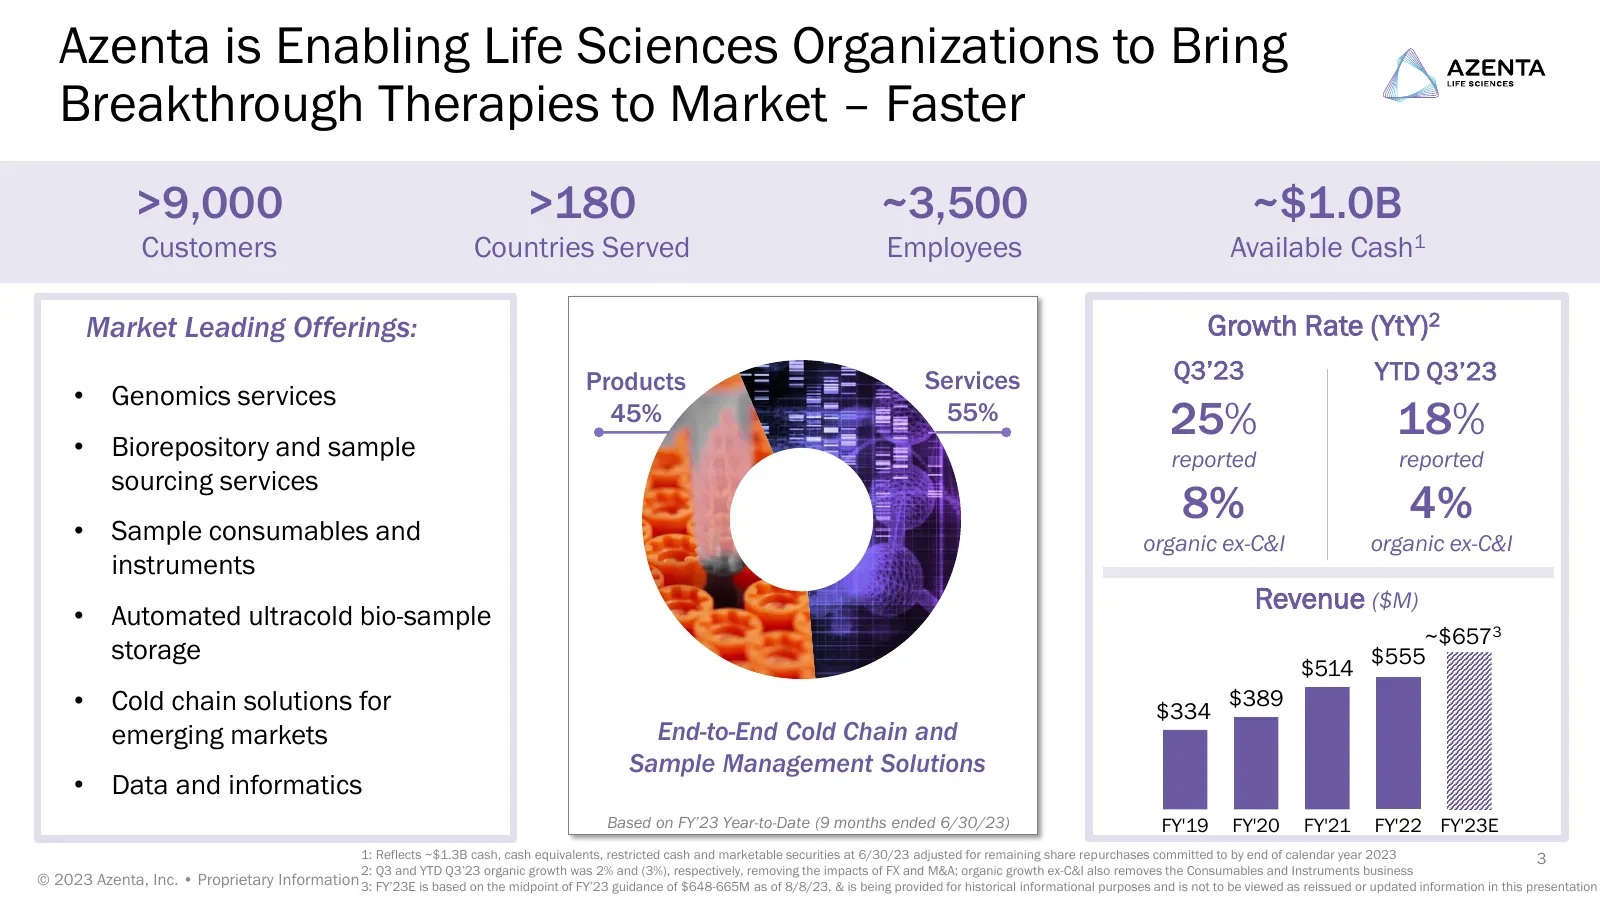
Azenta is Enabling Life Sciences Organizations to Bring Breakthrough Therapies to Market – Faster >9,000 >180 ~3,500 ~$1.0B Customers Countries Served Employees Available Cash1 Market Leading Offerings: Growth Rate (YtY)2 Products Services Q3’23 YTD Q3’23 • Genomics services • Biorepository and samp
Slide 5: Established Early, Recognized as a Leader in Life Sciences
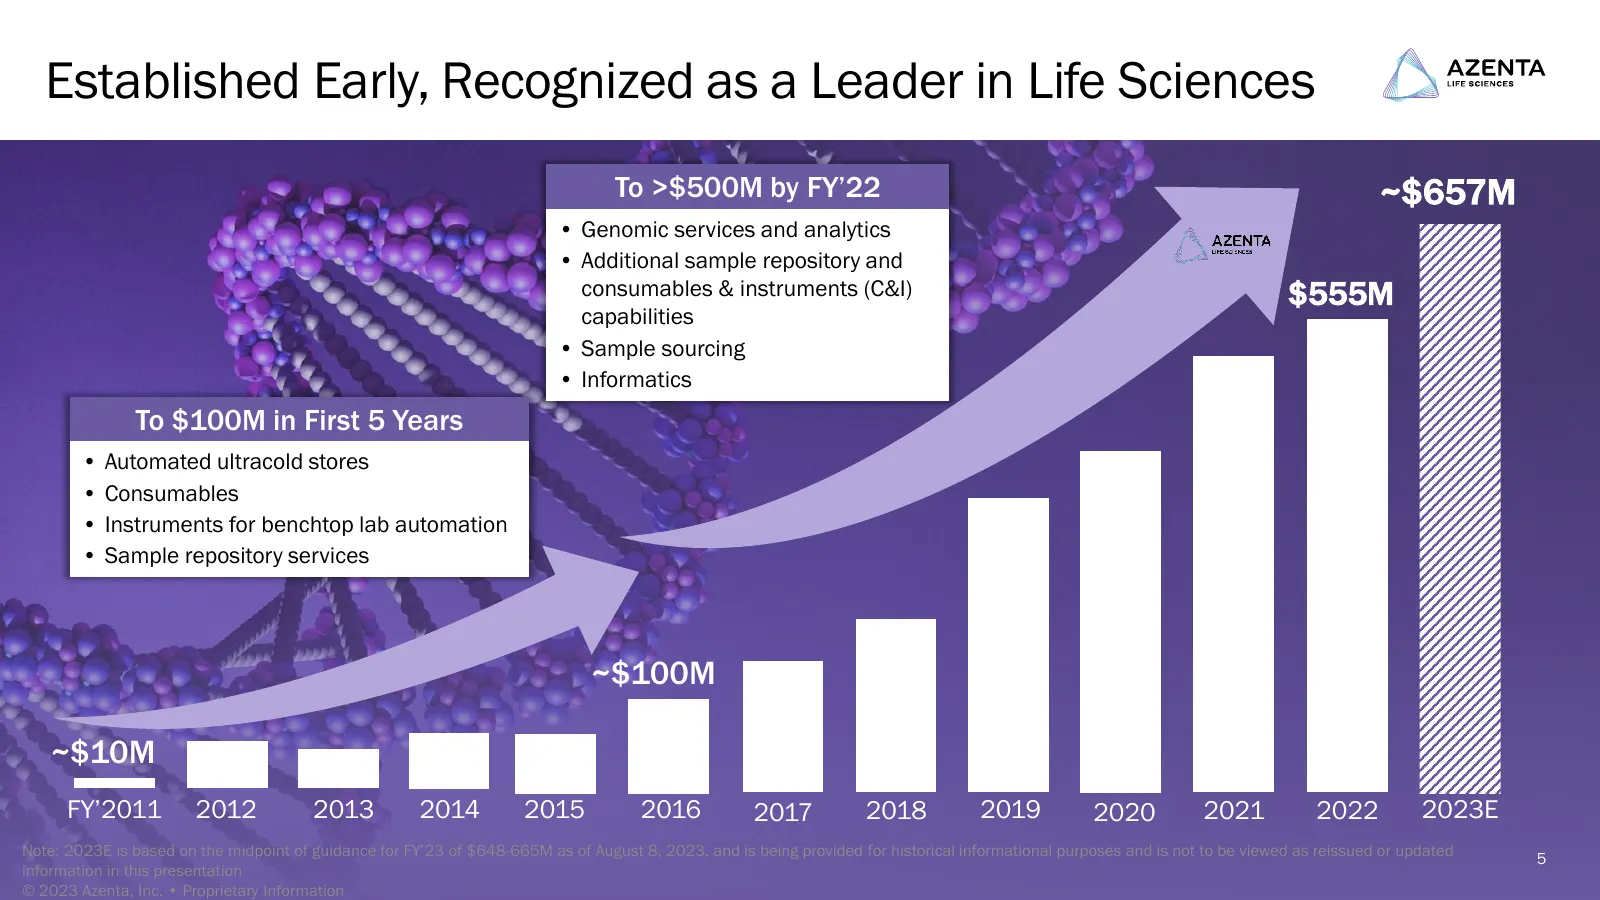
Established Early, Recognized as a Leader in Life Sciences To >$500M by FY’22 ~$657M • Genomic services and analytics • Additional sample repository and consumables & instruments (C&I) $555M capabilities • Sample sourcing • Informatics To $100M in First 5 Years • Automated ultracold stores • Consuma
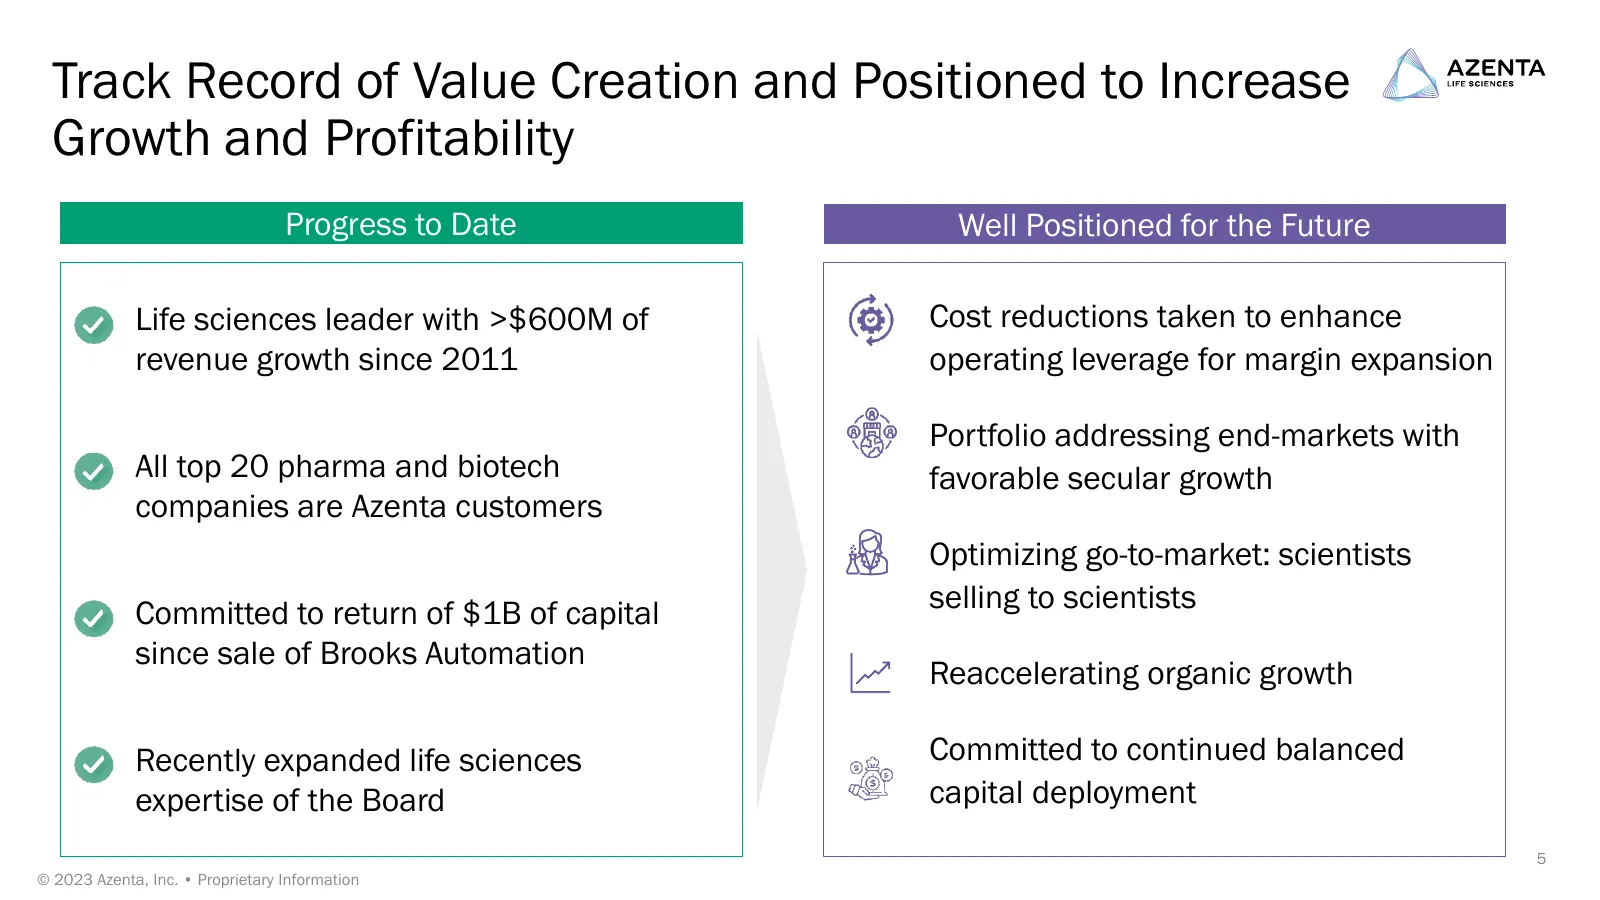
Slide 6: Track Record of Value Creation and Positioned to Increase Growth and Profitability
Track Record of Value Creation and Positioned to Increase Growth and Profitability Progress to Date Well Positioned for the Future Life sciences leader with >$600M of Cost reductions taken to enhance revenue growth since 2011 operating leverage for margin expansion Portfolio addressing end-markets w
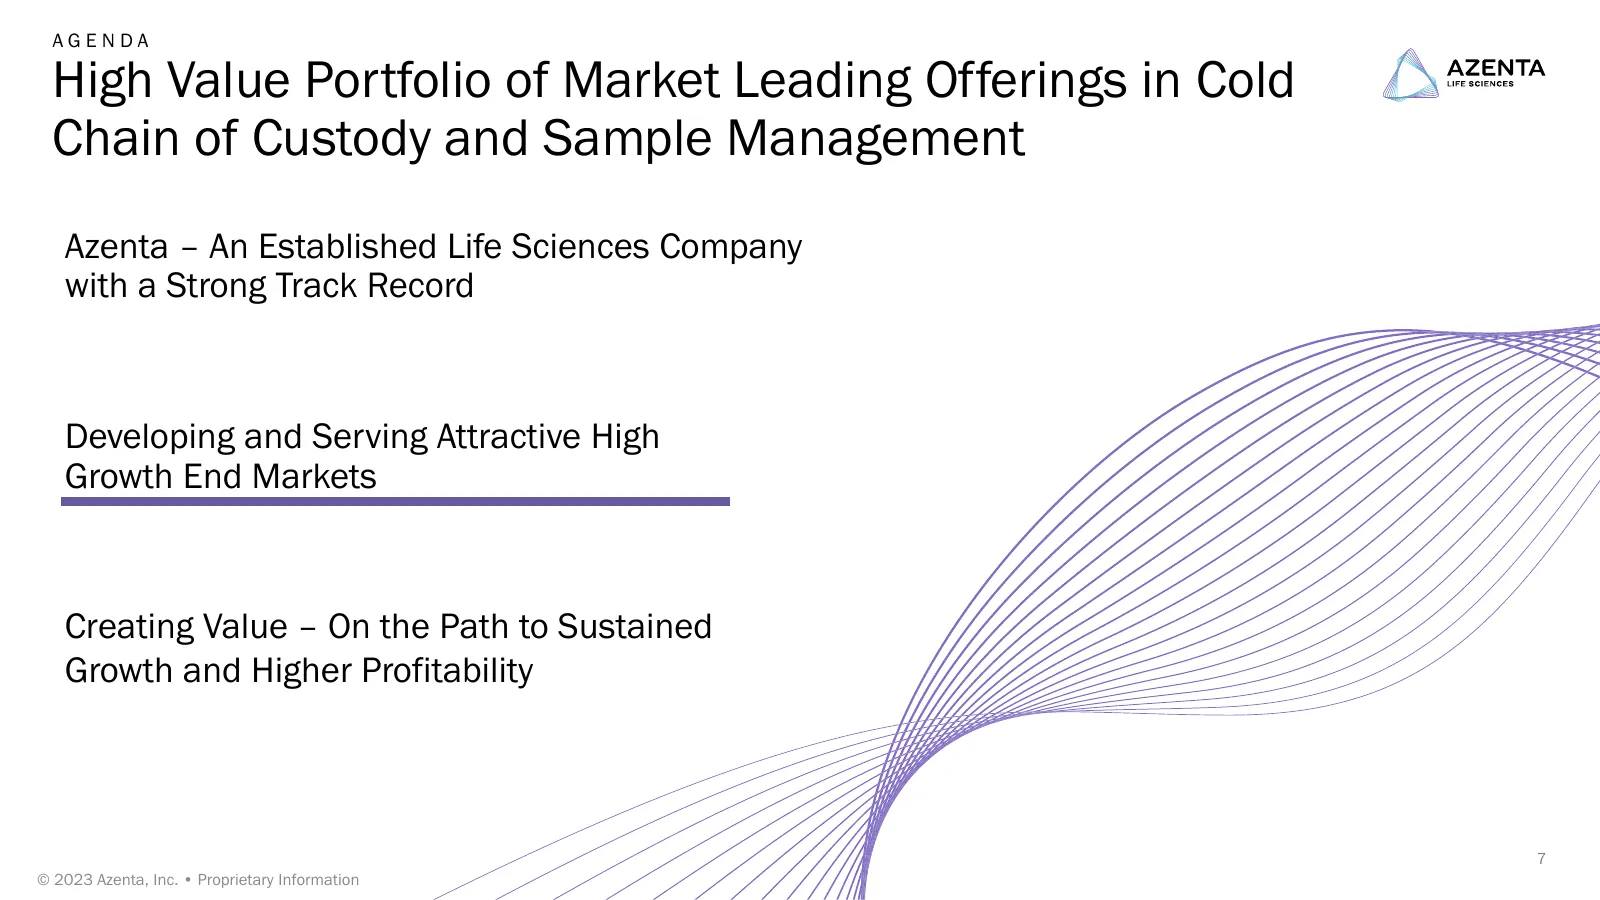
Slide 7: Agenda
AGENDA High Value Portfolio of Market Leading Offerings in Cold Chain of Custody and Sample Management Azenta – An Established Life Sciences Company with a Strong Track Record Developing and Serving Attractive High Growth End Markets Creating Value – On the Path to Sustained Growth and Higher Profit
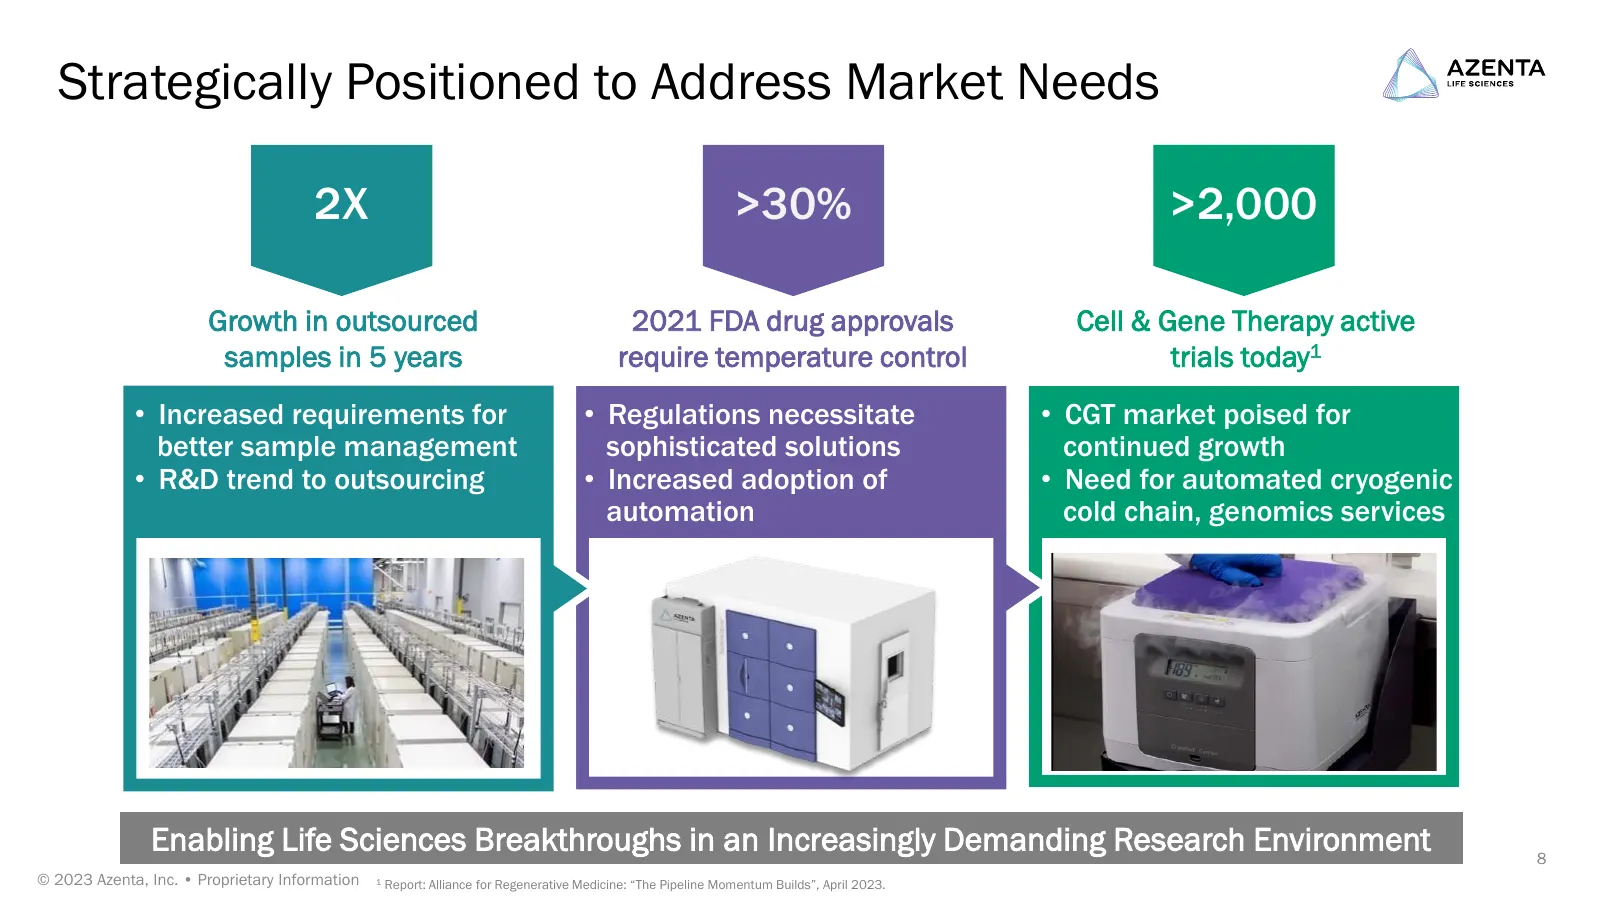
Slide 8: Strategically Positioned to Address Market Needs
Strategically Positioned to Address Market Needs 2X >30% >2,000 Growth in outsourced 2021 FDA drug approvals Cell & Gene Therapy active samples in 5 years require temperature control trials today1 • Increased requirements for • Regulations necessitate • CGT market poised for better sample management
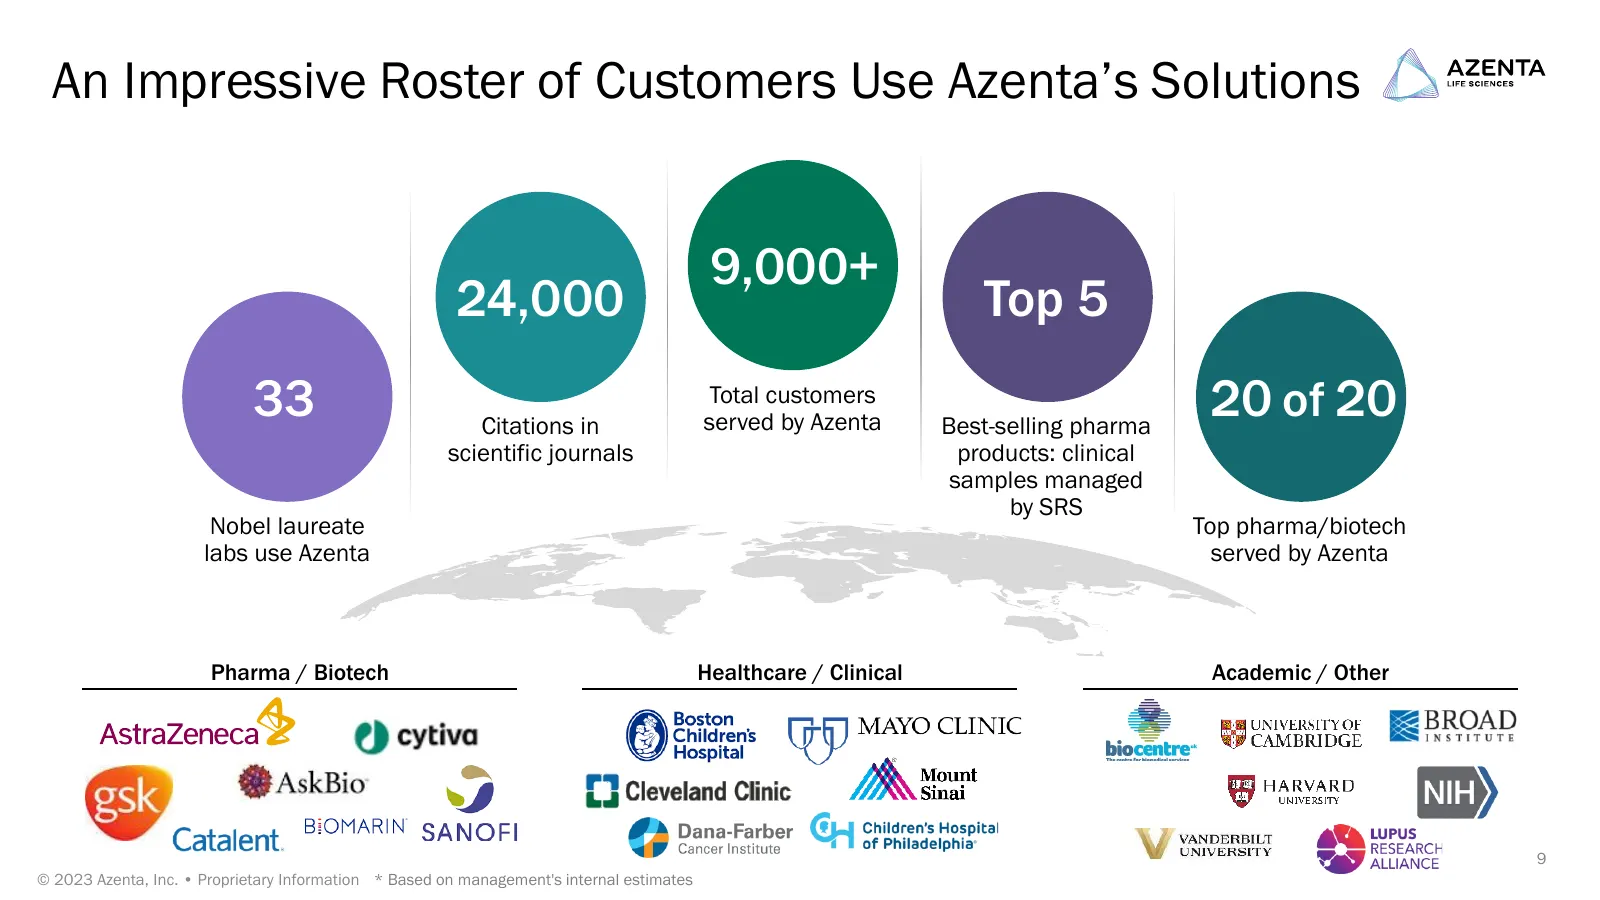
Slide 9: An Impressive Roster of Customers Use Azenta's Solutions
An Impressive Roster of Customers Use Azenta’s Solutions 9,000+ 24,000 Top 5 33 Citations in Total customers served by Azenta Best-selling pharma 20 of 20 scientific journals products: clinical samples managed by SRS Nobel laureate Top pharma/biotech labs use Azenta served by Azenta Pharma / Biotech
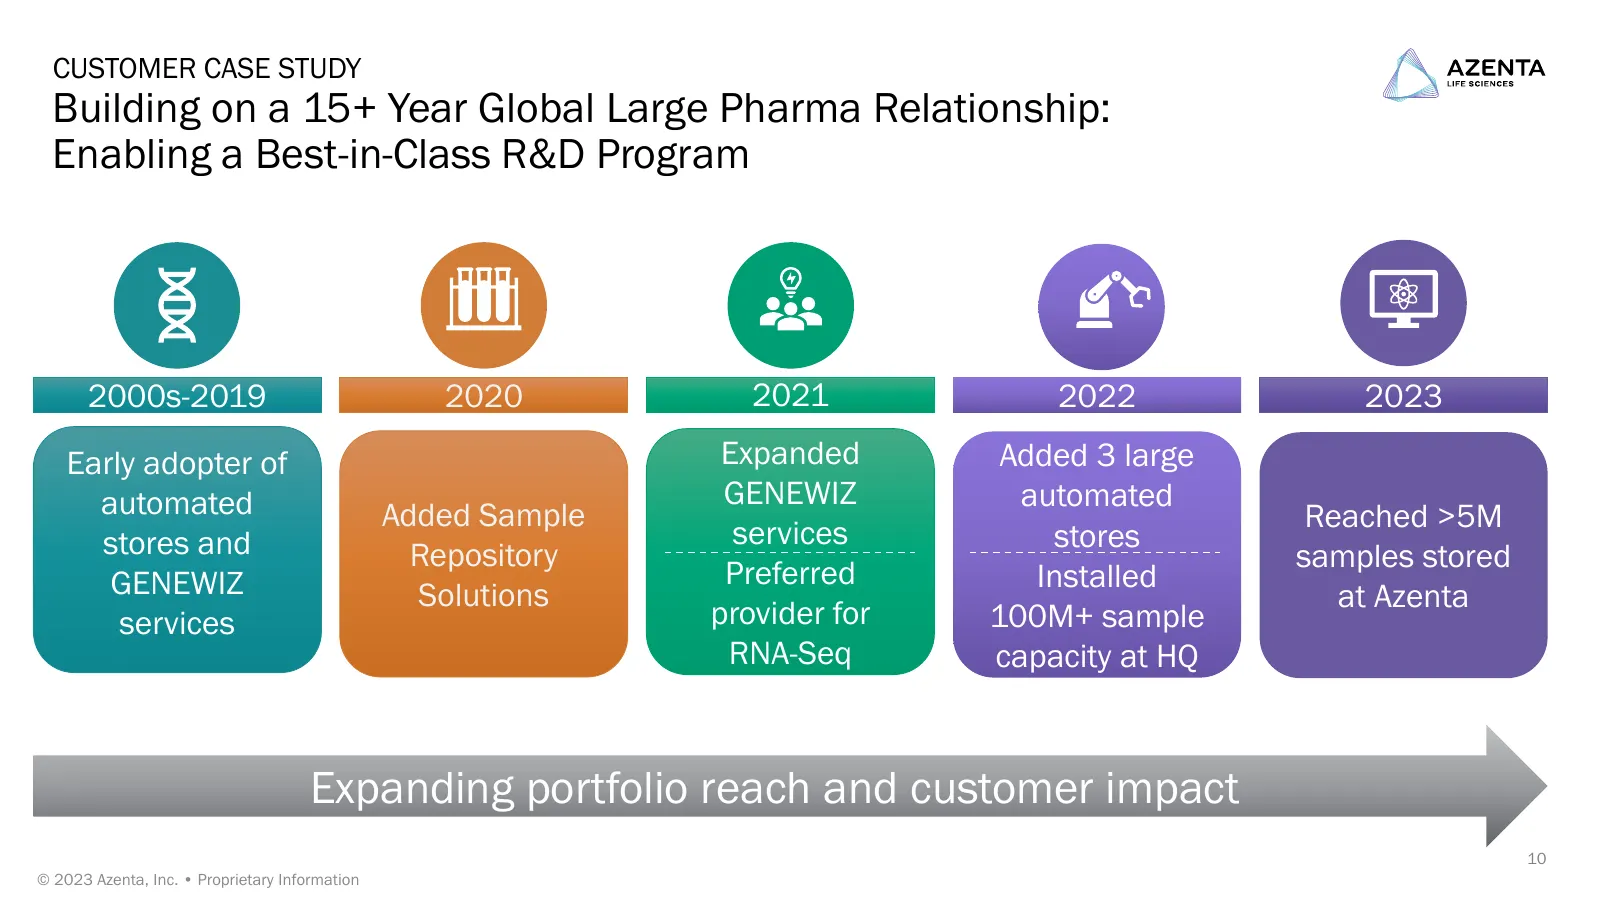
Slide 10: Building on a 15+ Year Global Large Pharma Relationship
CUSTOMER CASE STUDY Building on a 15+ Year Global Large Pharma Relationship: Enabling a Best-in-Class R&D Program 2000s-2019 2020 2021 2022 2023 Early adopter of Expanded Added 3 large automated GENEWIZ automated Added Sample Reached >5M stores and services stores Repository samples stored GENEWIZ P
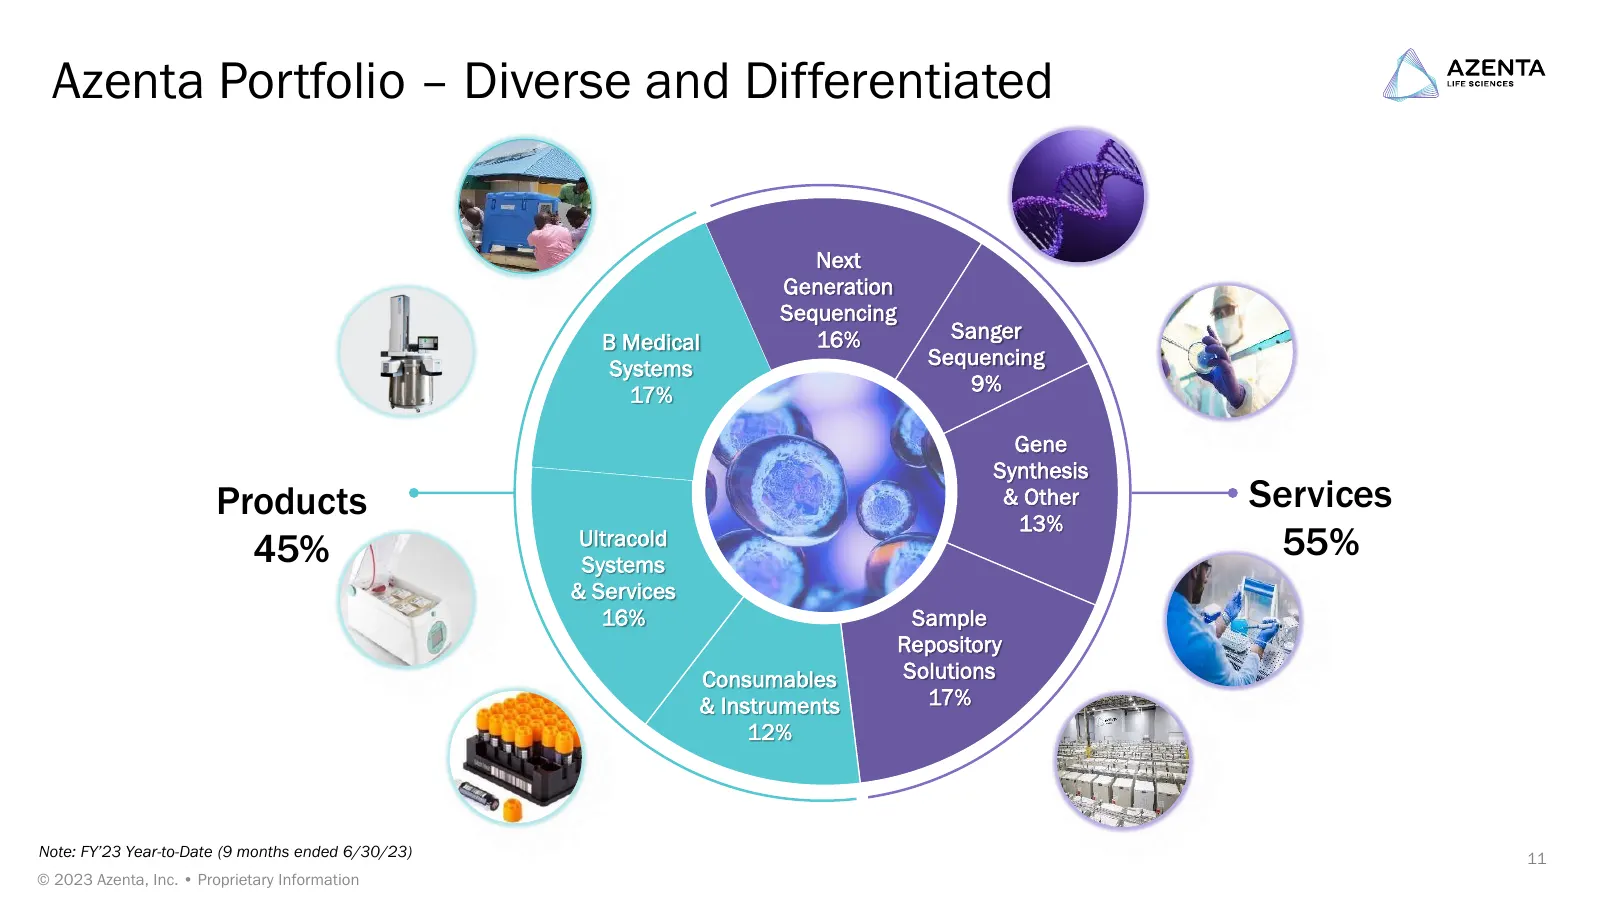
Slide 11: Azenta Portfolio – Diverse and Differentiated
Azenta Portfolio – Diverse and Differentiated Next Generation Sequencing B Medical 16% Sanger Systems Sequencing 17% 9% Gene Synthesis Products & Other Services 13% 45% Ultracold Systems 55% & Services 16% Sample Repository Consumables Solutions & Instruments 17% 12% Note: FY’23 Year-to-Date (9 mont
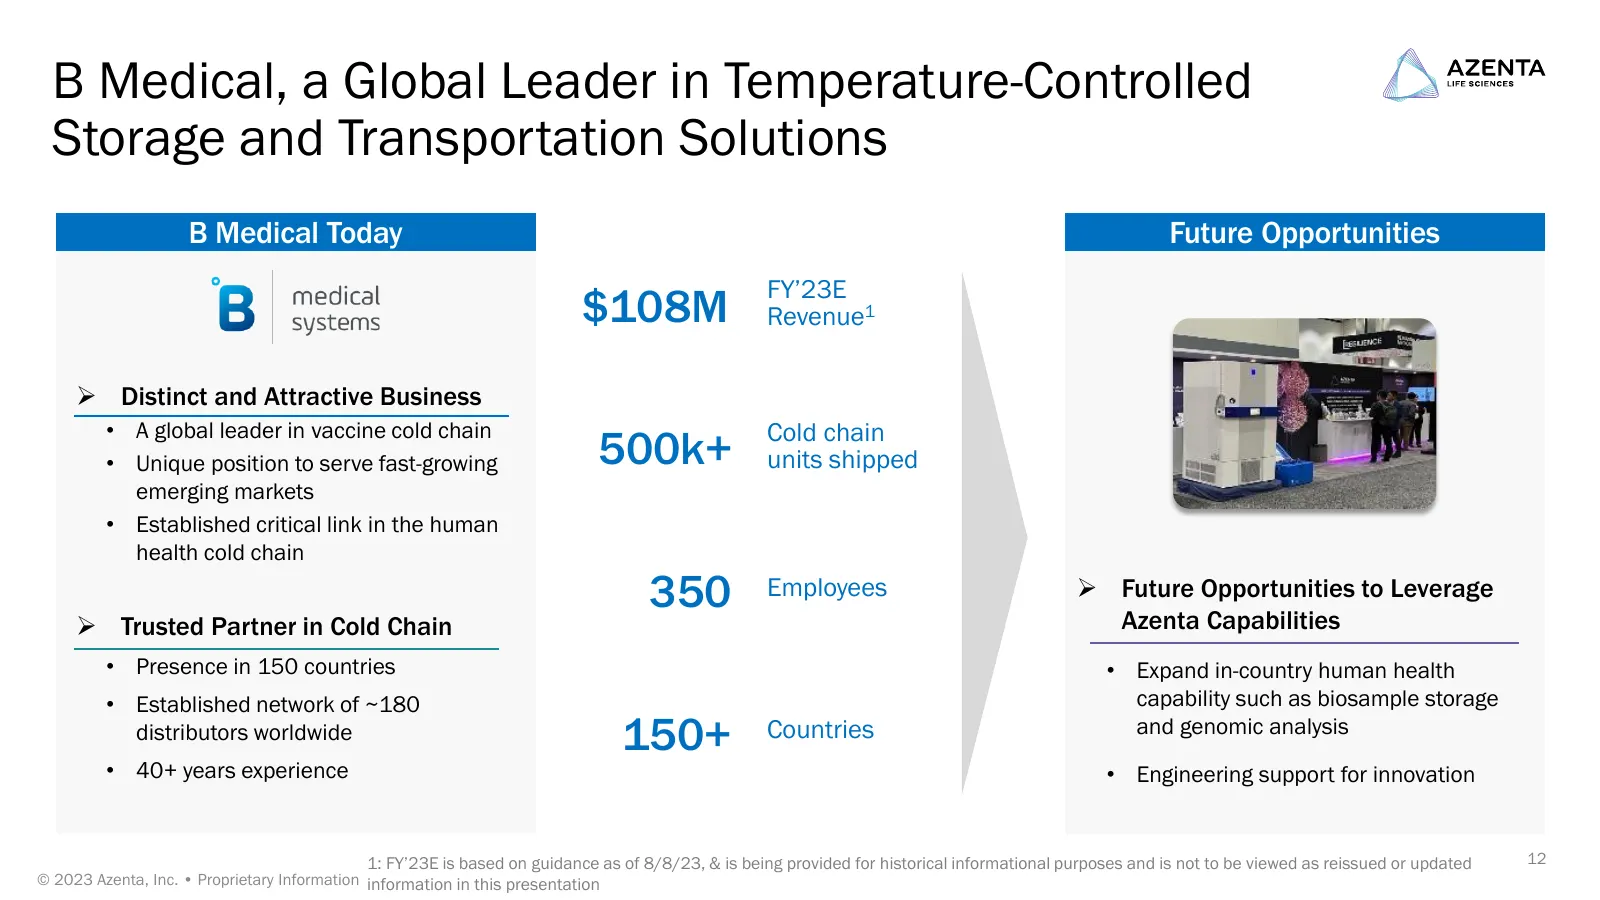
Slide 12: B Medical, a Global Leader in Temperature-Controlled Storage and Transportation Solutions
B Medical, a Global Leader in Temperature-Controlled Storage and Transportation Solutions B Medical Today Future Opportunities FY’23E $108M Revenue1 ➢ Distinct and Attractive Business • A global leader in vaccine cold chain Cold chain • Unique position to serve fast-growing 500k+ units shipped emerg
Slide 13: Agenda
AGENDA High Value Portfolio of Market Leading Offerings in Cold Chain of Custody and Sample Management Azenta – An Established Life Sciences Company with a Strong Track Record Developing and Serving Attractive High Growth End Markets Creating Value – On the Path to Sustained Growth and Higher Profit
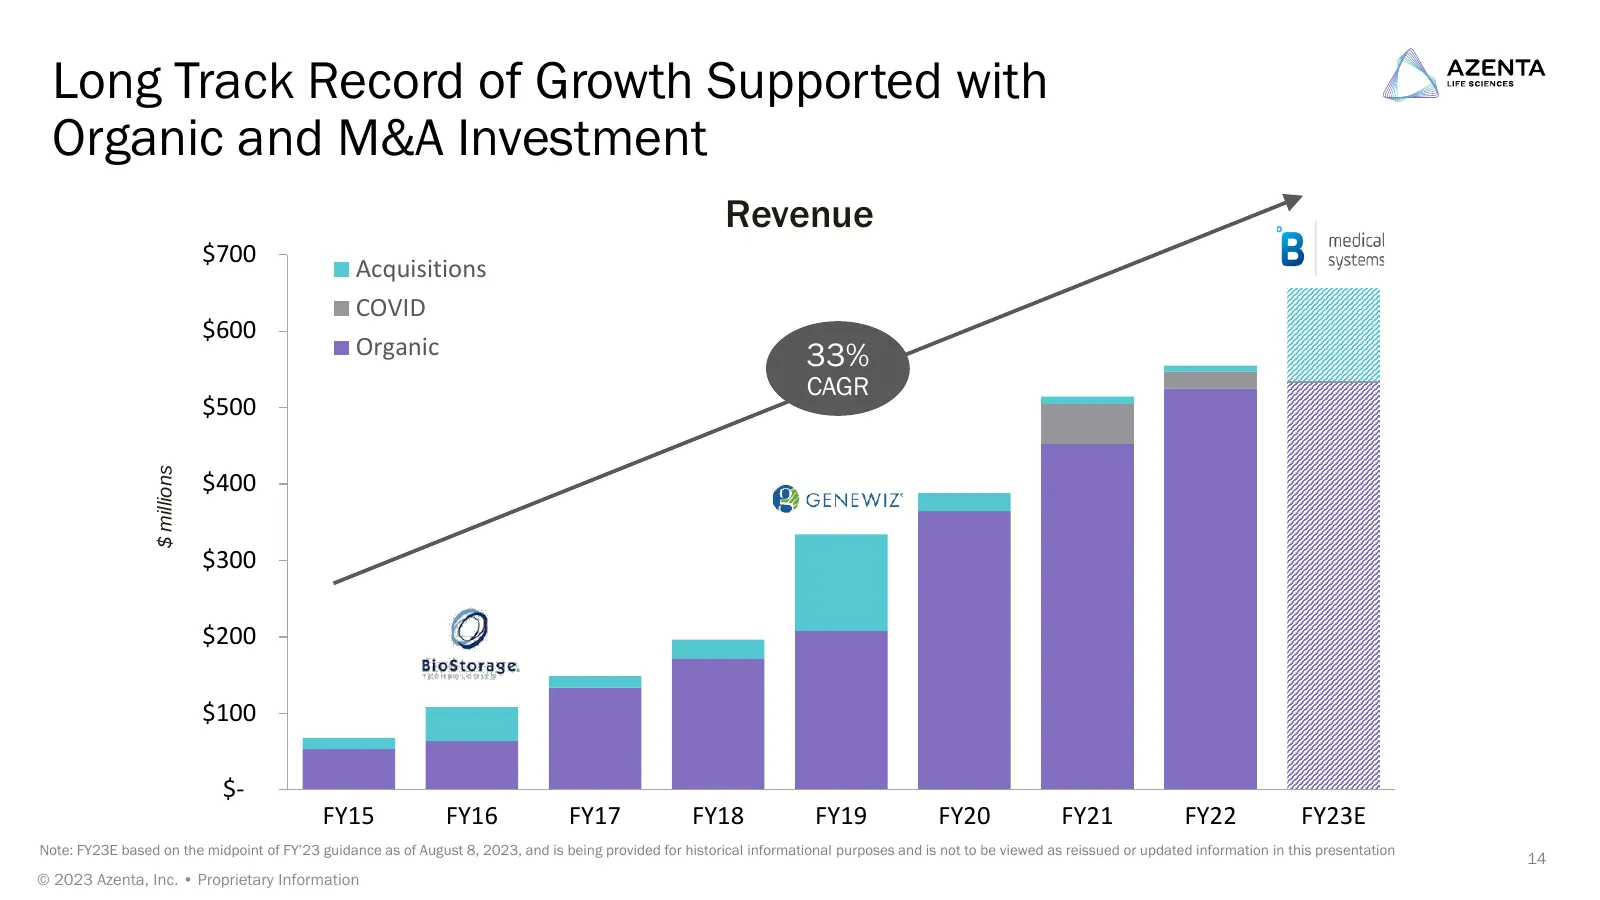
Slide 14: Long Track Record of Growth Supported with Organic and M&A Investment
Long Track Record of Growth Supported with Organic and M&A Investment Revenue $700 Acquisitions COVID $600 Organic 33% CAGR $500 $ millions $400 $300 $200 $100 $- FY15 FY16 FY17 FY18 FY19 FY20 FY21 FY22 FY23E Note: FY23E based on the midpoint of FY’23 guidance as of August 8, 2023, and is being prov
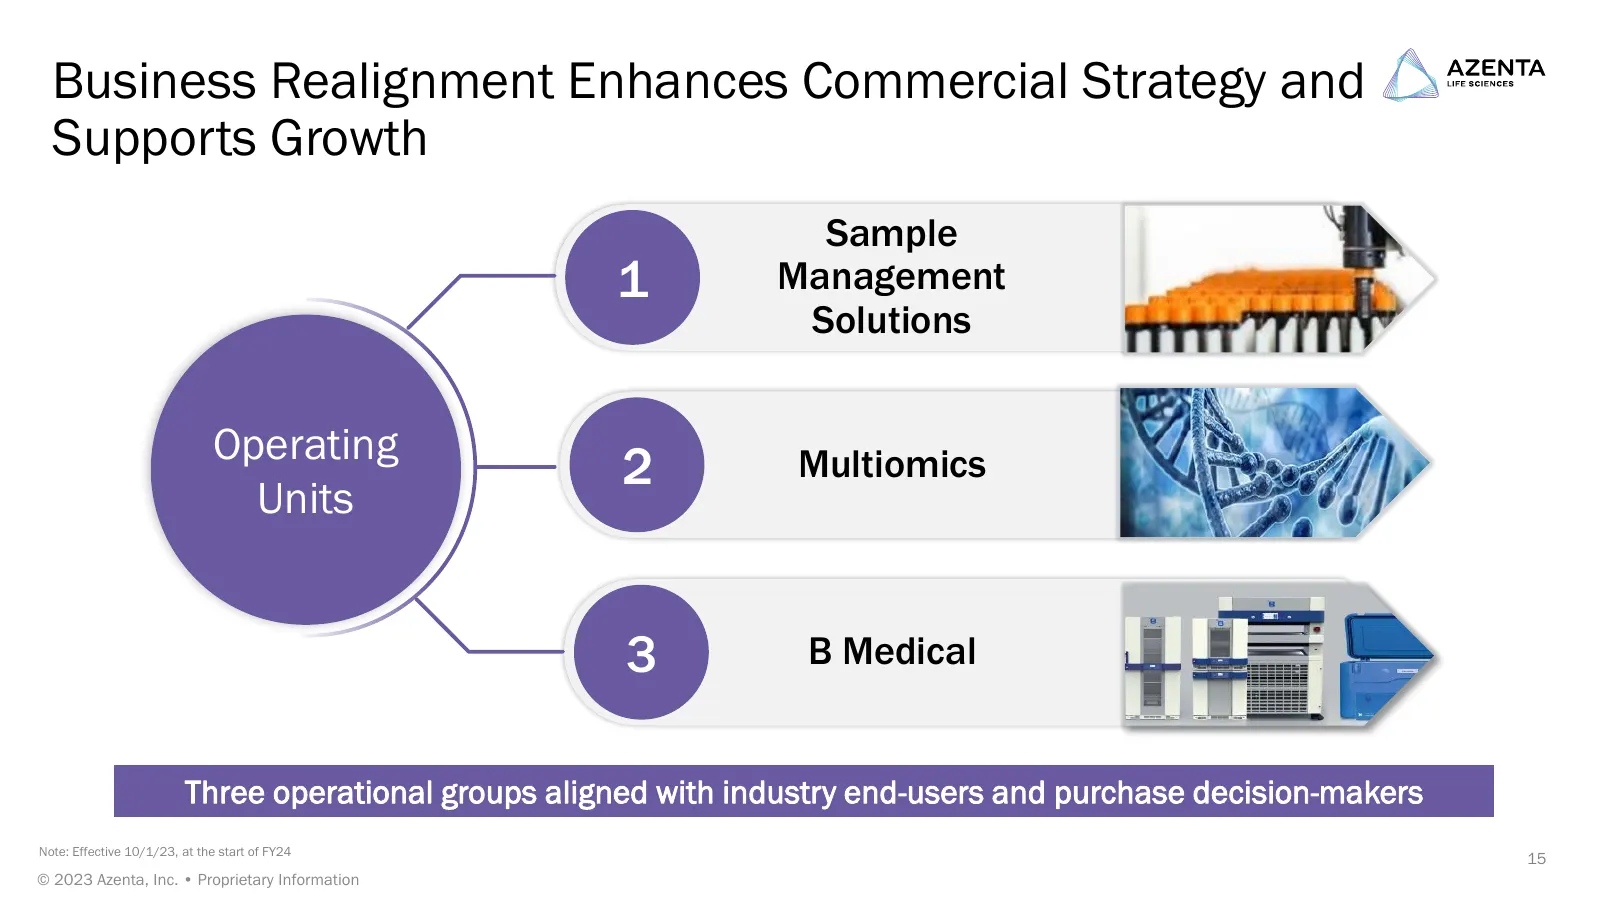
Slide 15: Business Realignment Enhances Commercial Strategy and Supports Growth
Business Realignment Enhances Commercial Strategy and Supports Growth Sample 1 Management Solutions Operating 2 Multiomics Units 3 B Medical Three operational groups aligned with industry end-users and purchase decision-makers Note: Effective 10/1/23, at the start of FY24 15 © 2023 Azenta, Inc. • Pr
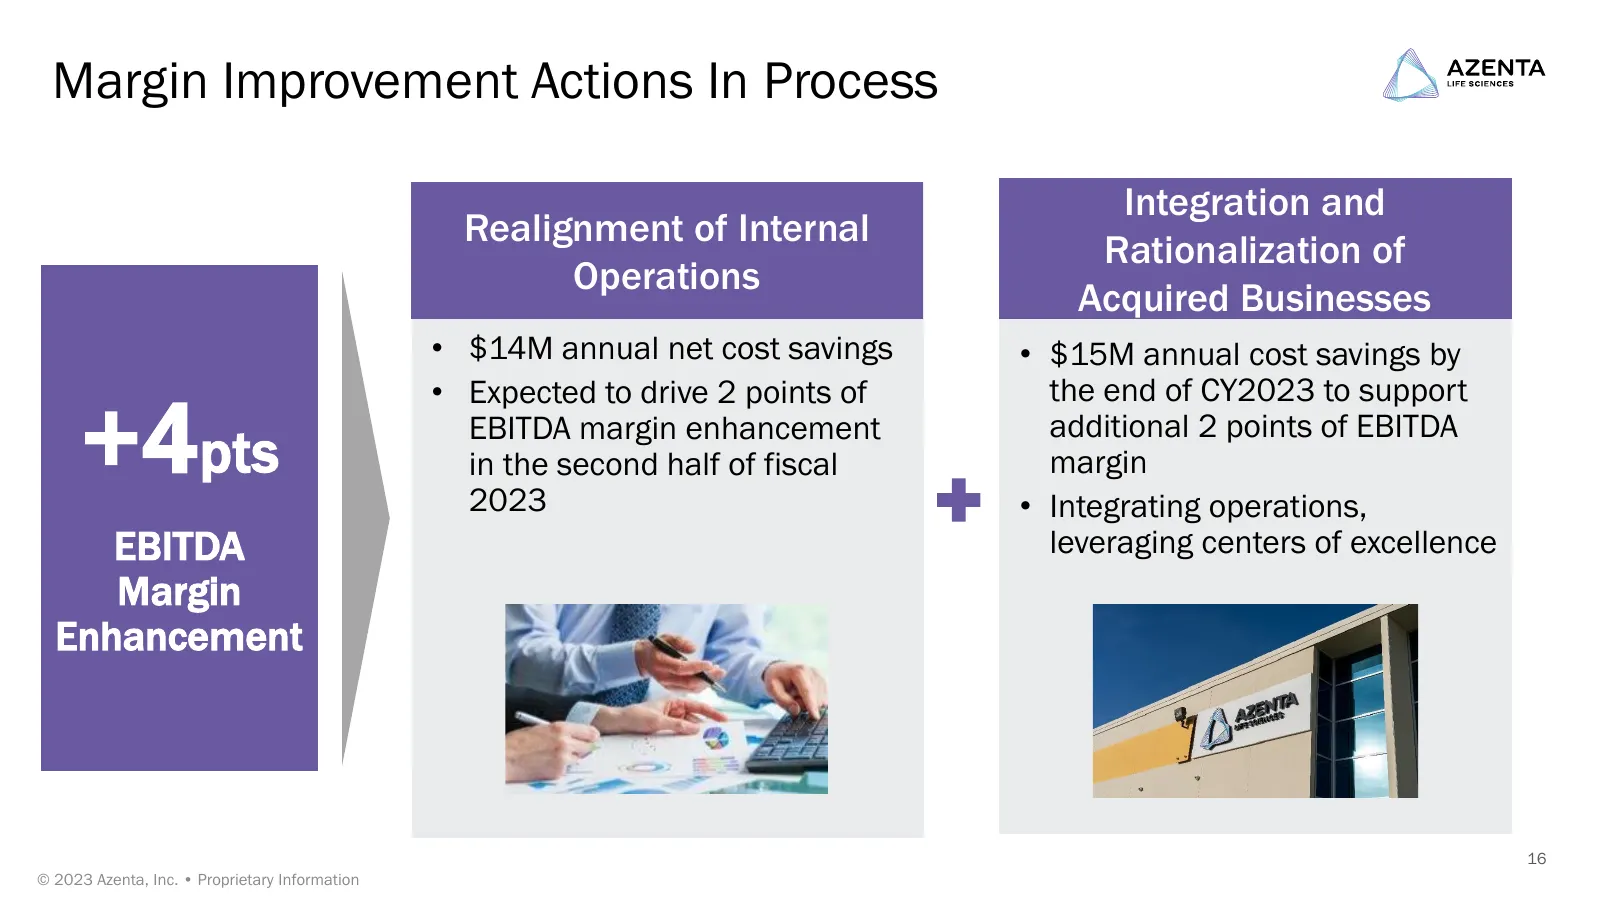
Slide 16: Margin Improvement Actions In Process
Margin Improvement Actions In Process Integration and Realignment of Internal Rationalization of Operations Acquired Businesses • $14M annual net cost savings • $15M annual cost savings by • Expected to drive 2 points of the end of CY2023 to support +4pts EBITDA margin enhancement in the second half
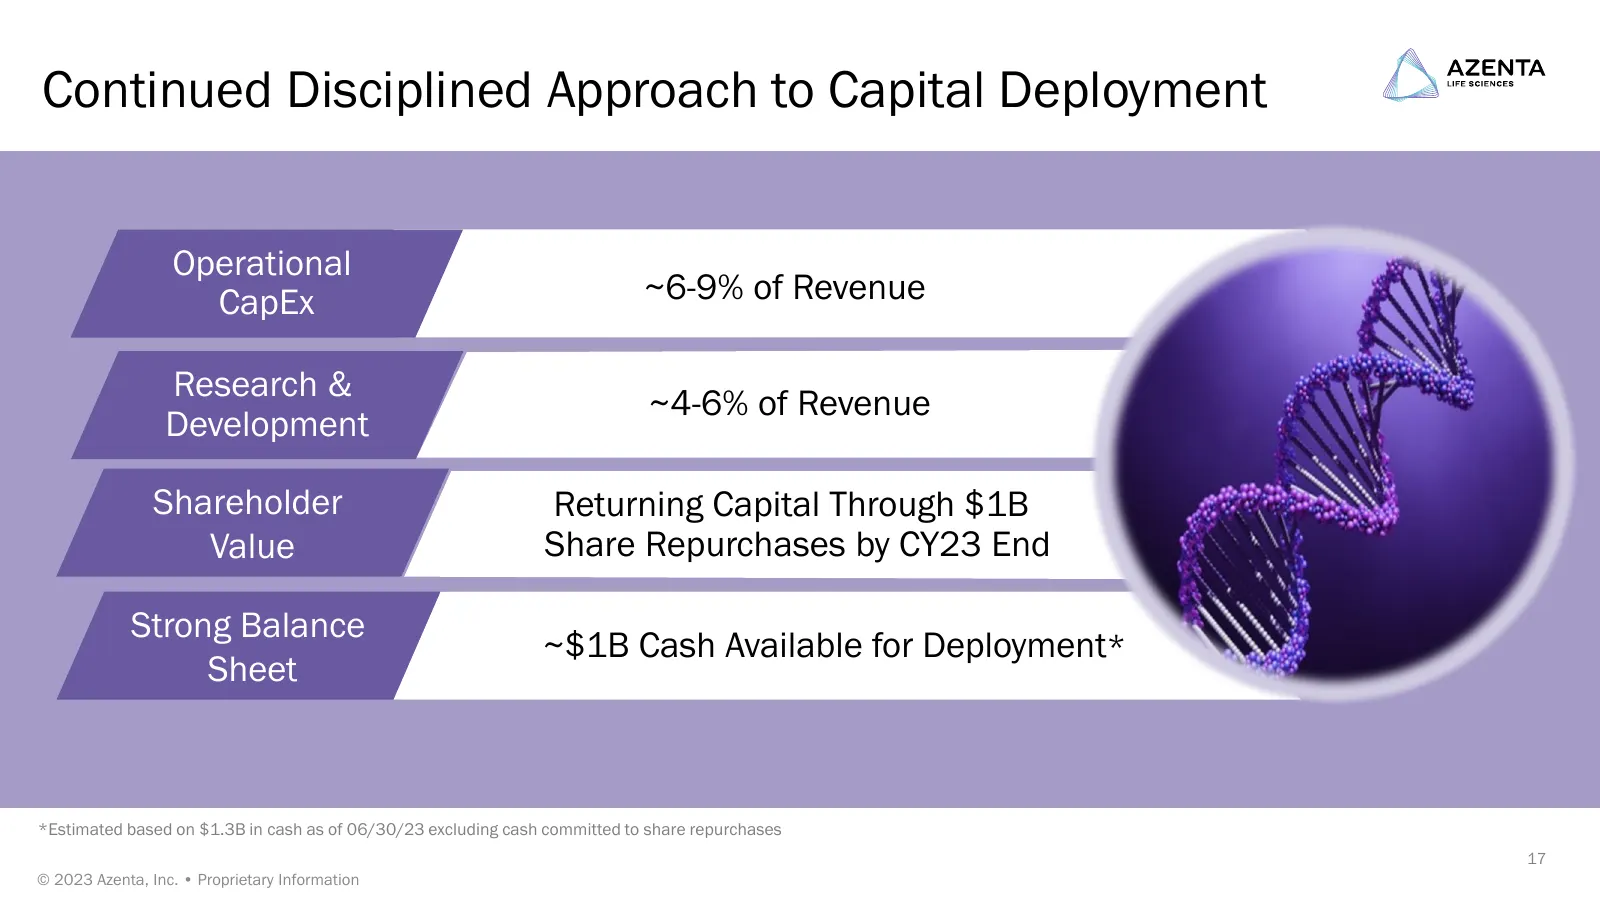
Slide 17: Continued Disciplined Approach to Capital Deployment
Continued Disciplined Approach to Capital Deployment Operational CapEx ~6-9% of Revenue Research & ~4-6% of Revenue Development Shareholder Returning Capital Through $1B Value Share Repurchases by CY23 End Strong Balance ~$1B Cash Available for Deployment* Sheet *Estimated based on $1.3B in cash as
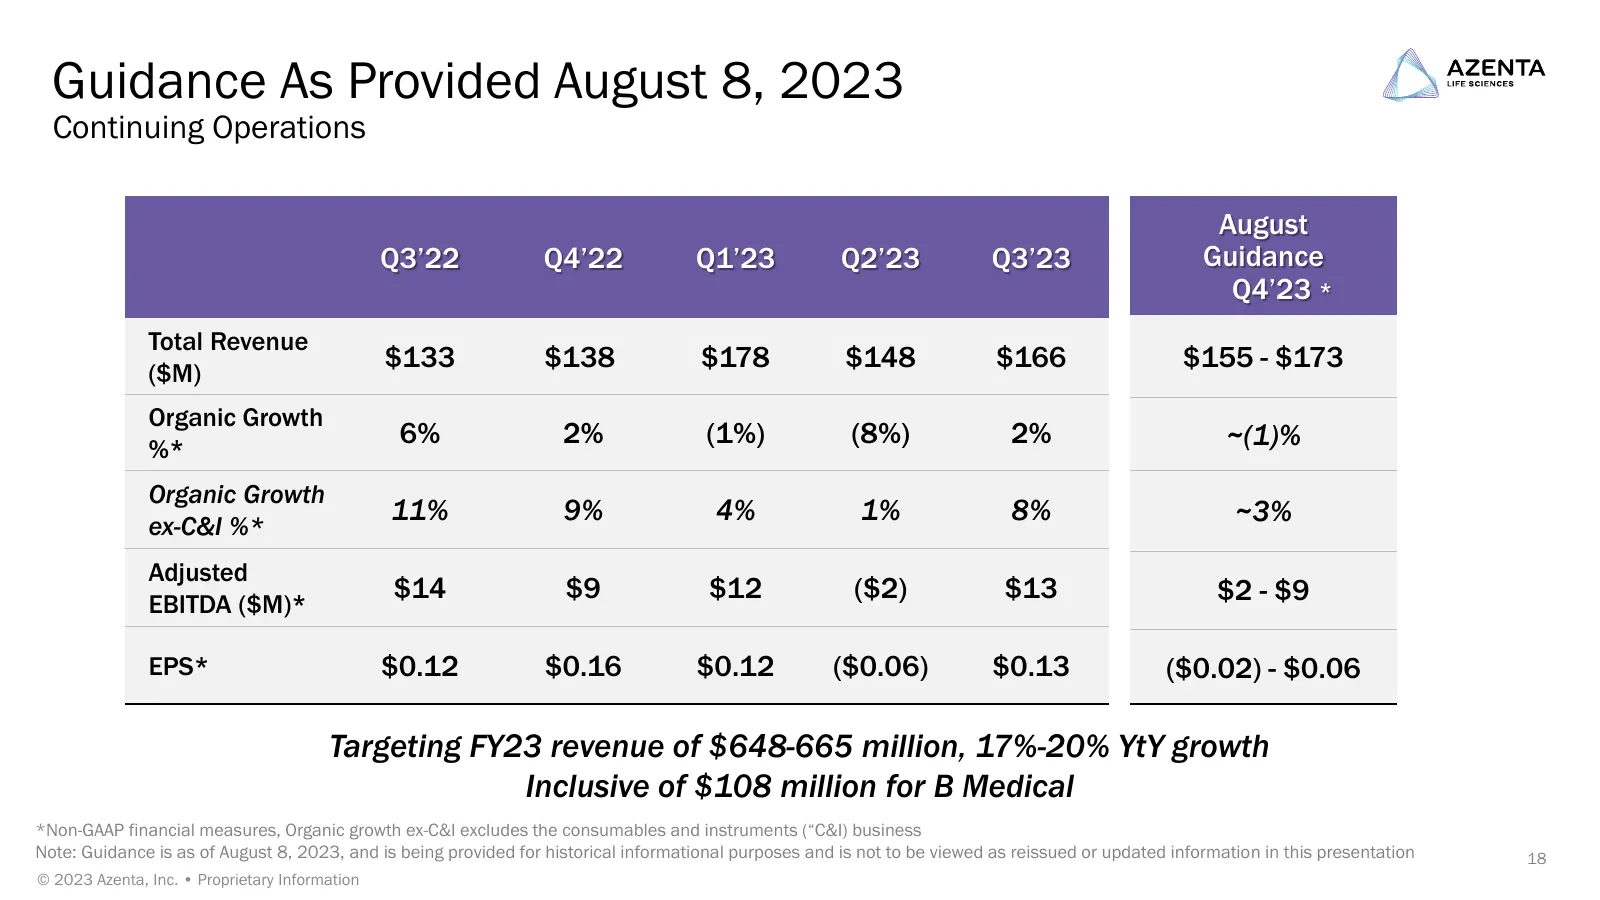
Slide 18: Guidance As Provided August 8, 2023
Guidance As Provided August 8, 2023 Continuing Operations August Q3’22 Q4’22 Q1’23 Q2’23 Q3’23 Guidance Q4’23 * Total Revenue ($M) $133 $138 $178 $148 $166 $155 - $173 Organic Growth %* 6% 2% (1%) (8%) 2% ~(1)% Organic Growth ex-C&I %* 11% 9% 4% 1% 8% ~3% Adjusted EBITDA ($M)* $14 $9 $12 ($2) $13 $2
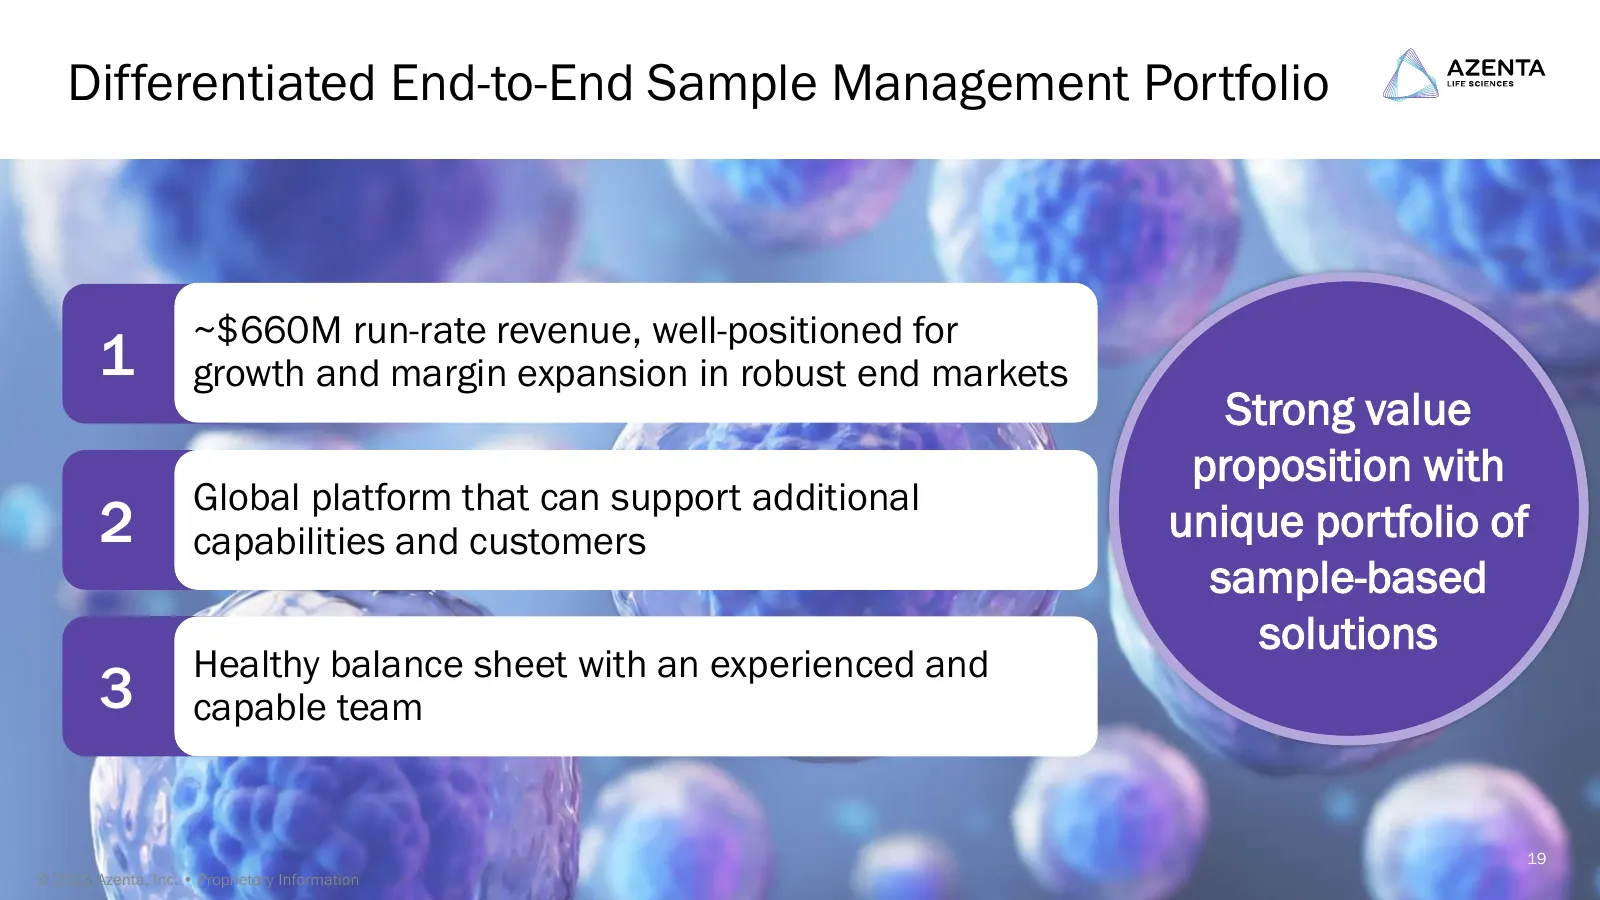
Slide 19: Differentiated End-to-End Sample Management Portfolio
Differentiated End-to-End Sample Management Portfolio ~$660M run-rate revenue, well-positioned for 1 growth and margin expansion in robust end markets Strong value proposition with Global platform that can support additional 2 capabilities and customers unique portfolio of sample-based solutions Hea

Slide 20: Appendix
/ \ AZENTA LIFE SCIENCES Appendix
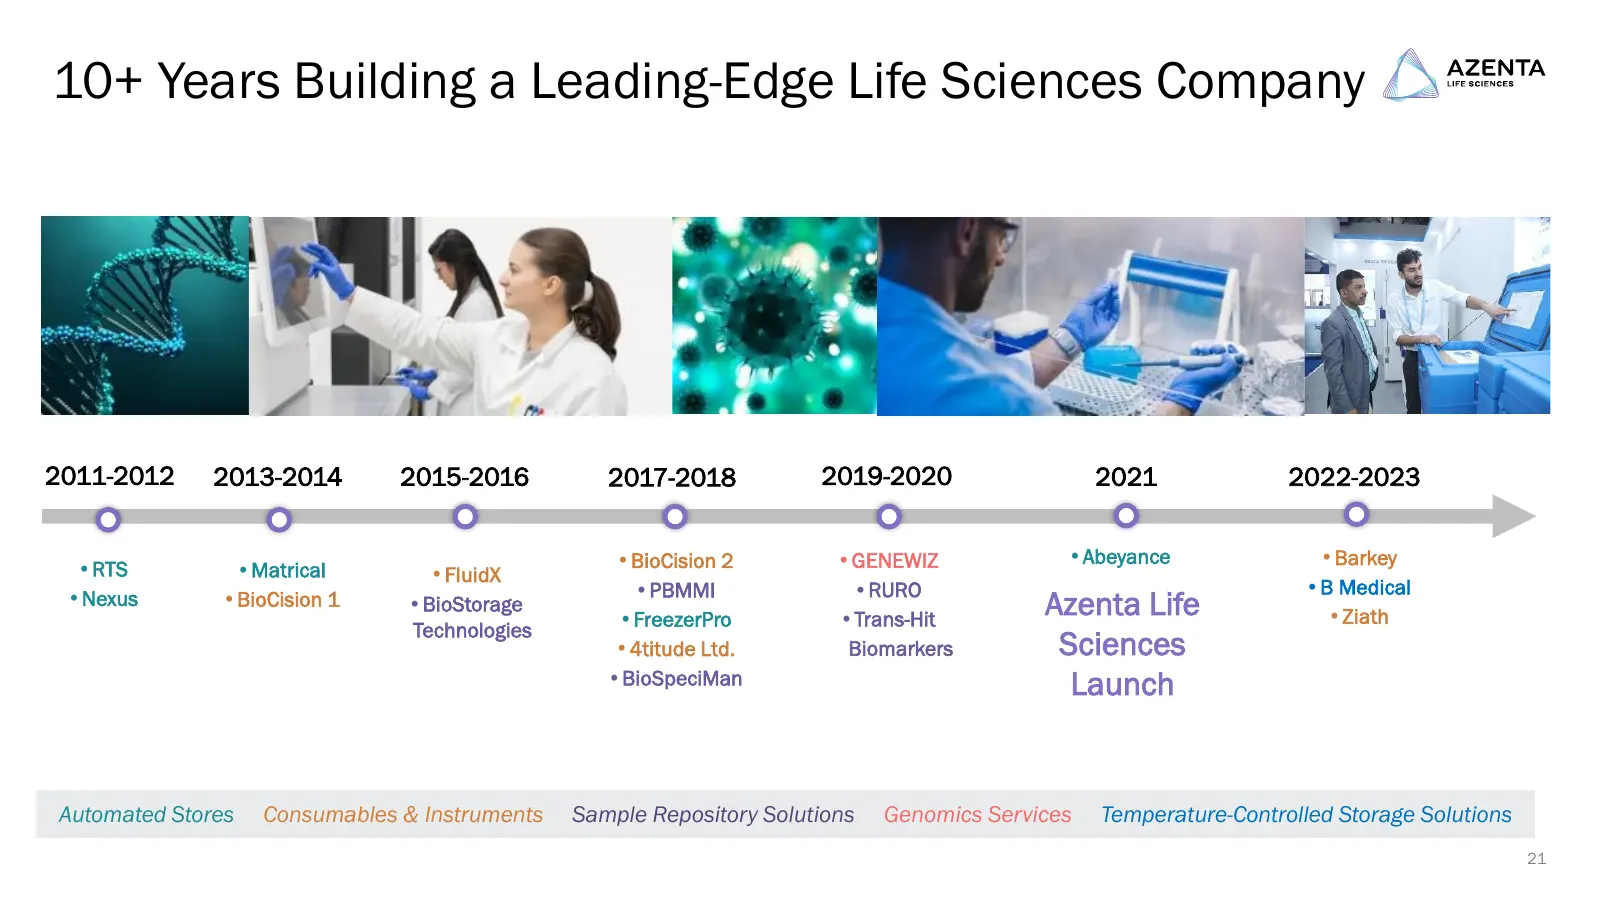
Slide 21: 10+ Years Building a Leading-Edge Life Sciences Company
10+ Years Building a Leading-Edge Life Sciences Company 2011-2012 2013-2014 2015-2016 2017-2018 2019-2020 2021 2022-2023 •BioCision 2 •GENEWIZ •Abeyance •Barkey •RTS •Matrical •FluidX •PBMMI •RURO •B Medical •Nexus •BioCision 1 •BioStorage •FreezerPro •Trans-Hit Azenta Life •Ziath Technologies •4tit
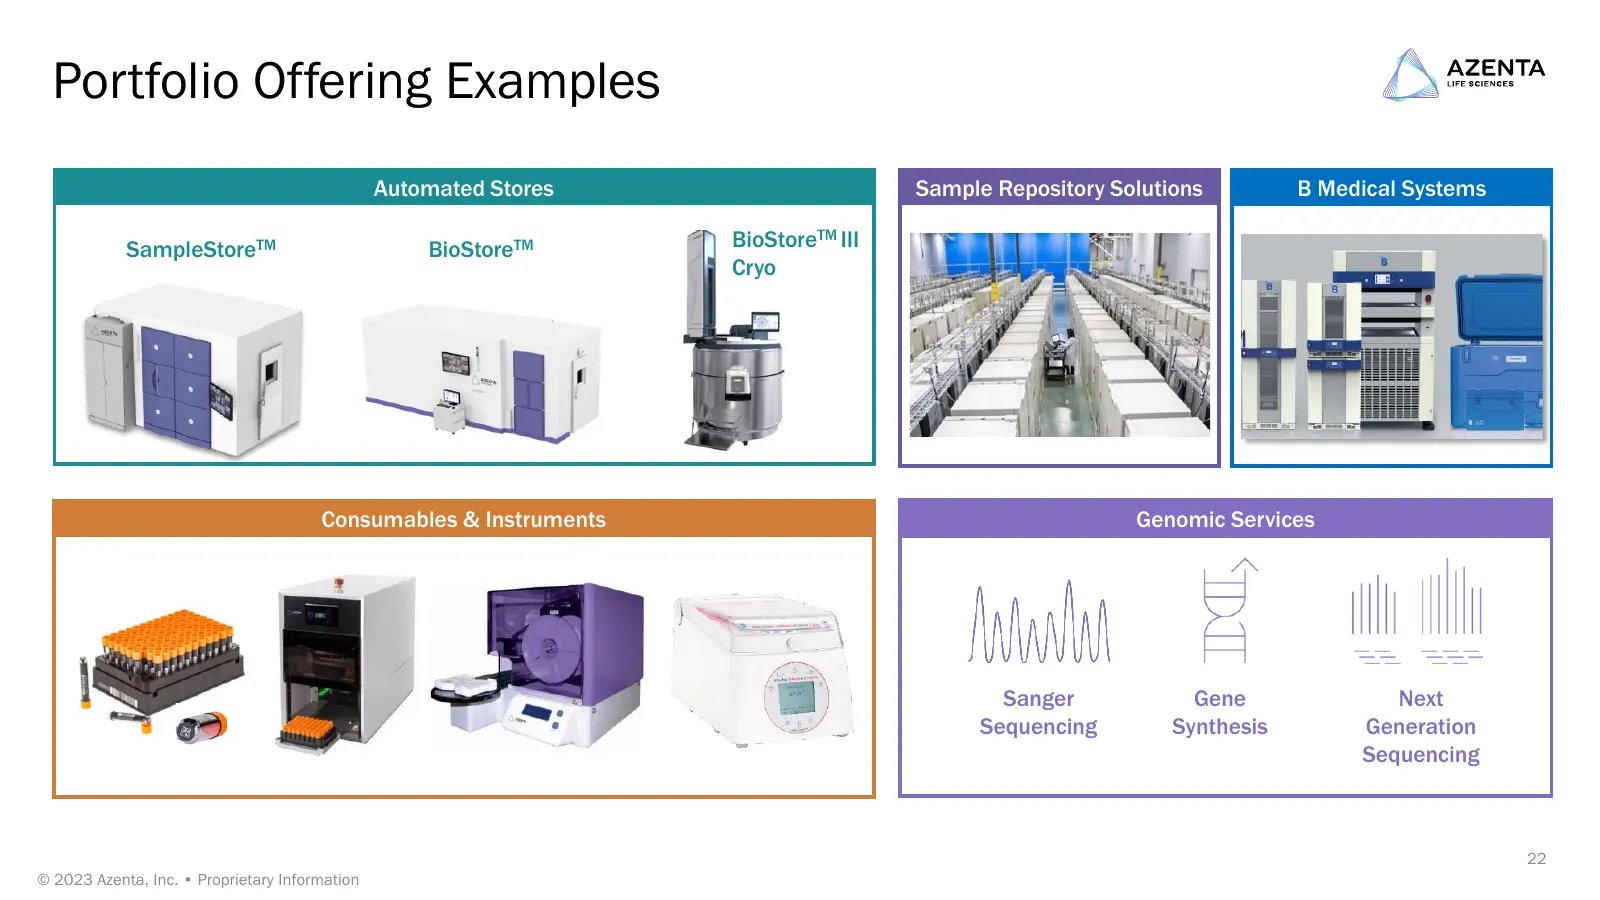
Slide 22: Portfolio Offering Examples
Portfolio Offering Examples Automated Stores Sample Repository Solutions B Medical Systems SampleStoreTM BioStoreTM BioStoreTM III Cryo Consumables & Instruments Genomic Services Sanger Gene Next Sequencing Synthesis Generation Sequencing 22 © 2023 Azenta, Inc. • Proprietary Information

Slide 23: Conference Call Third Quarter Fiscal 2023 Financial Results
Conference Call Third Quarter Fiscal 2023 Financial Results August 8, 2023
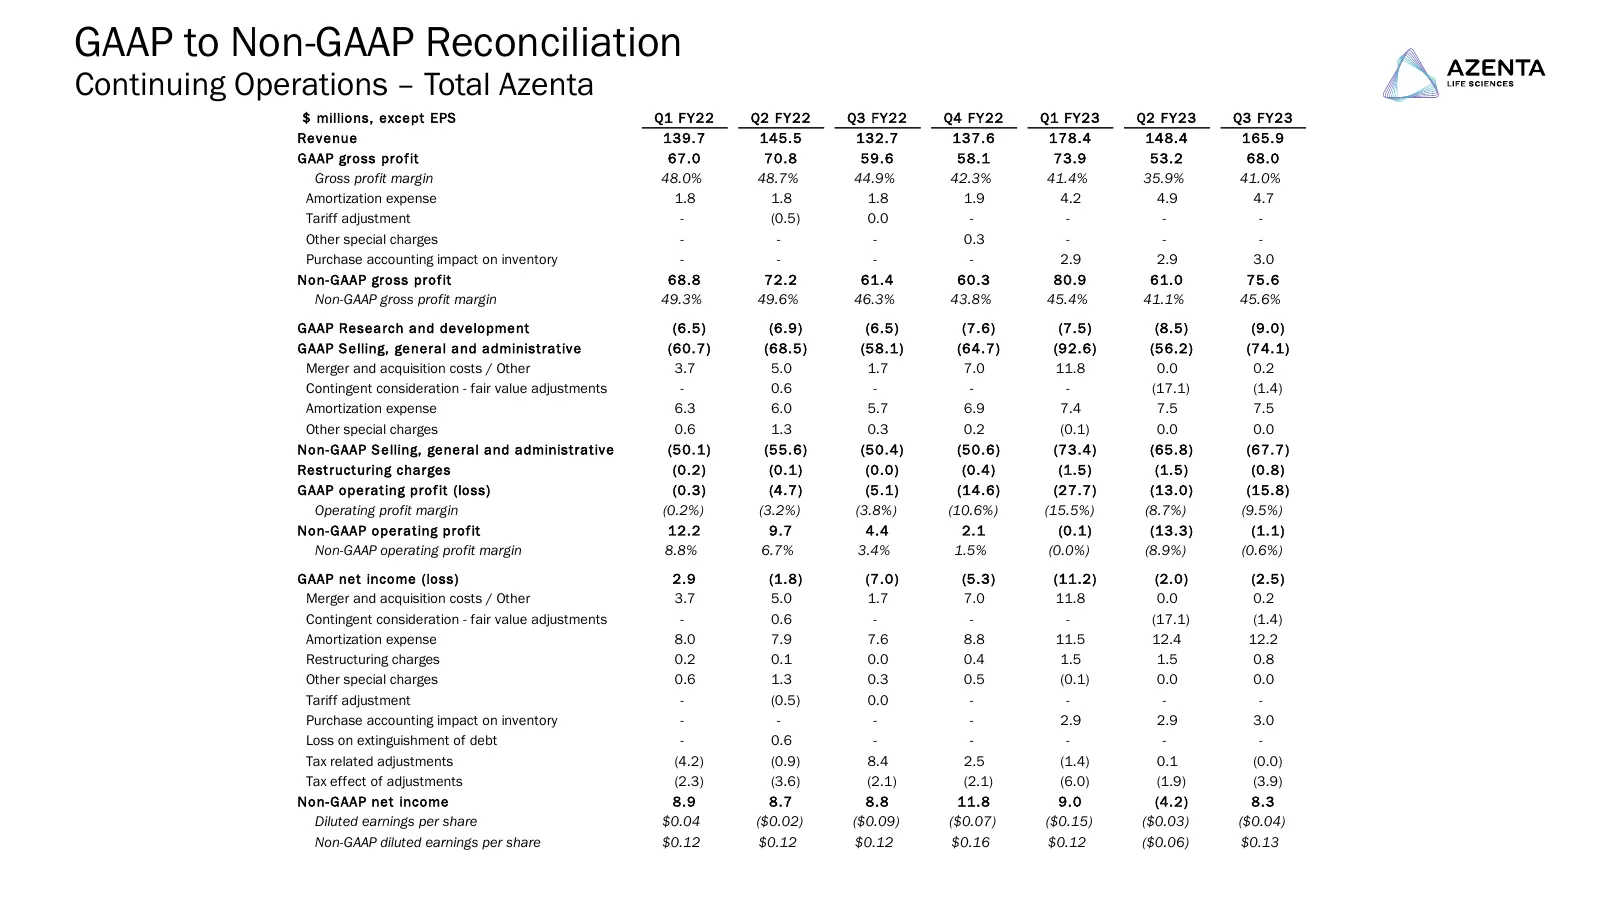
Slide 24: GAAP to Non-GAAP Reconciliation
GAAP to Non-GAAP Reconciliation Continuing Operations – Total Azenta $ millions, except EPS Q1 FY22 Q2 FY22 Q3 FY22 Q4 FY22 Q1 FY23 Q2 FY23 Q3 FY23 Revenue 139.7 145.5 132.7 137.6 178.4 148.4 165.9 GAAP gross profit 67.0 70.8 59.6 58.1 73.9 53.2 68.0 Gross profit margin 48.0% 48.7% 44.9% 42.3% 41.4%
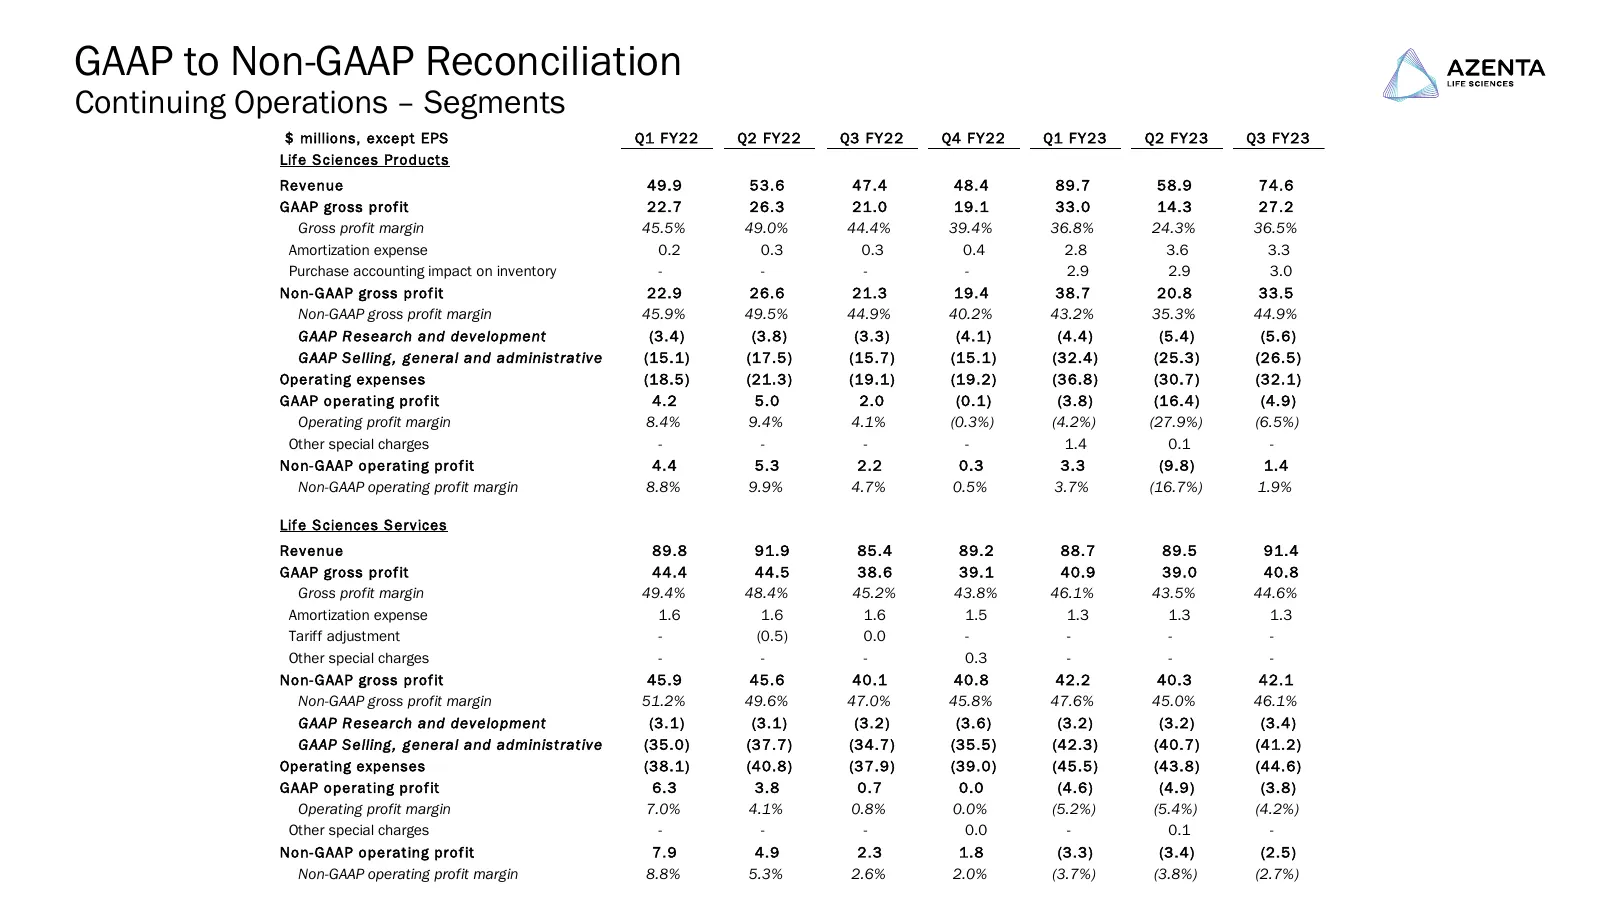
Slide 25: GAAP to Non-GAAP Reconciliation – Segments
GAAP to Non-GAAP Reconciliation Continuing Operations – Segments $ millions, except EPS Q1 FY22 Q2 FY22 Q3 FY22 Q4 FY22 Q1 FY23 Q2 FY23 Q3 FY23 Life Sciences Products Revenue 49.9 53.6 47.4 48.4 89.7 58.9 74.6 GAAP gross profit 22.7 26.3 21.0 19.1 33.0 14.3 27.2 Gross profit margin 45.5% 49.0% 44.4%
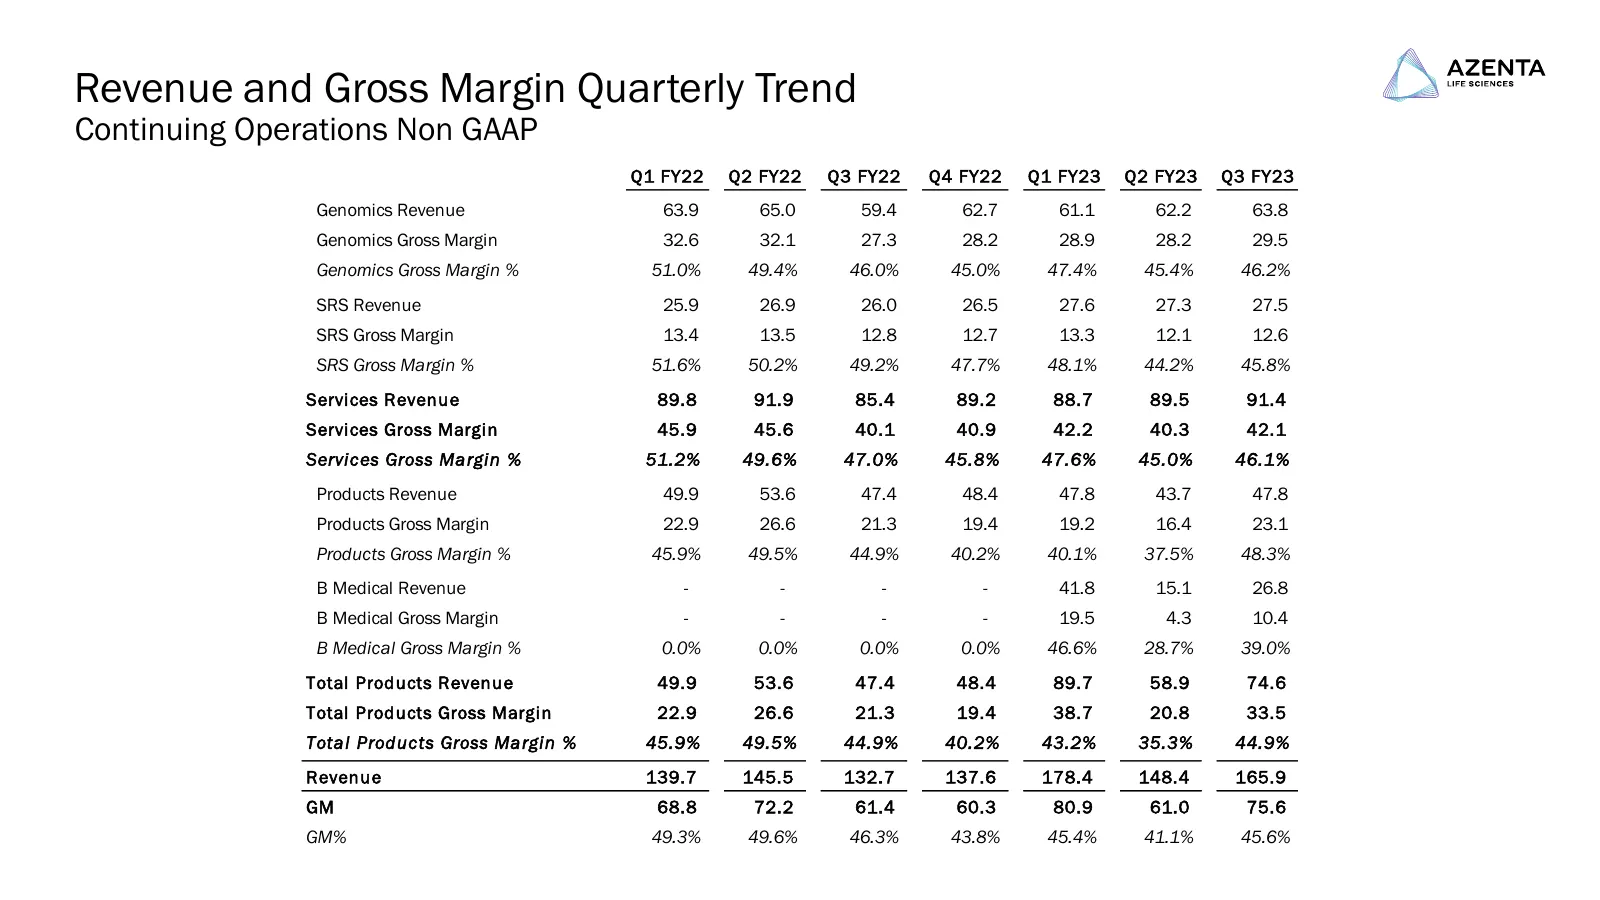
Slide 26: Revenue and Gross Margin Quarterly Trend
Revenue and Gross Margin Quarterly Trend Continuing Operations Non GAAP Q1 FY22 Q2 FY22 Q3 FY22 Q4 FY22 Q1 FY23 Q2 FY23 Q3 FY23 Genomics Revenue 63.9 65.0 59.4 62.7 61.1 62.2 63.8 Genomics Gross Margin 32.6 32.1 27.3 28.2 28.9 28.2 29.5 Genomics Gross Margin % 51.0% 49.4% 46.0% 45.0% 47.4% 45.4% 46.
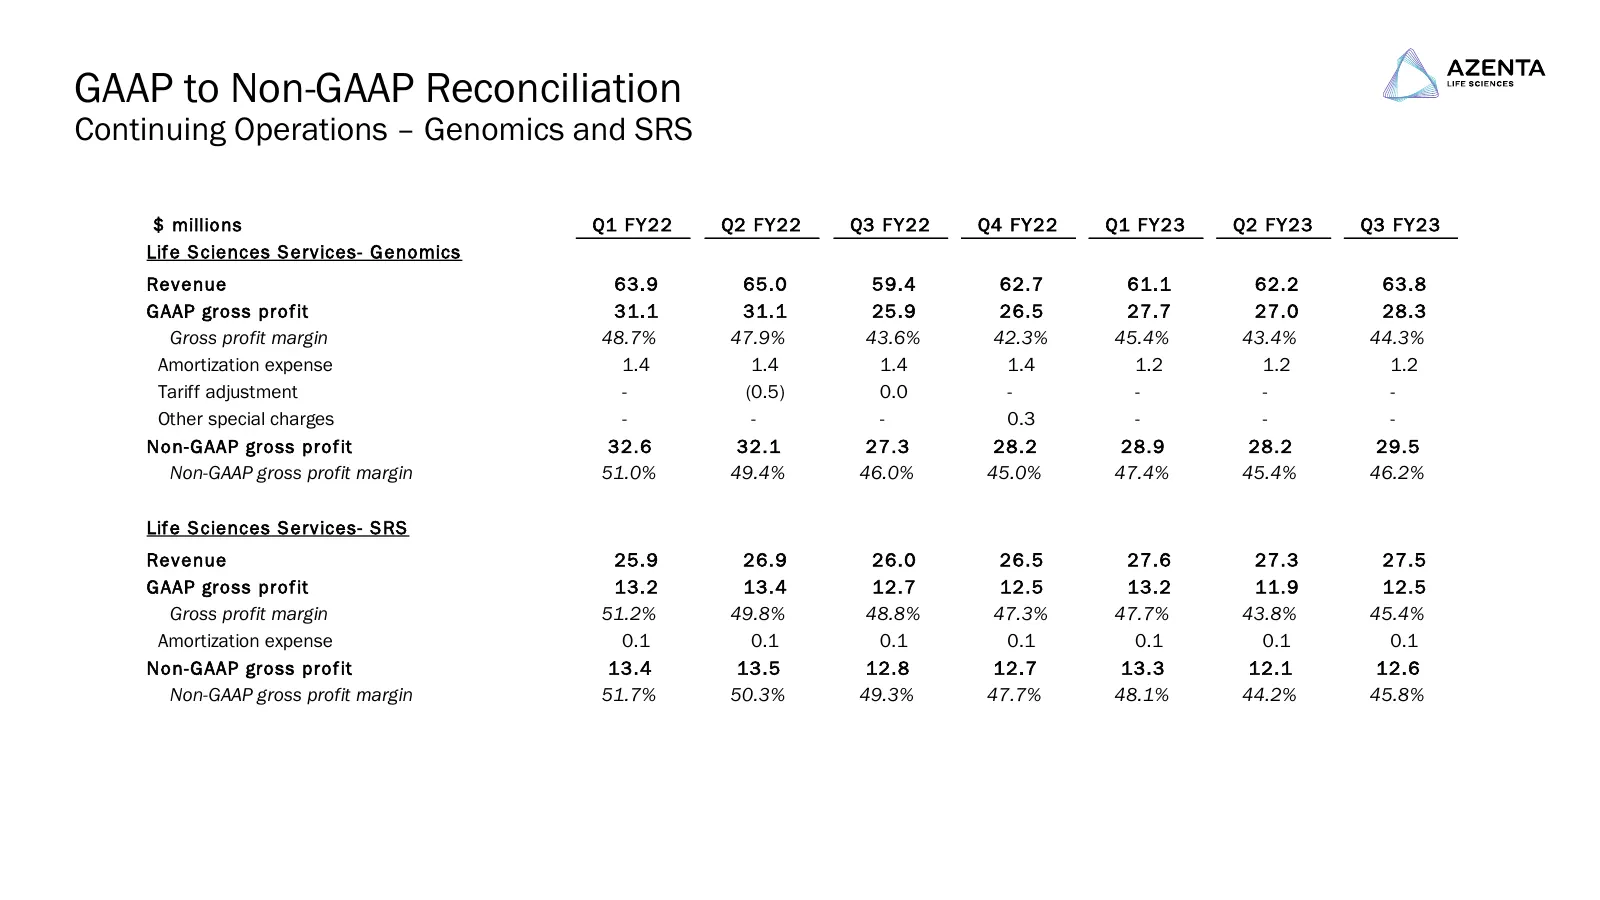
Slide 27: GAAP to Non-GAAP Reconciliation – Genomics and SRS
GAAP to Non-GAAP Reconciliation Continuing Operations – Genomics and SRS $ millions Q1 FY22 Q2 FY22 Q3 FY22 Q4 FY22 Q1 FY23 Q2 FY23 Q3 FY23 Life Sciences Services- Genomics Revenue 63.9 65.0 59.4 62.7 61.1 62.2 63.8 GAAP gross profit 31.1 31.1 25.9 26.5 27.7 27.0 28.3 Gross profit margin 48.7% 47.9%
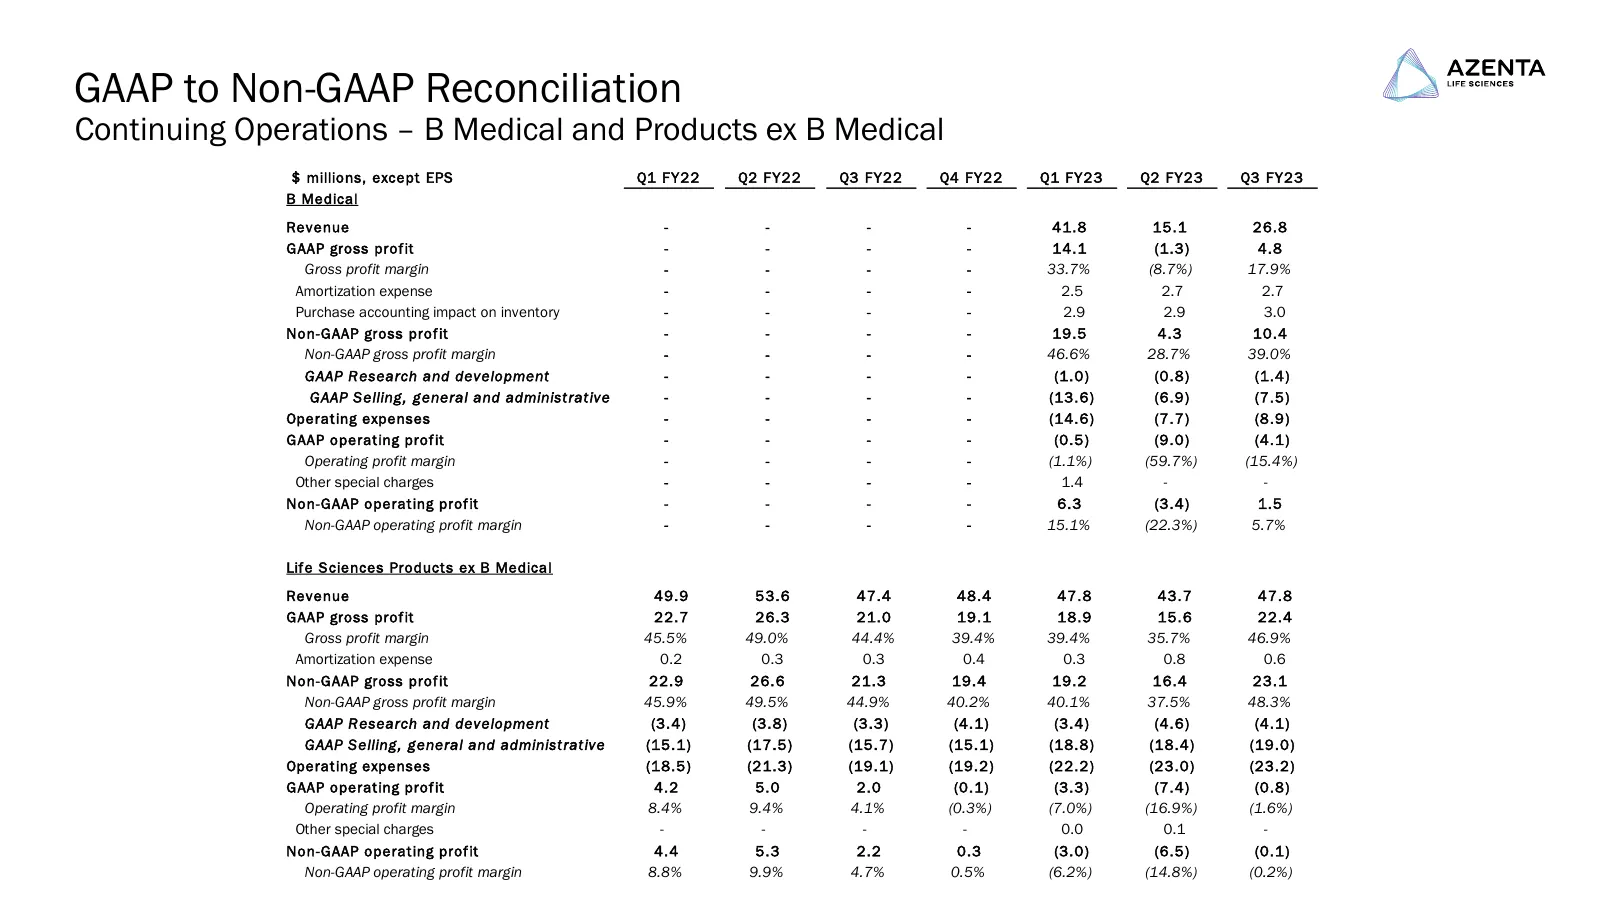
Slide 28: GAAP to Non-GAAP Reconciliation – B Medical and Products ex B Medical
GAAP to Non-GAAP Reconciliation Continuing Operations – B Medical and Products ex B Medical $ millions, except EPS Q1 FY22 Q2 FY22 Q3 FY22 Q4 FY22 Q1 FY23 Q2 FY23 Q3 FY23 B Medical Revenue - - - - 41.8 15.1 26.8 GAAP gross profit - - - - 14.1 (1.3) 4.8 Gross profit margin - - - - 33.7% (8.7%) 17.9%
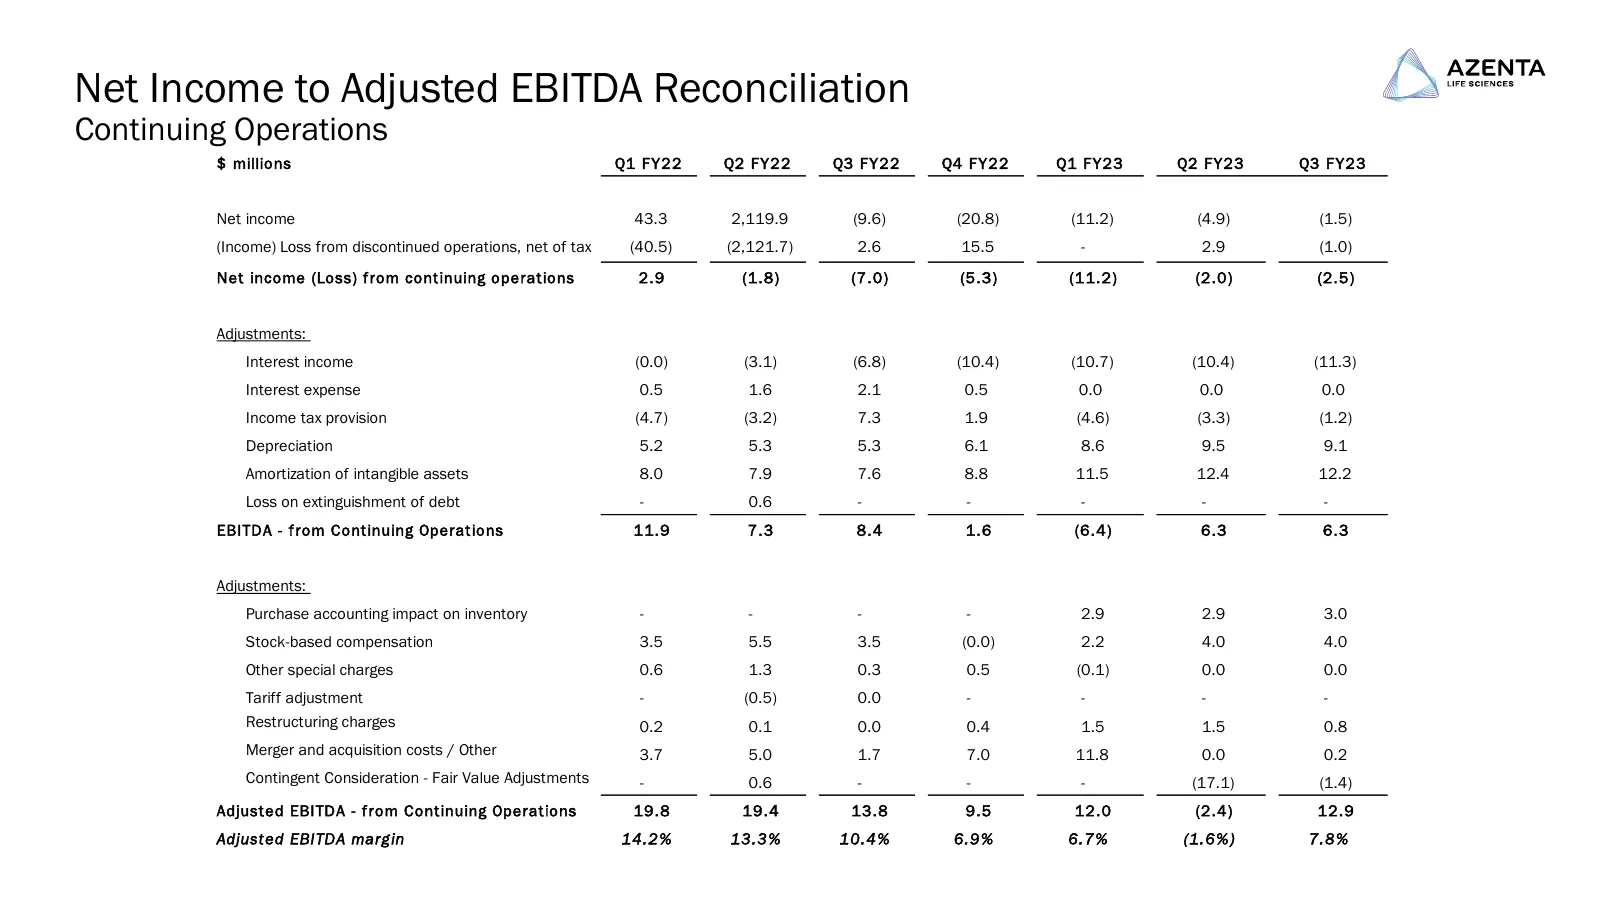
Slide 29: Net Income to Adjusted EBITDA Reconciliation
Net Income to Adjusted EBITDA Reconciliation Continuing Operations $ millions Q1 FY22 Q2 FY22 Q3 FY22 Q4 FY22 Q1 FY23 Q2 FY23 Q3 FY23 Net income 43.3 2,119.9 (9.6) (20.8) (11.2) (4.9) (1.5) (Income) Loss from discontinued operations, net of tax (40.5) (2,121.7) 2.6 15.5 - 2.9 (1.0) Net income (Loss)
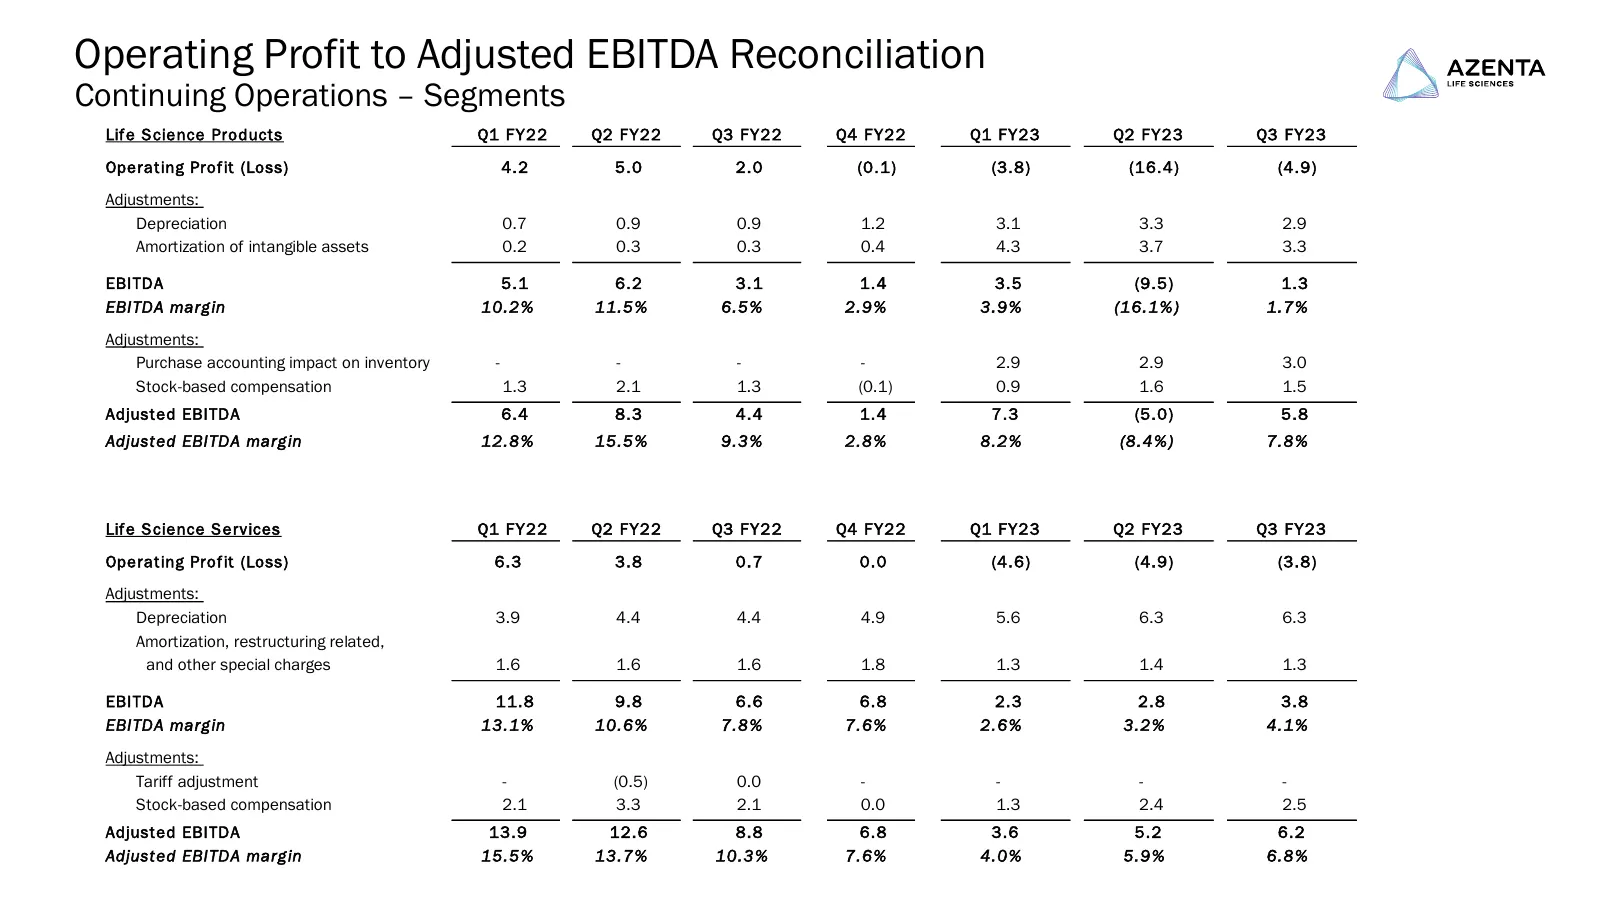
Slide 30: Operating Profit to Adjusted EBITDA Reconciliation
Operating Profit to Adjusted EBITDA Reconciliation Continuing Operations – Segments Life Science Products Q1 FY22 Q2 FY22 Q3 FY22 Q4 FY22 Q1 FY23 Q2 FY23 Q3 FY23 Operating Profit (Loss) 4.2 5.0 2.0 (0.1) (3.8) (16.4) (4.9) Adjustments: Depreciation 0.7 0.9 0.9 1.2 3.1 3.3 2.9 Amortization of intangi
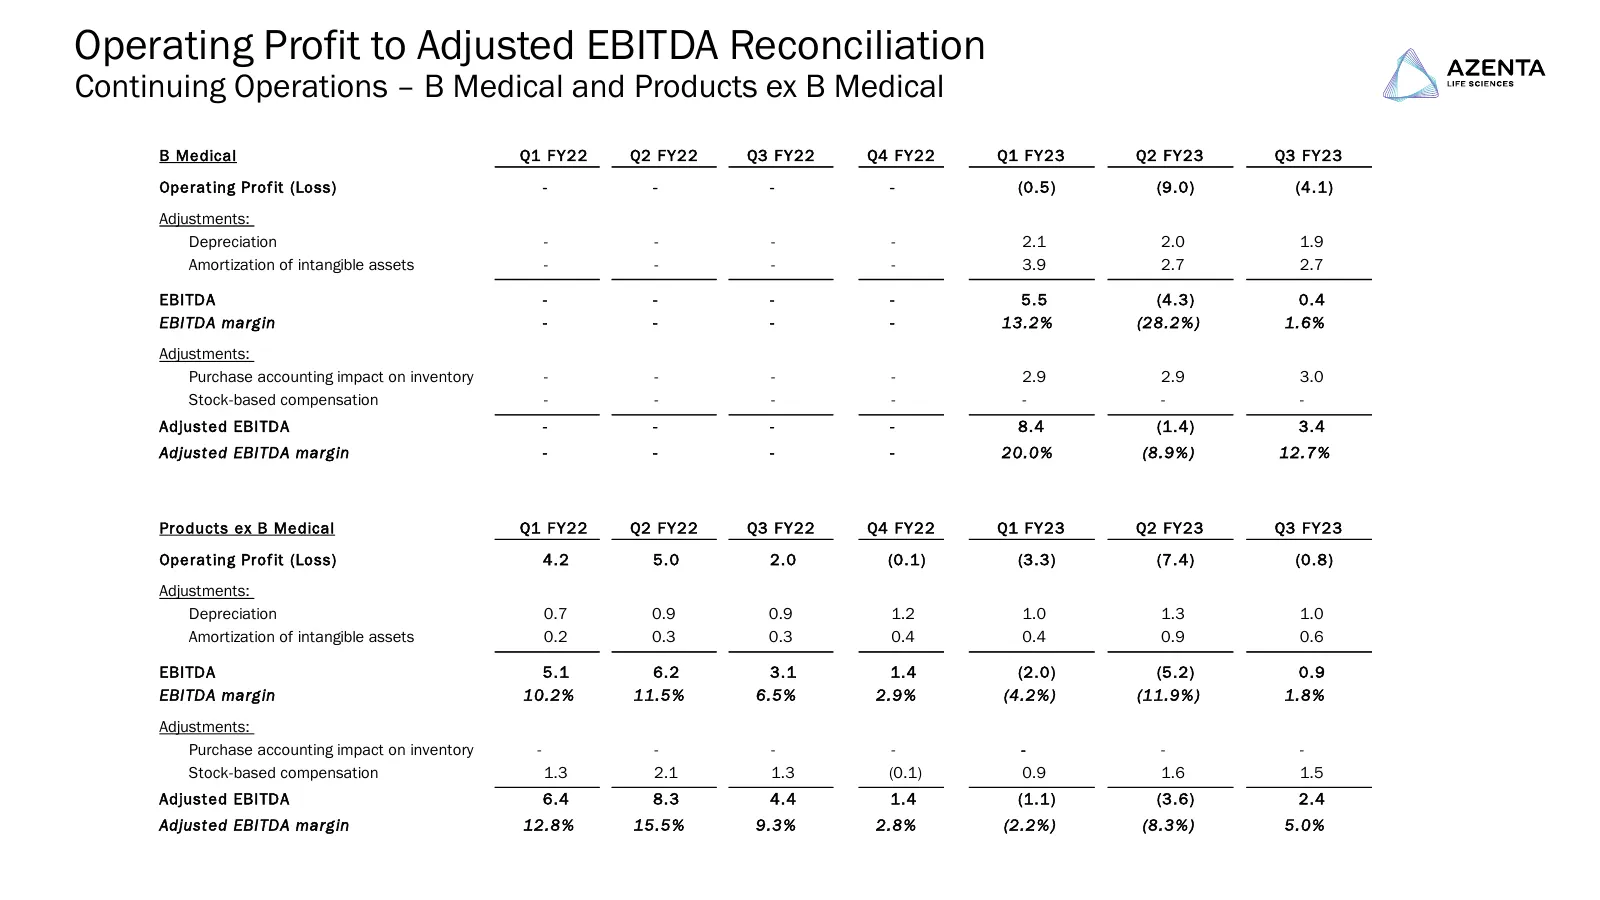
Slide 31: Operating Profit to Adjusted EBITDA Reconciliation
Operating Profit to Adjusted EBITDA Reconciliation Continuing Operations – B Medical and Products ex B Medical B Medical Q1 FY22 Q2 FY22 Q3 FY22 Q4 FY22 Q1 FY23 Q2 FY23 Q3 FY23 Operating Profit (Loss) - - - - (0.5) (9.0) (4.1) Adjustments: Depreciation - - - - 2.1 2.0 1.9 Amortization of intangible
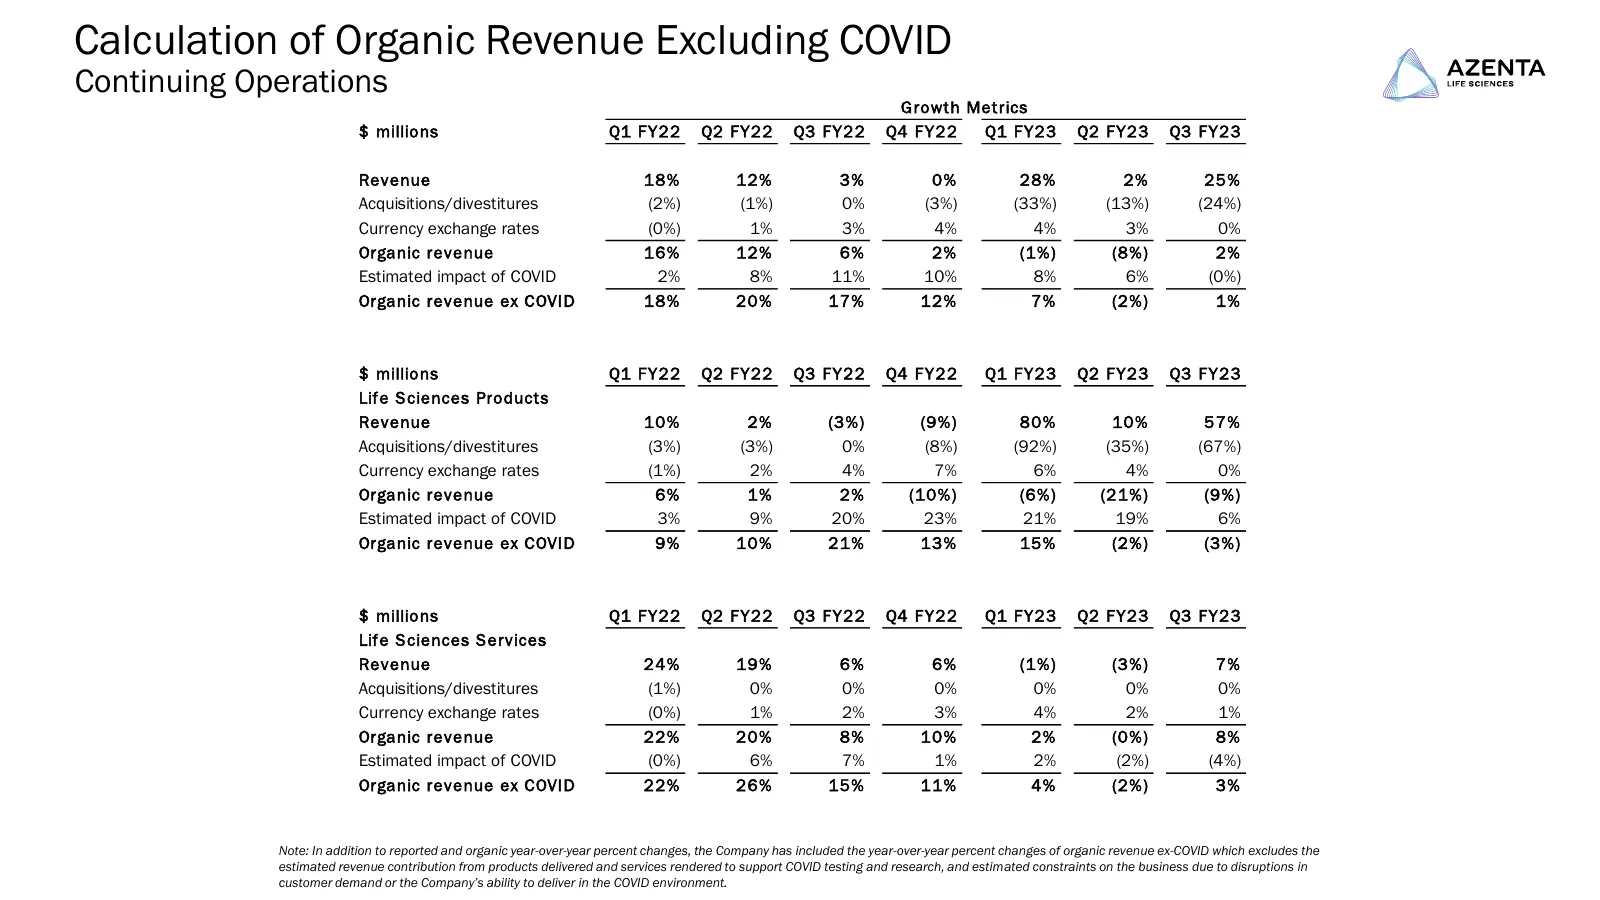
Slide 32: Calculation of Organic Revenue Excluding COVID
Calculation of Organic Revenue Excluding COVID Continuing Operations Growth Metrics $ millions Q1 FY22 Q2 FY22 Q3 FY22 Q4 FY22 Q1 FY23 Q2 FY23 Q3 FY23 Revenue 18% 12% 3% 0% 28% 2% 25% Acquisitions/divestitures (2%) (1%) 0% (3%) (33%) (13%) (24%) Currency exchange rates (0%) 1% 3% 4% 4% 3% 0% Organic
Source: company website
More decks from Azenta, Inc.
 Q4 2026 Earnings Presentation14 slides · Nov 11, 2026
 Q4 2026 Earnings Presentation14 slides · Nov 11, 2026
 Q3 2026 Earnings Presentation13 slides · Aug 5, 2026
 Q2 2026 Earnings Presentation13 slides · May 6, 2026
 Q1 2026 Earnings Presentation13 slides · Feb 4, 2026
 Investor Day (December 2025)67 slides · Dec 10, 2025