NN Group N.V. · EURONEXT:NN
NN — Q4 2019 Earnings Presentation
22 slides from NN's earnings presentation, Feb 13, 2020

Slide 1: Fourth quarter 2019 results
Fourth quarter 2019 results 13 February 2020
Slide 2: Highlights
Highlights David Knibbe, CEO 2
Slide 3: Highlights 4Q19
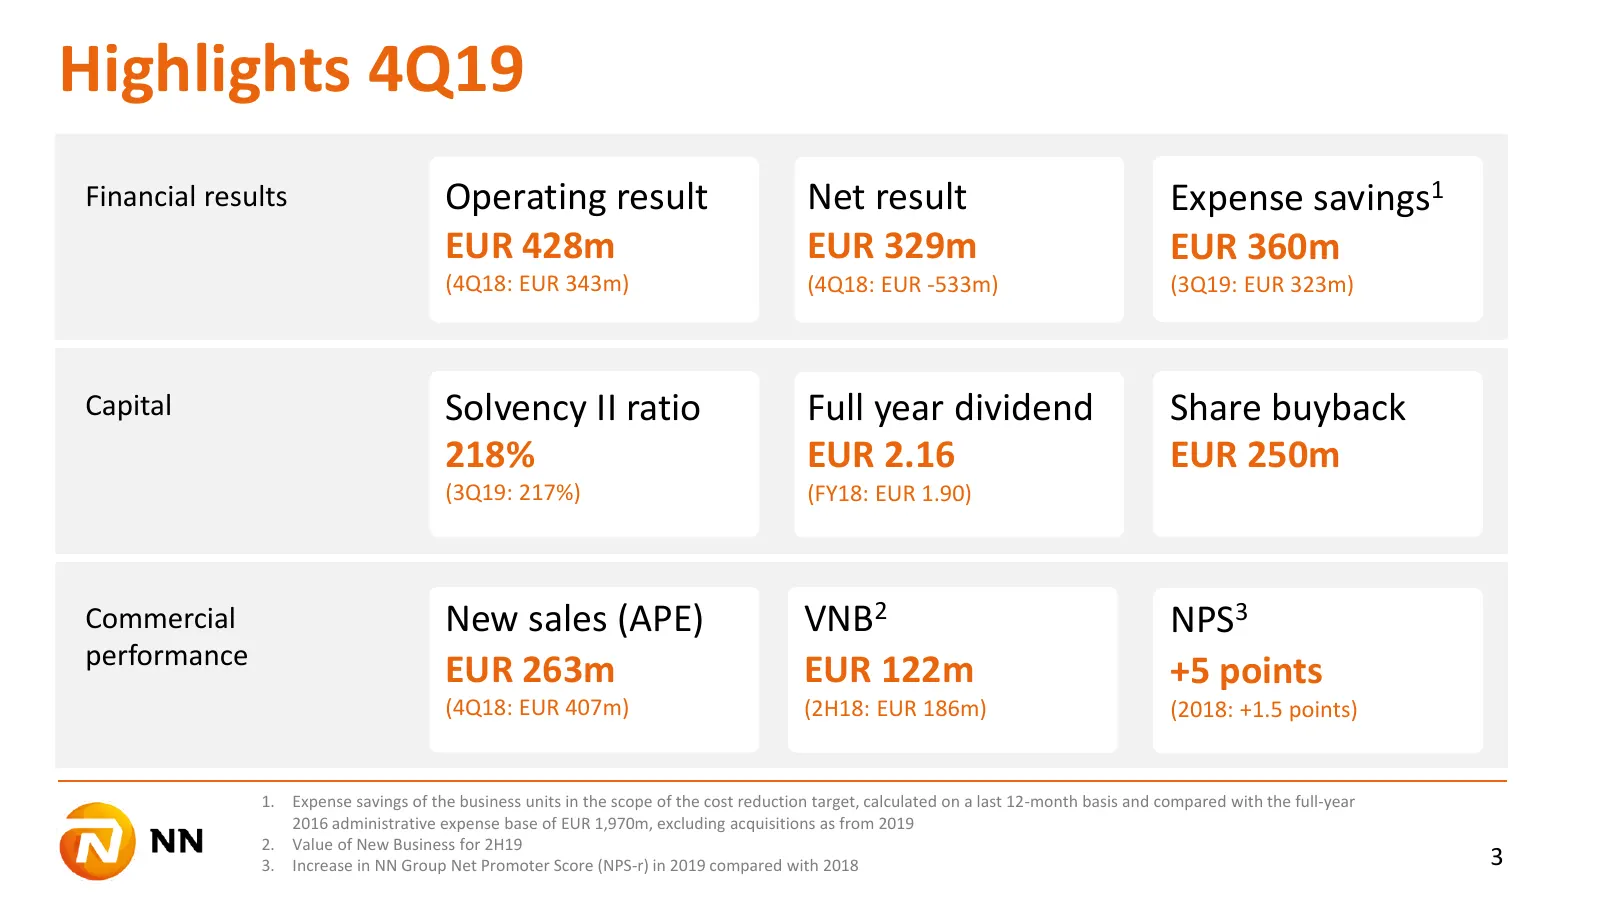
Highlights 4Q19 Financial results Operating result Net result Expense savings1 EUR 428m EUR 329m EUR 360m (4Q18: EUR 343m) (4Q18: EUR -533m) (3Q19: EUR 323m) Capital Solvency II ratio Full year dividend Share buyback 218% EUR 2.16 EUR 250m (3Q19: 217%) (FY18: EUR 1.90) Commercial New sales (APE) VNB
Slide 4: Focus on profitable growth
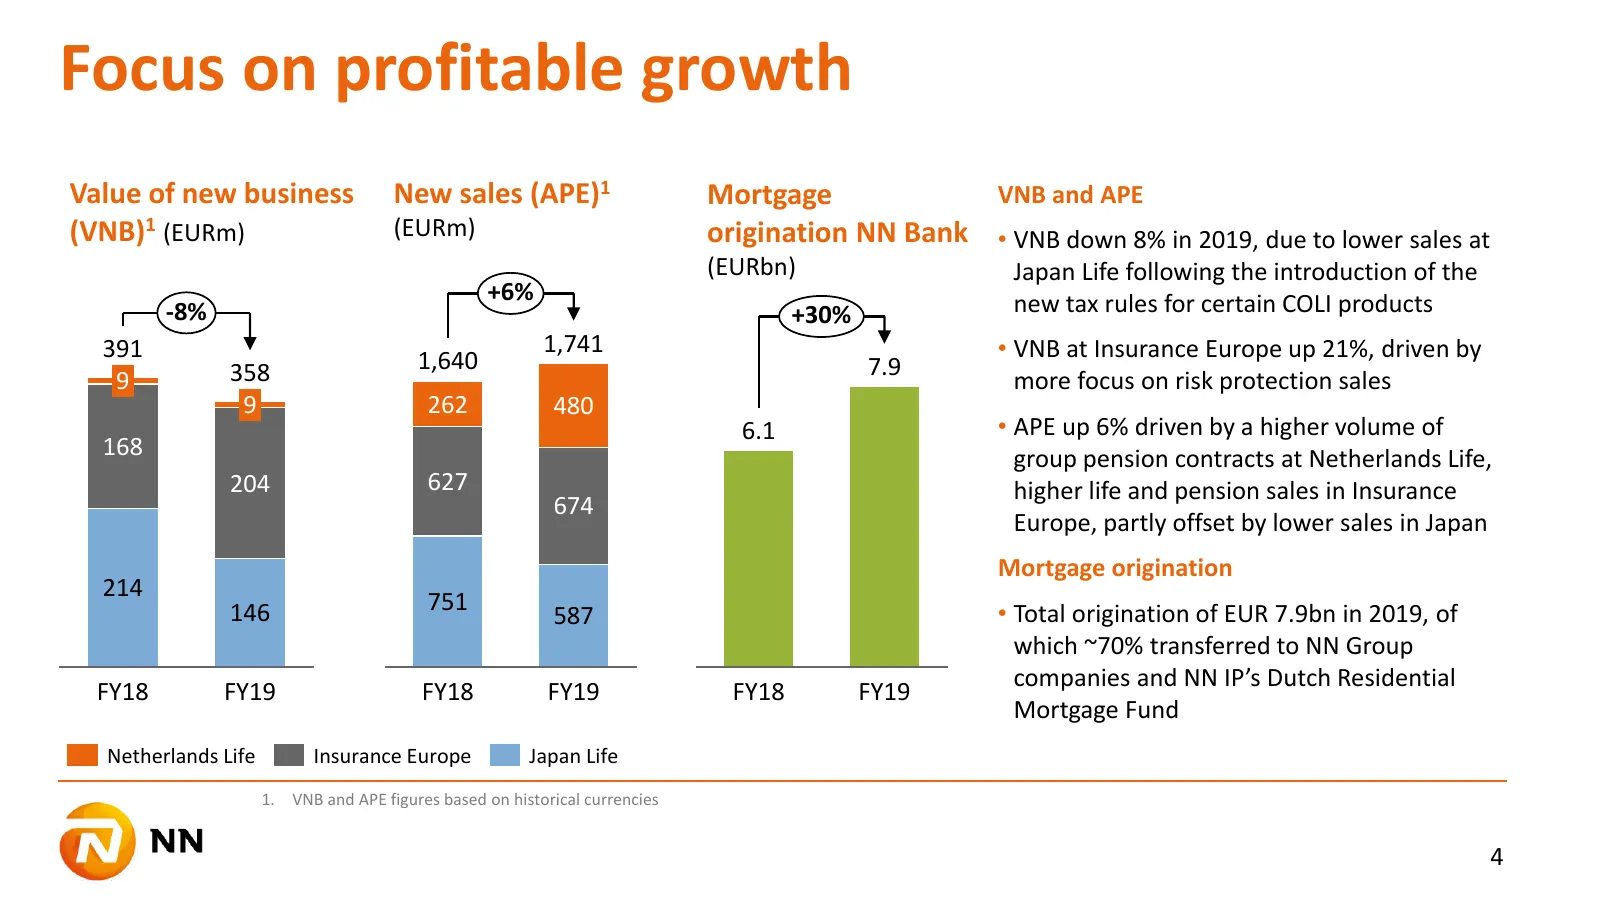
Focus on profitable growth Value of new business New sales (APE)1 Mortgage VNB and APE (VNB)1 (EURm) (EURm) origination NN Bank • VNB down 8% in 2019, due to lower sales at (EURbn) Japan Life following the introduction of the +6% new tax rules for certain COLI products -8% +30% 391 1,741 • VNB at In
Slide 5: Progress on our Group financial targets
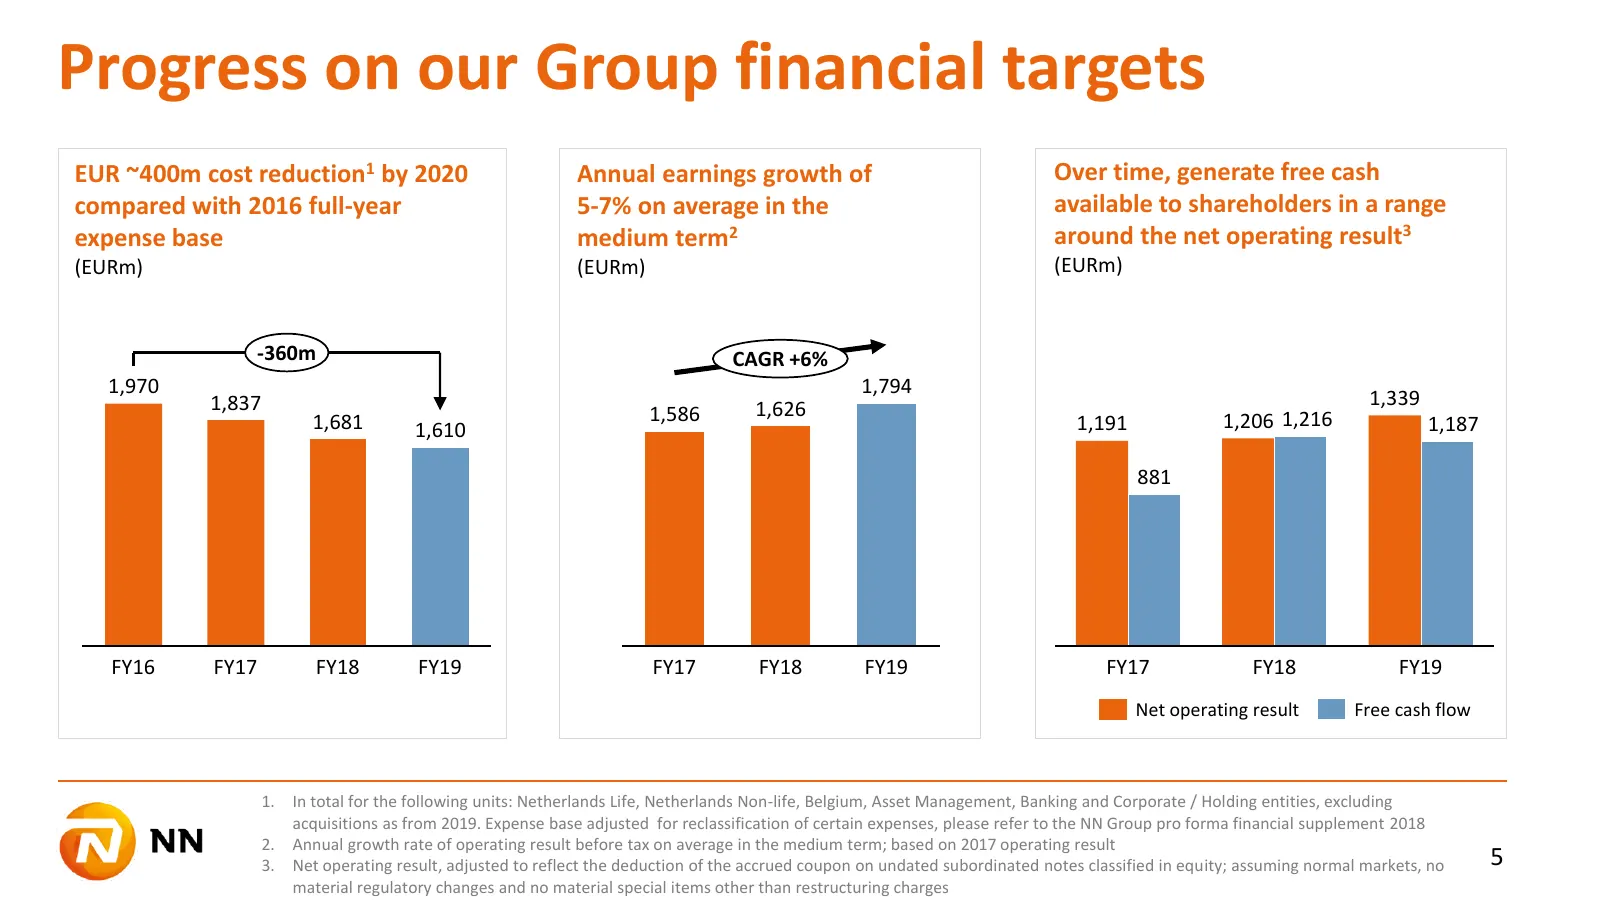
Progress on our Group financial targets EUR ~400m cost reduction1 by 2020 Annual earnings growth of Over time, generate free cash compared with 2016 full-year 5-7% on average in the available to shareholders in a range expense base medium term2 around the net operating result3 (EURm) (EURm) (EURm) -
Slide 6: Updated dividend policy
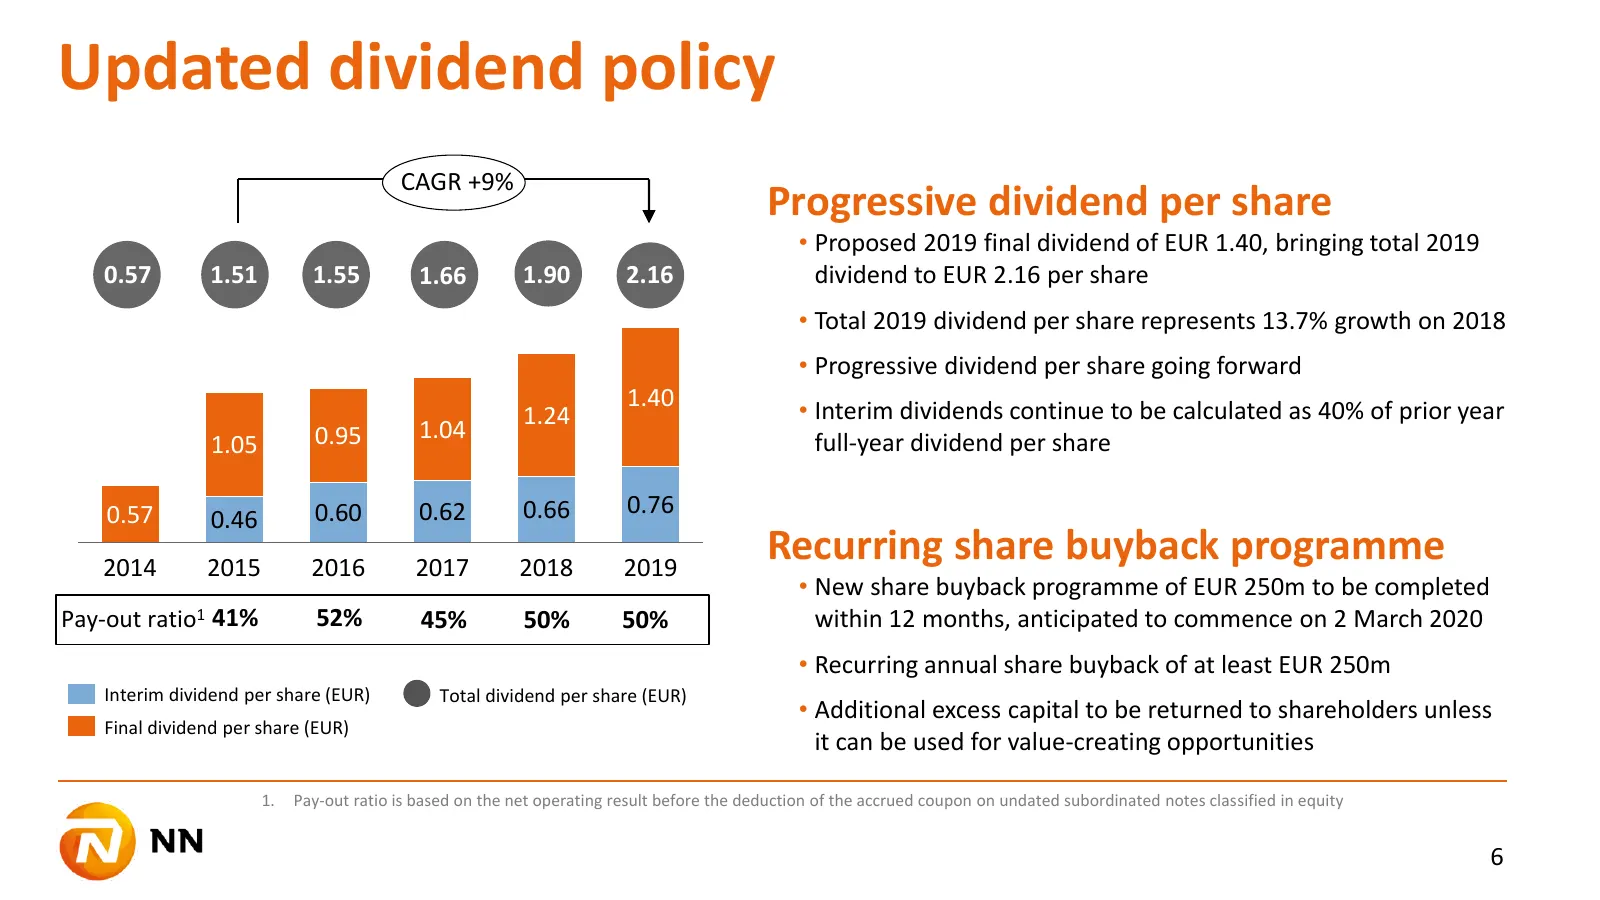
Updated dividend policy CAGR +9% Progressive dividend per share • Proposed 2019 final dividend of EUR 1.40, bringing total 2019 0.57 1.51 1.55 1.66 1.90 2.16 dividend to EUR 2.16 per share • Total 2019 dividend per share represents 13.7% growth on 2018 • Progressive dividend per share going forward
Slide 7: 4Q19 results
4Q19 results Delfin Rueda, CFO 7
Slide 8: Operating result and net result
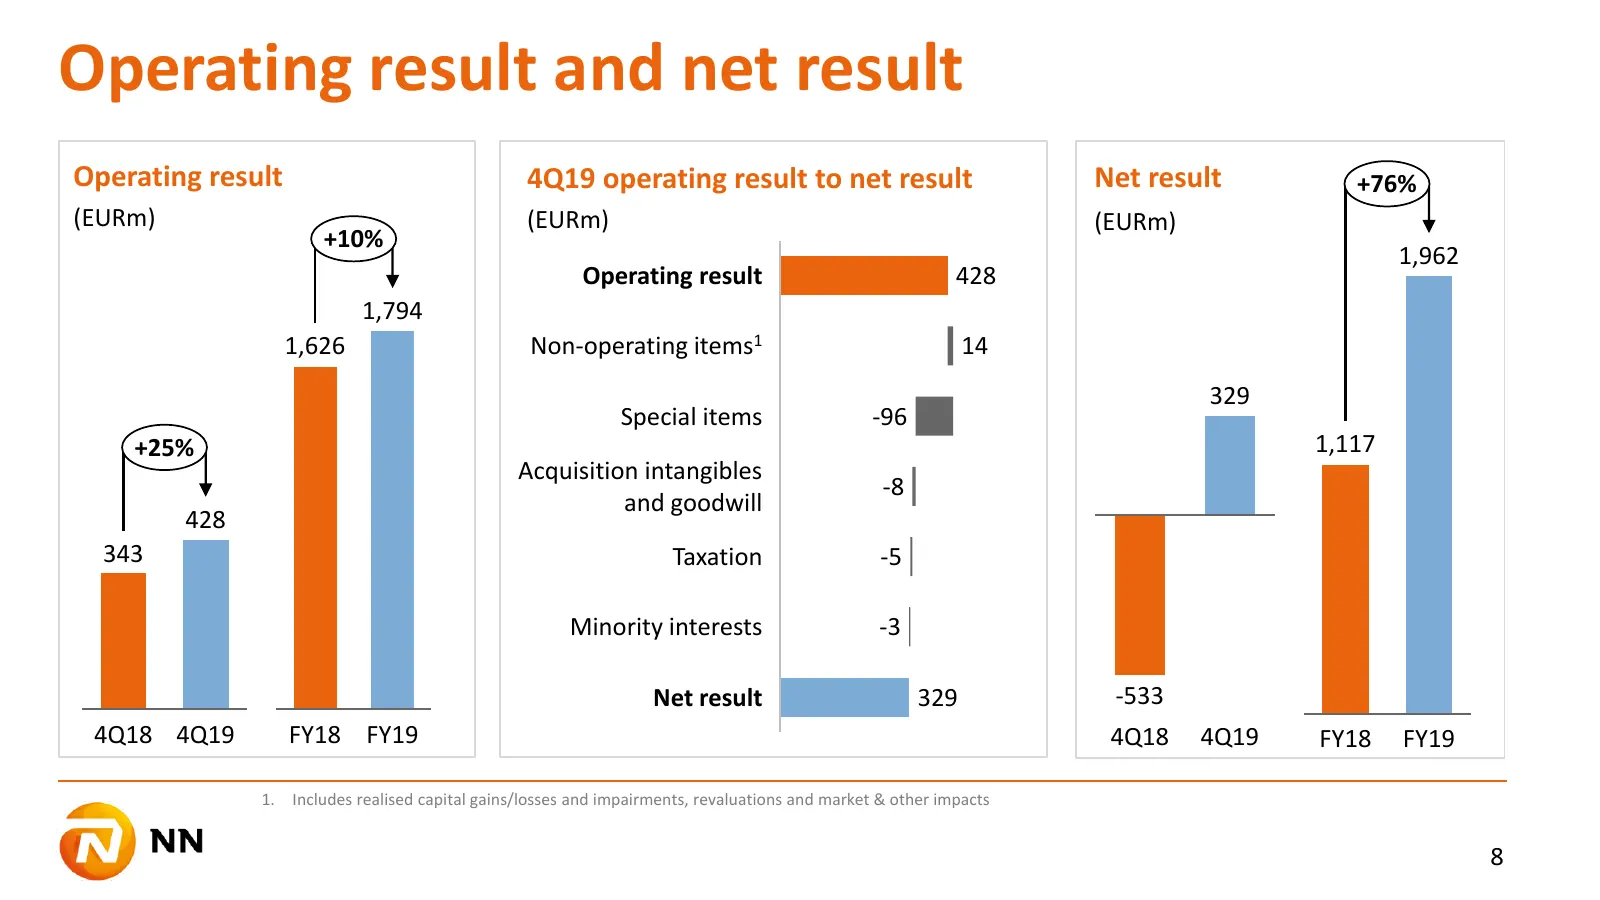
Operating result and net result Operating result 4Q19 operating result to net result Net result +76% (EURm) (EURm) (EURm) +10% 1,962 Operating result 428 1,794 1,626 Non-operating items1 14 329 Special items -96 +25% 1,117 Acquisition intangibles -8 and goodwill 428 343 Taxation -5 Minority interest
Slide 9: 4Q19 and FY19 operating result by segment
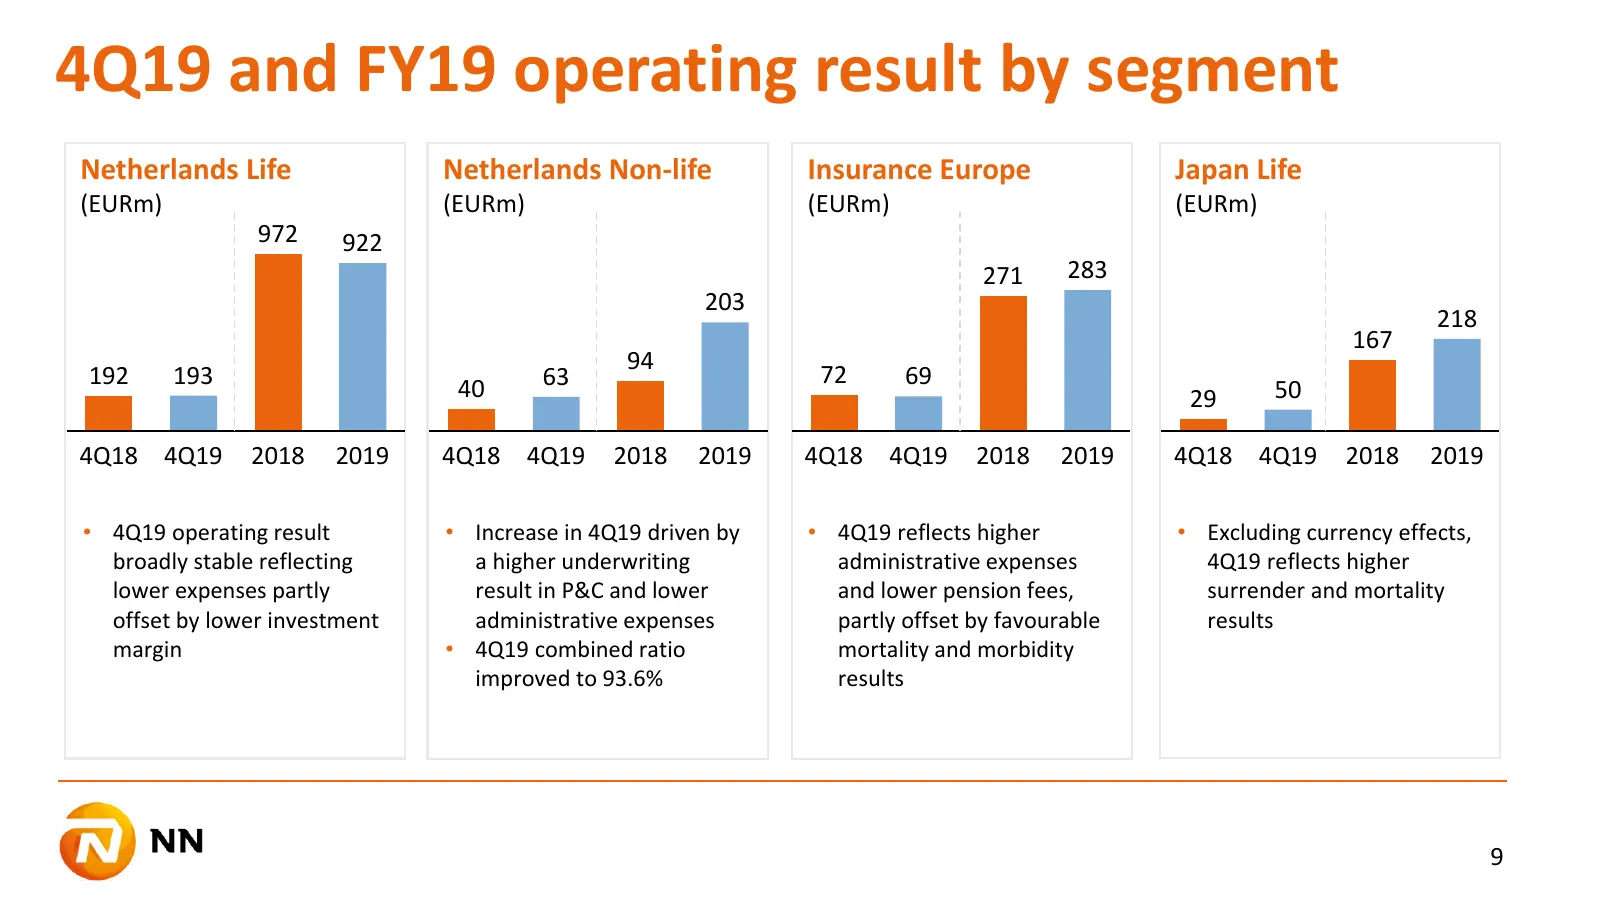
4Q19 and FY19 operating result by segment Netherlands Life Netherlands Non-life Insurance Europe Japan Life (EURm) (EURm) (EURm) (EURm) 972 922 271 283 203 218 167 94 192 193 63 72 69 40 29 50 4Q18 4Q19 2018 2019 4Q18 4Q19 2018 2019 4Q18 4Q19 2018 2019 4Q18 4Q19 2018 2019 • 4Q19 operating result • I
Slide 10: 4Q19 and FY19 operating result by segment
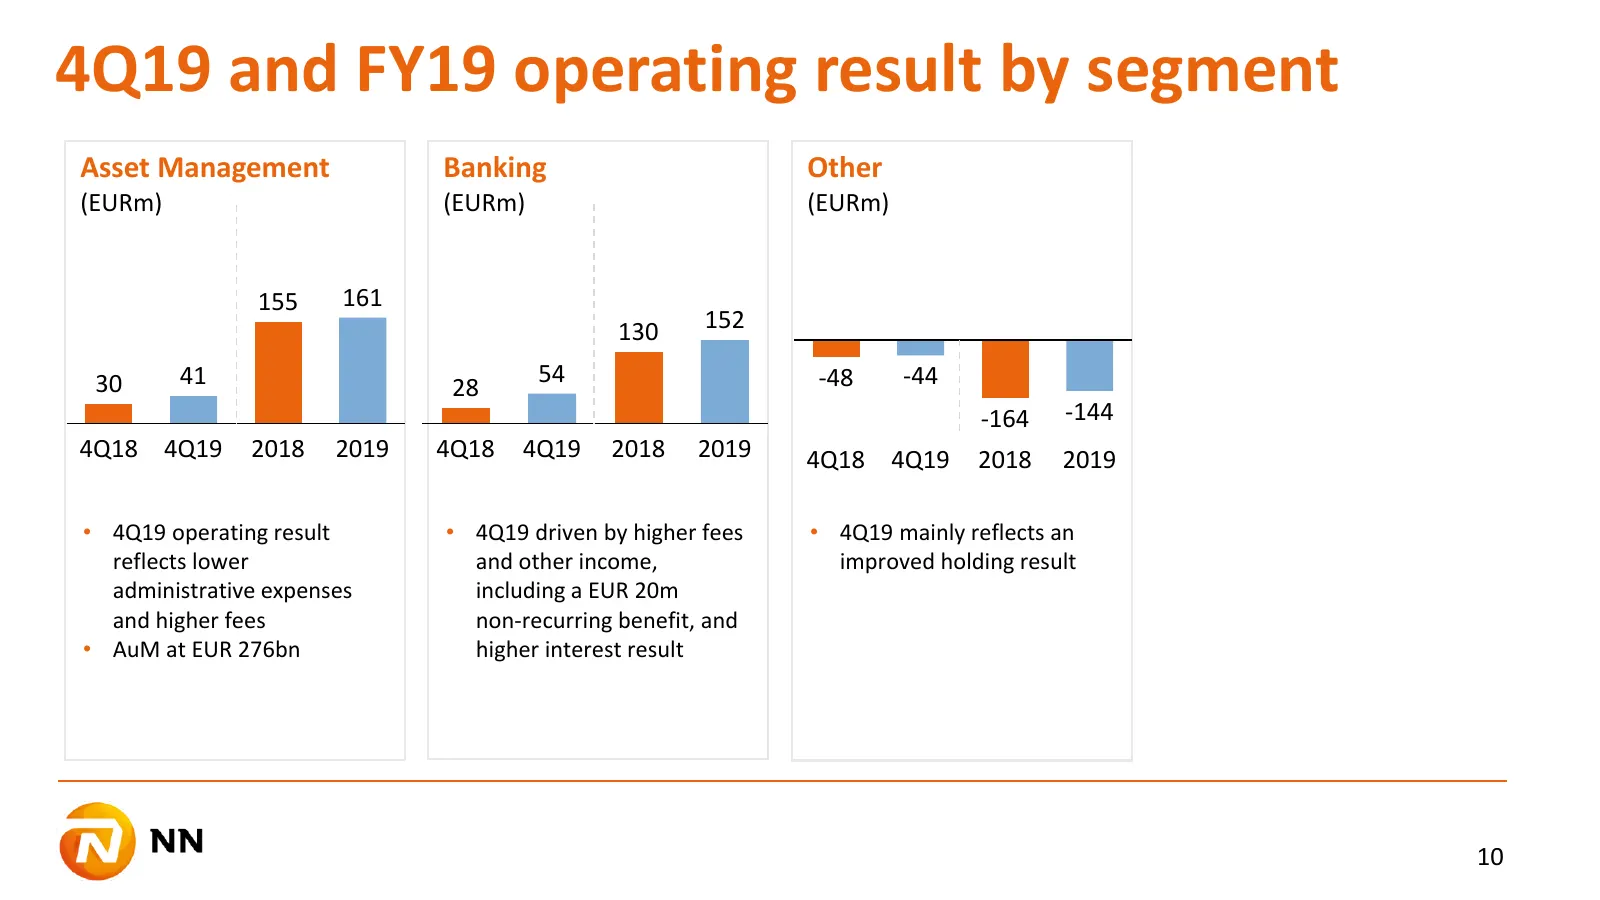
4Q19 and FY19 operating result by segment Asset Management Banking Other (EURm) (EURm) (EURm) 161 37,874,602 155 33,659,858 130 152 30 41 54 -48 -44 28 -164 -144 4Q18 4Q19 2018 2019 4Q18 3Q18 4Q19 3Q19 2019 2018 4Q18 4Q19 2018 2019 • 4Q19 operating result • 4Q19 driven by higher fees • 4Q19 mainly r
Slide 11: Cost reductions achieved to date of EUR 360m
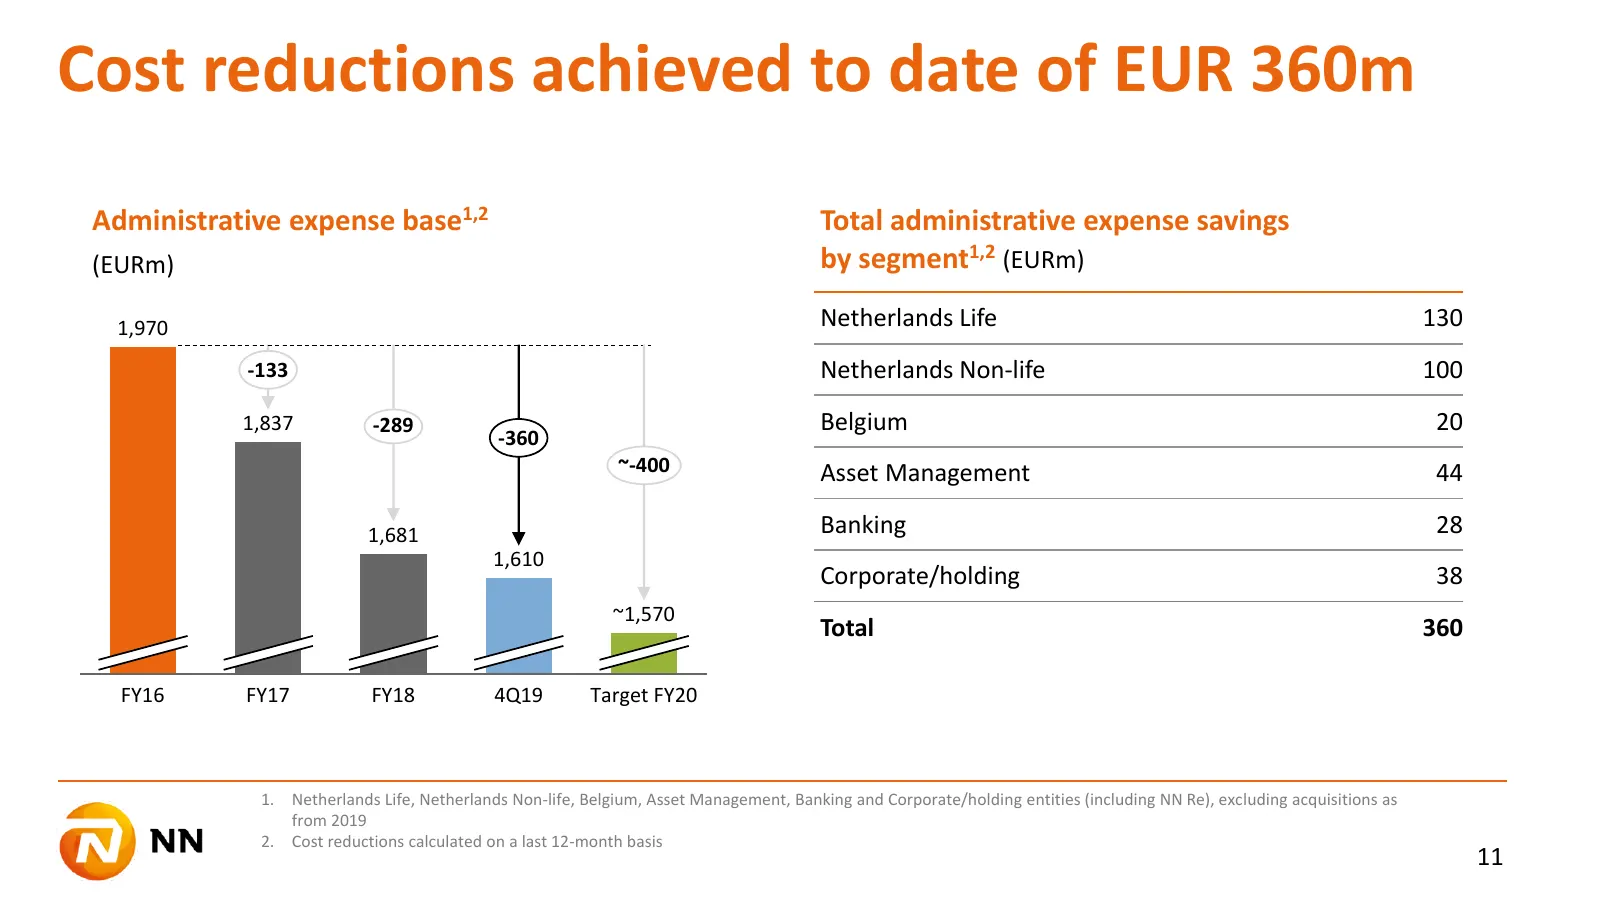
Cost reductions achieved to date of EUR 360m Administrative expense base1,2 Total administrative expense savings (EURm) by segment1,2 (EURm) 1,970 Netherlands Life 130 -133 Netherlands Non-life 100 1,837 -289 Belgium 20 -360 ~-400 Asset Management 44 1,681 Banking 28 1,610 Corporate/holding 38 ~1,57
Slide 12: Free cash flow 4Q19 and FY19
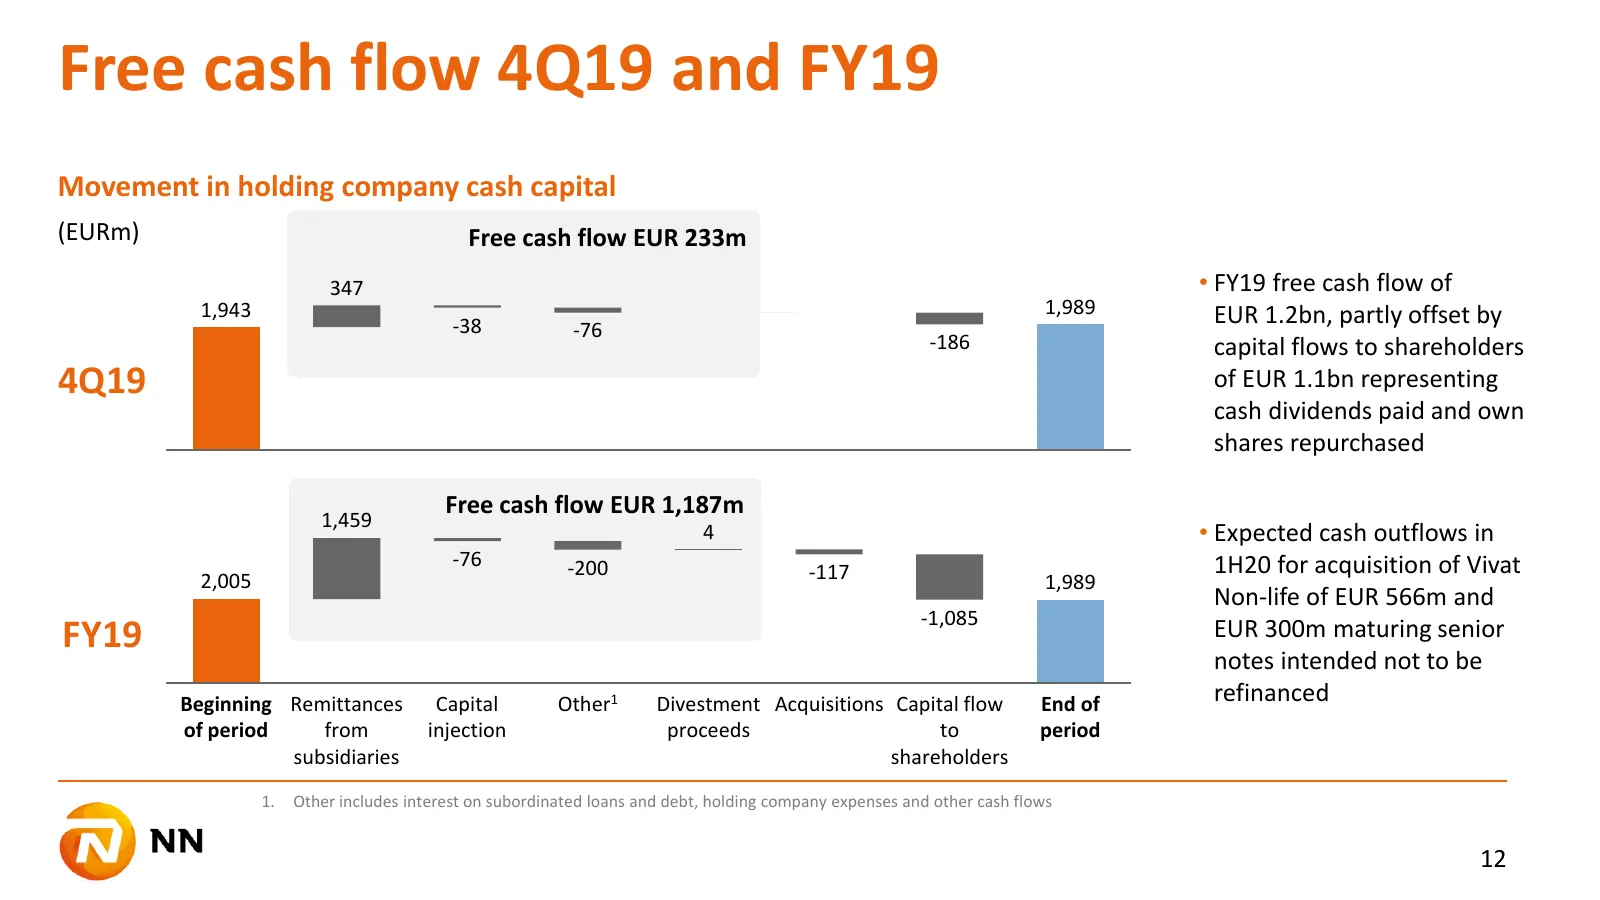
Free cash flow 4Q19 and FY19 Movement in holding company cash capital (EURm) Free cash flow EUR 233m 347 • FY19 free cash flow of 1,943 1,989 EUR 1.2bn, partly offset by -38 -76 -186 capital flows to shareholders 4Q19 of EUR 1.1bn representing cash dividends paid and own shares repurchased Free cash
Slide 13: Solvency II movement 4Q19
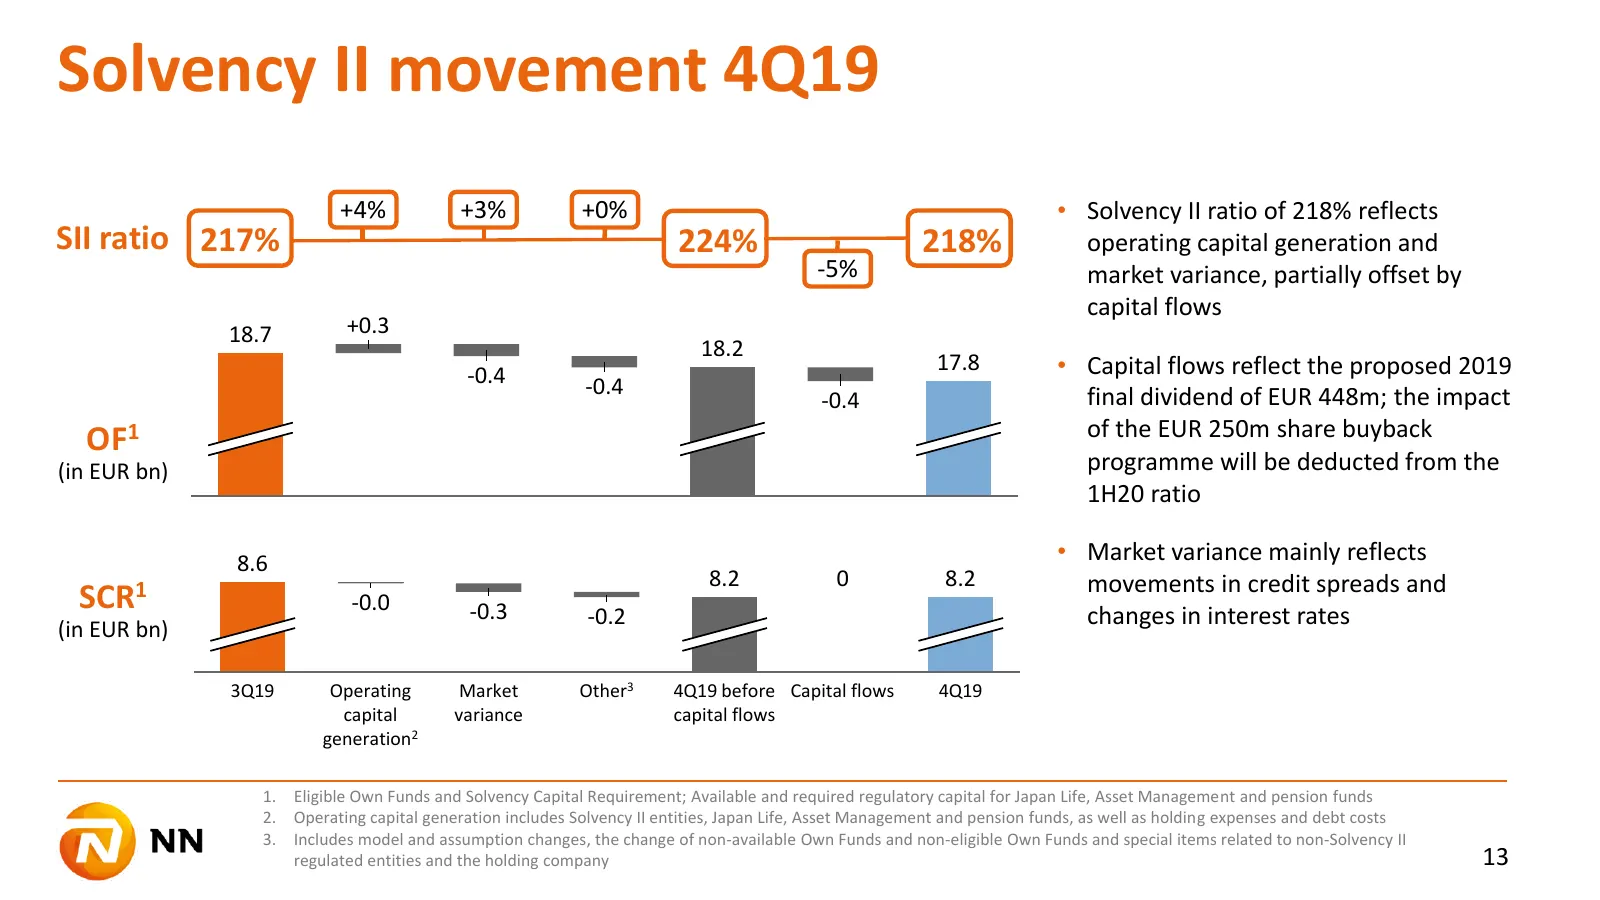
Solvency II movement 4Q19 +4% +3% +0% • Solvency II ratio of 218% reflects SII ratio 217% 224% 218% operating capital generation and -5% market variance, partially offset by capital flows 18.7 +0.3 18.2 -0.4 17.8 • Capital flows reflect the proposed 2019 -0.4 final dividend of EUR 448m; the impact -
Slide 14: Solvency II movement FY19
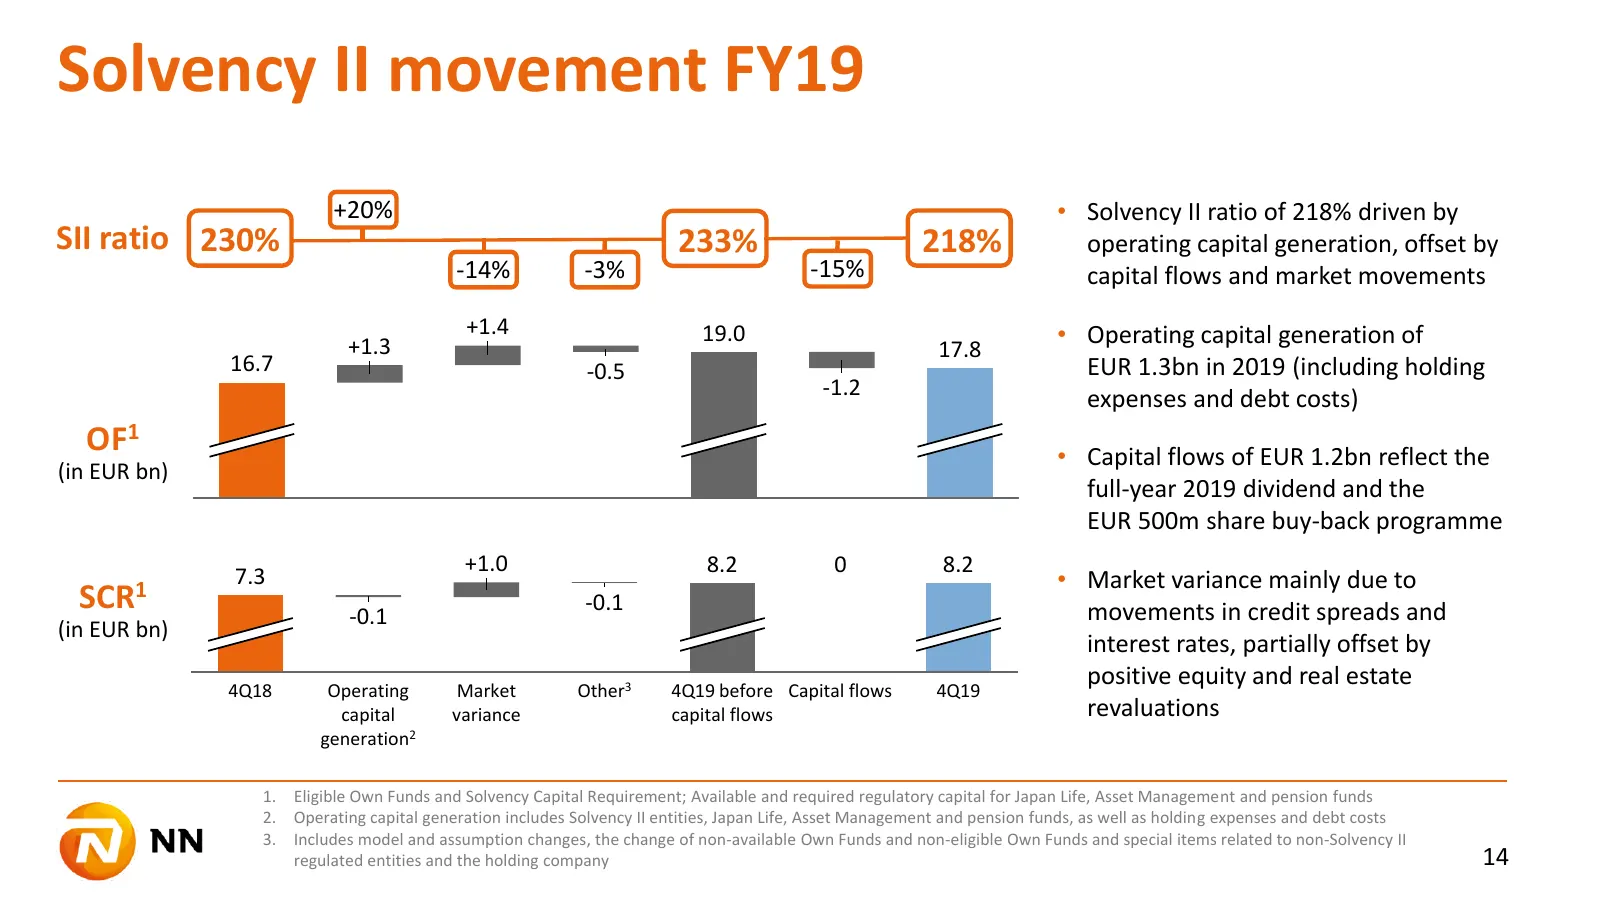
Solvency II movement FY19 +20% • Solvency II ratio of 218% driven by SII ratio 230% 233% 218% operating capital generation, offset by -14% -3% -15% capital flows and market movements +1.4 19.0 • Operating capital generation of +1.3 17.8 16.7 -0.5 EUR 1.3bn in 2019 (including holding -1.2 expenses an
Slide 15: Wrap up
Wrap up David Knibbe, CEO 15
Slide 16: Key takeaways
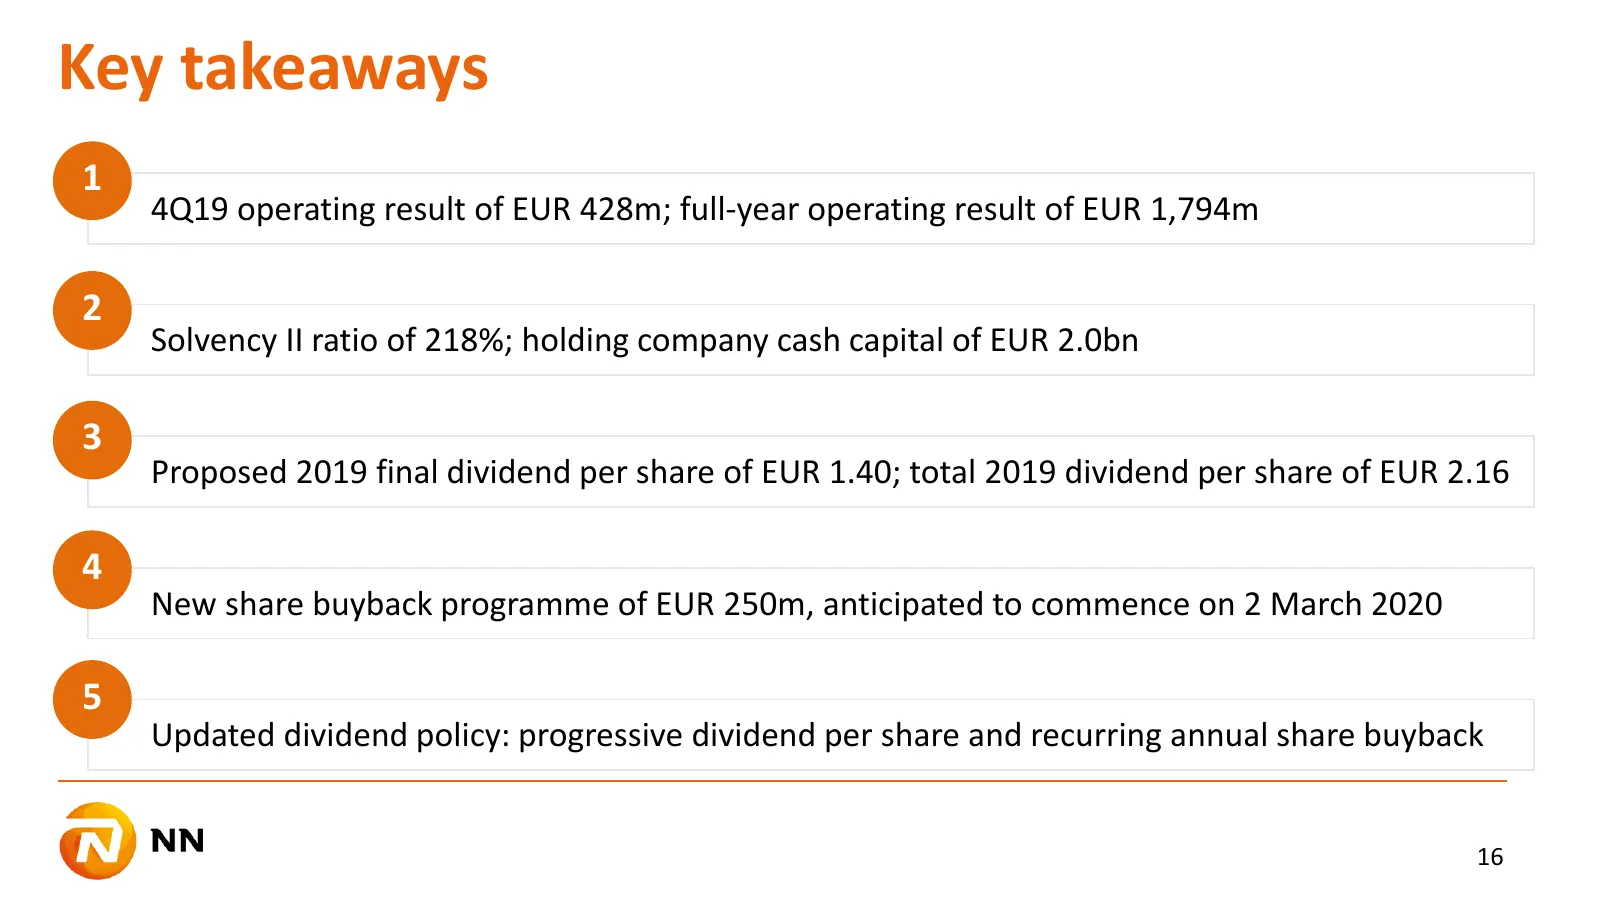
Key takeaways 1 4Q19 operating result of EUR 428m; full-year operating result of EUR 1,794m 2 Solvency II ratio of 218%; holding company cash capital of EUR 2.0bn 3 Proposed 2019 final dividend per share of EUR 1.40; total 2019 dividend per share of EUR 2.16 4 New share buyback programme of EUR 250m
Slide 17: Q&A
Q&A David Knibbe, Delfin Rueda 17
Slide 18: Appendices
Appendices 18
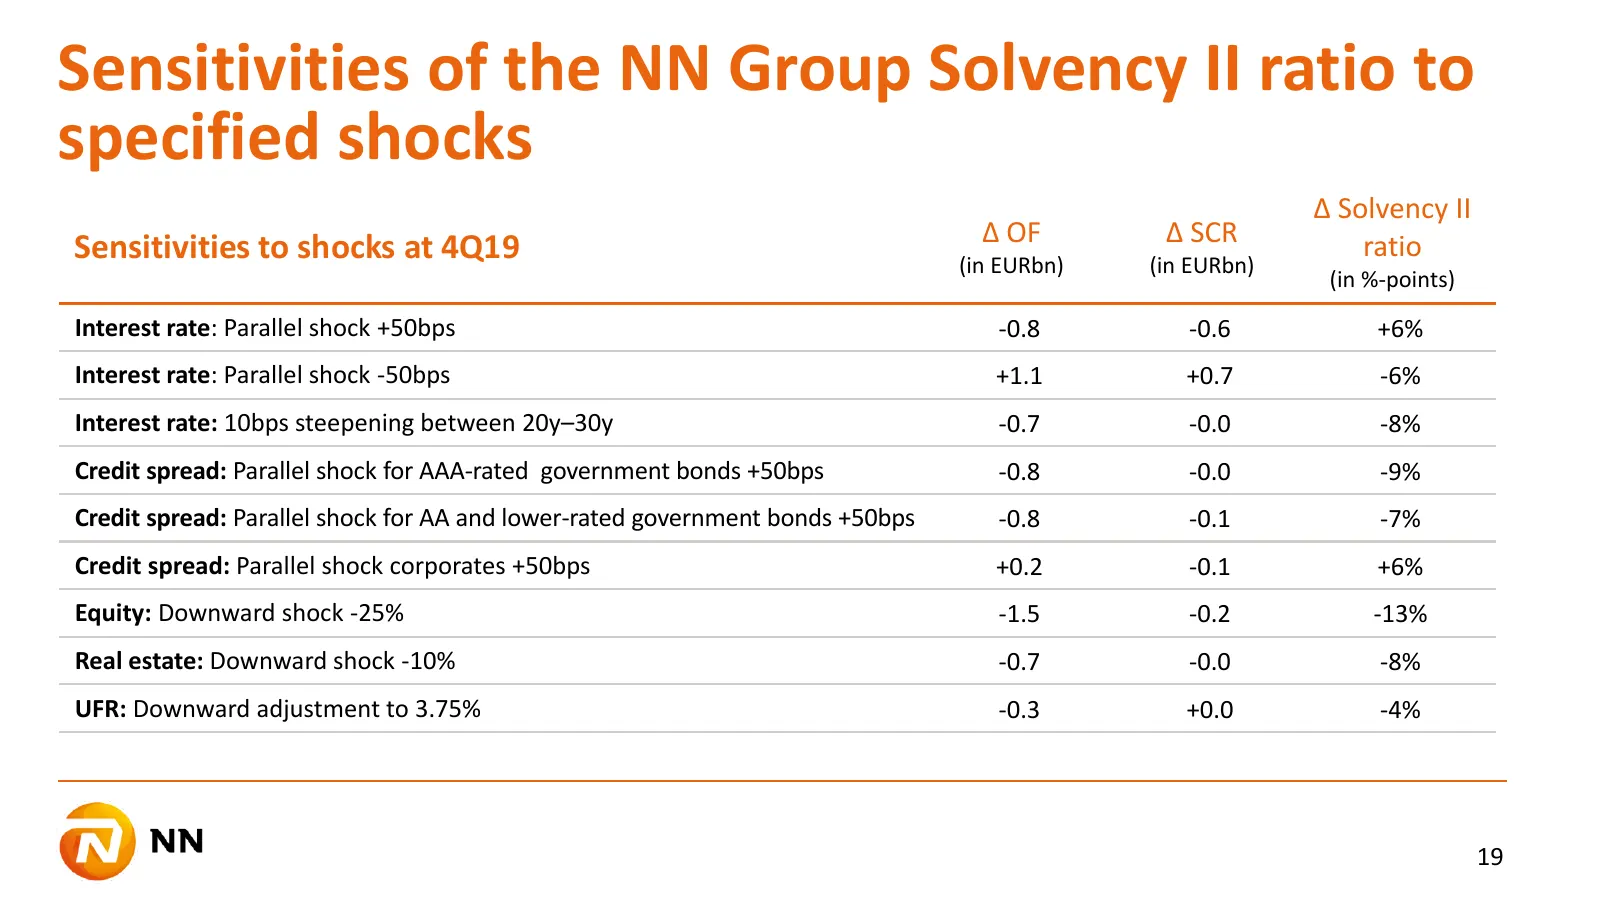
Slide 19: Sensitivities of the NN Group Solvency II ratio to specified shocks
Sensitivities of the NN Group Solvency II ratio to specified shocks Δ Solvency II Δ OF Δ SCR Sensitivities to shocks at 4Q19 (in EURbn) (in EURbn) ratio (in %-points) Interest rate: Parallel shock +50bps -0.8 -0.6 +6% Interest rate: Parallel shock -50bps +1.1 +0.7 -6% Interest rate: 10bps steepening
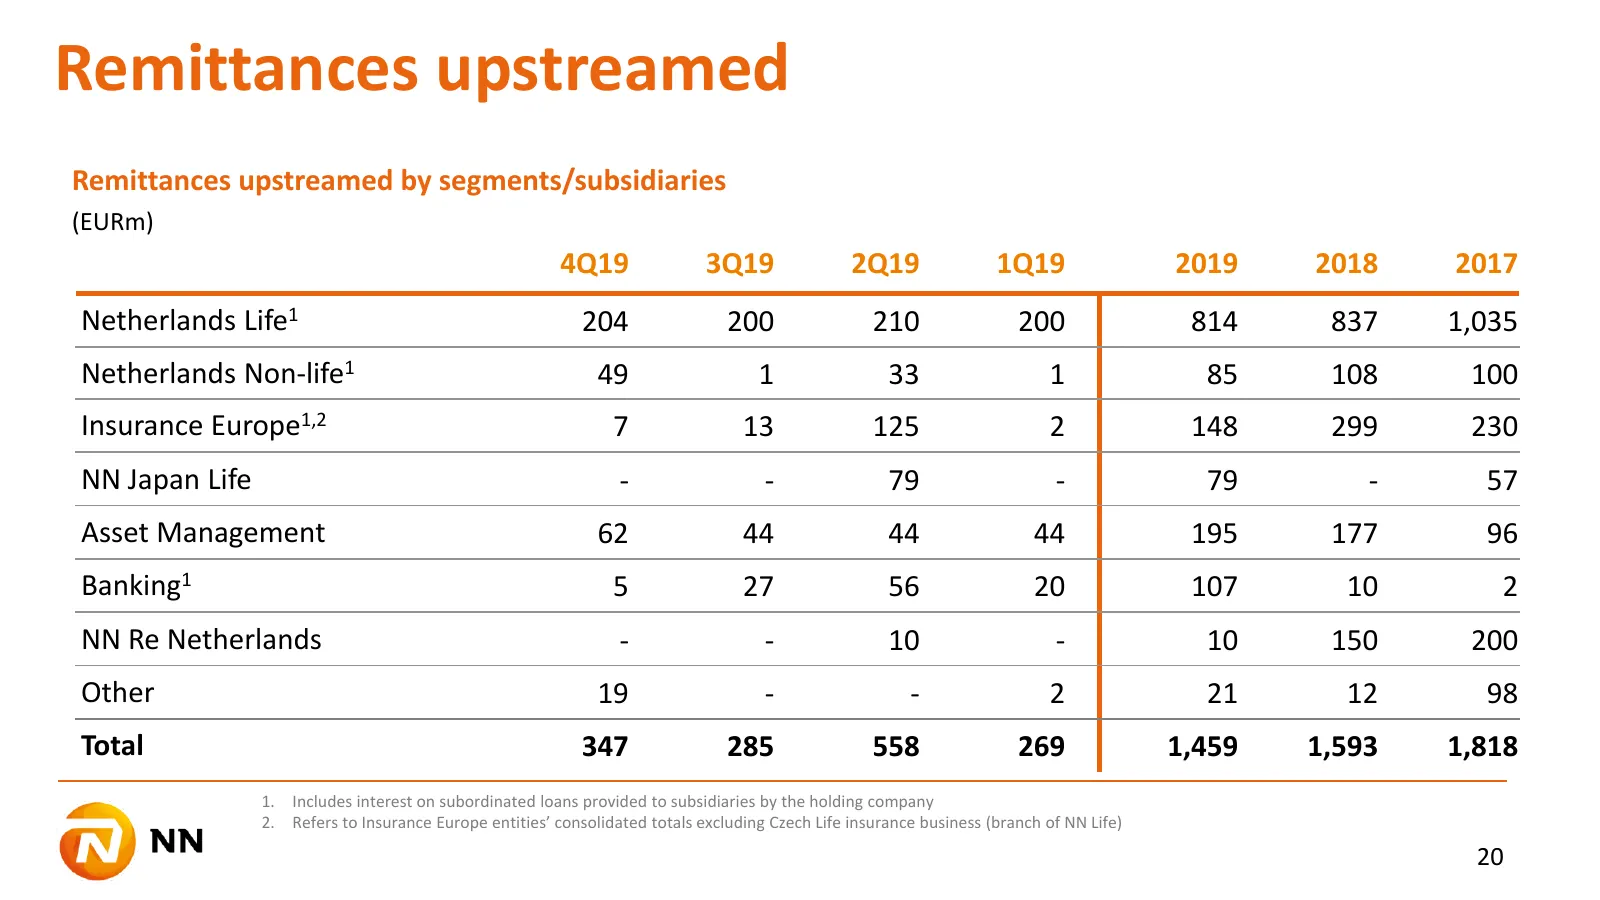
Slide 20: Remittances upstreamed
Remittances upstreamed Remittances upstreamed by segments/subsidiaries (EURm) 4Q19 3Q19 2Q19 1Q19 2019 2018 2017 Netherlands Life1 204 200 210 200 814 837 1,035 Netherlands Non-life1 49 1 33 1 85 108 100 Insurance Europe1,2 7 13 125 2 148 299 230 NN Japan Life - - 79 - 79 - 57 Asset Management 62 44
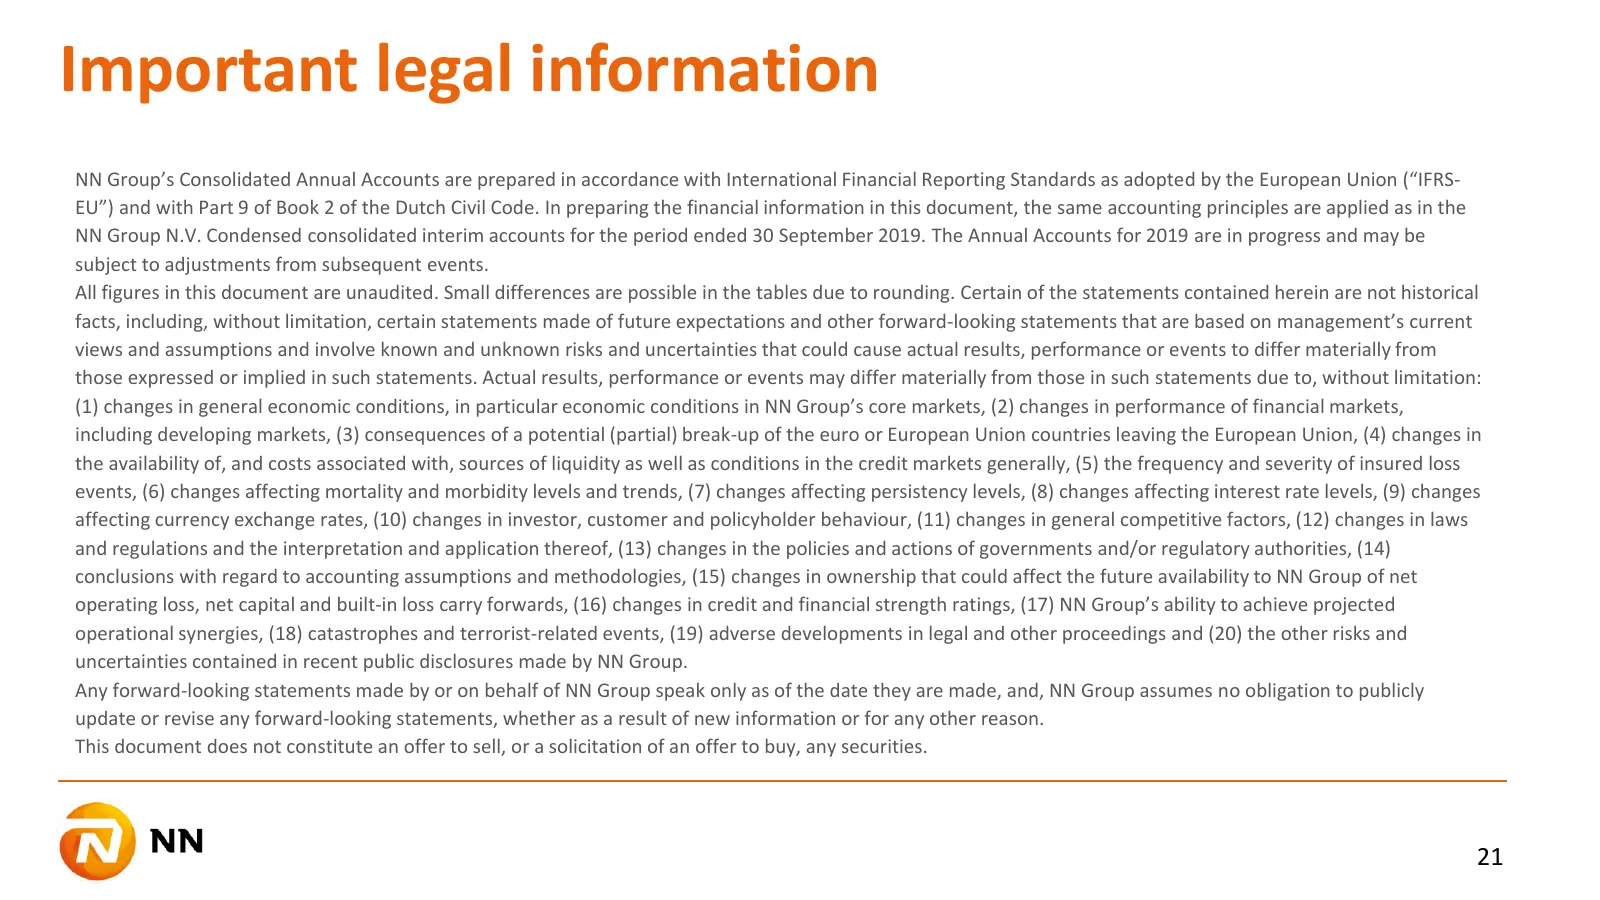
Slide 21: Important legal information
Important legal information NN Group’s Consolidated Annual Accounts are prepared in accordance with International Financial Reporting Standards as adopted by the European Union (“IFRS- EU”) and with Part 9 of Book 2 of the Dutch Civil Code. In preparing the financial information in this document, th

Slide 22
Source: Internet Archive copy of nn-group.com
More decks from NN Group N.V.
 ESG Presentation (August 2026)33 slides · Aug 6, 2026
 1H26 Earnings Presentation31 slides · Aug 6, 2026
 Nationale-Nederlanden Bank — Debt Investor Presentation (April 2026)51 slides · Apr 16, 2026
 ESG Presentation (February 2026)33 slides · Feb 12, 2026
 FY2025 Earnings Presentation37 slides · Feb 12, 2026
 Nationale-Nederlanden Bank — Debt Investor Presentation (September 2025)61 slides · September 2025