Whitehaven Coal Limited · ASX:WHC
Whitehaven Coal — Investor Day (September 2019)
111 slides from Whitehaven Coal's investor day presentation, Sep 12, 2019
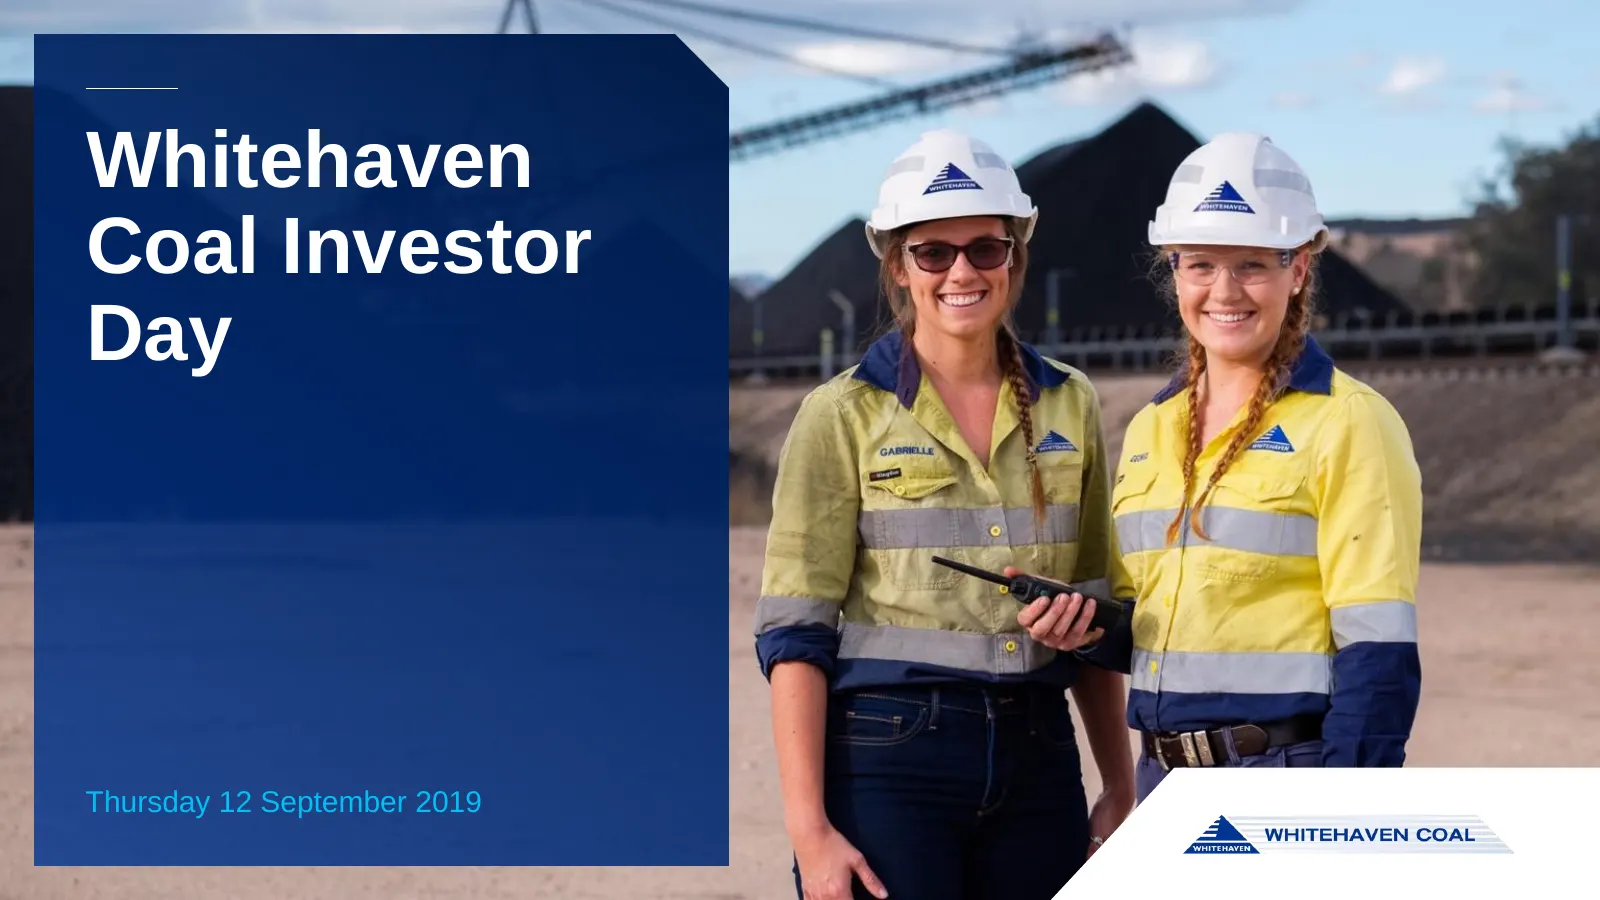
Slide 1: Whitehaven Coal Investor Day
Whitehaven Coal Investor Day Thursday 12 September 2019
Slide 2: Disclosure
Disclosure STATEMENTS CONTAINED IN THIS MATERIAL, PARTICULARLY THOSE REGARDING THE POSSIBLE OR ASSUMED FUTURE PERFORMANCE, COSTS, DIVIDENDS, RETURNS, PRODUCTION LEVELS OR RATES, PRICES, RESERVES, POTENTIAL GROWTH OF WHITEHAVEN COAL LIMITED, INDUSTRY GROWTH OR OTHER TREND PROJECTIONS AND ANY ESTIMATE
Slide 3: Agenda
Agenda Introduction and Strategic Overview Paul Flynn, MD and CEO Coal Market Outlook Scott Knights, EGM Marketing Operations and Projects Jamie Frankcombe, COO Funding and Capital Management Kevin Ball, CFO
Slide 4: Introduction and Strategic Overview – Paul Flynn, CEO and MD
Introduction and Strategic Overview – Paul Flynn, CEO and MD
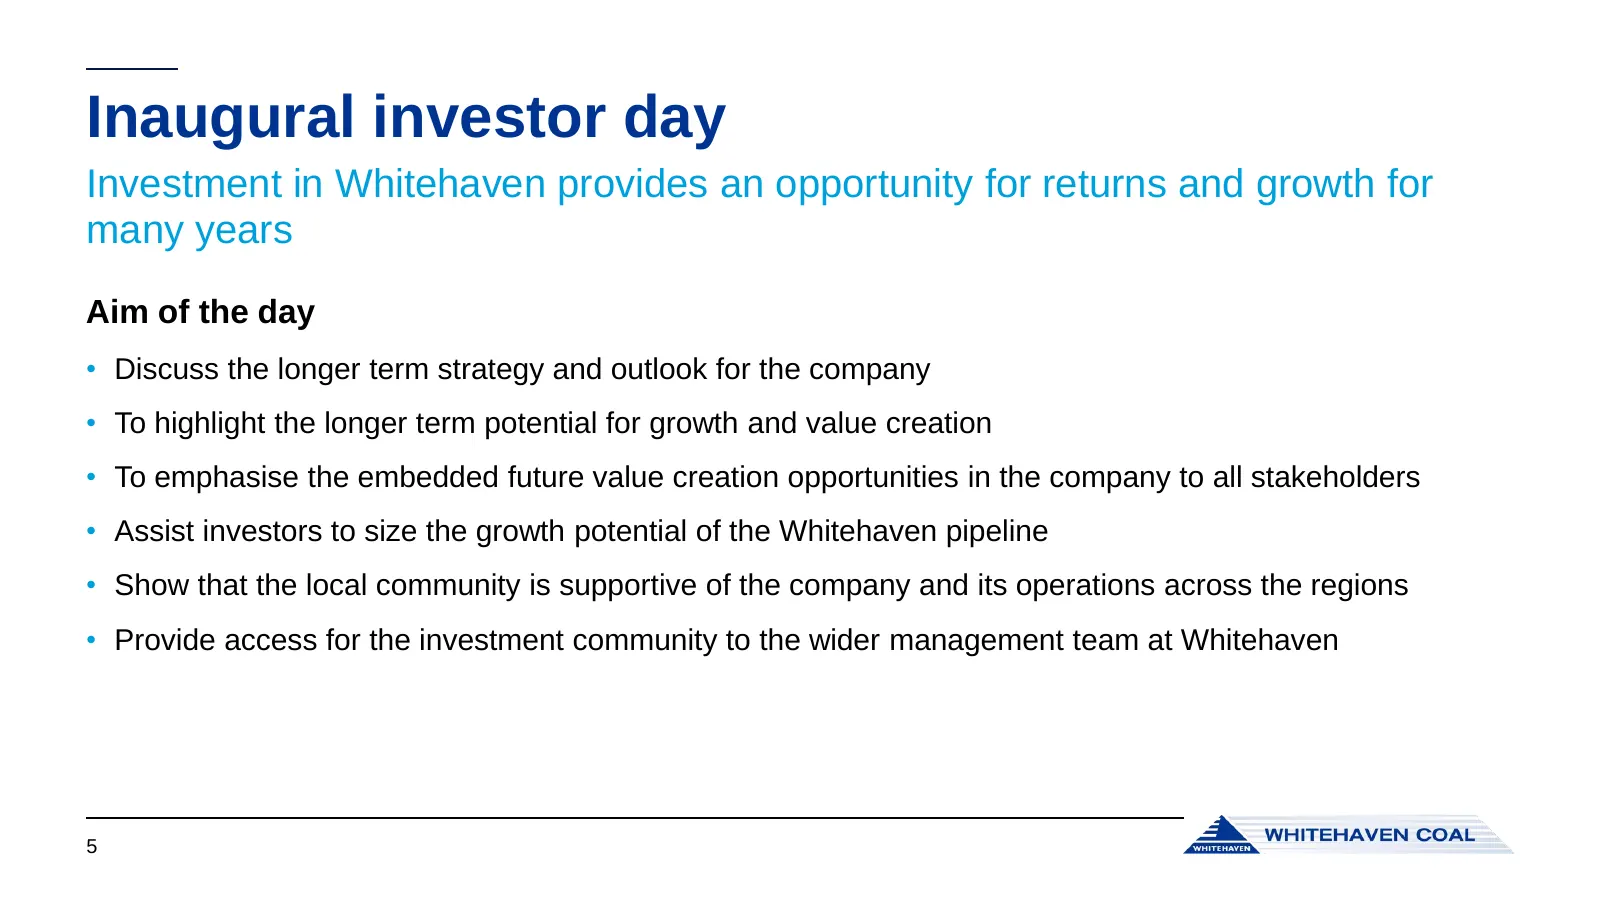
Slide 5: Inaugural investor day
Inaugural investor day Investment in Whitehaven provides an opportunity for returns and growth for many years Aim of the day • Discuss the longer term strategy and outlook for the company • To highlight the longer term potential for growth and value creation • To emphasise the embedded future value
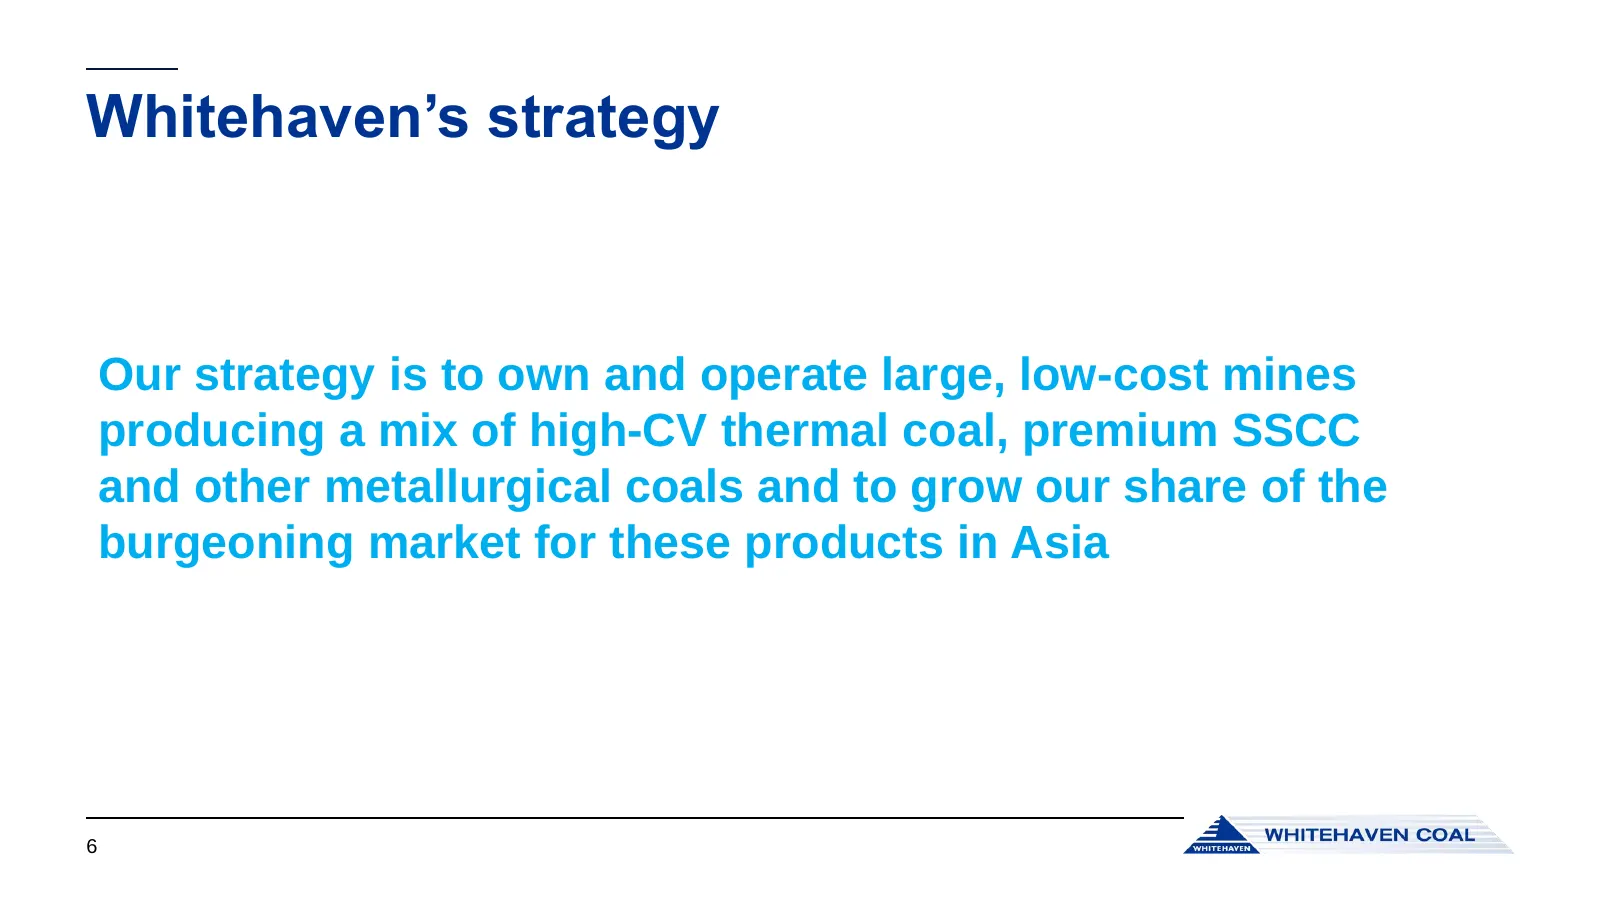
Slide 6: Whitehaven's strategy
Whitehaven’s strategy Our strategy is to own and operate large, low-cost mines producing a mix of high-CV thermal coal, premium SSCC and other metallurgical coals and to grow our share of the burgeoning market for these products in Asia 6
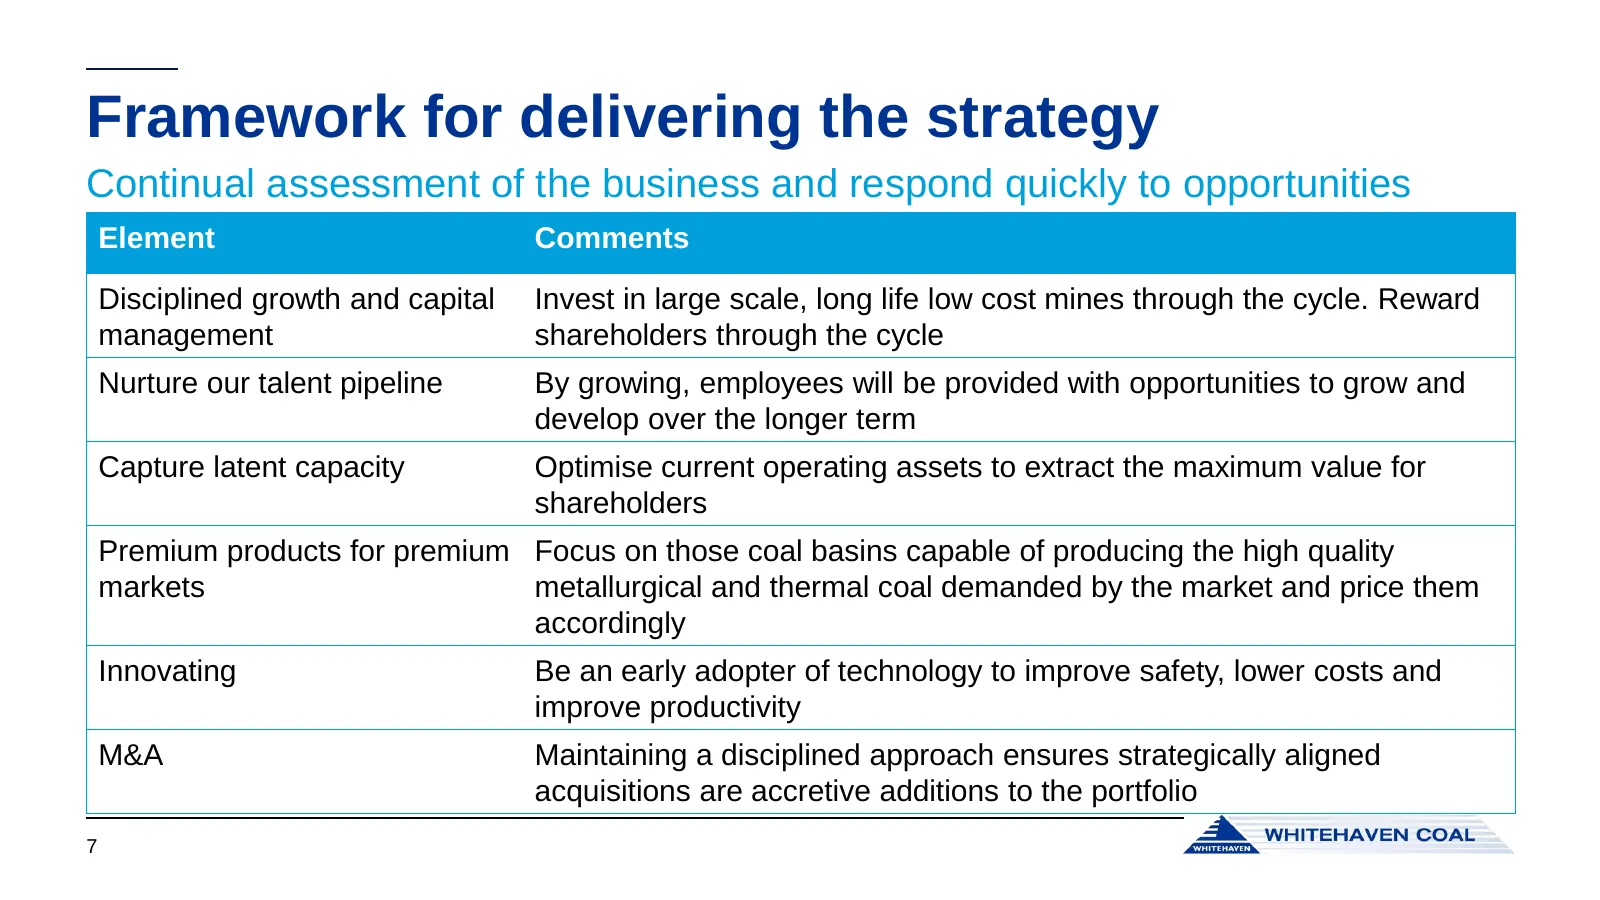
Slide 7: Framework for delivering the strategy
Framework for delivering the strategy Continual assessment of the business and respond quickly to opportunities Element Comments Disciplined growth and capital Invest in large scale, long life low cost mines through the cycle. Reward management shareholders through the cycle Nurture our talent pipel
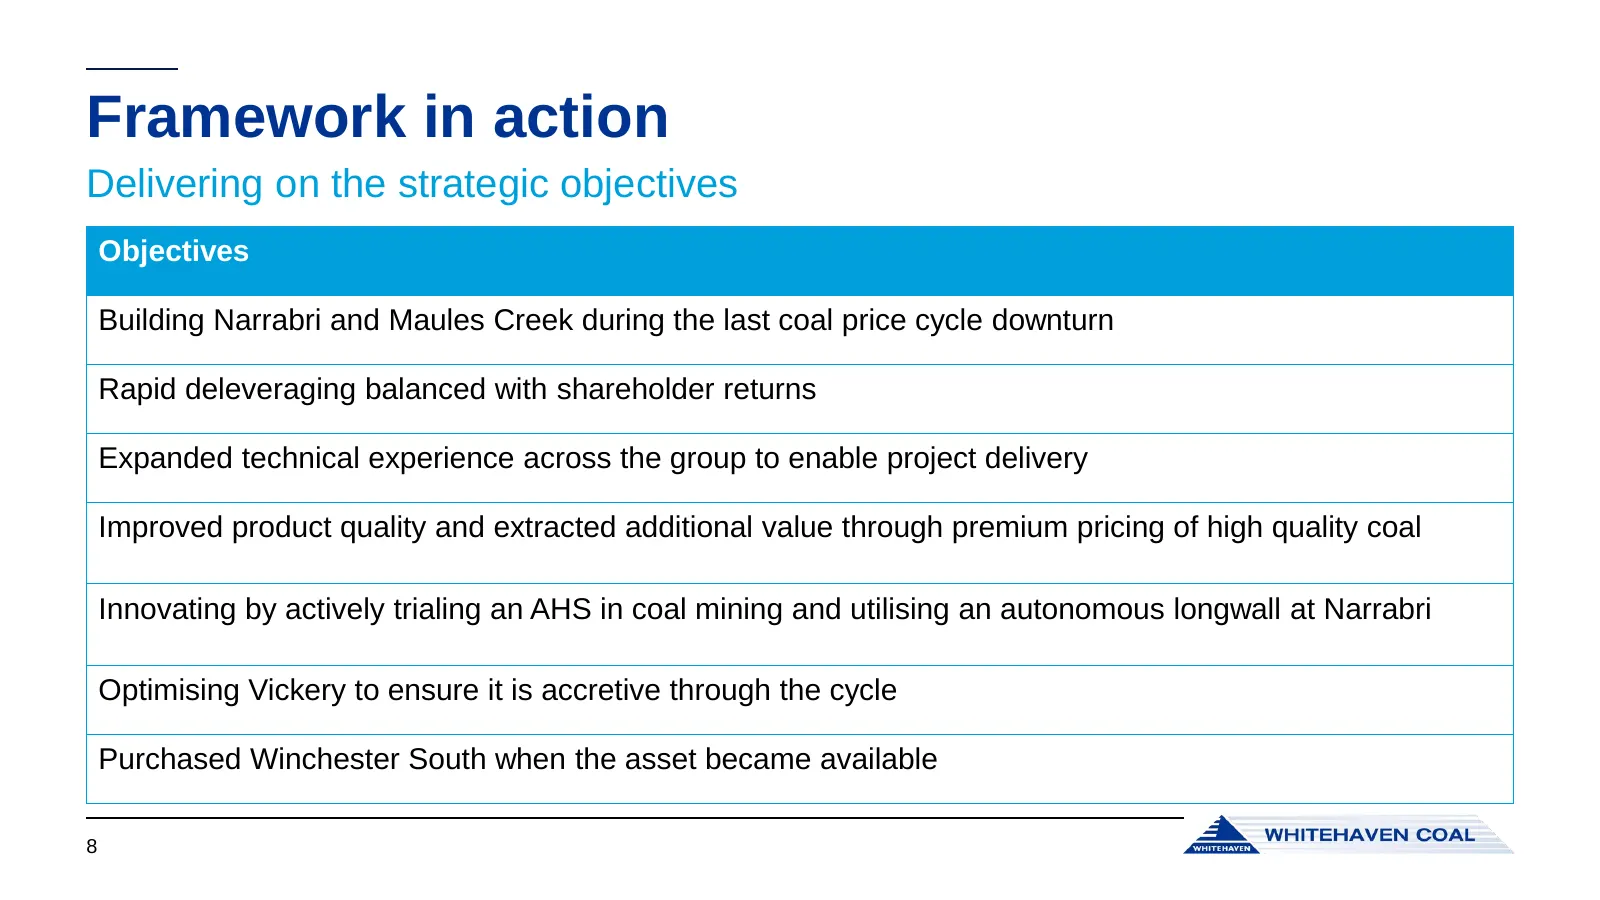
Slide 8: Framework in action
Framework in action Delivering on the strategic objectives Objectives Building Narrabri and Maules Creek during the last coal price cycle downturn Rapid deleveraging balanced with shareholder returns Expanded technical experience across the group to enable project delivery Improved product quality a
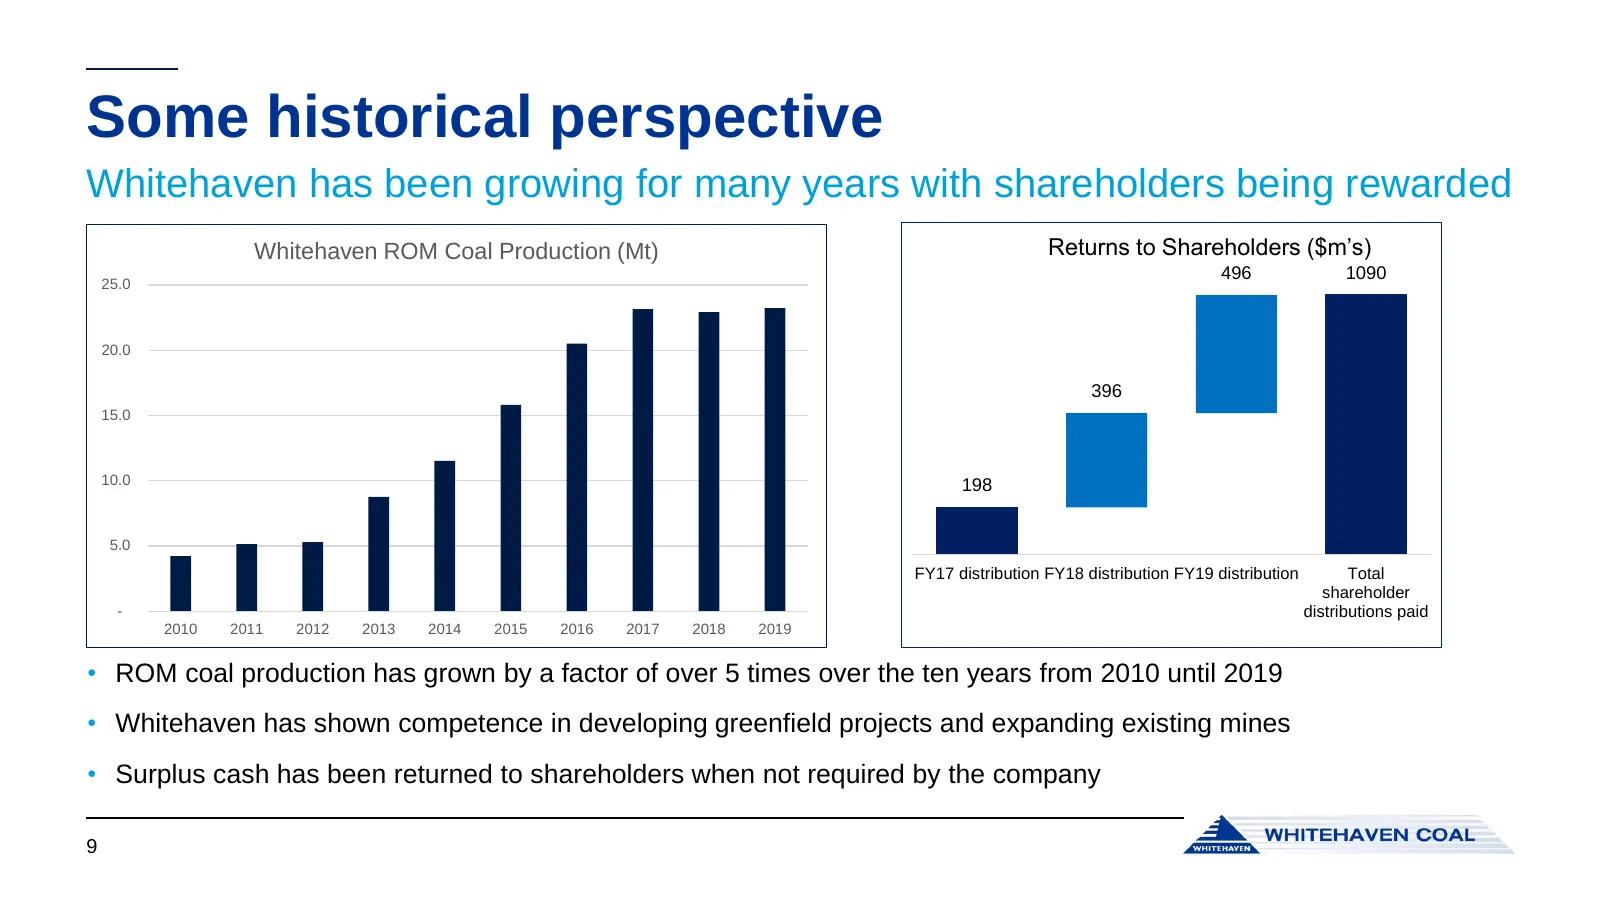
Slide 9: Some historical perspective
Some historical perspective Whitehaven has been growing for many years with shareholders being rewarded Whitehaven ROM Coal Production (Mt) Returns to Shareholders ($m’s) 496 1090 25.0 20.0 396 15.0 10.0 198 5.0 FY17 distribution FY18 distribution FY19 distribution Total shareholder - distributions
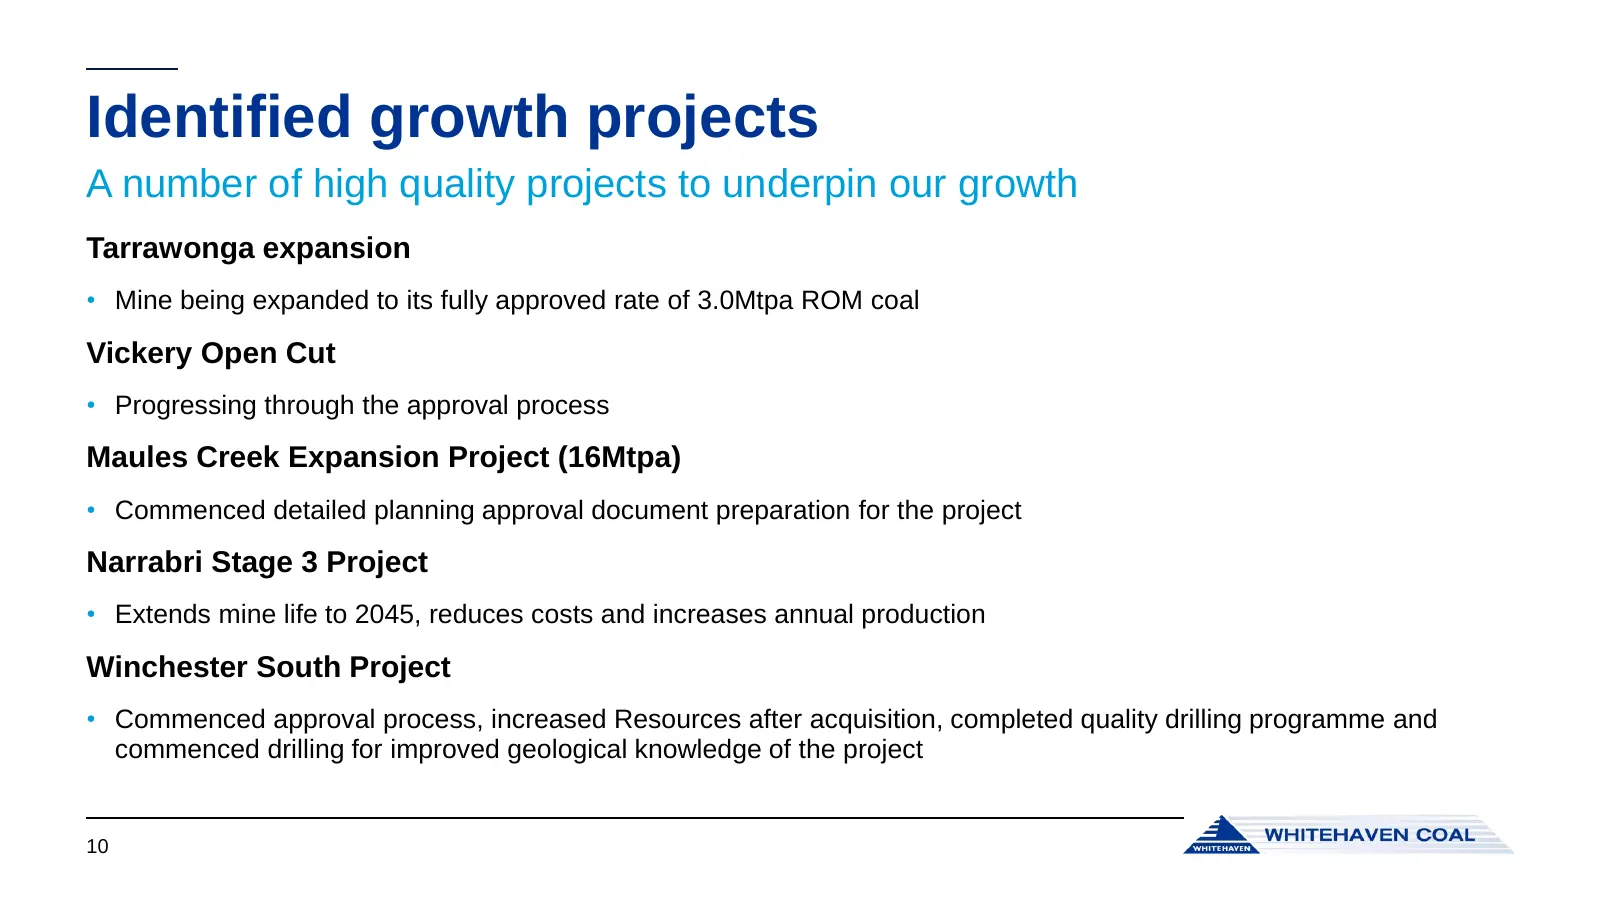
Slide 10: Identified growth projects
Identified growth projects A number of high quality projects to underpin our growth Tarrawonga expansion • Mine being expanded to its fully approved rate of 3.0Mtpa ROM coal Vickery Open Cut • Progressing through the approval process Maules Creek Expansion Project (16Mtpa) • Commenced detailed plann
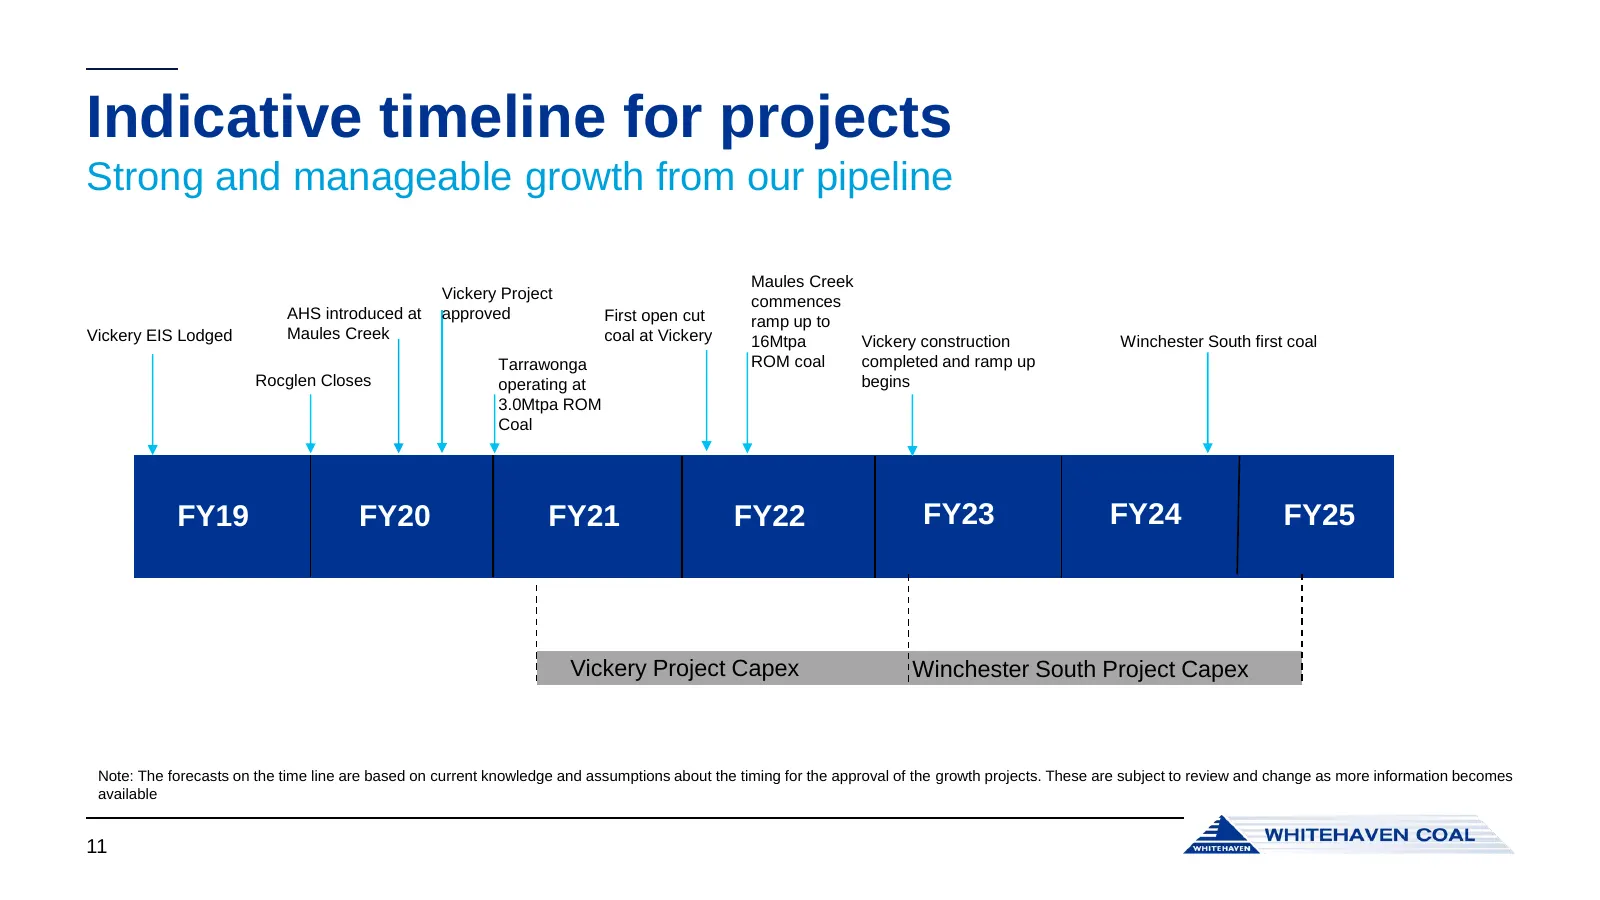
Slide 11: Indicative timeline for projects
Indicative timeline for projects Strong and manageable growth from our pipeline Maules Creek Vickery Project commences AHS introduced at approved First open cut ramp up to Vickery EIS Lodged Maules Creek coal at Vickery Winchester South first coal 16Mtpa Vickery construction Tarrawonga ROM coal comp
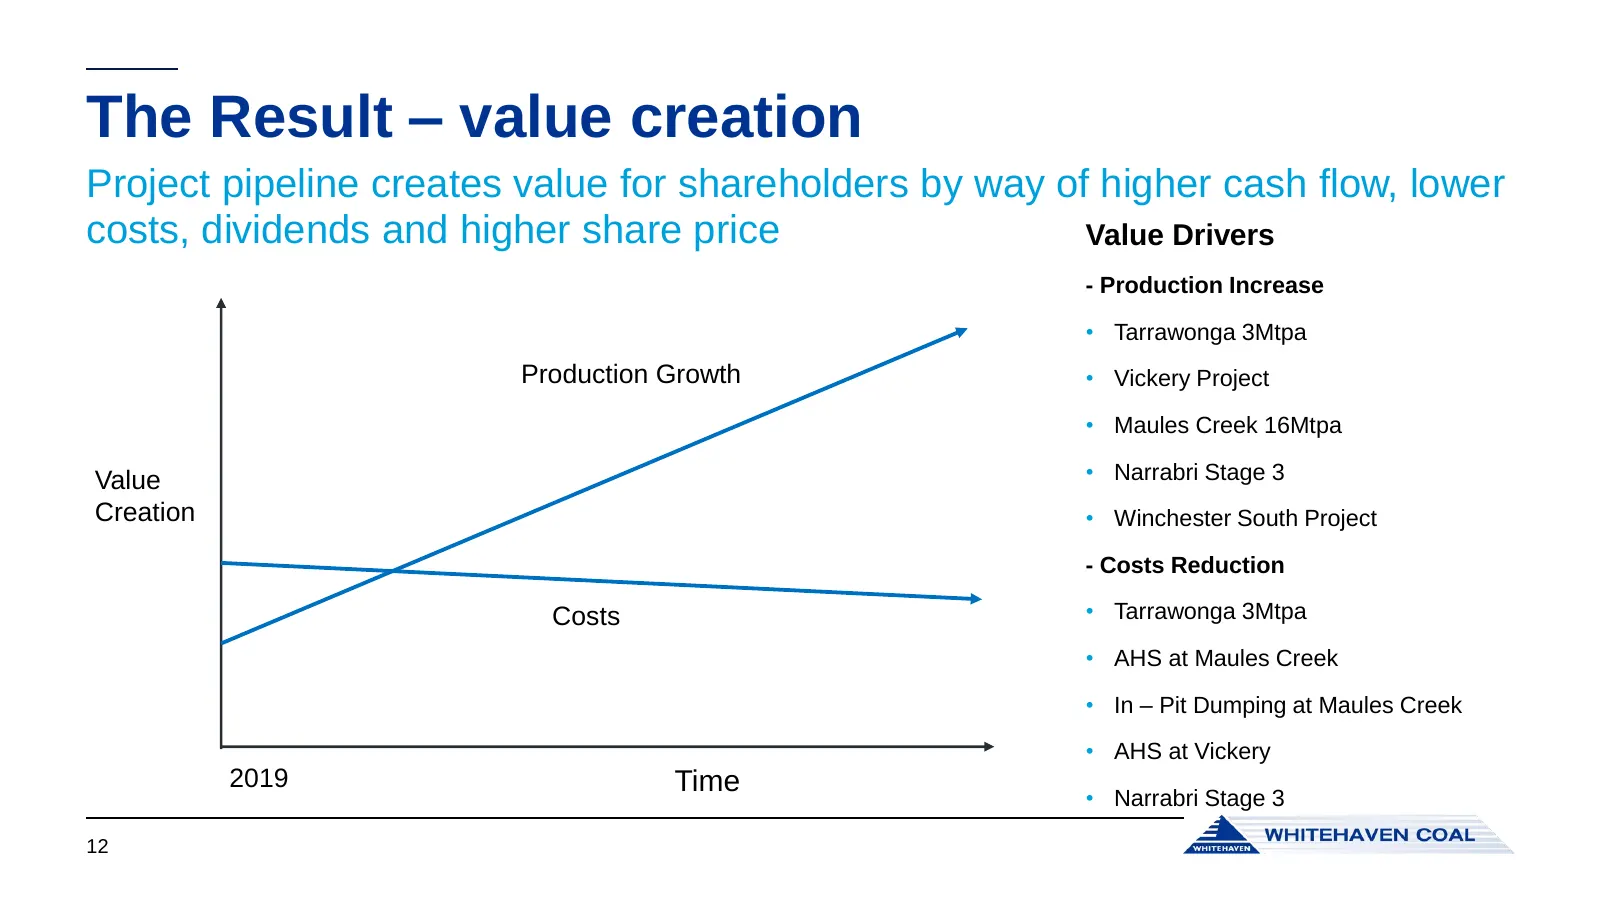
Slide 12: The Result – value creation
The Result – value creation Project pipeline creates value for shareholders by way of higher cash flow, lower costs, dividends and higher share price Value Drivers - Production Increase • Tarrawonga 3Mtpa Production Growth • Vickery Project • Maules Creek 16Mtpa Value • Narrabri Stage 3 Creation • W
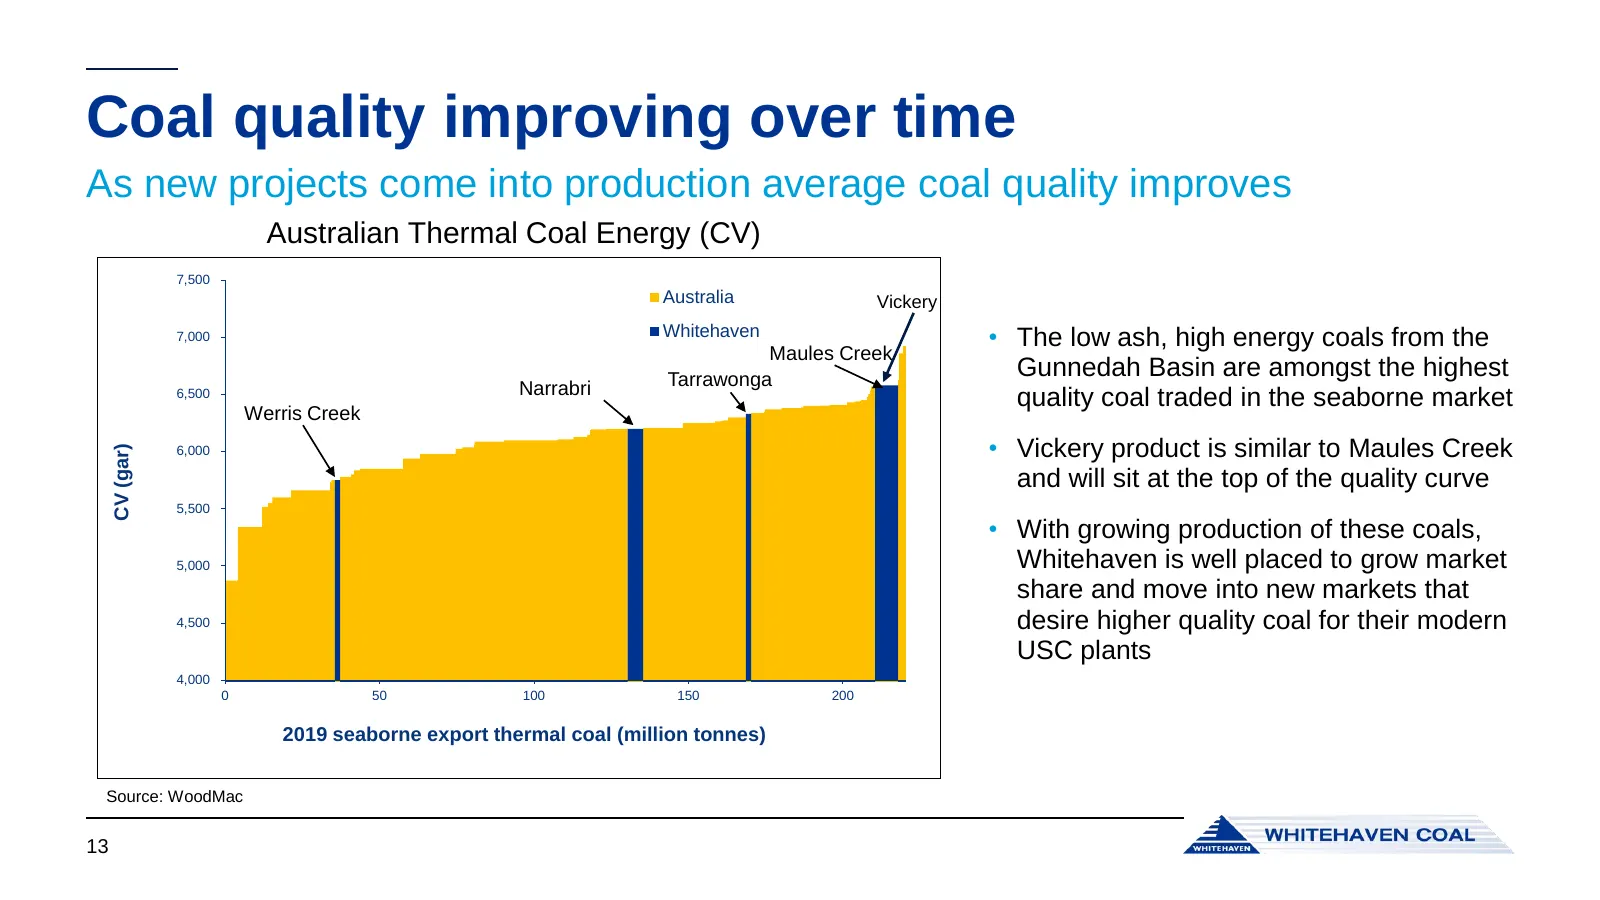
Slide 13: Coal quality improving over time
Coal quality improving over time As new projects come into production average coal quality improves Australian Thermal Coal Energy (CV) 7,500 Australia Vickery 7,000 Whitehaven • The low ash, high energy coals from the Maules Creek Tarrawonga Gunnedah Basin are amongst the highest Narrabri 6,500 qua
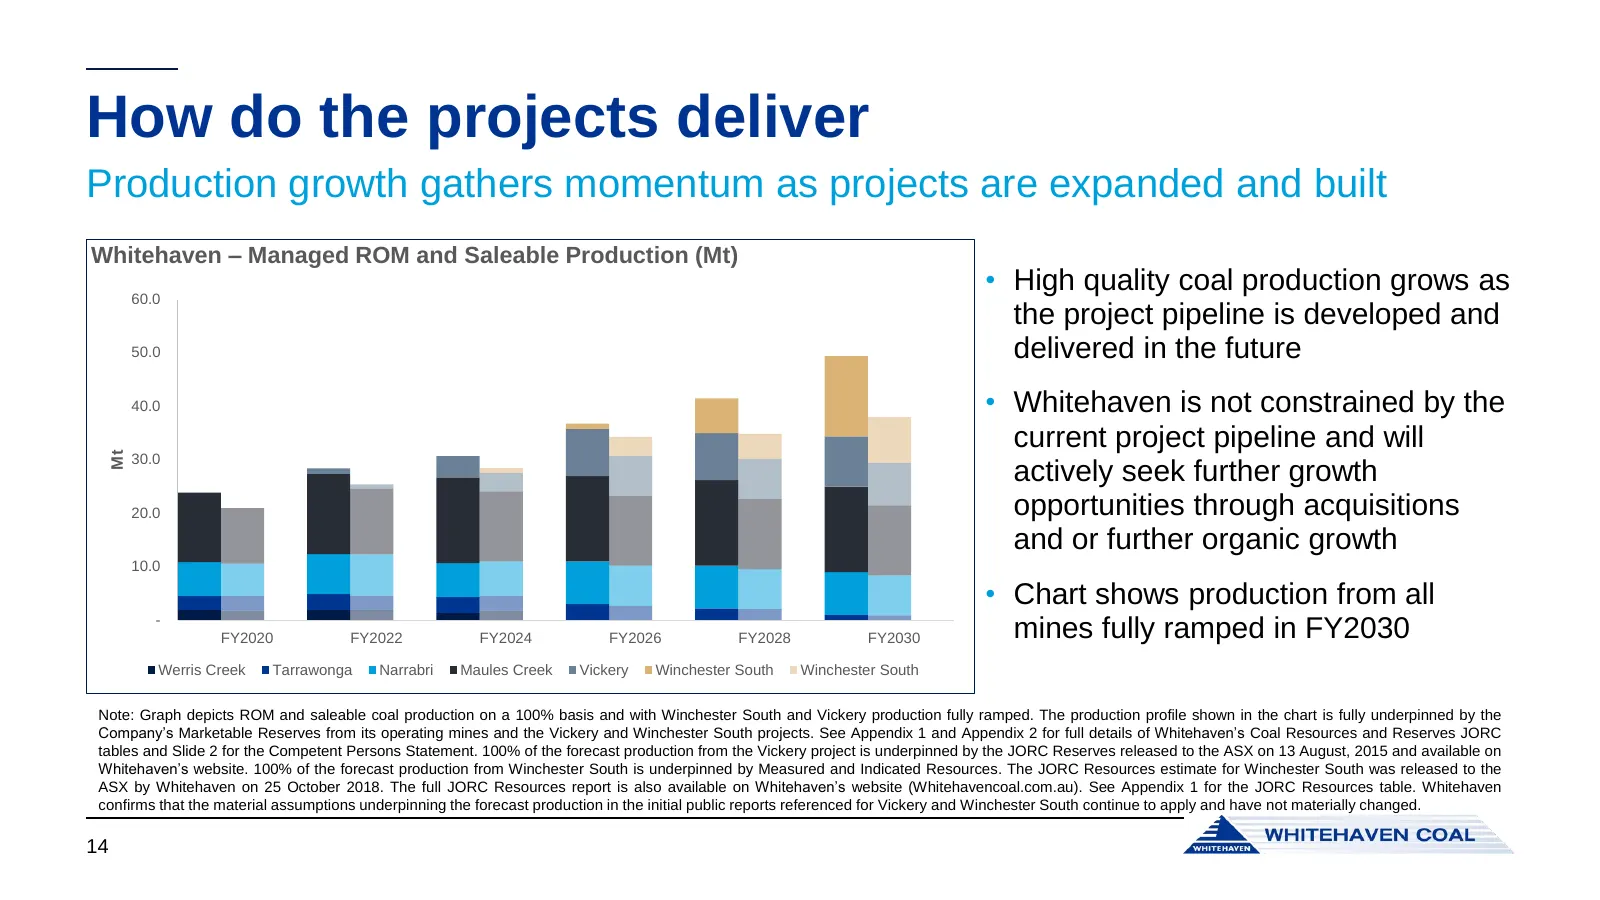
Slide 14: How do the projects deliver
How do the projects deliver Production growth gathers momentum as projects are expanded and built Whitehaven – Managed ROM and Saleable Production (Mt) 60.0 • High quality coal production grows as the project pipeline is developed and 50.0 delivered in the future 40.0 • Whitehaven is not constrained
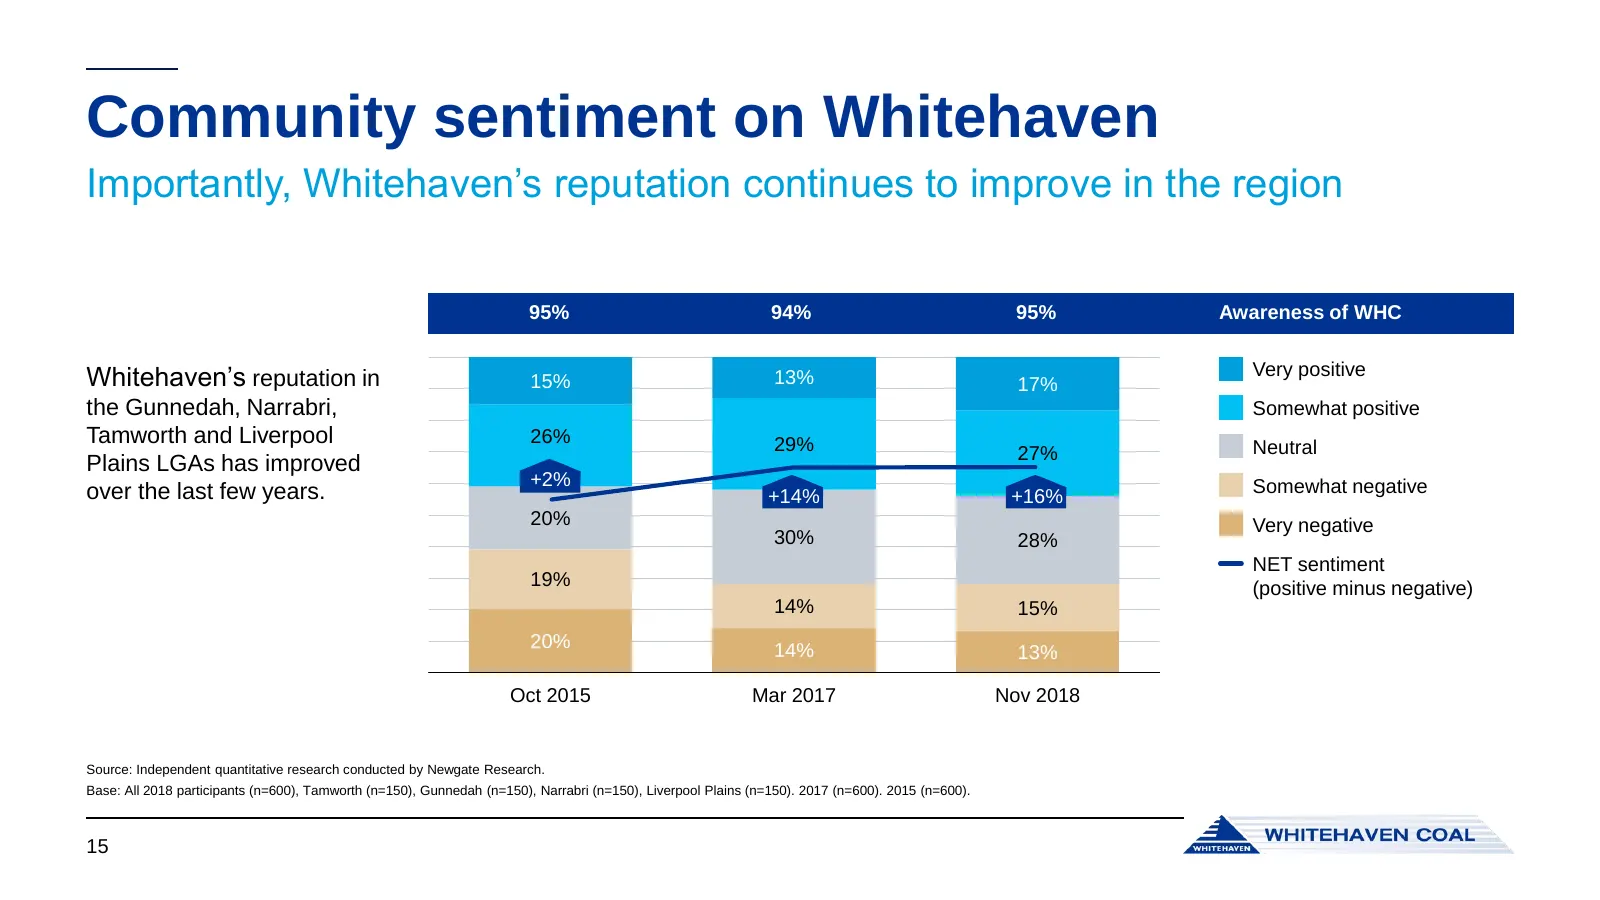
Slide 15: Community sentiment on Whitehaven
Community sentiment on Whitehaven Importantly, Whitehaven’s reputation continues to improve in the region 95% 94% 95% Awareness of WHC Very positive Whitehaven’s reputation in 15% 13% 17% the Gunnedah, Narrabri, Somewhat positive Tamworth and Liverpool 26% 29% Neutral 27% Plains LGAs has improved +2
Slide 16: Summary
Summary Whitehaven, a growth company • Delivering on our growth strategy will create significant value for shareholders • The focus will be on delivering the pipeline in a timely fashion by negotiating the approval process and committing to their development • Supporting the local community and ensu
Slide 17: Marketing – Scott Knights, EGM Marketing
Marketing – Scott Knights, EGM Marketing
Slide 18: Coal significant in energy mix
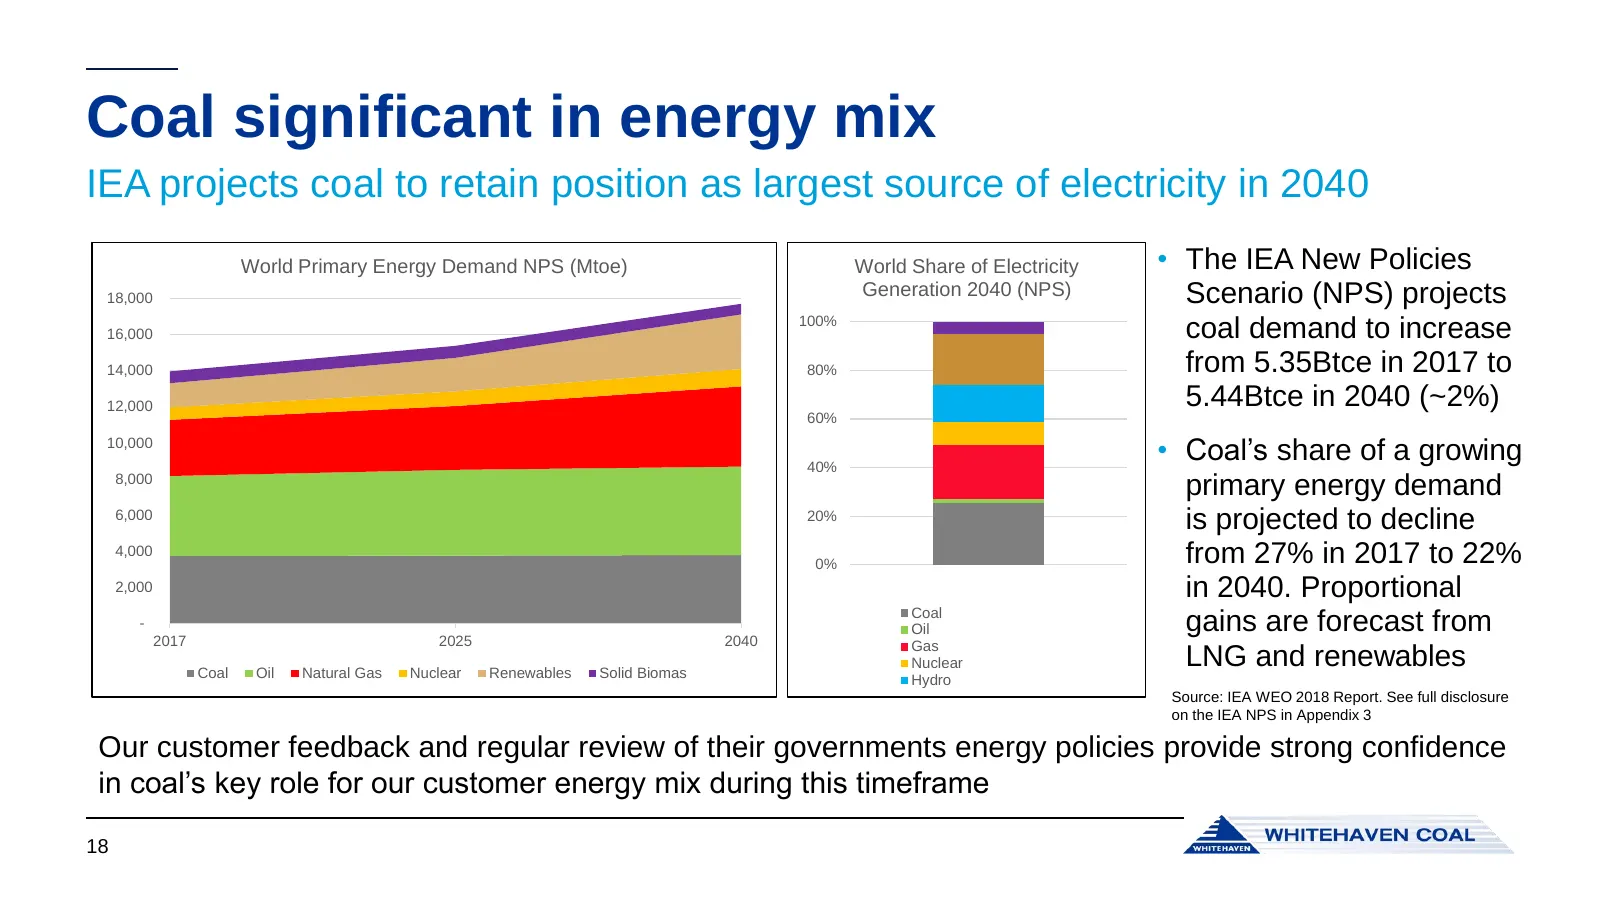
Coal significant in energy mix IEA projects coal to retain position as largest source of electricity in 2040 World Primary Energy Demand NPS (Mtoe) World Share of Electricity • The IEA New Policies 18,000 Generation 2040 (NPS) Scenario (NPS) projects 100% 16,000 coal demand to increase 14,000 80% fr
Slide 19: Thermal demand
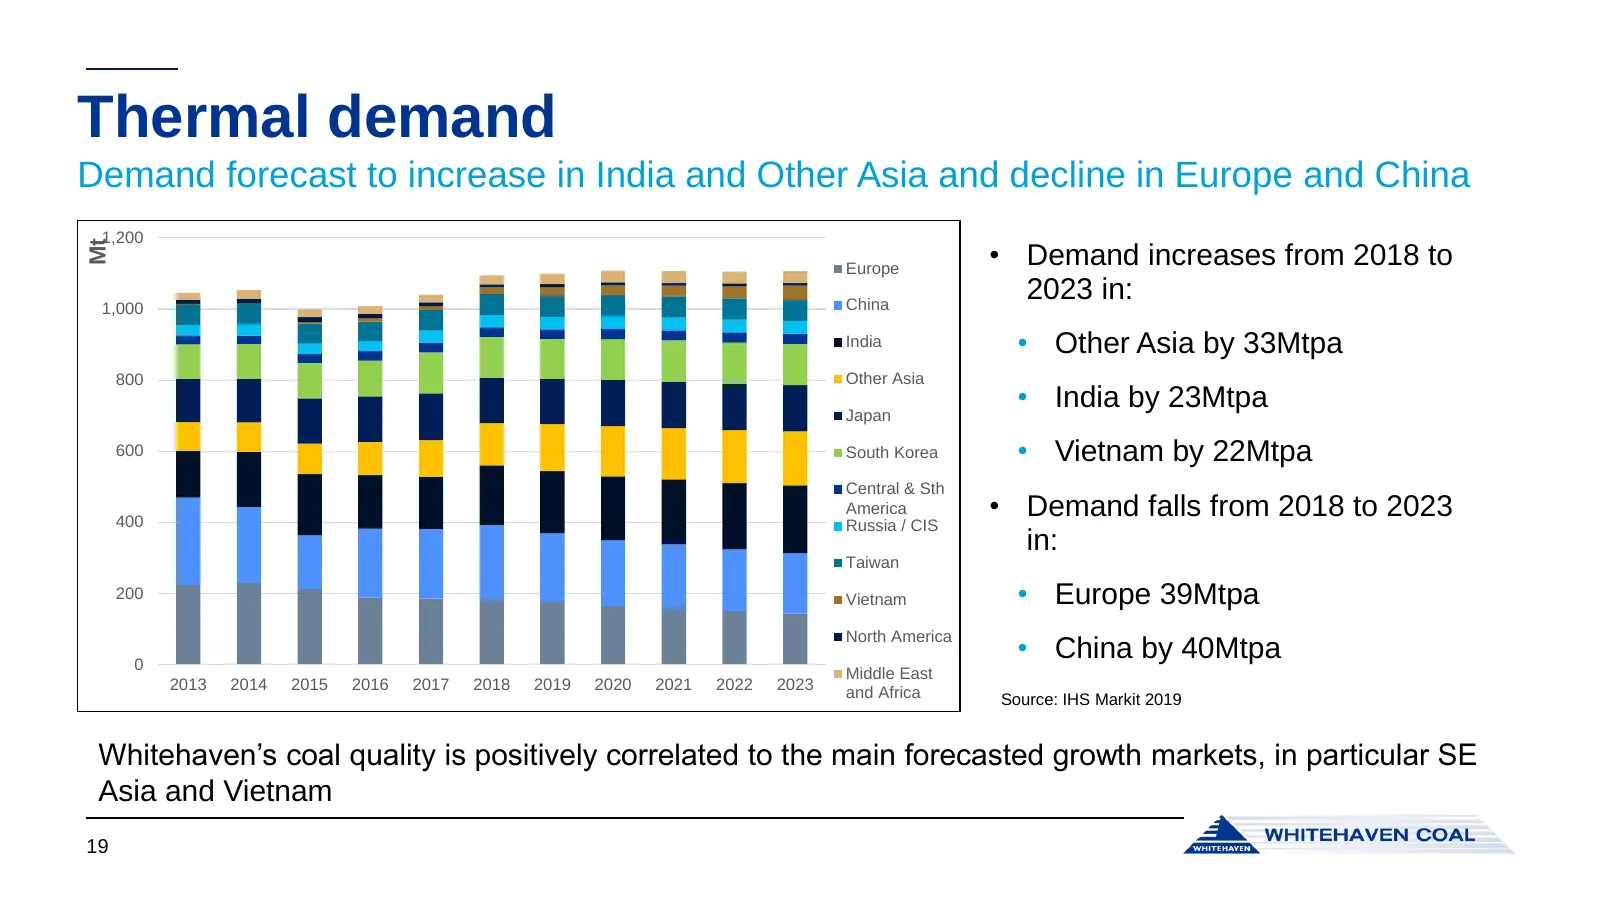
Thermal demand Demand forecast to increase in India and Other Asia and decline in Europe and China 1,200 • Demand increases from 2018 to Mt Europe 1,000 China 2023 in: India • Other Asia by 33Mtpa 800 Other Asia Japan • India by 23Mtpa 600 South Korea • Vietnam by 22Mtpa Central & Sth 400 America •
Slide 20: Why the growth in India and Southeast Asia?
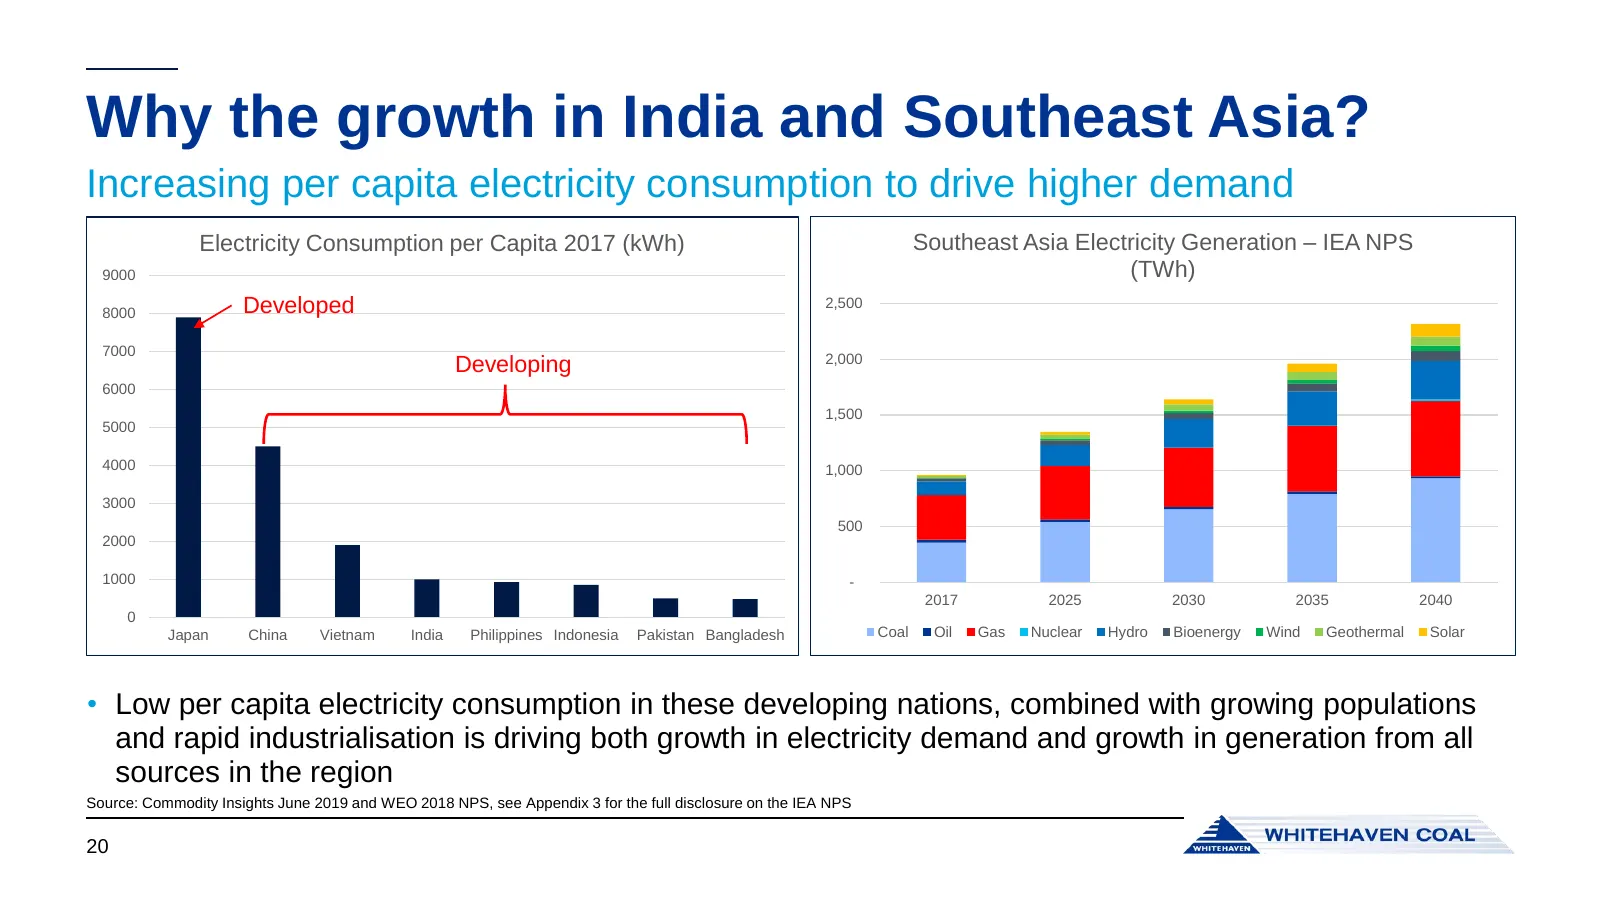
Why the growth in India and Southeast Asia? Increasing per capita electricity consumption to drive higher demand Electricity Consumption per Capita 2017 (kWh) Southeast Asia Electricity Generation – IEA NPS 9000 (TWh) 8000 Developed 2,500 7000 2,000 Developing 6000 1,500 5000 4000 1,000 3000 500 200
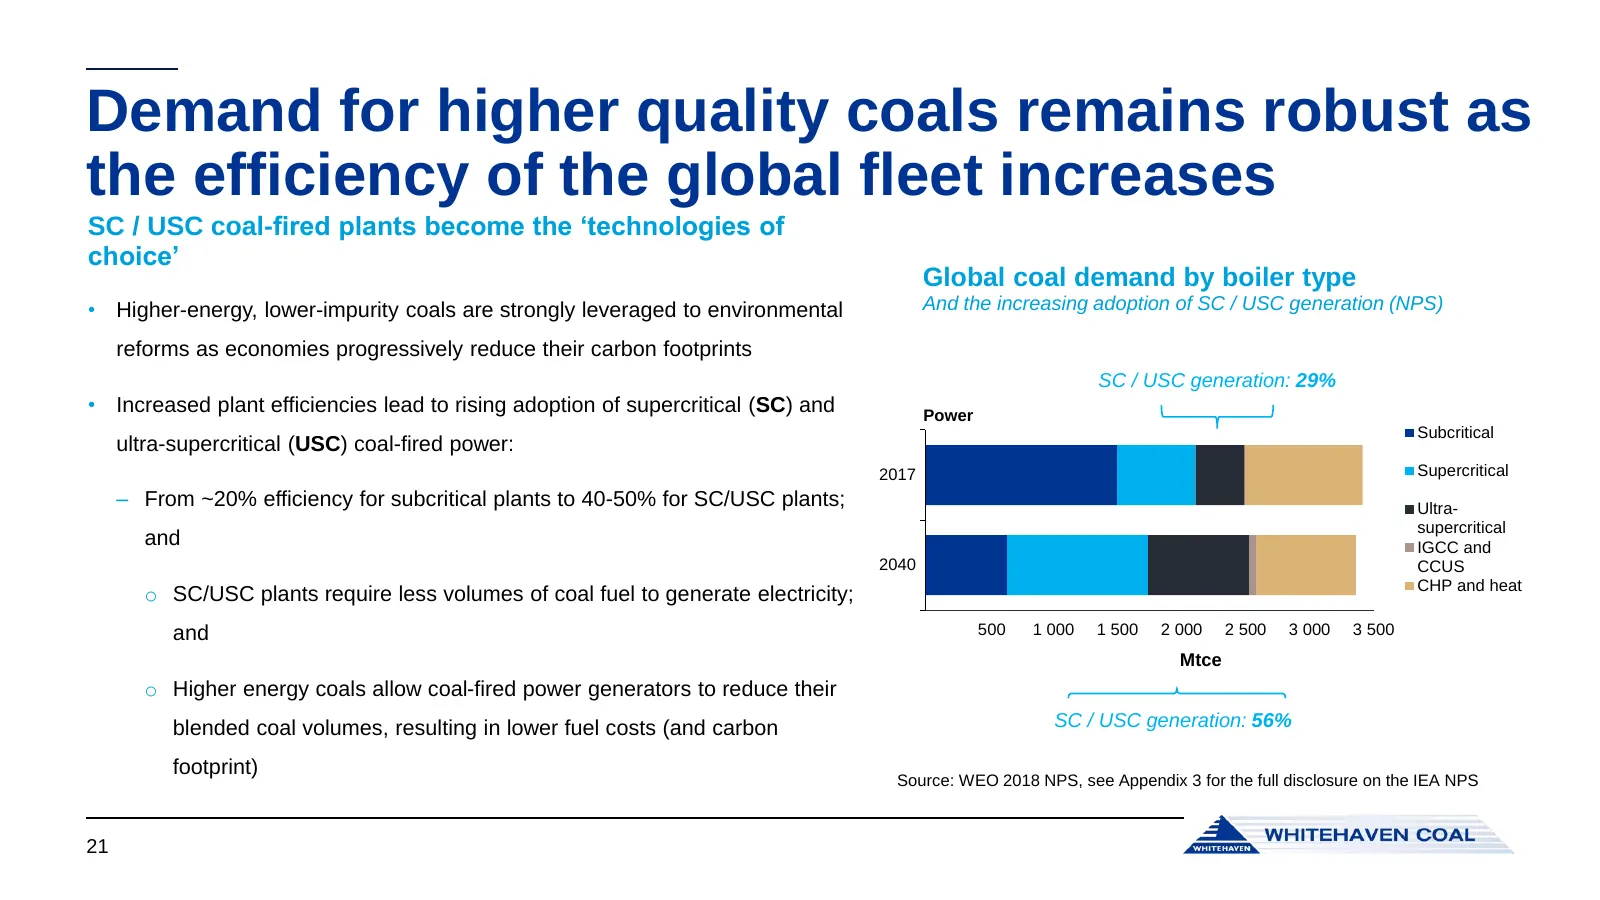
Slide 21: Demand for higher quality coals remains robust
Demand for higher quality coals remains robust as the efficiency of the global fleet increases SC / USC coal-fired plants become the ‘technologies of choice’ Global coal demand by boiler type • Higher-energy, lower-impurity coals are strongly leveraged to environmental And the increasing adoption of
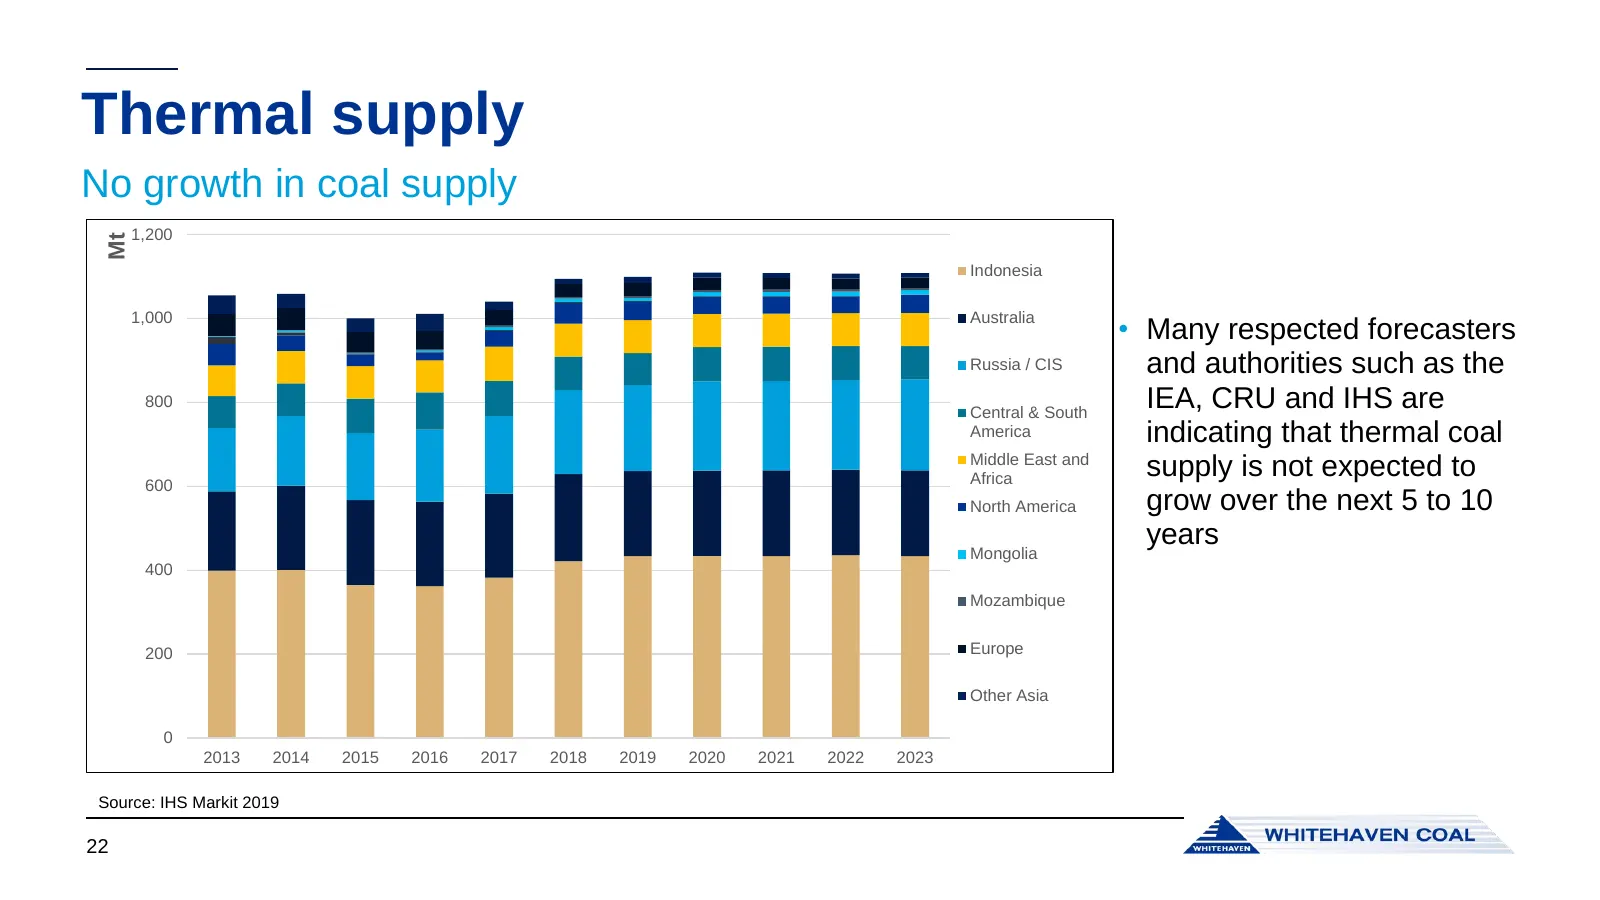
Slide 22: Thermal supply
Thermal supply No growth in coal supply 1,200 Mt Indonesia 1,000 Australia • Many respected forecasters Russia / CIS and authorities such as the 800 Central & South IEA, CRU and IHS are America indicating that thermal coal Middle East and Africa supply is not expected to 600 North America grow over
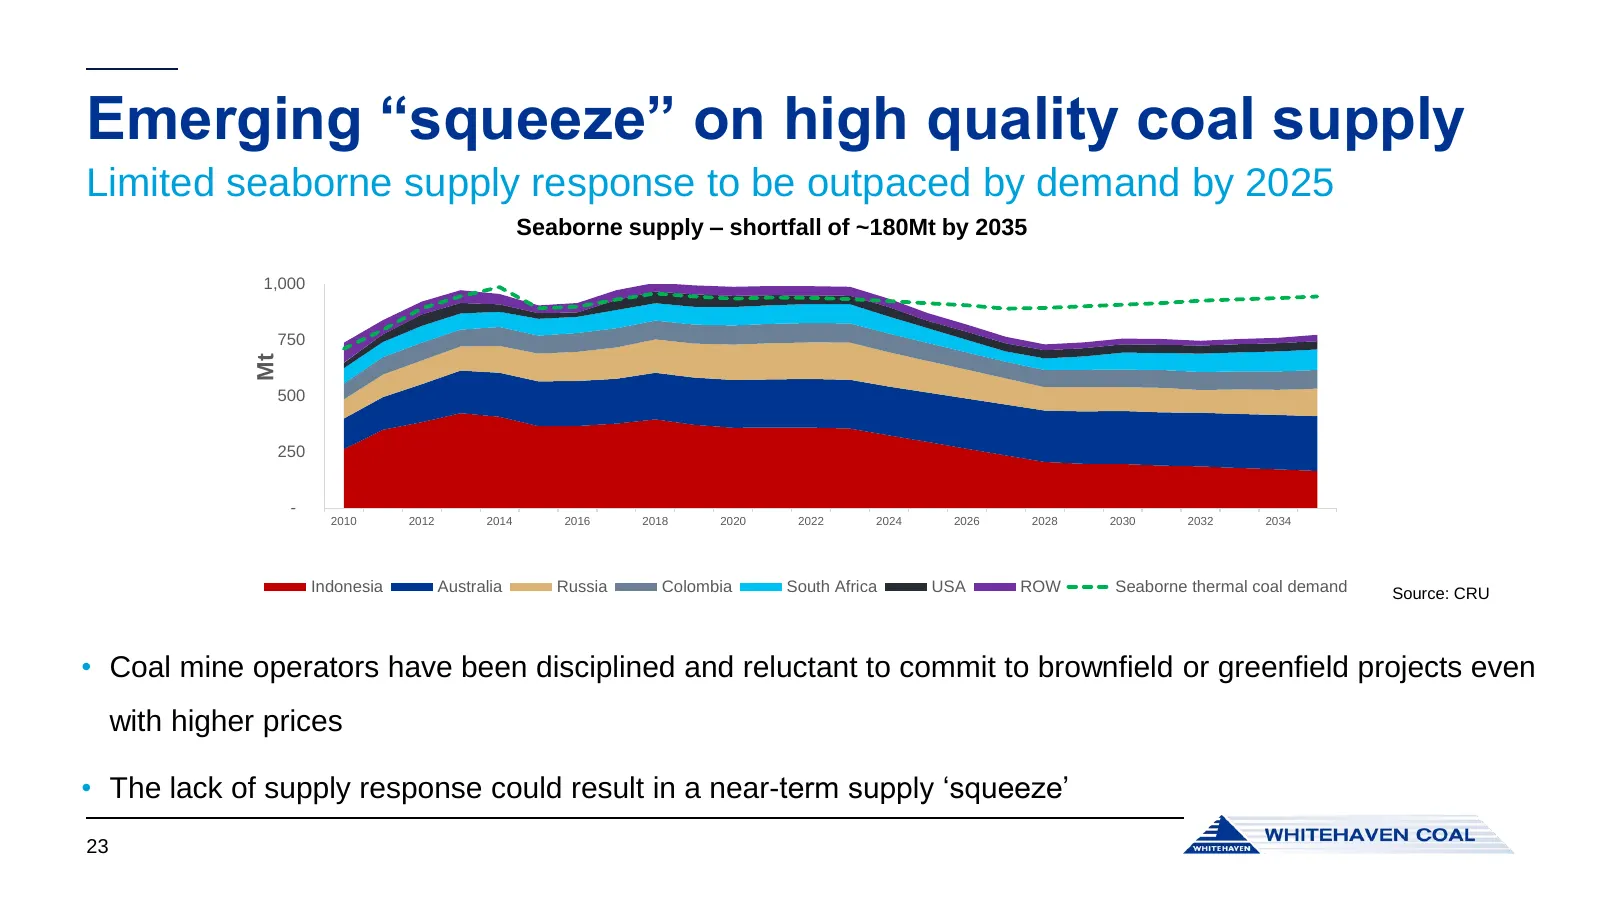
Slide 23: Emerging squeeze on high quality coal supply
Emerging “squeeze” on high quality coal supply Limited seaborne supply response to be outpaced by demand by 2025 Seaborne supply – shortfall of ~180Mt by 2035 1,000 750 Mt 500 250 - 2010 2012 2014 2016 2018 2020 2022 2024 2026 2028 2030 2032 2034 Indonesia Australia Russia Colombia South Africa USA
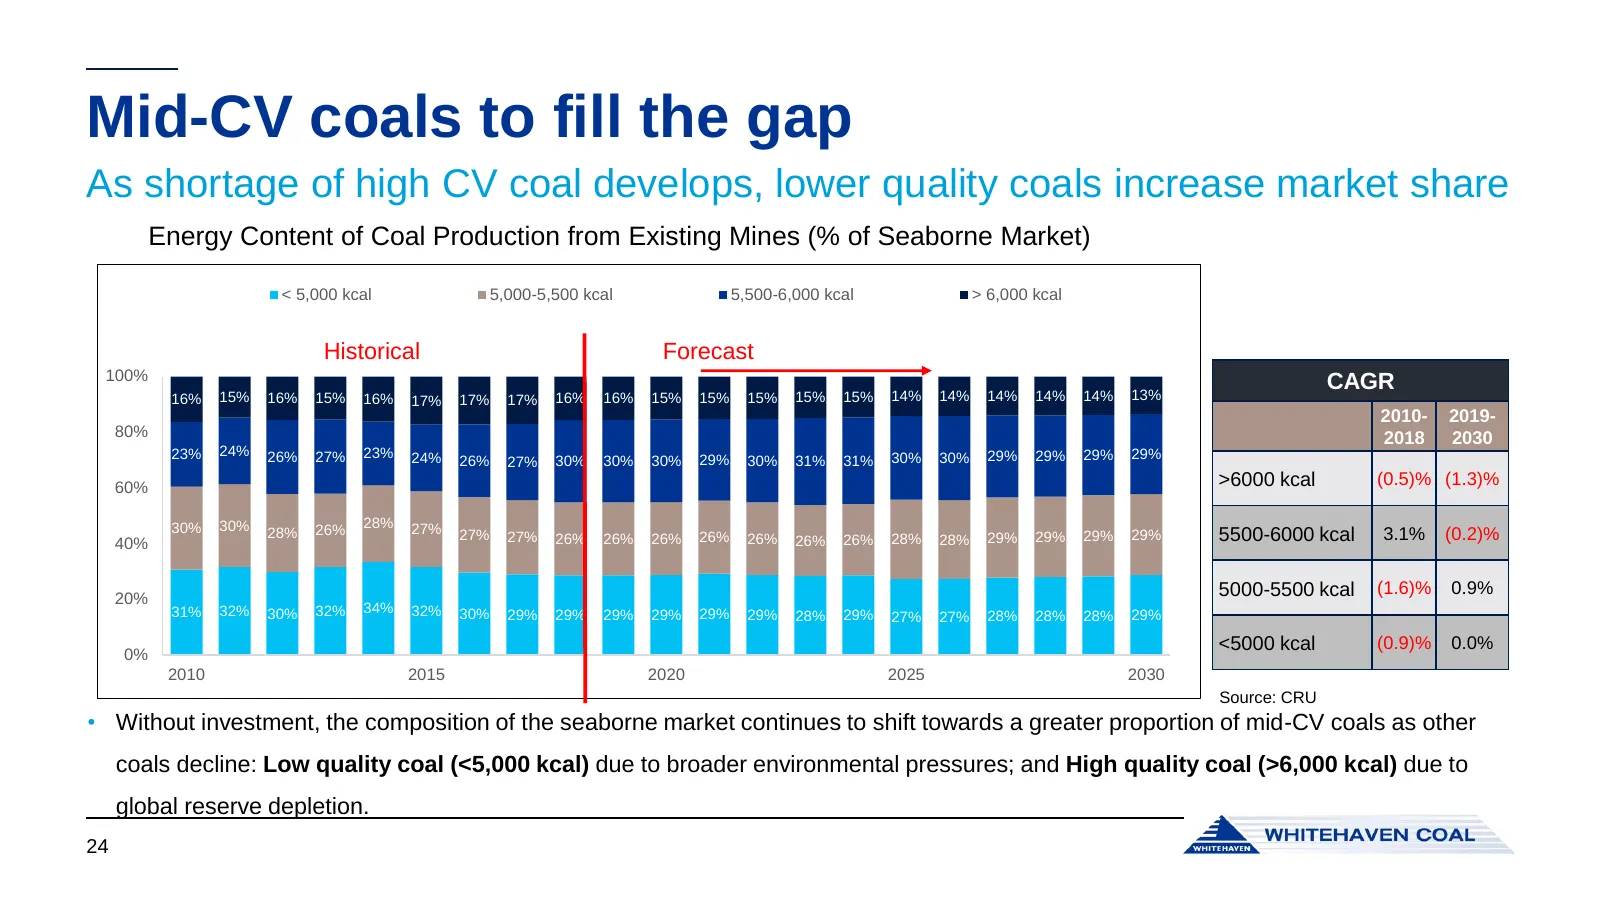
Slide 24: Mid-CV coals to fill the gap
Mid-CV coals to fill the gap As shortage of high CV coal develops, lower quality coals increase market share Energy Content of Coal Production from Existing Mines (% of Seaborne Market) < 5,000 kcal 5,000-5,500 kcal 5,500-6,000 kcal > 6,000 kcal Historical Forecast 100% CAGR 16% 15% 16% 15% 16% 17%
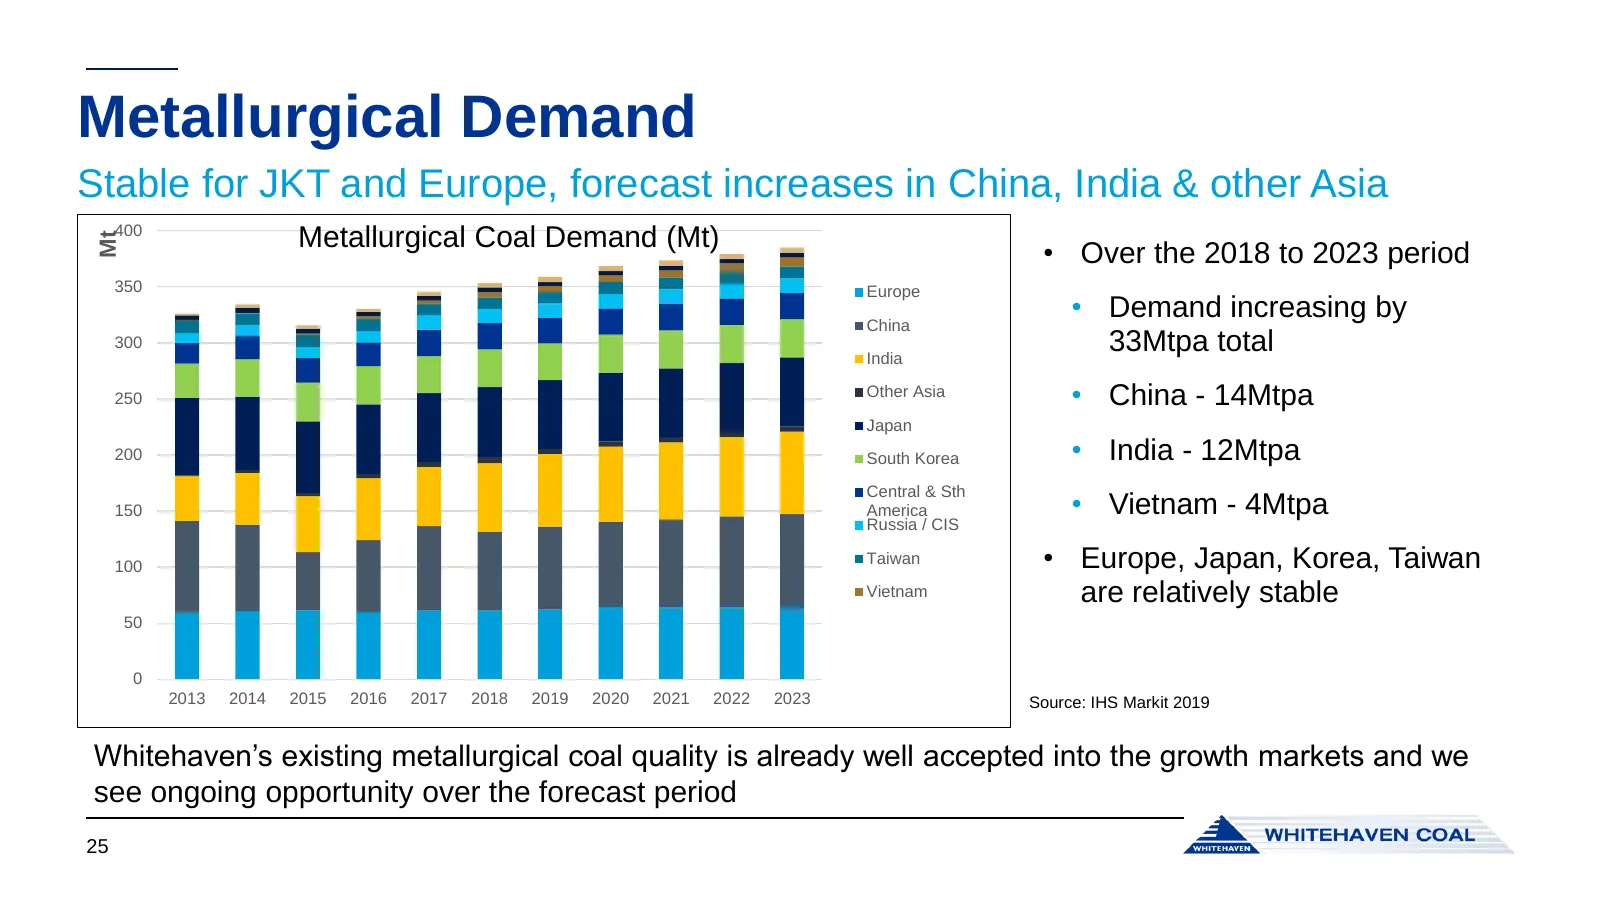
Slide 25: Metallurgical Demand
Metallurgical Demand Stable for JKT and Europe, forecast increases in China, India & other Asia 400 Metallurgical Coal Demand (Mt) Mt • Over the 2018 to 2023 period 350 Europe China • Demand increasing by 300 India 33Mtpa total 250 Other Asia • China - 14Mtpa Japan 200 South Korea • India - 12Mtpa C
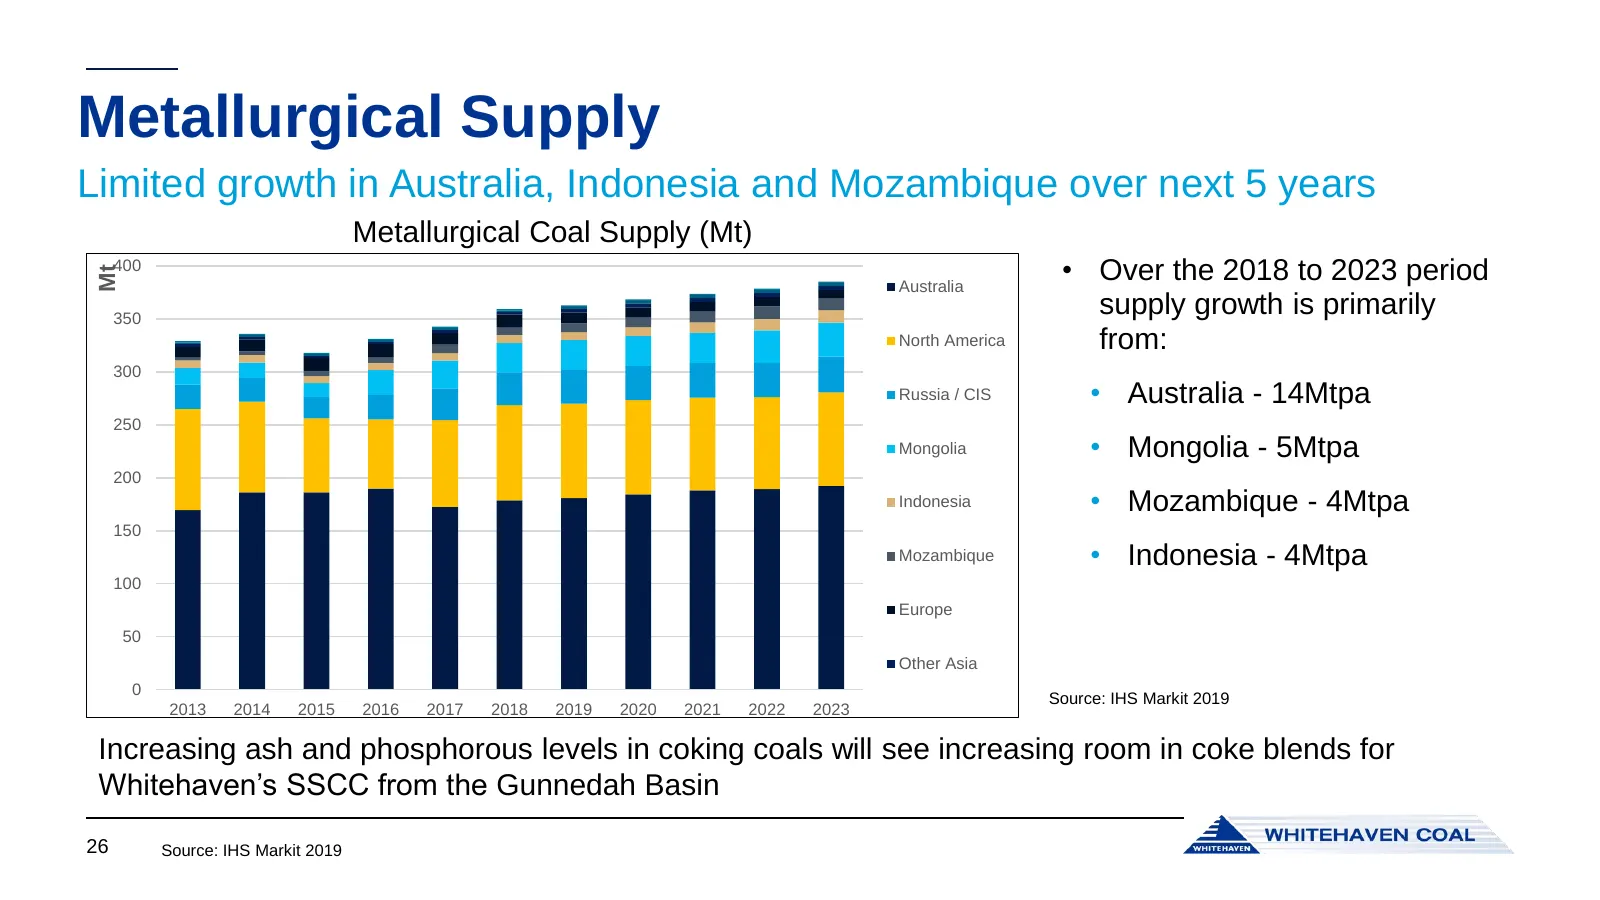
Slide 26: Metallurgical Supply
Metallurgical Supply Limited growth in Australia, Indonesia and Mozambique over next 5 years Metallurgical Coal Supply (Mt) 400 • Over the 2018 to 2023 period Mt Australia 350 supply growth is primarily North America from: 300 Russia / CIS • Australia - 14Mtpa 250 Mongolia • Mongolia - 5Mtpa 200 Ind
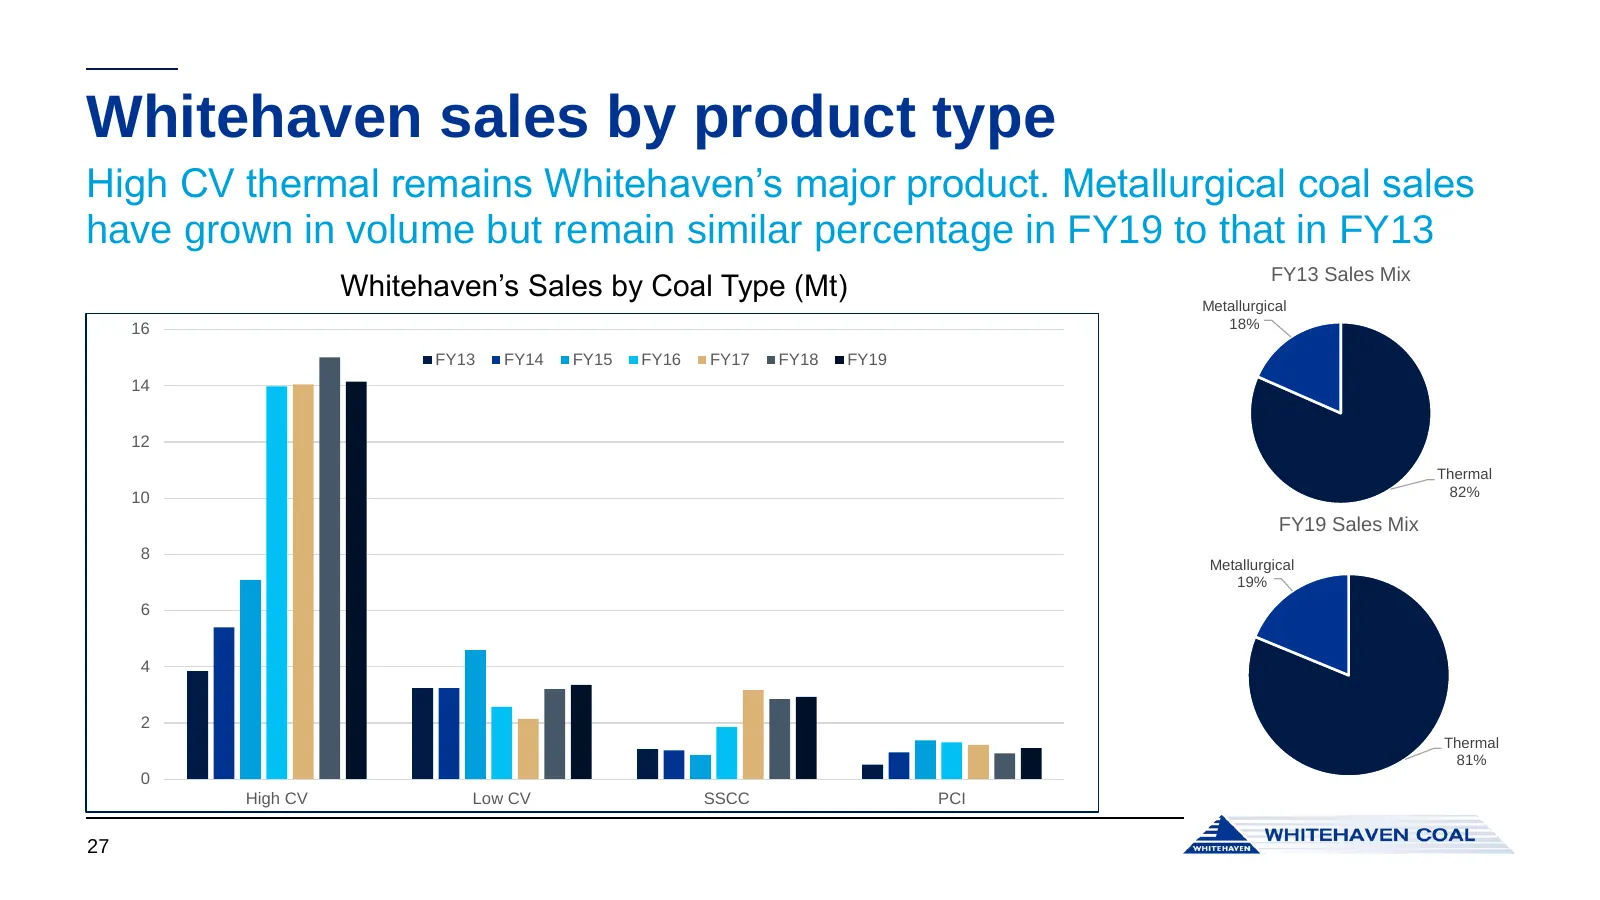
Slide 27: Whitehaven sales by product type
Whitehaven sales by product type High CV thermal remains Whitehaven’s major product. Metallurgical coal sales have grown in volume but remain similar percentage in FY19 to that in FY13 FY13 Sales Mix Whitehaven’s Sales by Coal Type (Mt) Metallurgical 16 18% FY13 FY14 FY15 FY16 FY17 FY18 FY19 14 12 T
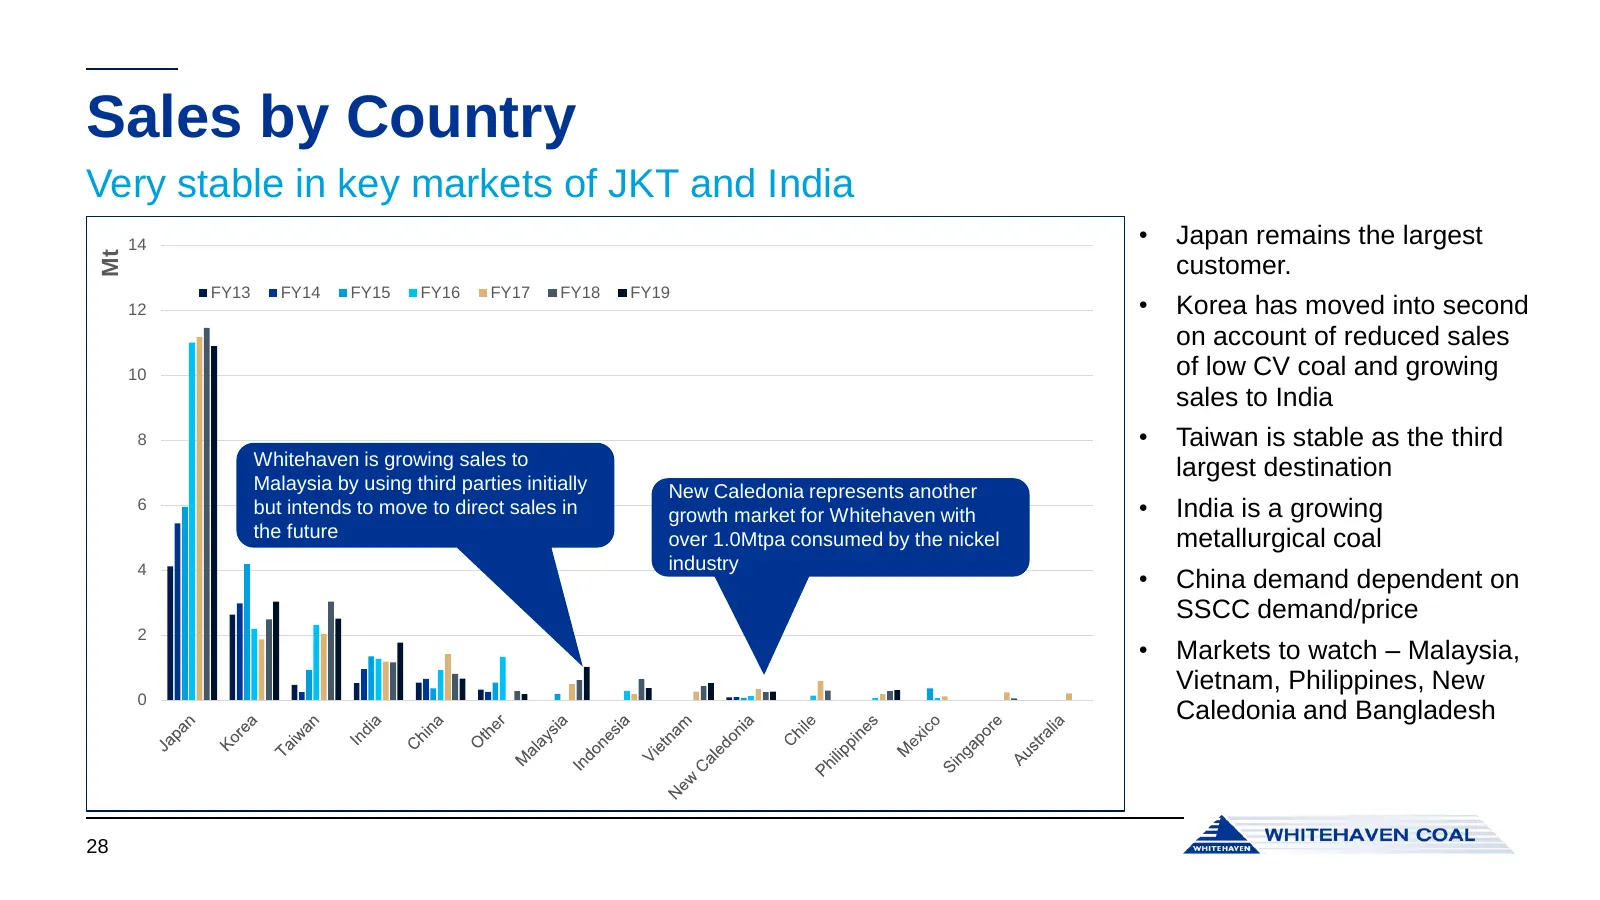
Slide 28: Sales by Country
Sales by Country Very stable in key markets of JKT and India 14 • Japan remains the largest Mt customer. FY13 FY14 FY15 FY16 FY17 FY18 FY19 12 • Korea has moved into second on account of reduced sales 10 of low CV coal and growing sales to India 8 • Taiwan is stable as the third Whitehaven is growin
Slide 29: Key marketing and logistics drivers
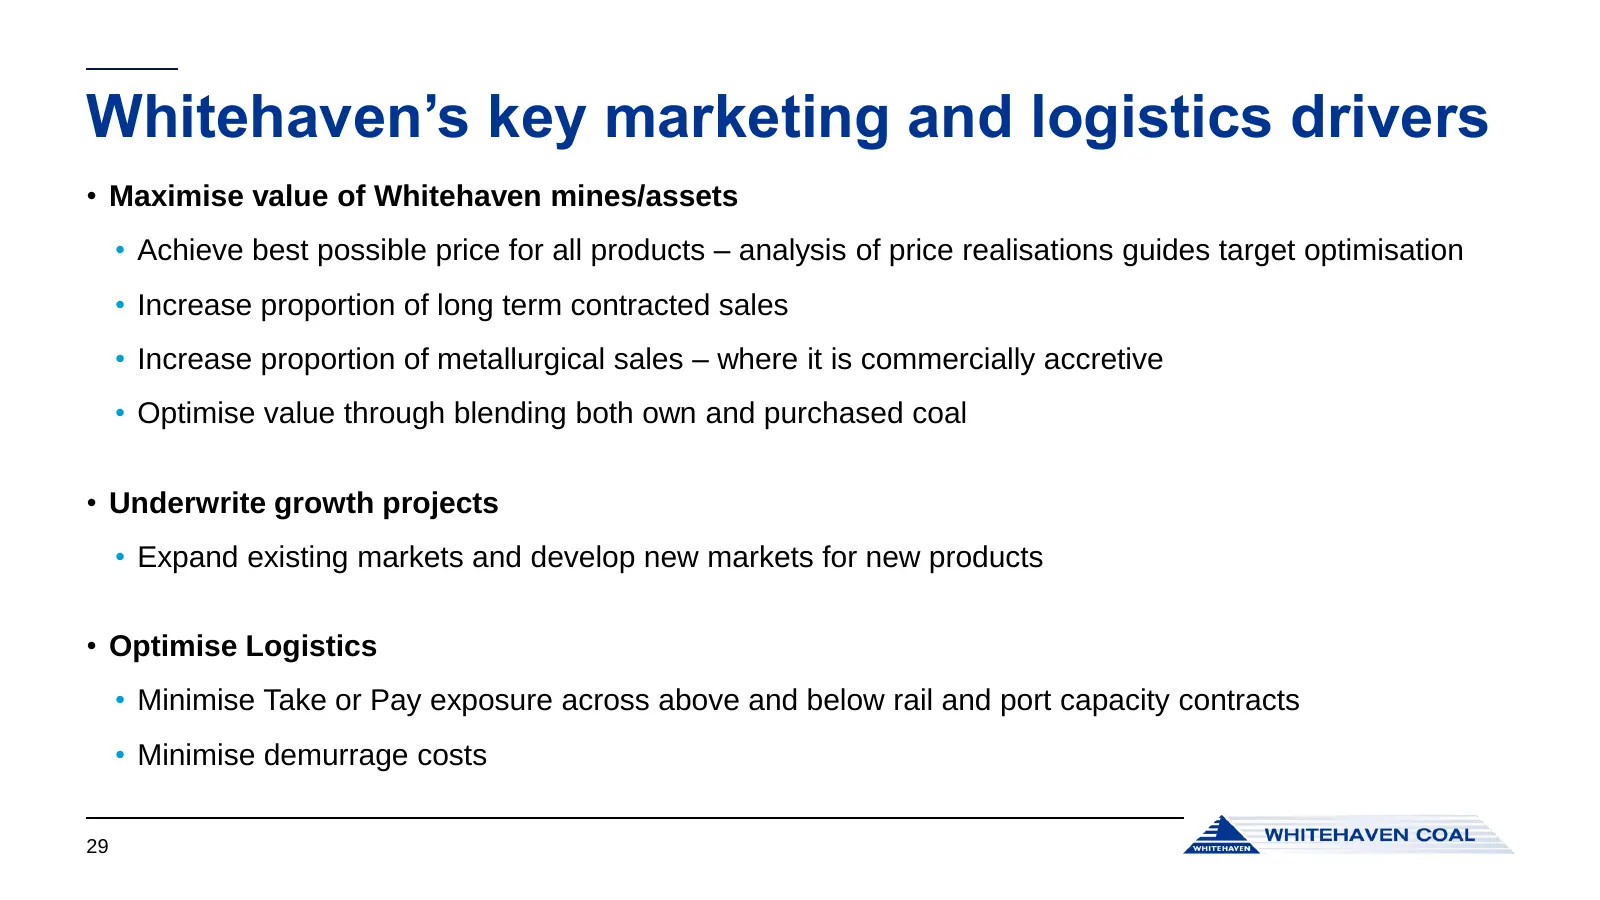
Whitehaven’s key marketing and logistics drivers • Maximise value of Whitehaven mines/assets • Achieve best possible price for all products – analysis of price realisations guides target optimisation • Increase proportion of long term contracted sales • Increase proportion of metallurgical sales – w
Slide 30: Operations – Jamie Frankcombe, COO
Operations – Jamie Frankcombe, COO
Slide 31: Portfolio overview
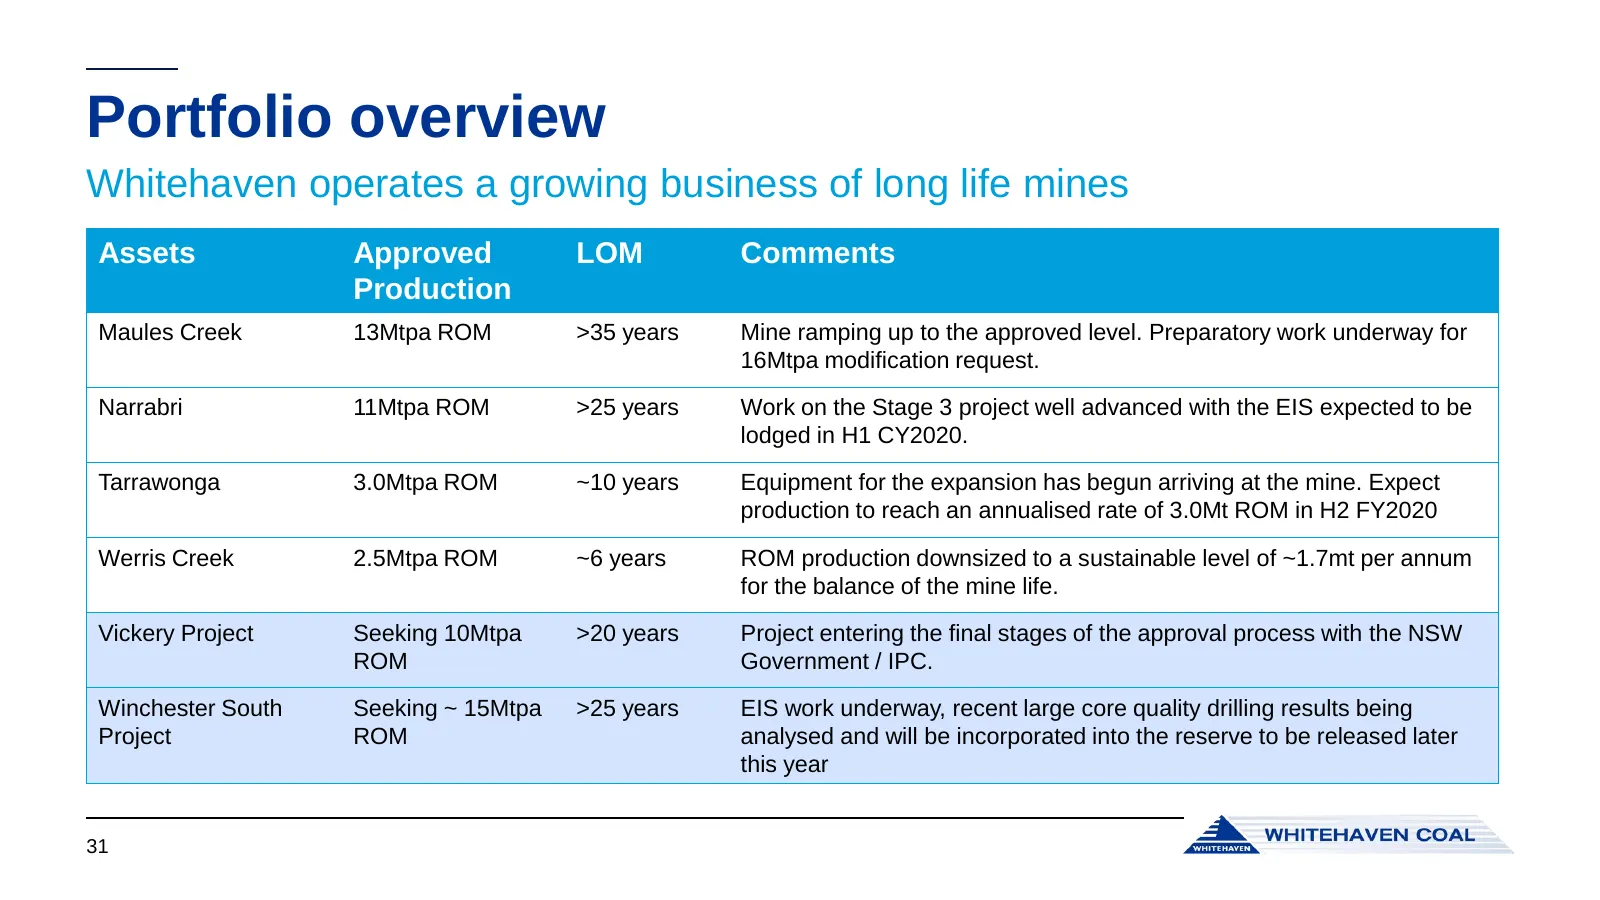
Portfolio overview Whitehaven operates a growing business of long life mines Assets Approved LOM Comments Production Maules Creek 13Mtpa ROM >35 years Mine ramping up to the approved level. Preparatory work underway for 16Mtpa modification request. Narrabri 11Mtpa ROM >25 years Work on the Stage 3 p
Slide 32: Maules Creek – In-pit dumping
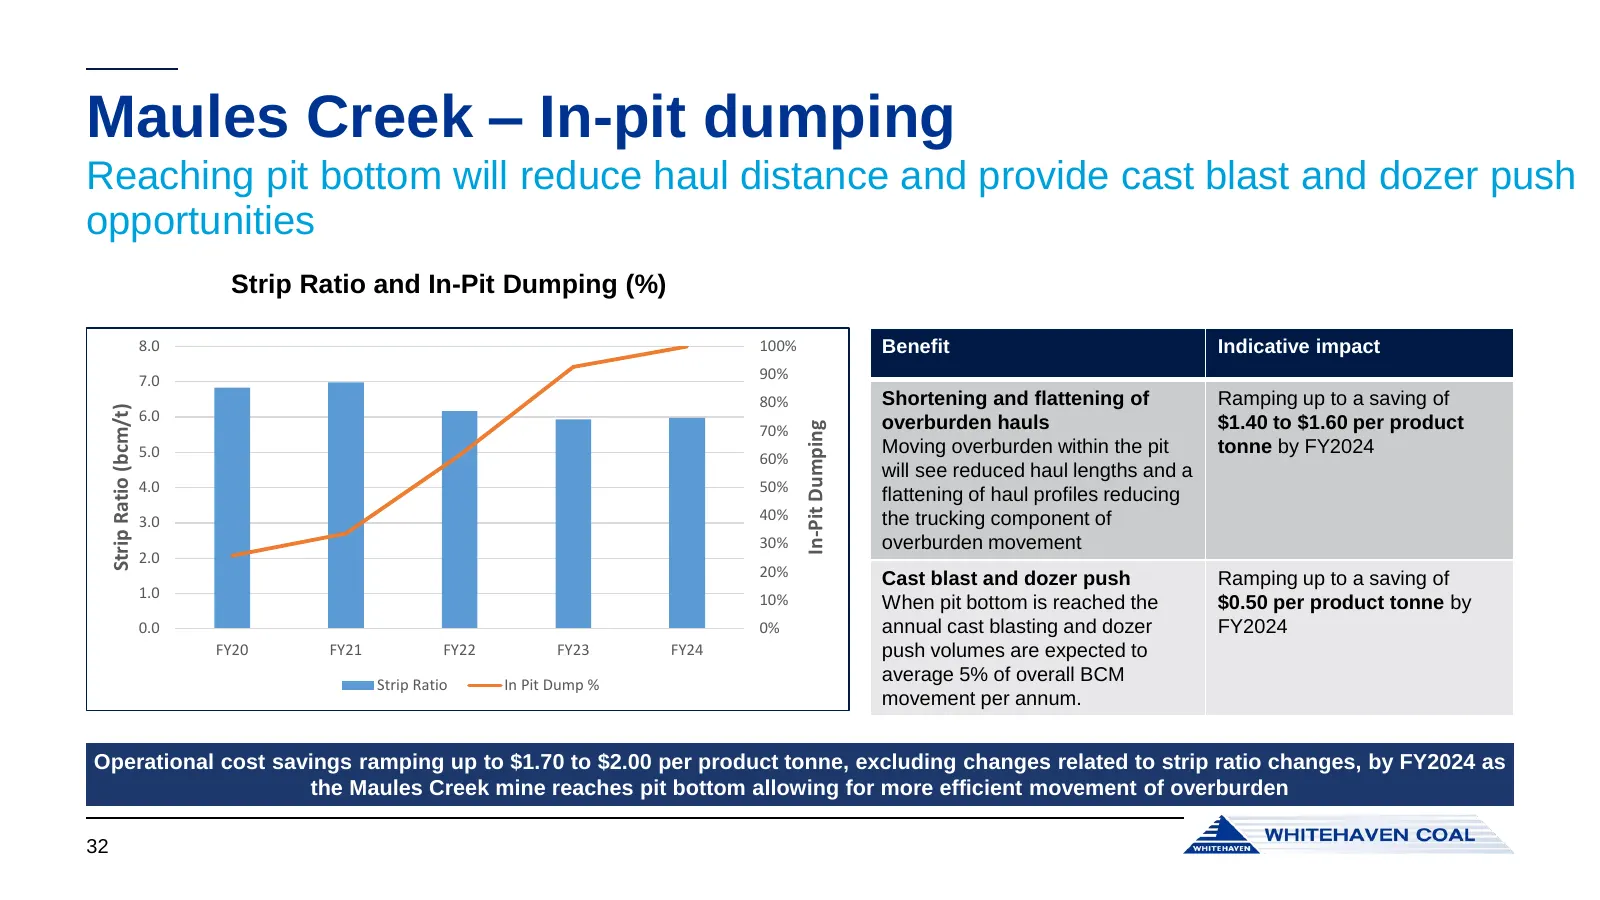
Maules Creek – In-pit dumping Reaching pit bottom will reduce haul distance and provide cast blast and dozer push opportunities Strip Ratio and In-Pit Dumping (%) 8.0 100% Benefit Indicative impact 7.0 90% 80% Shortening and flattening of Ramping up to a saving of Strip Ratio (bcm/t) 6.0 overburden
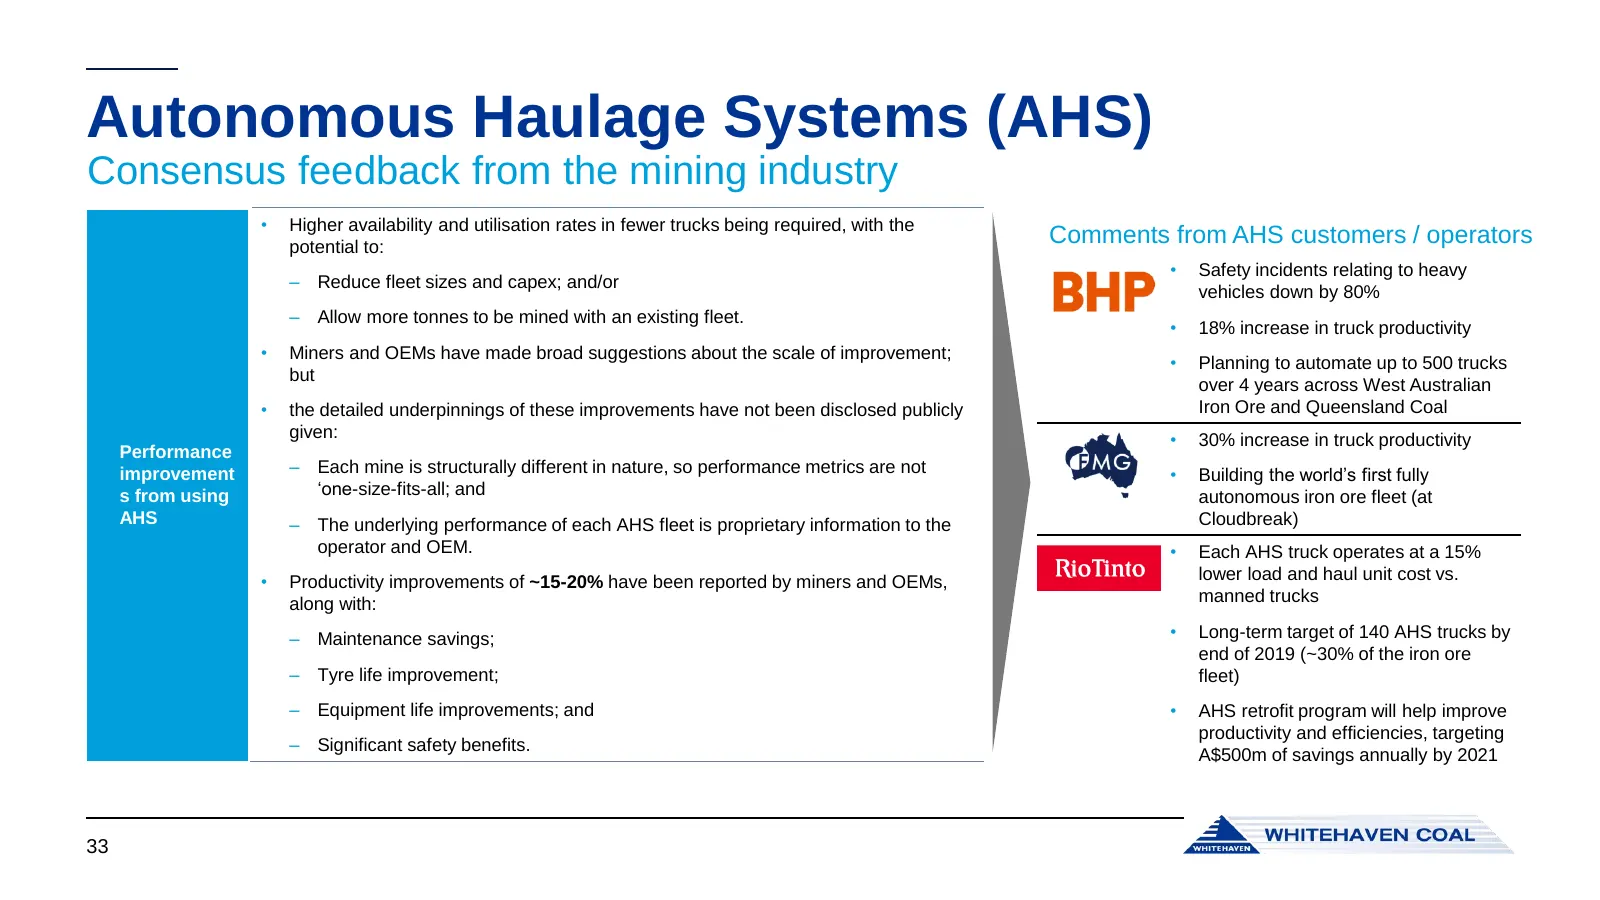
Slide 33: Autonomous Haulage Systems (AHS)
Autonomous Haulage Systems (AHS) Consensus feedback from the mining industry • Higher availability and utilisation rates in fewer trucks being required, with the potential to: Comments from AHS customers / operators • Safety incidents relating to heavy ‒ Reduce fleet sizes and capex; and/or vehicles
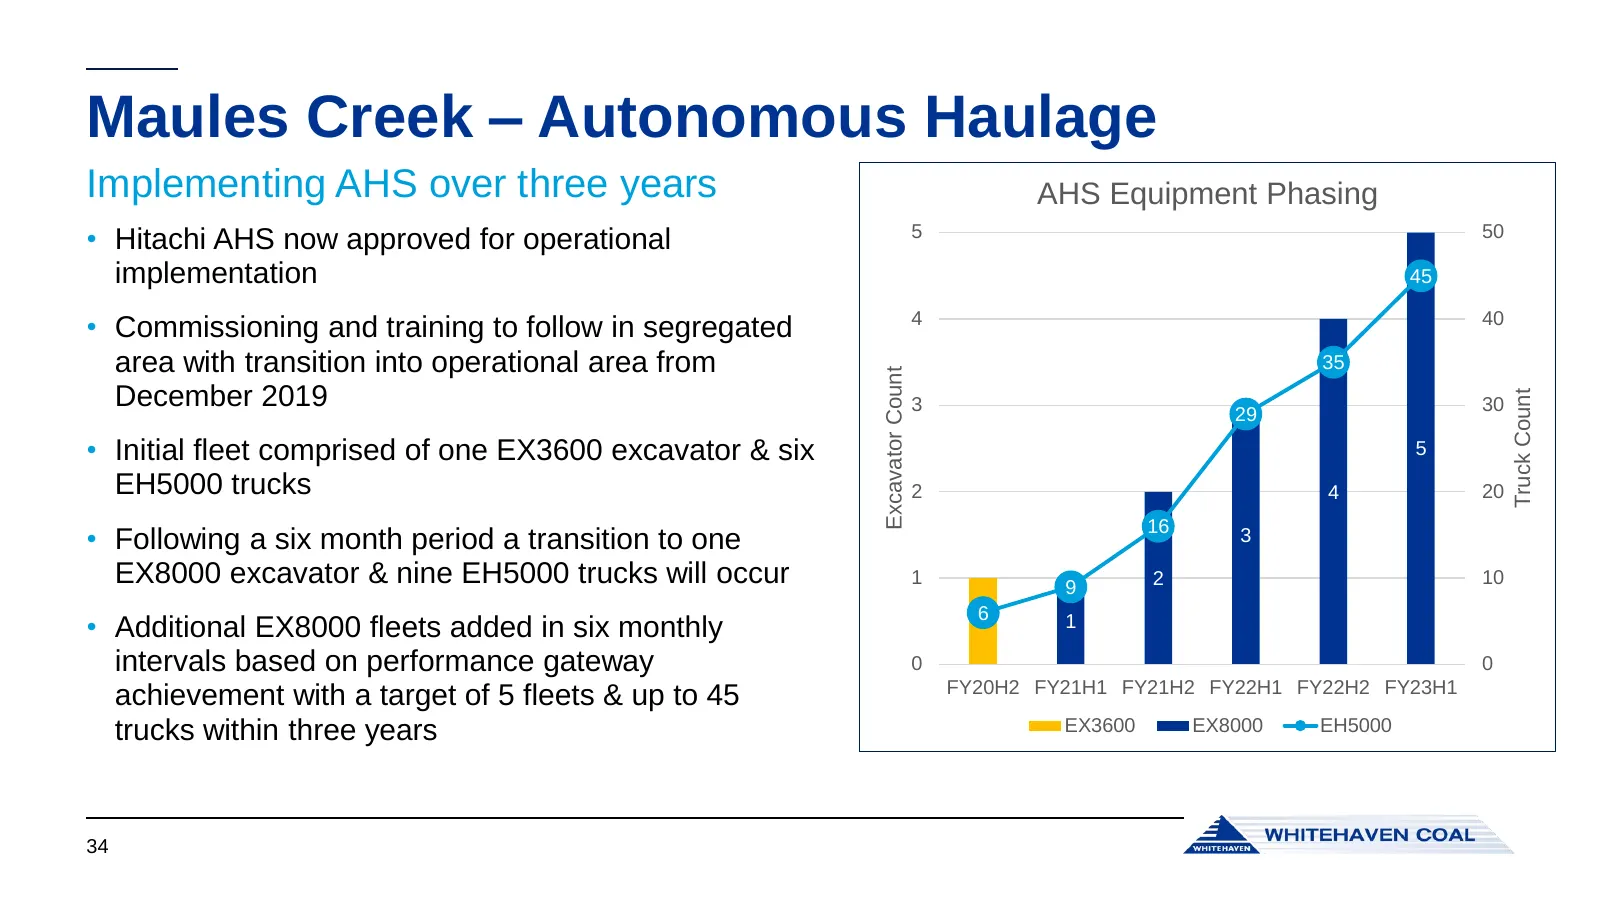
Slide 34: Maules Creek – Autonomous Haulage
Maules Creek – Autonomous Haulage Implementing AHS over three years AHS Equipment Phasing • Hitachi AHS now approved for operational 5 50 implementation 45 • Commissioning and training to follow in segregated 4 40 area with transition into operational area from 35 Excavator Count December 2019 Truck
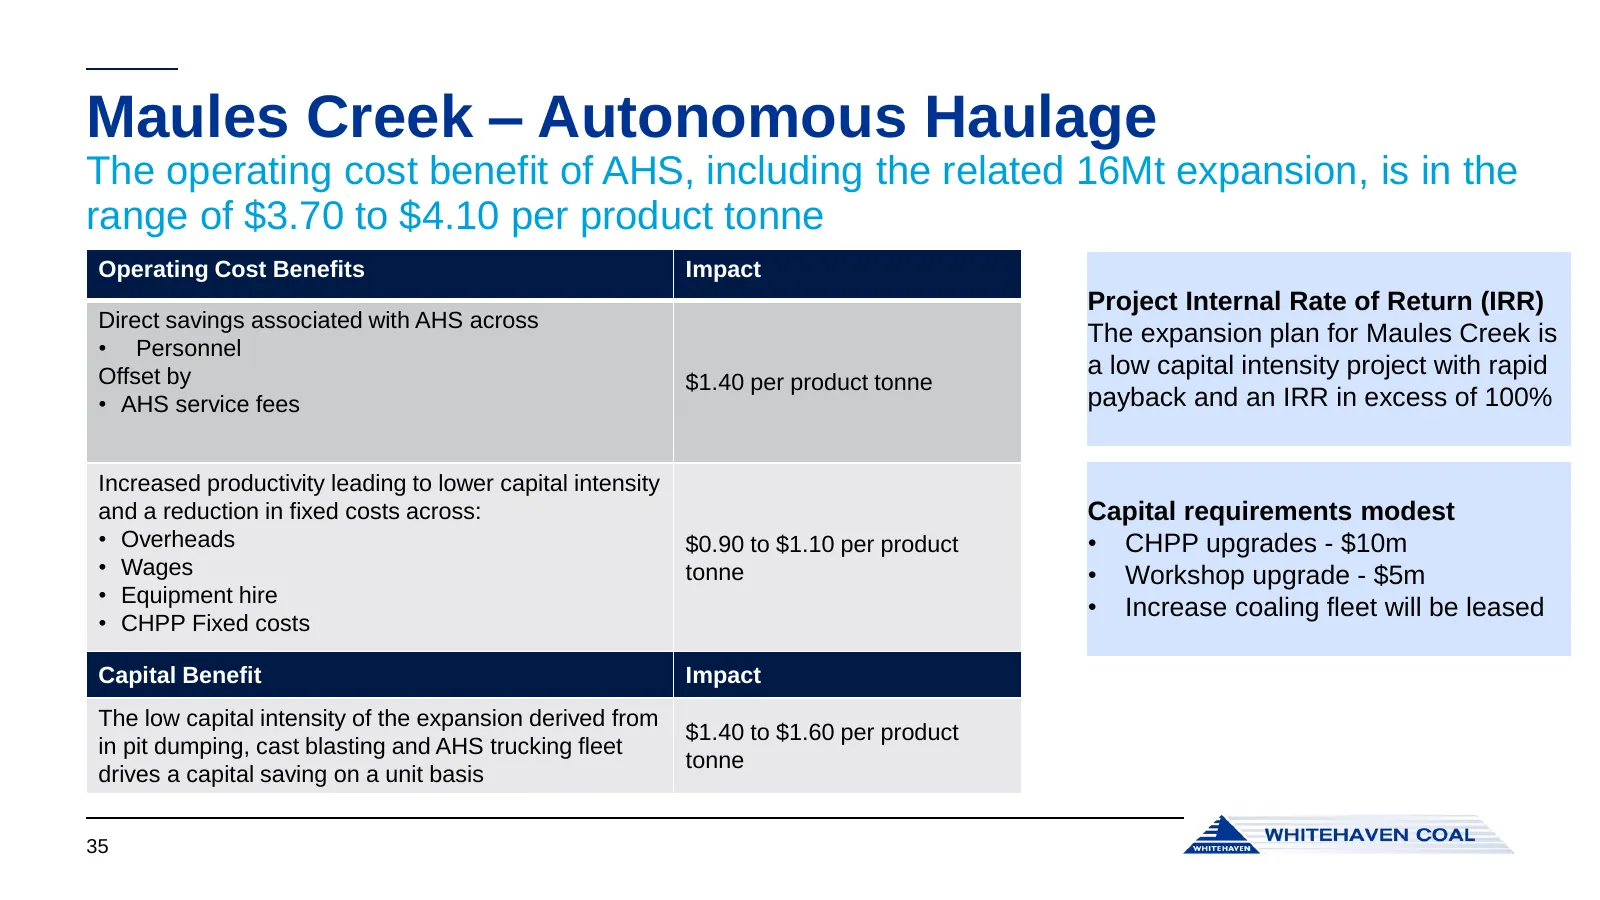
Slide 35: Maules Creek – Autonomous Haulage
Maules Creek – Autonomous Haulage The operating cost benefit of AHS, including the related 16Mt expansion, is in the range of $3.70 to $4.10 per product tonne Operating Cost Benefits Impact Project Internal Rate of Return (IRR) Direct savings associated with AHS across The expansion plan for Maules
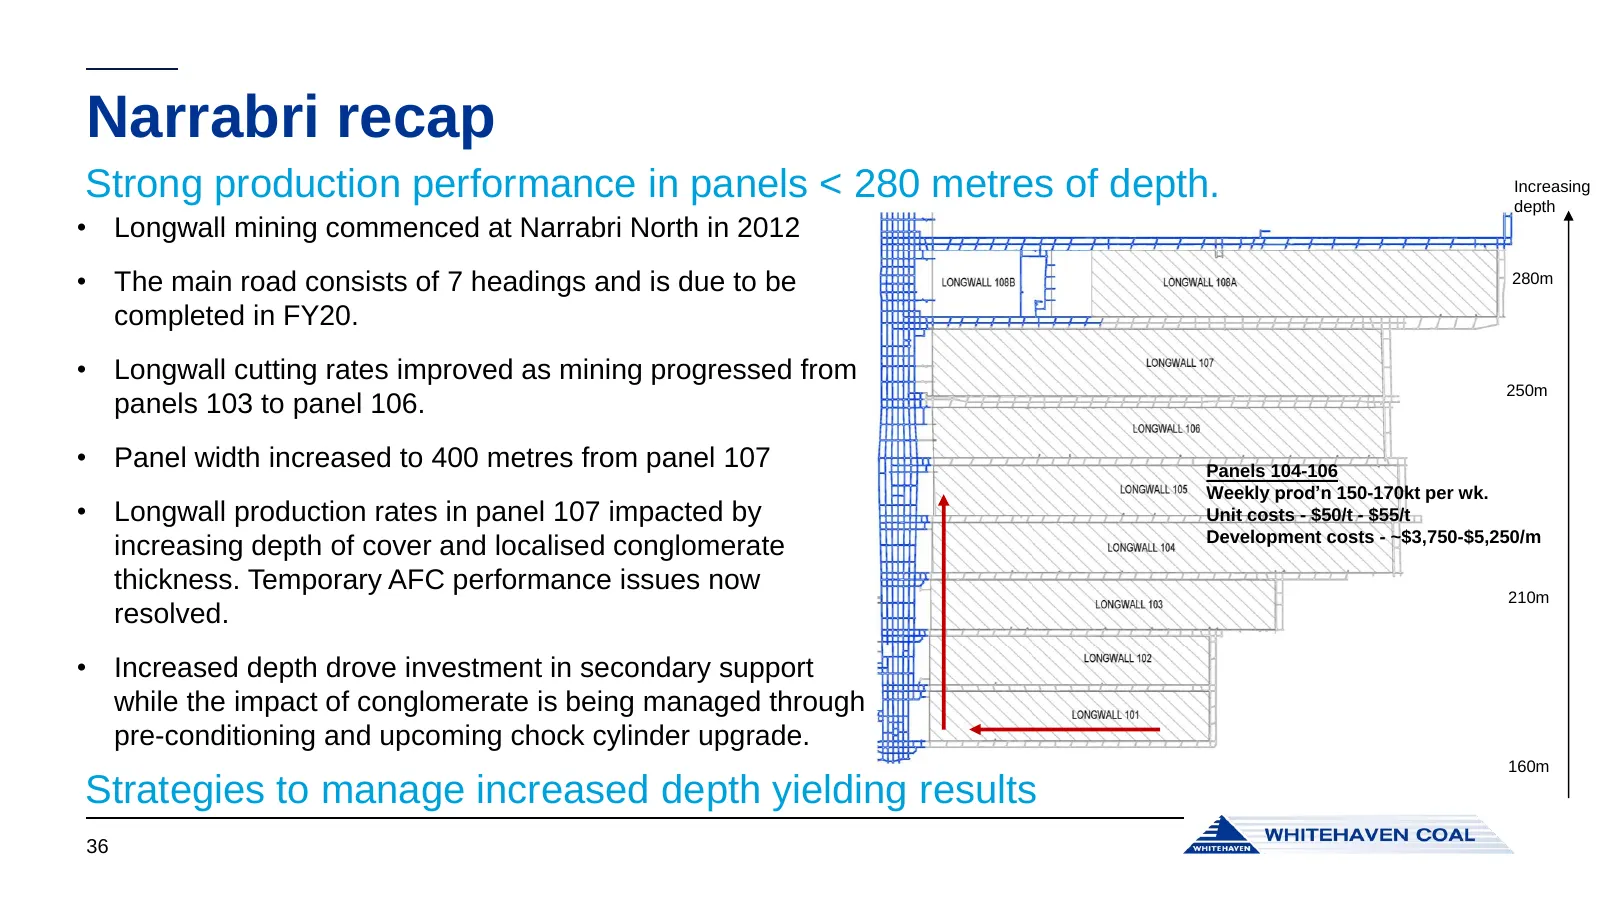
Slide 36: Narrabri recap
Narrabri recap Strong production performance in panels < 280 metres of depth. Increasing depth • Longwall mining commenced at Narrabri North in 2012 • The main road consists of 7 headings and is due to be 280m completed in FY20. • Longwall cutting rates improved as mining progressed from 250m panels
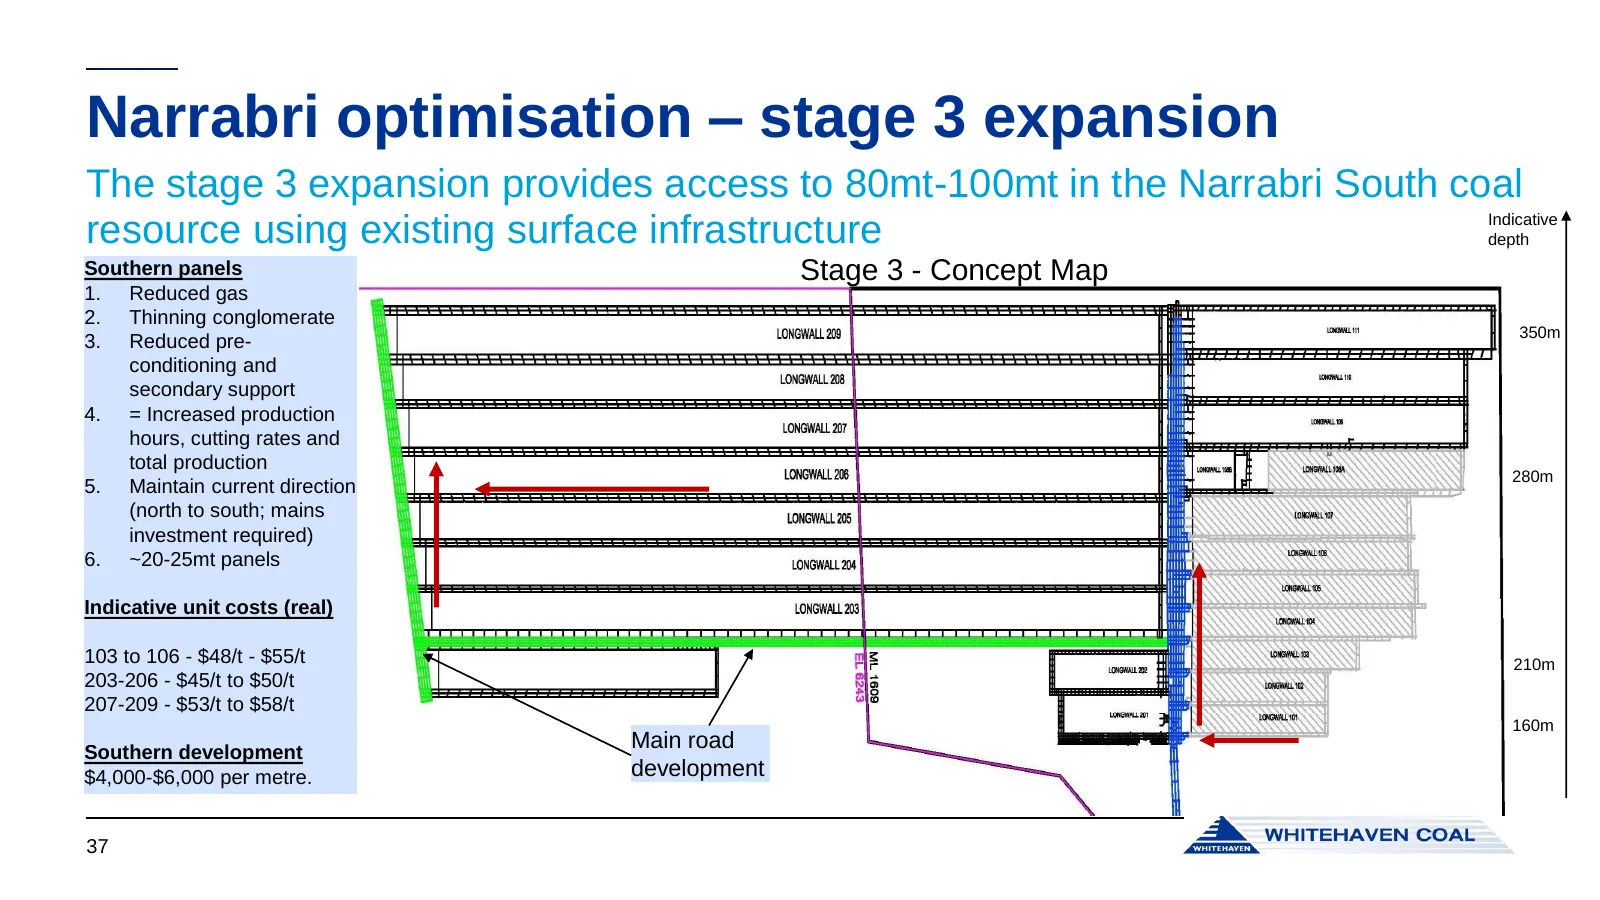
Slide 37: Narrabri optimisation – stage 3 expansion
Narrabri optimisation – stage 3 expansion The stage 3 expansion provides access to 80mt-100mt in the Narrabri South coal Indicative resource using existing surface infrastructure depth Southern panels Stage 3 - Concept Map 1. Reduced gas 2. Thinning conglomerate 350m 3. Reduced pre- conditioning and
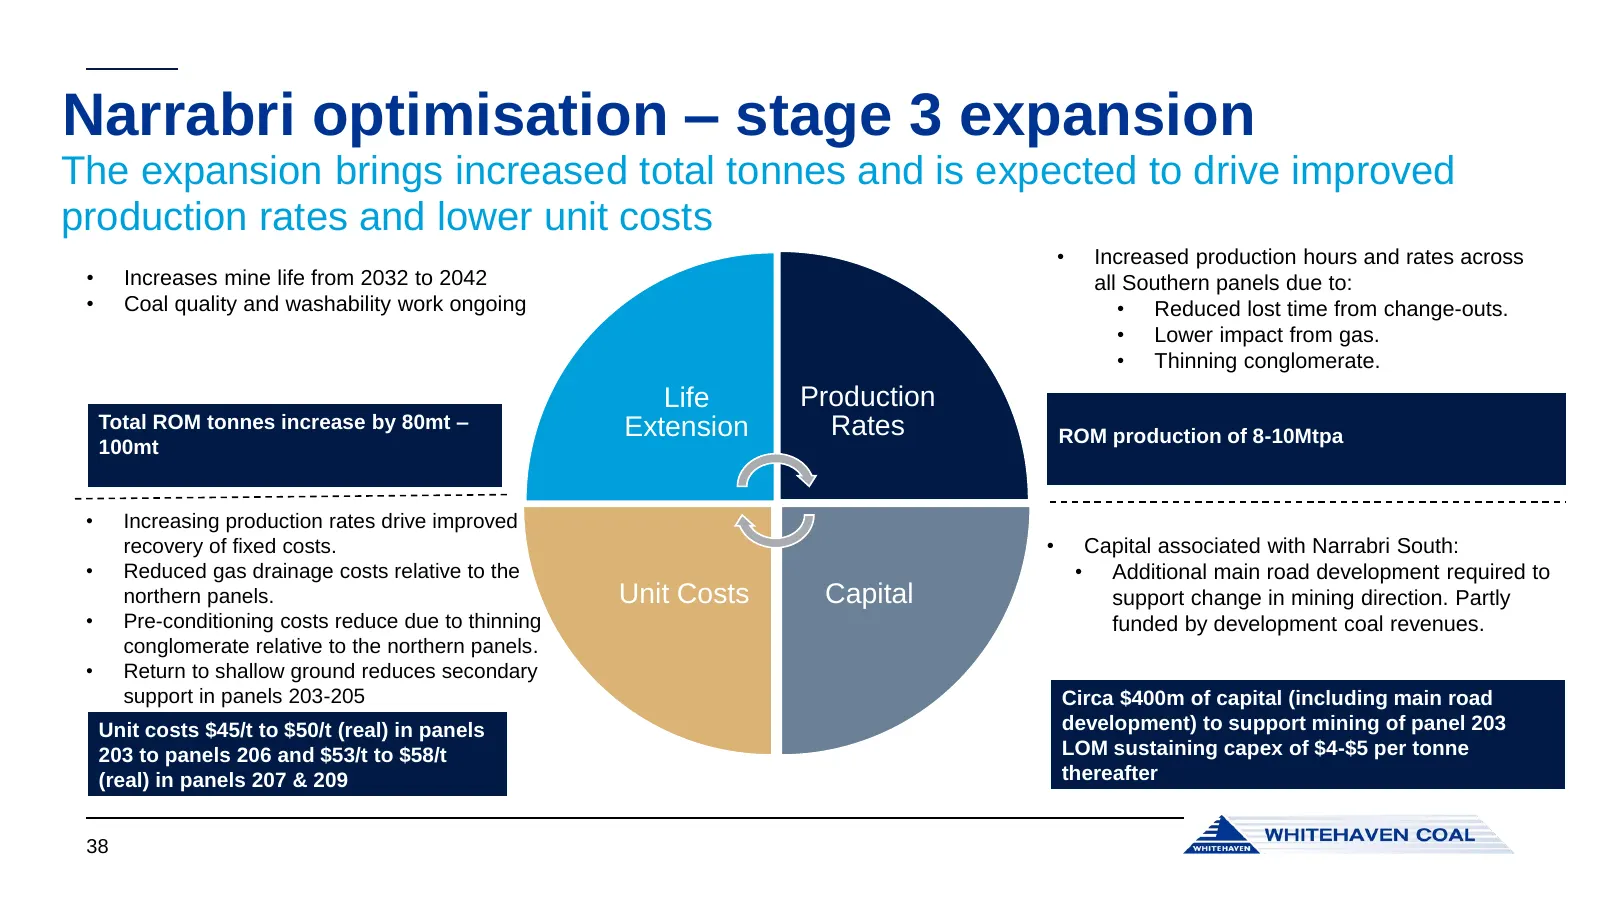
Slide 38: Narrabri optimisation – stage 3 expansion
Narrabri optimisation – stage 3 expansion The expansion brings increased total tonnes and is expected to drive improved production rates and lower unit costs • Increased production hours and rates across • Increases mine life from 2032 to 2042 all Southern panels due to: • Coal quality and washabili
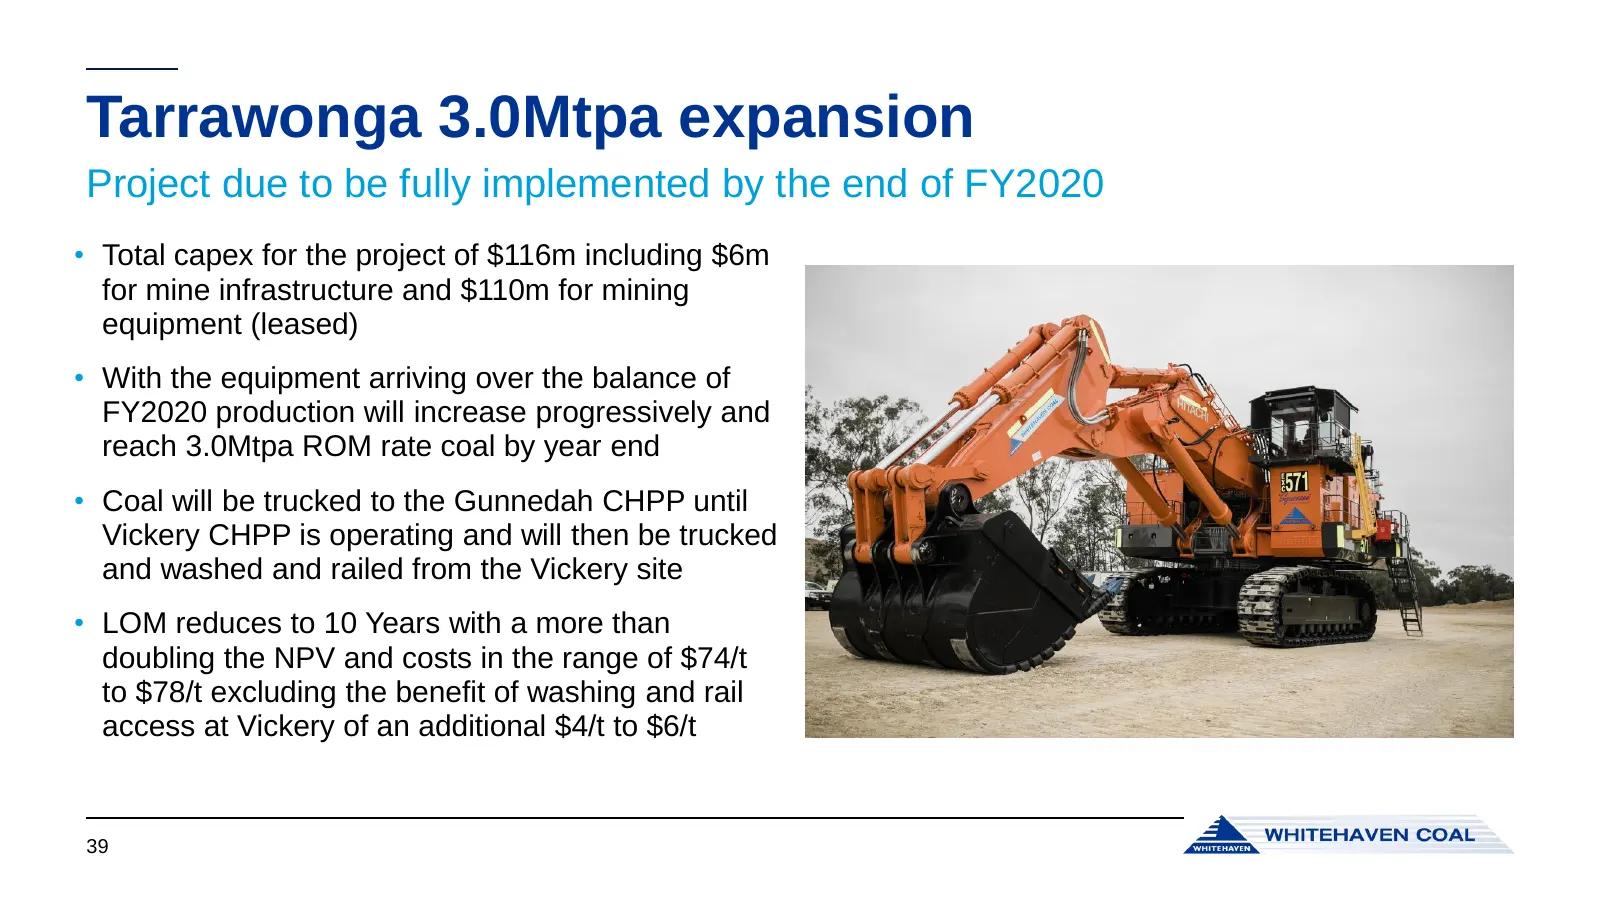
Slide 39: Tarrawonga 3.0Mtpa expansion
Tarrawonga 3.0Mtpa expansion Project due to be fully implemented by the end of FY2020 • Total capex for the project of $116m including $6m for mine infrastructure and $110m for mining equipment (leased) • With the equipment arriving over the balance of FY2020 production will increase progressively a
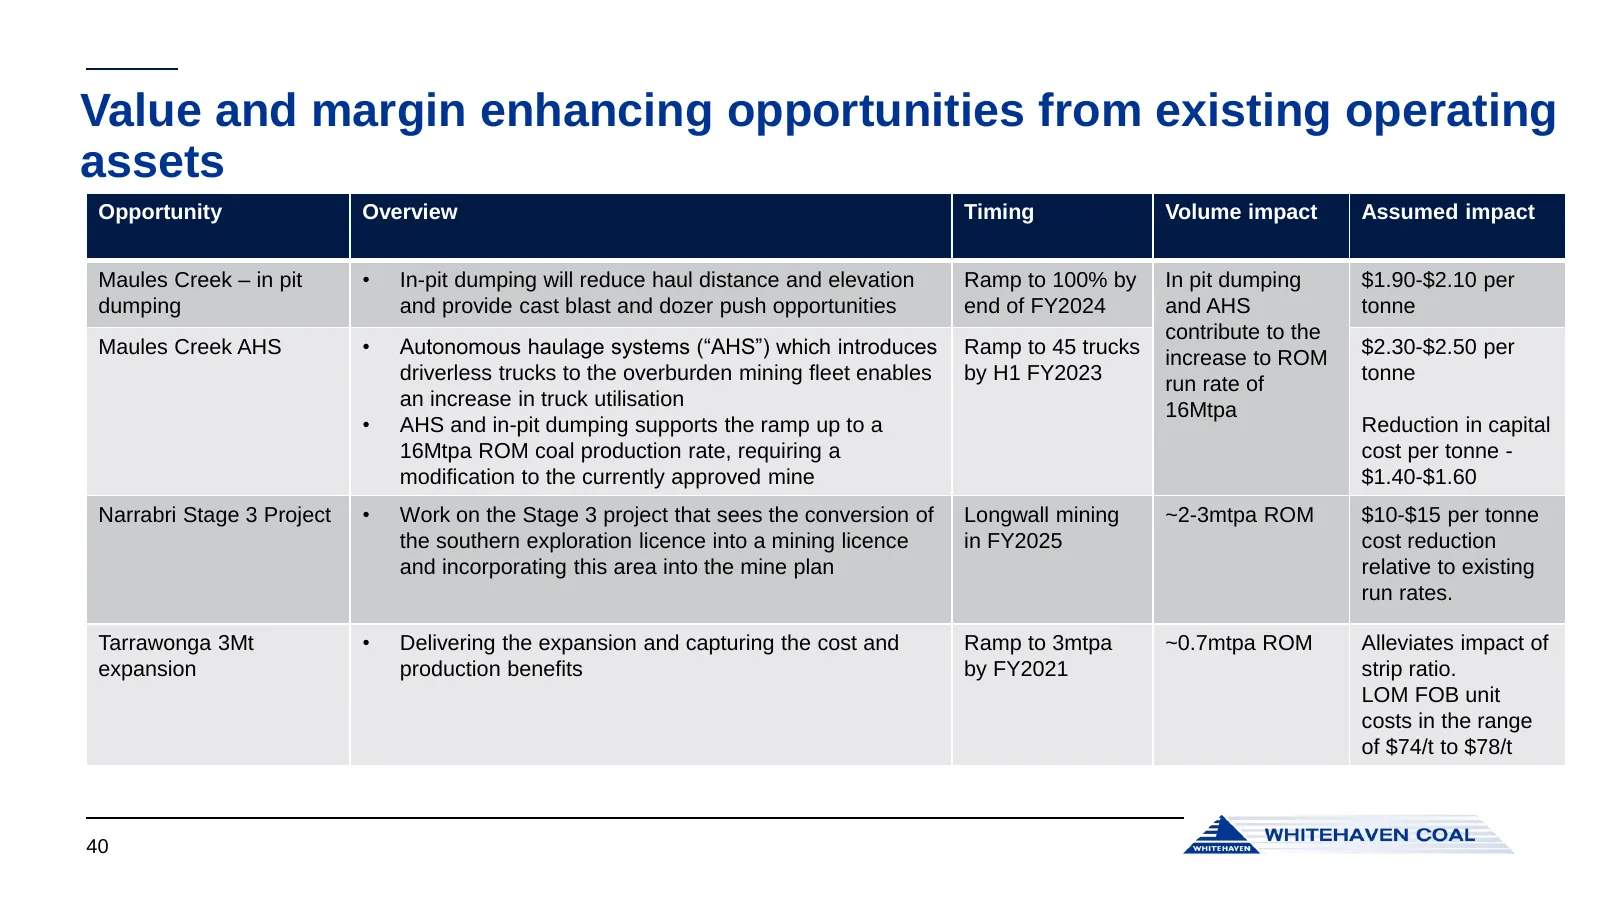
Slide 40: Value and margin enhancing opportunities from existing operating assets
Value and margin enhancing opportunities from existing operating assets Opportunity Overview Timing Volume impact Assumed impact Maules Creek – in pit • In-pit dumping will reduce haul distance and elevation Ramp to 100% by In pit dumping $1.90-$2.10 per dumping and provide cast blast and dozer push
Slide 41: Competitive cost position cost curve
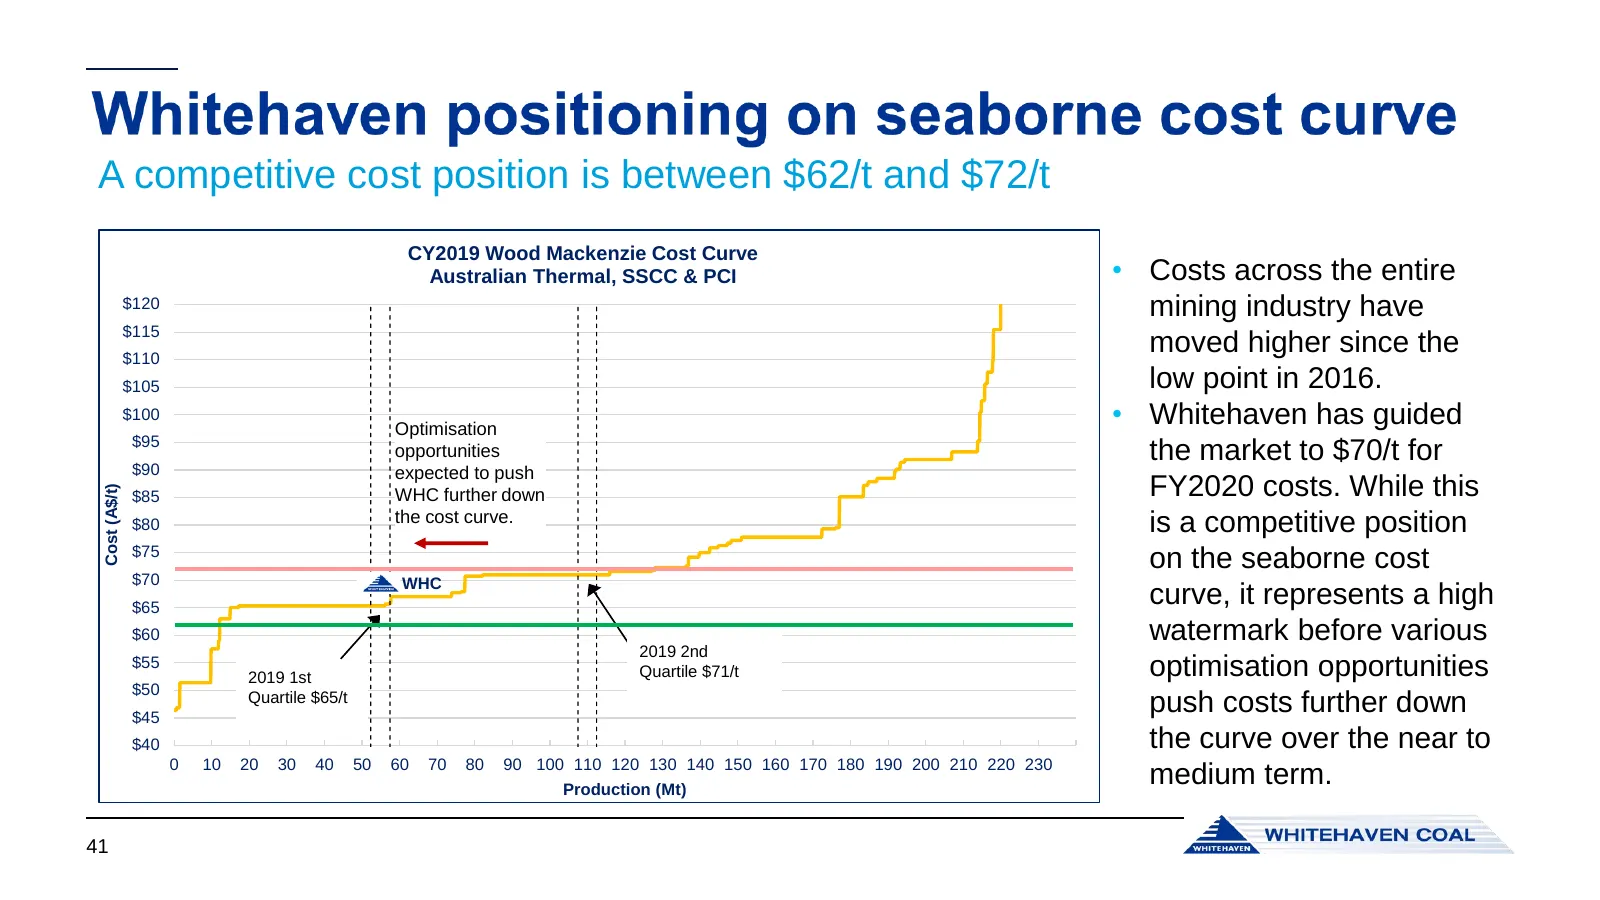
A competitive cost position is between $62/t and $72/t CY2019 Wood Mackenzie Cost Curve Australian Thermal, SSCC & PCI • Costs across the entire $120 mining industry have $115 $110 moved higher since the $105 low point in 2016. $100 Optimisation • Whitehaven has guided $95 $90 opportunities the mark
Slide 42: Development Projects
Development Projects
Slide 43: Vickery Project status update
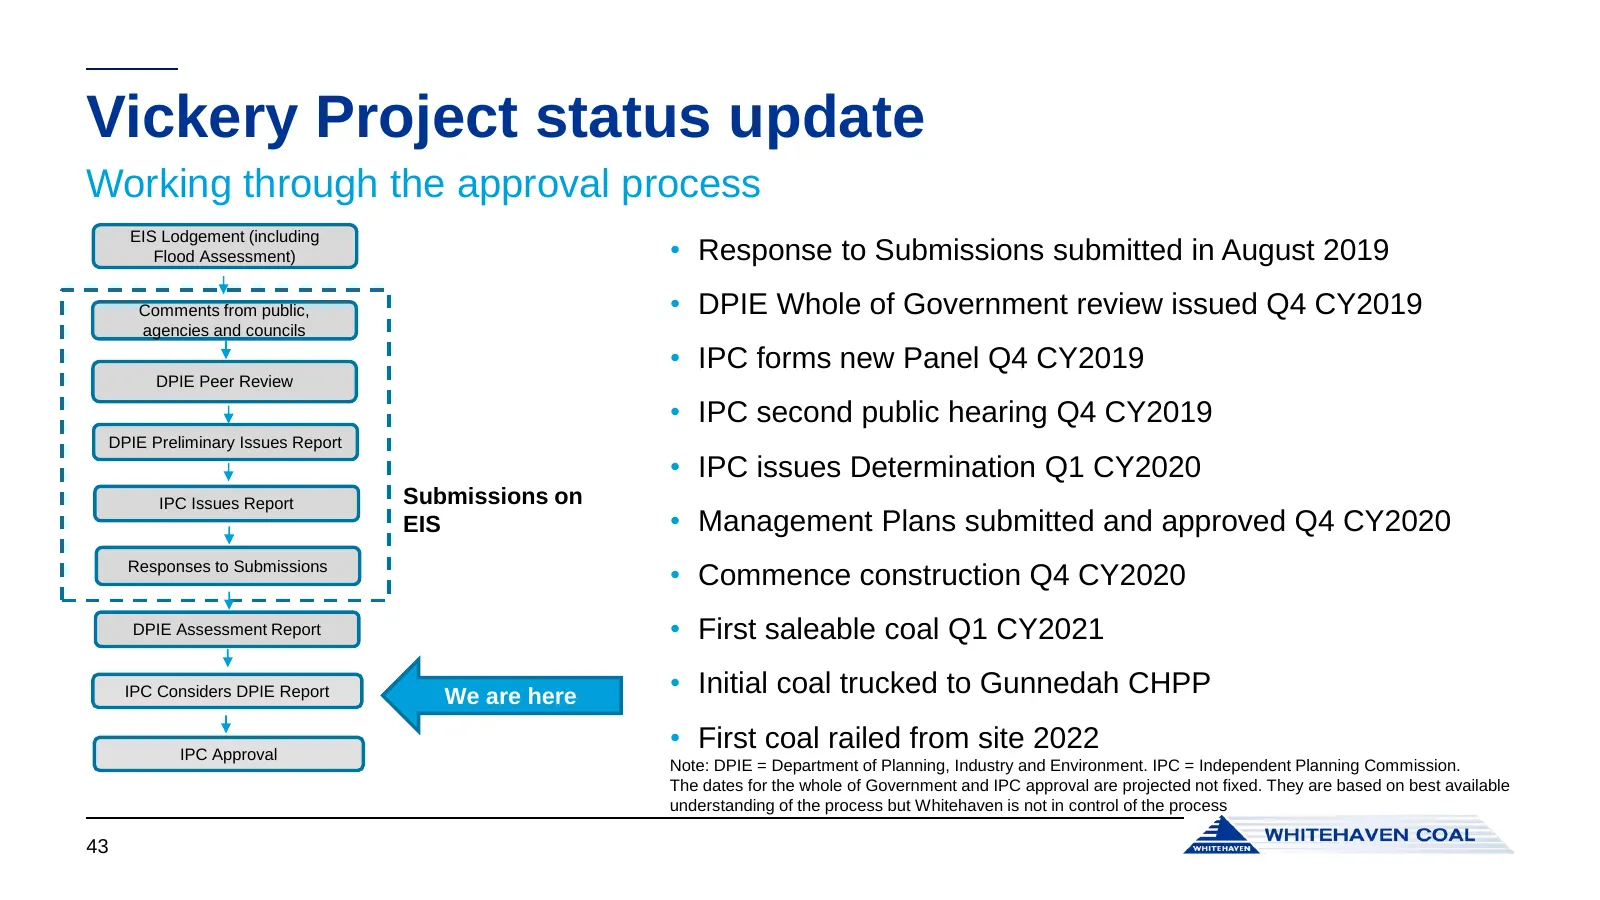
Vickery Project status update Working through the approval process EIS Lodgement (including Flood Assessment) • Response to Submissions submitted in August 2019 Comments from public, • DPIE Whole of Government review issued Q4 CY2019 agencies and councils • IPC forms new Panel Q4 CY2019 DPIE Peer Re
Slide 44: Vickery economics
Vickery economics A robust project at reasonable long term coal prices • JV formation to progress once draft approval conditions issued by the Government are known (likely Q4 CY2019), targeting users of thermal and met coal • Whitehaven will consider developing the project on a 100% basis in order t
Slide 45: Winchester South Project status update
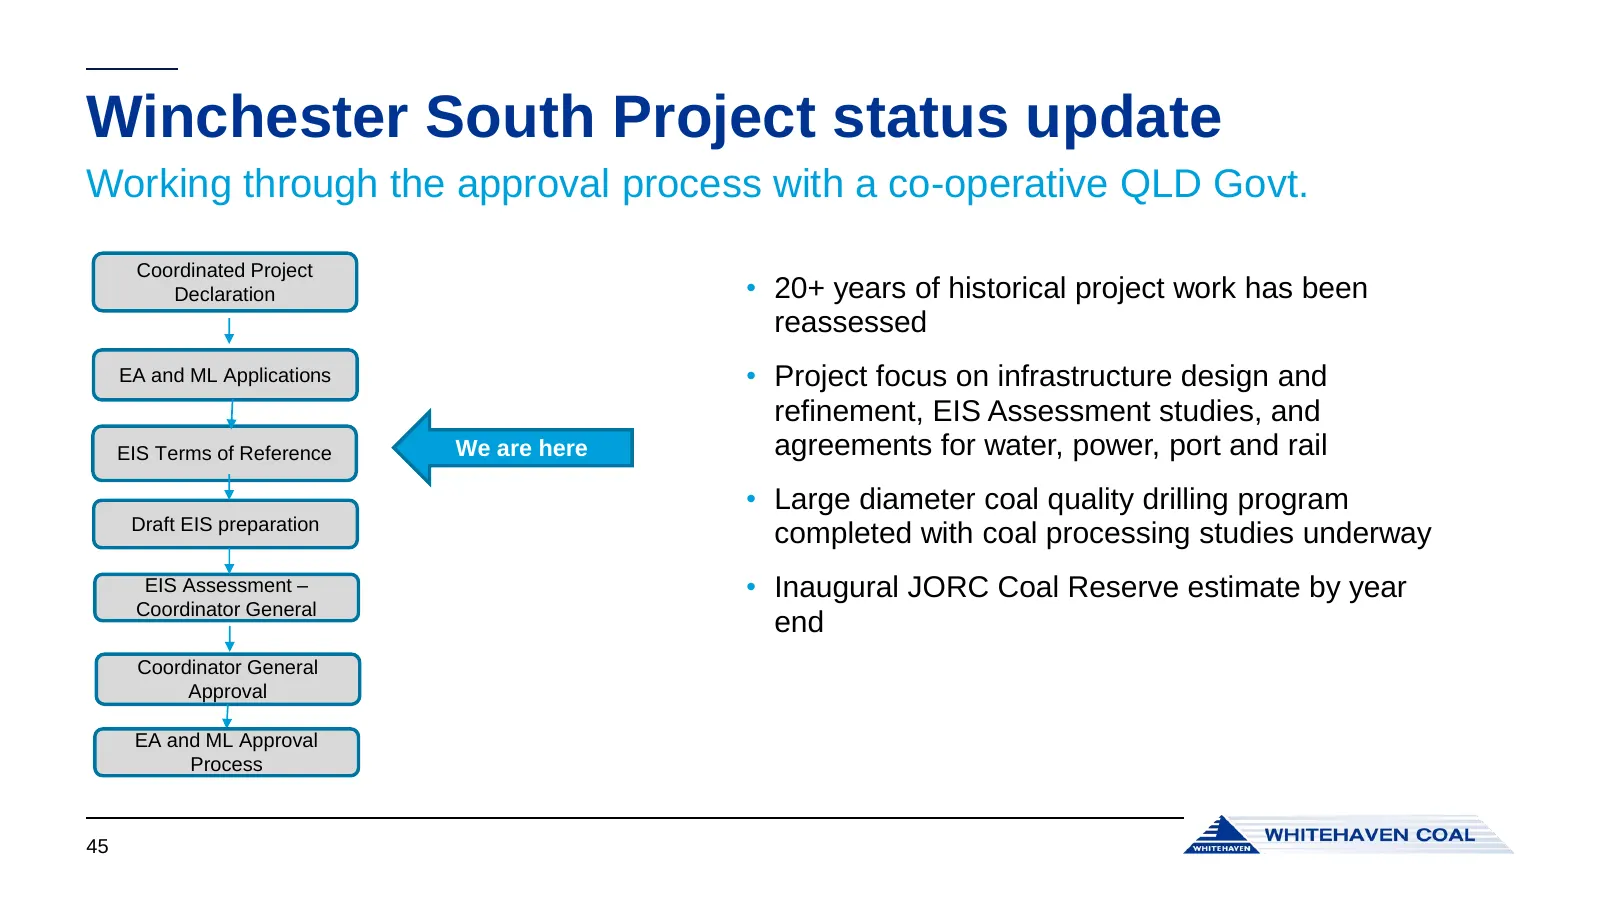
Winchester South Project status update Working through the approval process with a co-operative QLD Govt. Coordinated Project Declaration • 20+ years of historical project work has been reassessed EA and ML Applications • Project focus on infrastructure design and refinement, EIS Assessment studies,
Slide 46: Winchester South – a strategic project
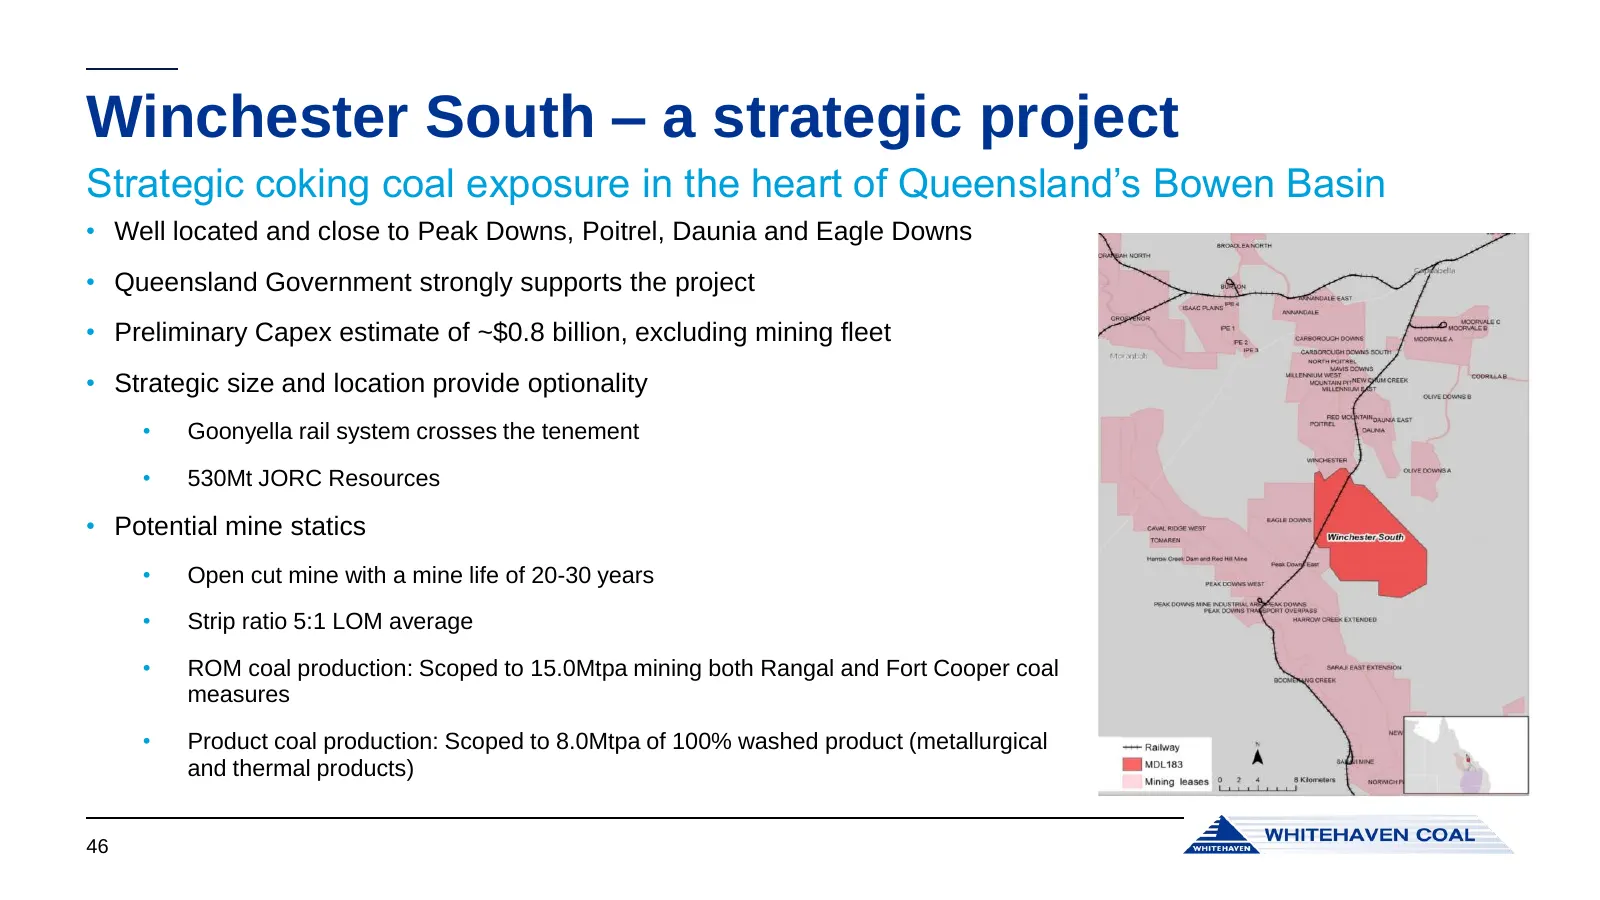
Winchester South – a strategic project Strategic coking coal exposure in the heart of Queensland’s Bowen Basin • Well located and close to Peak Downs, Poitrel, Daunia and Eagle Downs • Queensland Government strongly supports the project • Preliminary Capex estimate of ~$0.8 billion, excluding mining
Slide 47: Summary – ROM coal production profile
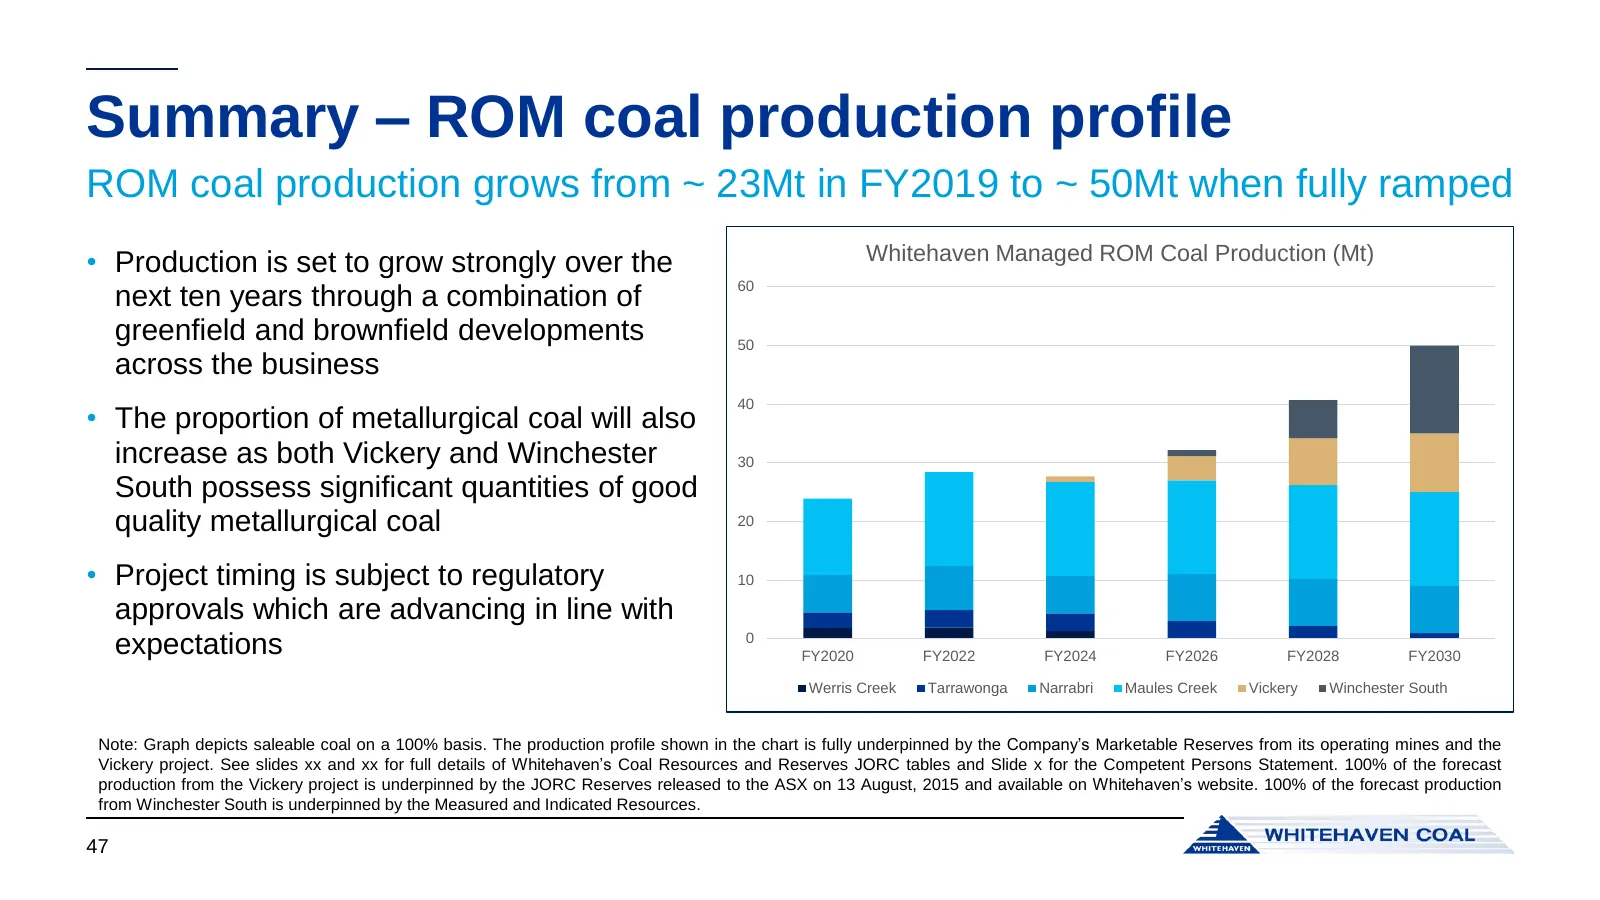
Summary – ROM coal production profile ROM coal production grows from ~ 23Mt in FY2019 to ~ 50Mt when fully ramped • Production is set to grow strongly over the Whitehaven Managed ROM Coal Production (Mt) 60 next ten years through a combination of greenfield and brownfield developments 50 across the

Slide 48: Finance – Kevin Ball, CFO
Finance – Kevin Ball, CFO
Slide 49: Coal funding – What do we know?
Coal funding – What do we know? • Competitive cost curve position • Respected Board and leadership and strong treasury function • ESG considerations • Funding by end customer jurisdictions • Explore and develop options and sources 49
Slide 50: Whitehaven's funding history
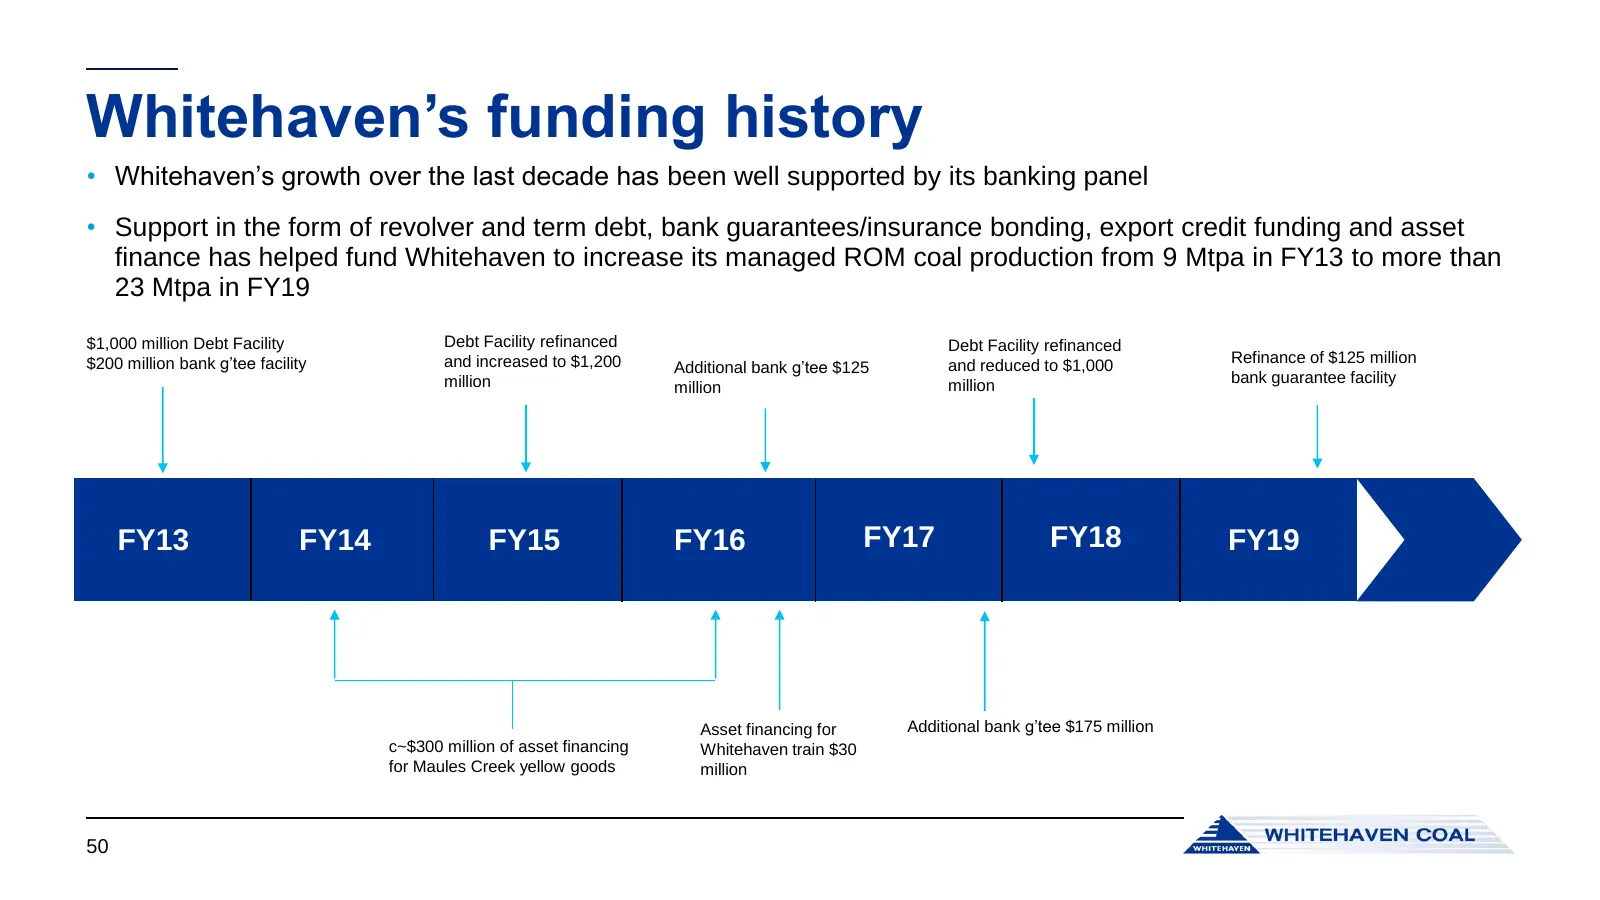
Whitehaven’s funding history • Whitehaven’s growth over the last decade has been well supported by its banking panel • Support in the form of revolver and term debt, bank guarantees/insurance bonding, export credit funding and asset finance has helped fund Whitehaven to increase its managed ROM coal
Slide 51: Current capital structure
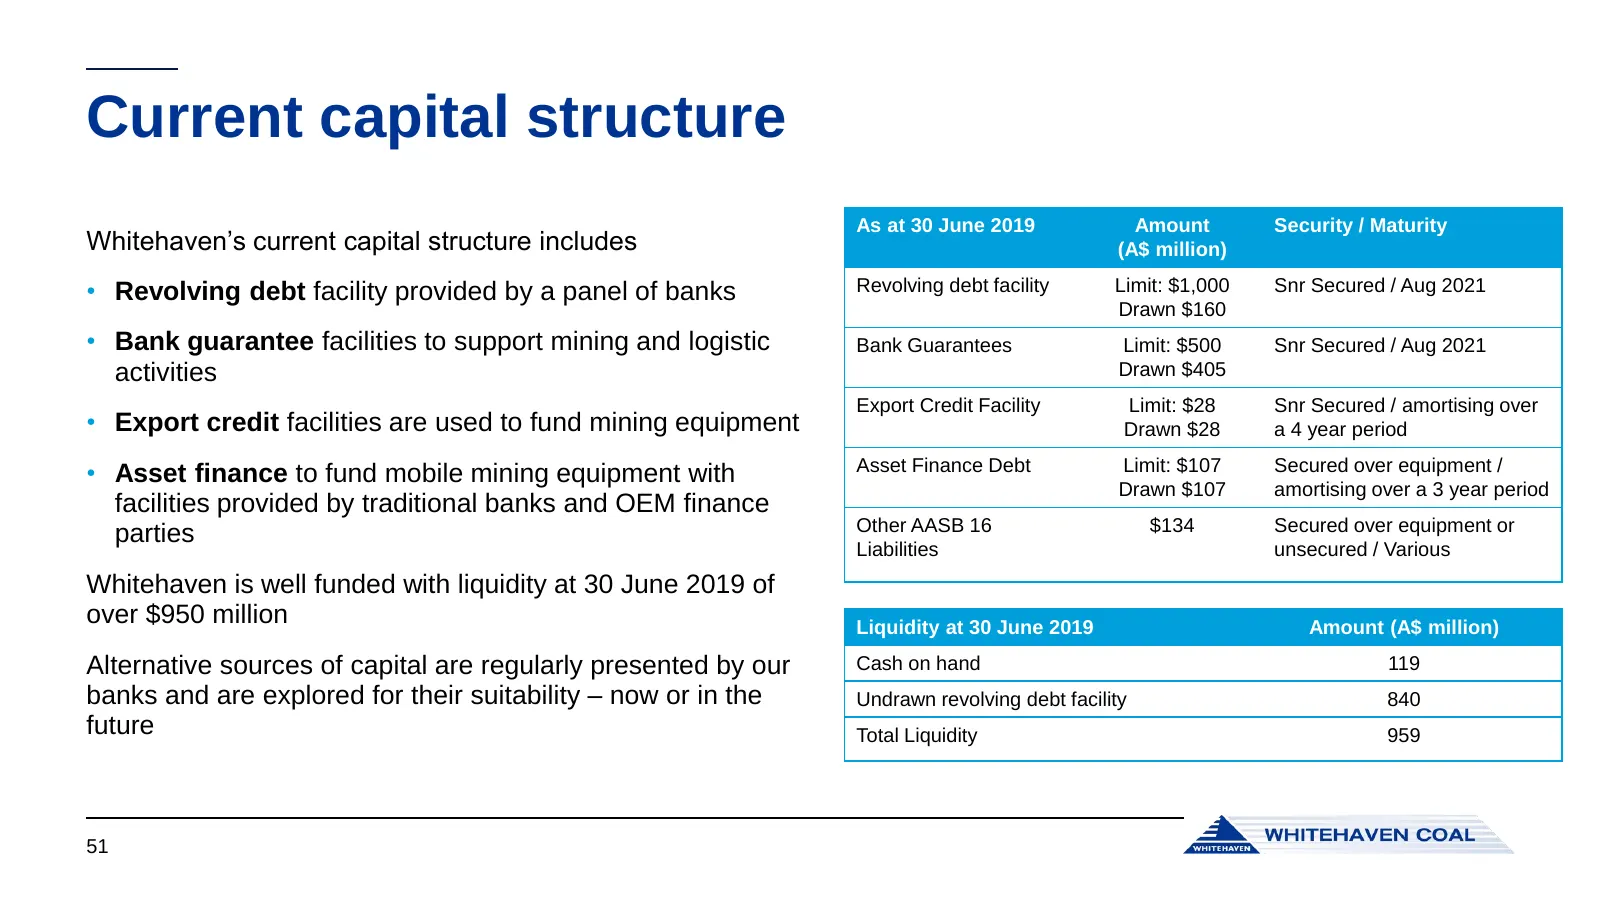
Current capital structure As at 30 June 2019 Amount Security / Maturity Whitehaven’s current capital structure includes (A$ million) • Revolving debt facility provided by a panel of banks Revolving debt facility Limit: $1,000 Snr Secured / Aug 2021 Drawn $160 • Bank guarantee facilities to support m
Slide 52: How growth is funded
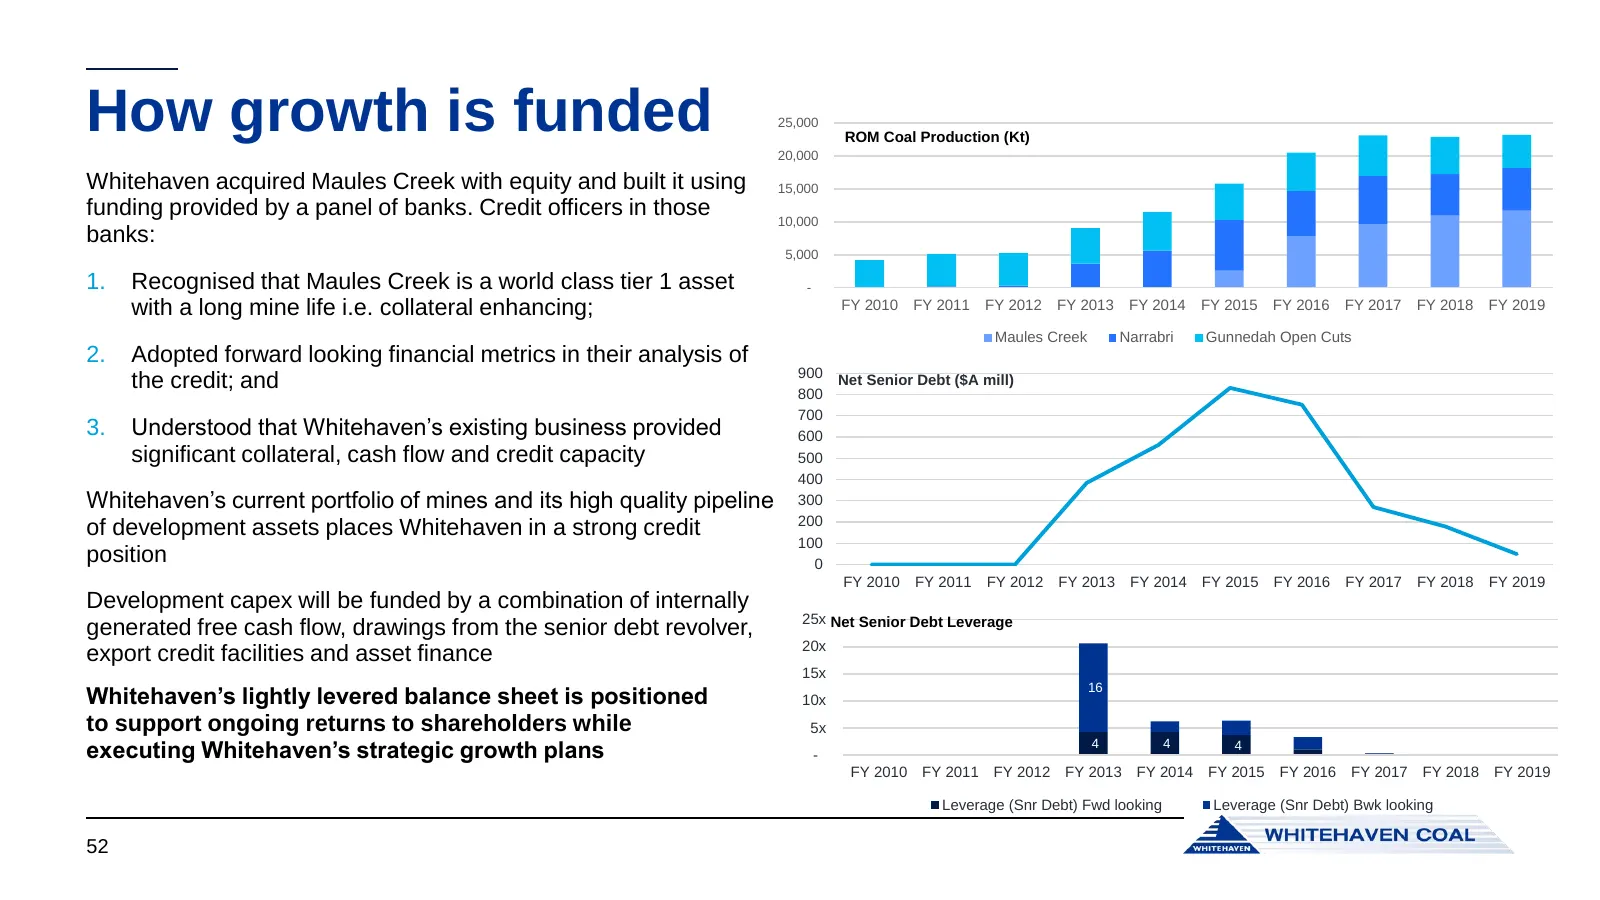
How growth is funded 25,000 20,000 ROM Coal Production (Kt) Whitehaven acquired Maules Creek with equity and built it using 15,000 funding provided by a panel of banks. Credit officers in those 10,000 banks: 5,000 1. Recognised that Maules Creek is a world class tier 1 asset - with a long mine life
Slide 53: Maintaining a strong balance sheet to sustain returns
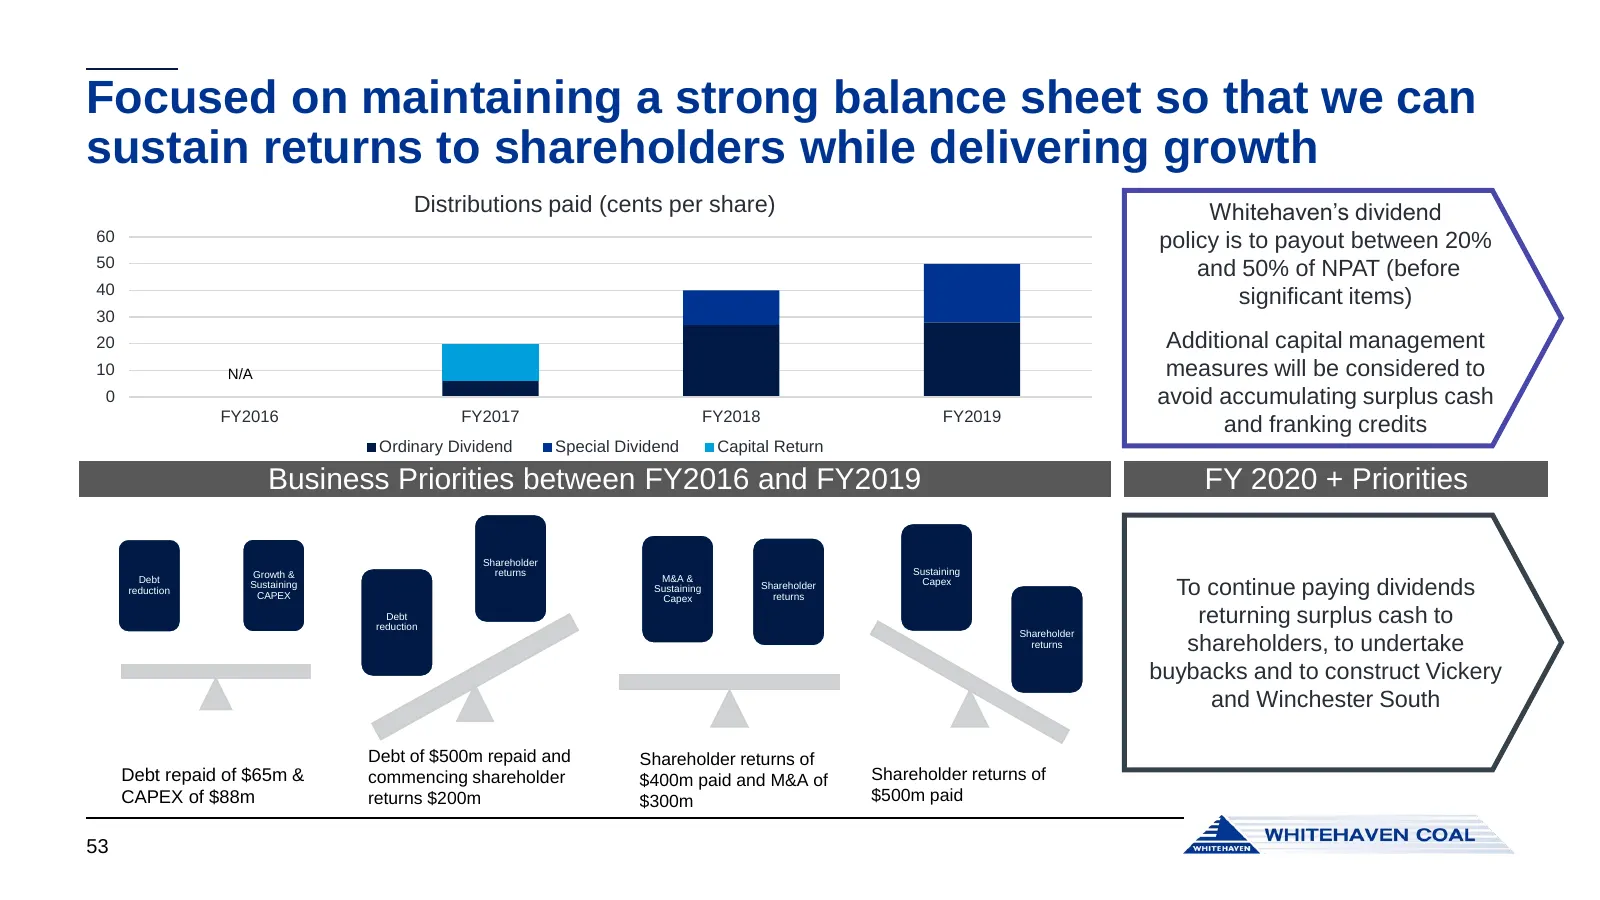
Focused on maintaining a strong balance sheet so that we can sustain returns to shareholders while delivering growth Distributions paid (cents per share) Whitehaven’s dividend 60 policy is to payout between 20% 50 and 50% of NPAT (before 40 significant items) 30 20 Additional capital management 10 N
Slide 54: Capital management metrics
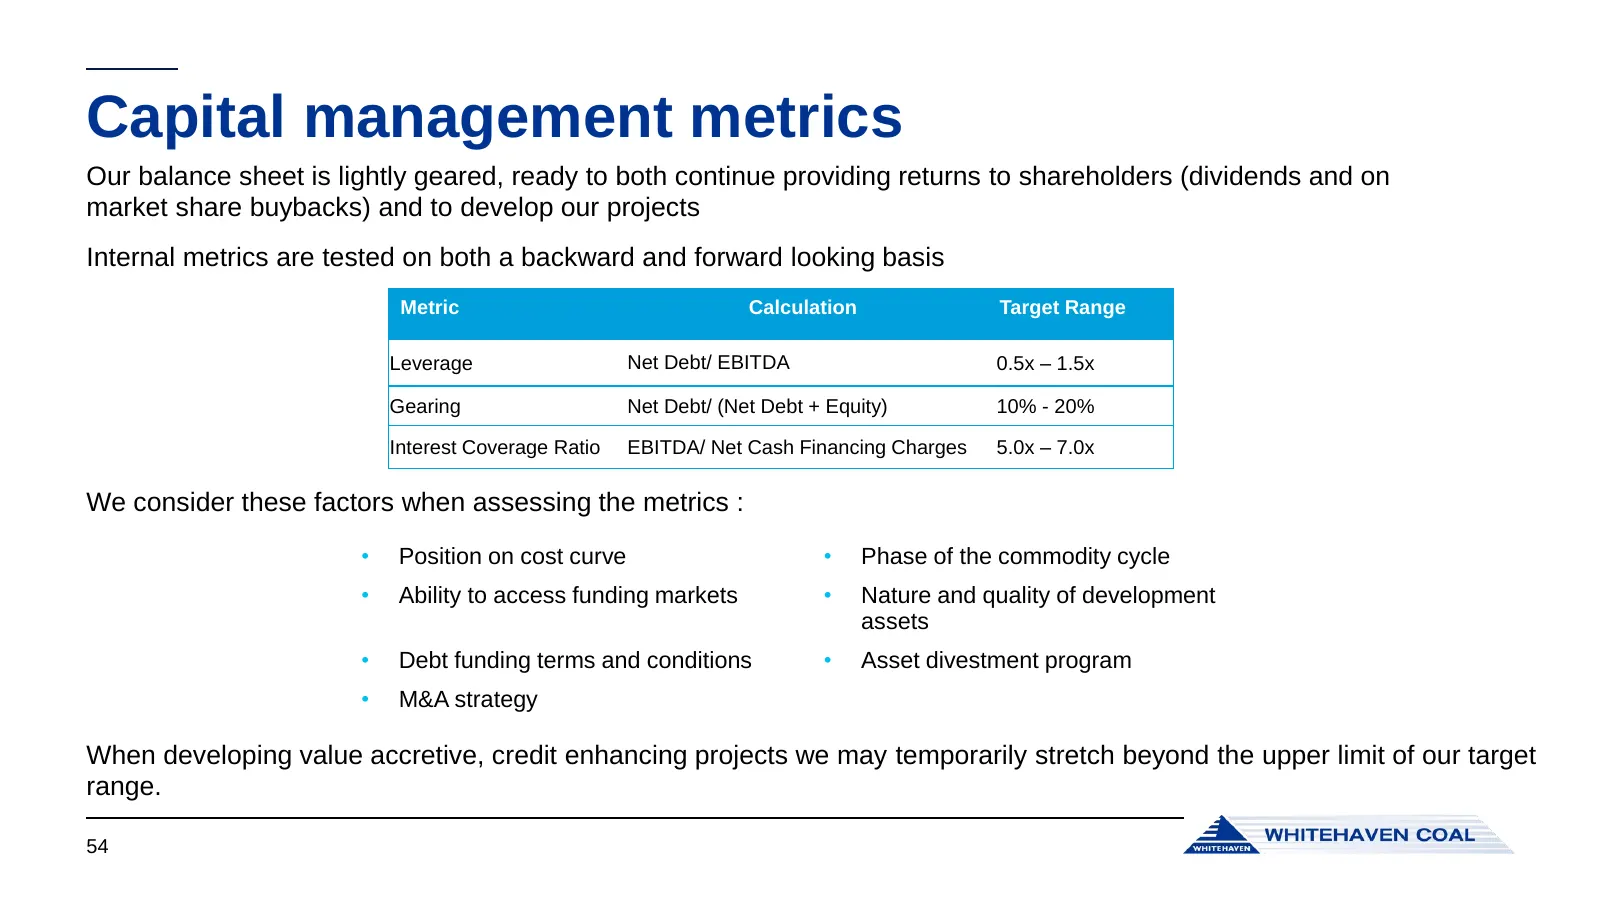
Capital management metrics Our balance sheet is lightly geared, ready to both continue providing returns to shareholders (dividends and on market share buybacks) and to develop our projects Internal metrics are tested on both a backward and forward looking basis Metric Calculation Target Range Lever
Slide 55: Whitehaven's tax position
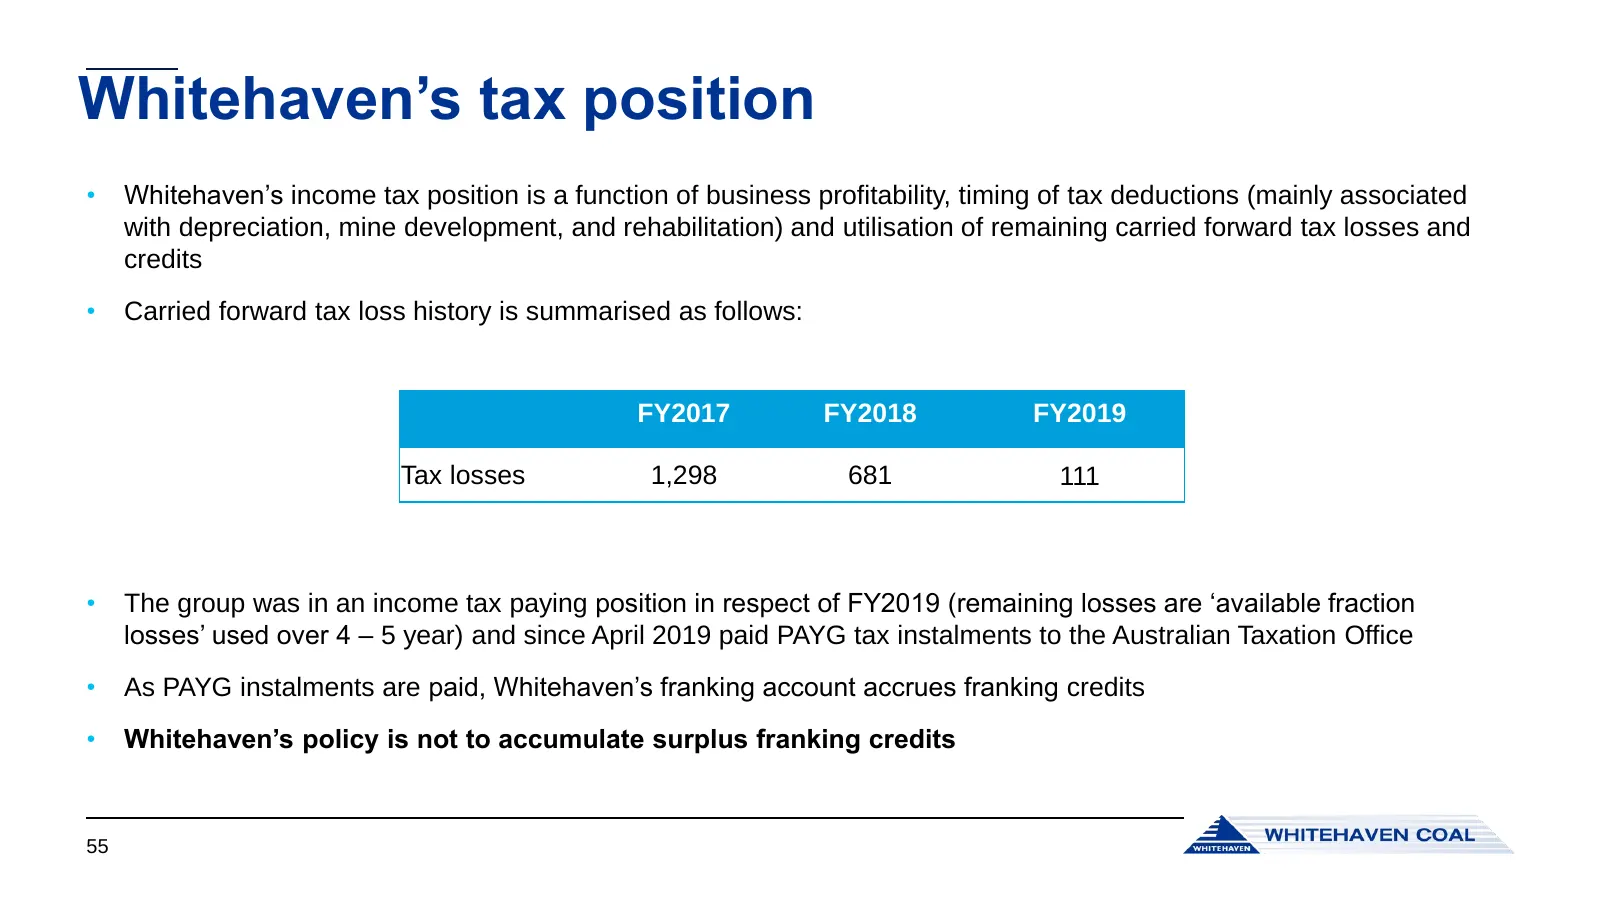
Whitehaven’s tax position • Whitehaven’s income tax position is a function of business profitability, timing of tax deductions (mainly associated with depreciation, mine development, and rehabilitation) and utilisation of remaining carried forward tax losses and credits • Carried forward tax loss hi
Slide 56: Thank you
Thank you www.whitehavencoal.com.au

Slide 57: Appendices
Appendices
Slide 58: Appendix 1 - Coal Resources
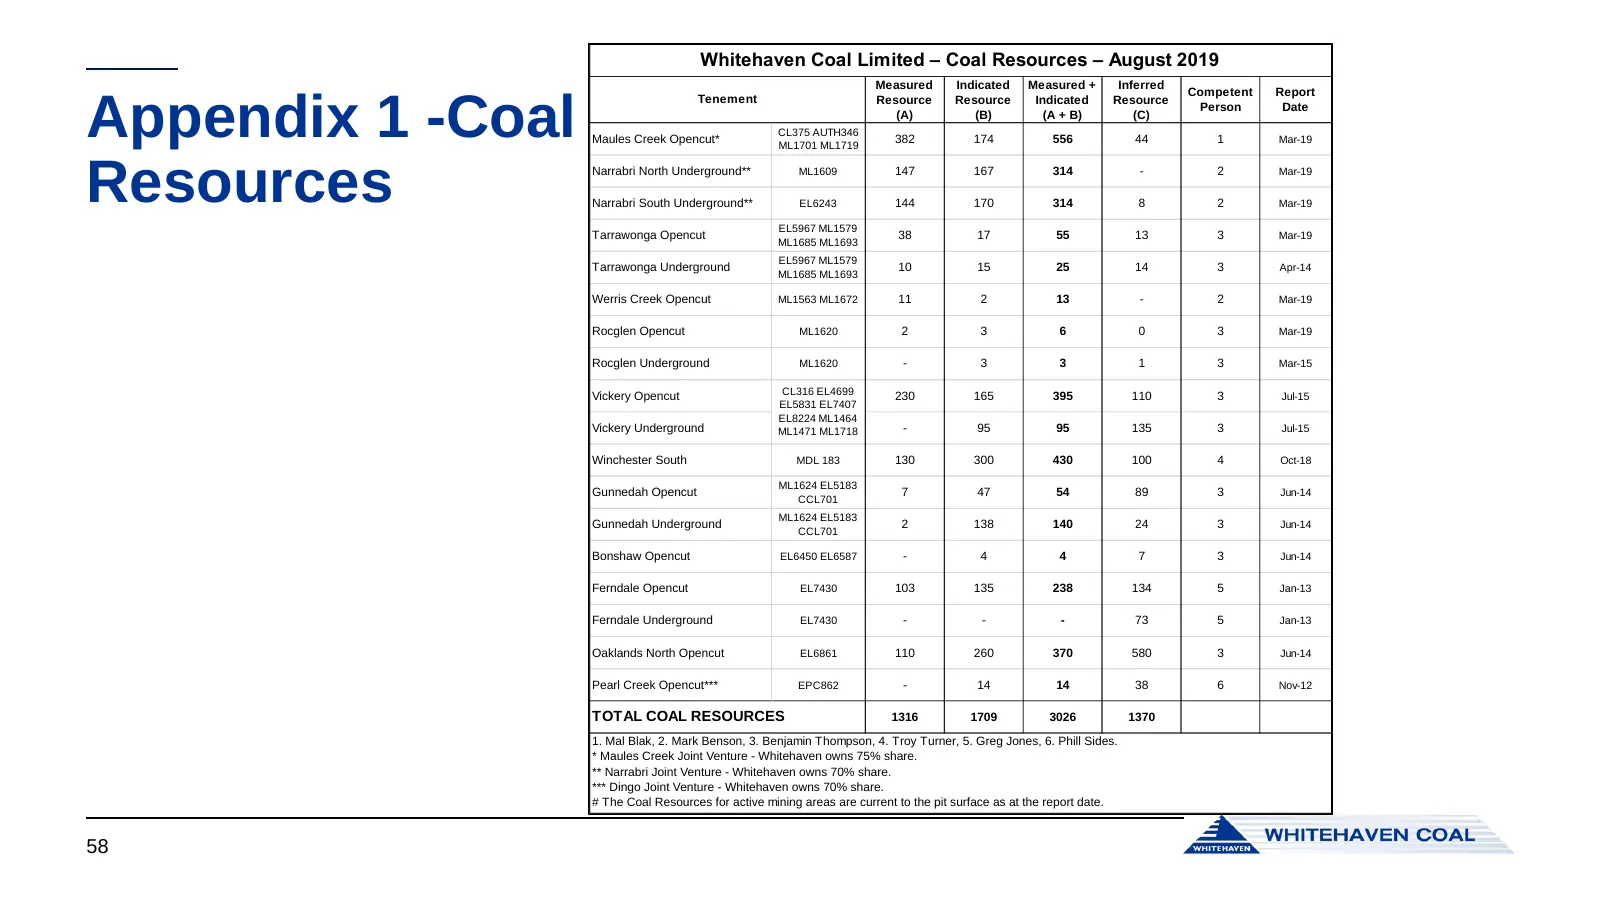
Whitehaven Coal Limited – Coal Resources – August 2019 Measured Indicated Measured + Inferred Competent Report Appendix 1 -Coal Tenement Resource Resource Indicated Resource Person Date (A) (B) (A + B) (C) CL375 AUTH346 Maules Creek Opencut* 382 174 556 44 1 Mar-19 ML1701 ML1719 Resources Narrabri N
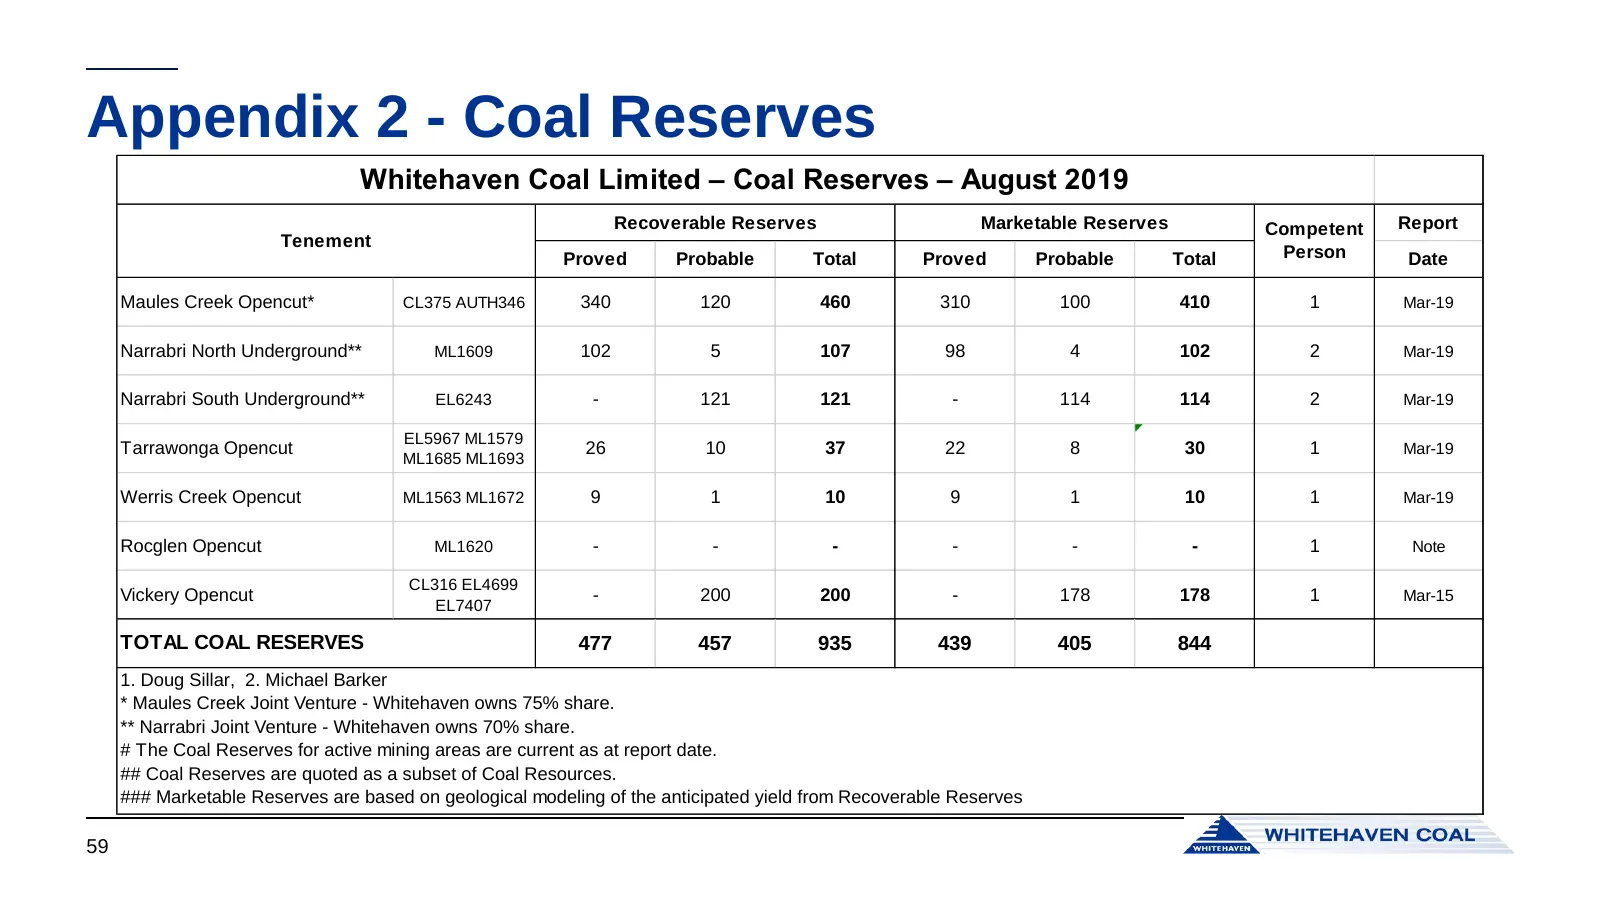
Slide 59: Appendix - Coal Reserves
Appendix 2 - Coal Reserves Whitehaven Coal Limited – Coal Reserves – August 2019 Recoverable Reserves Marketable Reserves Competent Report Tenement Proved Probable Total Proved Probable Total Person Date Maules Creek Opencut* CL375 AUTH346 340 120 460 310 100 410 1 Mar-19 Narrabri North Underground*
Slide 60: Appendix 3 – IEA New Policies Scenario
Appendix 3 – IEA New Policies Scenario The International Energy Agency’s central scenario Note: The New Policies Scenario provides a measured assessment of where today’s policy frameworks and ambitions, together with the continued evolution of known technologies, might take the energy sector in the
Slide 61: Appendix 4 – Individual mine and project packs
Appendix 4 – Individual mine and project packs 61
Slide 62: Maules Creek Mine
Maules Creek Mine
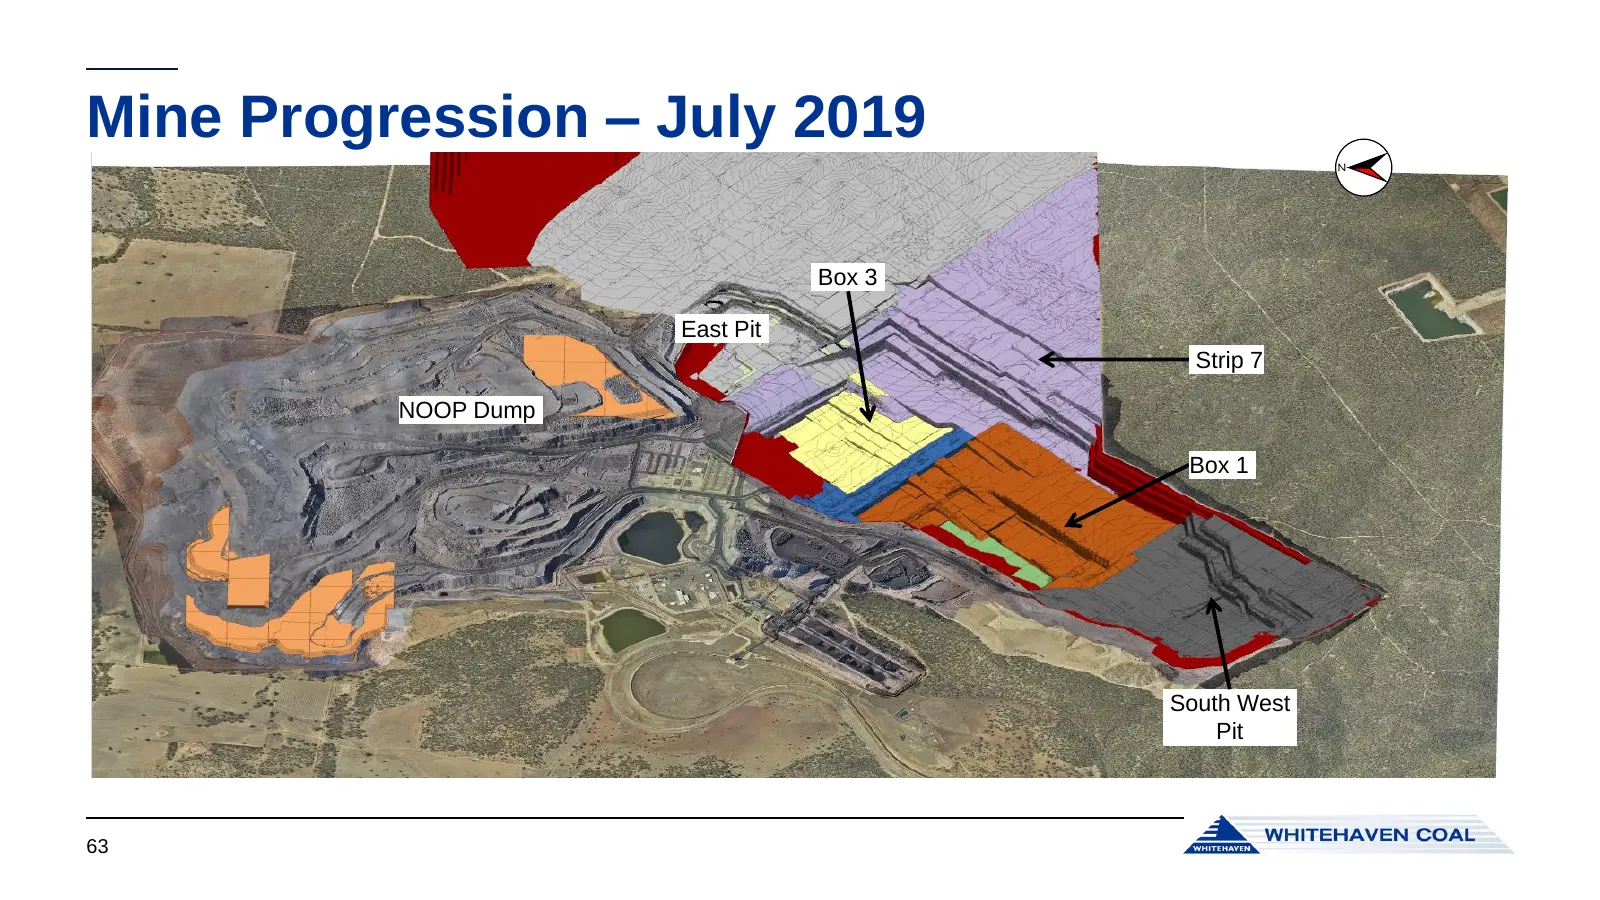
Slide 63: Mine Progression – July 2019
Mine Progression – July 2019 N Box 3 East Pit Strip 7 NOOP Dump Box 1 South West Pit 63
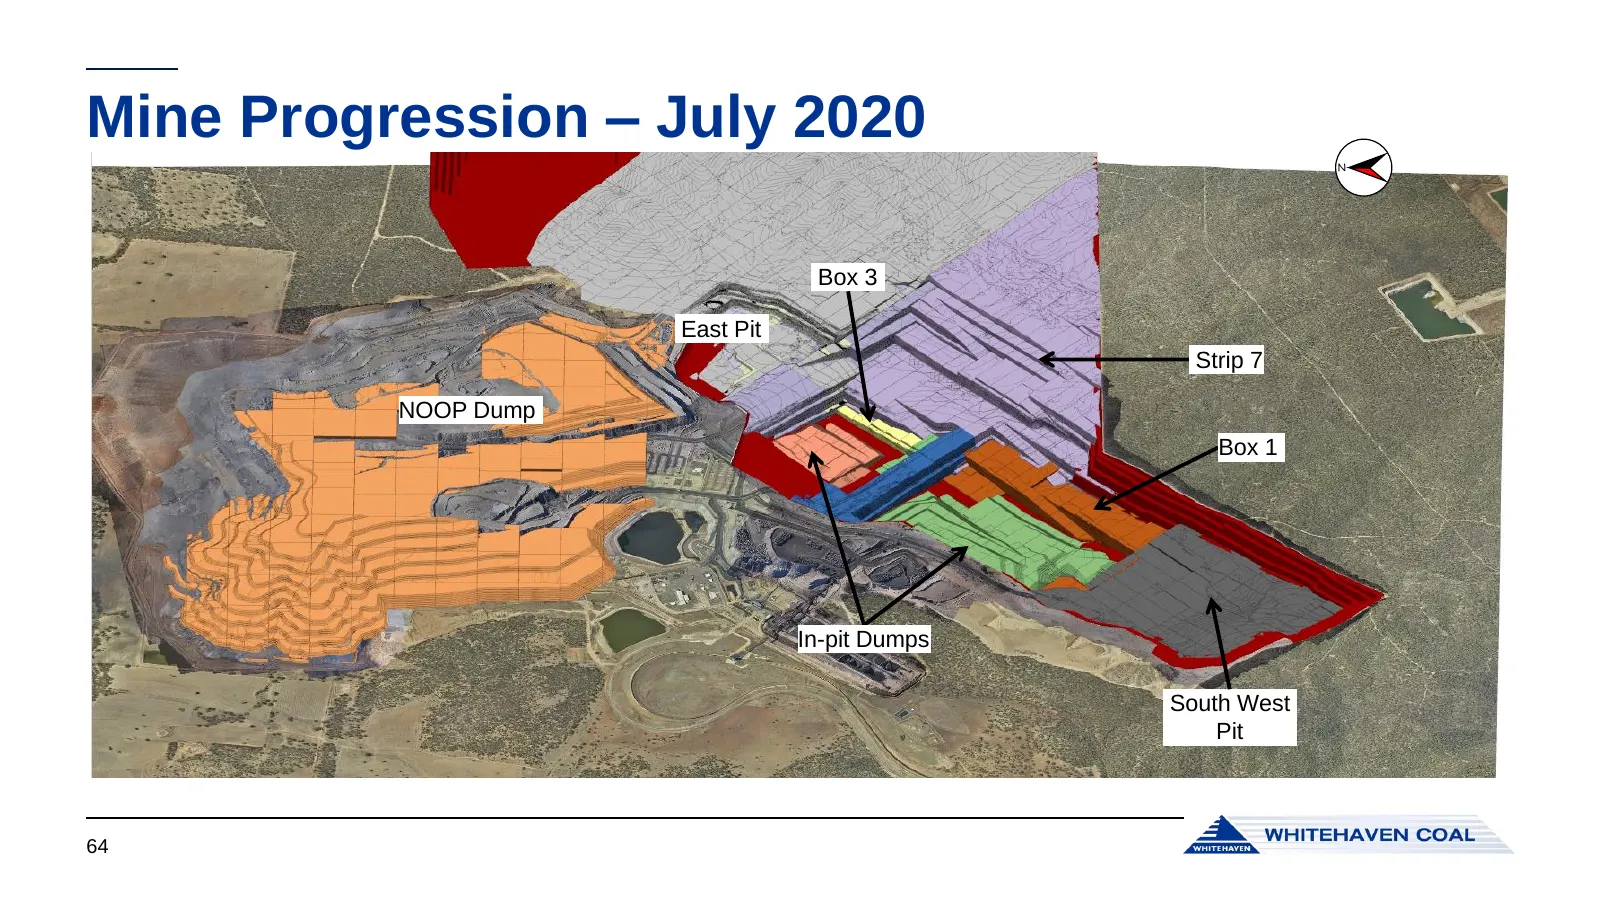
Slide 64: Mine Progression – July 2020
Mine Progression – July 2020 N Box 3 East Pit Strip 7 NOOP Dump Box 1 In-pit Dumps South West Pit 64
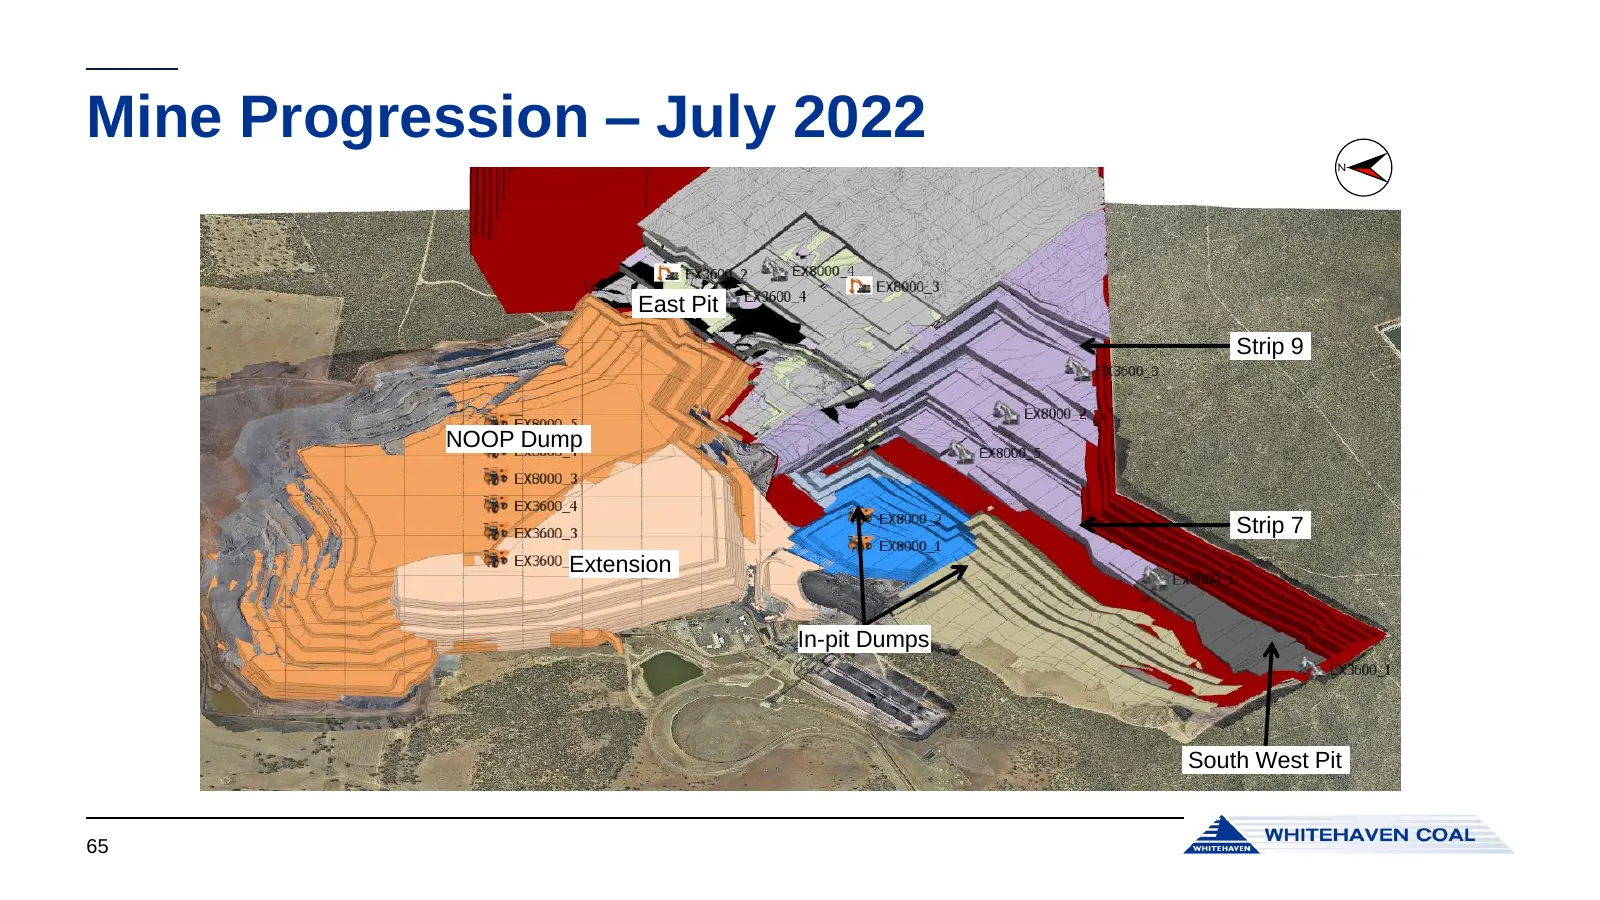
Slide 65: Mine Progression – July 2022
Mine Progression – July 2022 N East Pit Strip 9 NOOP Dump Strip 7 Extension In-pit Dumps South West Pit 65
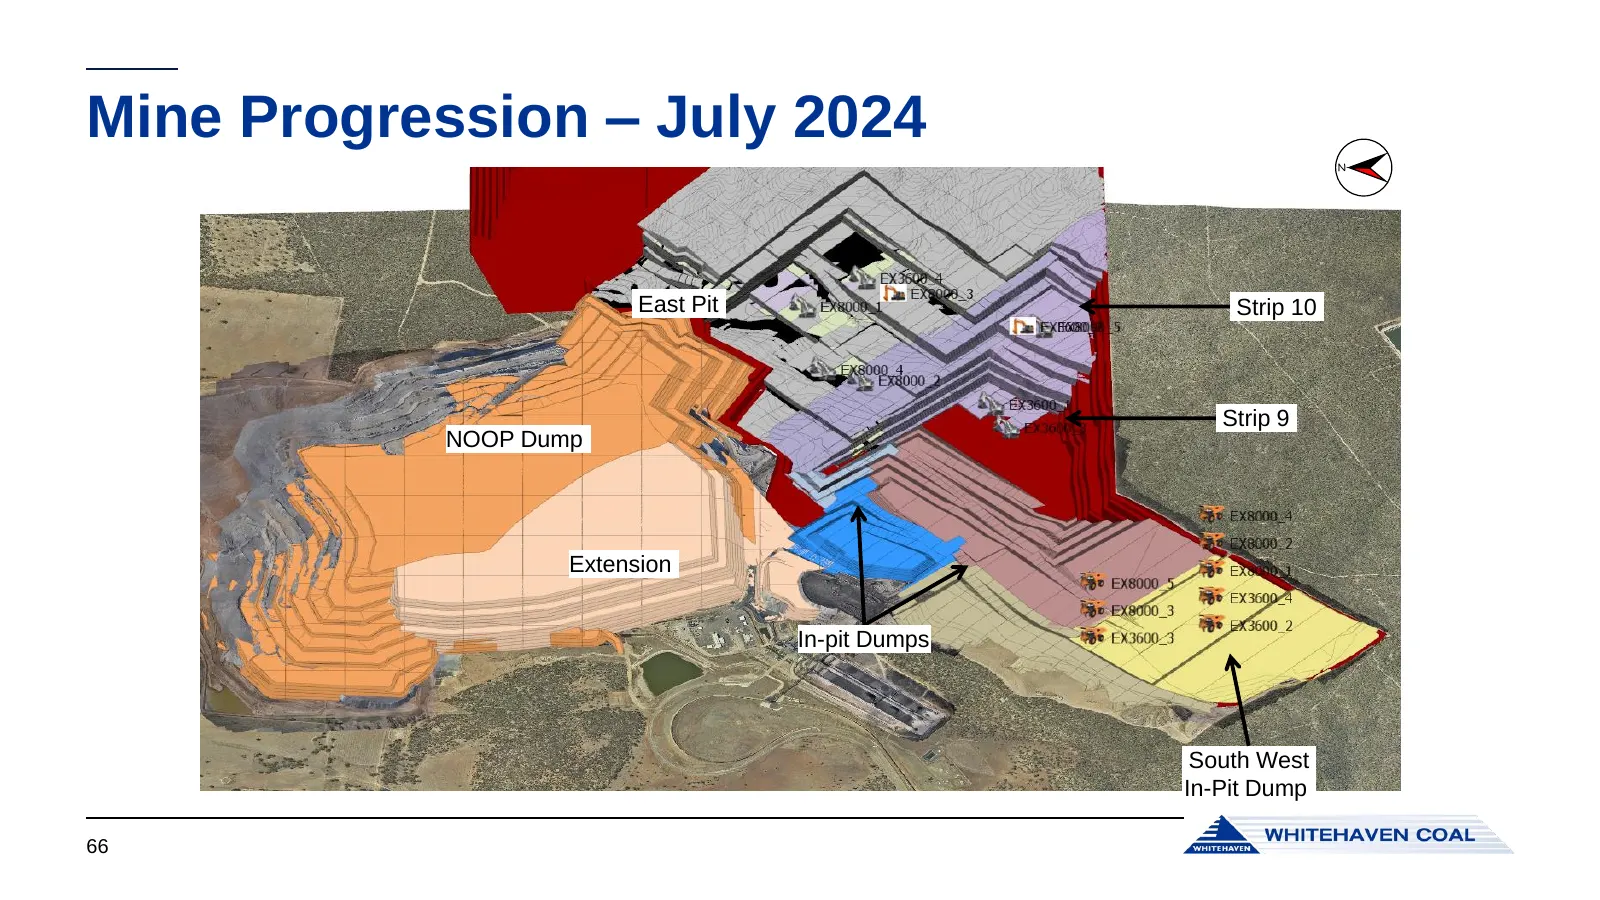
Slide 66: Mine Progression – July 2024
Mine Progression – July 2024 N East Pit Strip 10 Strip 9 NOOP Dump Extension In-pit Dumps South South WestWest Pit In-Pit Dump 66
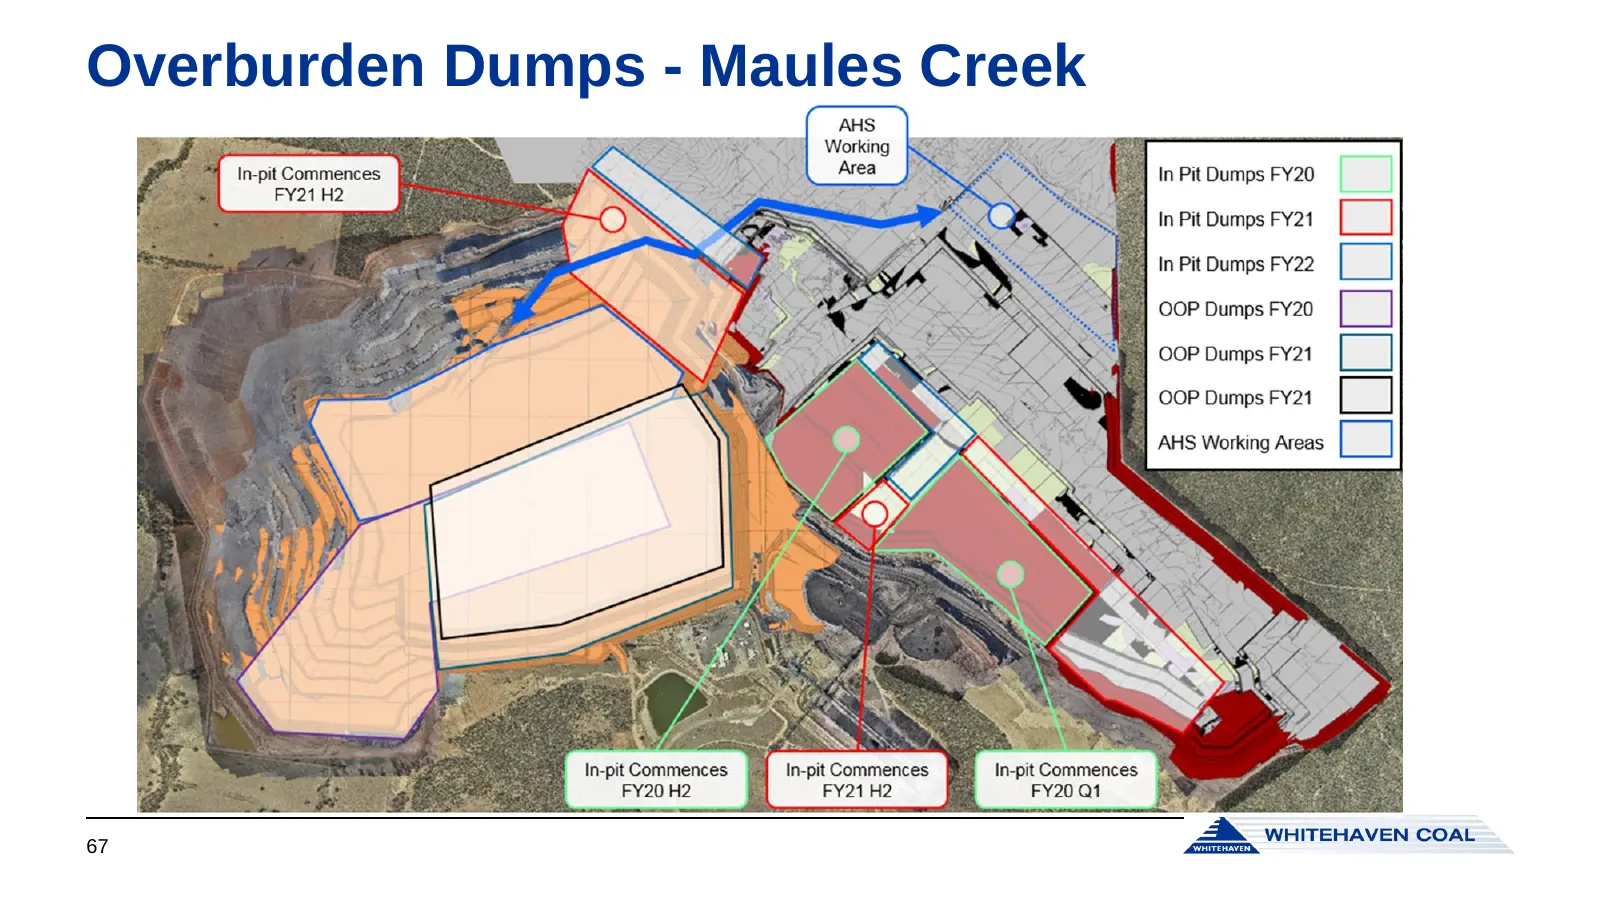
Slide 67: Overburden Dumps - Maules Creek
Overburden Dumps - Maules Creek 67
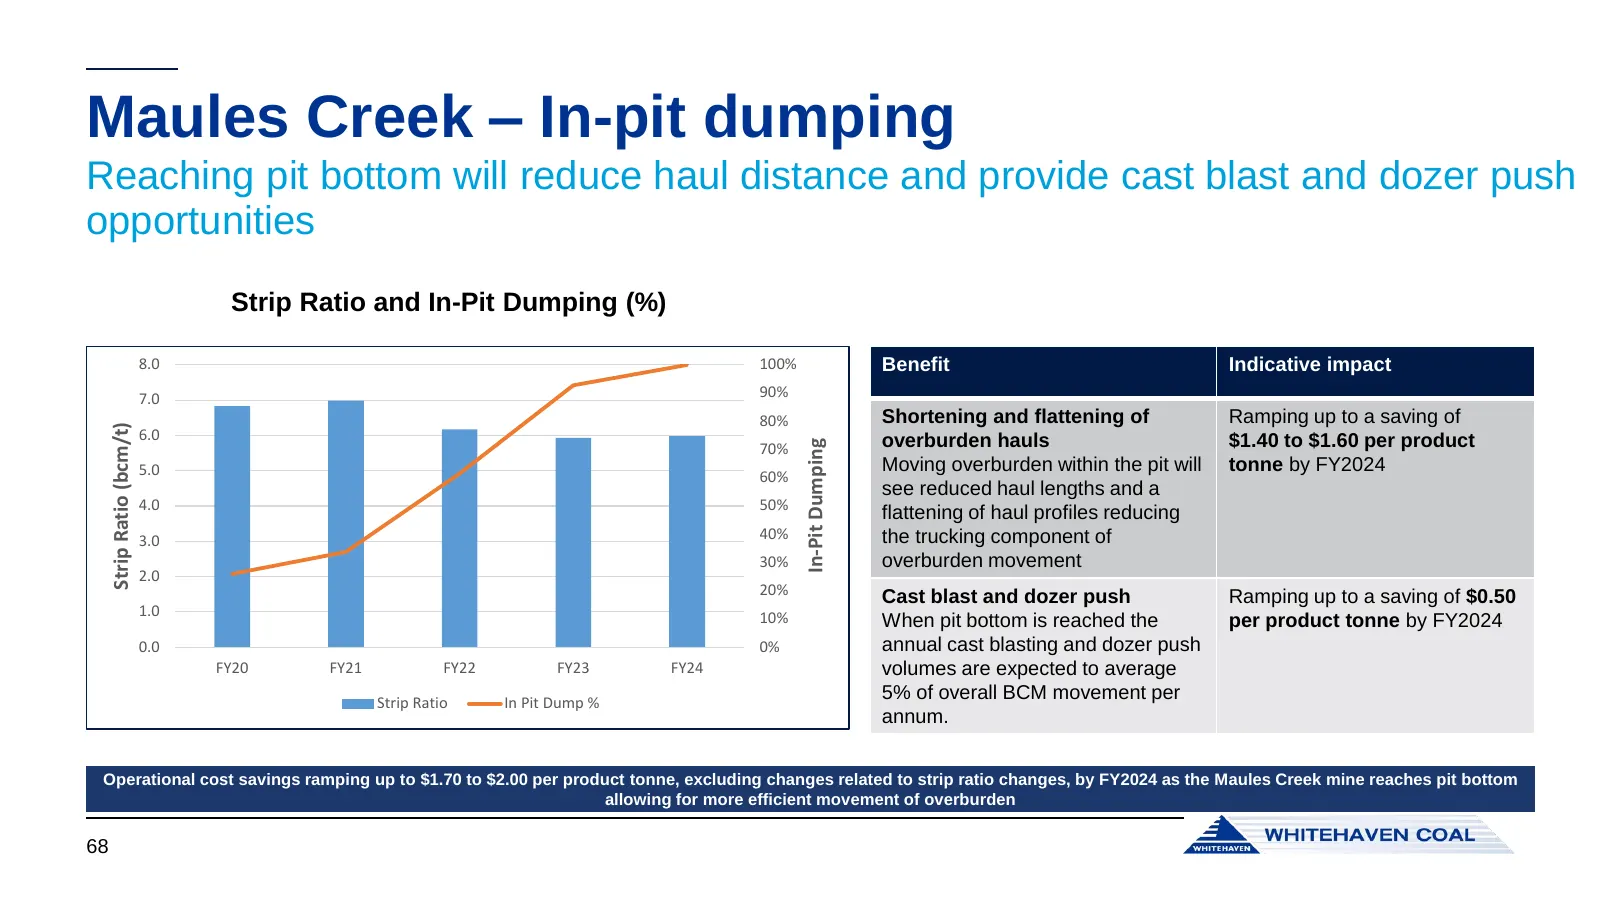
Slide 68: Maules Creek – In-pit dumping
Maules Creek – In-pit dumping Reaching pit bottom will reduce haul distance and provide cast blast and dozer push opportunities Strip Ratio and In-Pit Dumping (%) 8.0 100% Benefit Indicative impact 7.0 90% 80% Shortening and flattening of Ramping up to a saving of Strip Ratio (bcm/t) 6.0 overburden
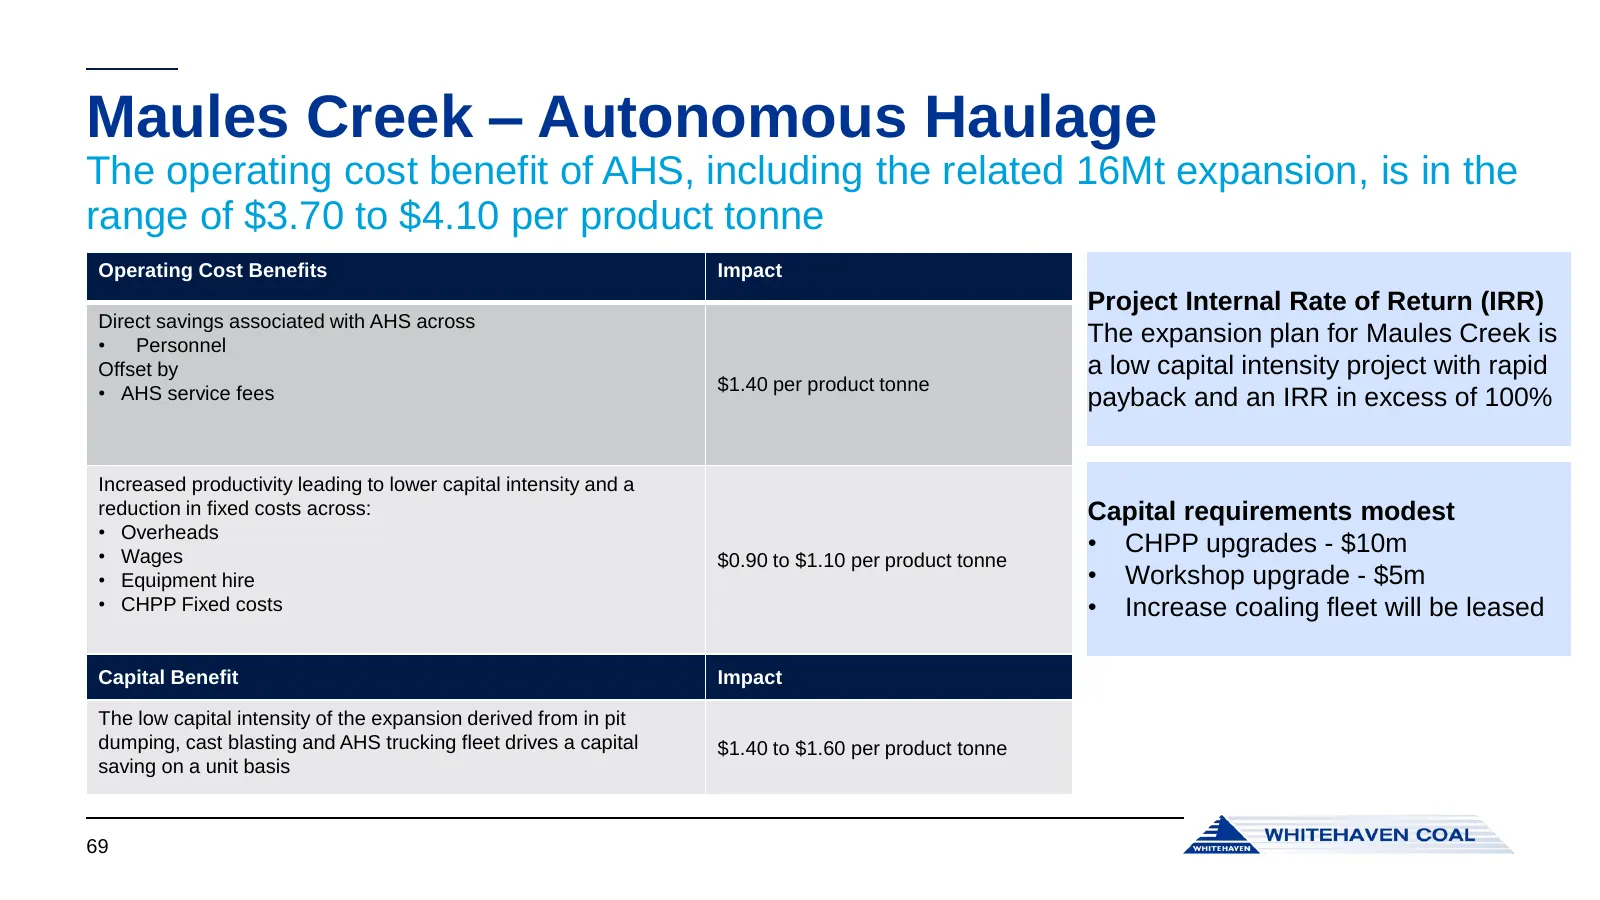
Slide 69: Maules Creek – Autonomous Haulage
Maules Creek – Autonomous Haulage The operating cost benefit of AHS, including the related 16Mt expansion, is in the range of $3.70 to $4.10 per product tonne Operating Cost Benefits Impact Project Internal Rate of Return (IRR) Direct savings associated with AHS across • Personnel The expansion plan
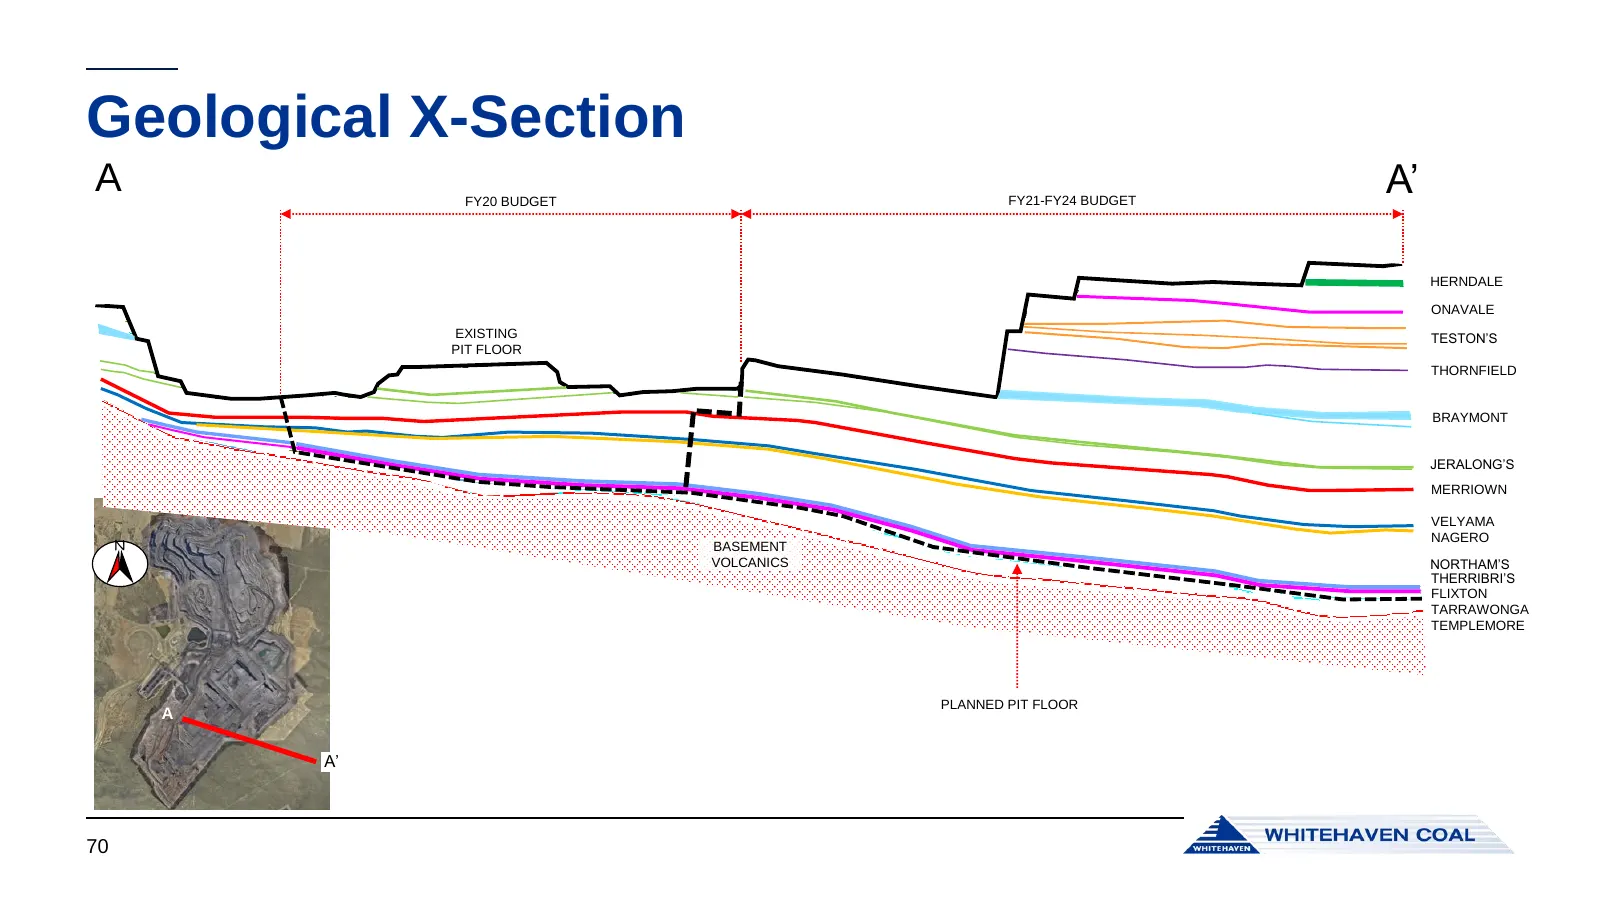
Slide 70: Geological X-Section
Geological X-Section A FY20 BUDGET FY21-FY24 BUDGET A’ HERNDALE ONAVALE EXISTING TESTON’S PIT FLOOR THORNFIELD BRAYMONT JERALONG’S MERRIOWN VELYAMA NAGERO N BASEMENT VOLCANICS NORTHAM’S THERRIBRI’S FLIXTON TARRAWONGA TEMPLEMORE PLANNED PIT FLOOR A A’ 70
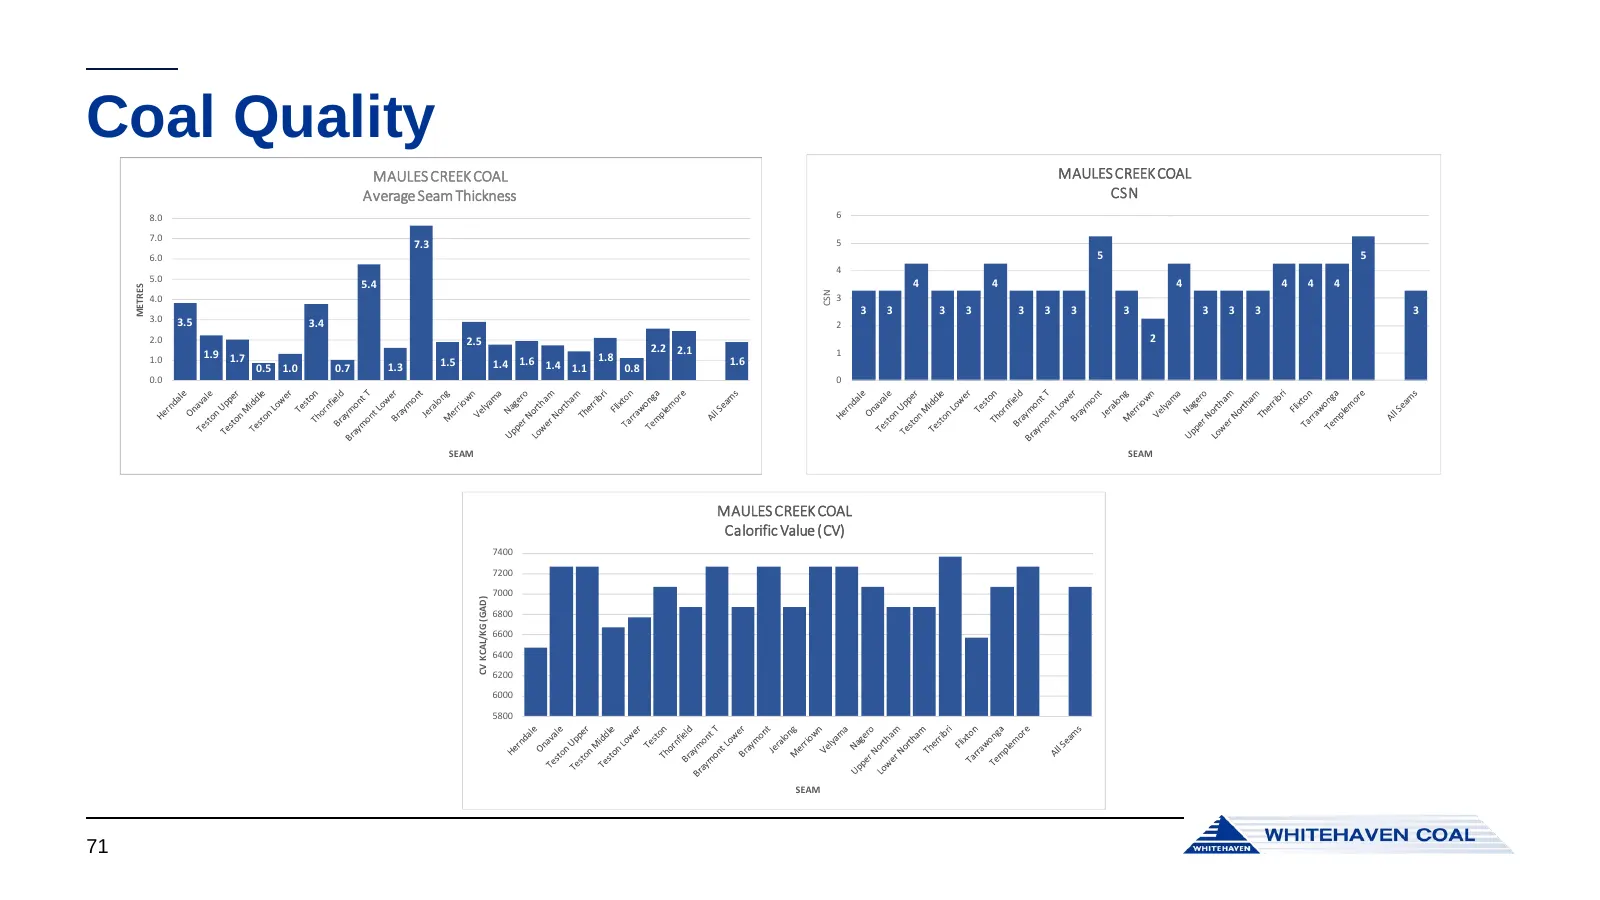
Slide 71: Coal Quality
Coal Quality MAULES CREEK COAL MAULES CREEK COAL Average Seam Thickness CSN 8.0 6 7.0 5 7.3 6.0 5 5 4 5.0 5.4 4 4 4 4 4 4 METRES CSN 4.0 3 3 3 3 3 3 3 3 3 3 3 3 3 3.0 3.5 3.4 2 2.0 2.5 2 2.2 2.1 1 1.0 1.9 1.7 1.8 0.5 1.0 0.7 1.3 1.5 1.4 1.6 1.4 1.1 0.8 1.6 0.0 0 SEAM SEAM MAULES CREEK COAL Calorific
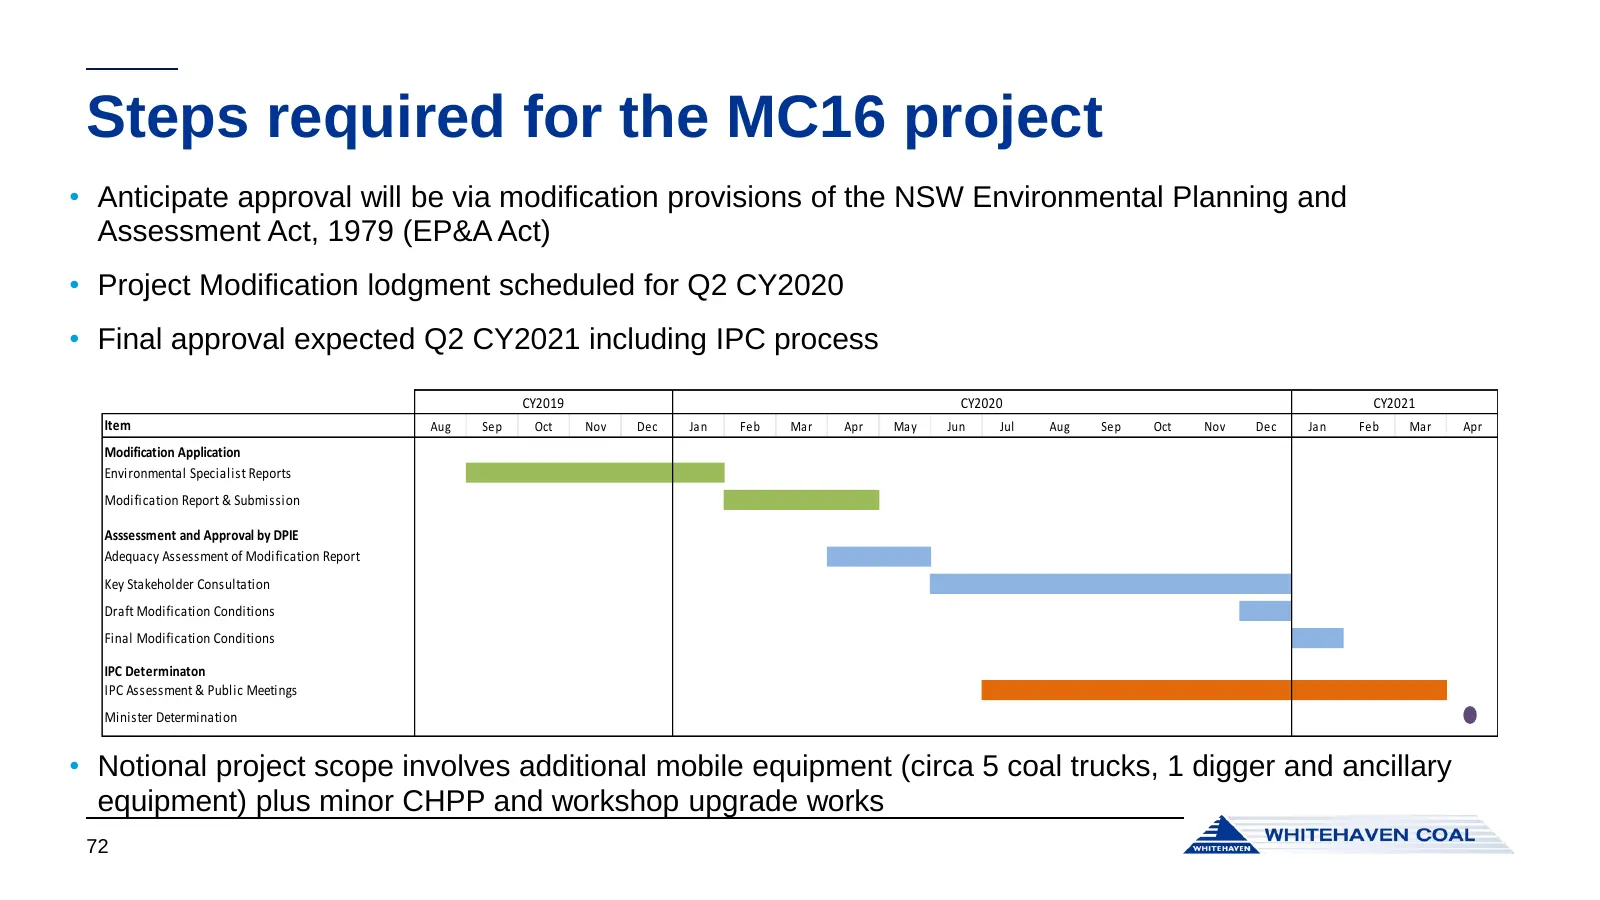
Slide 72: Steps required for the MC16 project
Steps required for the MC16 project • Anticipate approval will be via modification provisions of the NSW Environmental Planning and Assessment Act, 1979 (EP&A Act) • Project Modification lodgment scheduled for Q2 CY2020 • Final approval expected Q2 CY2021 including IPC process CY2019 CY2020 CY2021 I
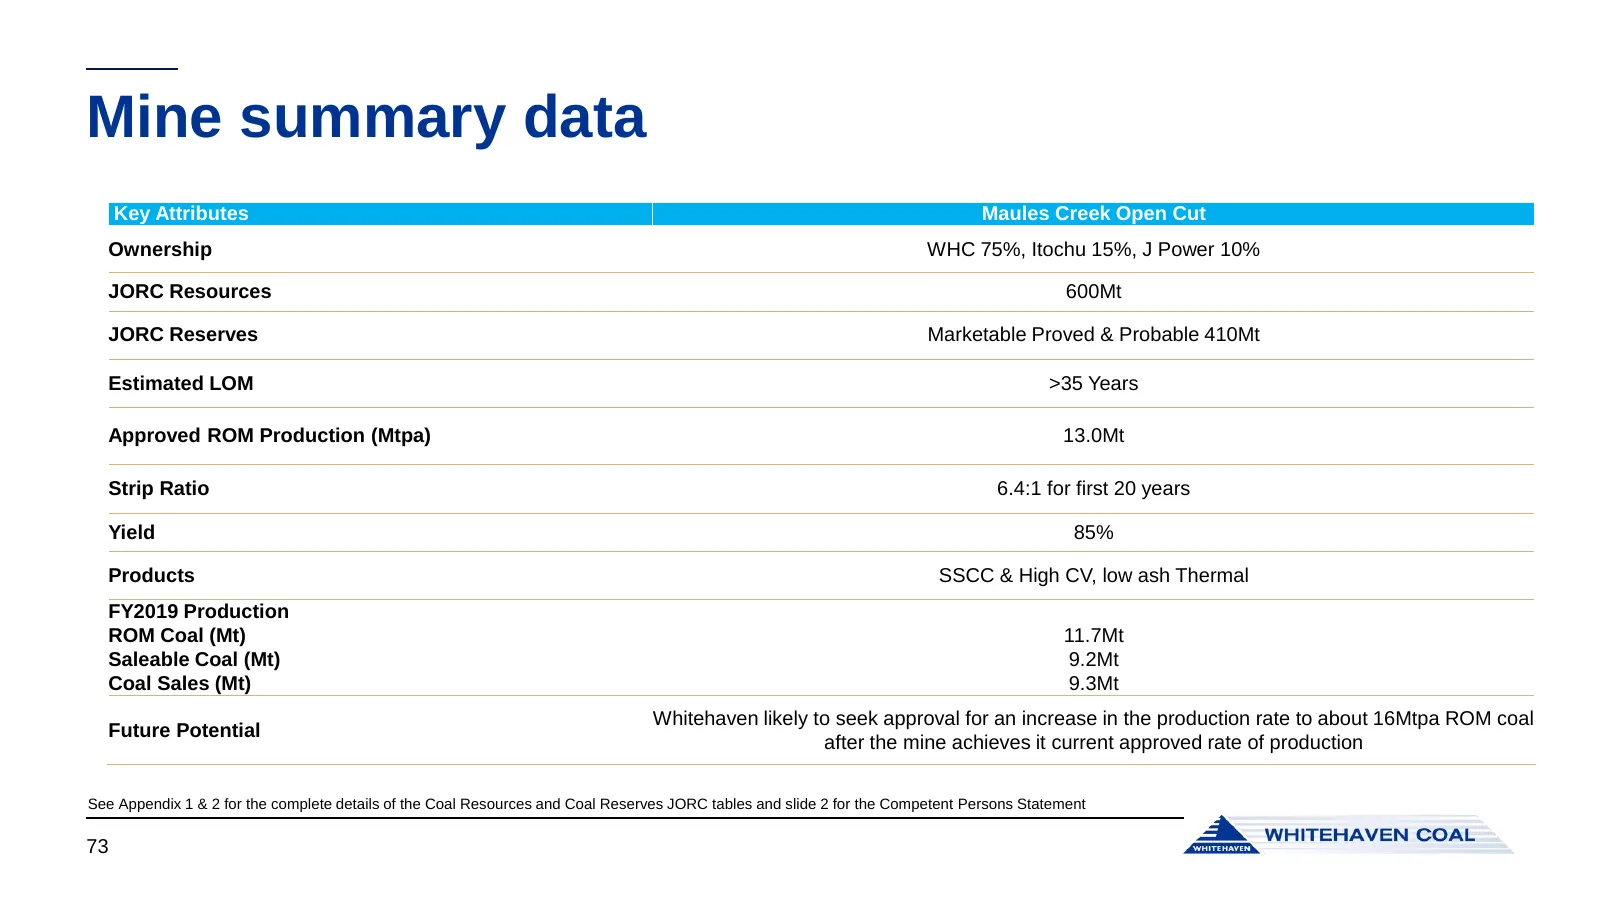
Slide 73: Mine summary data
Mine summary data Key Attributes Maules Creek Open Cut Ownership WHC 75%, Itochu 15%, J Power 10% JORC Resources 600Mt JORC Reserves Marketable Proved & Probable 410Mt Estimated LOM >35 Years Approved ROM Production (Mtpa) 13.0Mt Strip Ratio 6.4:1 for first 20 years Yield 85% Products SSCC & High CV

Slide 74: Narrabri Mine
Narrabri Mine
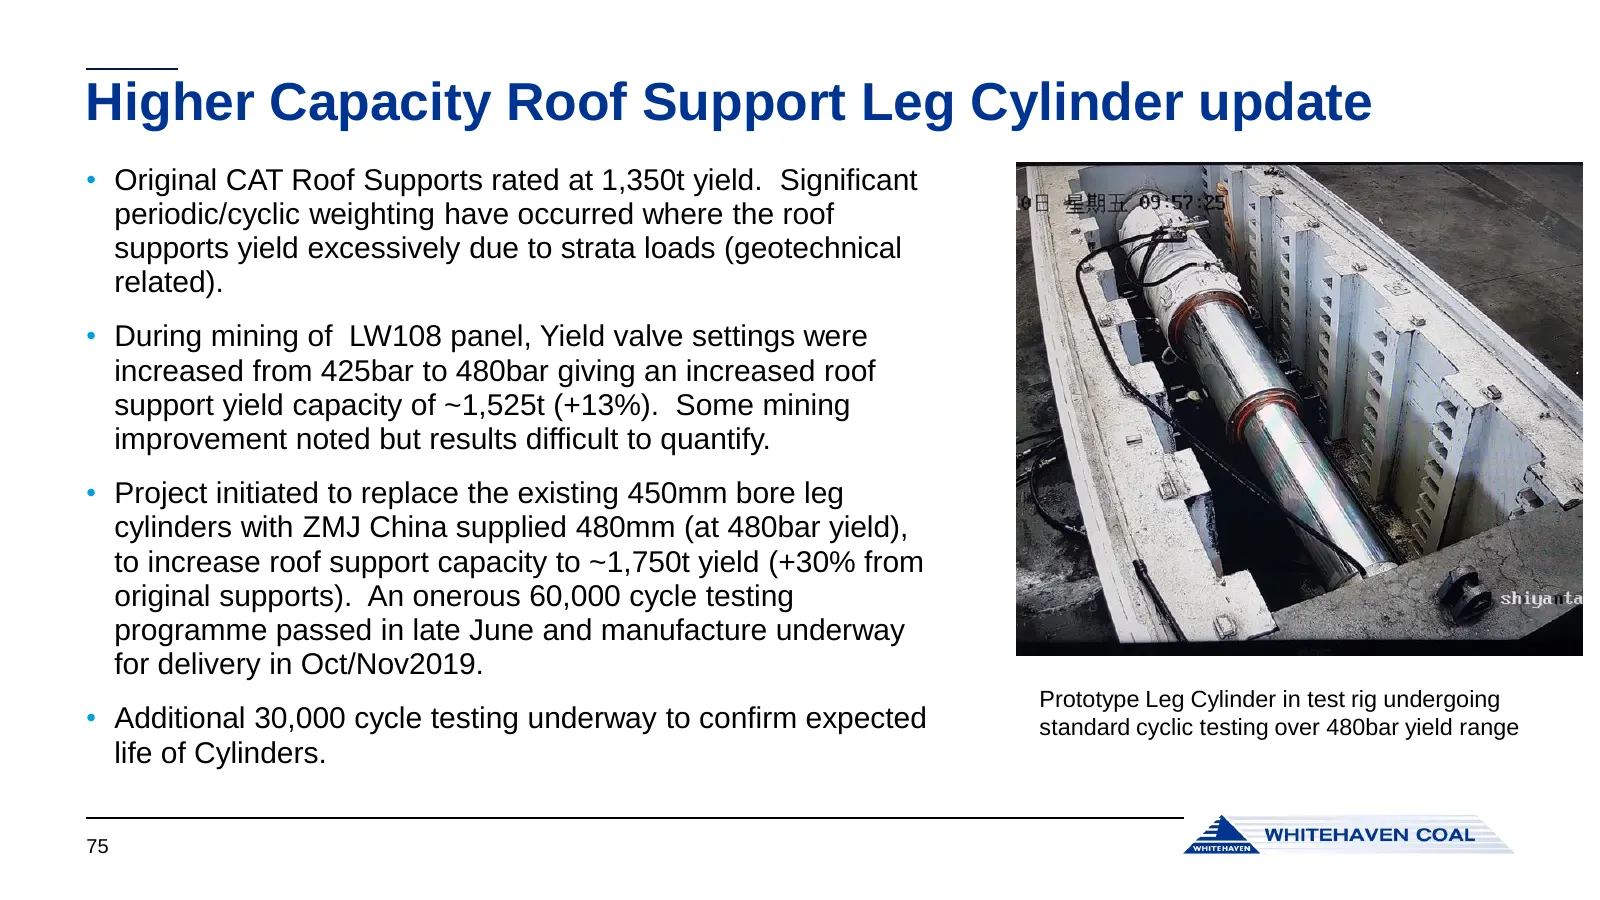
Slide 75: Higher Capacity Roof Support Leg Cylinder update
Higher Capacity Roof Support Leg Cylinder update • Original CAT Roof Supports rated at 1,350t yield. Significant periodic/cyclic weighting have occurred where the roof supports yield excessively due to strata loads (geotechnical related). • During mining of LW108 panel, Yield valve settings were inc
Slide 76: Higher Capacity Roof Support Leg Cylinder update
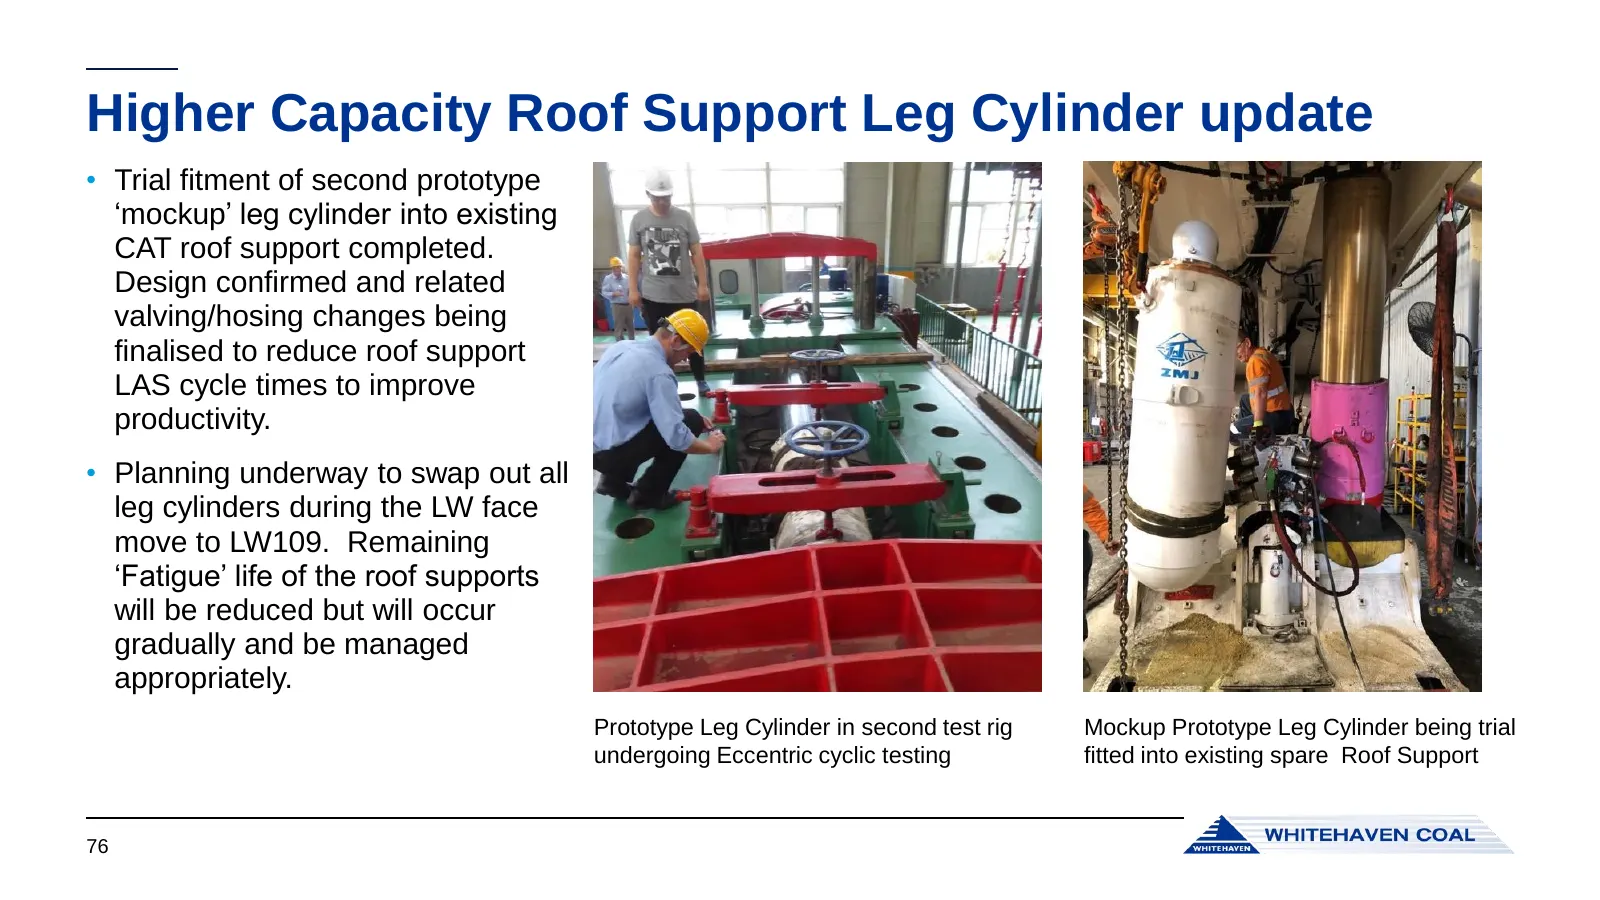
Higher Capacity Roof Support Leg Cylinder update • Trial fitment of second prototype ‘mockup’ leg cylinder into existing CAT roof support completed. Design confirmed and related valving/hosing changes being finalised to reduce roof support LAS cycle times to improve productivity. • Planning underway
Slide 77: Narrabri Three Year Mine Plan
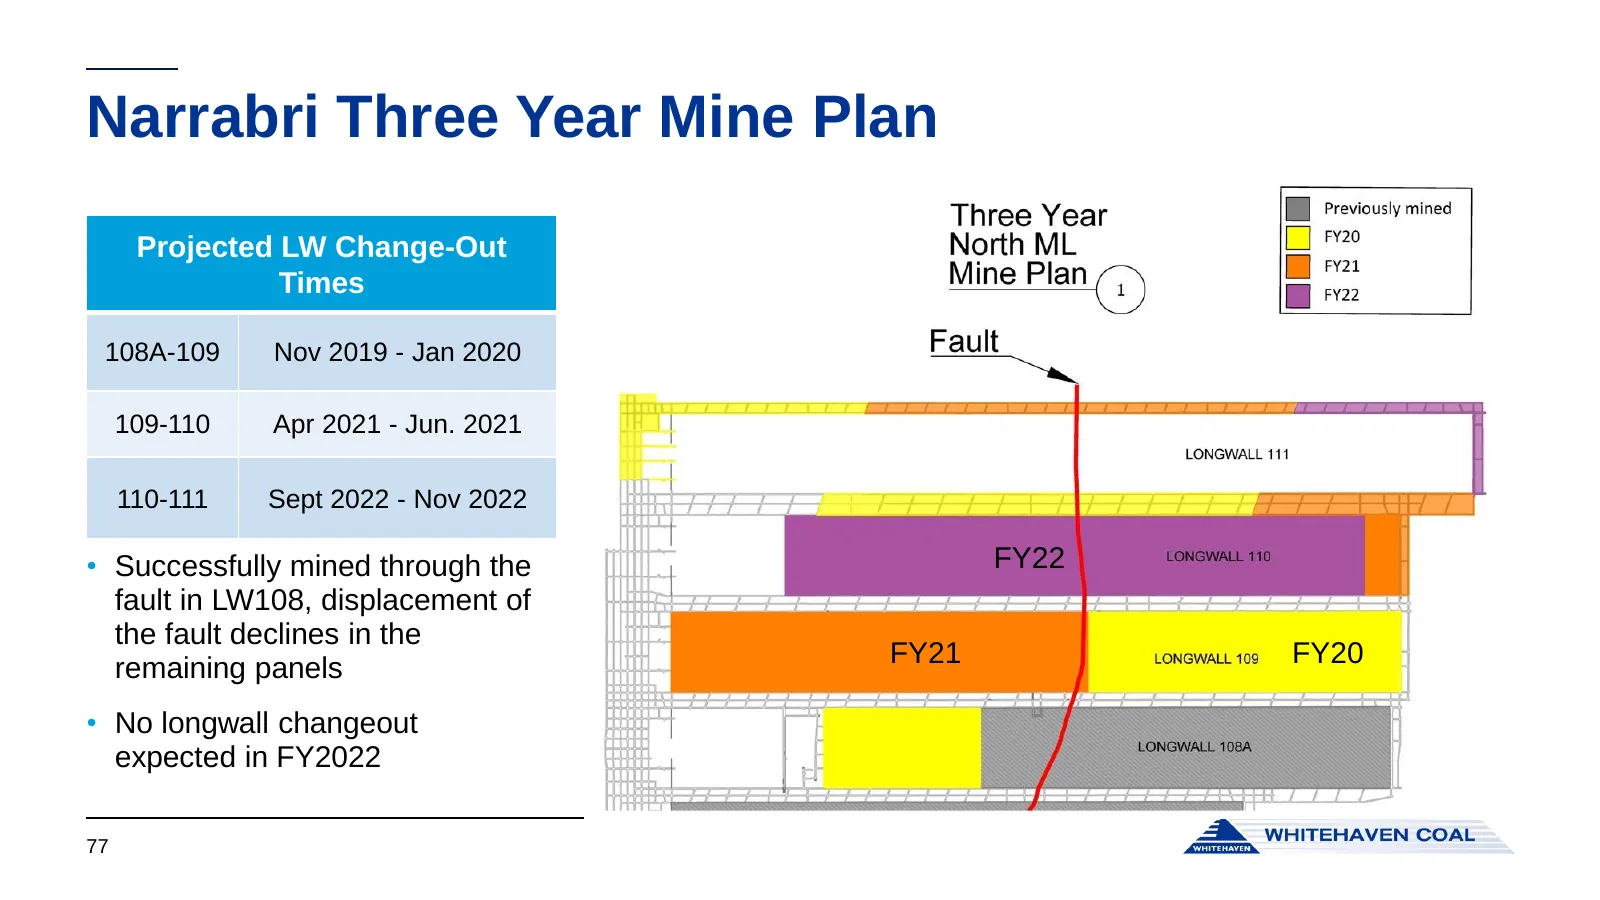
Narrabri Three Year Mine Plan Projected LW Change-Out Times 108A-109 Nov 2019 - Jan 2020 109-110 Apr 2021 - Jun. 2021 110-111 Sept 2022 - Nov 2022 • Successfully mined through the FY22 fault in LW108, displacement of the fault declines in the FY21 FY20 remaining panels • No longwall changeout expect
Slide 78: Narrabri optimisation – stage 3 expansion
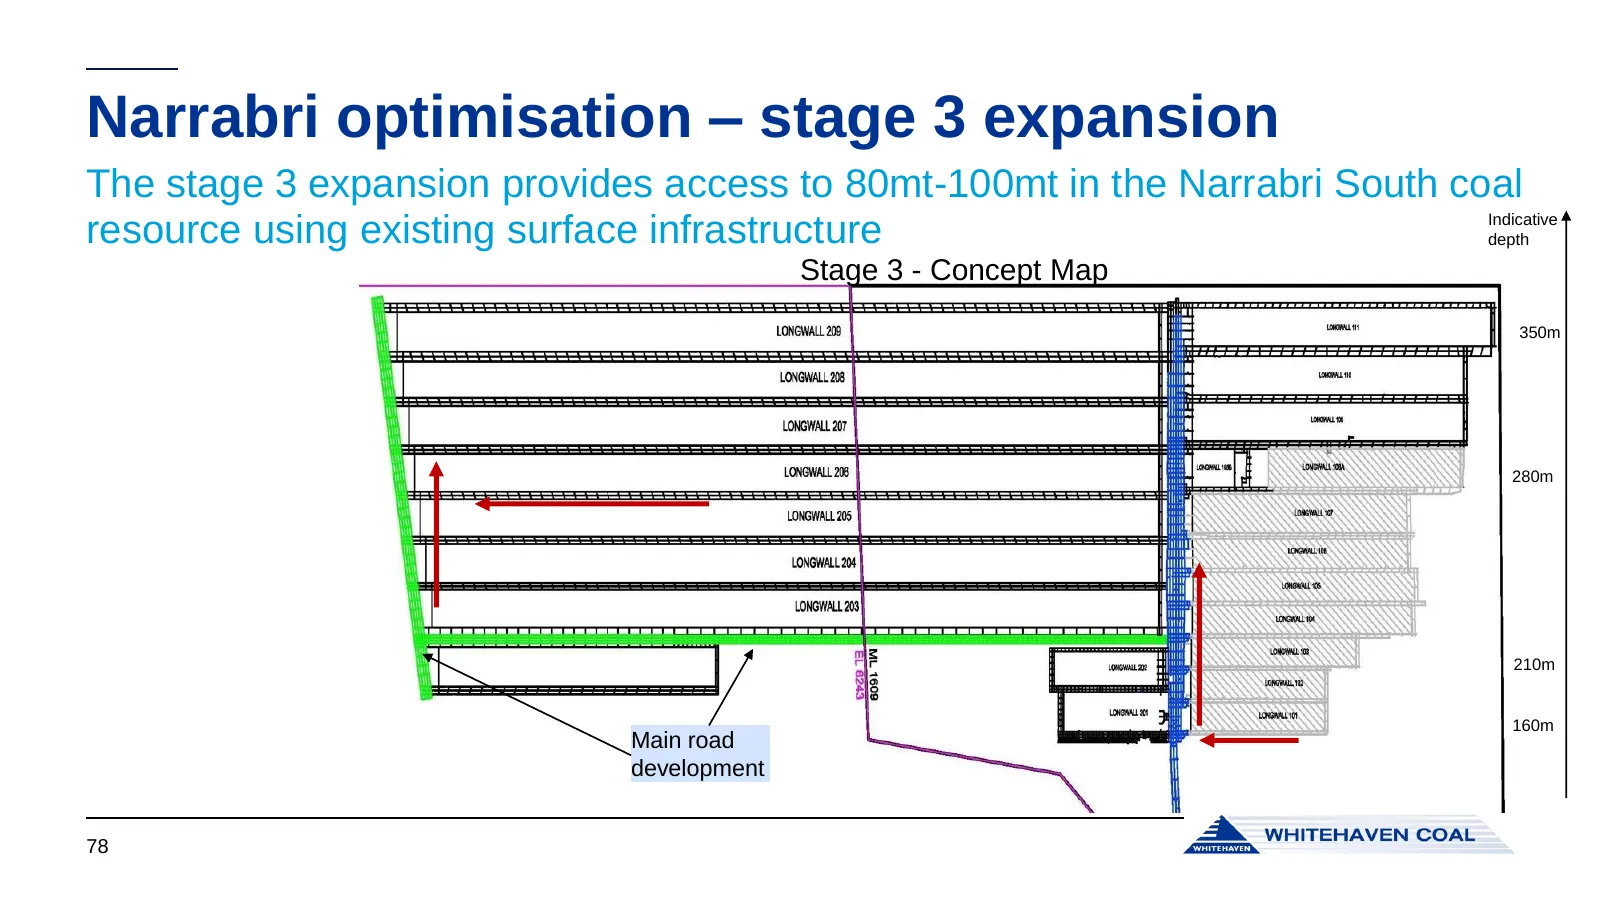
Narrabri optimisation – stage 3 expansion The stage 3 expansion provides access to 80mt-100mt in the Narrabri South coal Indicative resource using existing surface infrastructure depth Stage 3 - Concept Map 350m 280m 210m 160m Main road development 78
Slide 79: Narrabri Stage 3 mine plan
Narrabri Stage 3 mine plan Stage 3 mine plan provides for: • Access to southern EL reserves utilizing the existing mine infrastructure – pit top, CHPP and rail loop • Ability to develop and extract extended longwall panels, from 9km to10km • Reduced relocations increasing annual production • Reduced
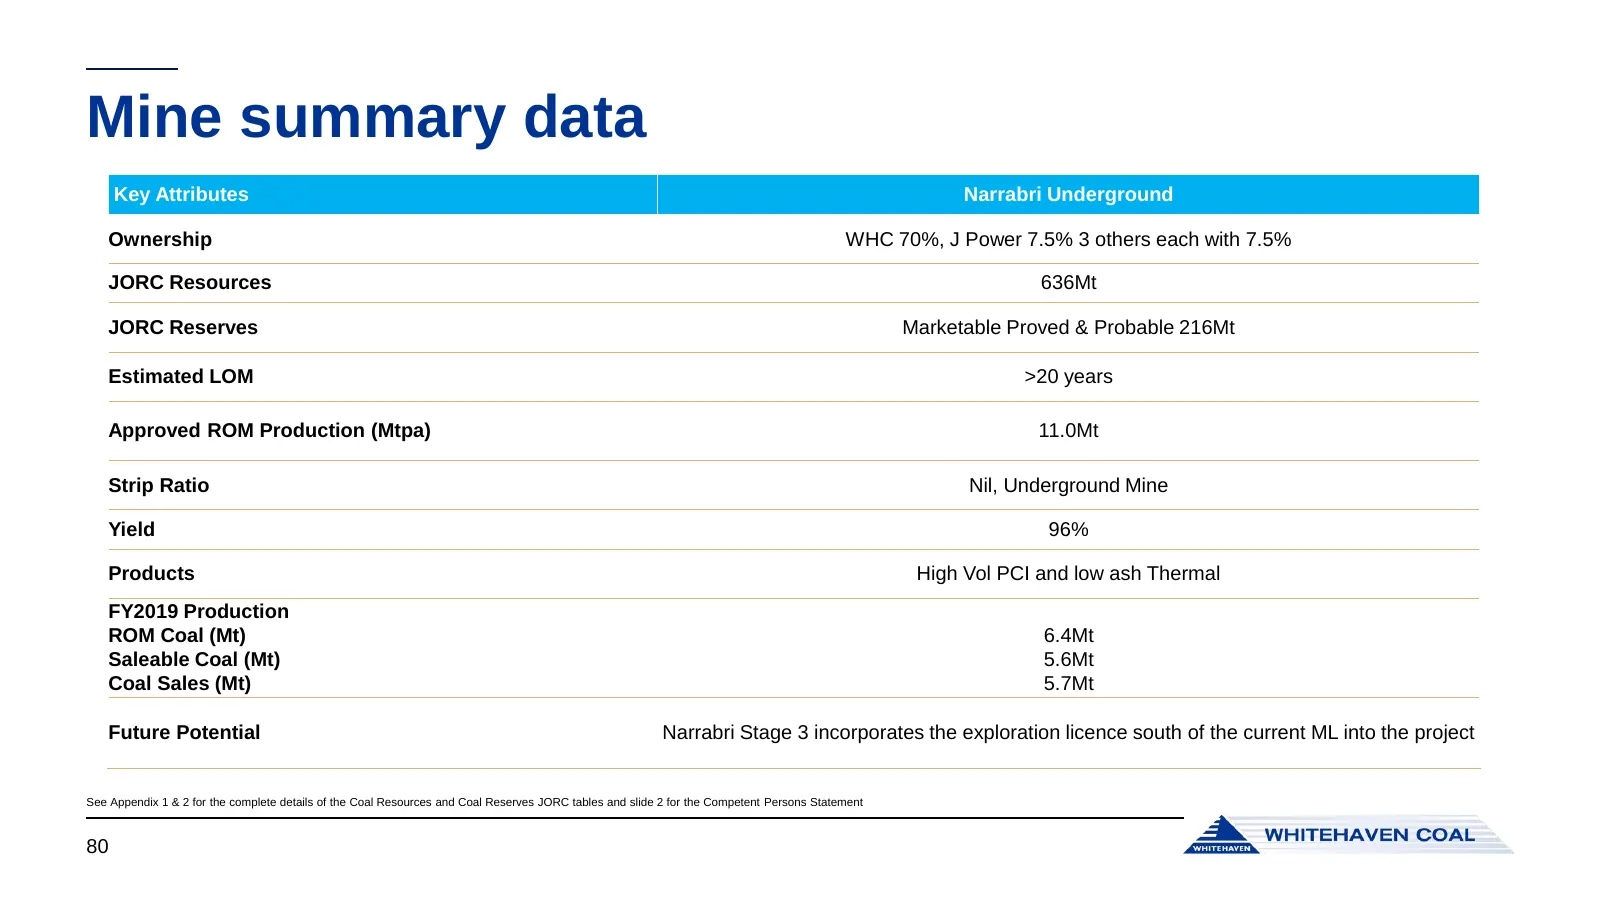
Slide 80: Mine summary data
Mine summary data Key Attributes Narrabri Underground Ownership WHC 70%, J Power 7.5% 3 others each with 7.5% JORC Resources 636Mt JORC Reserves Marketable Proved & Probable 216Mt Estimated LOM >20 years Approved ROM Production (Mtpa) 11.0Mt Strip Ratio Nil, Underground Mine Yield 96% Products High
Slide 81: GOC – Tarrawonga, Werris Creek and Gunnedah CHPP
GOC – Tarrawonga, Werris Creek and Gunnedah CHPP
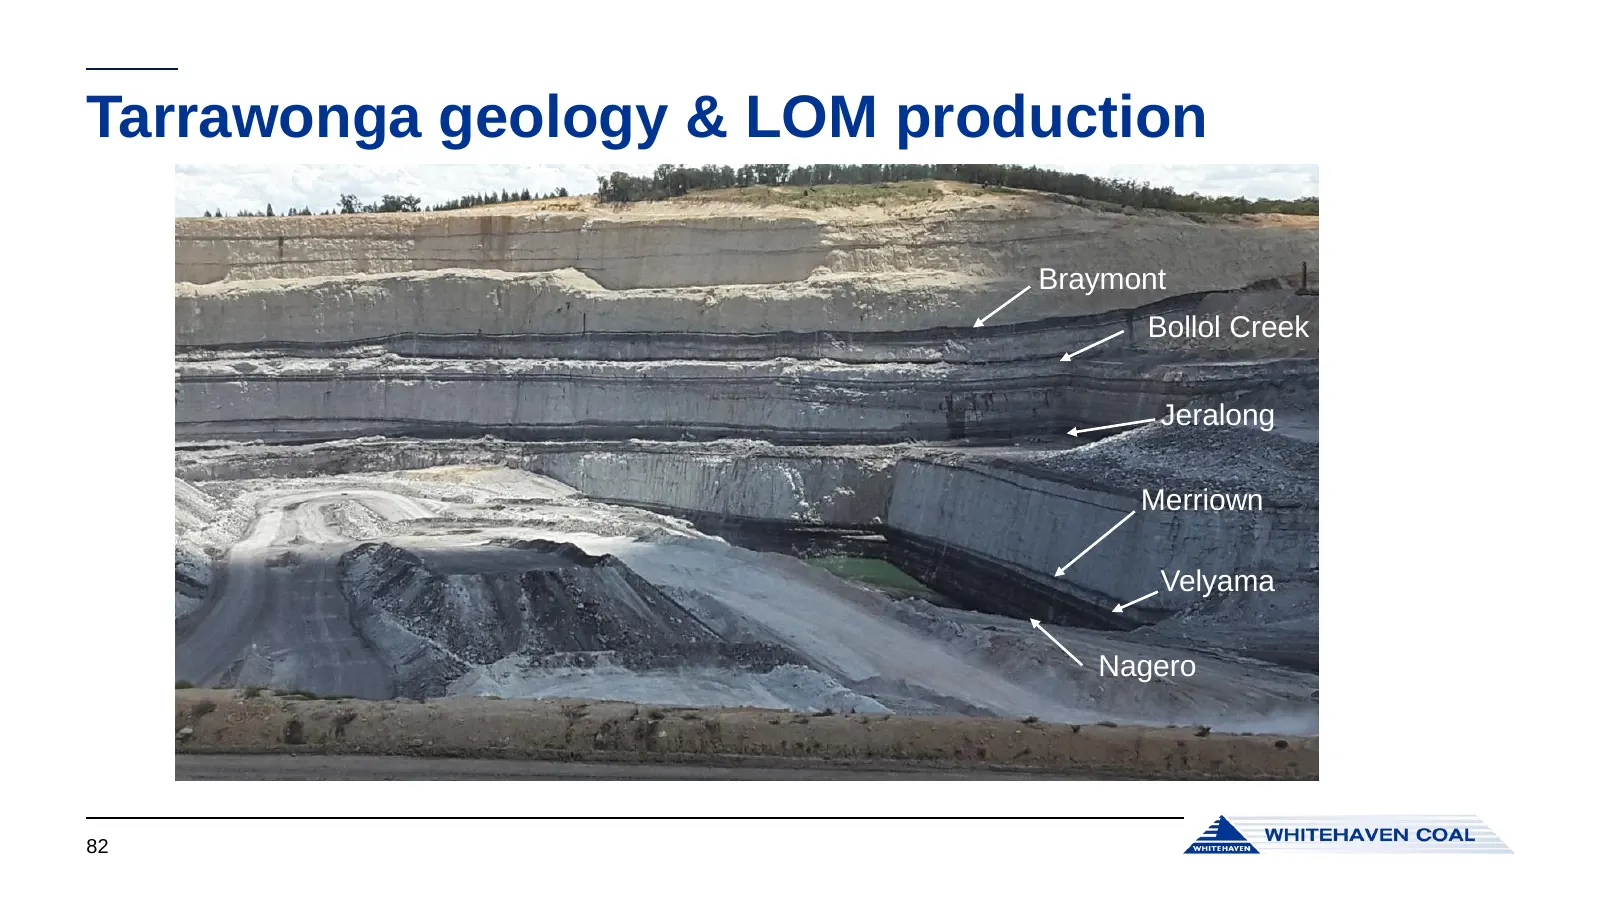
Slide 82: Tarrawonga geology & LOM production
Tarrawonga geology & LOM production Braymont Bollol Creek Jeralong Merriown Velyama Nagero 82
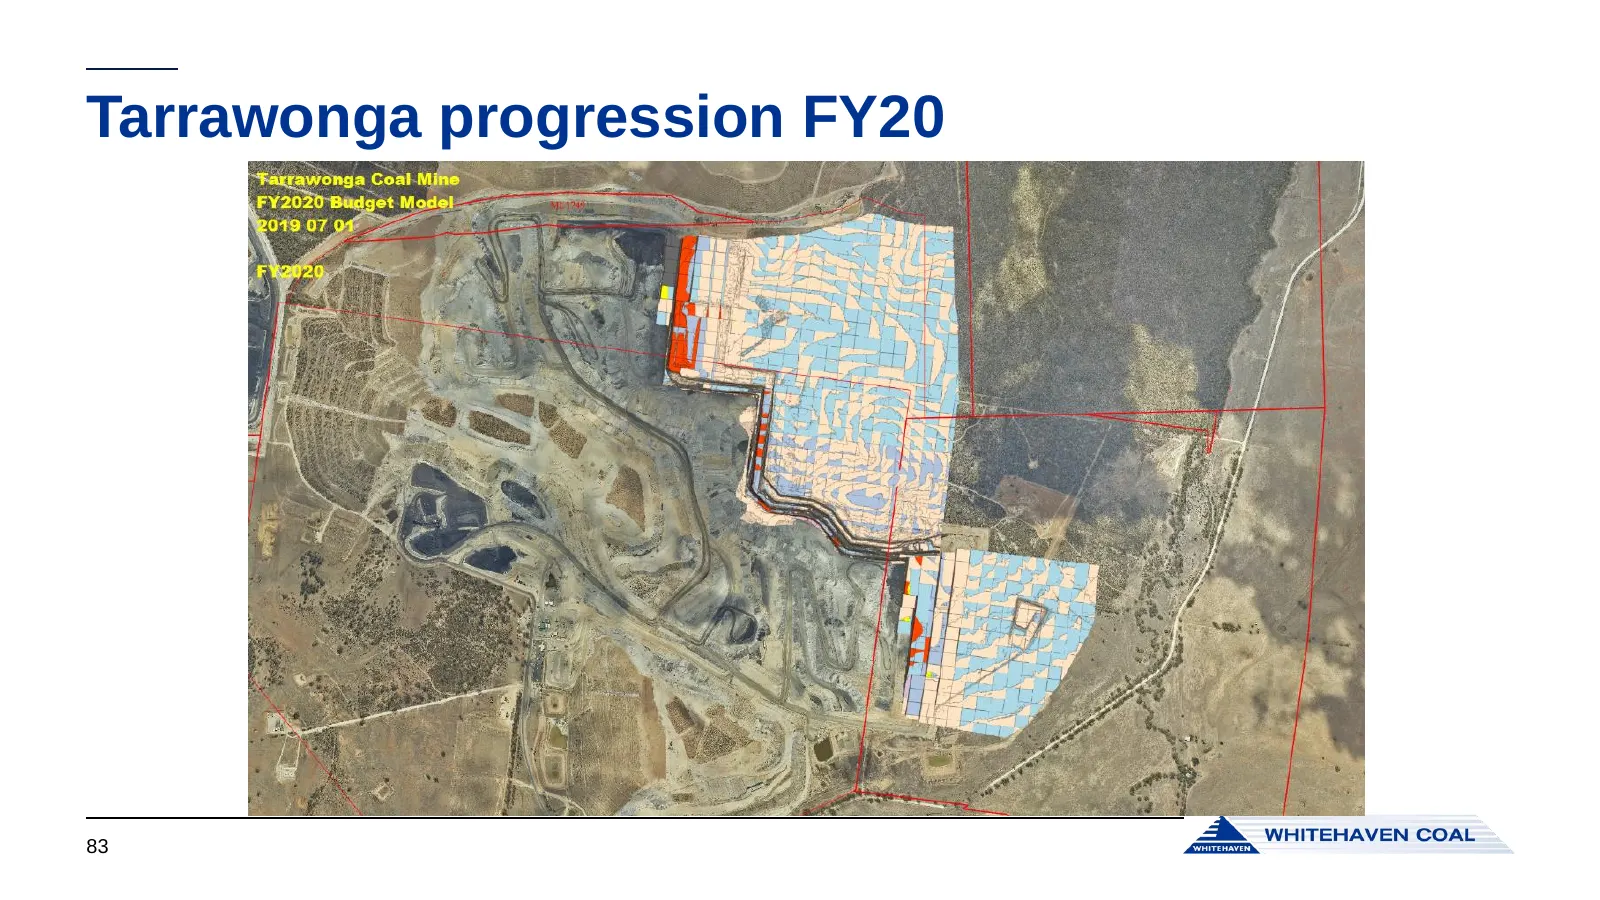
Slide 83: Tarrawonga progression FY20
Tarrawonga progression FY20 83
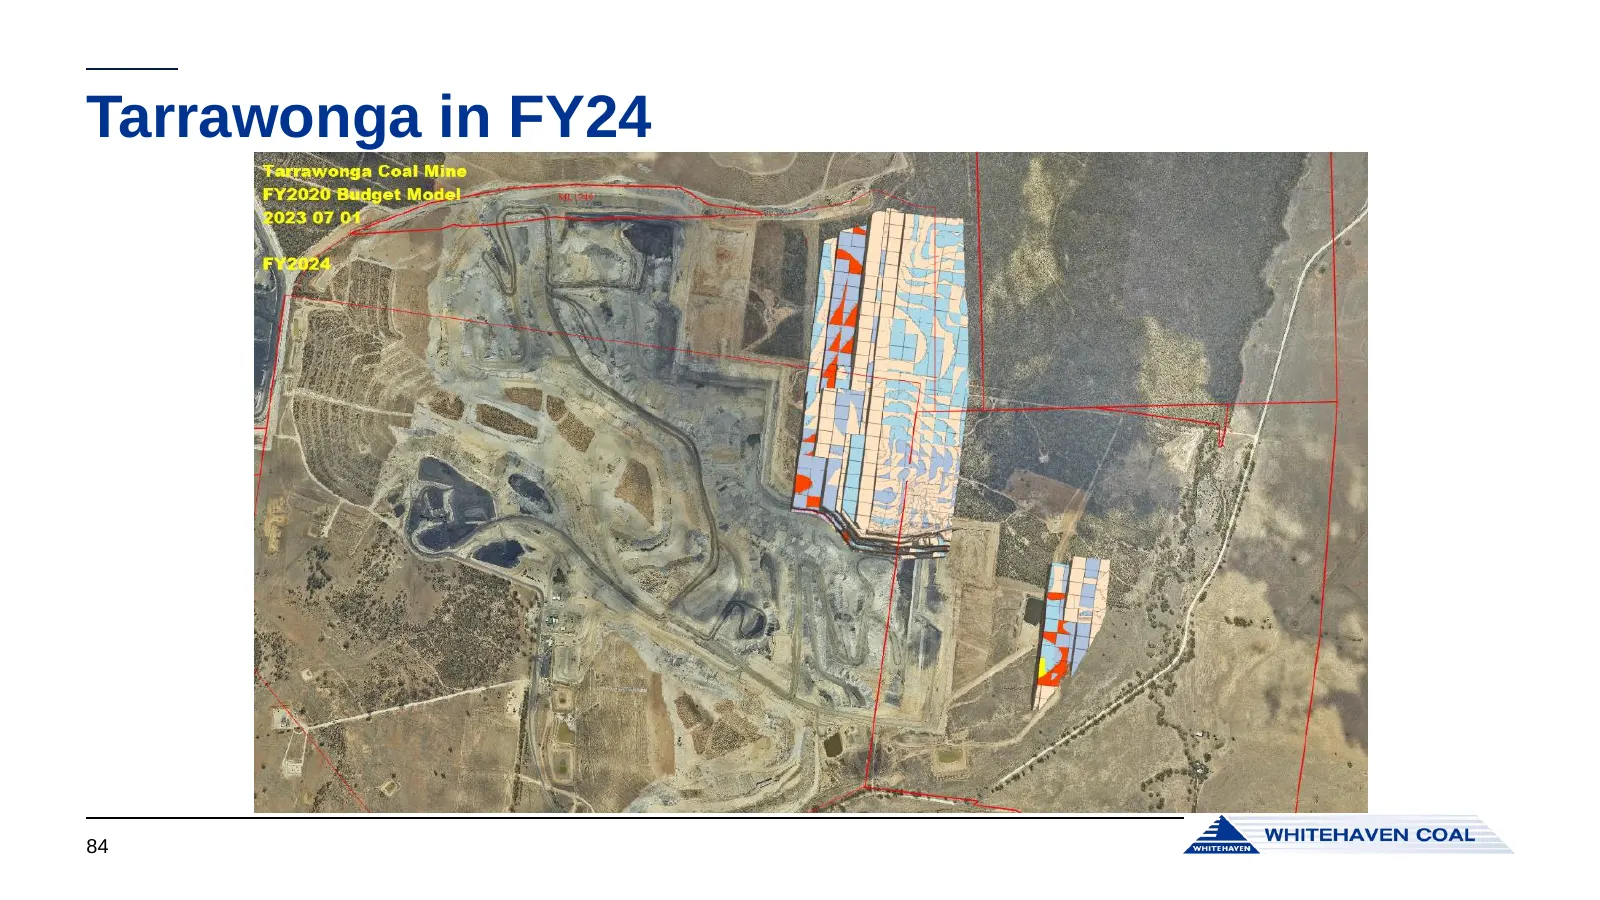
Slide 84: Tarrawonga in FY24
Tarrawonga in FY24 “Fatrawonga Coal-Min FY2020 Digger Mod 2a B® warrenaven coaL
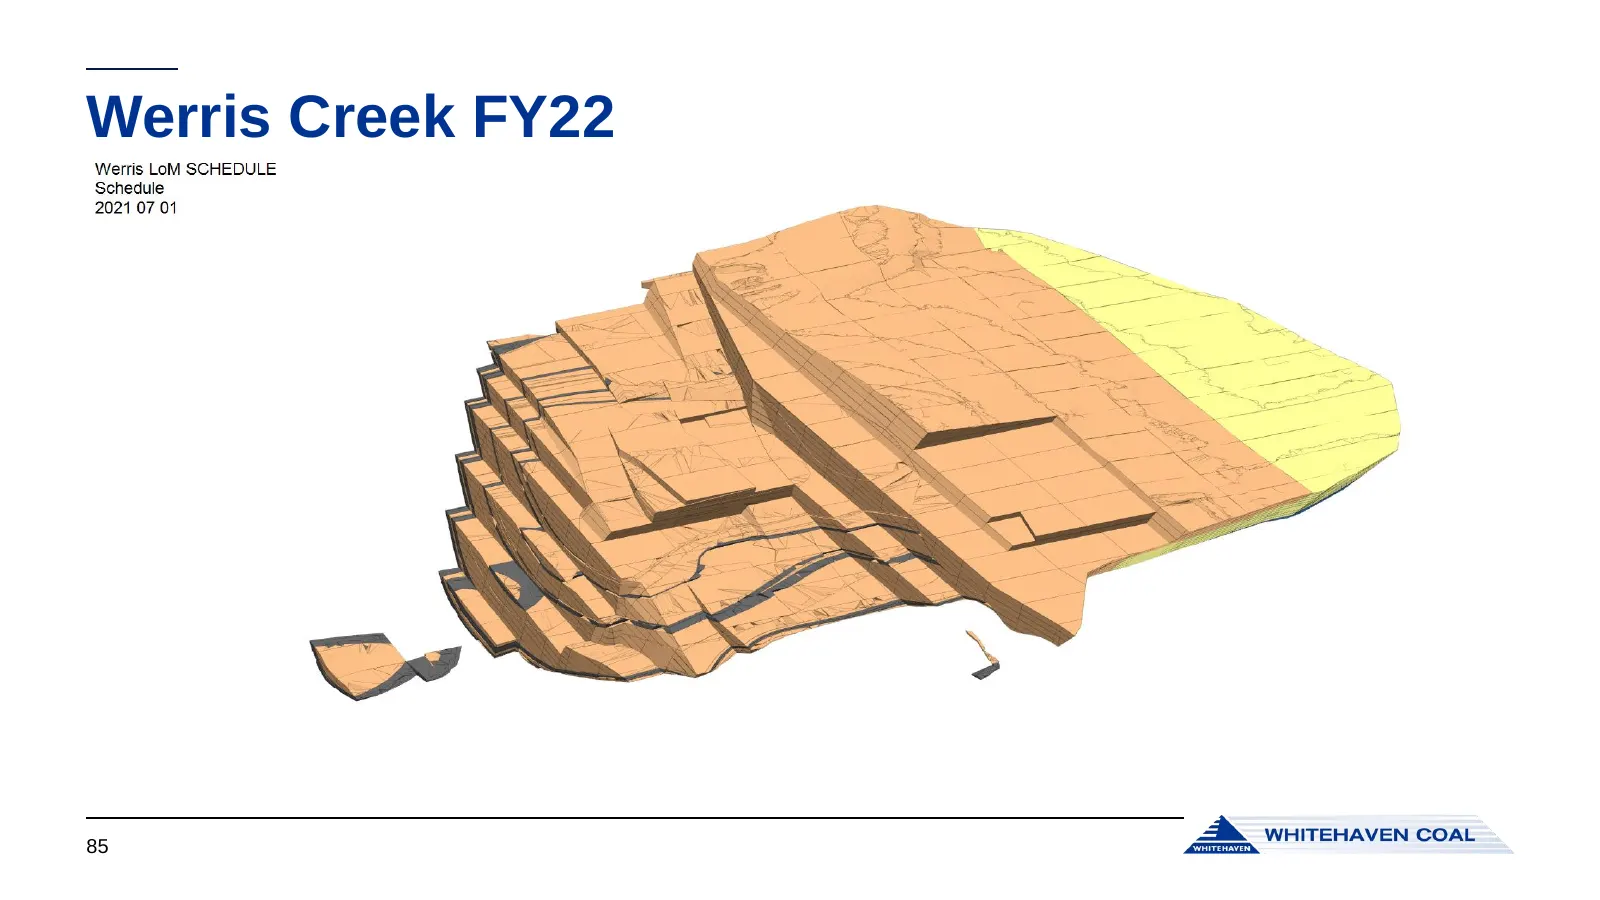
Slide 85: Werris Creek FY22
Werris Creek FY22 Werris LoM SCHEDULE Schedule 2021 07 01 85 B® warrenaven coat
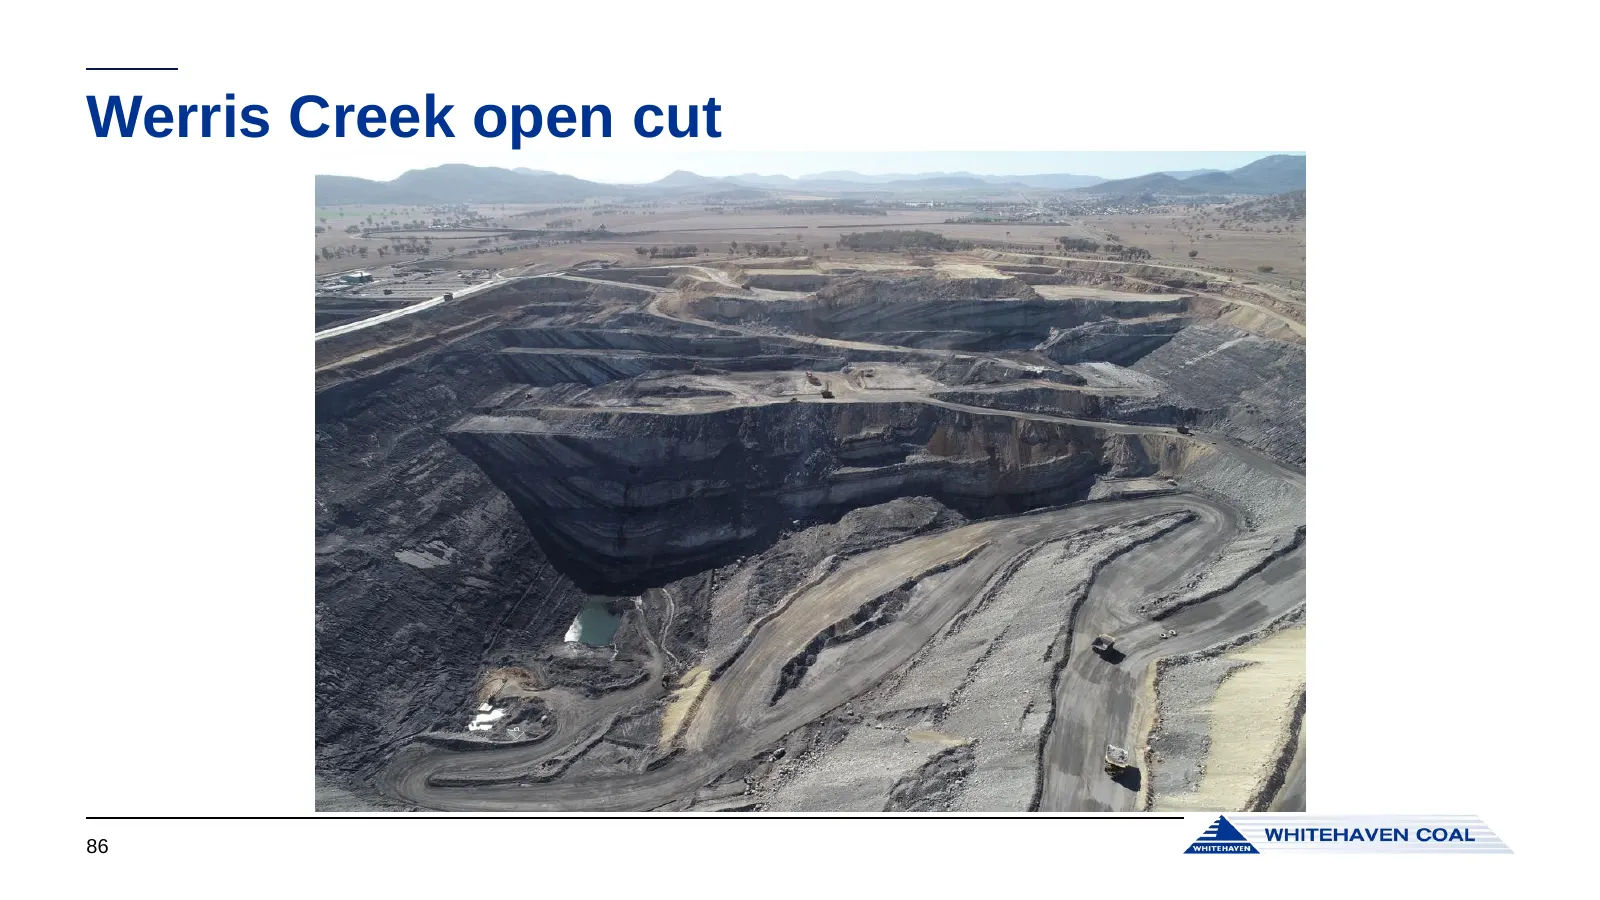
Slide 86: Werris Creek open cut
Werris Creek open cut 86
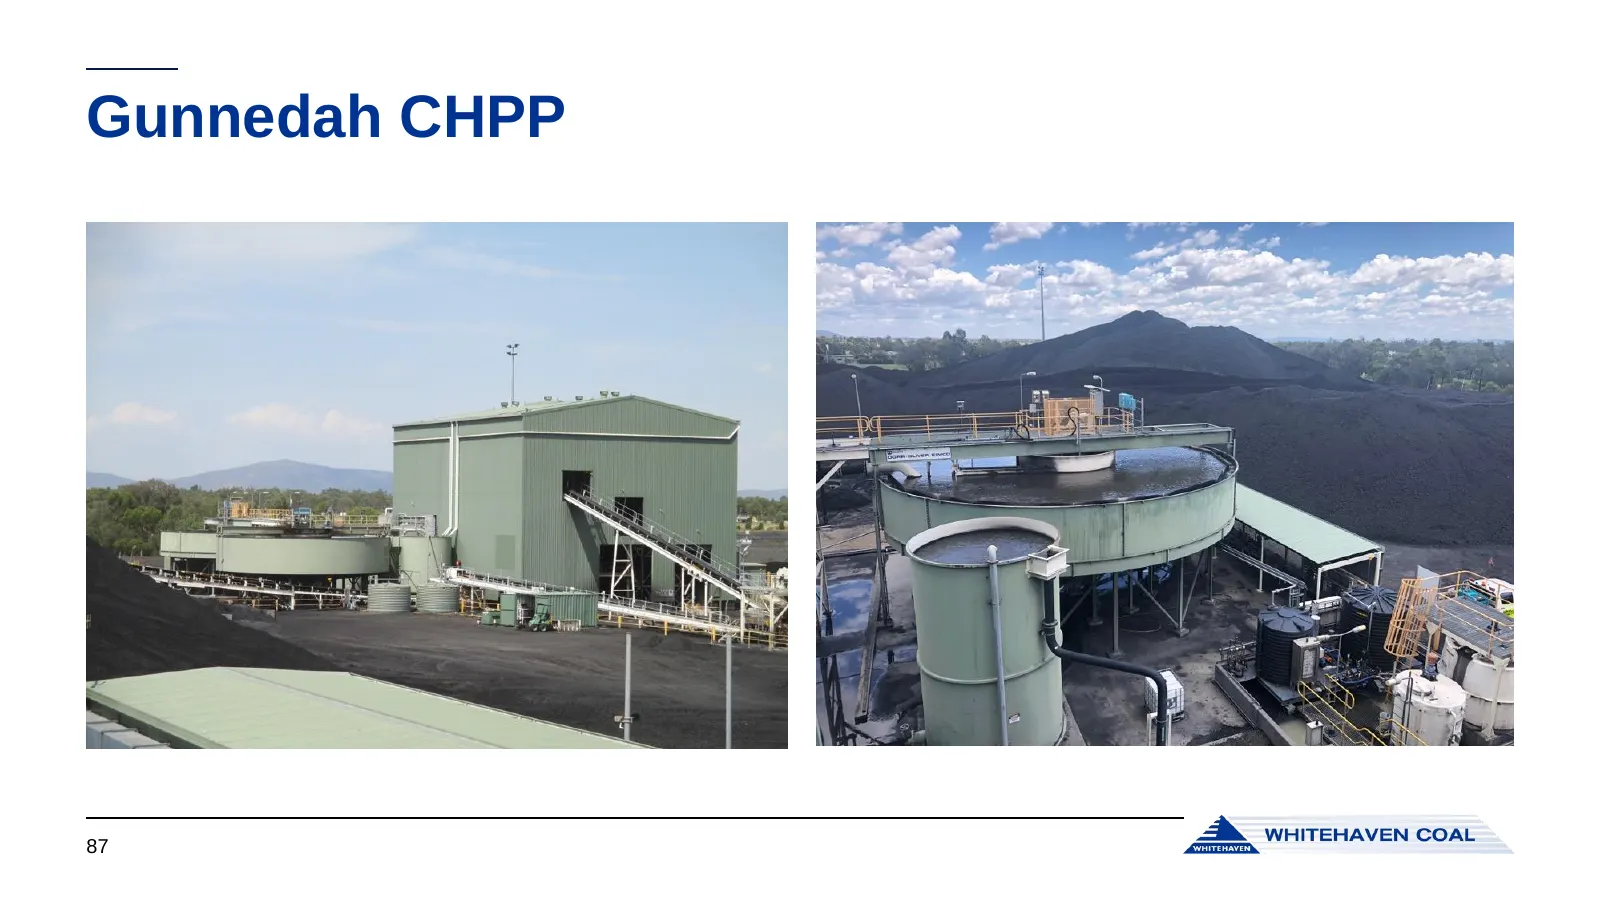
Slide 87: Gunnedah CHPP
Gunnedah CHPP 87
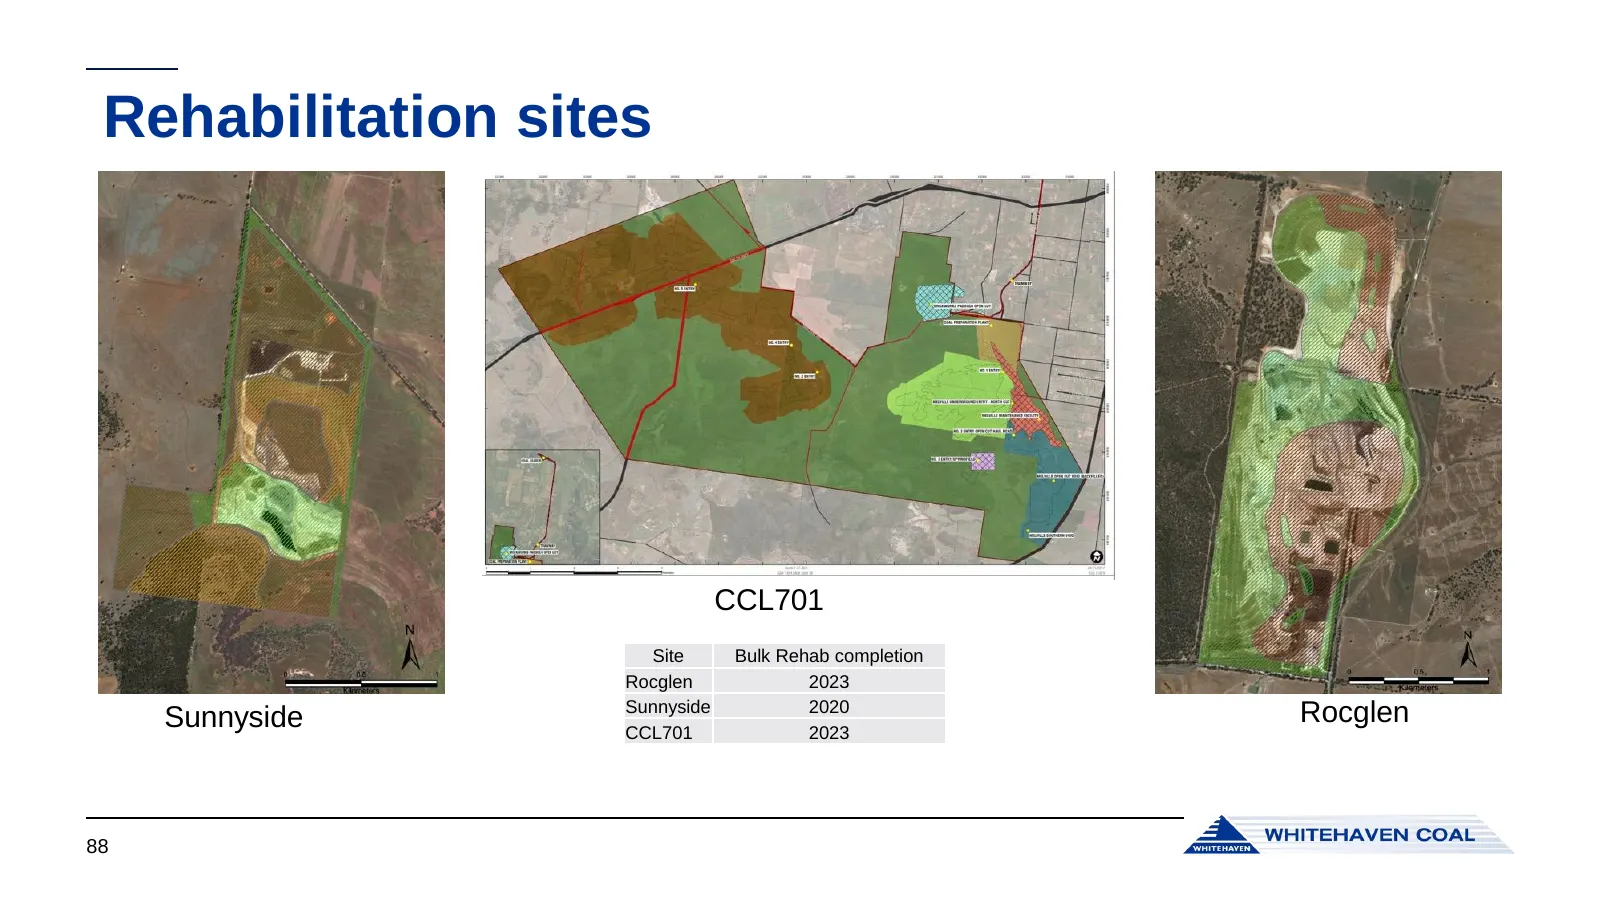
Slide 88: Rehabilitation sites
Rehabilitation sites CCL701 Site Bulk Rehab completion Rocglen 2023 Sunnyside 2020 Rocglen Sunnyside CCL701 2023 88
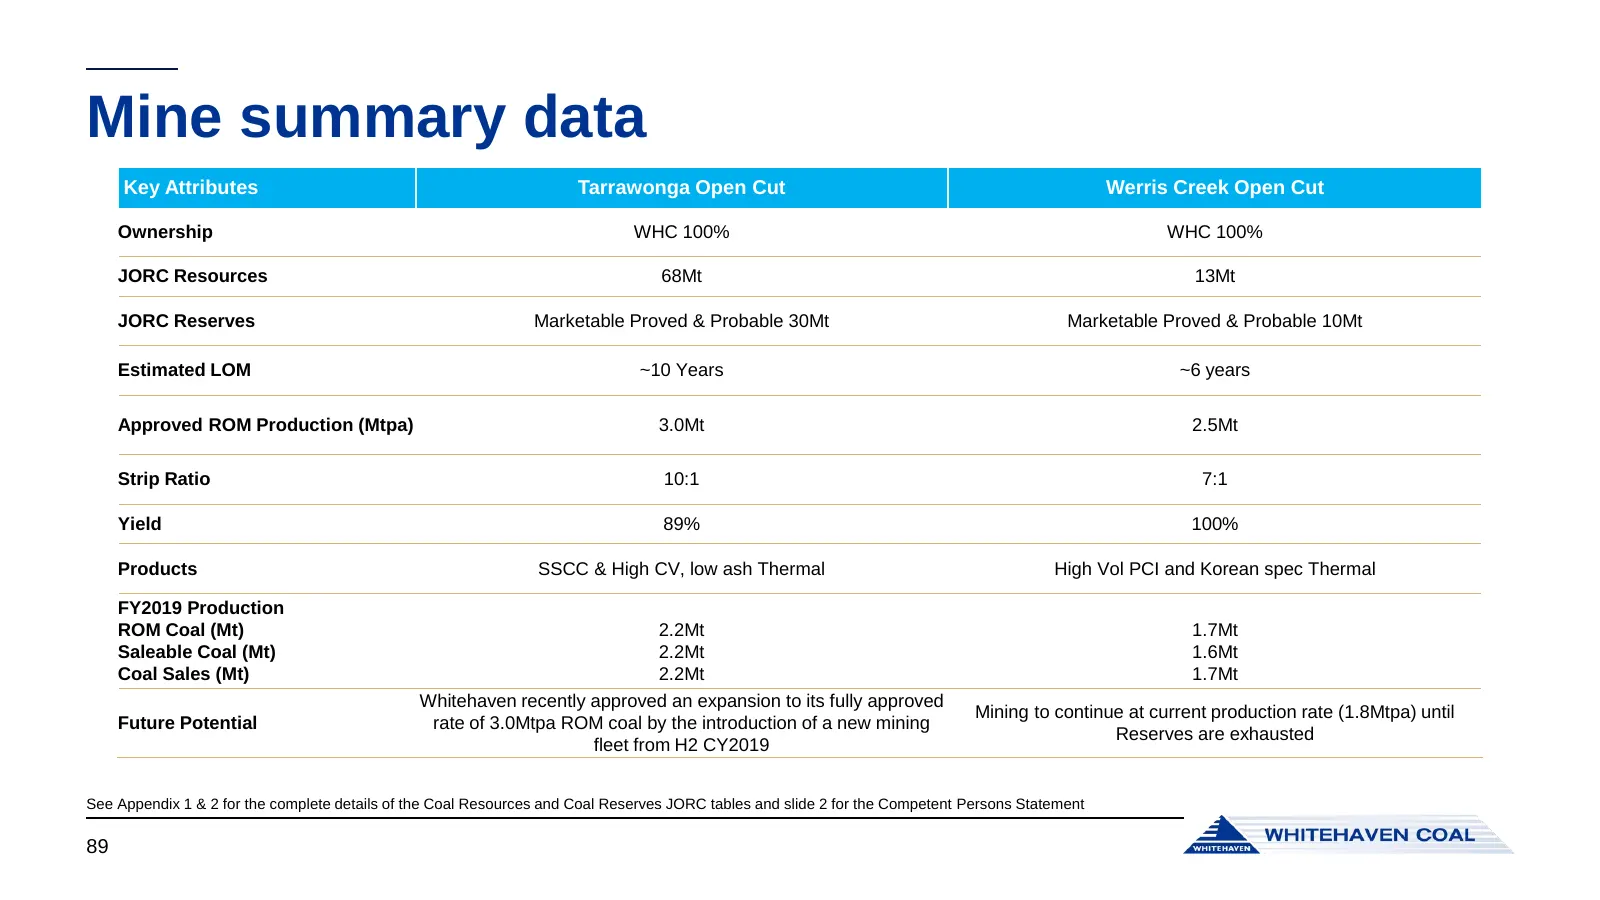
Slide 89: Mine summary data
Mine summary data Key Attributes Tarrawonga Open Cut Werris Creek Open Cut Ownership WHC 100% WHC 100% JORC Resources 68Mt 13Mt JORC Reserves Marketable Proved & Probable 30Mt Marketable Proved & Probable 10Mt Estimated LOM ~10 Years ~6 years Approved ROM Production (Mtpa) 3.0Mt 2.5Mt Strip Ratio 10

Slide 90: Vickery Project
Vickery Project
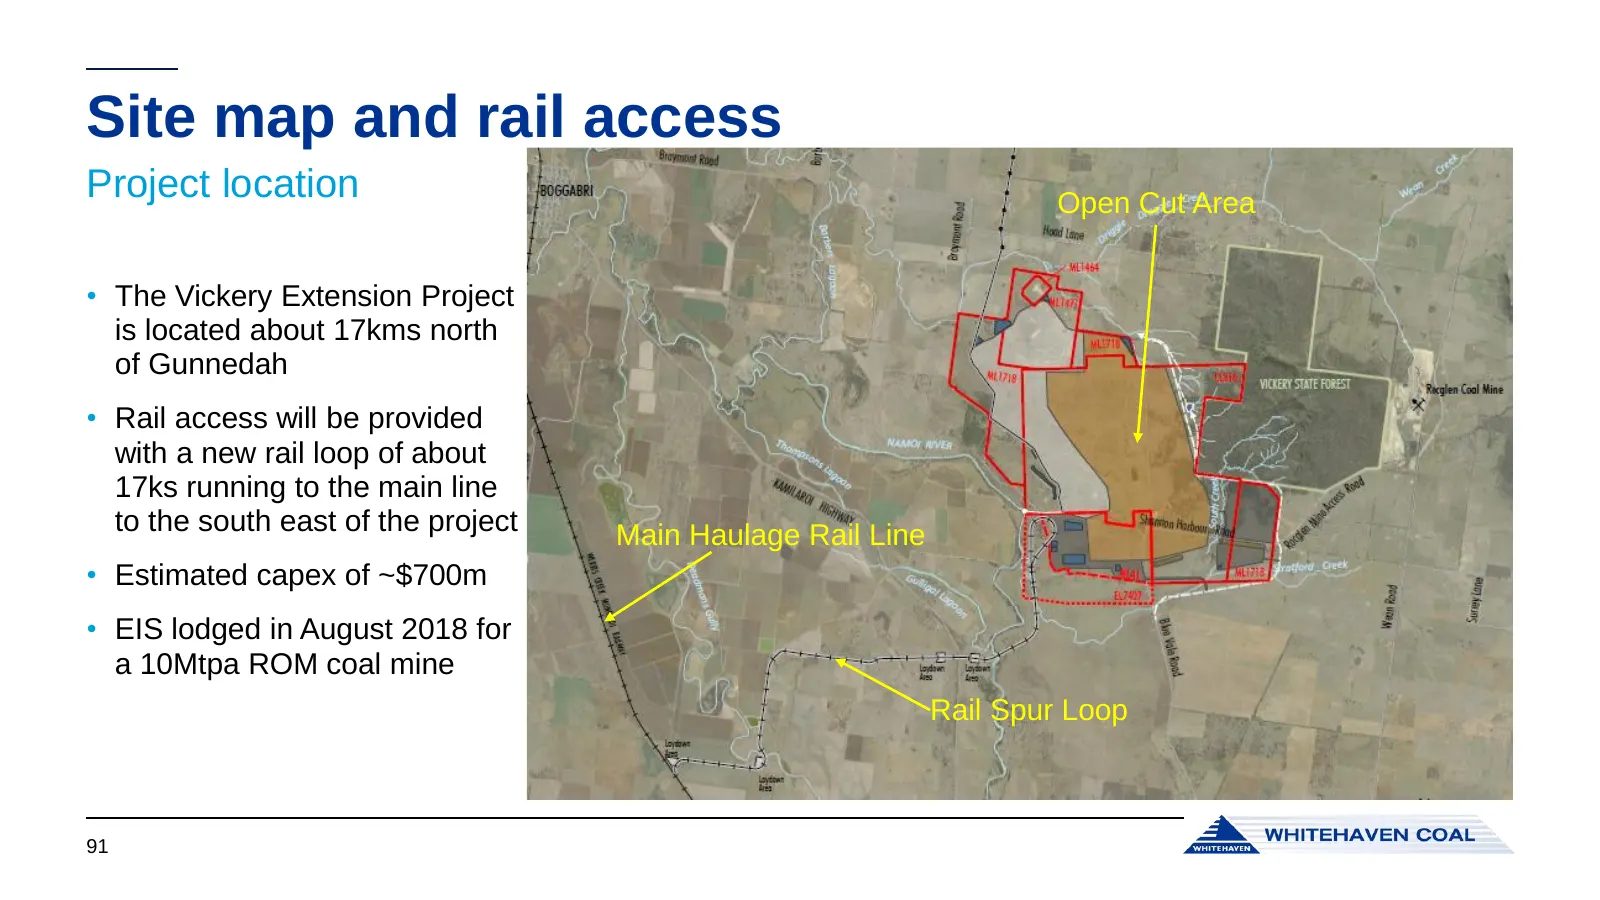
Slide 91: Site map and rail access
Site map and rail access Project location Open Cut Area • The Vickery Extension Project is located about 17kms north of Gunnedah • Rail access will be provided with a new rail loop of about 17ks running to the main line to the south east of the project Main Haulage Rail Line • Estimated capex of ~$7
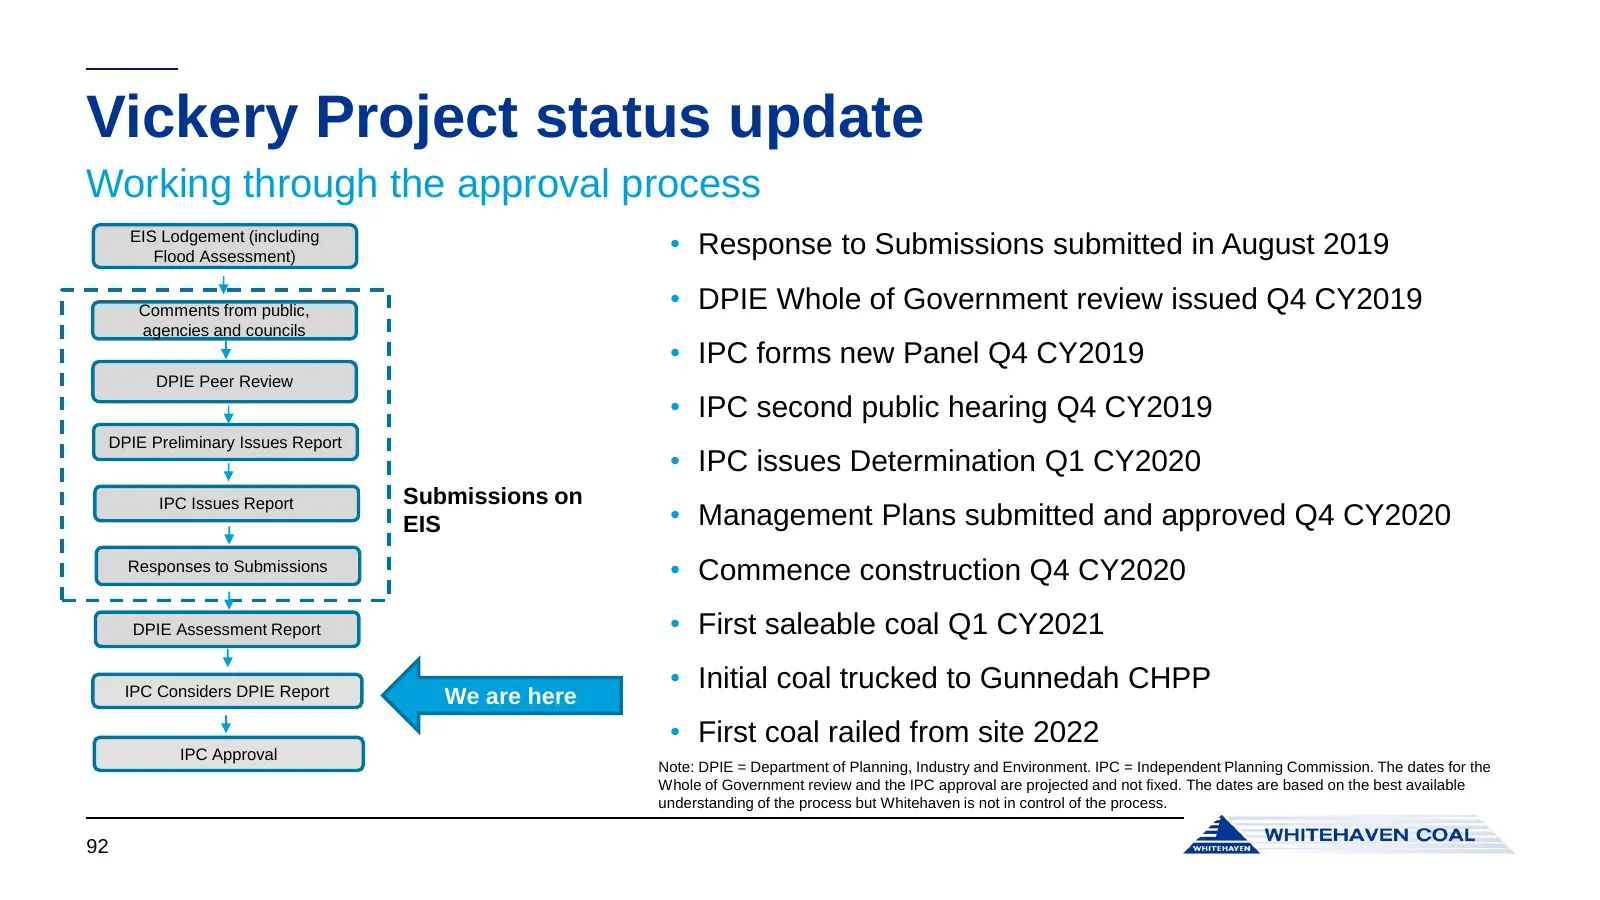
Slide 92: Vickery Project status update
Vickery Project status update Working through the approval process EIS Lodgement (including Flood Assessment) • Response to Submissions submitted in August 2019 Comments from public, • DPIE Whole of Government review issued Q4 CY2019 agencies and councils • IPC forms new Panel Q4 CY2019 DPIE Peer Re
Slide 93: Vickery economics
Vickery economics A robust project at reasonable long term coal prices • JV formation to progress once draft approval conditions issued by the Government are known (likely Q4 CY2019), targeting users of thermal and met coal • Whitehaven will consider developing the project on a 100% basis in order t
Slide 94: Current drilling
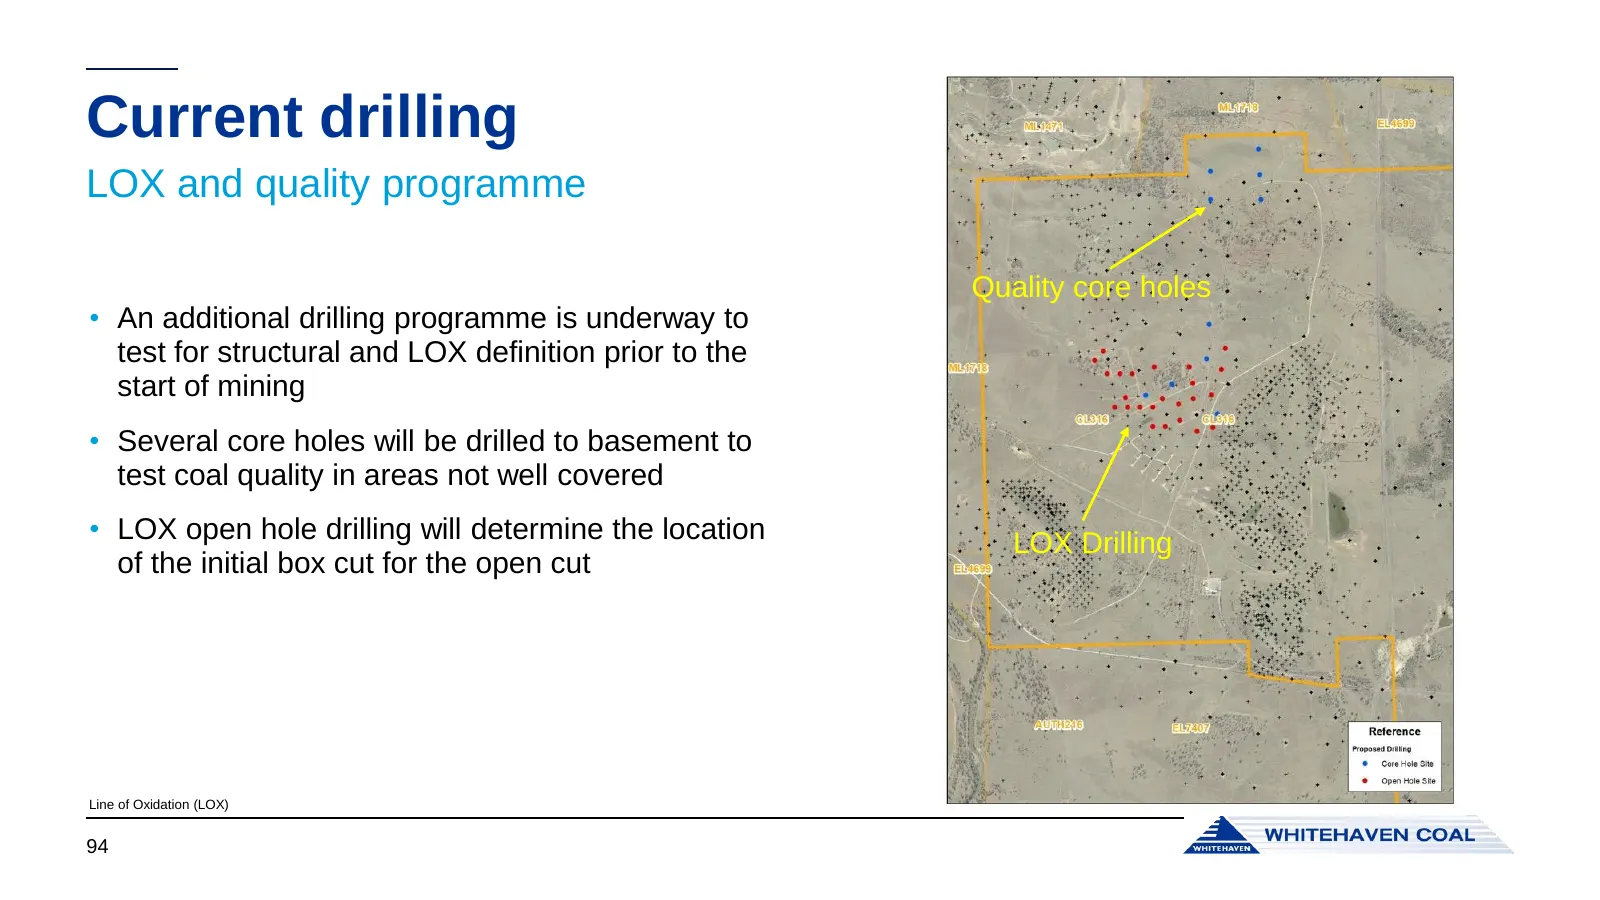
Current drilling LOX and quality programme Quality core holes • An additional drilling programme is underway to test for structural and LOX definition prior to the start of mining • Several core holes will be drilled to basement to test coal quality in areas not well covered • LOX open hole drilling
Slide 95: Stratigraphy and quality
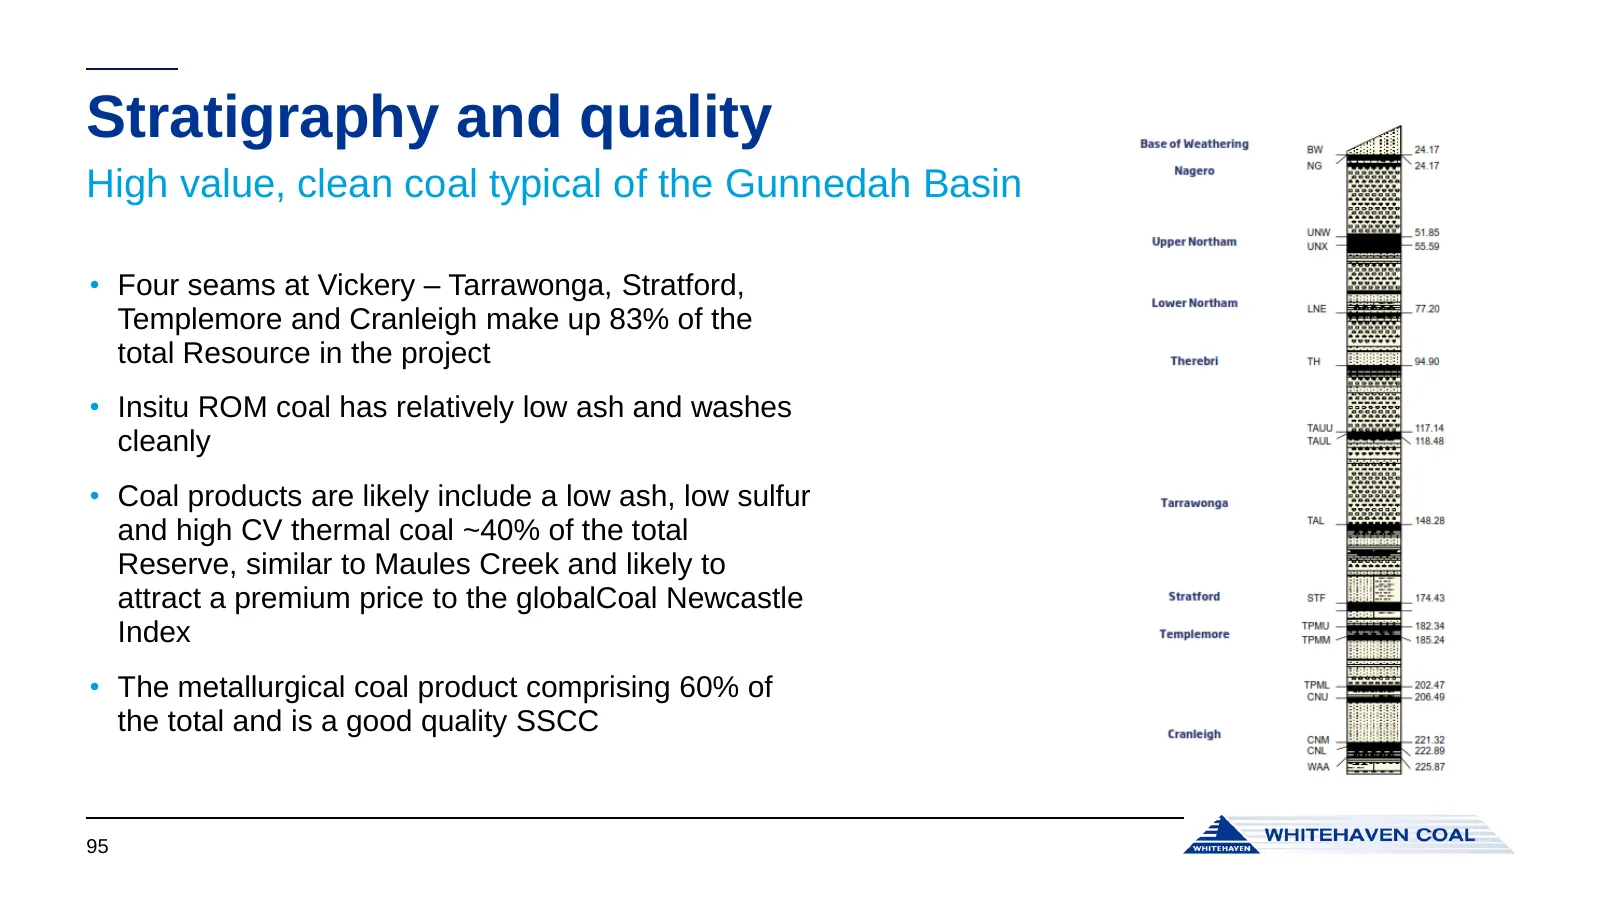
Stratigraphy and quality High value, clean coal typical of the Gunnedah Basin • Four seams at Vickery – Tarrawonga, Stratford, Templemore and Cranleigh make up 83% of the total Resource in the project • Insitu ROM coal has relatively low ash and washes cleanly • Coal products are likely include a lo
Slide 96: Mine Development
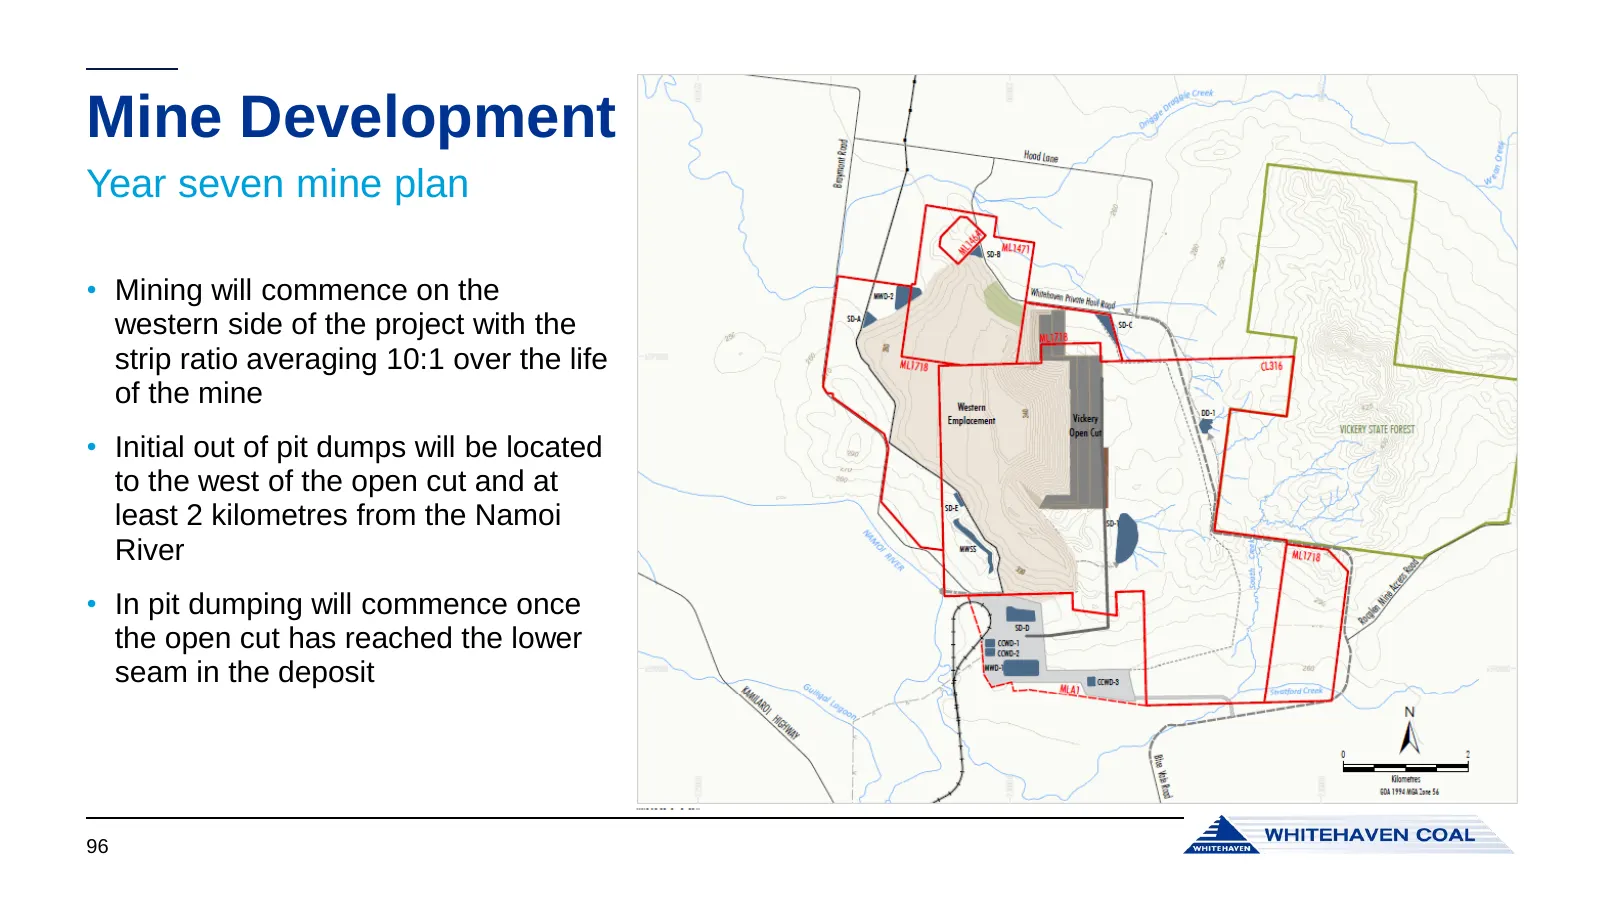
Mine Development Year seven mine plan • Mining will commence on the western side of the project with the strip ratio averaging 10:1 over the life of the mine • Initial out of pit dumps will be located to the west of the open cut and at least 2 kilometres from the Namoi River • In pit dumping will co
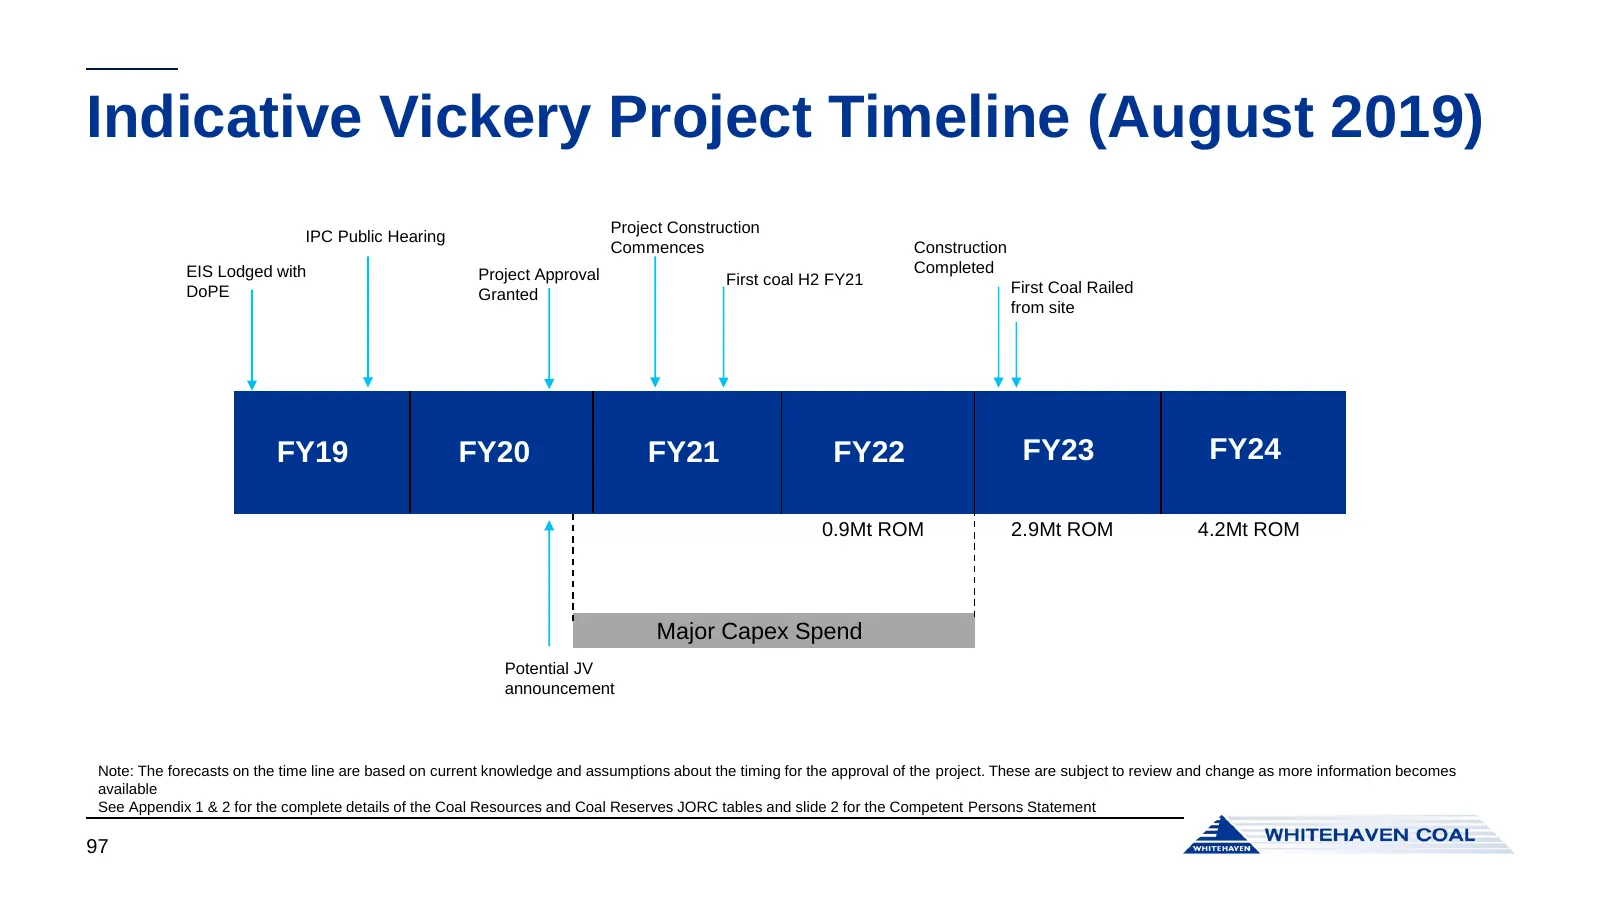
Slide 97: Indicative Vickery Project Timeline (August 2019)
Indicative Vickery Project Timeline (August 2019) Project Construction IPC Public Hearing Commences Construction EIS Lodged with Project Approval Completed First coal H2 FY21 First Coal Railed DoPE Granted from site FY19 FY20 FY21 FY22 FY23 FY24 0.9Mt ROM 2.9Mt ROM 4.2Mt ROM Major Capex Spend Potent
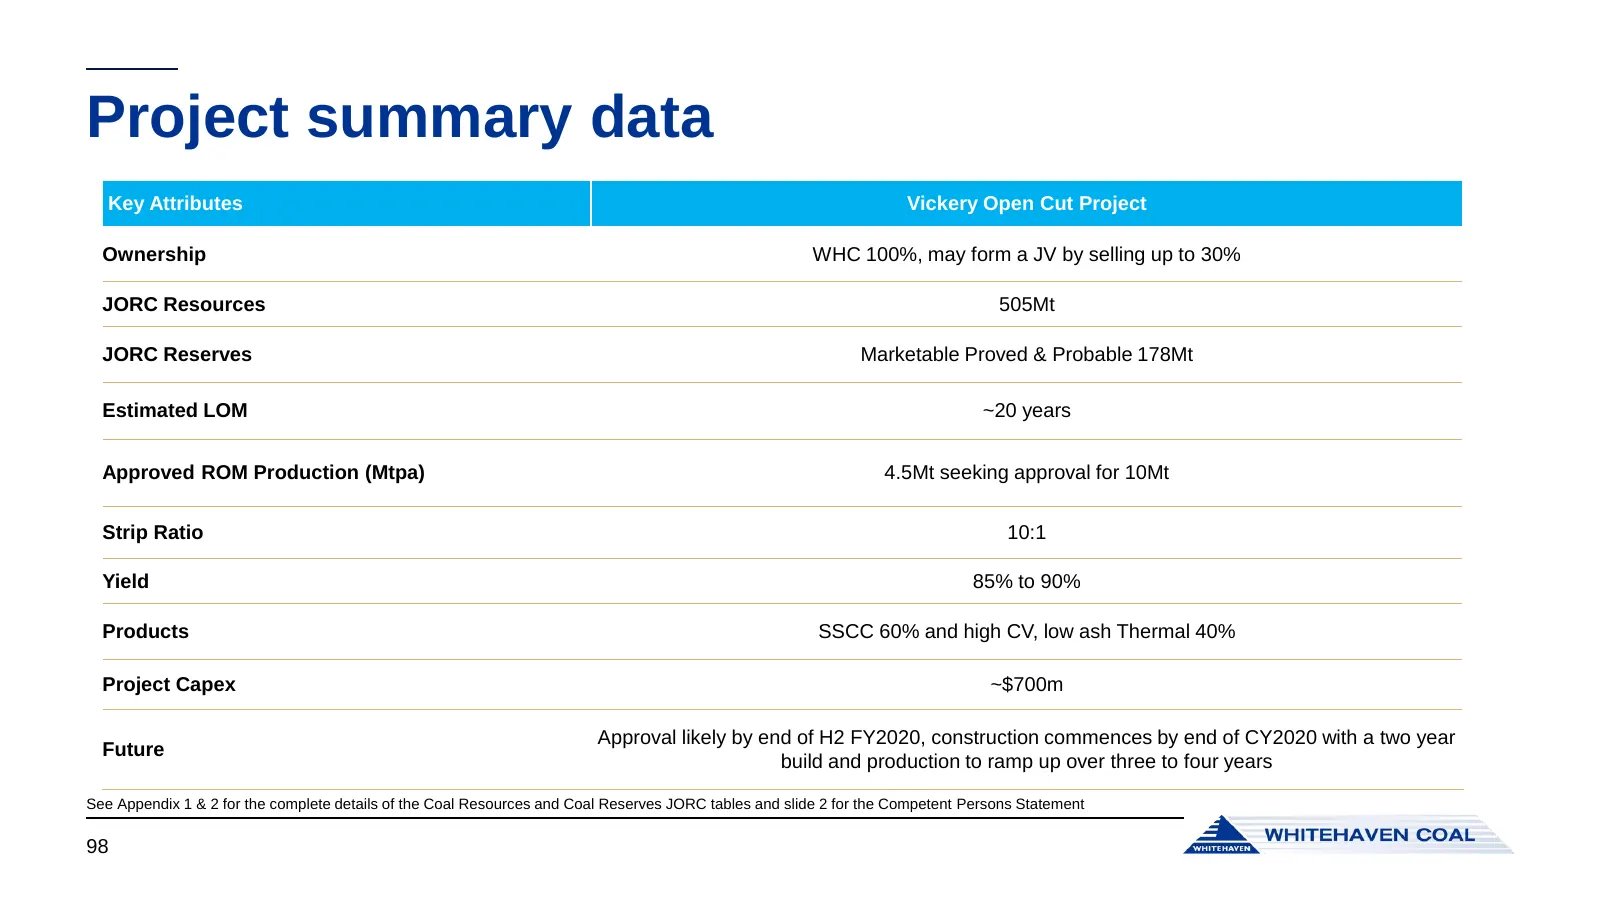
Slide 98: Project summary data
Project summary data Key Attributes Vickery Open Cut Project Ownership WHC 100%, may form a JV by selling up to 30% JORC Resources 505Mt JORC Reserves Marketable Proved & Probable 178Mt Estimated LOM ~20 years Approved ROM Production (Mtpa) 4.5Mt seeking approval for 10Mt Strip Ratio 10:1 Yield 85%
Slide 99: Winchester South Project
Winchester South Project
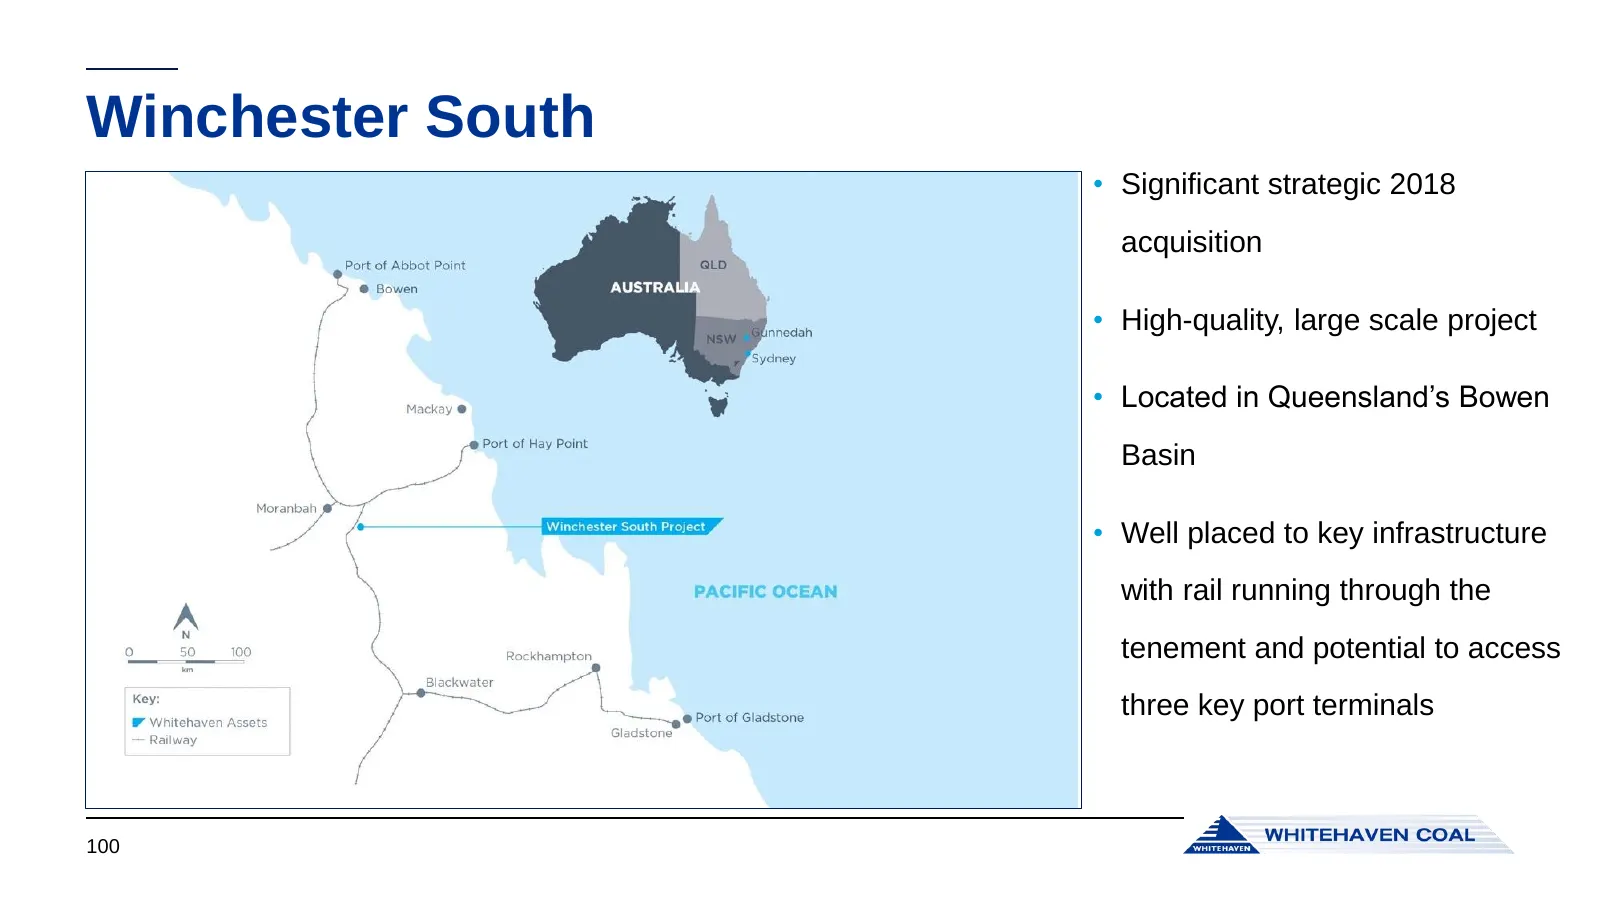
Slide 100: Winchester South
Winchester South • Significant strategic 2018 acquisition • High-quality, large scale project • Located in Queensland’s Bowen Basin • Well placed to key infrastructure with rail running through the tenement and potential to access three key port terminals 100
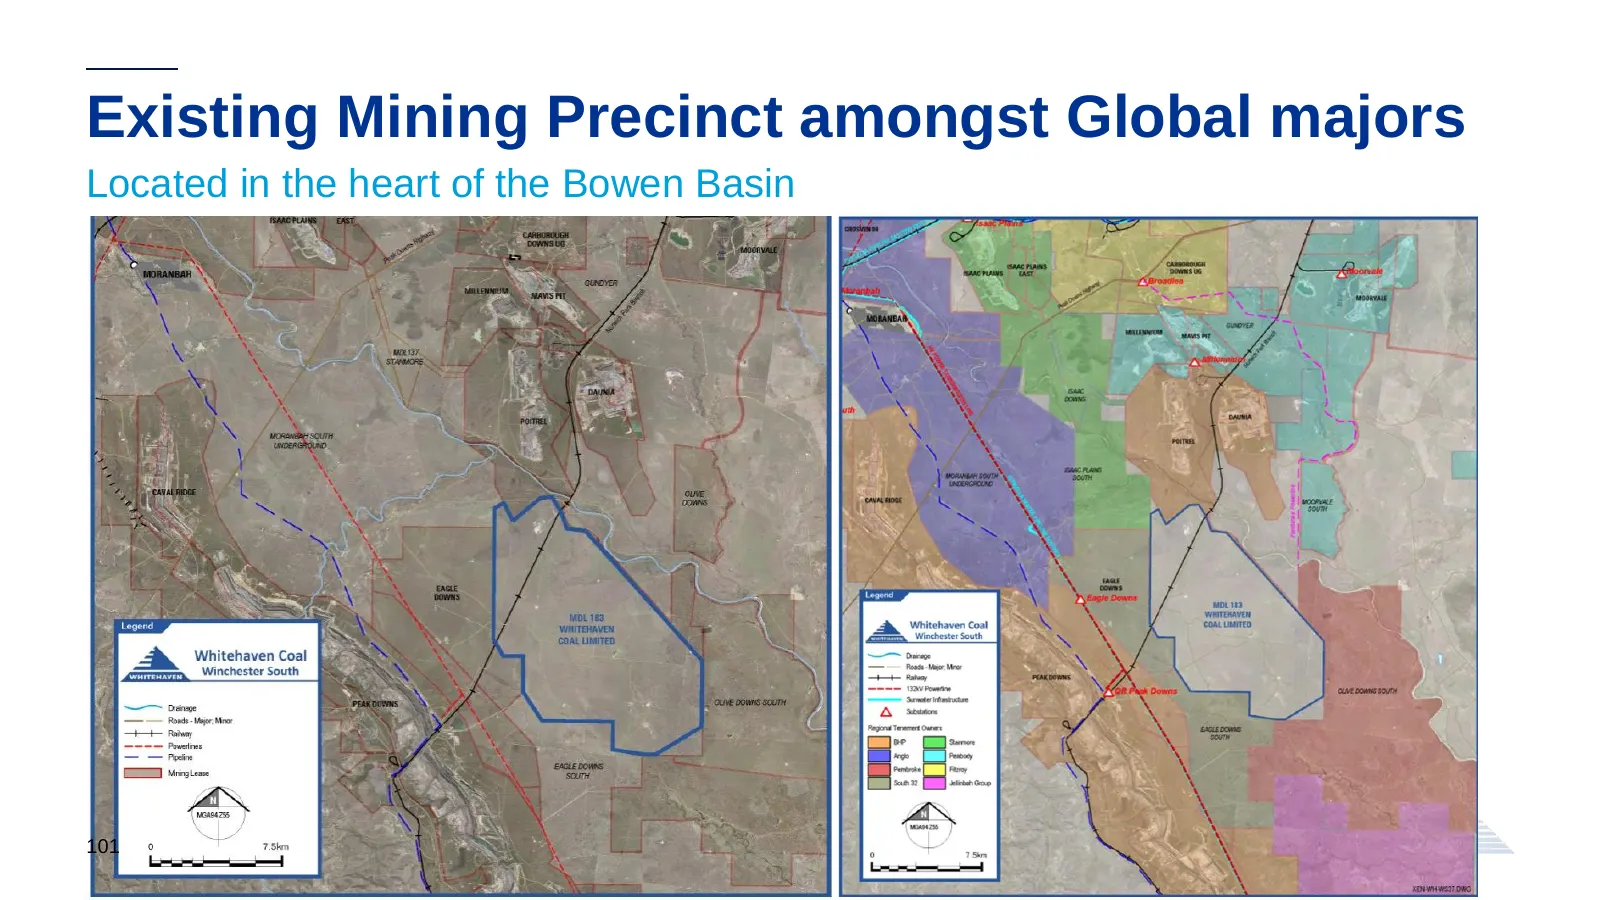
Slide 101: Existing Mining Precinct amongst Global majors
Existing Mining Precinct amongst Global majors Located in the heart of the Bowen Basin 101
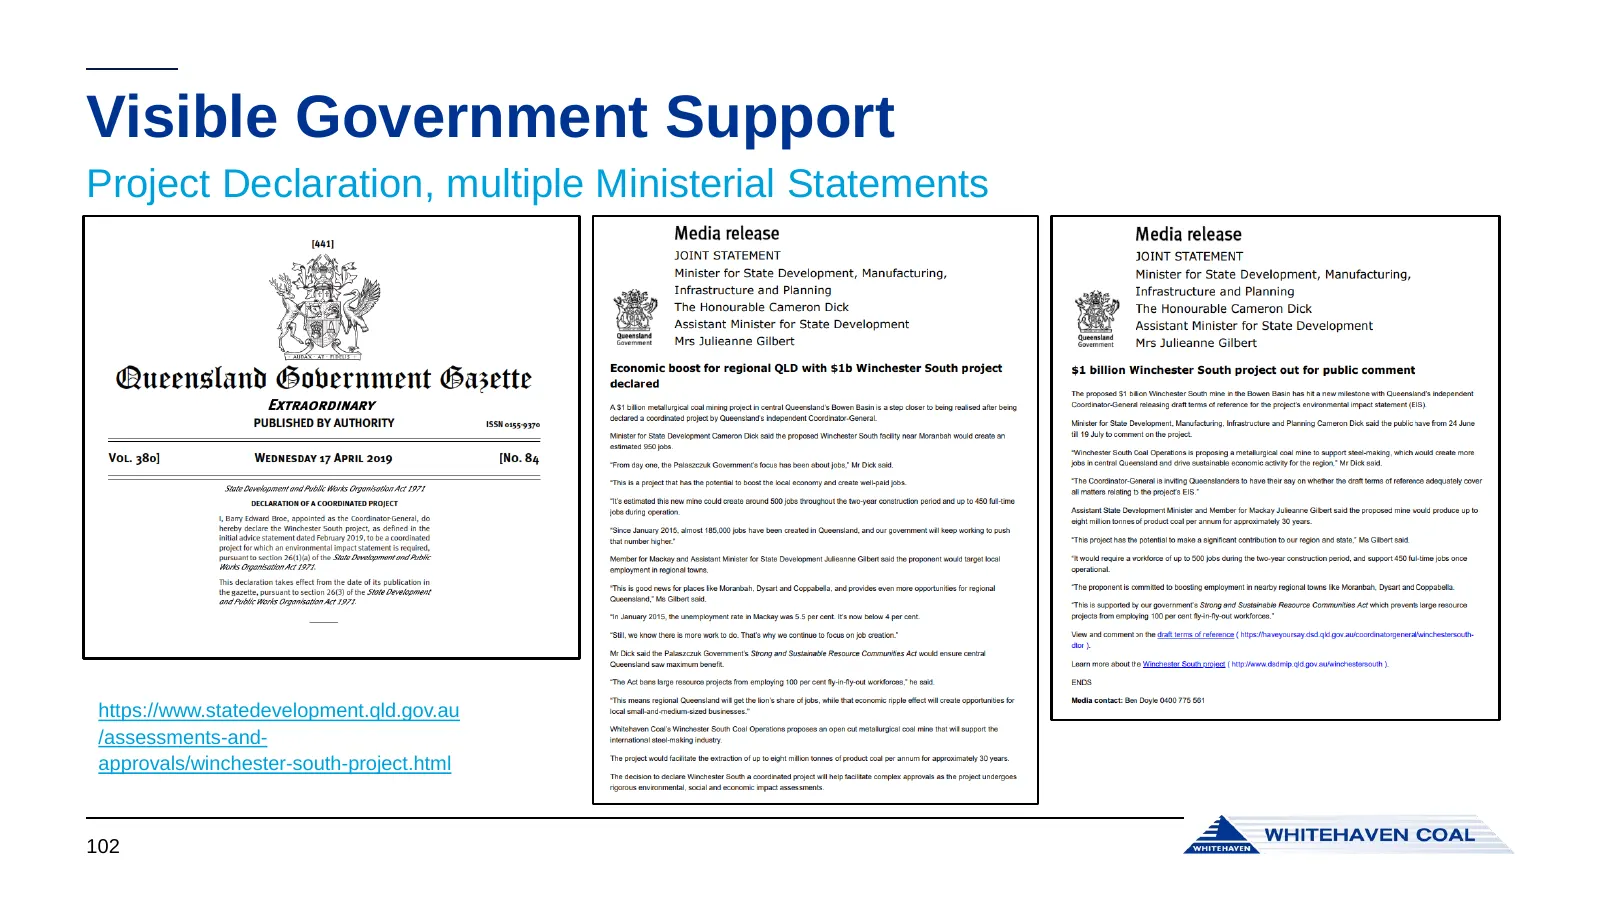
Slide 102: Visible Government Support
Visible Government Support Project Declaration, multiple Ministerial Statements https://www.statedevelopment.qld.gov.au /assessments-and- approvals/winchester-south-project.html 102
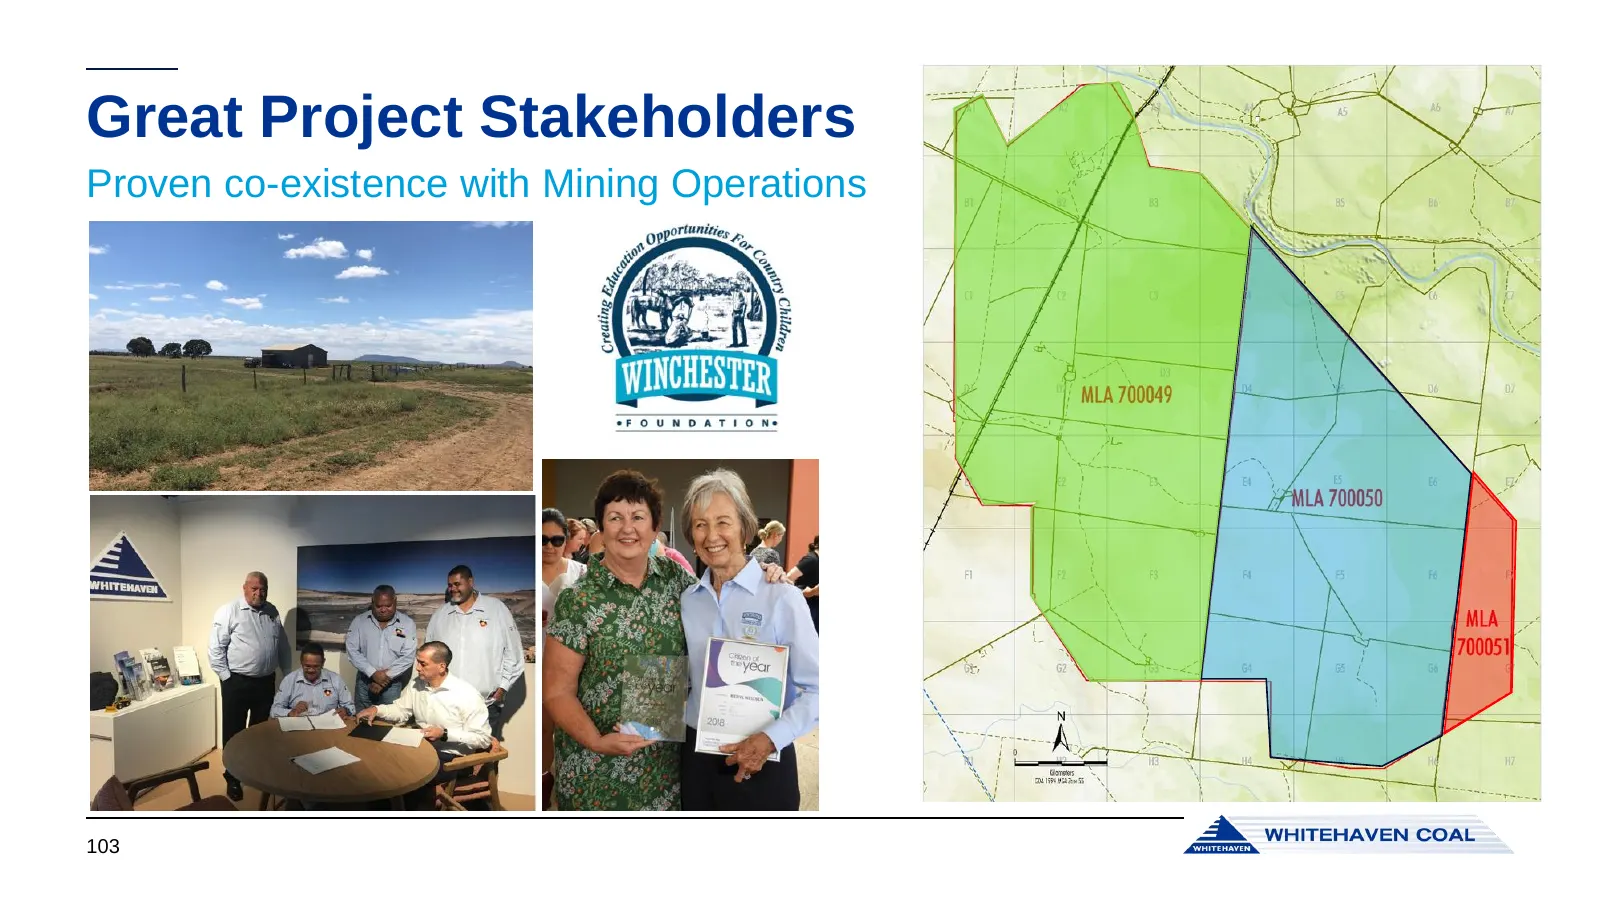
Slide 103: Great Project Stakeholders
Great Project Stakeholders Proven co-existence with Mining Operations 103
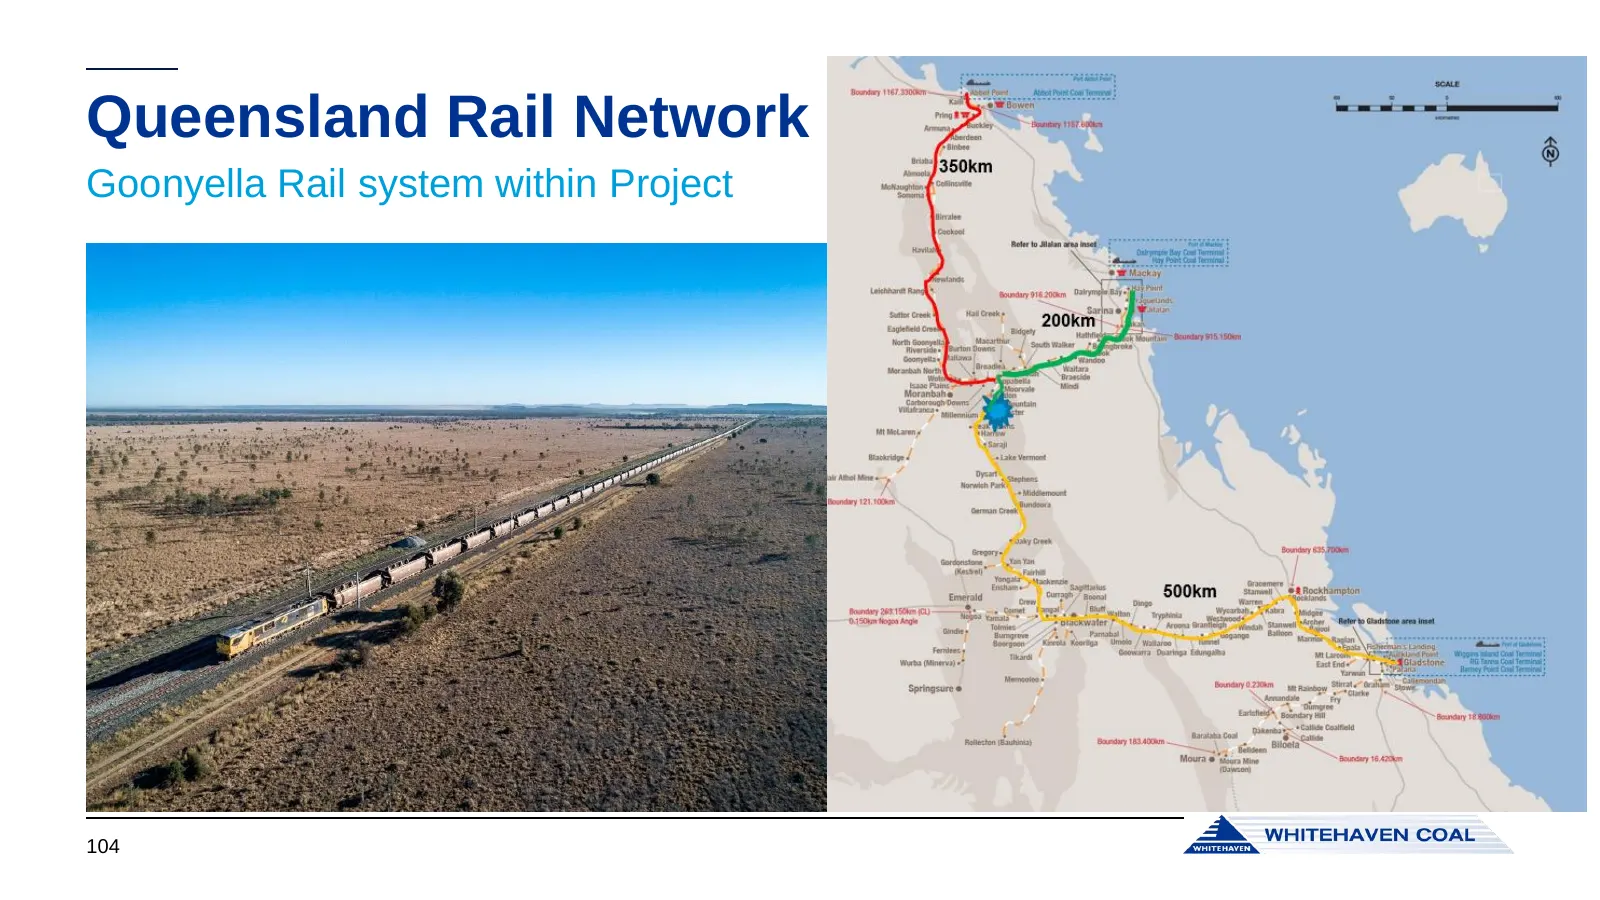
Slide 104: Queensland Rail Network
Queensland Rail Network Goonyella Rail system within Project 104
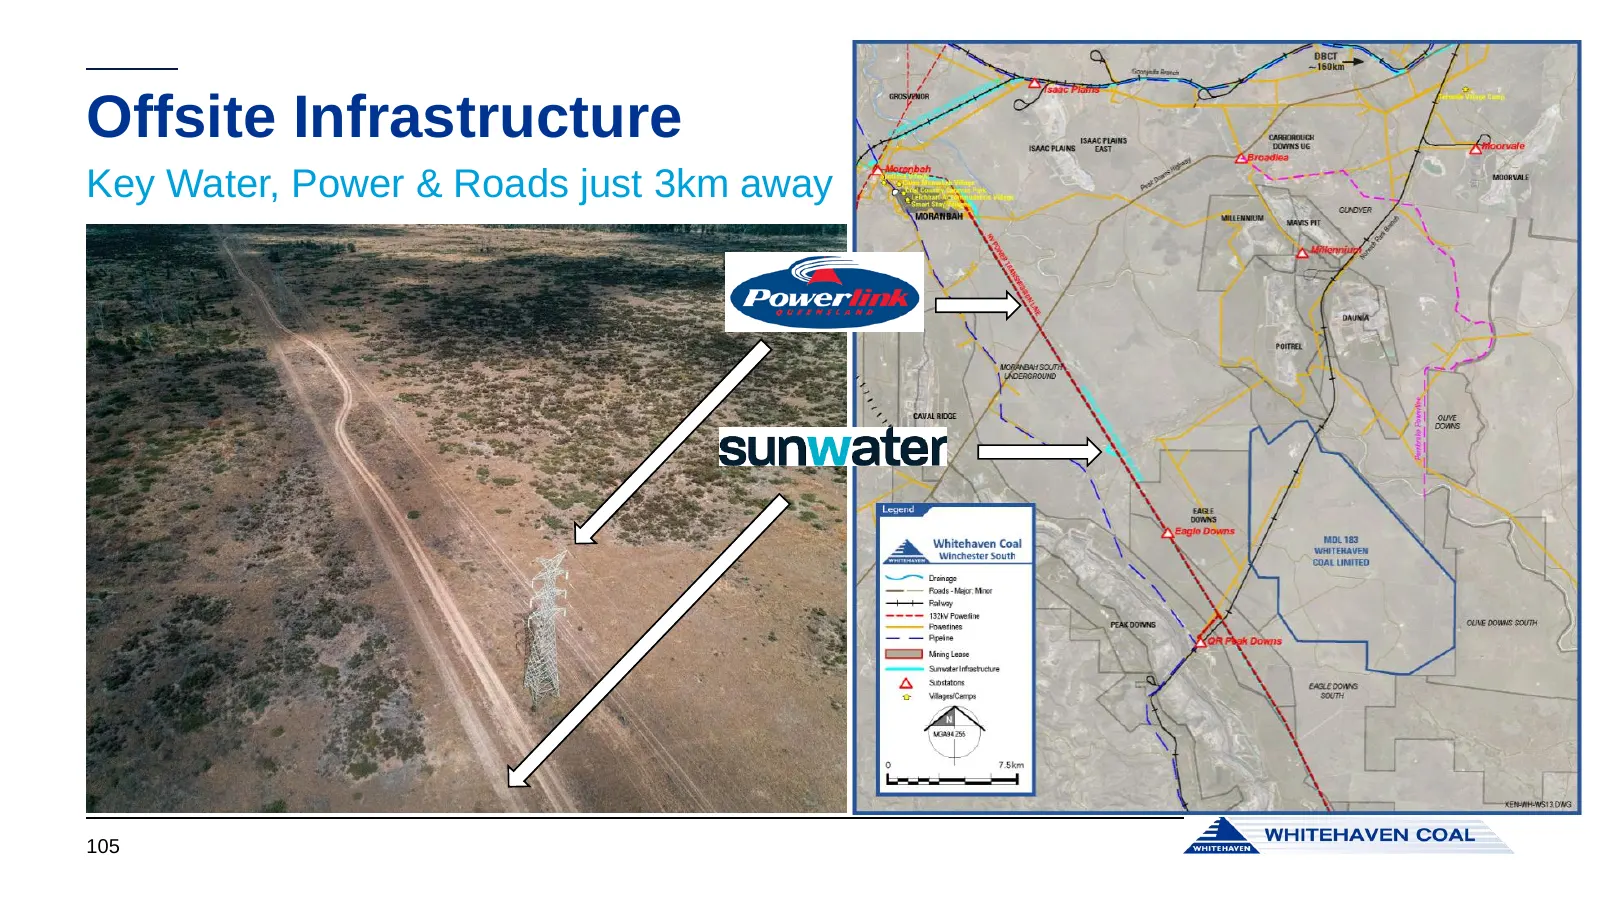
Slide 105: Offsite Infrastructure
Offsite Infrastructure Key Water, Power & Roads just 3km away 105
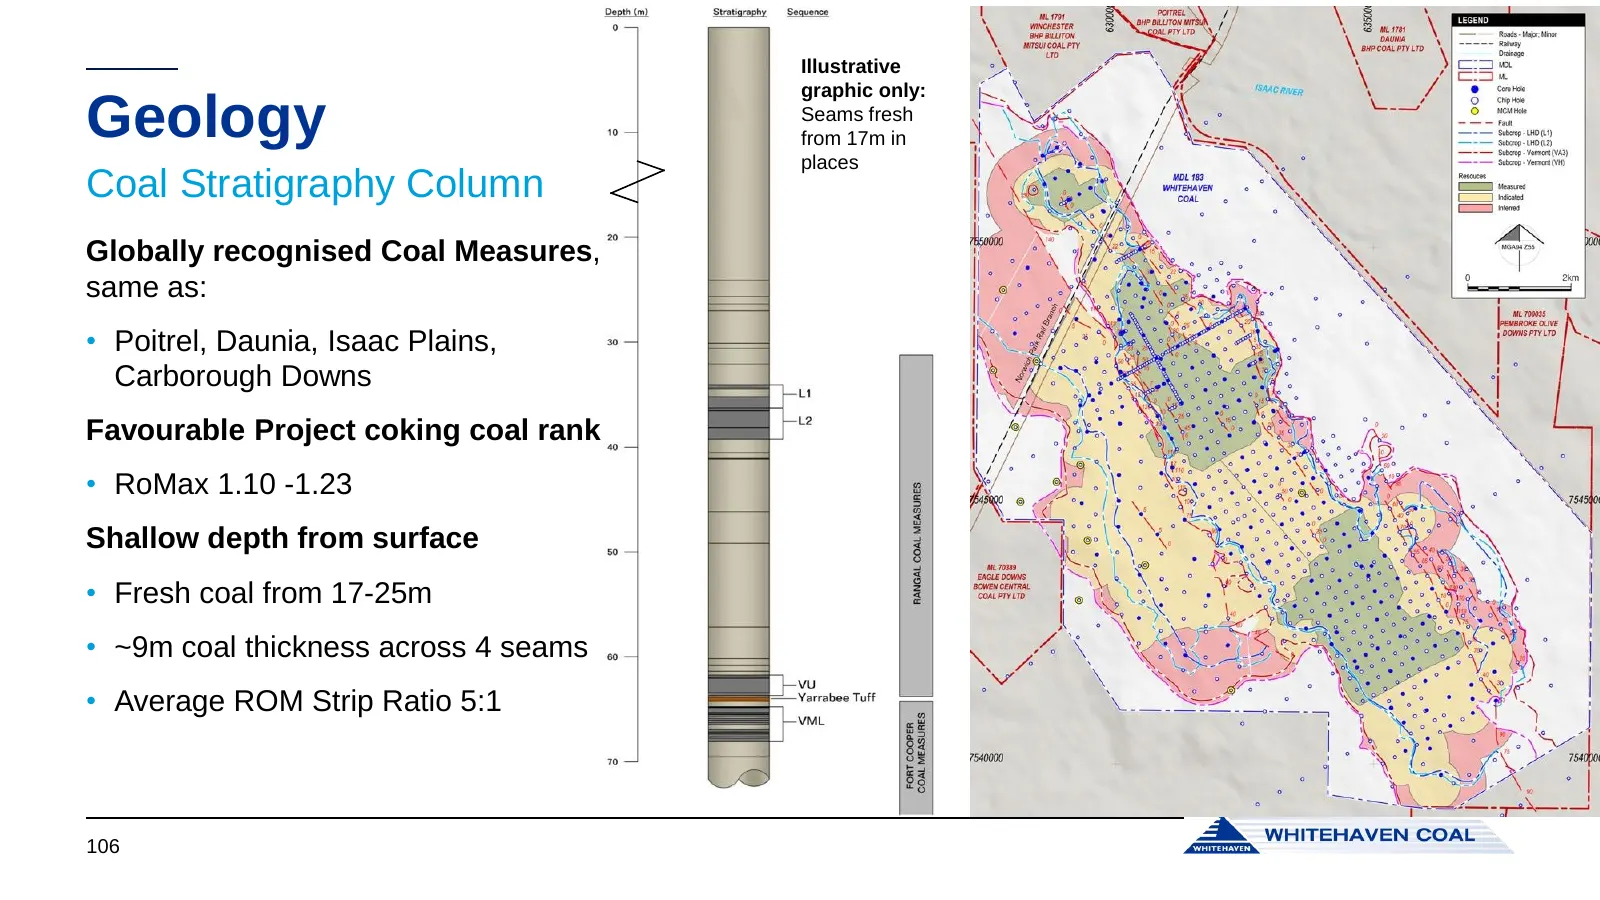
Slide 106: Geology
Illustrative graphic only: Geology Seams fresh from 17m in places Coal Stratigraphy Column Globally recognised Coal Measures, same as: • Poitrel, Daunia, Isaac Plains, Carborough Downs Favourable Project coking coal rank • RoMax 1.10 -1.23 Shallow depth from surface • Fresh coal from 17-25m • ~9m co
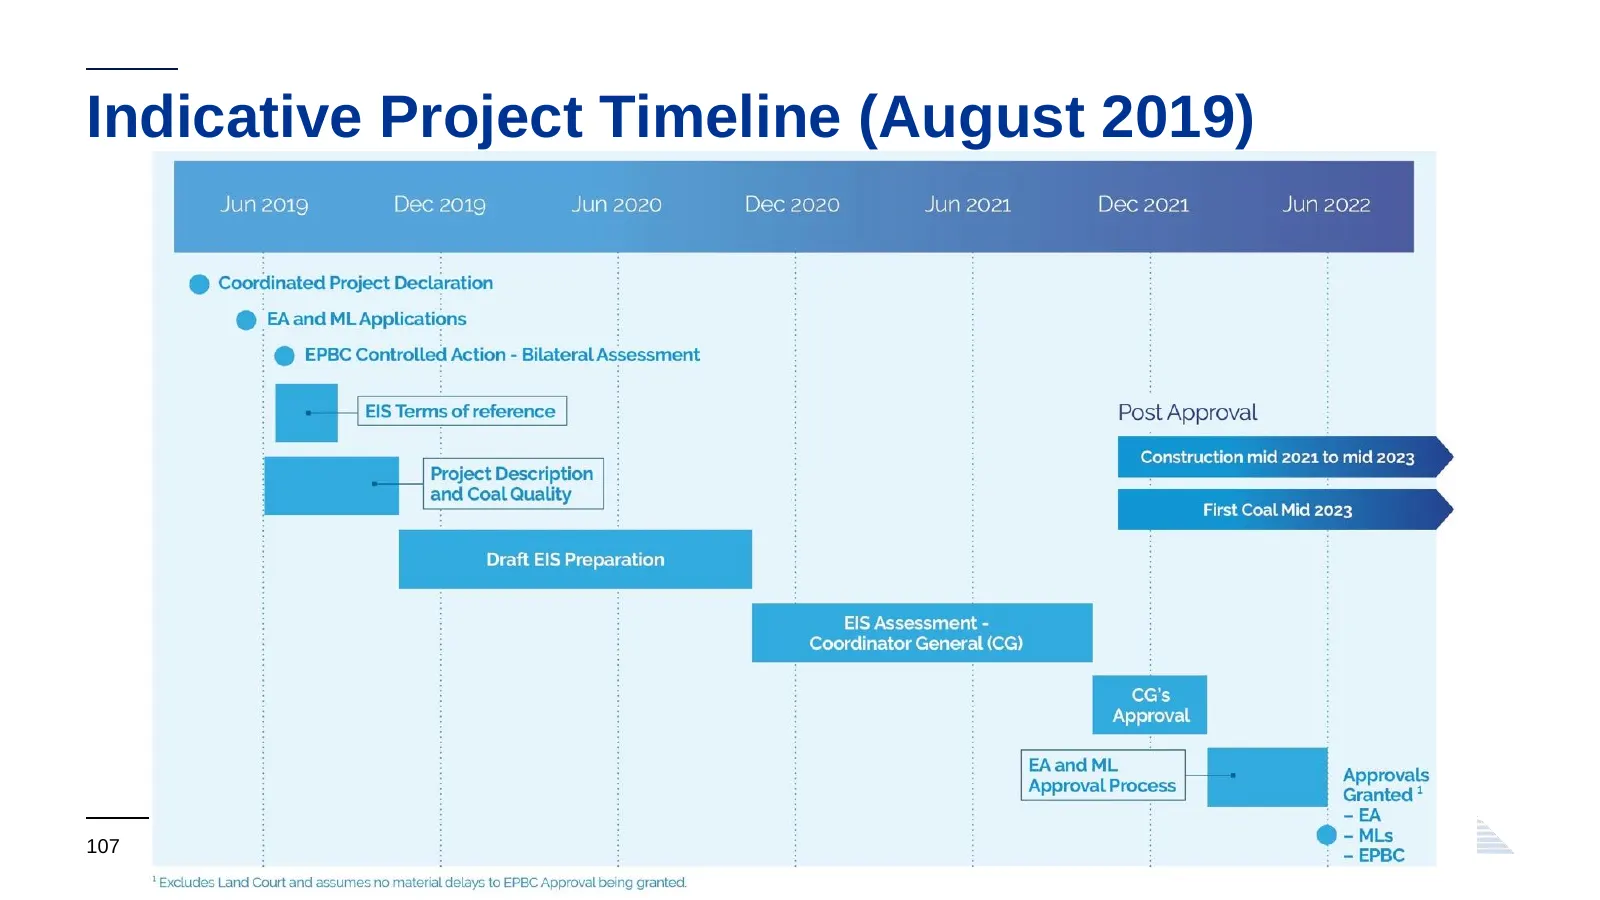
Slide 107: Indicative Project Timeline (August 2019)
Indicative Project Timeline (August 2019) 107
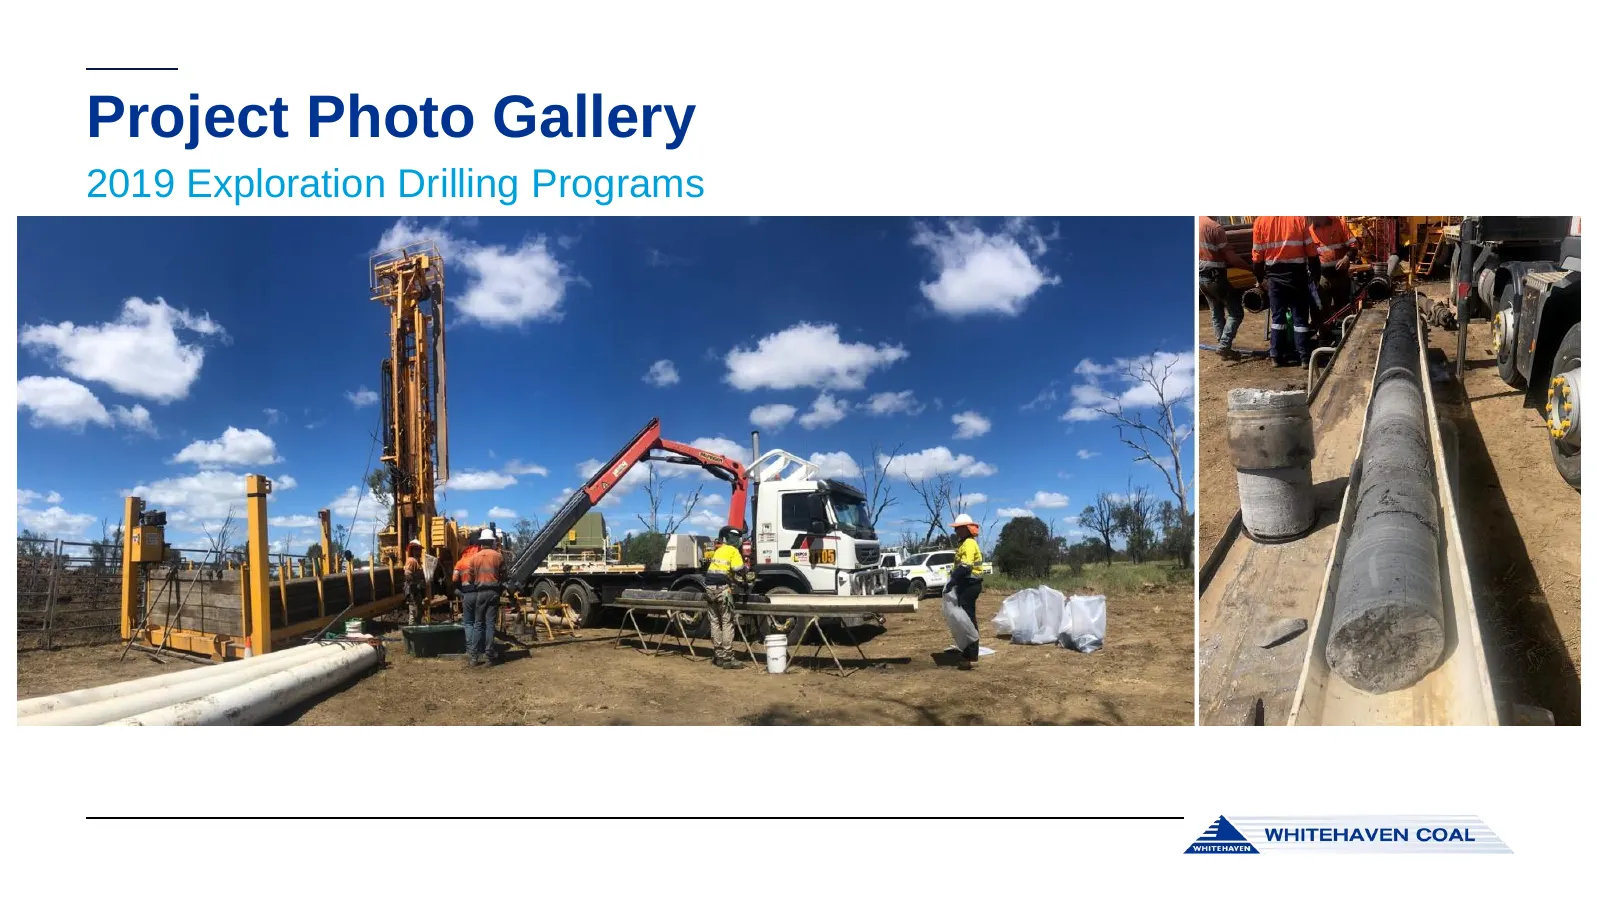
Slide 108: Project Photo Gallery
Project Photo Gallery 2019 Exploration Drilling Programs
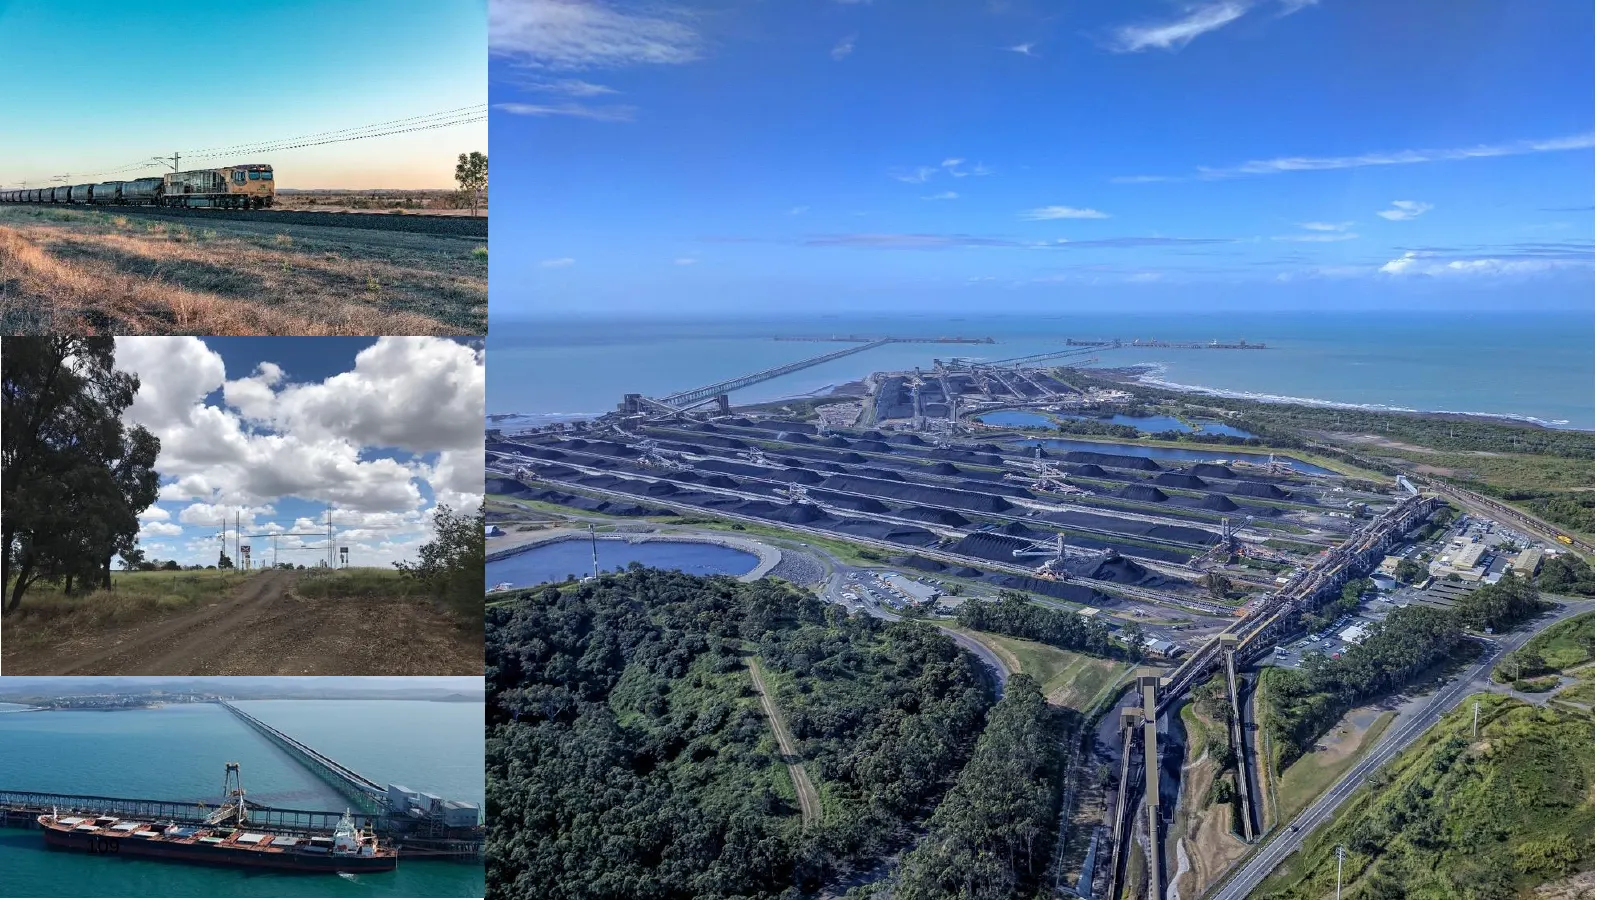
Slide 109: 109
109
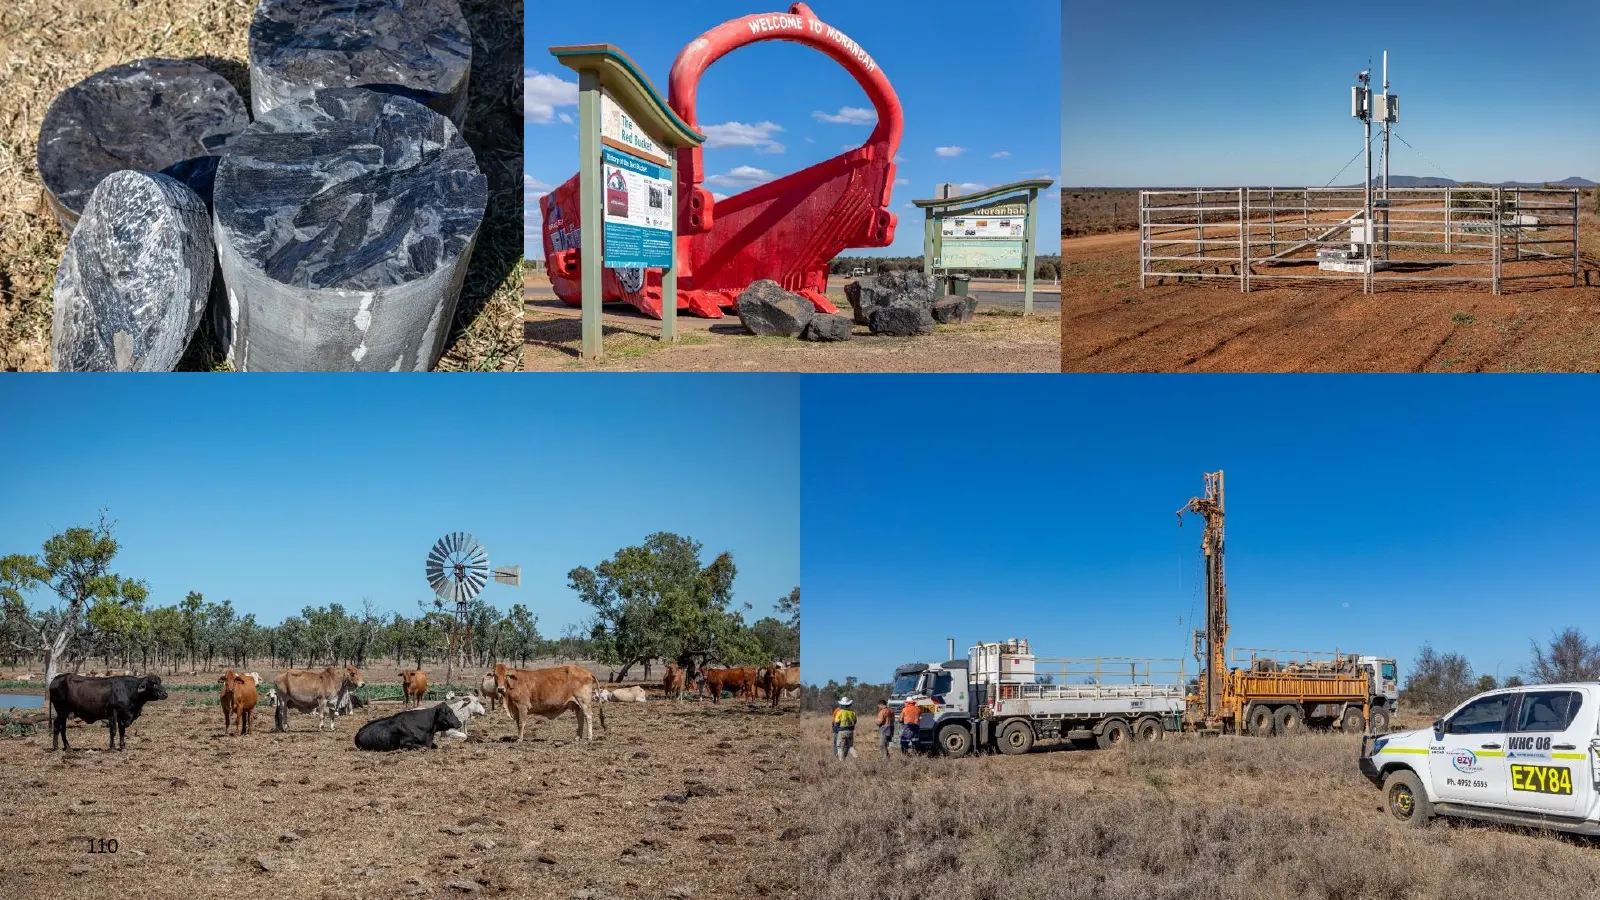
Slide 110: 110
110
Slide 111: Thank you
Thank you www.whitehavencoal.com.au
Source: ASX announcement via 6ix News
More decks from Whitehaven Coal Limited
 Shareholder Meeting (November 2026)20 slides · Nov 5, 2026
 FY2026 Earnings Presentation46 slides · Aug 19, 2026
 H1 FY26 Earnings Presentation48 slides · Feb 19, 2026
 Shareholder Meeting (October 2025)16 slides · Oct 30, 2025
 Shareholder Meeting (October 2025)25 slides · Oct 30, 2025
 FY25 Earnings Presentation50 slides · Aug 21, 2025