Cooper Tire & Rubber — Q1 2020 Earnings Presentation
13 slides from Cooper Tire & Rubber's earnings presentation, May 7, 2020
Slide 1: Company Update First Quarter 2020
Company Update First Quarter 2020 May 7, 2020
Slide 2: Safe Harbor Statement
Safe Harbor Statement This presentation contains what the company believes are forward-looking statements related to future financial results and business operations for Cooper Tire & Rubber Company. Actual results may differ materially from current management forecasts and projections as a result o
Slide 3: Available Information
Available Information You can find Cooper Tire on the web at coopertire.com. Our company webcasts earnings calls and presentations from certain events that we participate in or host on the investor relations portion of our website (http://coopertire.com/investors.aspx). In addition, we also make ava
Slide 4: Three Months Ended March 31, 2020 Financial Performance Highlights
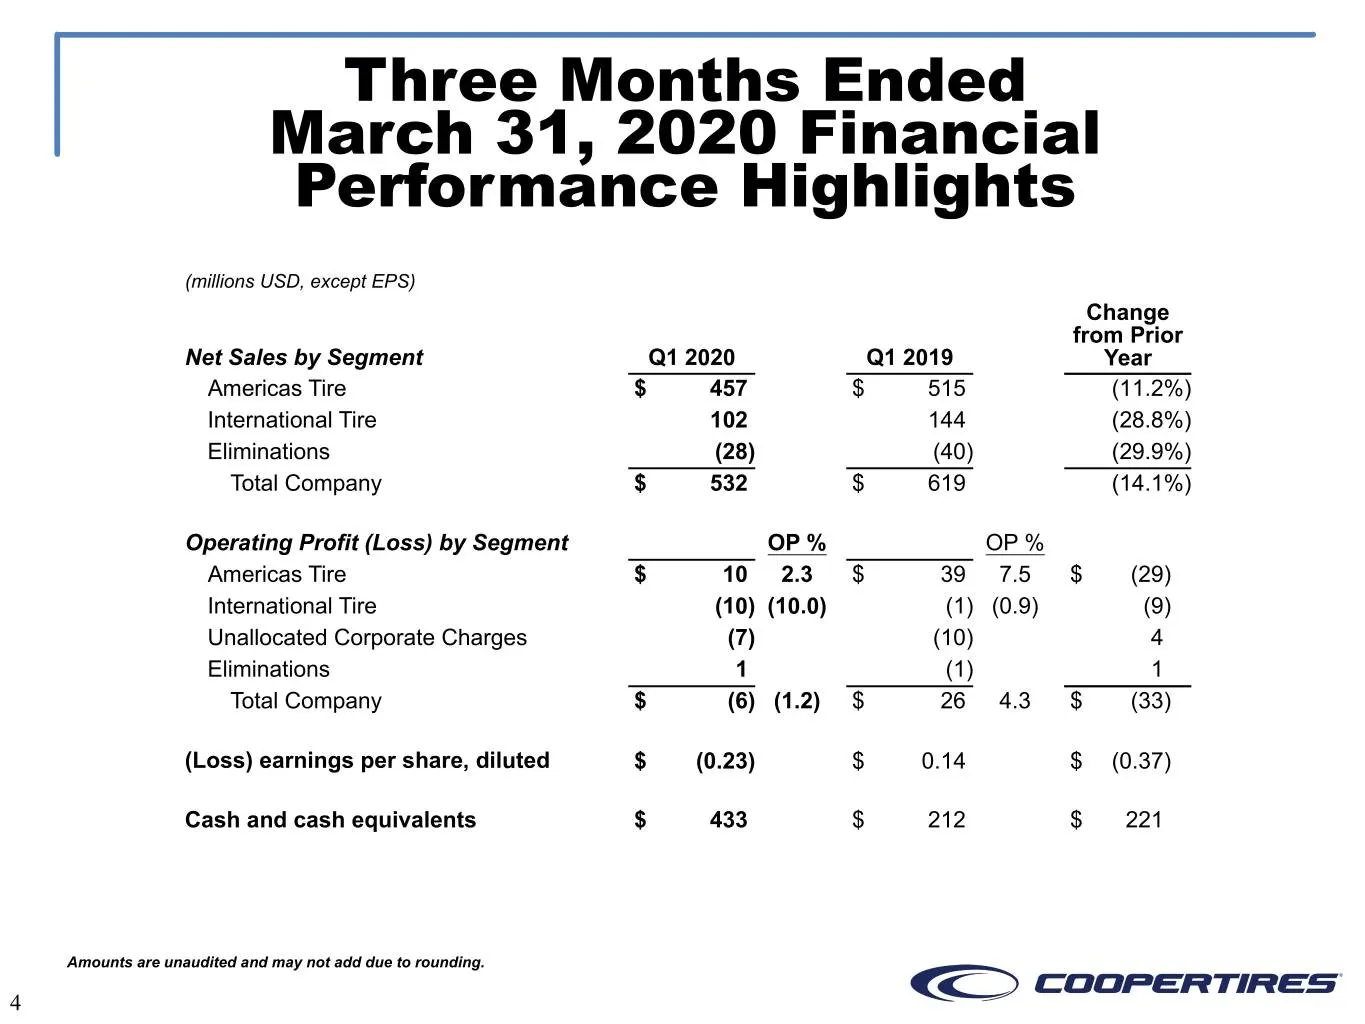
Three Months Ended March 31, 2020 Financial Performance Highlights (millions USD, except EPS) Change from Prior Net Sales by Segment Q1 2020 Q1 2019 Year Americas Tire $ 457 $ 515 (11.2%) International Tire 102 144 (28.8%) Eliminations (28) (40) (29.9%) Total Company $ 532 $ 619 (14.1%) Operating Pr
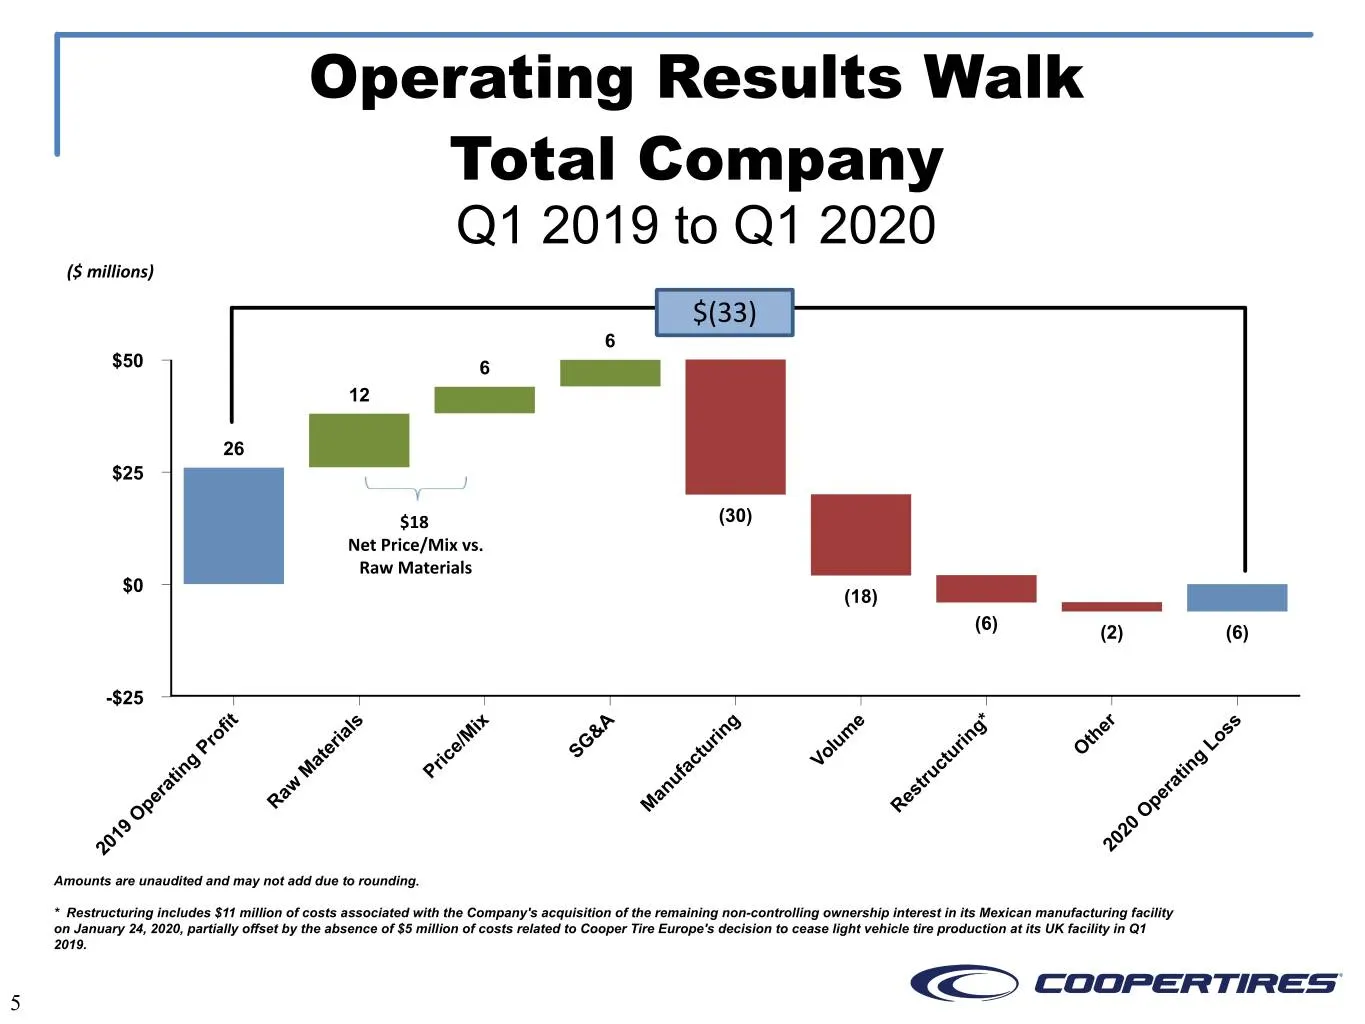
Slide 5: Operating Results Walk Total Company Q1 2019 to Q1 2020
Operating Results Walk Total Company Q1 2019 to Q1 2020 ($ millions) $(33) 6 $50 6 12 26 $25 $18 (30) Net Price/Mix vs. Raw Materials $0 (18) (6) (2) (6) -$25 t * r fi ls ix A g e g e s o a & in m h s r ri /M r u in t o P e e G u l r O L t c S t o tu g g a ri c V c n in M P fa u ti t u tr a ra w n s
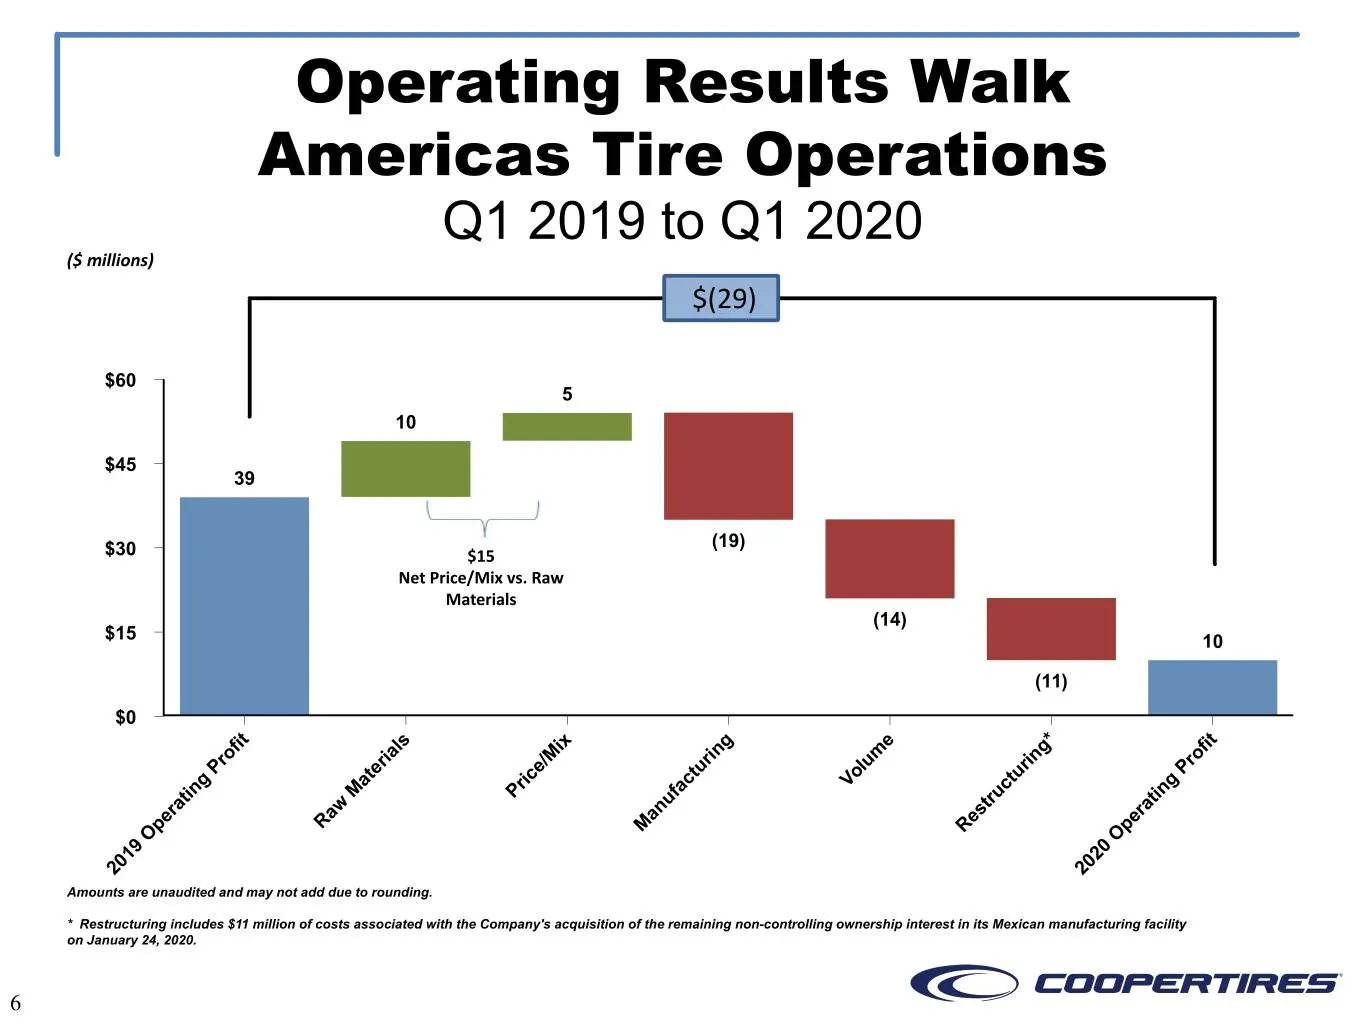
Slide 6: Operating Results Walk Americas Tire Operations Q1 2019 to Q1 2020
Operating Results Walk Americas Tire Operations Q1 2019 to Q1 2020 ($ millions) $(29) $60 5 10 $45 39 (19) $30 $15 Net Price/Mix vs. Raw Materials (14) $15 10 (11) $0 t * t fi ls ix g e g fi o a in m o r ri /M r u in r P e e u l r P t c t o tu g a ri c V c g in M P fa u in t u tr t ra w n s ra e a a
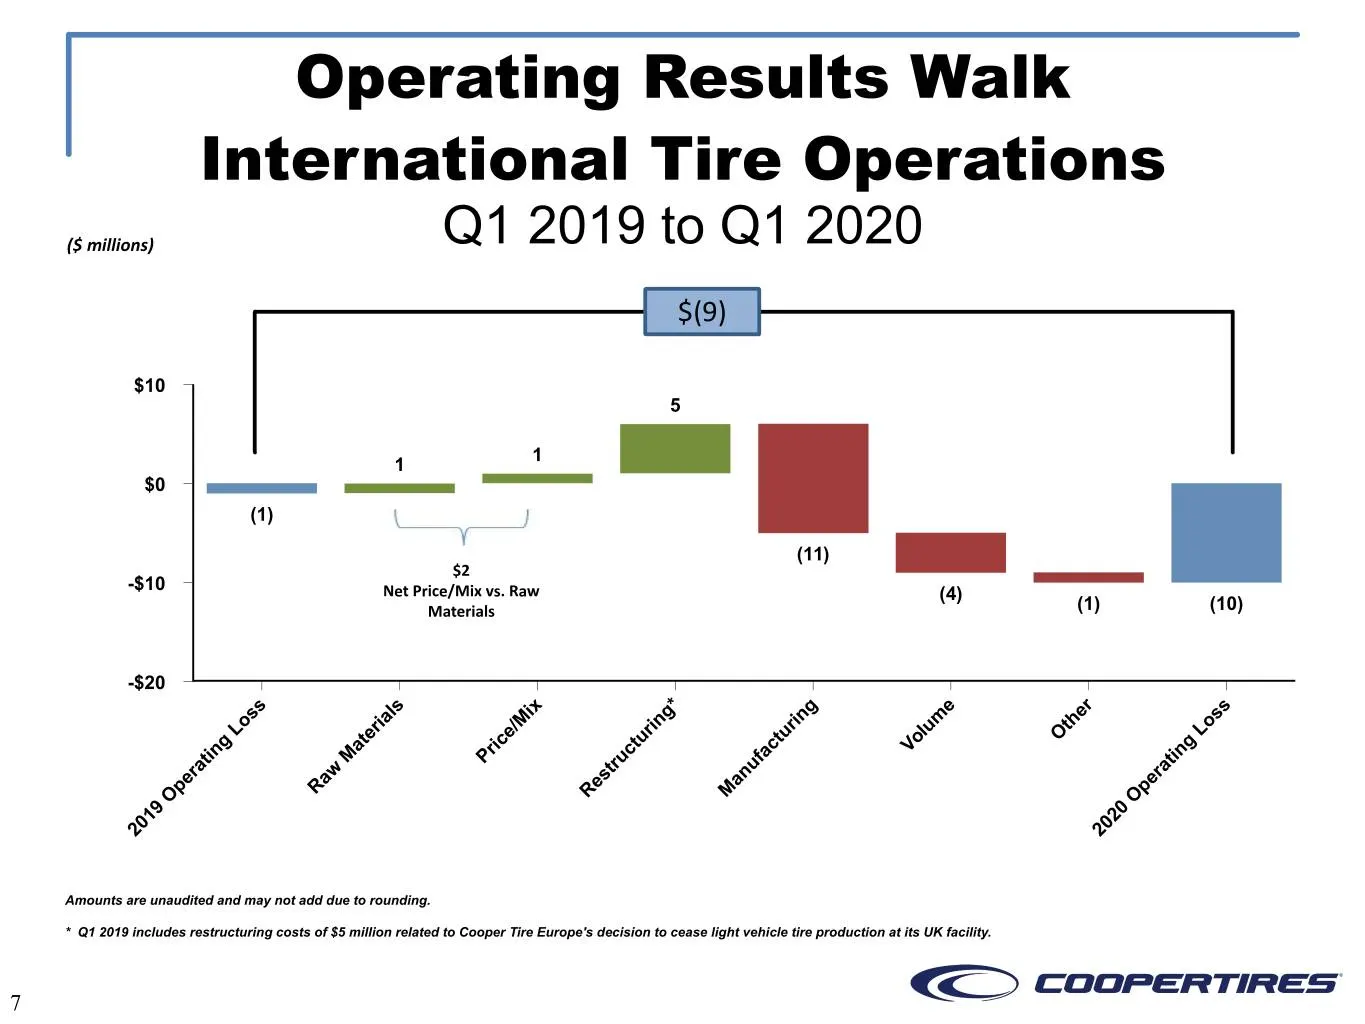
Slide 7: Operating Results Walk International Tire Operations Q1 2019 to Q1 2020
Operating Results Walk International Tire Operations ($ millions) Q1 2019 to Q1 2020 $(9) $10 5 1 1 $0 (1) (11) $2 -$10 Net Price/Mix vs. Raw (4) Materials (1) (10) -$20 * r s ls ix g g e e s s a in m h s o ri /M in r u t o L e e r u l O L g t c tu t o g n a ri c c V n i M u fa i t P r u t ra w t n
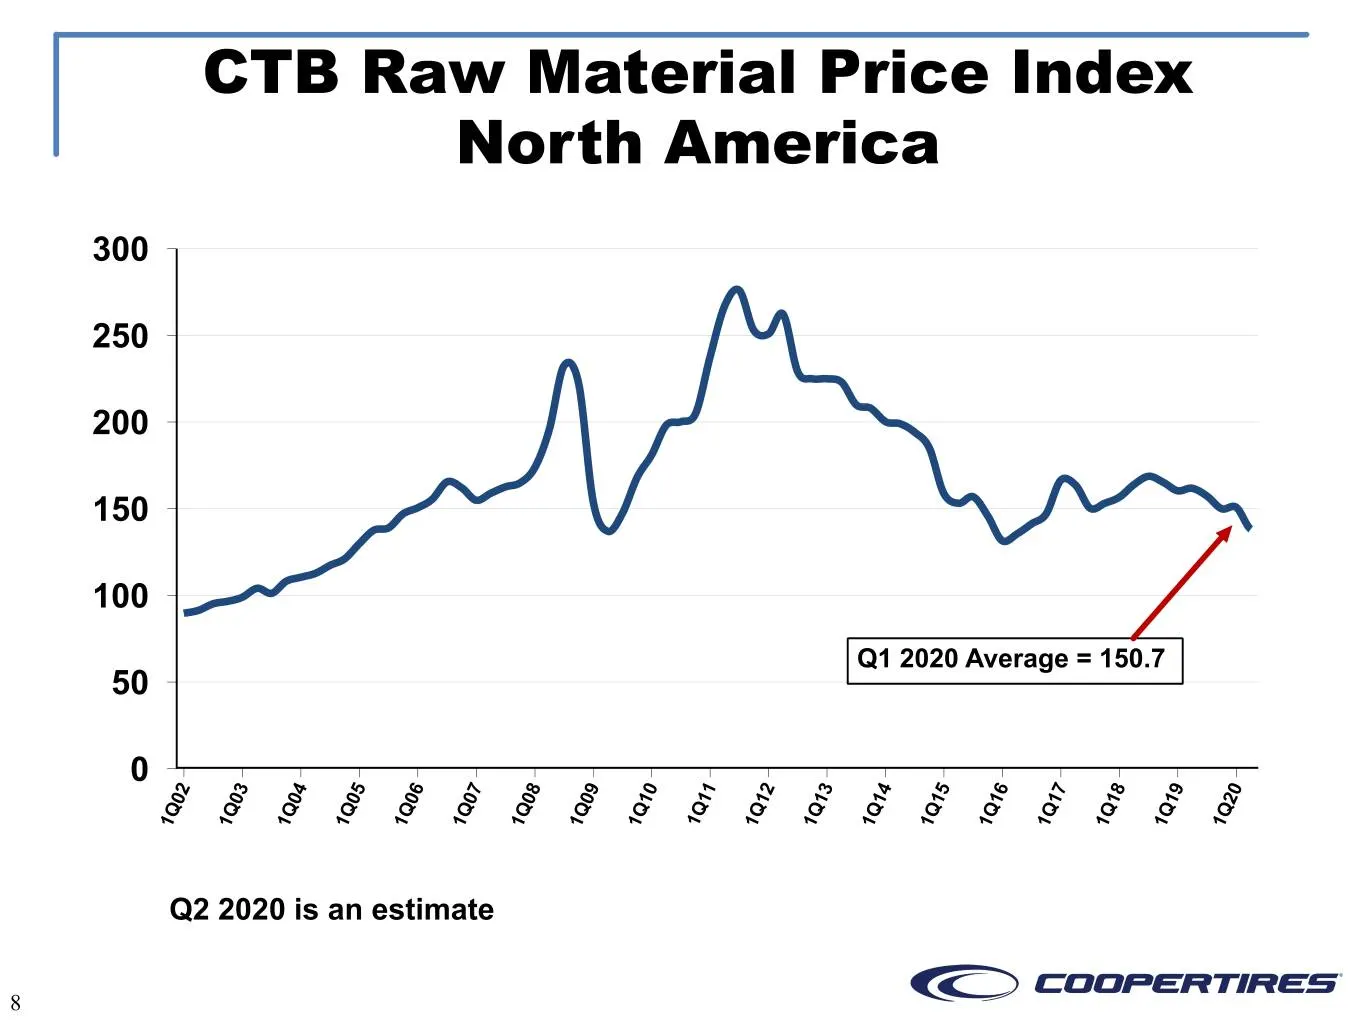
Slide 8: CTB Raw Material Price Index North America
CTB Raw Material Price Index North America 300 250 200 150 100 Q1 2020 Average = 150.7 50 0 2 3 4 5 6 7 8 9 0 1 2 3 4 5 6 7 8 9 0 0 0 0 0 0 0 0 0 1 1 1 1 1 1 1 1 1 1 2 Q Q Q Q Q Q Q Q Q Q Q Q Q Q Q Q Q Q Q 1 1 1 1 1 1 1 1 1 1 1 1 1 1 1 1 1 1 1 Q2 2020 is an estimate 8
Slide 9: Non-GAAP Measures
Non-GAAP Measures Non-GAAP financial measures should be considered in addition to, not as a substitute for, other financial measures prepared in accordance with generally accepted accounting principles (“GAAP”). The company’s methods of determining these non-GAAP financial measures may differ from t
Slide 10: Non-GAAP Measures Return on Invested Capital (ROIC)
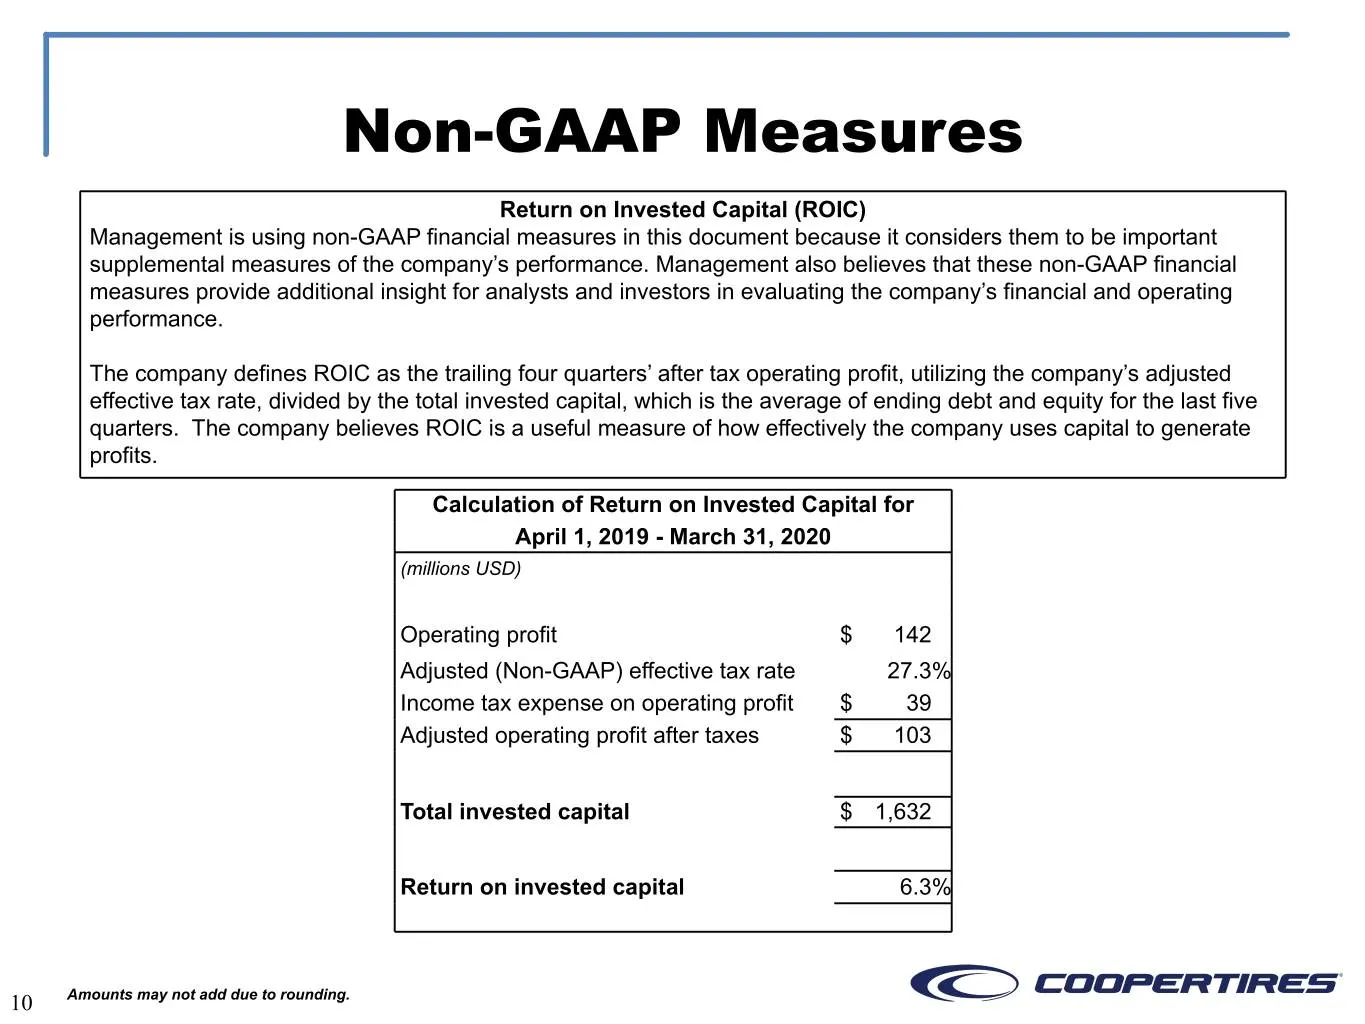
Non-GAAP Measures Return on Invested Capital (ROIC) Management is using non-GAAP financial measures in this document because it considers them to be important supplemental measures of the company’s performance. Management also believes that these non-GAAP financial measures provide additional insigh
Slide 11: Non-GAAP Measures Trailing Four Quarter Effective Tax Rate
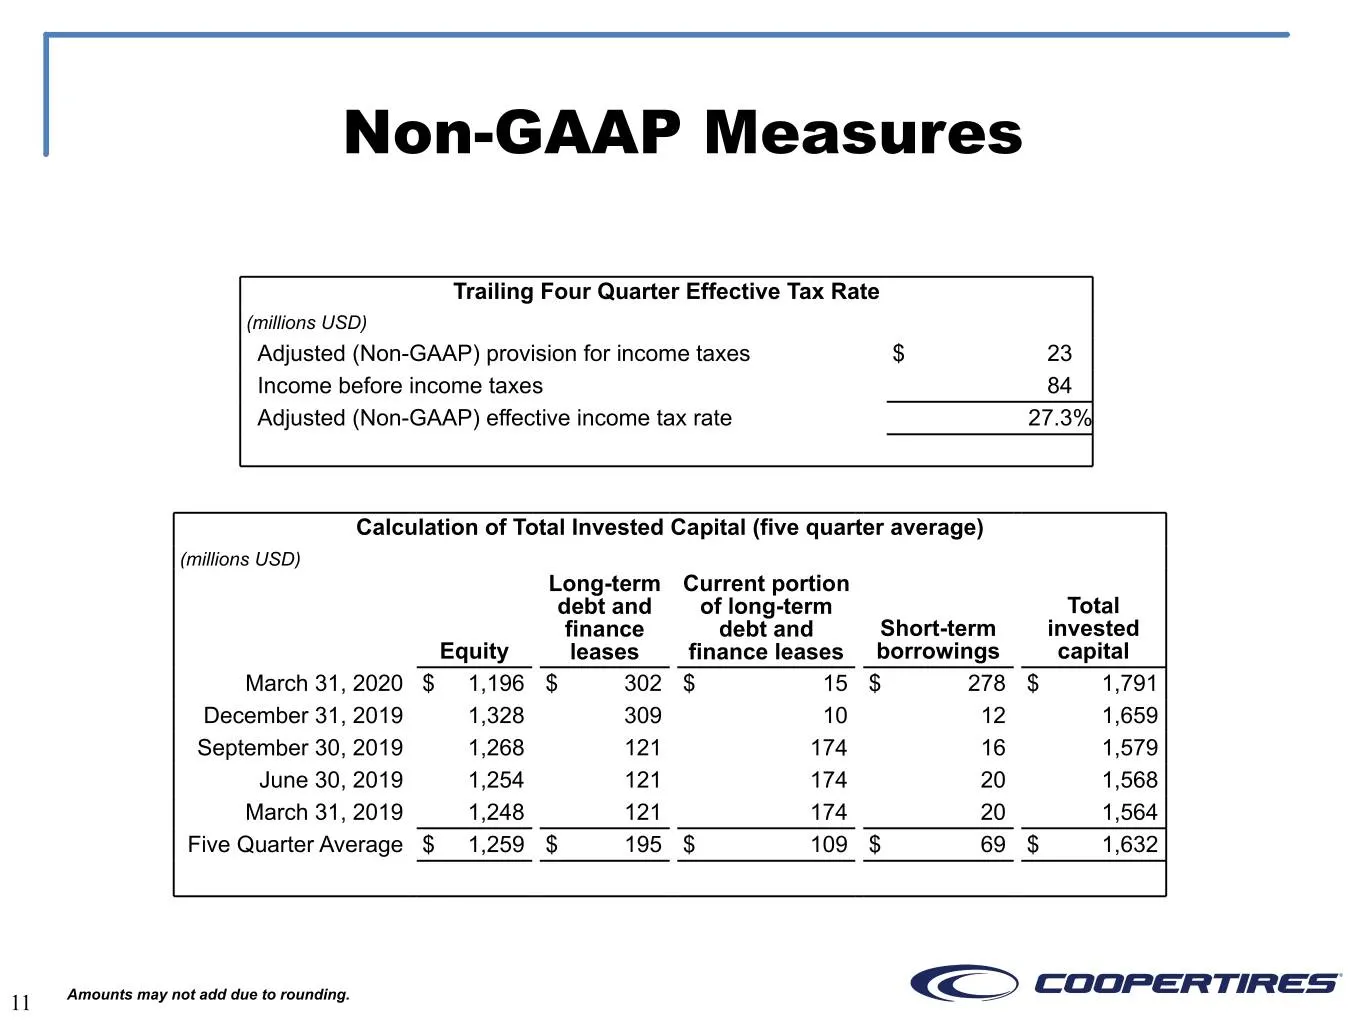
Non-GAAP Measures Trailing Four Quarter Effective Tax Rate (millions USD) Adjusted (Non-GAAP) provision for income taxes $ 23 Income before income taxes 84 Adjusted (Non-GAAP) effective income tax rate 27.3% Calculation of Total Invested Capital (five quarter average) (millions USD) Long-term Curren
Slide 12: Non-GAAP Measures Trailing Four Quarter Income and Expense Inputs
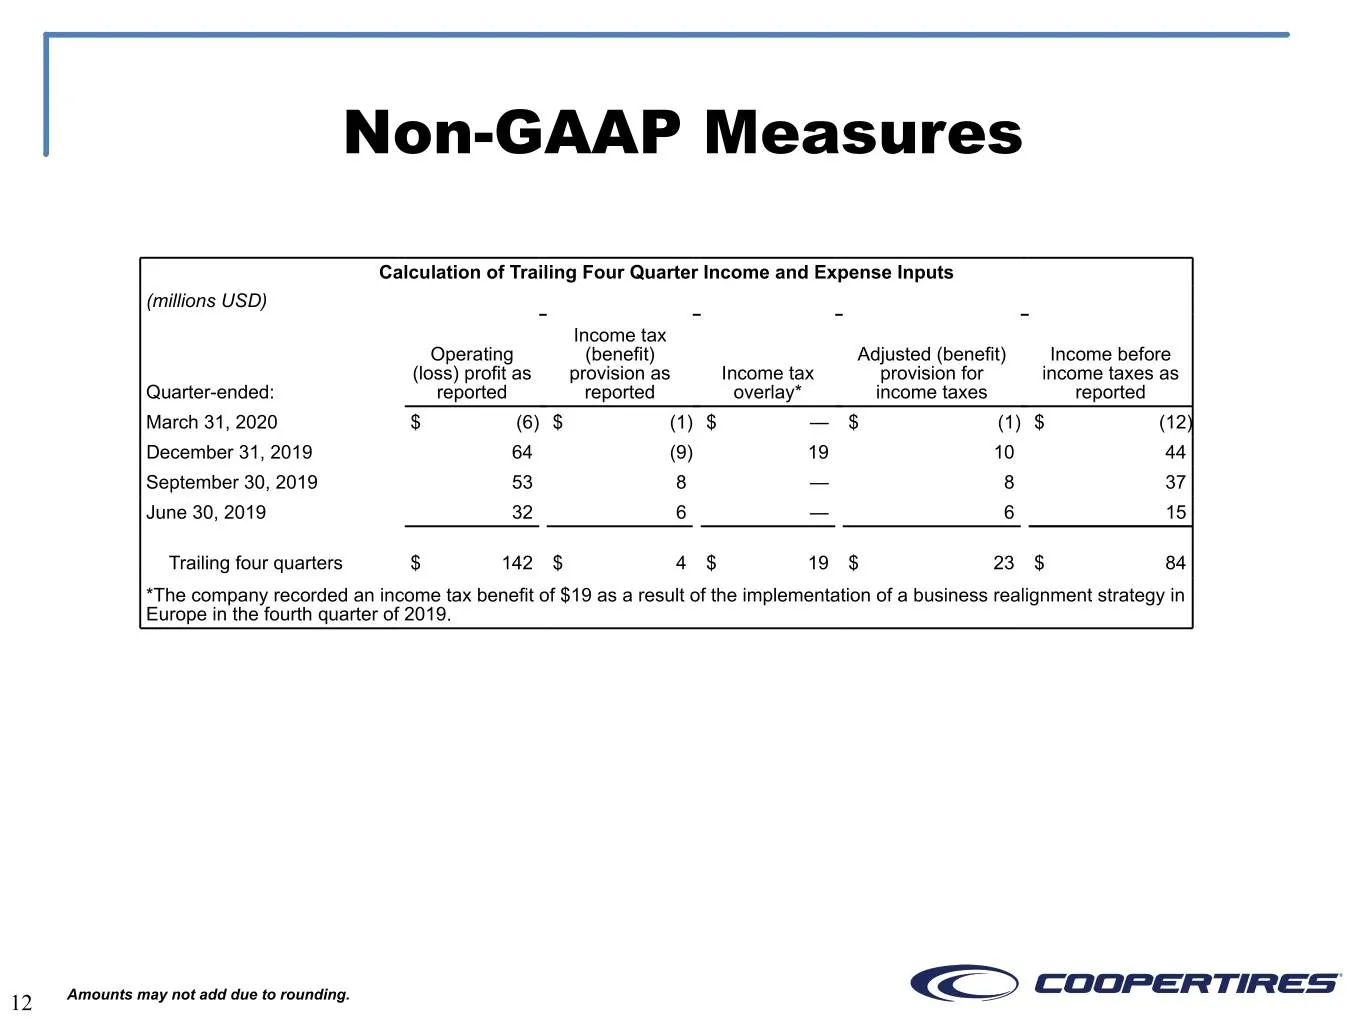
Non-GAAP Measures Calculation of Trailing Four Quarter Income and Expense Inputs (millions USD) Income tax Operating (benefit) Adjusted (benefit) Income before (loss) profit as provision as Income tax provision for income taxes as Quarter-ended: reported reported overlay* income taxes reported March
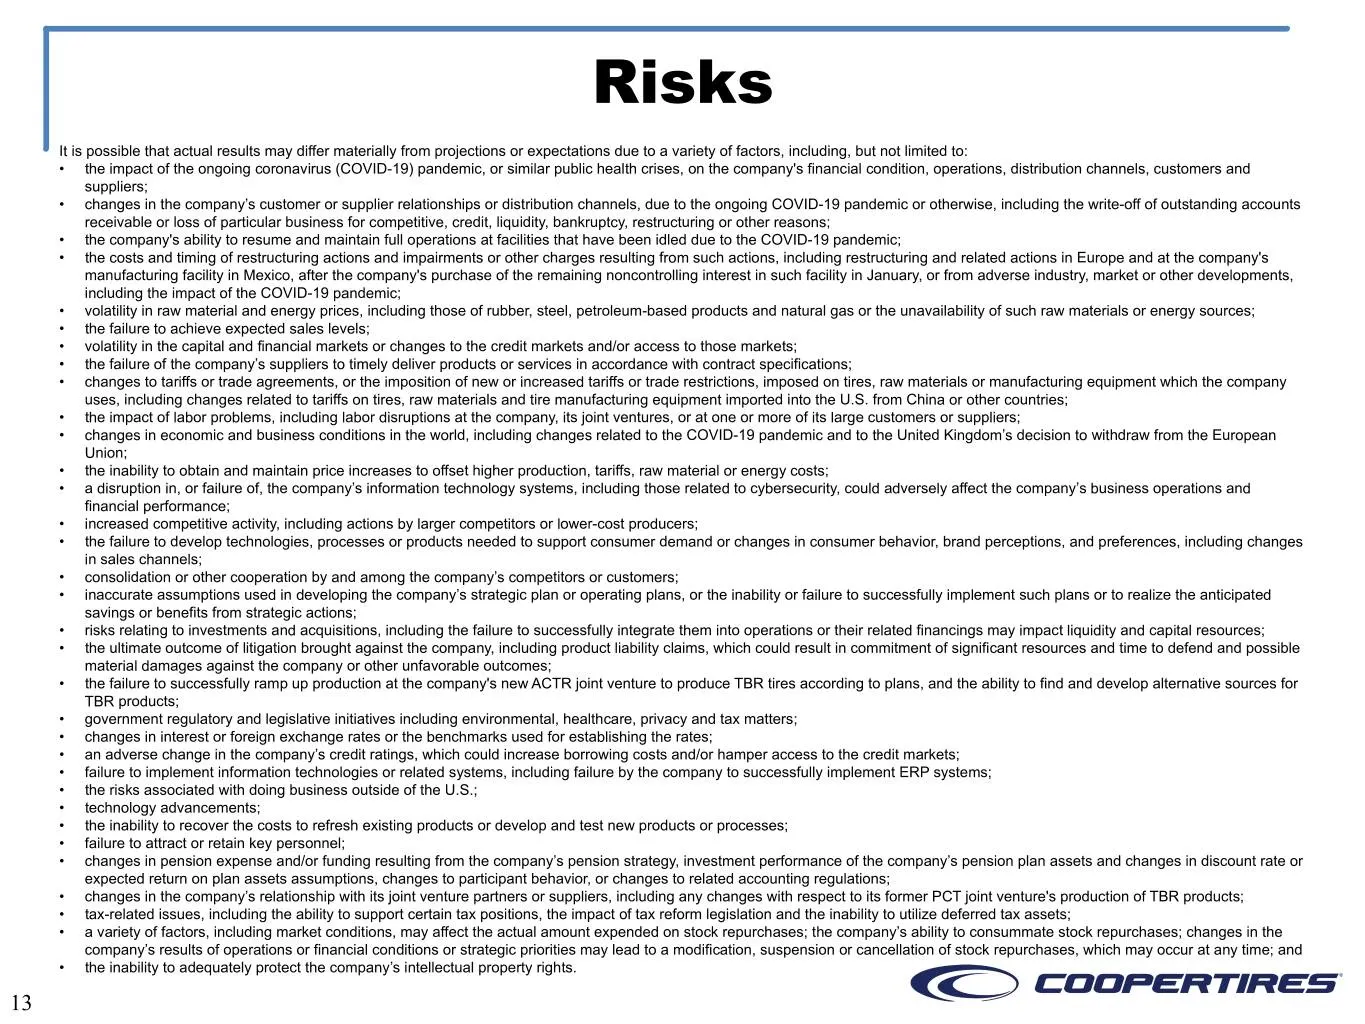
Slide 13: Risks
Risks It is possible that actual results may differ materially from projections or expectations due to a variety of factors, including, but not limited to: • the impact of the ongoing coronavirus (COVID-19) pandemic, or similar public health crises, on the company's financial condition, operations,
Source: SEC EDGAR · 8-K filed May 7, 2020
More decks from Cooper Tire & Rubber Company
 Q1 2021 Earnings Presentation13 slides · May 3, 2021
 FY2020 Earnings Presentation17 slides · Feb 22, 2021
 Q3 2020 Earnings Presentation14 slides · Oct 29, 2020
 Q2 2020 Earnings Presentation14 slides · Aug 3, 2020
 FY2019 Earnings Presentation18 slides · Feb 24, 2020
 Q3 2019 Earnings Presentation14 slides · Oct 28, 2019