Tiger Brands Limited · JSE:TBS
Tiger Brands — FY2009 Earnings Presentation
38 slides from Tiger Brands's earnings presentation, November 2009
Slide 1: Results Presentation for the year ended 30 September 2009
Adding value to life RESULTSPRESENTATION fortheyearended30September2009
Slide 2: Agenda
AGENDA 1 Corporate Strategy 2 Business Performance Overview 3 Salient Features 4 Fi Financial i lAAnalysis l i 5 Segmental Performance 6 Outlook 2009
Slide 3: Corporate Strategy
CORPORATESTRATEGY PeterMatlare Chief Executive Officer ChiefExecutiveOfficer 2009
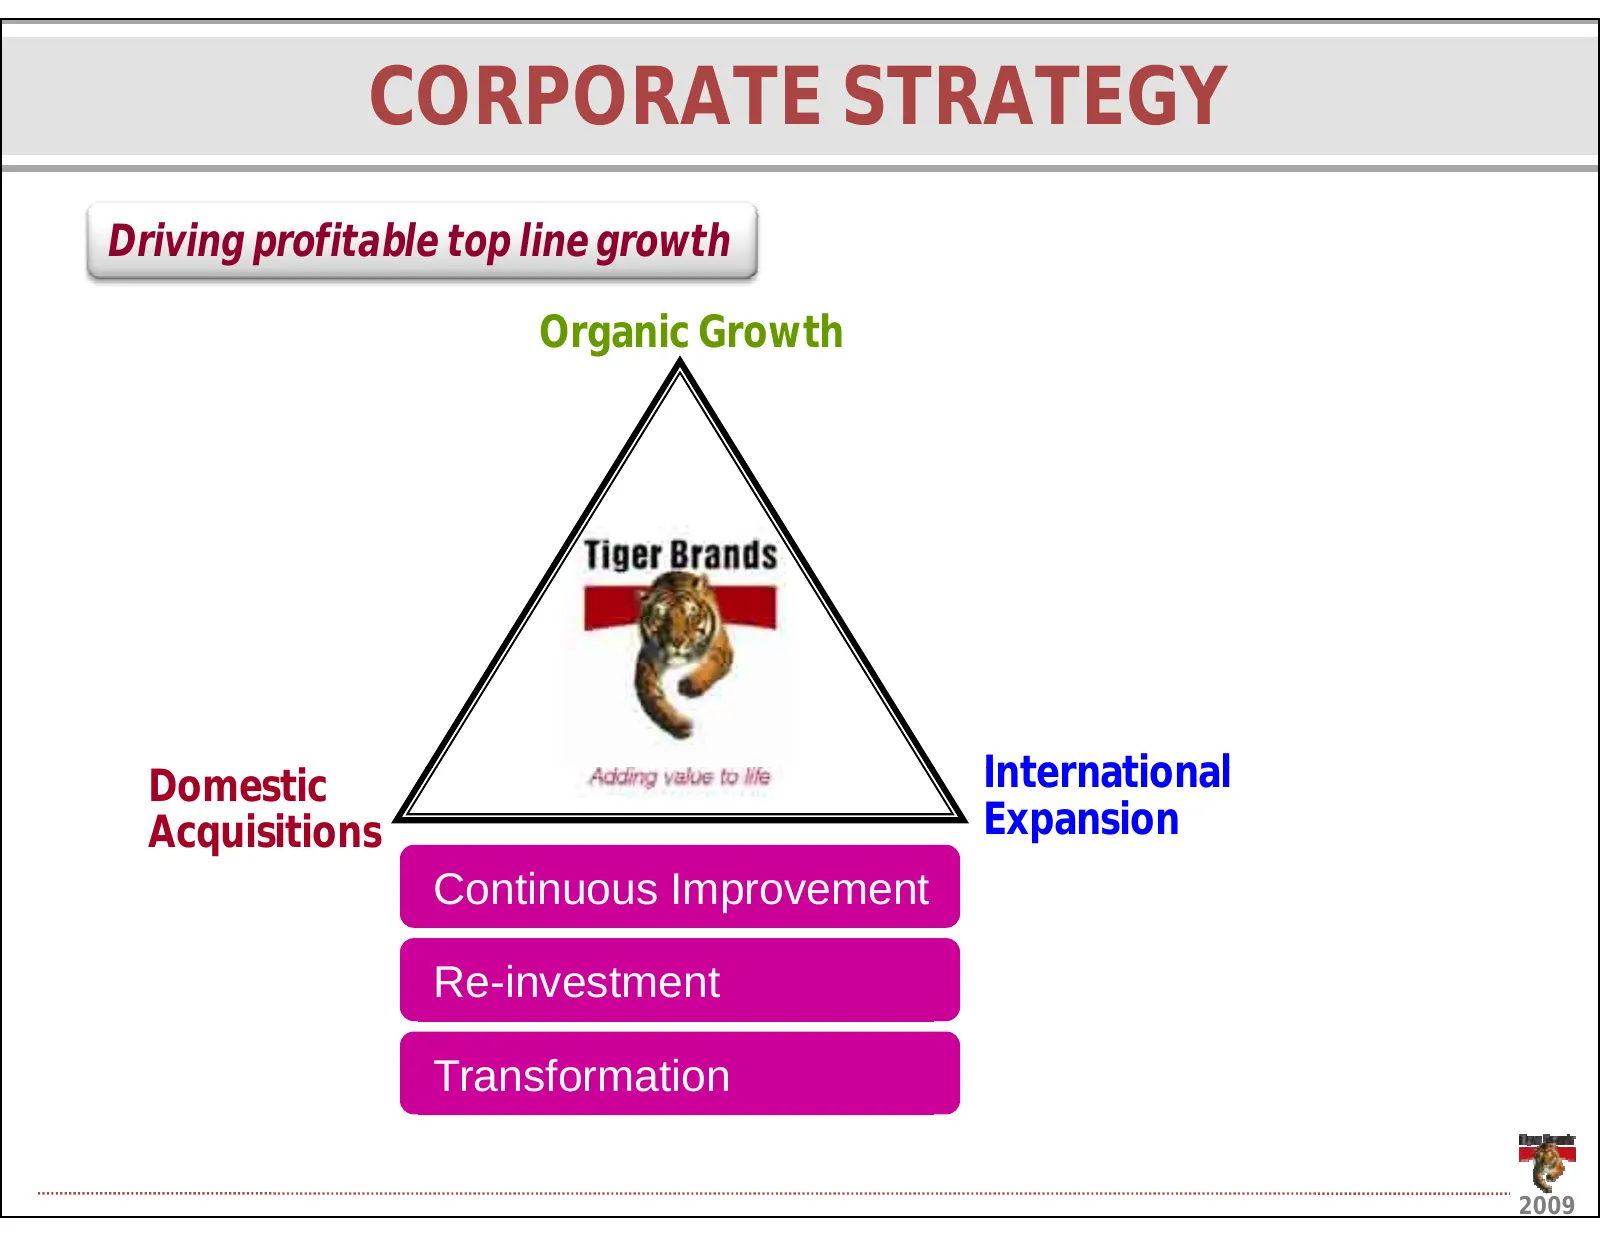
Slide 4: Corporate Strategy: Driving profitable topline growth
CORPORATESTRATEGY Drivingprofitabletoplinegrowth OrganicGrowth i h Domestic International Acquisitions Expansion Continuous Improvement Re-investment Transformation 2009
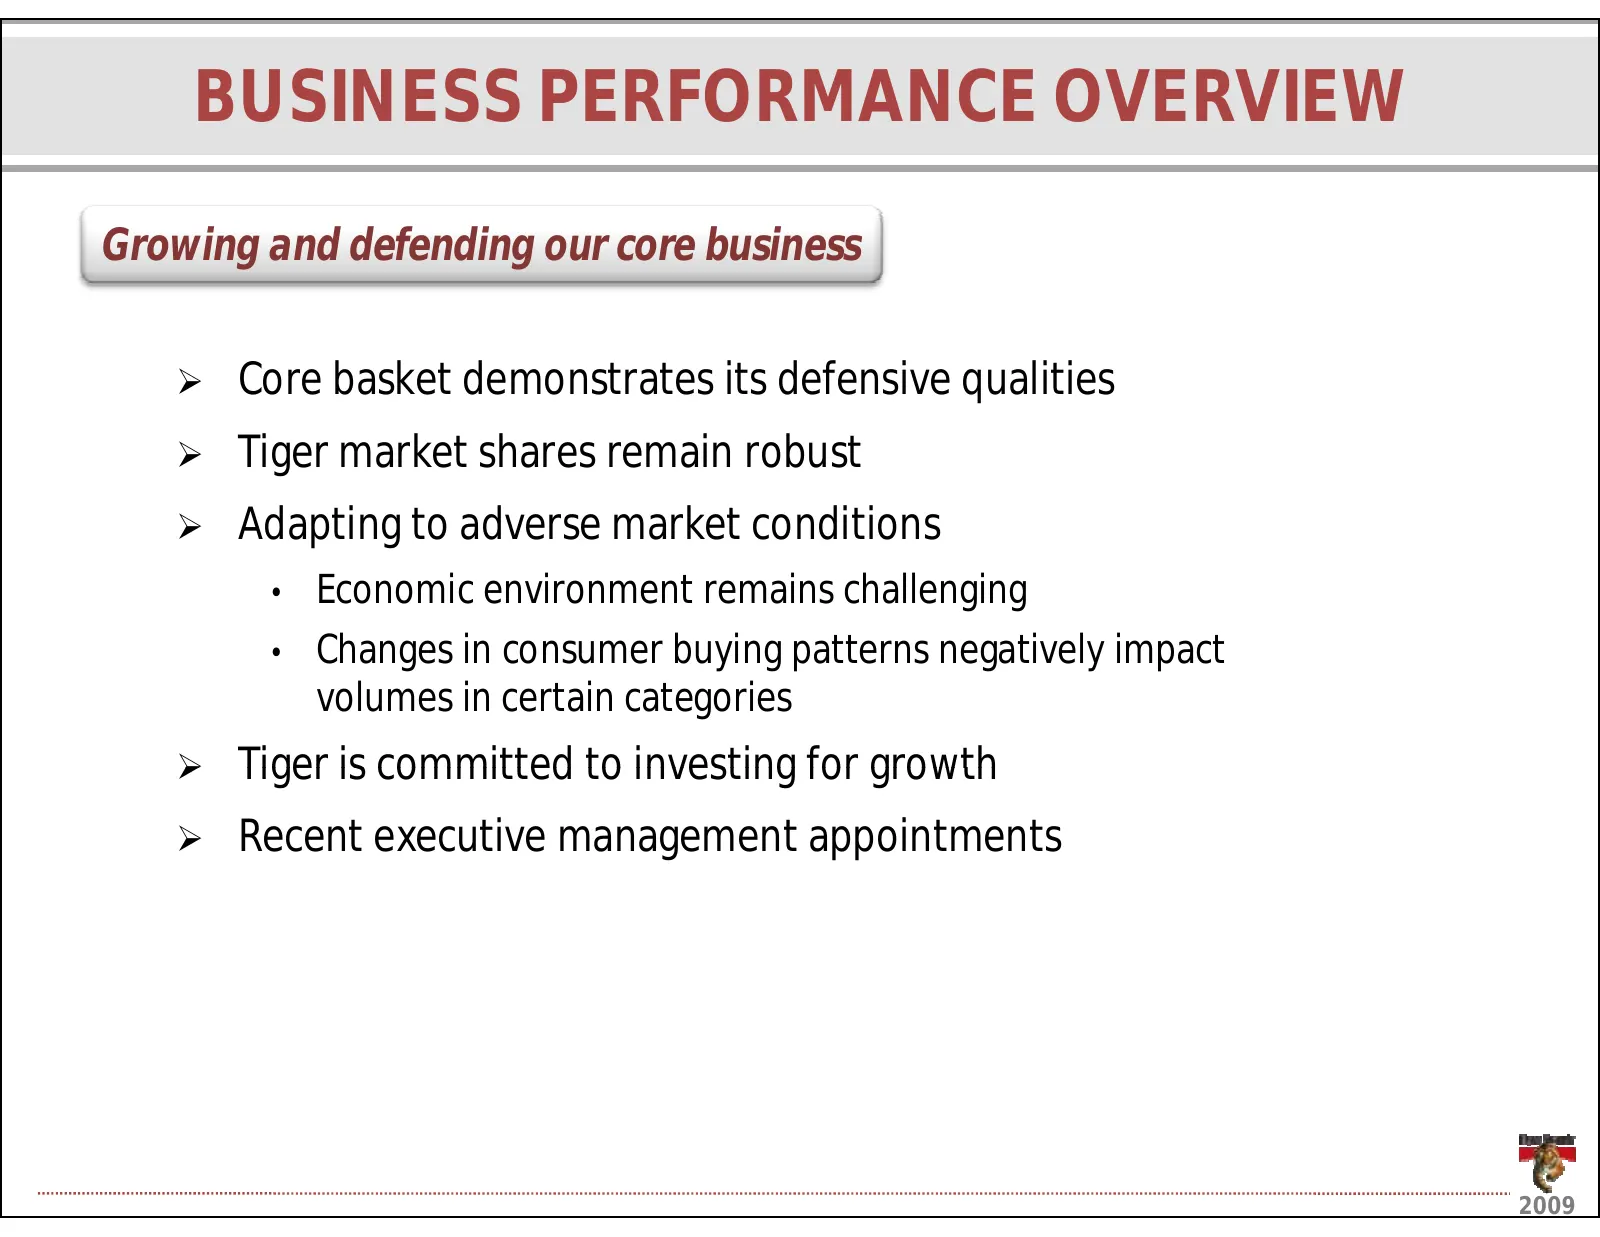
Slide 5: Business Performance Overview: Growing and defending our core business
BUSINESSPERFORMANCEOVERVIEW Growinganddefendingourcorebusiness ¾ Corebasketdemonstratesitsdefensivequalities ¾ Tigermarketsharesremainrobust g ¾ Adaptingtoadversemarketconditions • Economicenvironmentremainschallenging • Changesinconsumerbuyingpatternsnegativelyimpact volumesincertaincategories ¾ Ti
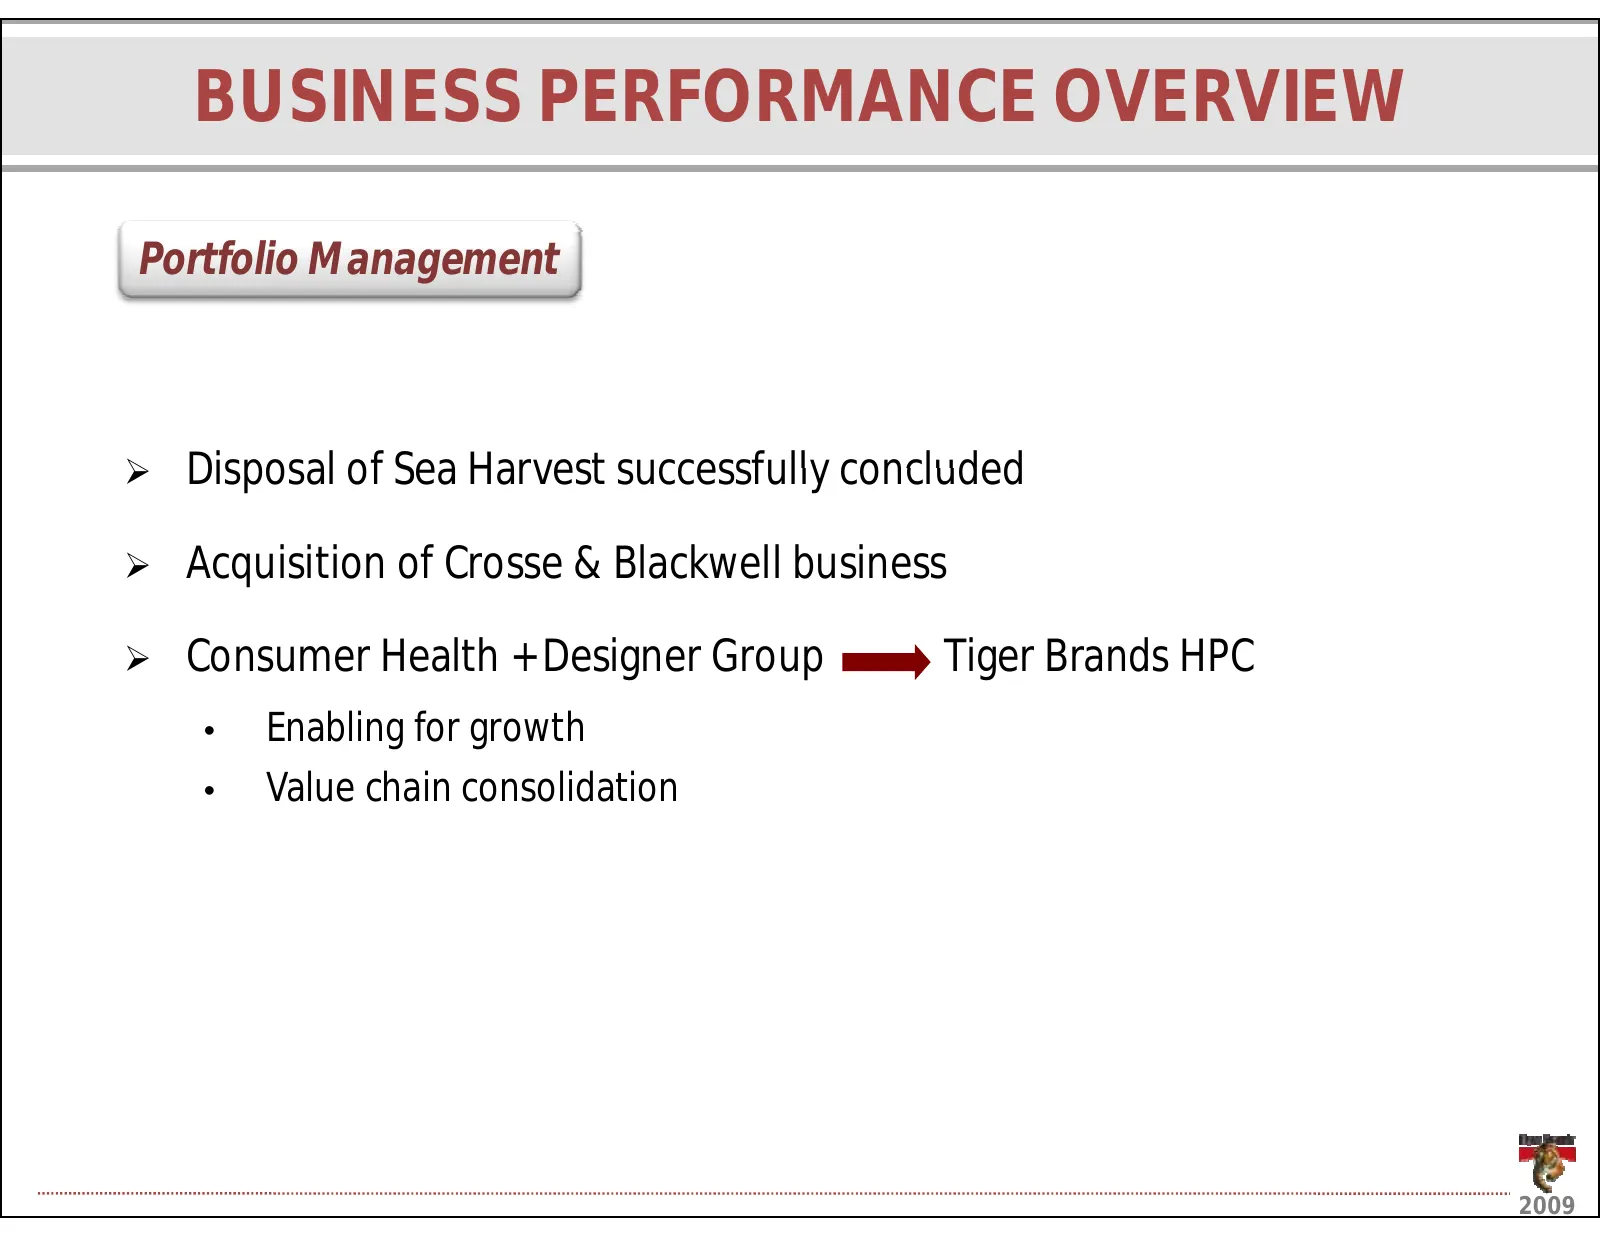
Slide 6: Business Performance Overview: Portfolio Management
BUSINESSPERFORMANCEOVERVIEW PortfolioManagement ¾ Disposal of Sea Harvest successfully concluded DisposalofSeaHarvestsuccessfullyconcluded ¾ AcquisitionofCrosse&Blackwellbusiness ¾ ConsumerHealth+DesignerGroupTigerBrandsHPC • Enablingforgrowth • Valuechainconsolidation 2009
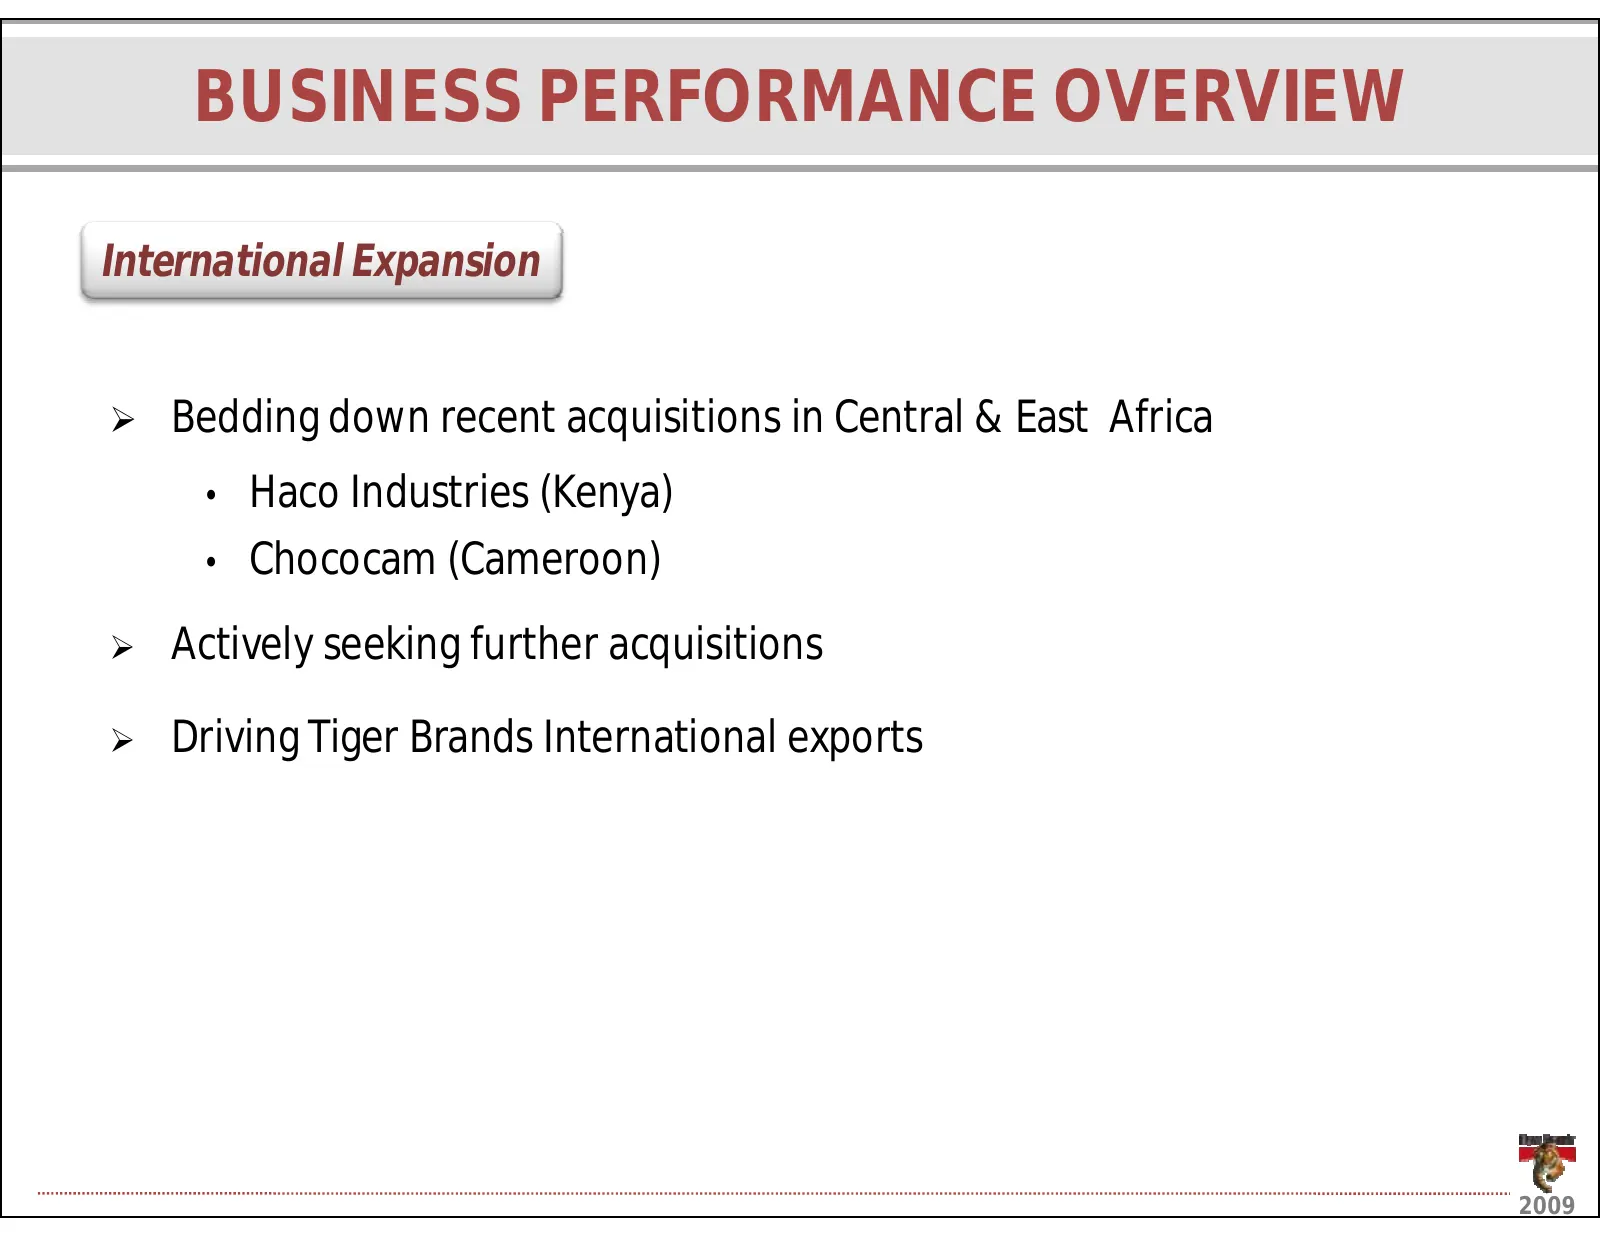
Slide 7: Business Performance Overview: International Expansion
BUSINESSPERFORMANCEOVERVIEW InternationalExpansion ¾ BeddingdownrecentacquisitionsinCentral&EastAfrica • HacoIndustries(Kenya) • Chococam(Cameroon) ¾ Activelyseekingfurtheracquisitions ¾ DrivingTigerBrandsInternationalexports 2009
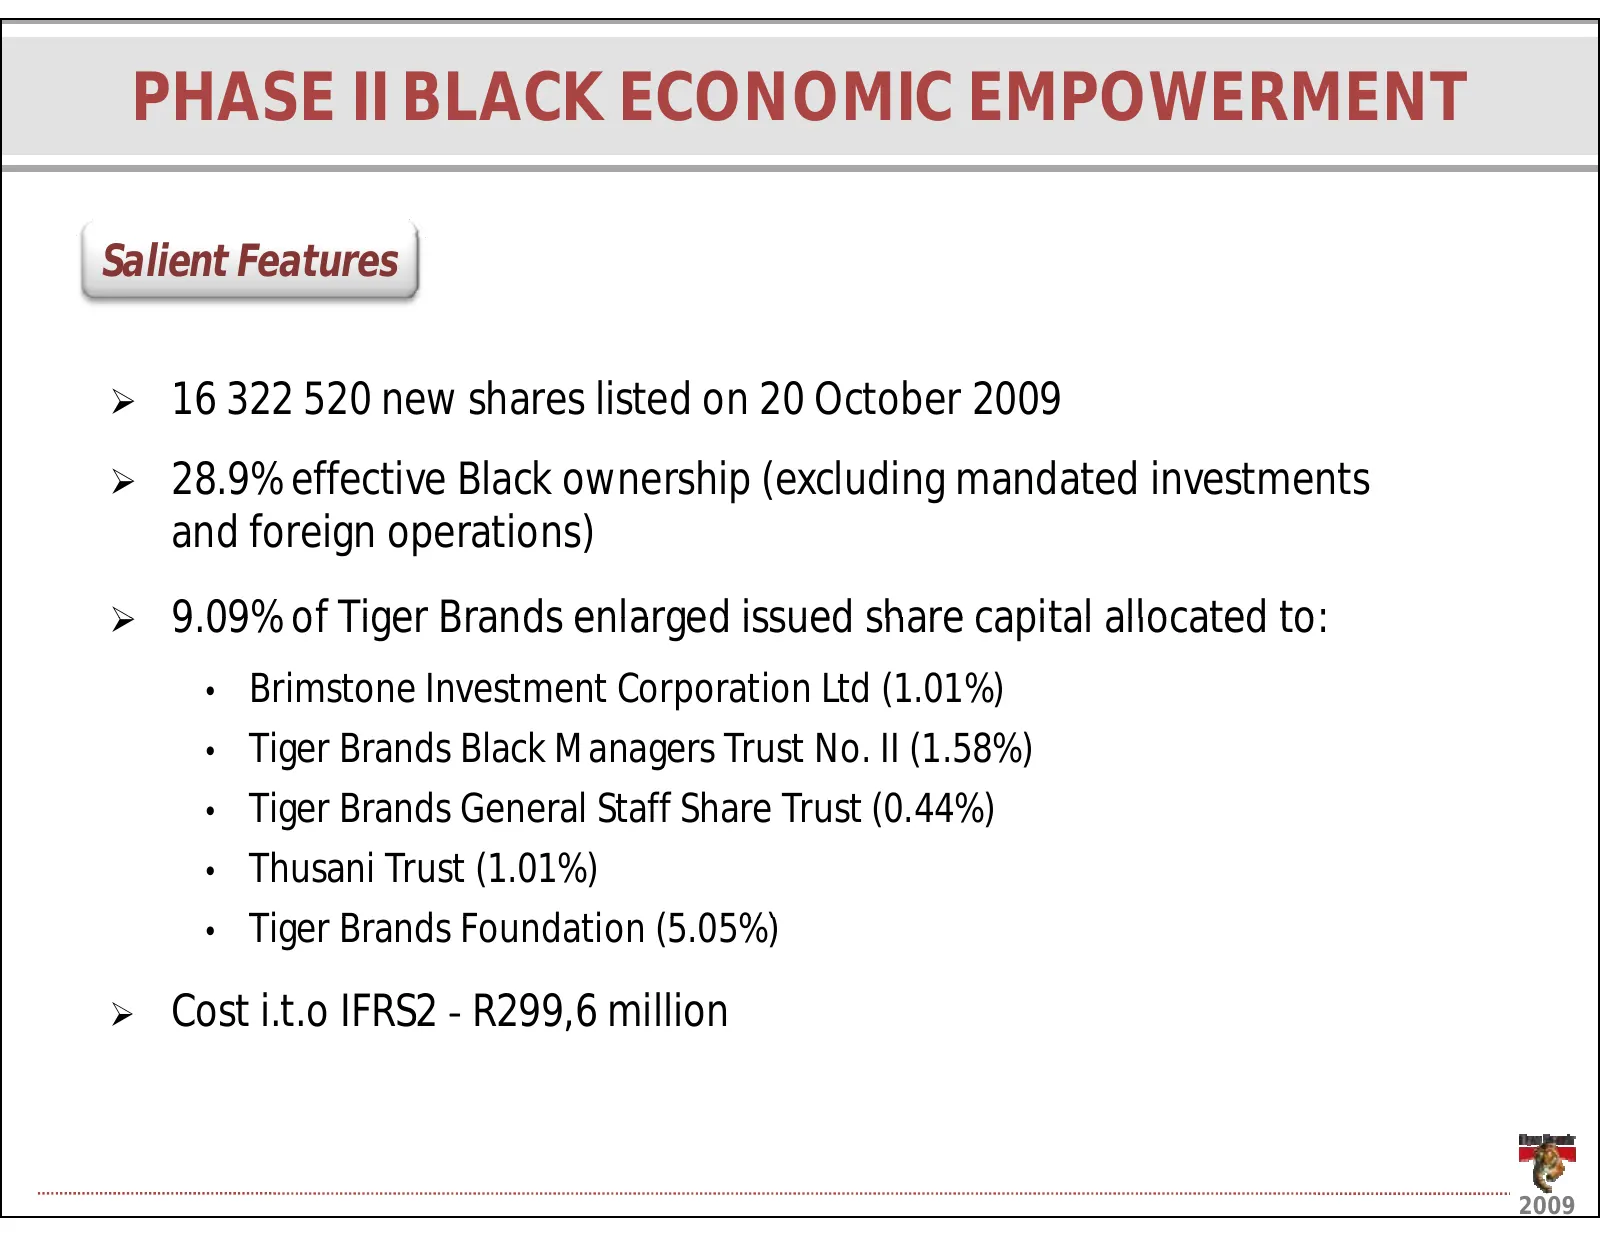
Slide 8: Phase II Black Economic Empowerment
PHASEIIBLACKECONOMICEMPOWERMENT SalientFeatures ¾ 16322520newshareslistedon20October2009 ¾ 28.9%effectiveBlackownership(excludingmandatedinvestments 28 9% ff i Bl k hi ( l di d di andforeignoperations) ¾ 9 09% of Tiger Brands enlarged issued share capital allocated to: 9.09%ofTigerBrandsenlargedissu
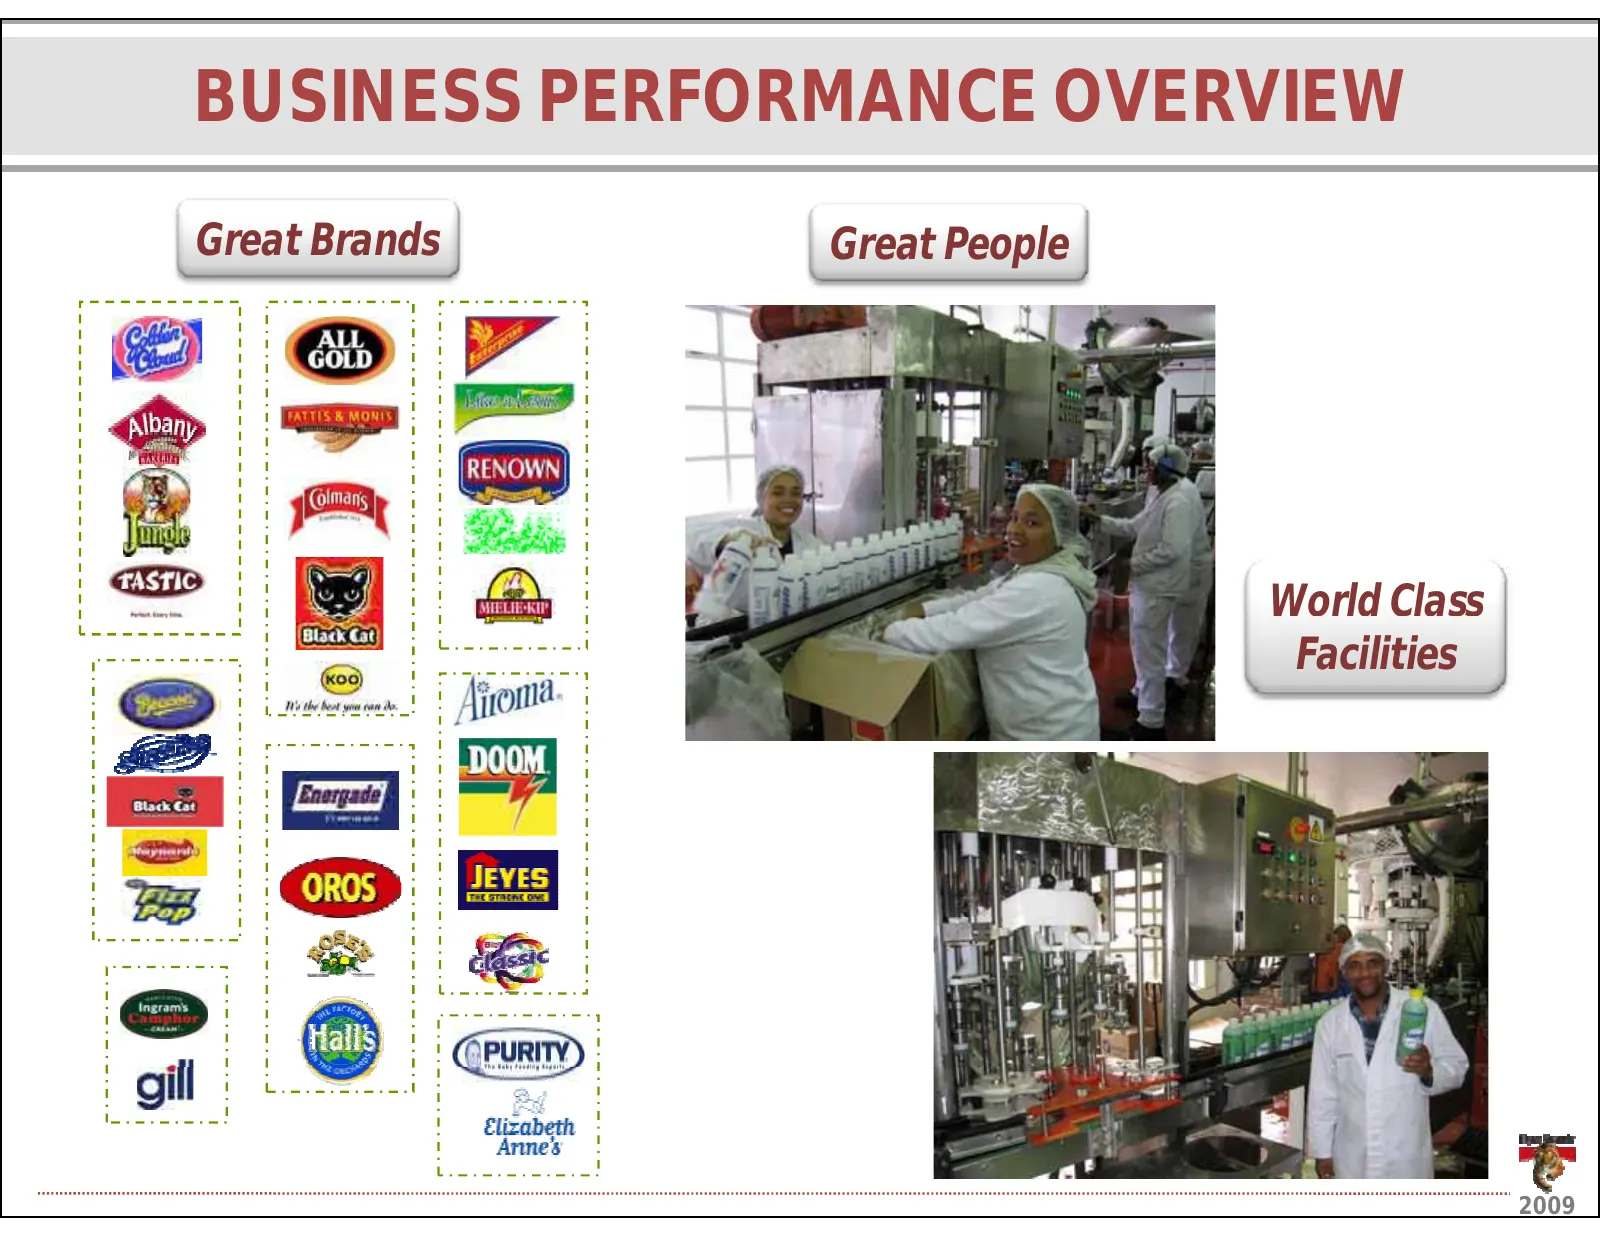
Slide 9: Business Performance Overview: Great Brands, Great People
BUSINESSPERFORMANCEOVERVIEW GreatBrands GreatPeople WorldClass Facilities 2009
Slide 10: Salient Features
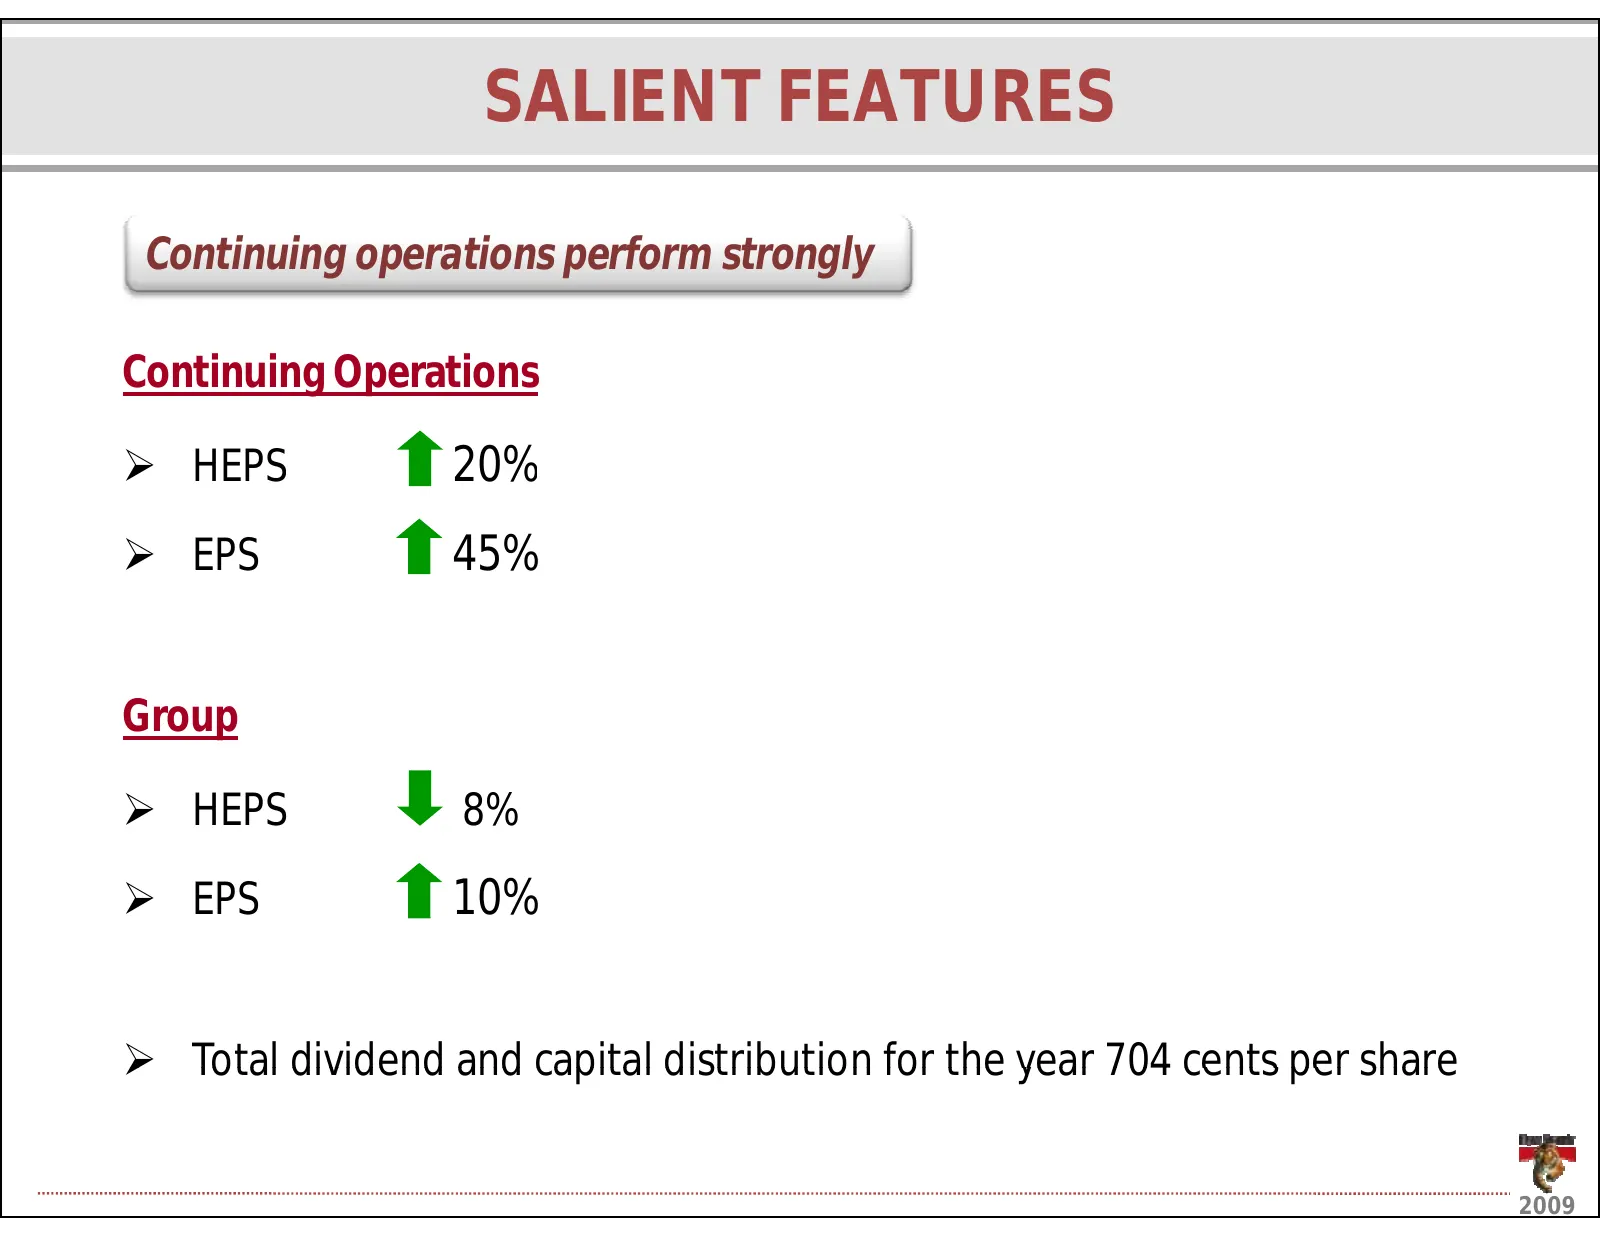
SALIENTFEATURES Continuingoperationsperformstrongly ContinuingOperations ¾ HEPS 20% ¾ EPS 45% Group ¾ HEPS 8% ¾ EPS 10% ¾ Totaldividendandcapitaldistributionfortheyear704centspershare Total dividend and capital distribution for the year 704 cents per share 2009
Slide 11: Financial Analysis
FINANCIALANALYSIS MichaelFleming Chief Financial Officer ChiefFinancialOfficer 2009
Slide 12: Income Statement to 30 September 2009
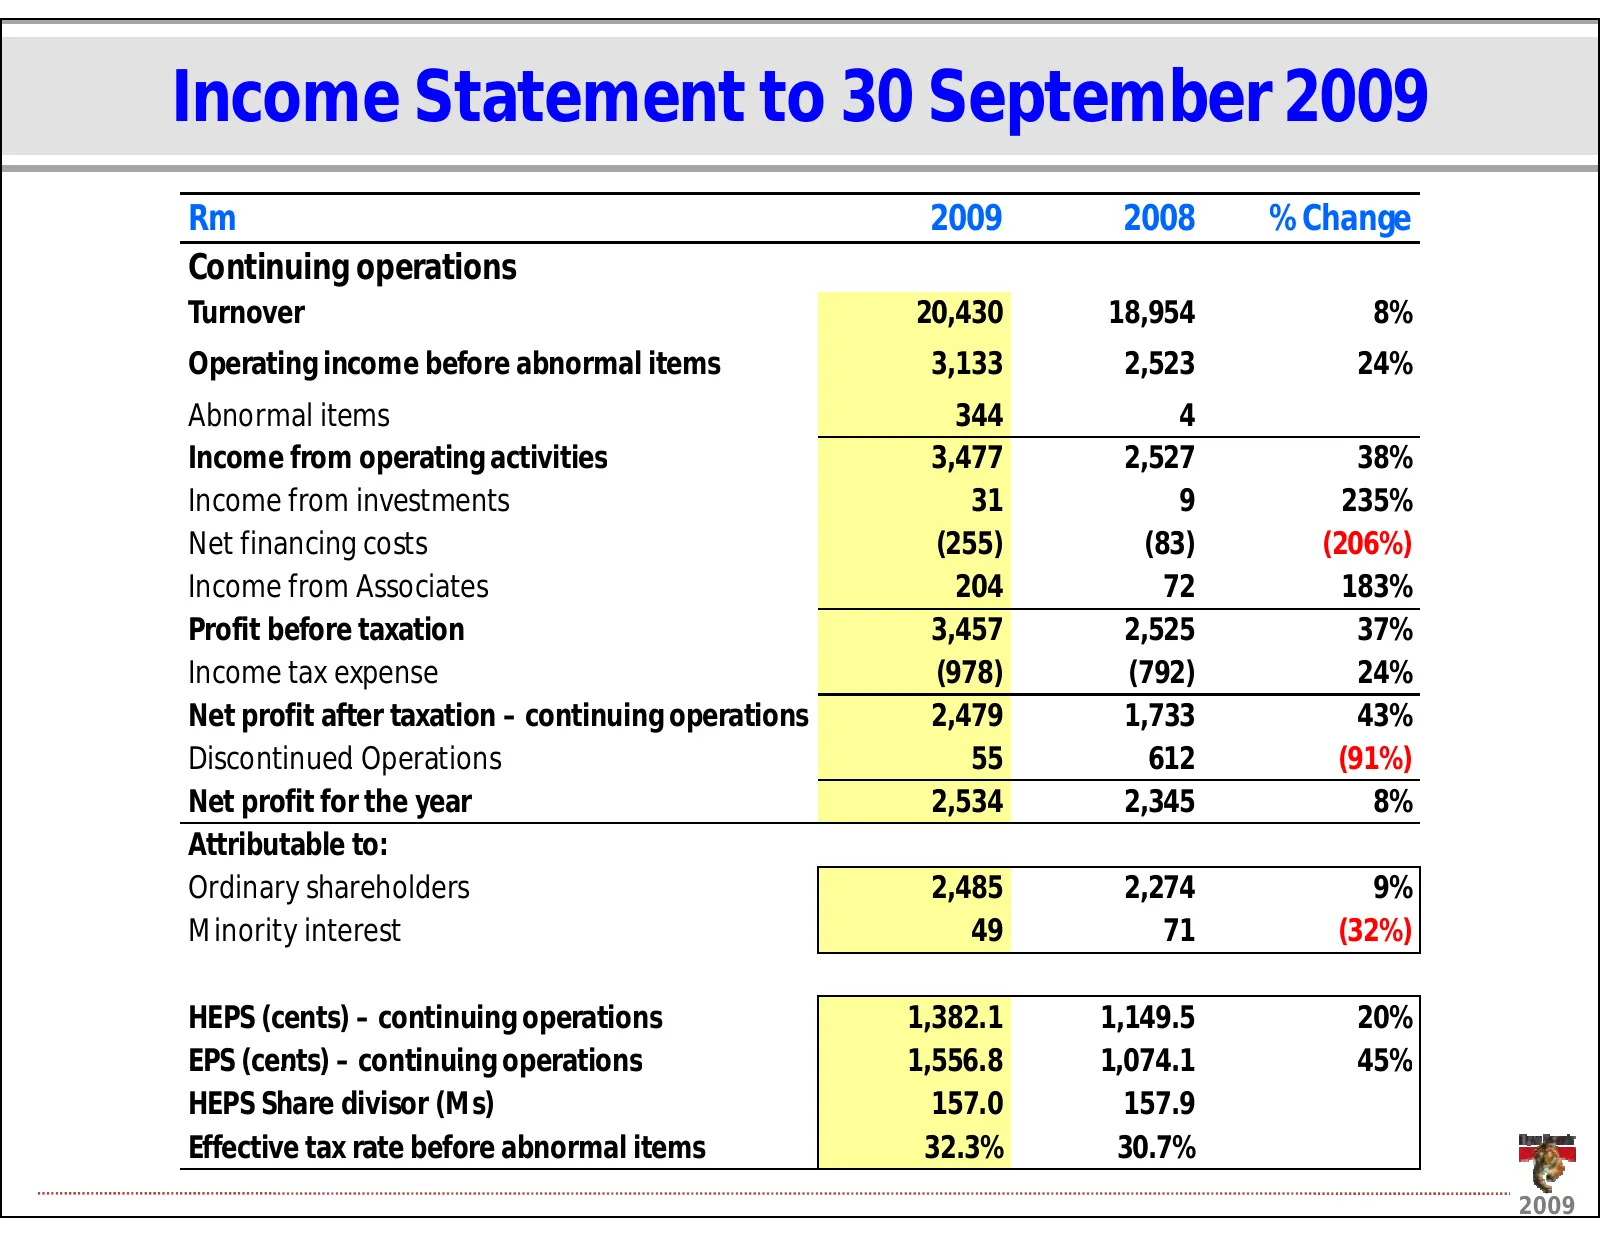
IncomeStatementto30 September2009 Rm 2009 2008 %Change Continuingoperations Turnover Turnover 20 430 20,430 18 954 18,954 8% 8% Operatingincomebeforeabnormalitems 3,133 2,523 24% Abnormalitems 344 4 Income from operating activities Incomefromoperatingactivities 3,477 2,527 2,527 38% 38% Incomefromin
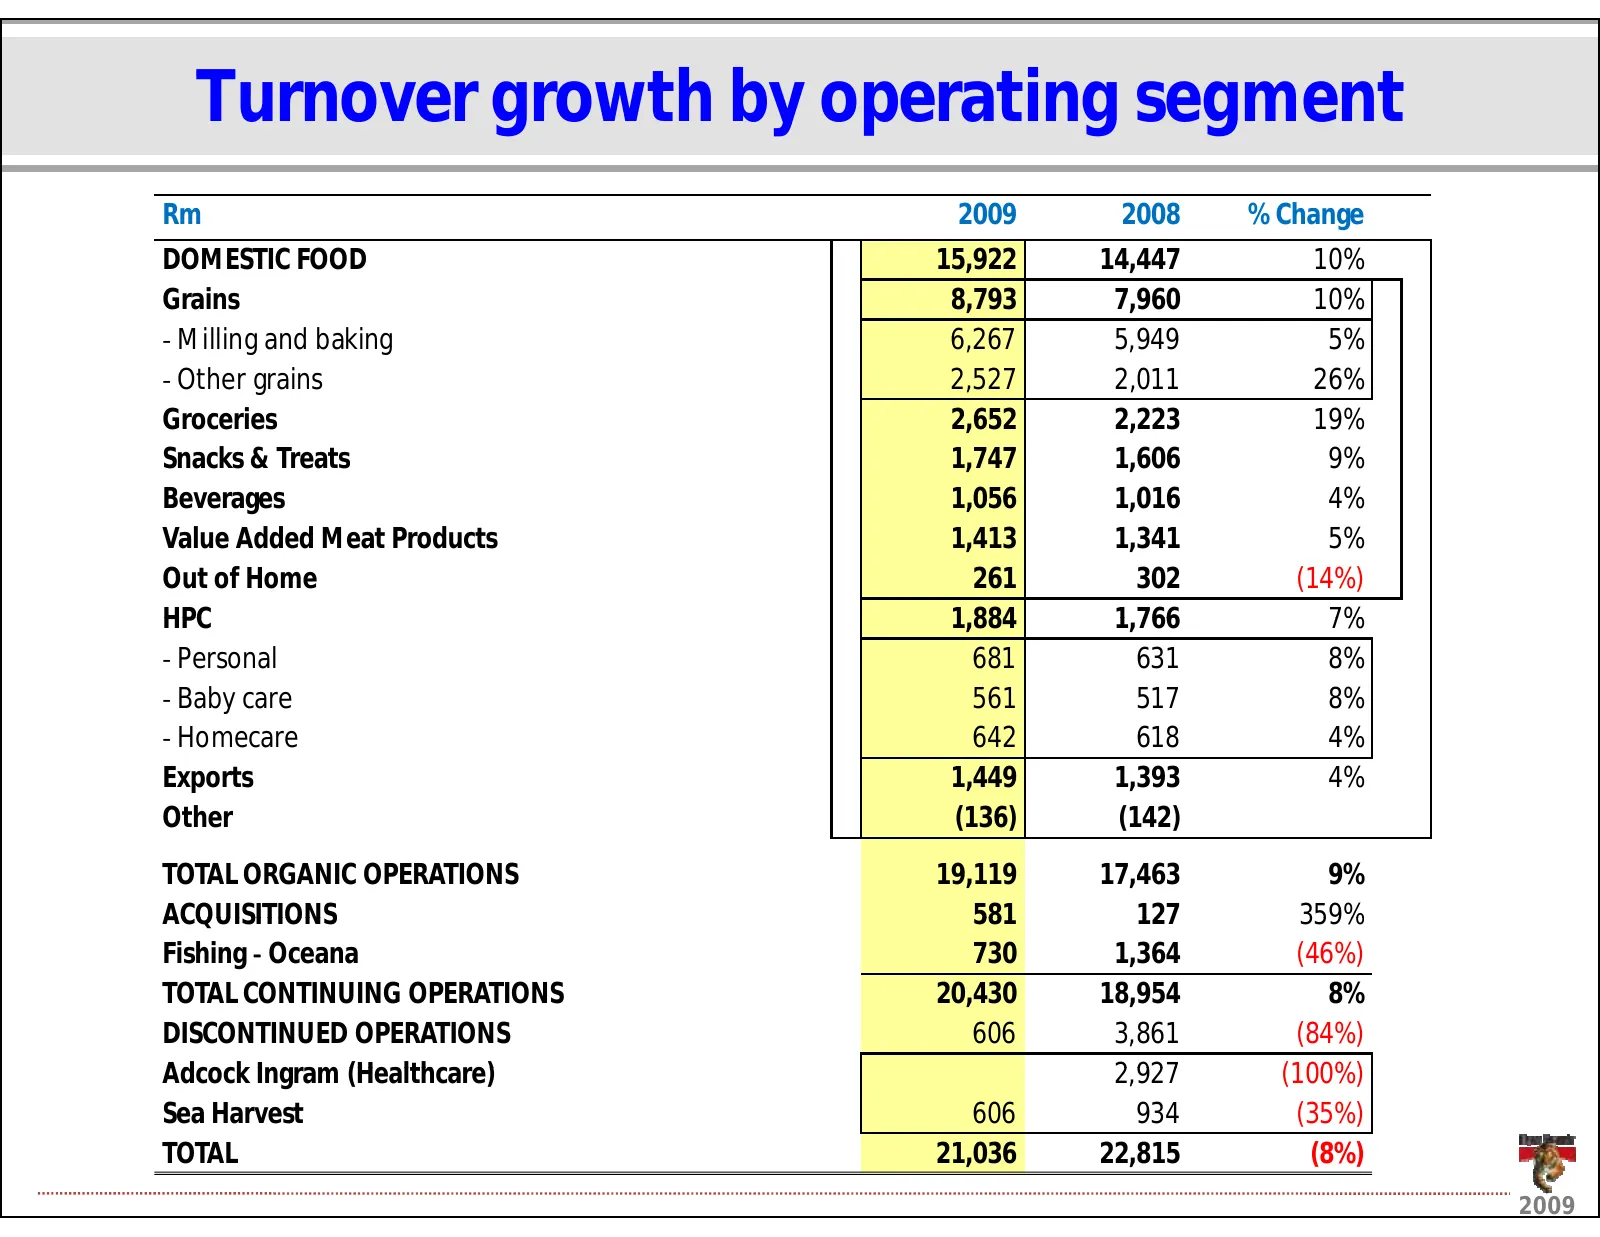
Slide 13: Turnover growth by operating segment
Turnovergrowthbyoperatingsegment Rm 2009 2008 %Change DOMESTICFOOD 15,922 14,447 10% Grains 8,793 7,960 10% Ͳ Millingandbaking 6,267 5,949 5% Ͳ Othergrains 2,527 2,011 26% Groceries 2,652 2,223 19% Snacks & Treats Snacks&Treats 1,747 1,747 1,606 1,606 9% 9% Beverages 1,056 1,016 4% ValueAddedMeatPro
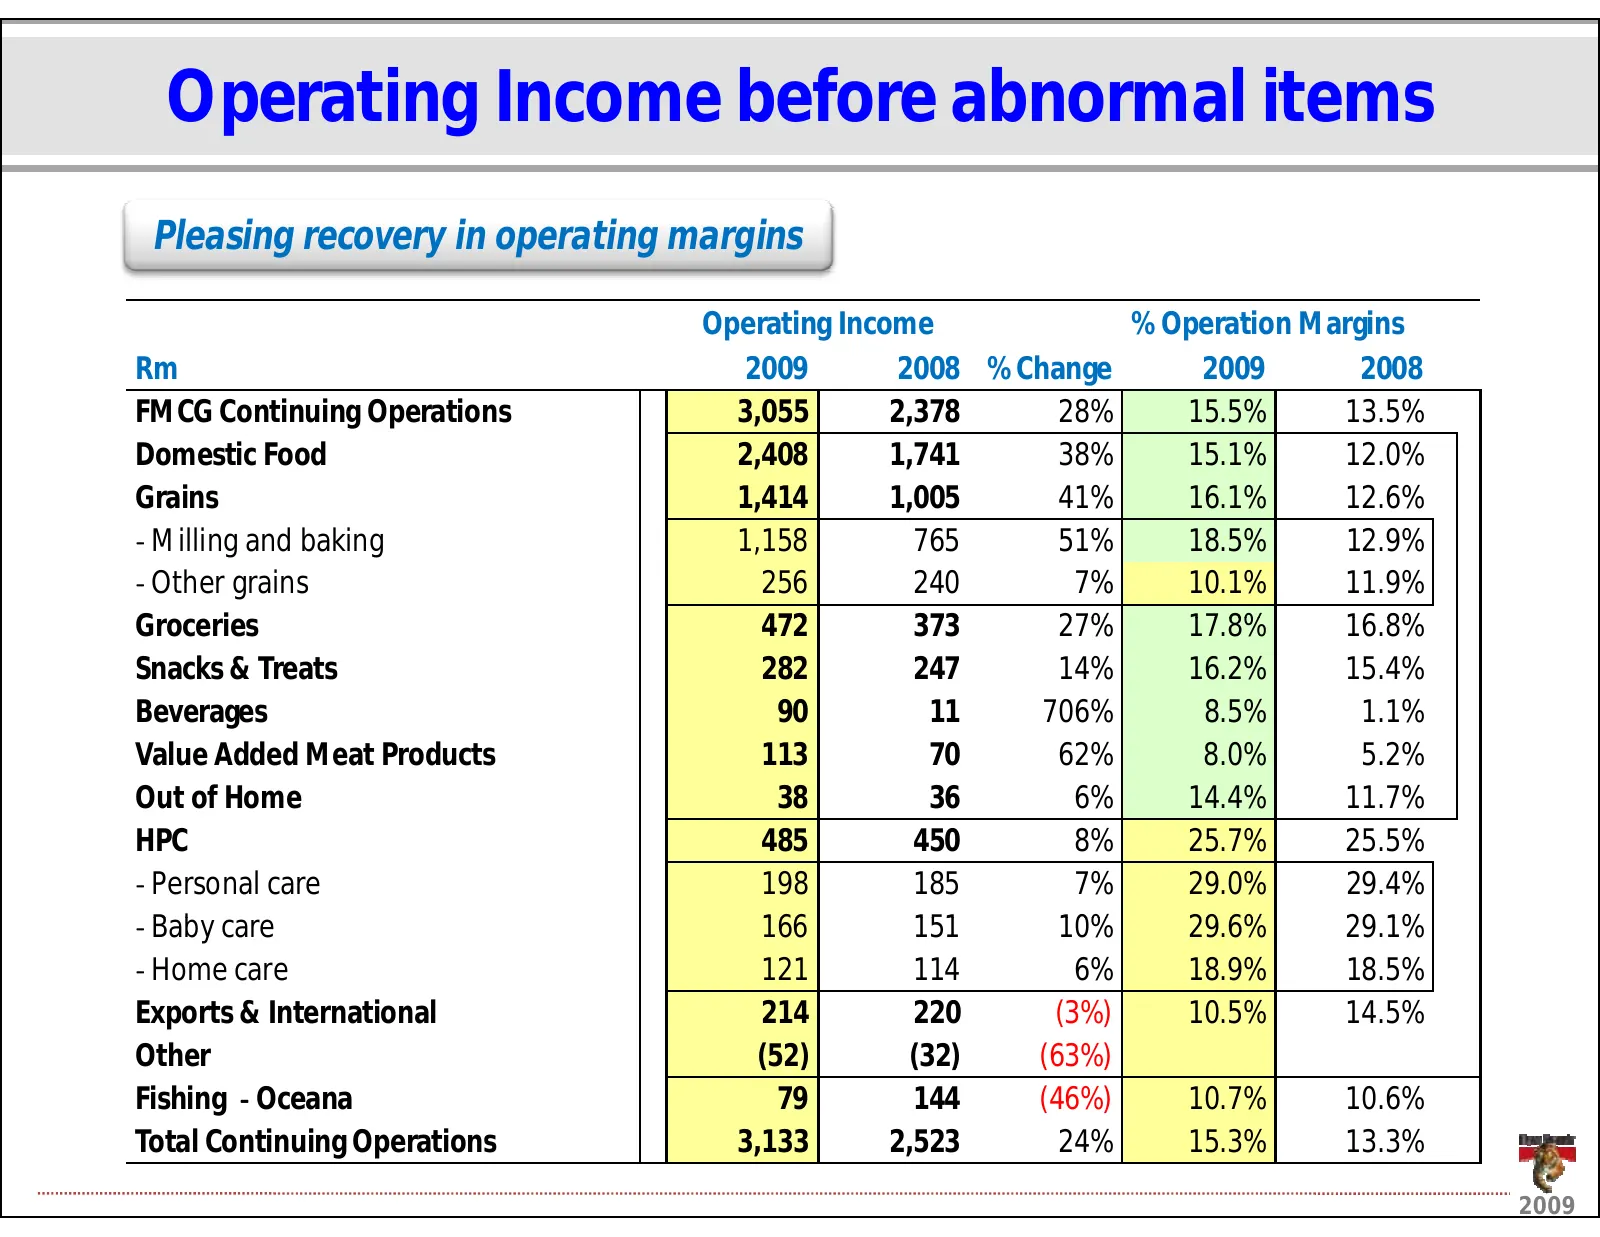
Slide 14: Operating Income before abnormal items
OperatingIncomebeforeabnormalitems Pleasingrecoveryinoperatingmargins OperatingIncome O ti I %OperationMargins %O ti M i Rm 2009 2008 %Change 2009 2008 FMCGContinuingOperations 3,055 2,378 28% 15.5% 13.5% DomesticFood 2,408 , 1,741 , 38% 15.1% 12.0% Grains 1,414 1,005 41% 16.1% 12.6% Ͳ Millingandbak
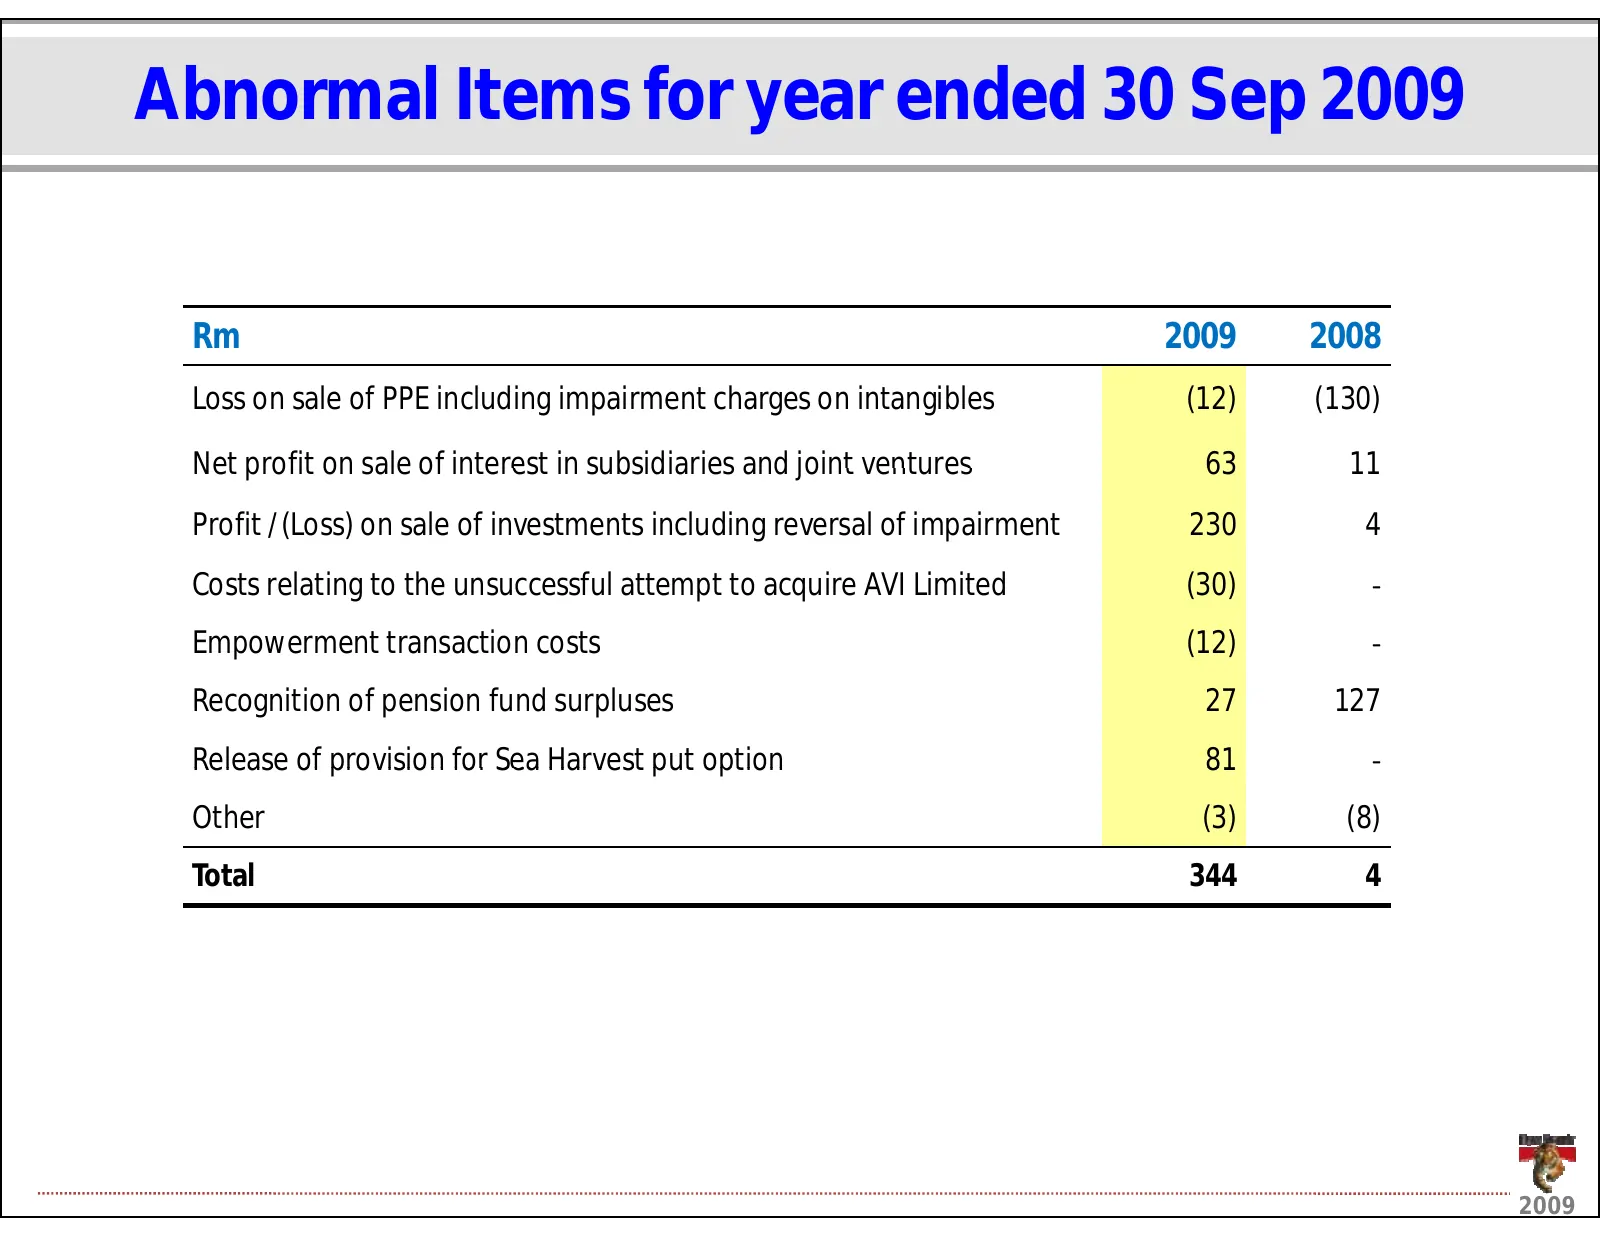
Slide 15: Abnormal Items for year ended 30 Sep 2009
AbnormalItemsforyearended30 Sep2009 Rm 2009 2008 LossonsaleofPPEincludingimpairmentcharges onintangibles (12) (130) Net profit on sale of interest in subsidiaries and joint ventures Netprofitonsaleofinterestinsubsidiariesandjointventures 63 63 11 11 Profit/(Loss)onsaleofinvestmentsincludingreversalo
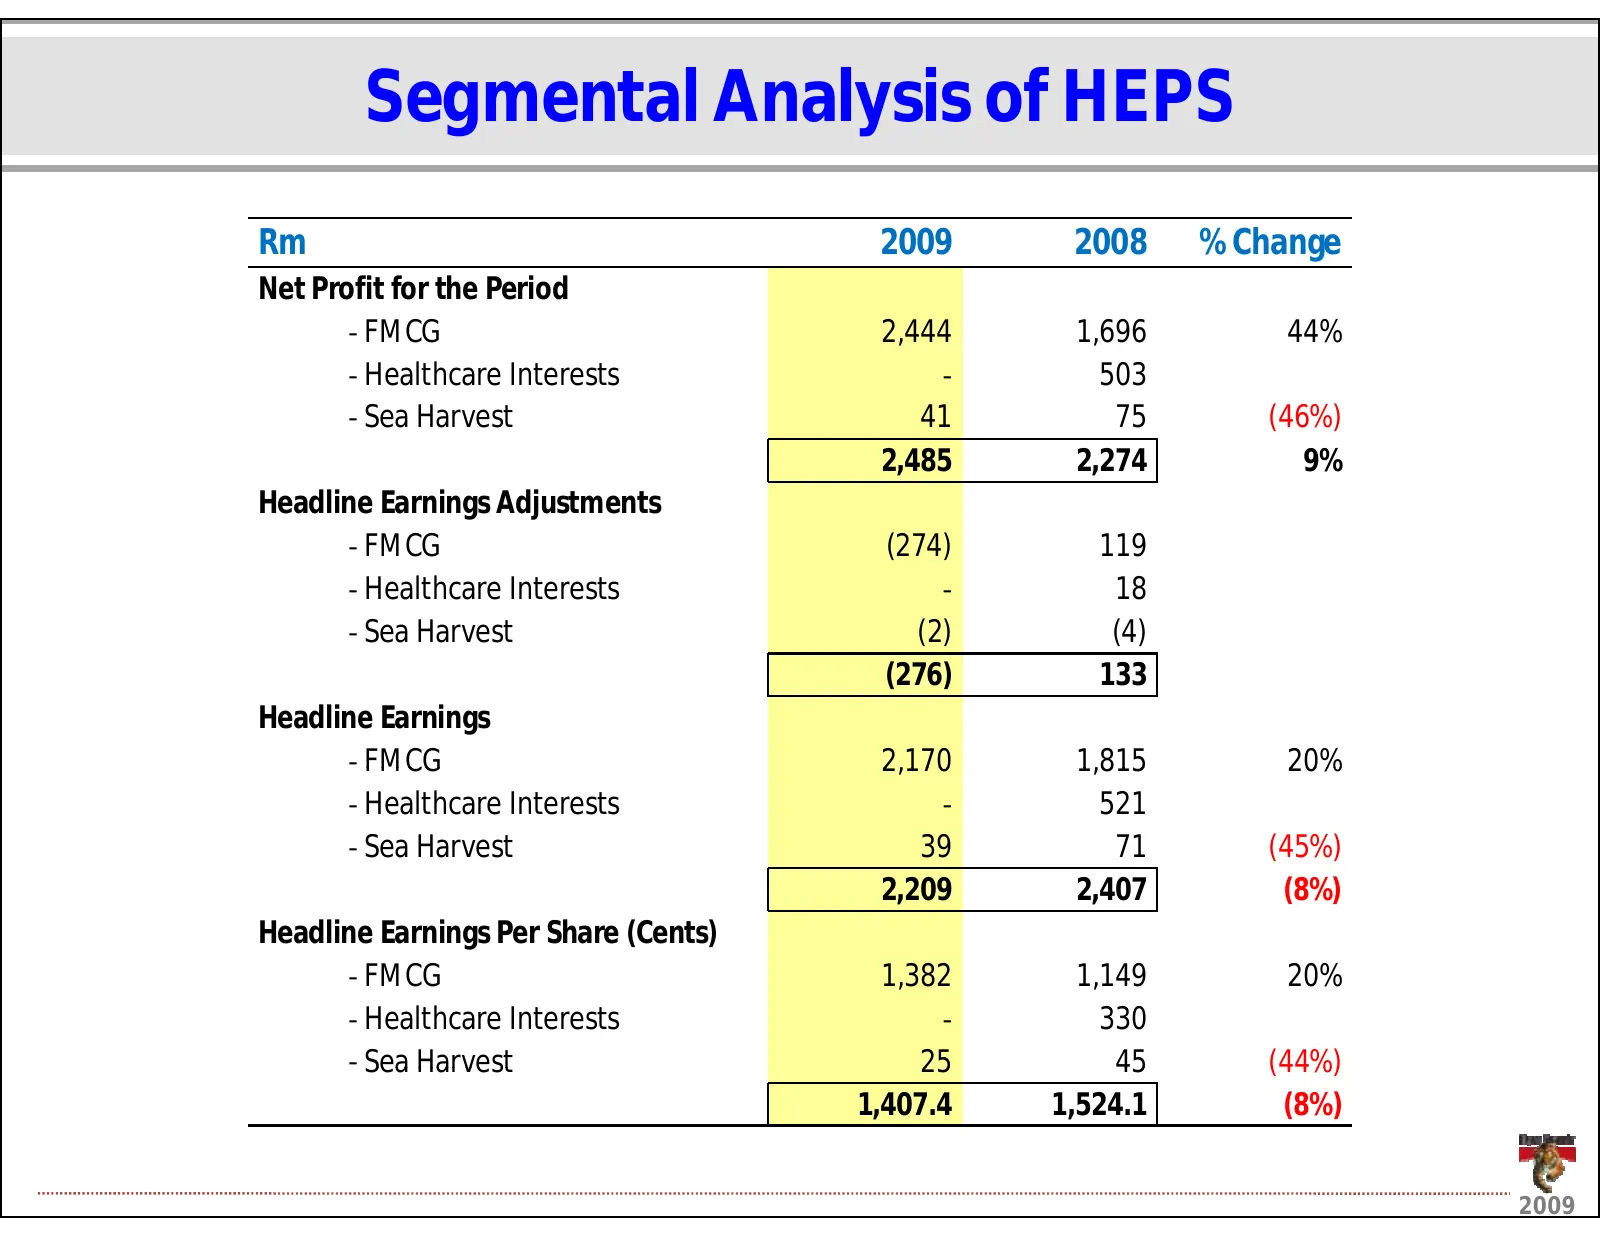
Slide 16: Segmental Analysis of HEPS
SegmentalAnalysisofHEPS Rm 2009 2008 %Change NetProfitforthePeriod Ͳ FMCG 2,444 1,696 44% Ͳ HealthcareInterests Ͳ 503 Ͳ SeaHarvest 41 75 (46%) 2,485 2,485 2,274 2,274 9% 9% HeadlineEarningsAdjustments Ͳ FMCG (274) 119 Ͳ HealthcareInterests Ͳ 18 Ͳ SeaHarvest (2) (4) (276) 133 HeadlineEarnings Ͳ FMCG
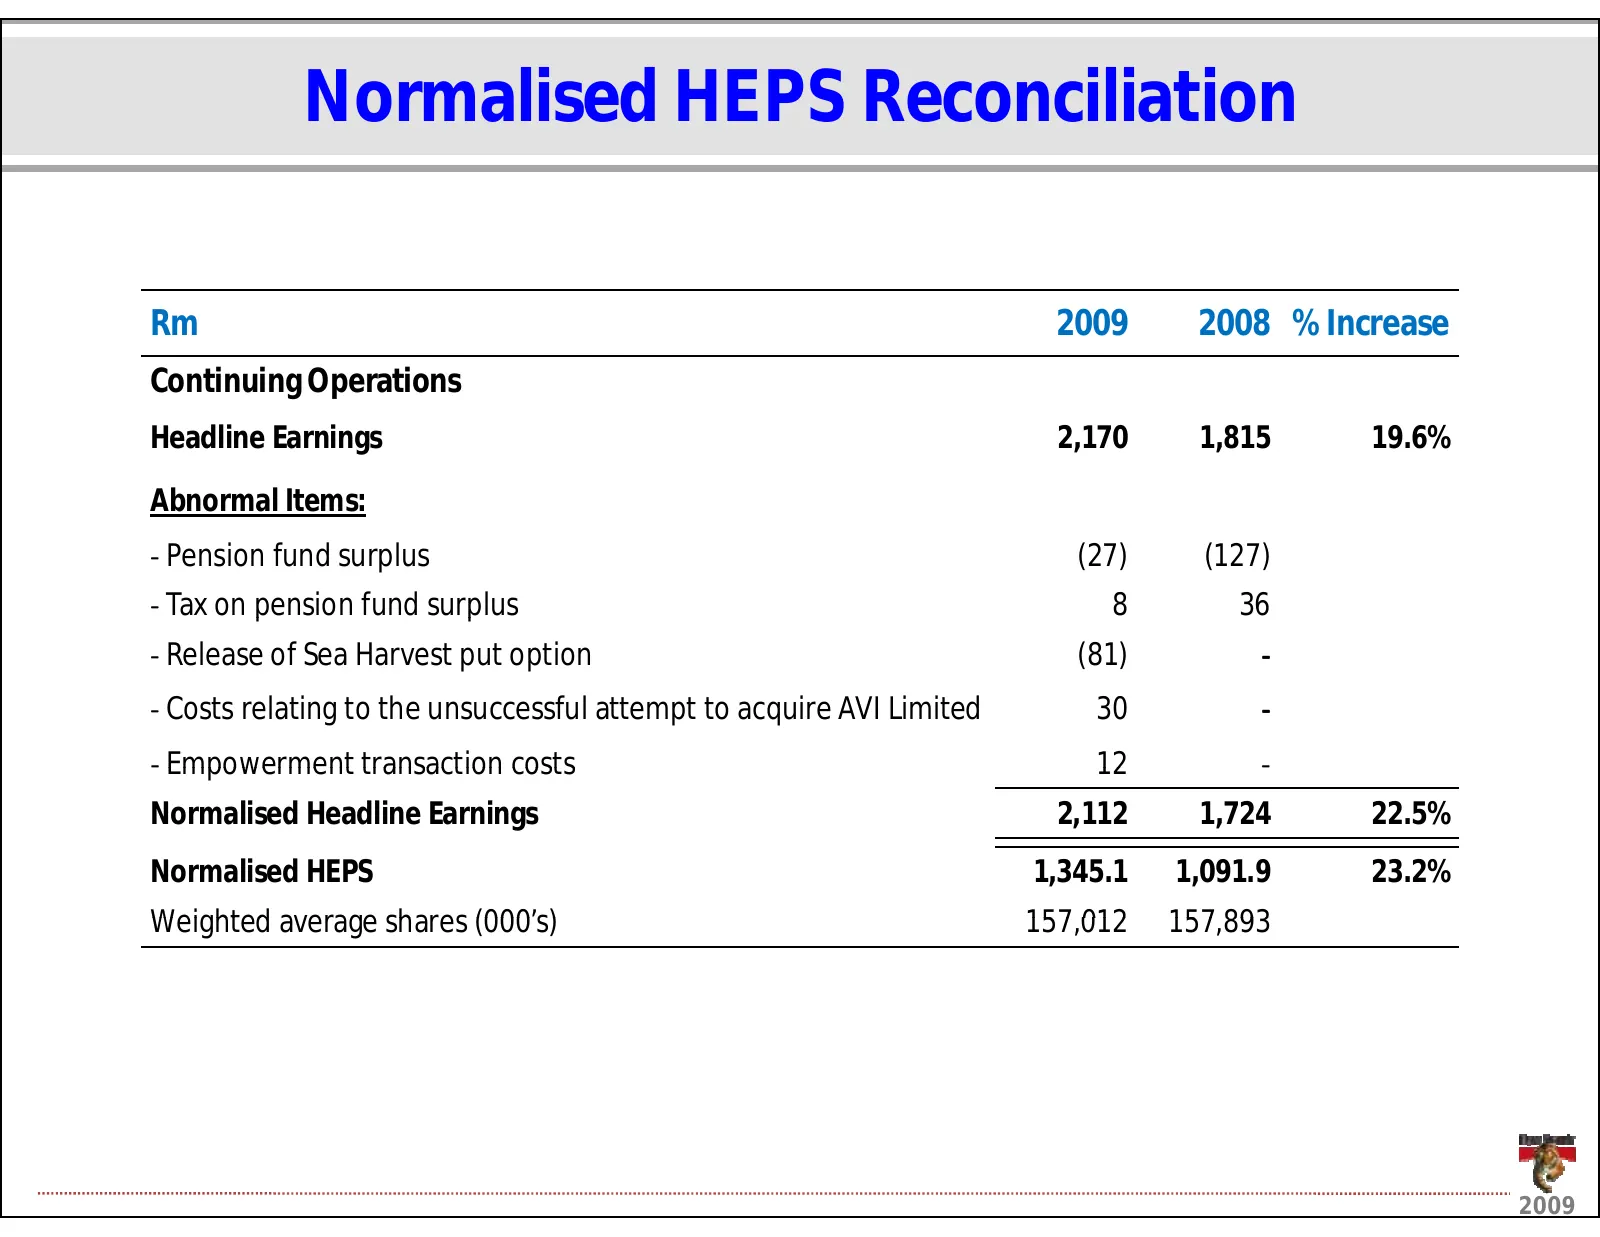
Slide 17: Normalised HEPS Reconciliation
NormalisedHEPSReconciliation R Rm 2009 2008 %Increase %I ContinuingOperations HeadlineEarnings 2,170 1,815 19.6% AbnormalItems: Ͳ Pensionfundsurplus (27) (127) Ͳ Taxonpensionfundsurplus p p 8 36 Ͳ ReleaseofSeaHarvestputoption (81) Ͳ Ͳ CostsrelatingtotheunsuccessfulattempttoacquireAVILimited 30 Ͳ Ͳ E
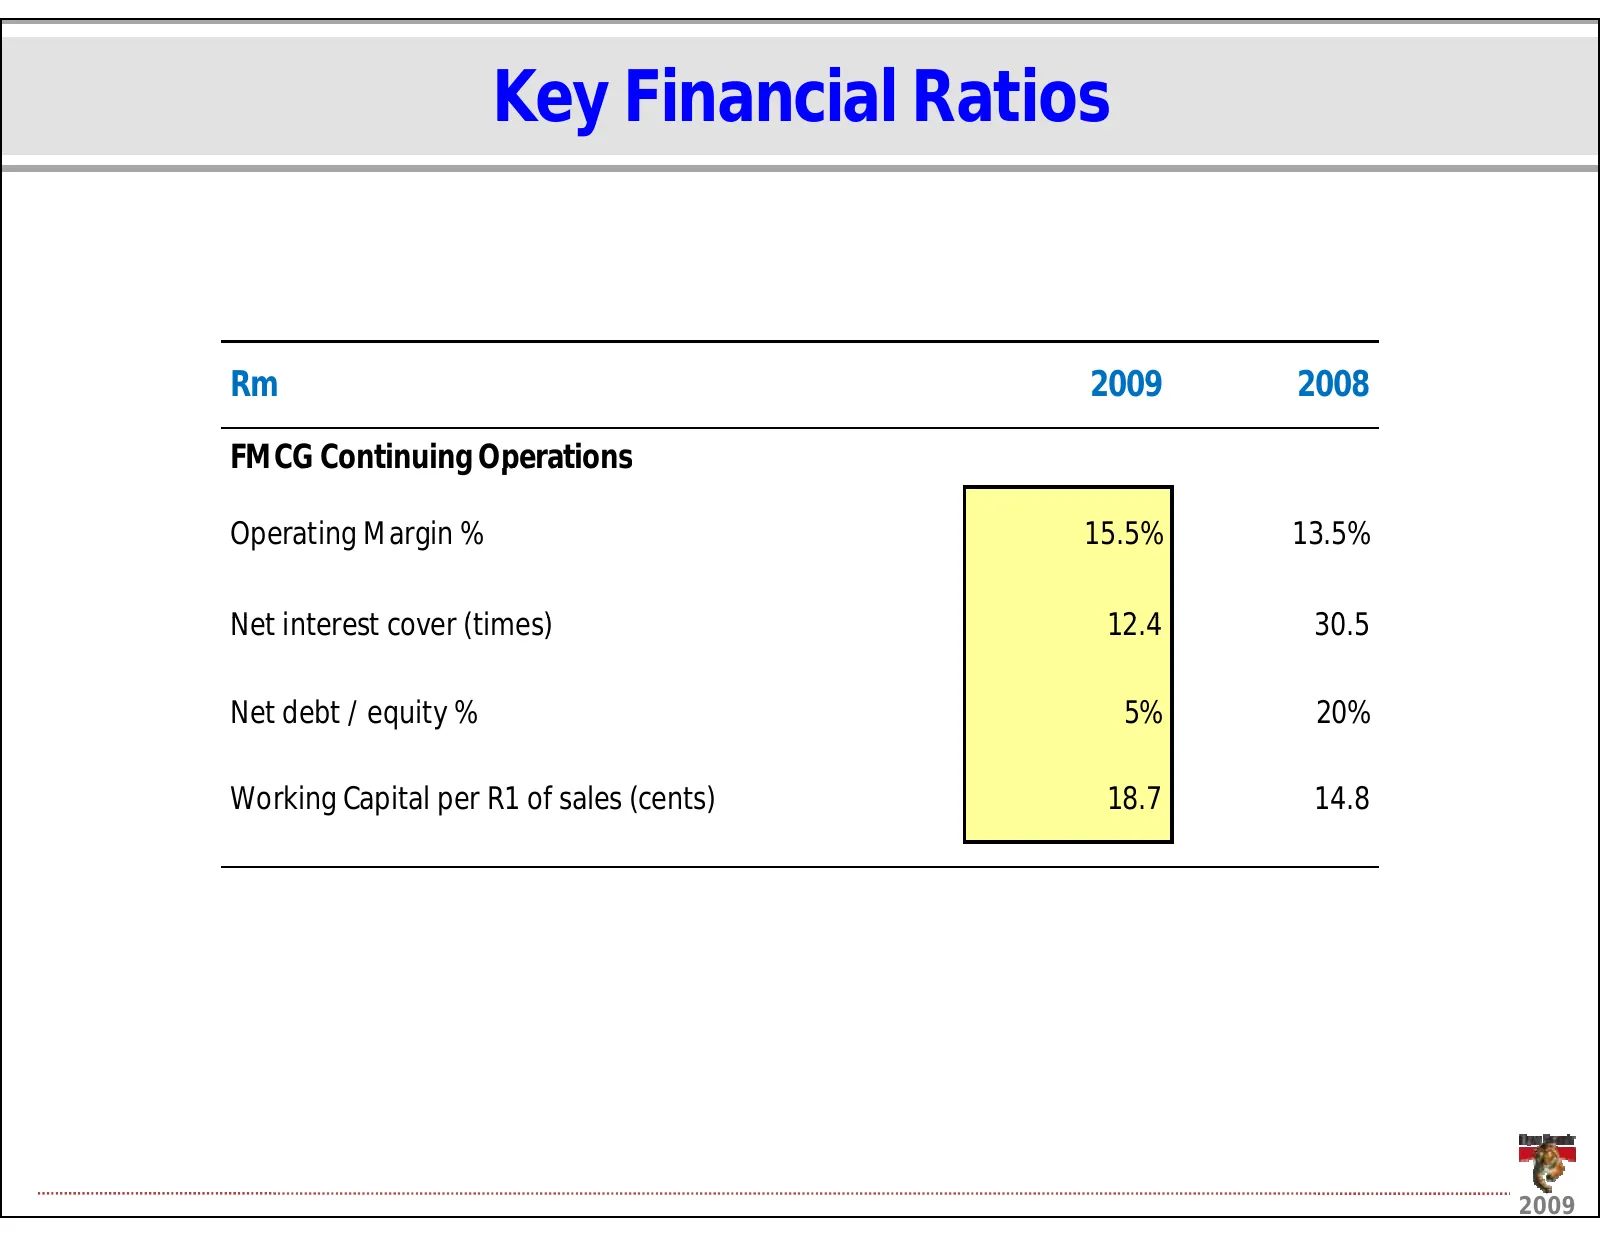
Slide 18: Key Financial Ratios
KeyFinancialRatios Rm 2009 2008 FMCG Continuing Operations FMCGContinuingOperations OperatingMargin% 15.5% 13.5% N ti t Netinterest t cover(times) (ti ) 12 4 12.4 30 5 30.5 Netdebt/equity % 5% 20% Working CapitalperR1ofsales(cents) 18.7 14.8 2009
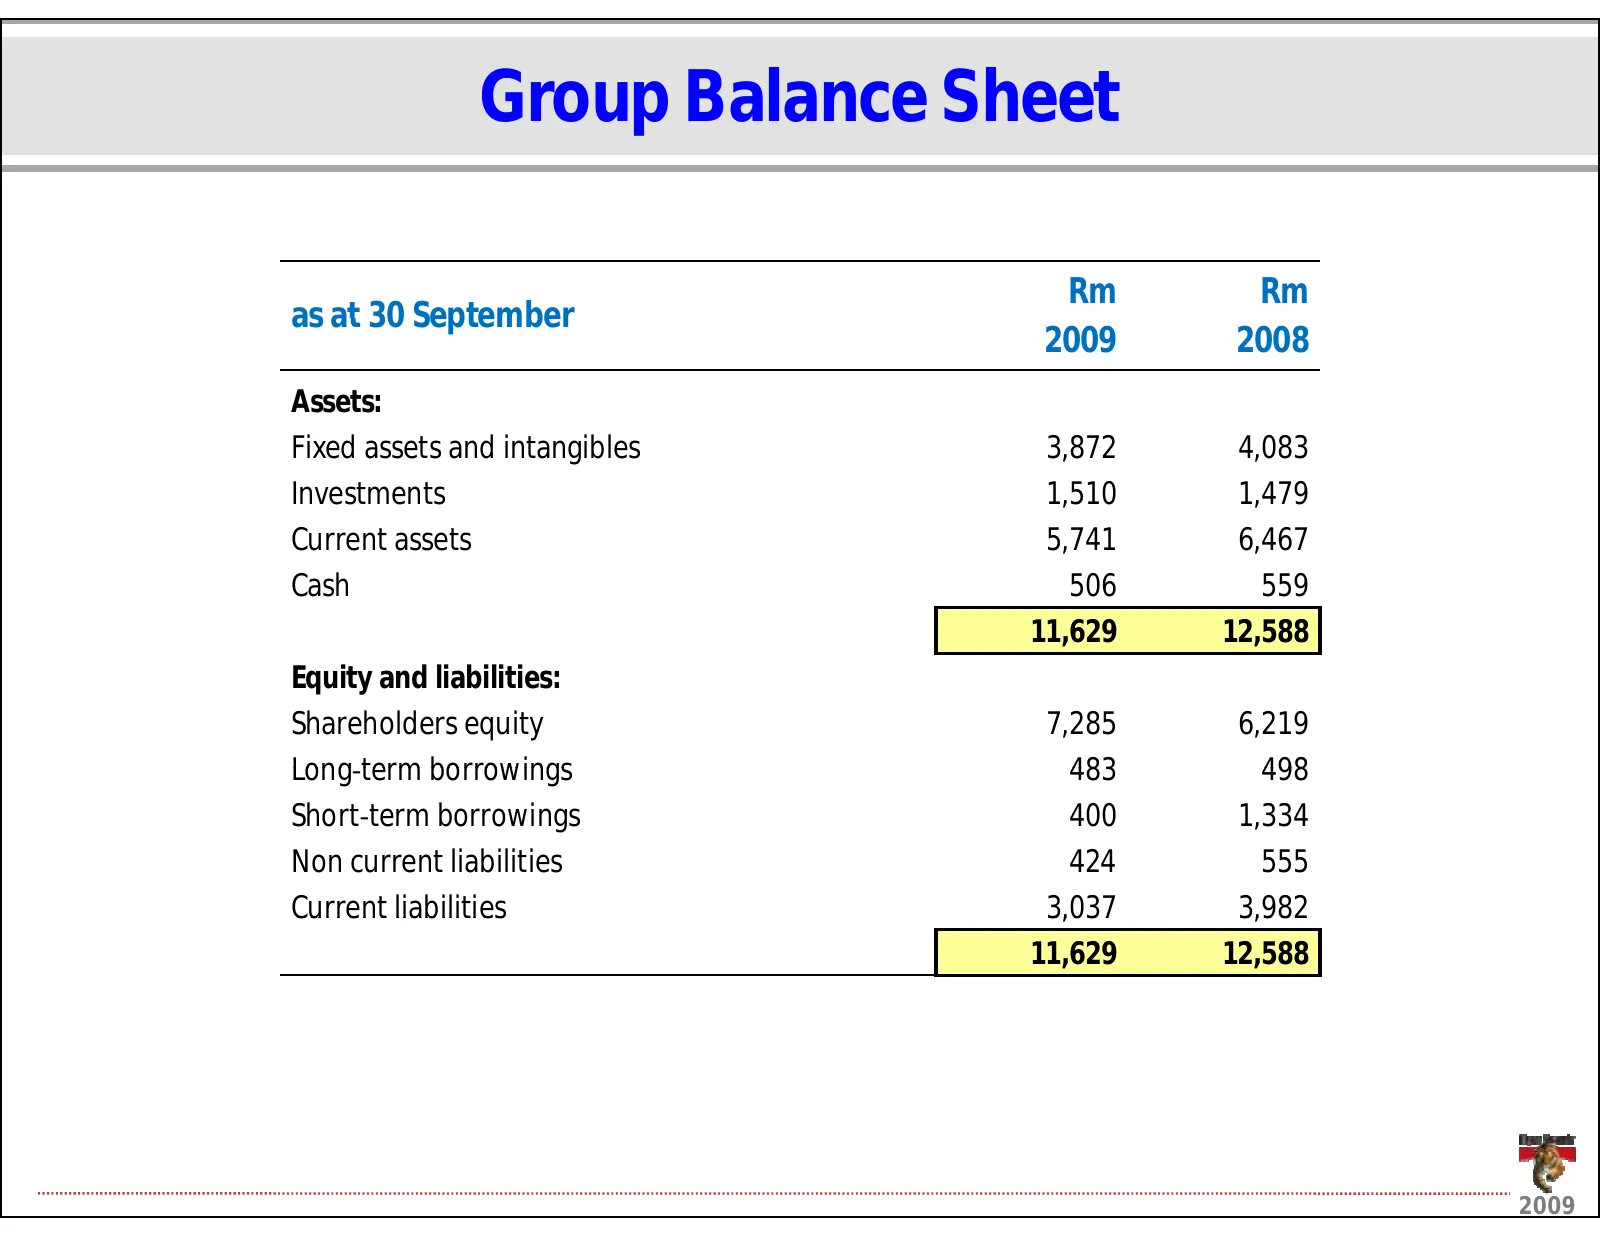
Slide 19: Group Balance Sheet
GroupBalanceSheet Rm Rm as at 30 September asat30September 2009 2008 Assets: Fixedassetsandintangibles 3,872 4,083 Investments 1,510 1,479 Currentassets 5,741 6,467 Cash 506 559 11,629 12,588 Equityandliabilities: Shareholdersequity 7,285 6,219 Long term borrowings LongͲtermborrowings 483 483 498 49
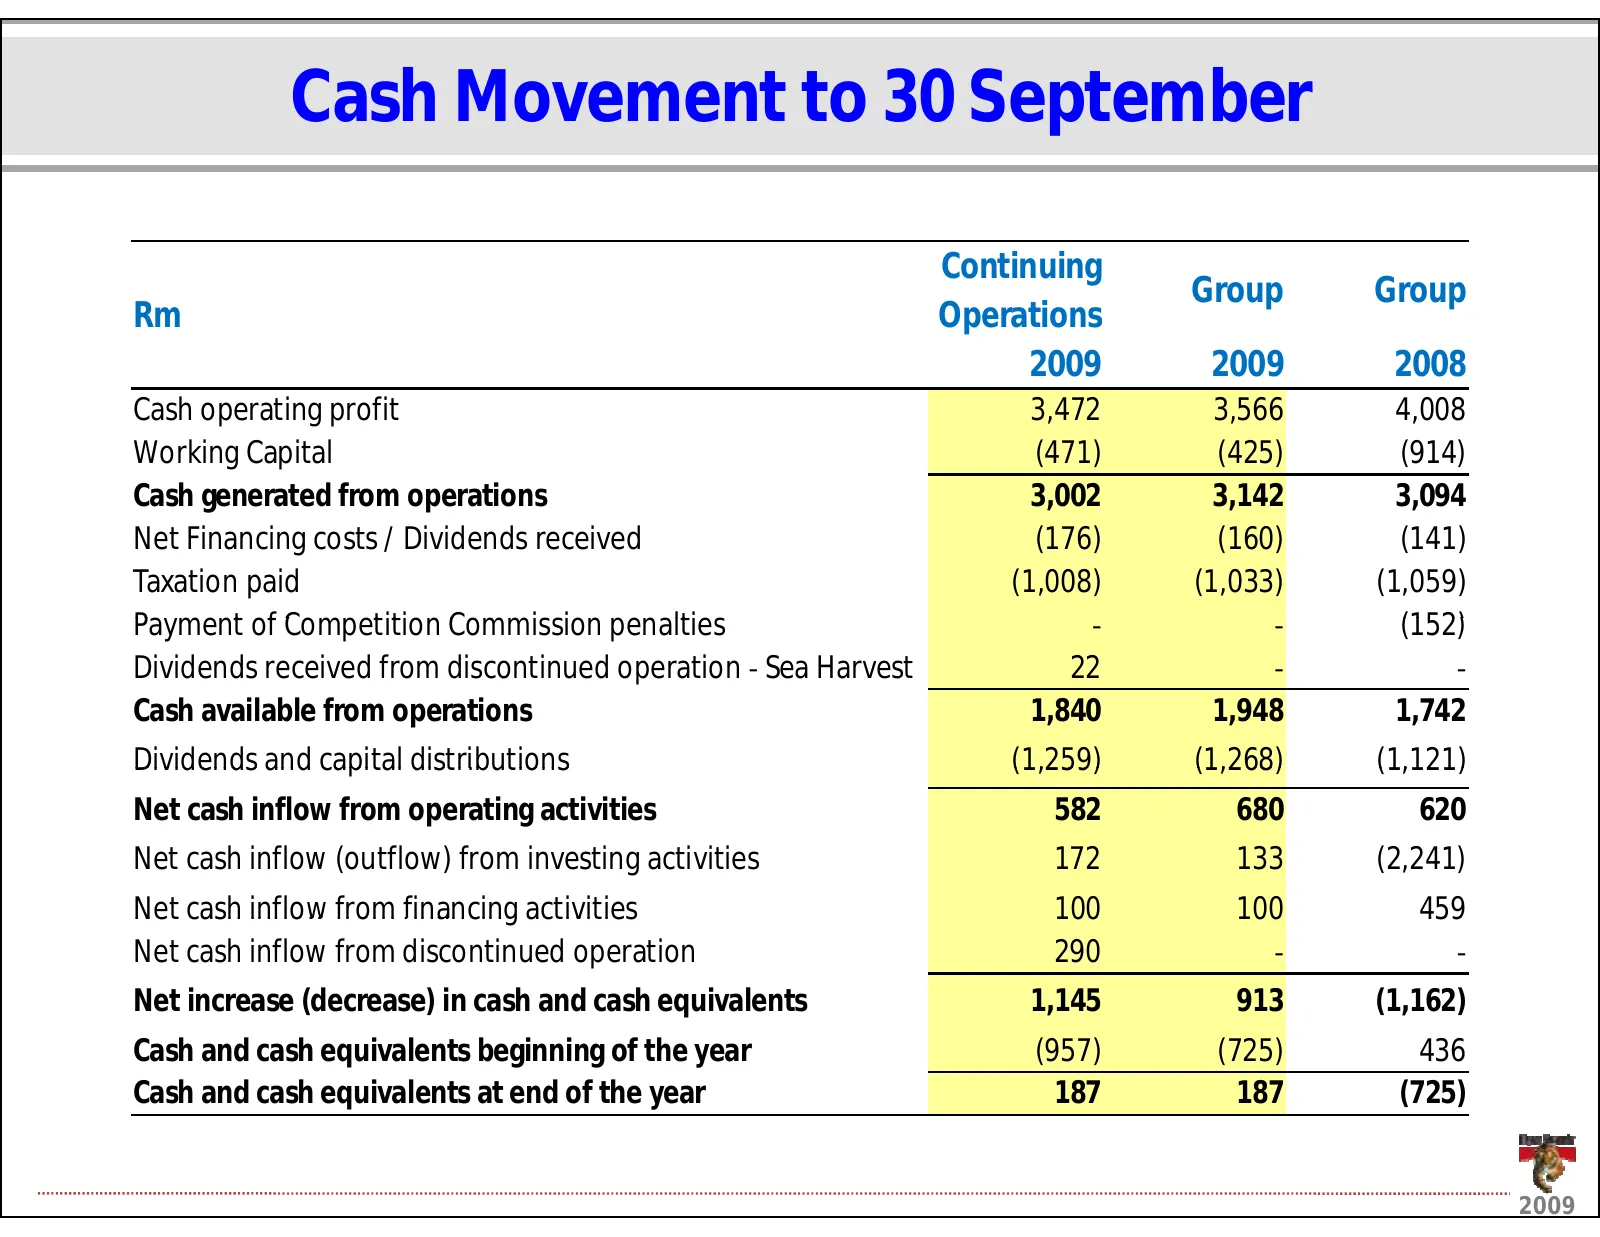
Slide 20: Cash Movement to 30 September
CashMovementto30 September Continuing Group Group Rm Operations 2009 2009 2008 Cashoperatingprofit 3,472 3,566 4,008 WorkingCapital g p ((471)) ((425)) ((914)) Cashgeneratedfromoperations 3,002 3,142 3,094 NetFinancingcosts/Dividendsreceived (176) (160) (141) Taxationpaid (1,008) (1,033) (1,059) P P
Slide 21: Capital Expenditure & Commitments
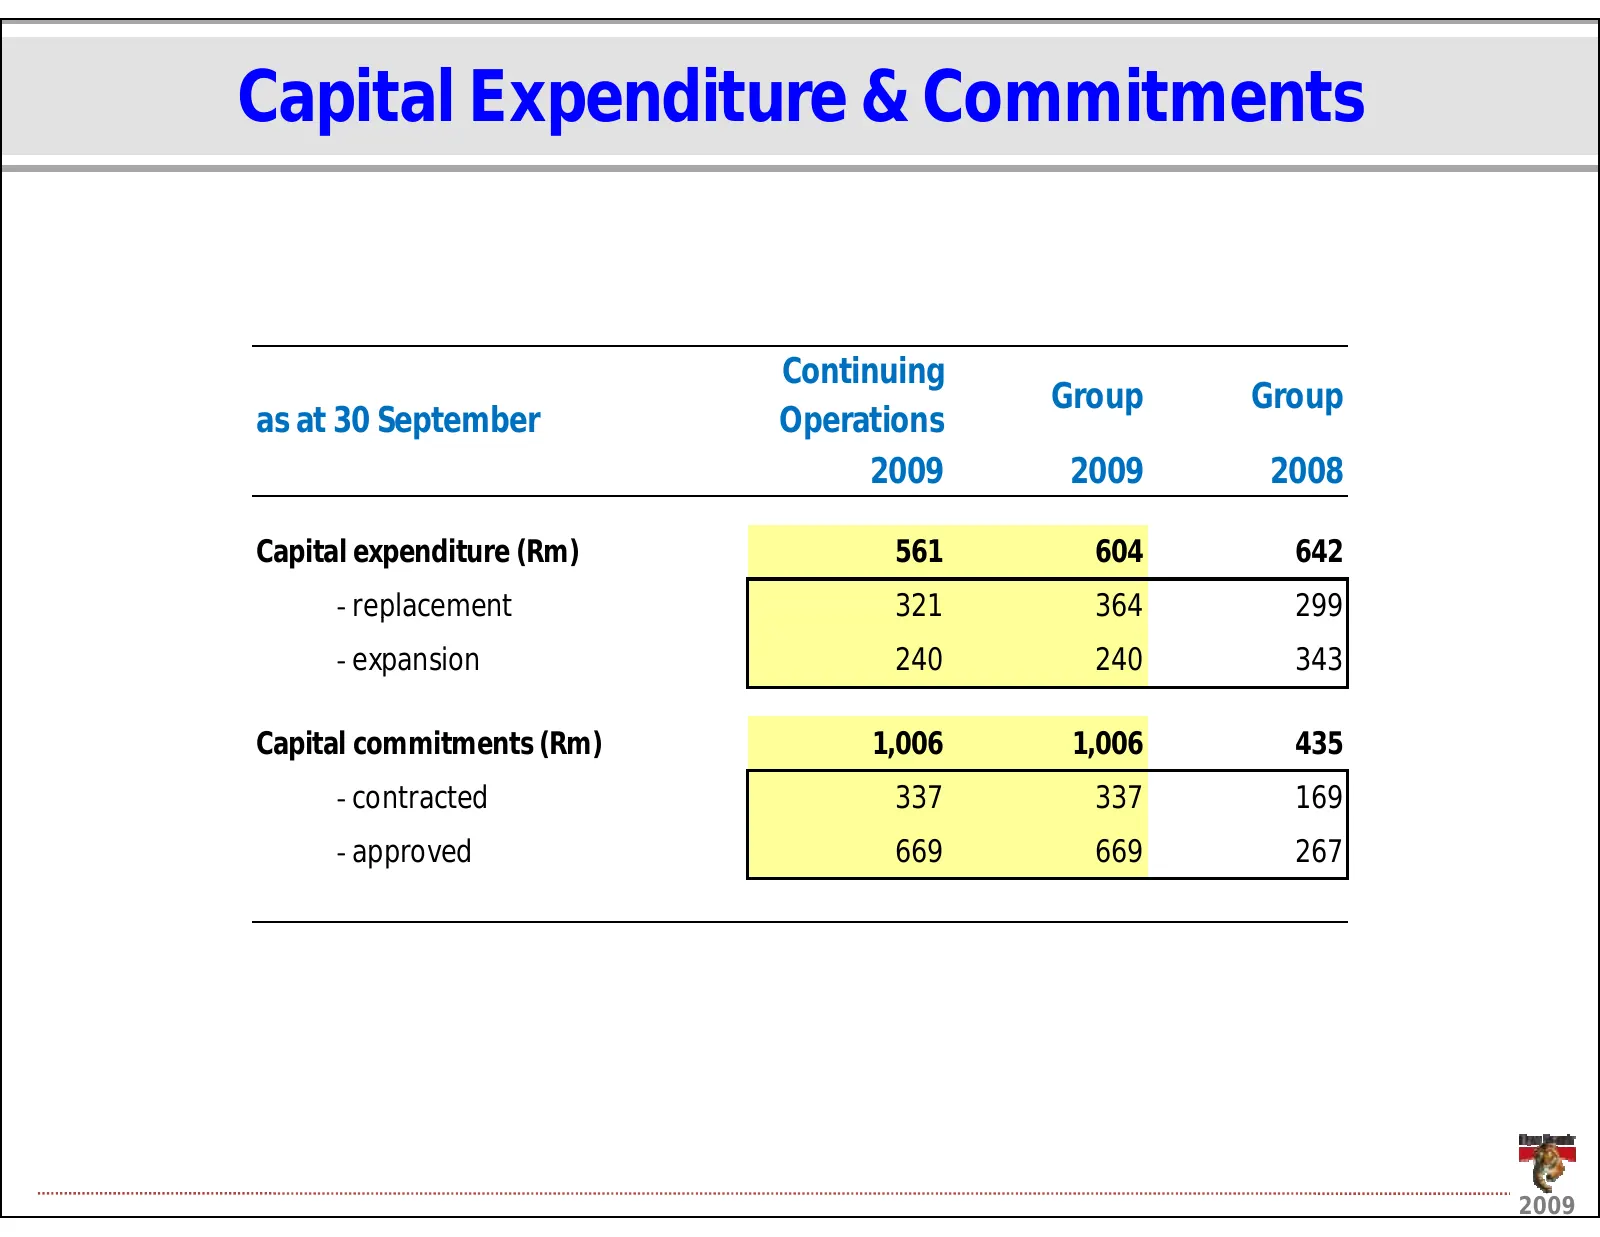
CapitalExpenditure&Commitments Continuing Group Group asat30September Operations 2009 2009 2008 Capitalexpenditure(Rm) 561 604 642 Ͳ replacement p 321 364 299 Ͳ expansion 240 240 343 Capitalcommitments(Rm) 1,006 1,006 435 Ͳ contracted 337 337 169 Ͳ approved 669 669 267 2009
Slide 22: Summary
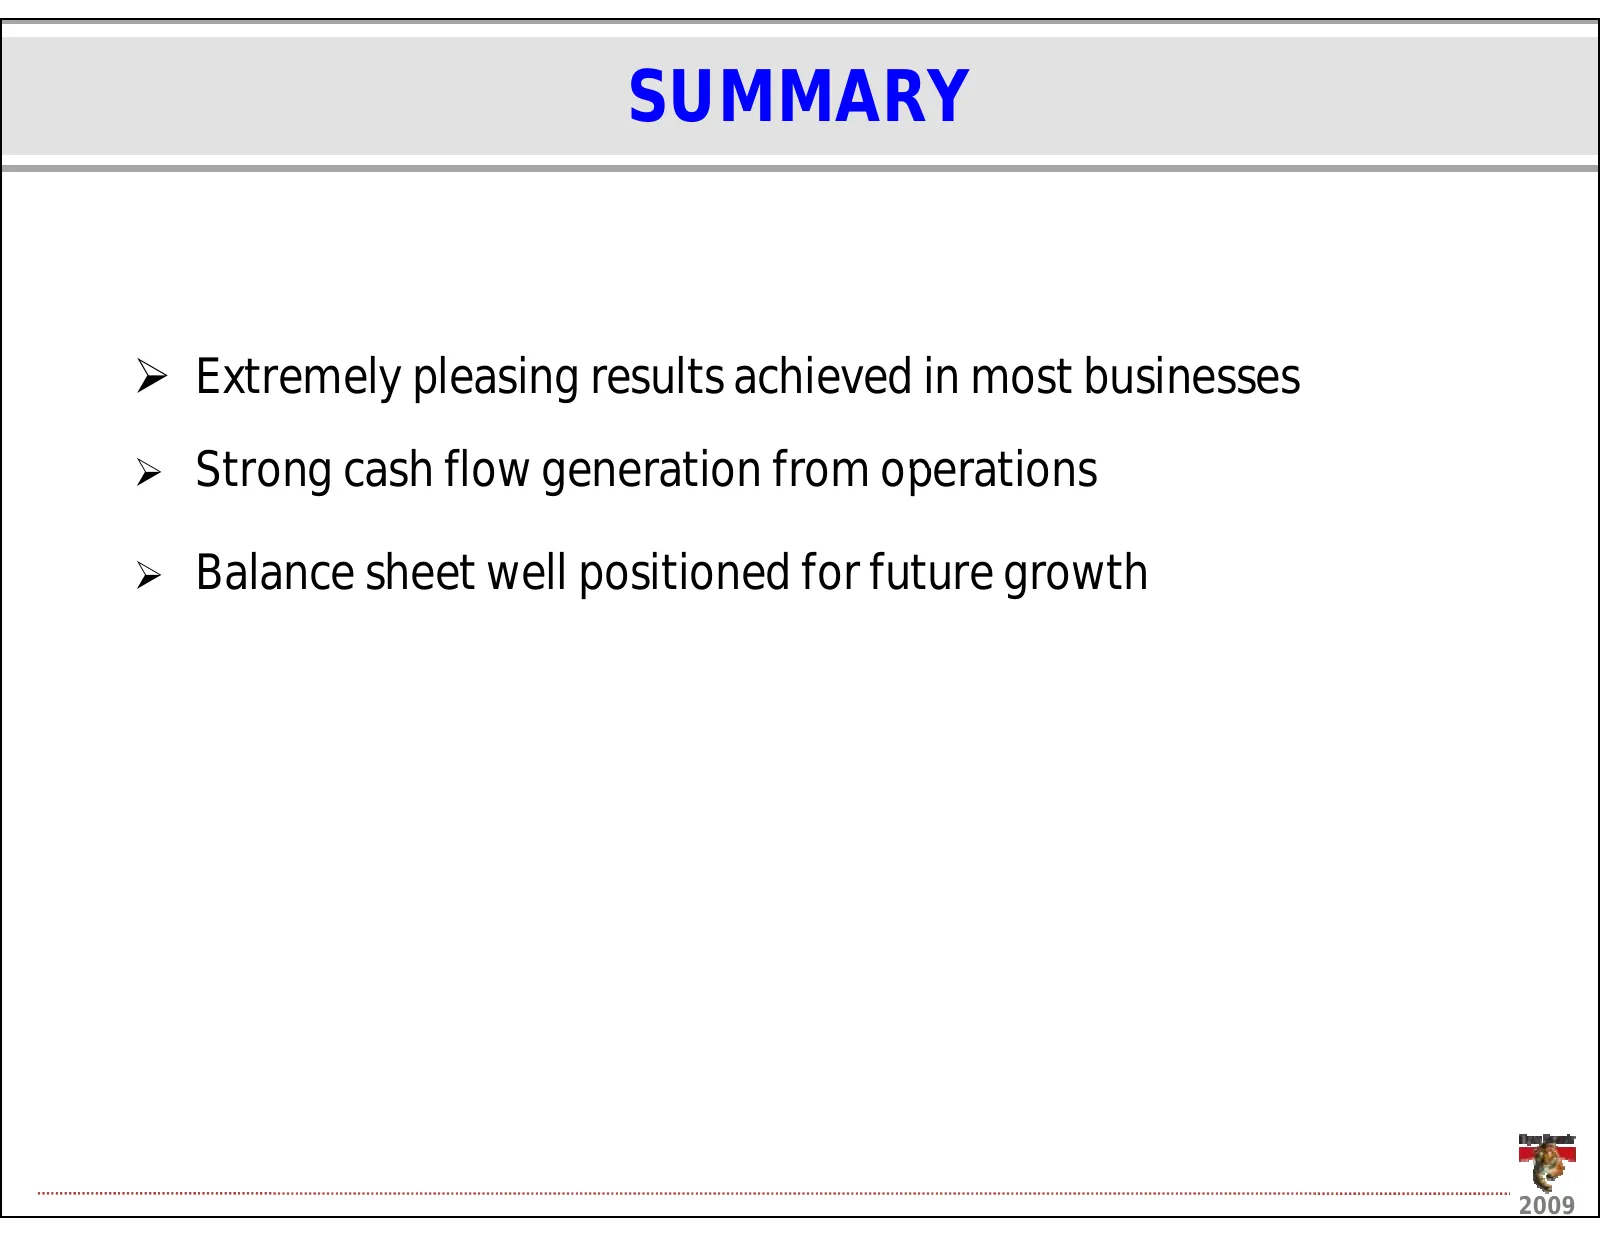
SUMMARY ¾ Extremelypleasingresultsachievedinmostbusinesses ¾ Strong cash flow generation from operations Strongcashflowgenerationfromoperations ¾ Balancesheetwellpositionedforfuturegrowth 2009
Slide 23: Grains
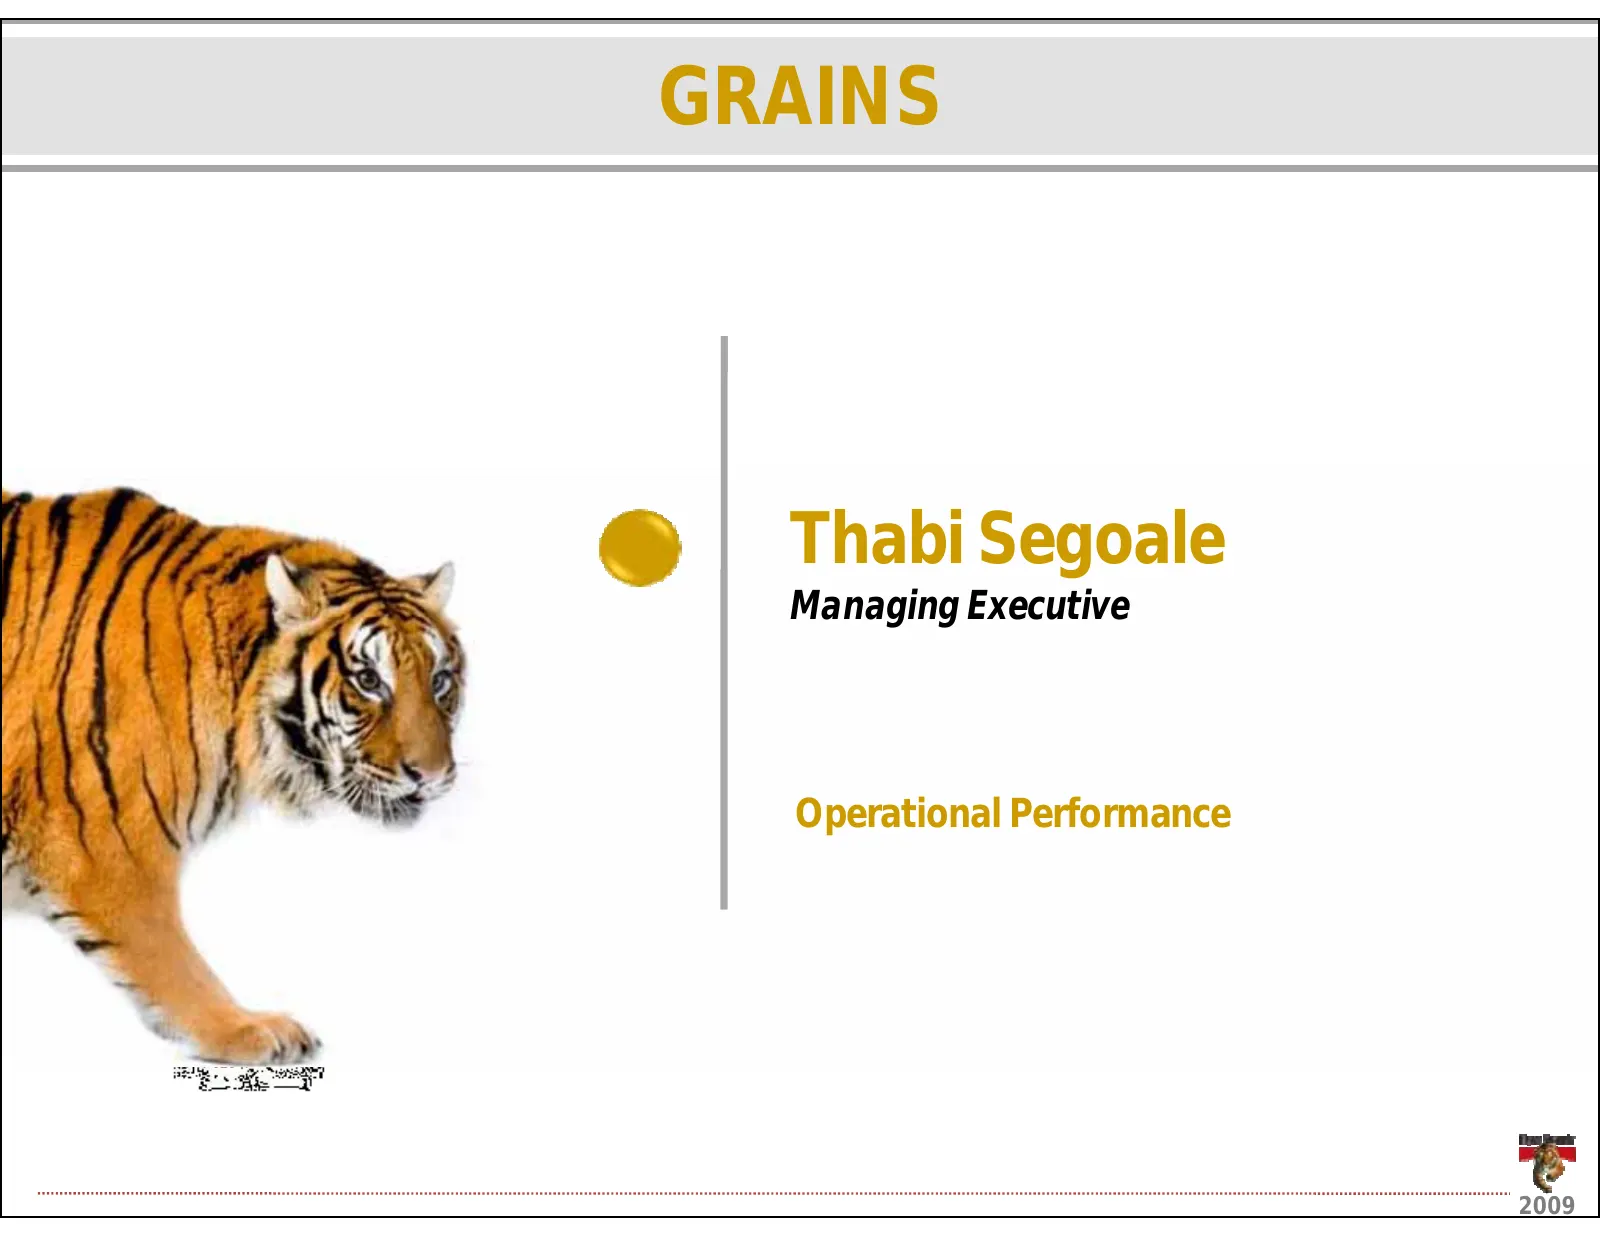
GRAINS ThabiSegoale Managing Executive ManagingExecutive OperationalPerformance 2009
Slide 24: Grains operating margins restored
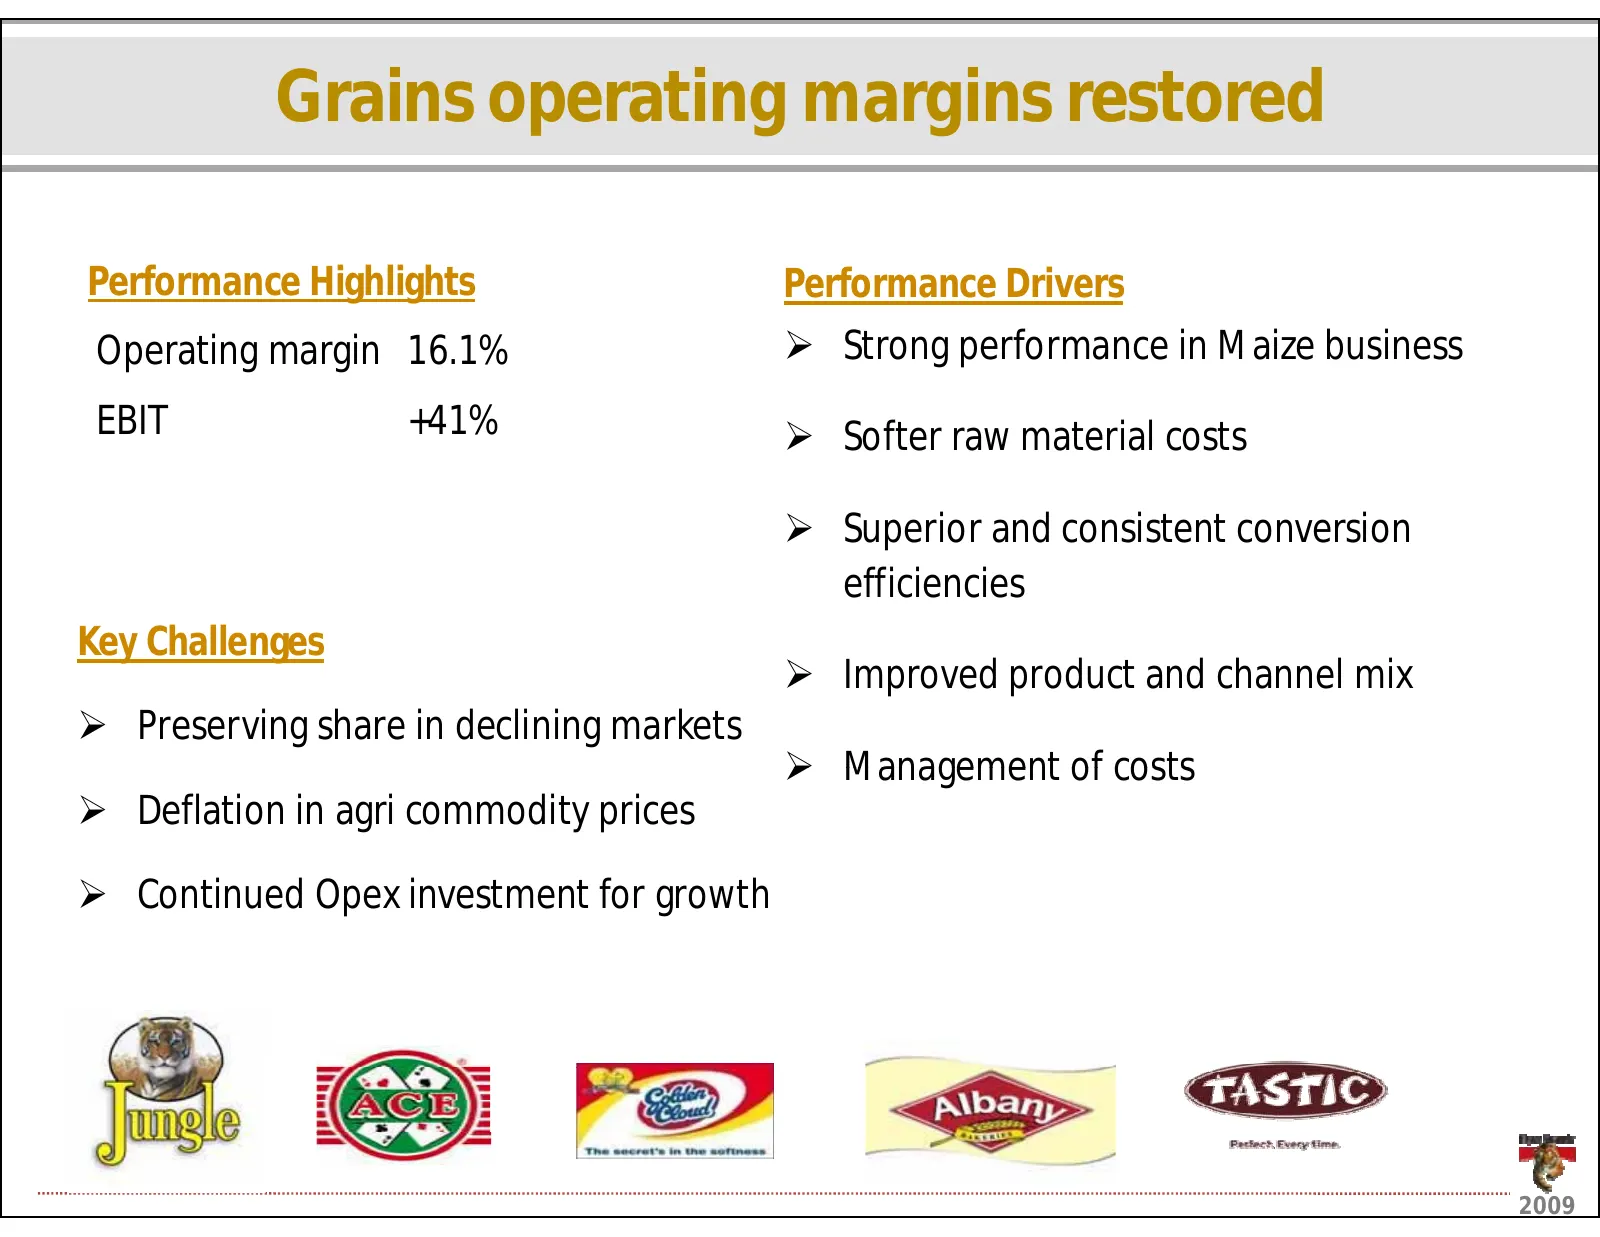
Grainsoperatingmarginsrestored PerformanceHighlights PerformanceDrivers Operatingmargin 16.1% ¾ StrongperformanceinMaizebusiness EBIT +41% ¾ Softerrawmaterialcosts ¾ Superiorandconsistentconversion efficiencies KeyChallenges ¾ Improvedproductandchannelmix ¾ Preservingshareindecliningmarkets ¾ Manage
Slide 25: Maize Milling
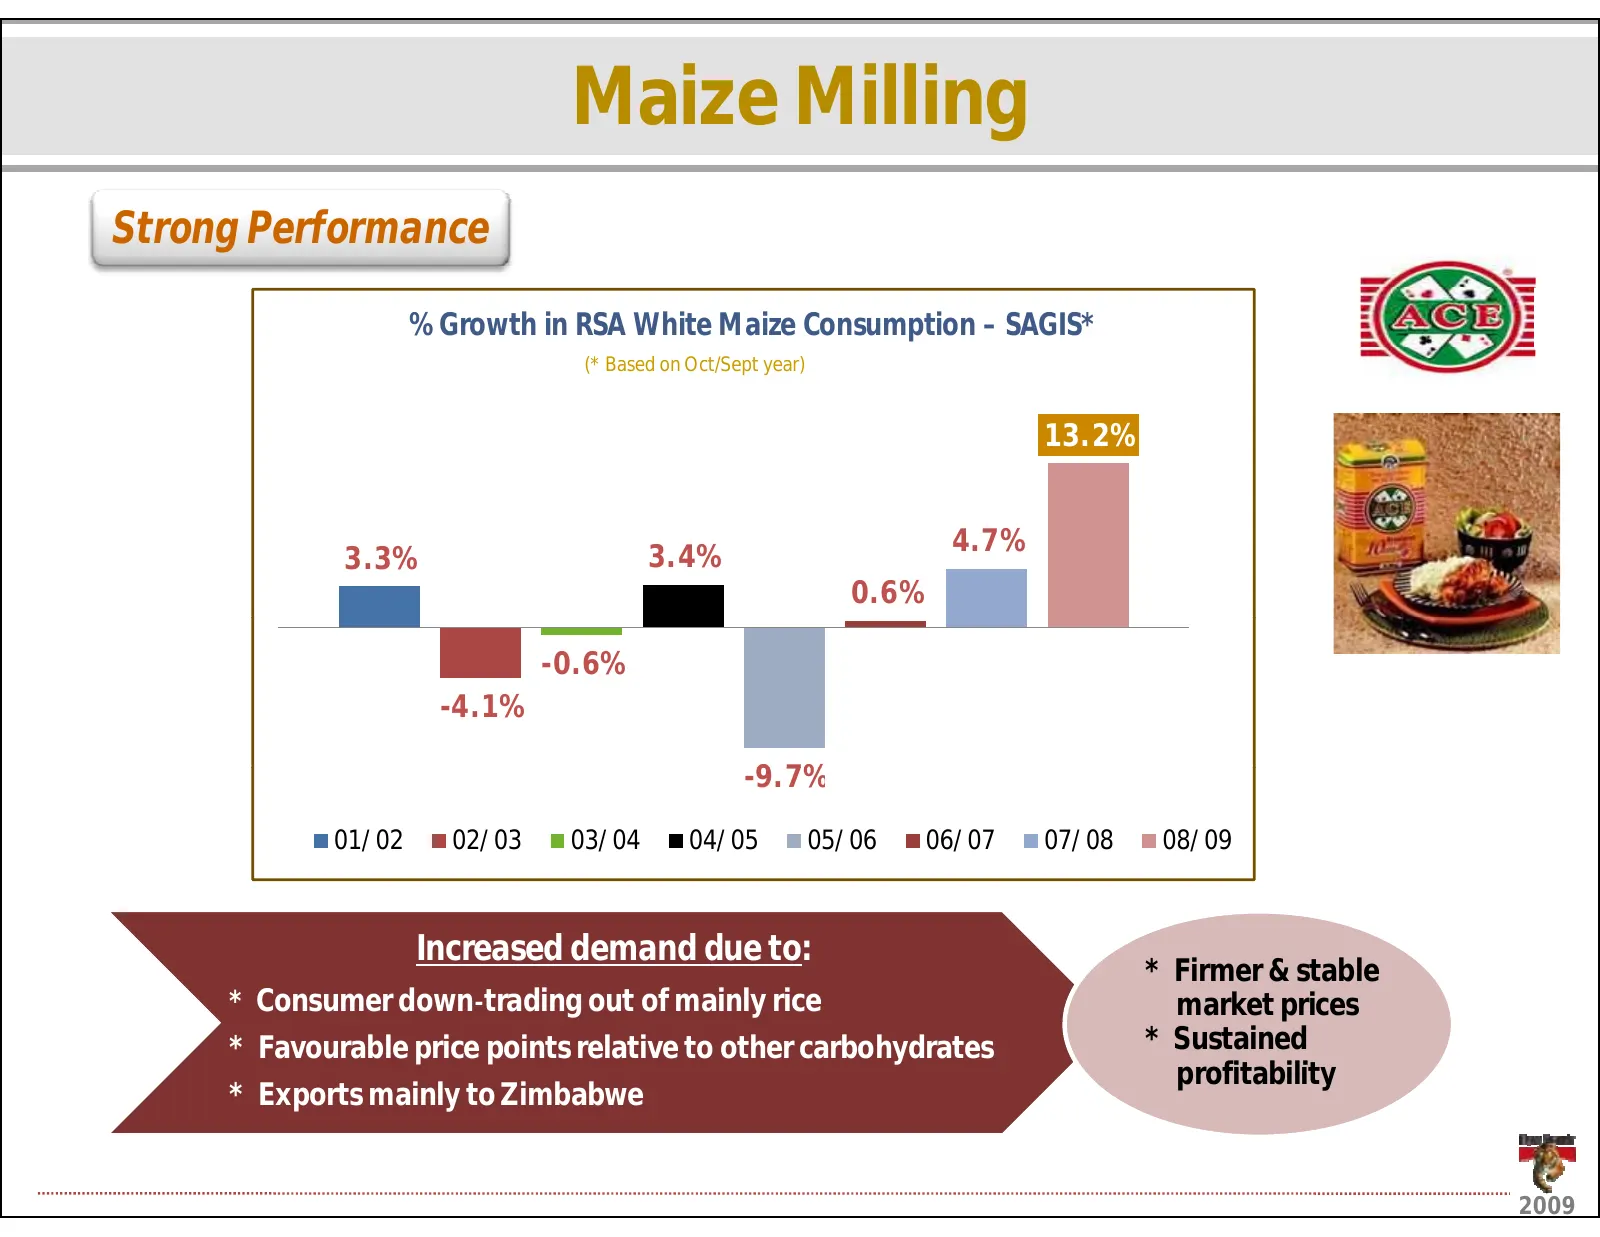
MaizeMilling StrongPerformance %G %GrowthinRSAWhiteMaizeConsumption– th i RSA Whit M i C ti SAGIS* (*BasedonOct/Septyear) 13.2% 4.7% 3.3% 3.4% 0.6% -0.6% -4.1% -9.7% 9 7% 01/02 02/03 03/04 04/05 05/06 06/07 07/08 08/09 Increaseddemanddueto: *Firmer&stable *ConsumerdownǦtradingoutofmainlyrice marketp
Slide 26: Wheat Milling & Baking
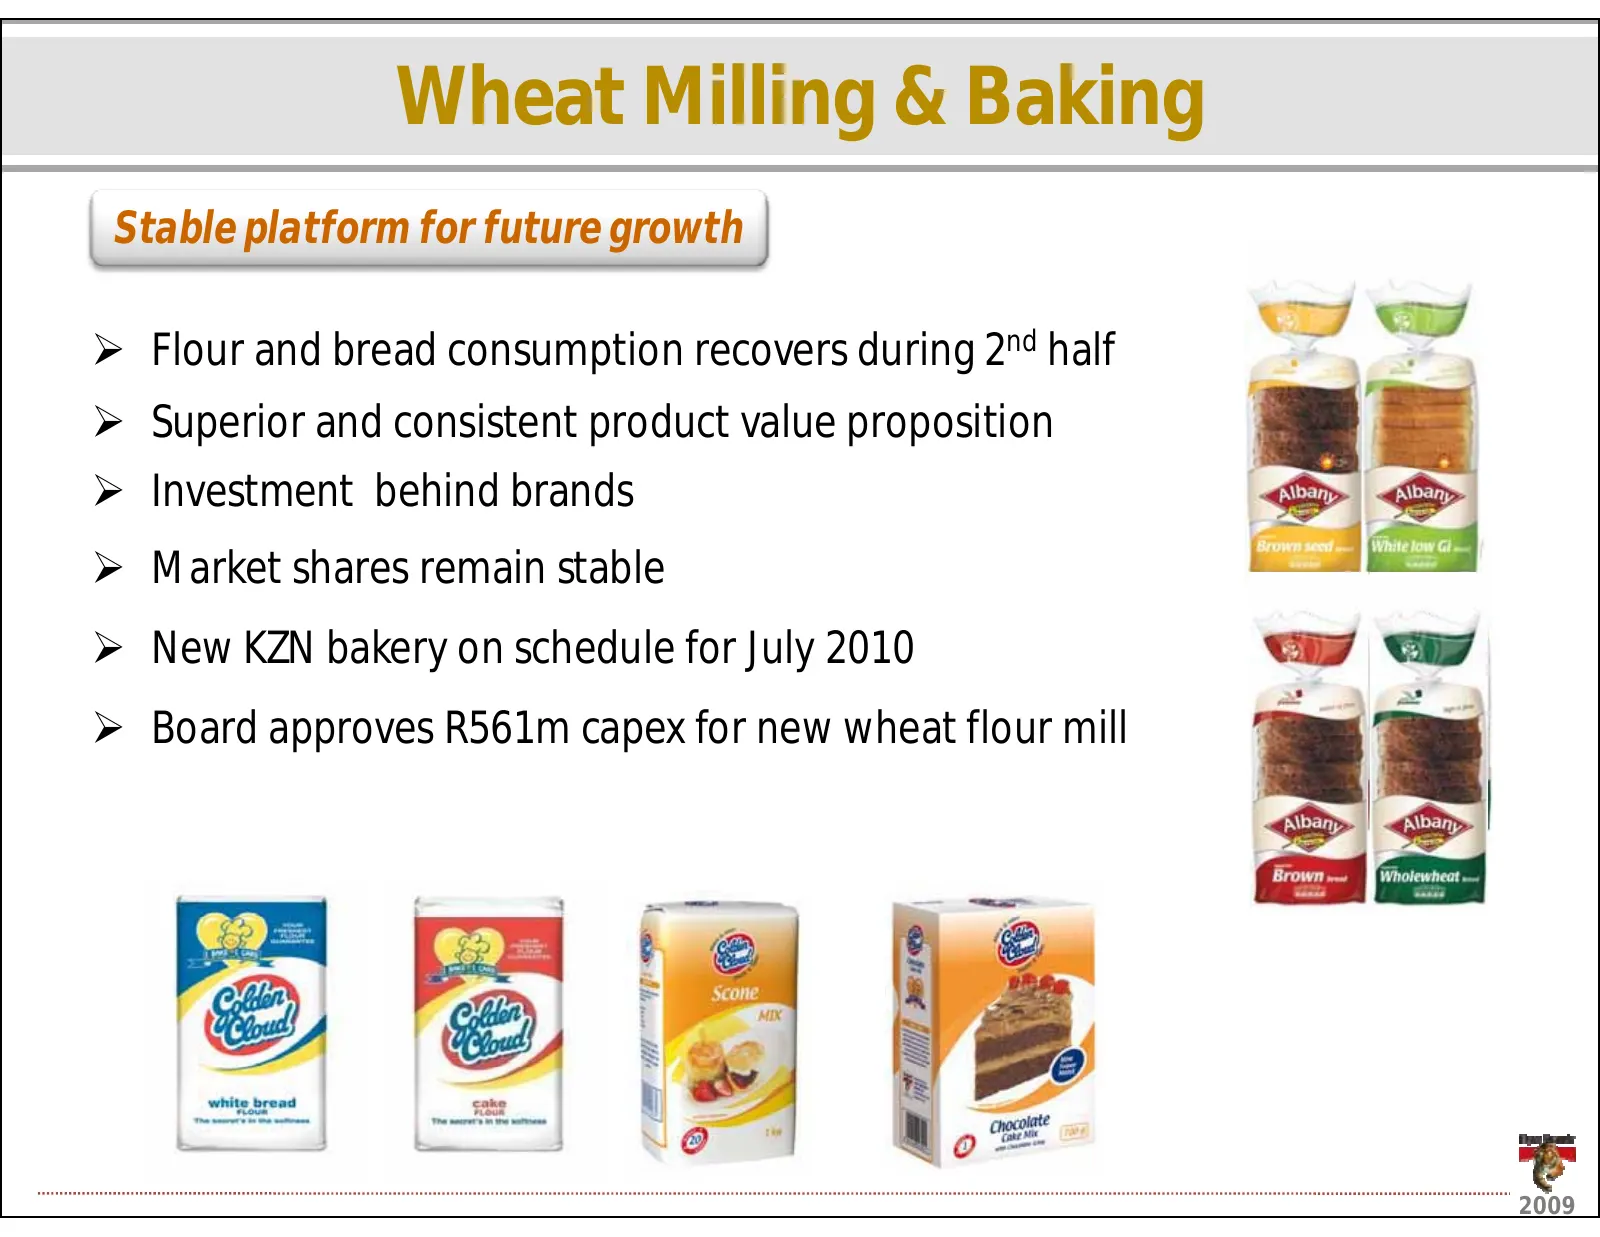
WheatMilling&Baking Stableplatformforfuturegrowth ¾ Flourandbreadconsumptionrecoversduring2nd half ¾ Superiorandconsistentproductvalueproposition ¾ Investmentbehindbrands ¾ Marketsharesremainstable ¾ NewKZNbakeryonscheduleforJuly2010 ¾ BoardapprovesR561mcapexfornewwheatflourmill 2009
Slide 27: Golden Cloud grows consumer ready mixes
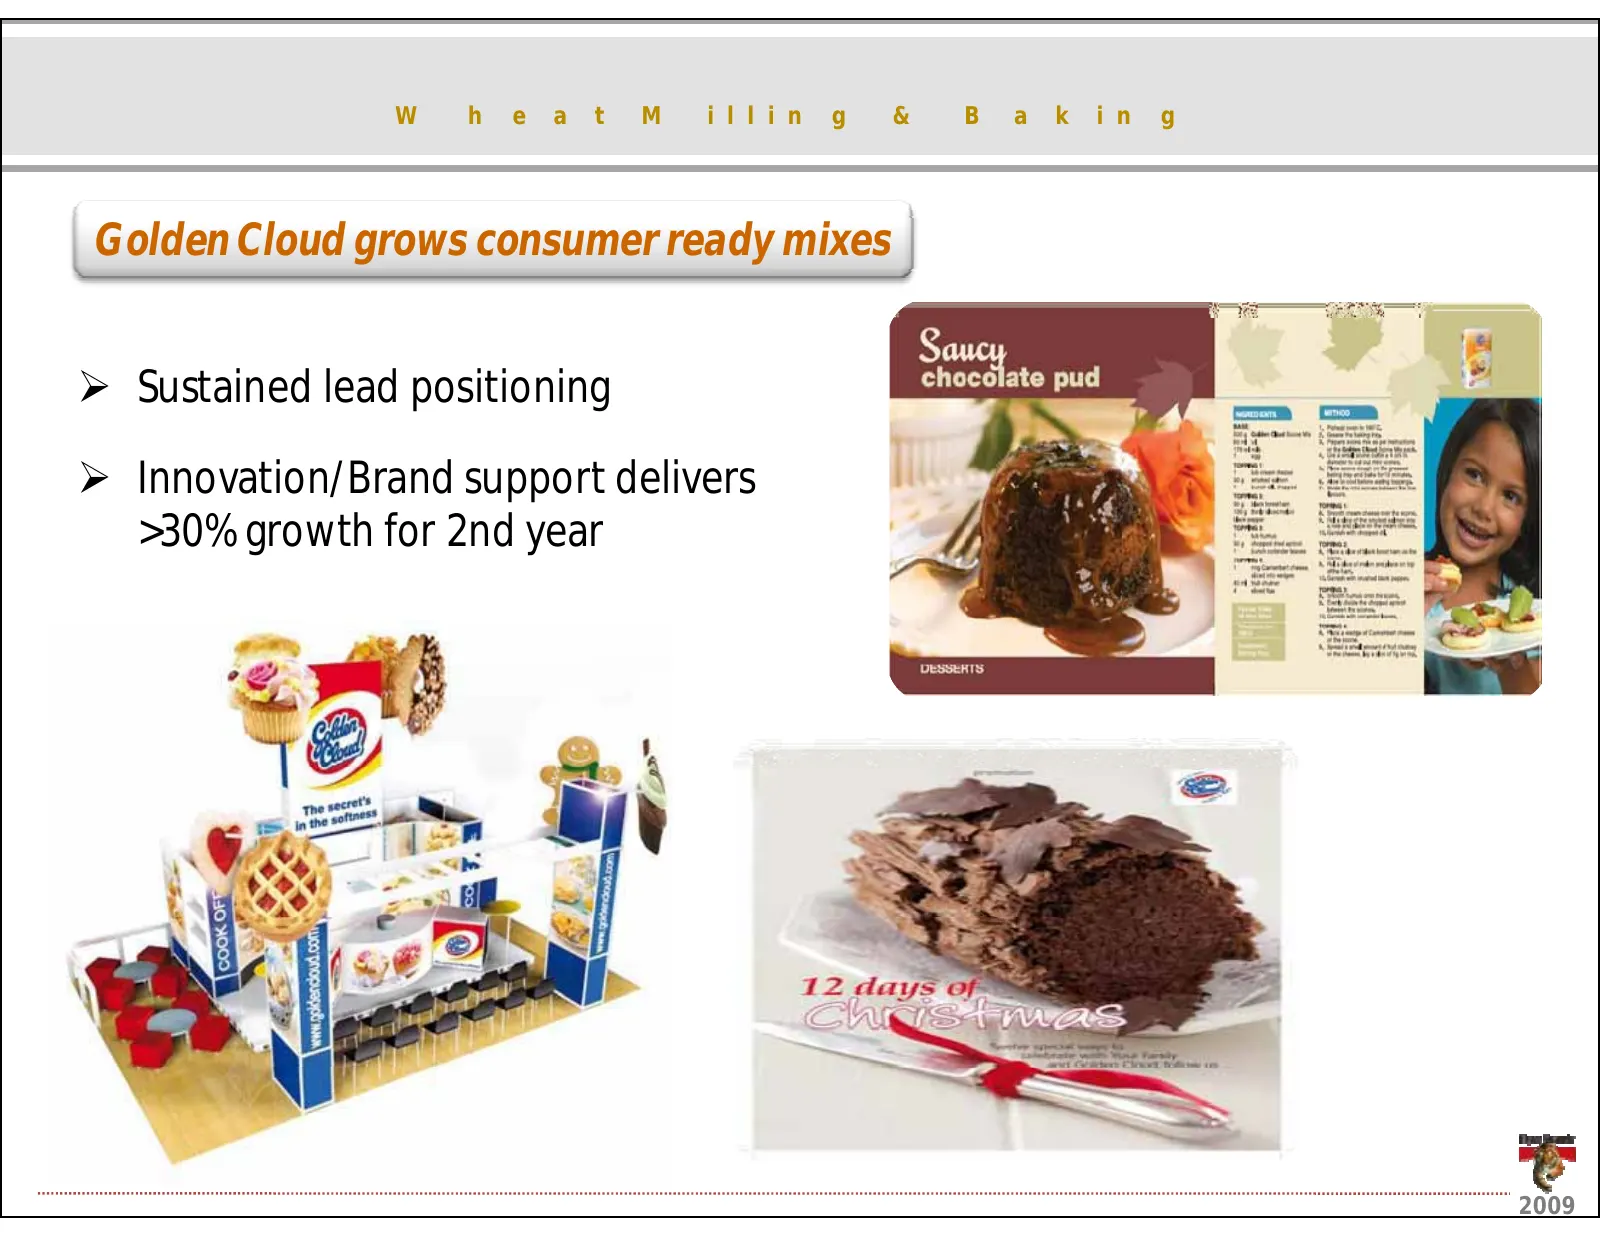
W h e a t M i l l i n g & B a k i n g GoldenCloudgrowsconsumerreadymixes ¾ Sustainedleadpositioning ¾ Innovation/Brandsupportdelivers I ti /B d t d li >30%growthfor2ndyear 2009
Slide 28: Albany Launches New Packaging
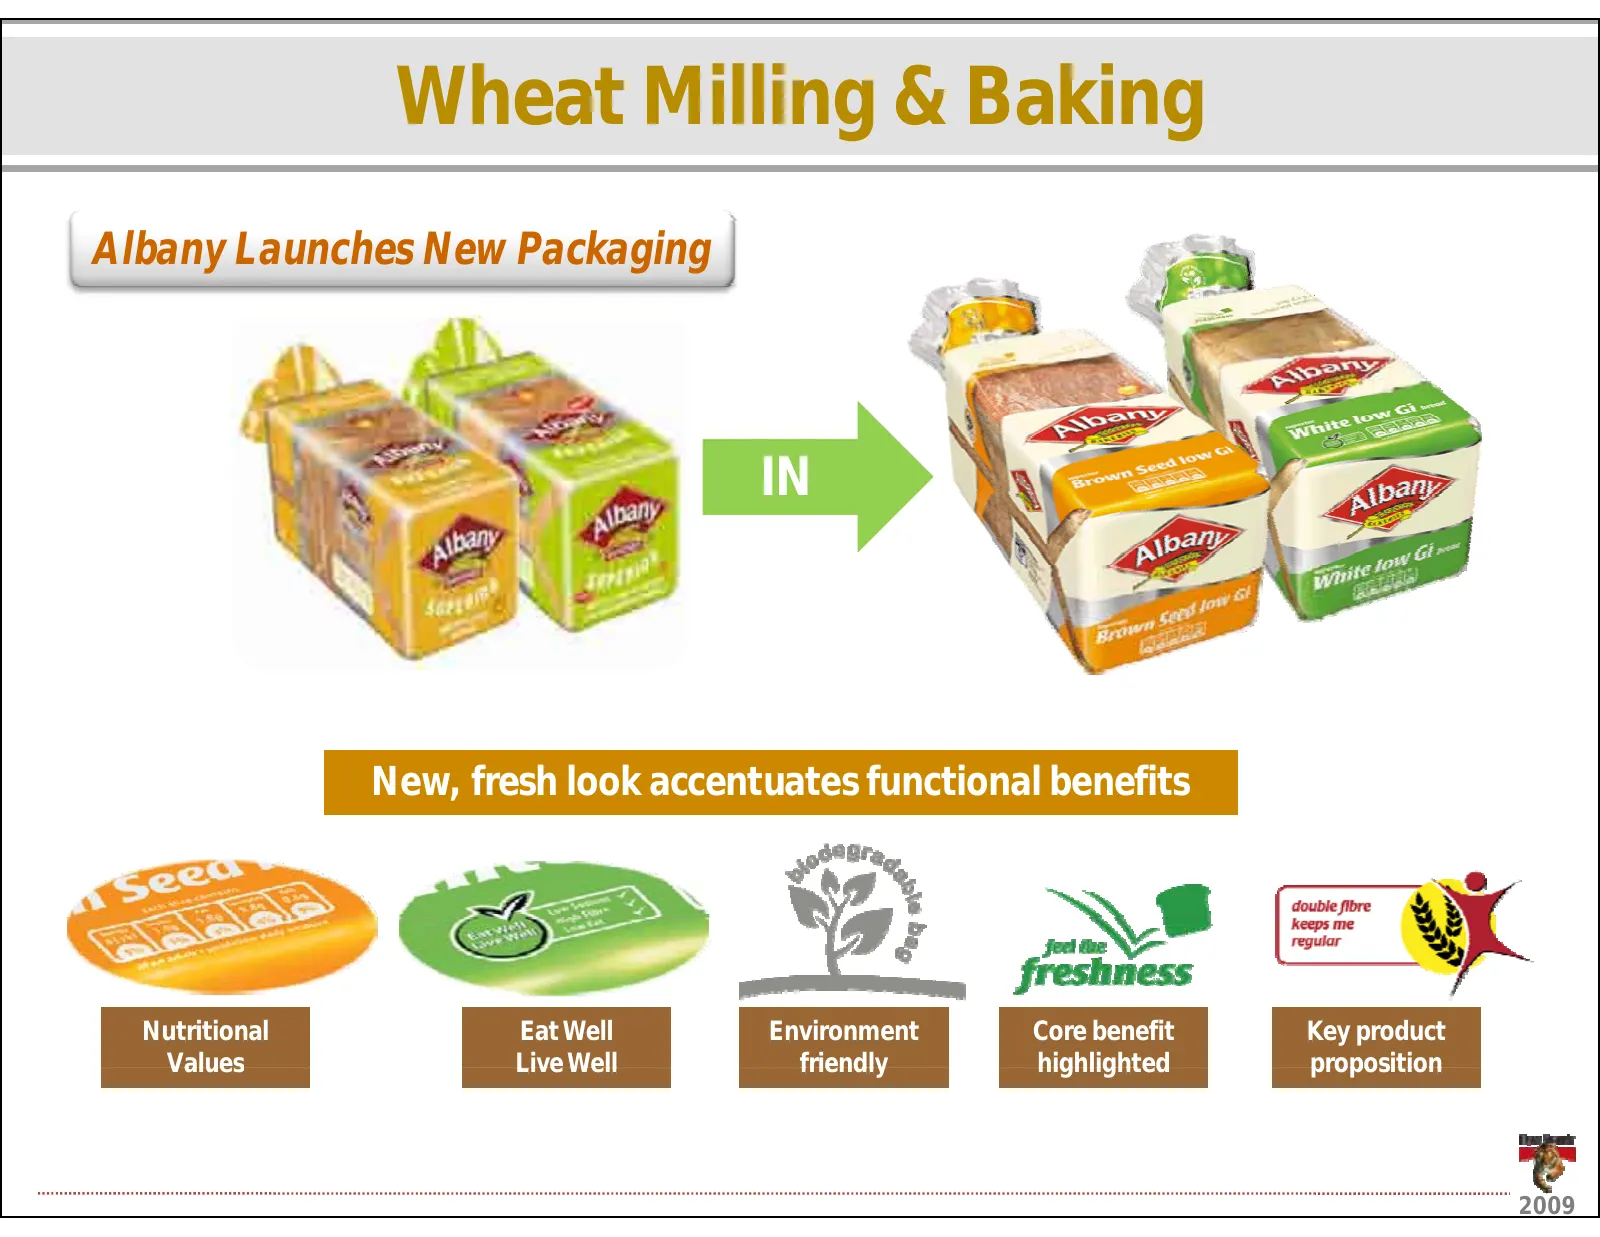
WheatMilling&Baking AlbanyLaunchesNewPackaging IN New,freshlookaccentuatesfunctionalbenefits f hl k f i lb fi Nutritional EatWell Environment Corebenefit Keyproduct Values Live Well LiveWell friendly highlighted proposition 2009
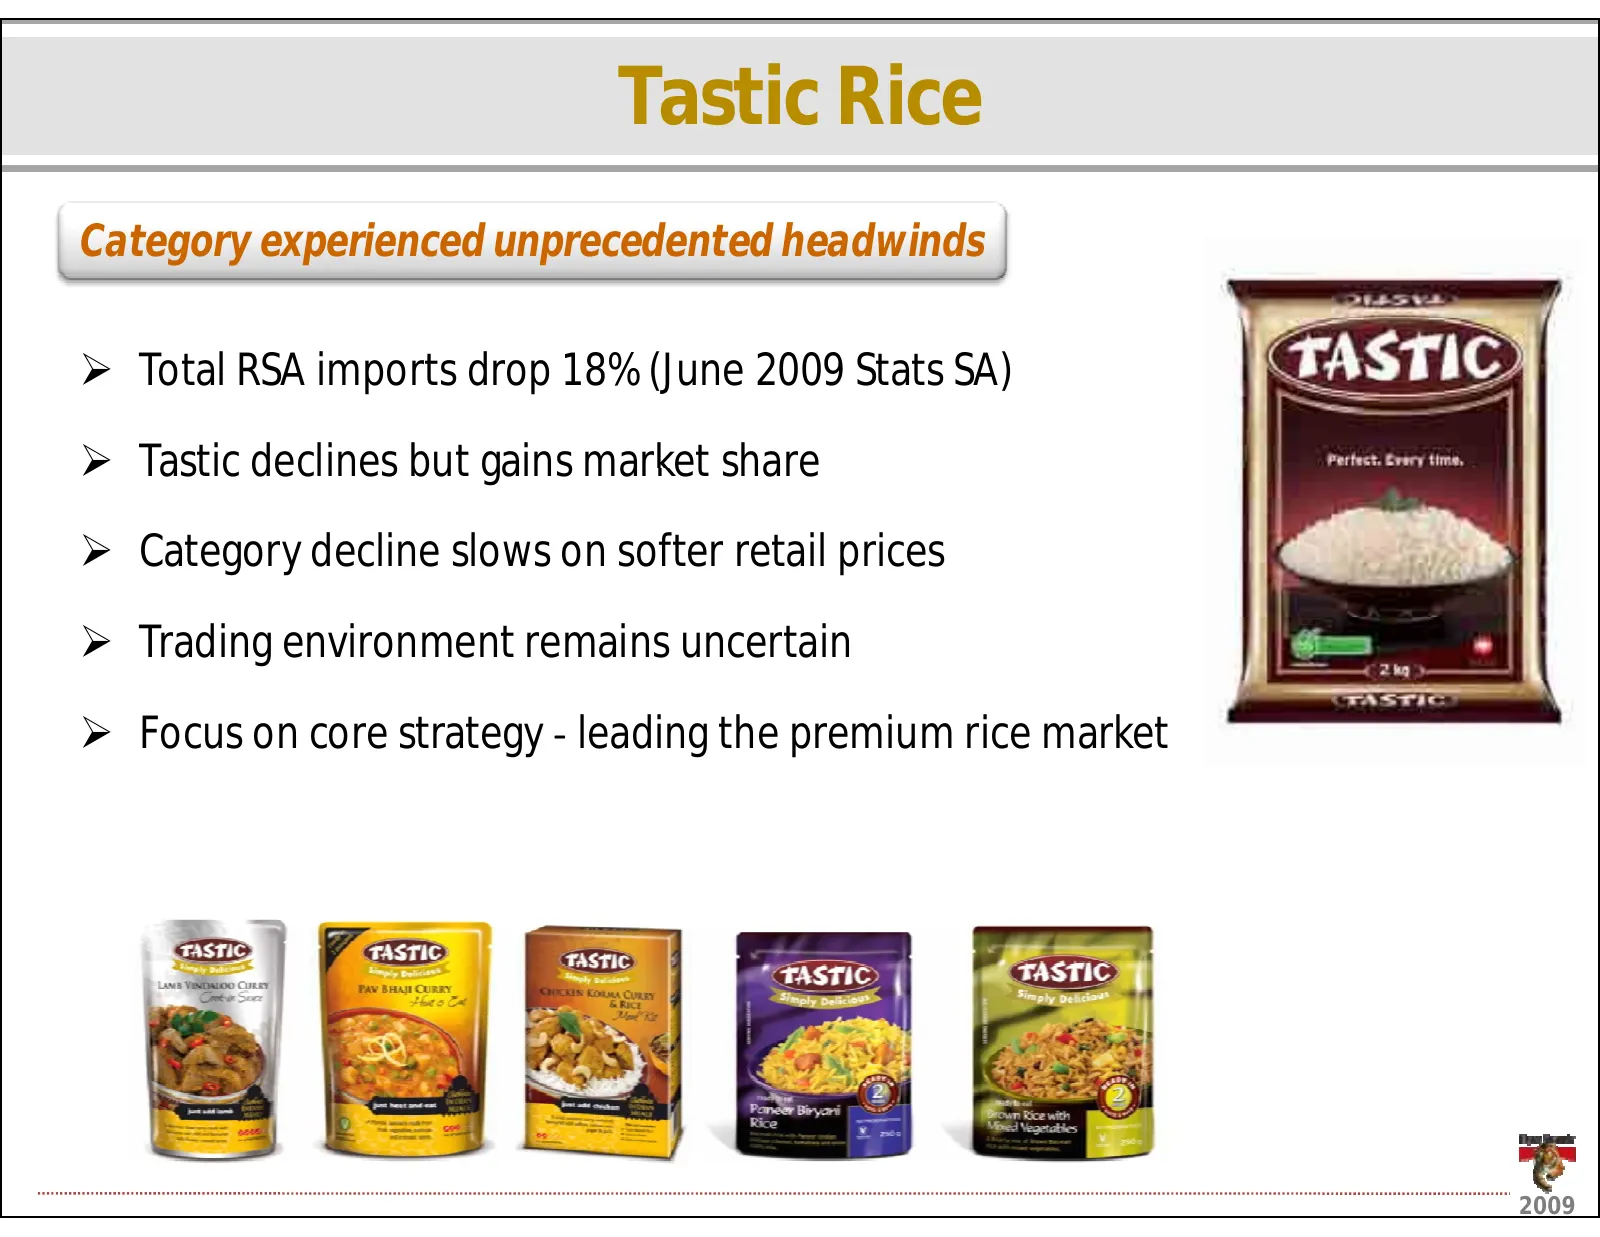
Slide 29: Tastic Rice
TasticRice Categoryexperiencedunprecedentedheadwinds ¾ TotalRSAimportsdrop18%(June2009StatsSA) ¾ Tasticdeclinesbutgainsmarketshare Tastic declines but gains market share ¾ Categorydeclineslowsonsofterretailprices ¾ Tradingenvironmentremainsuncertain ¾ FocusoncorestrategyͲ leadingthepremiumricemarket
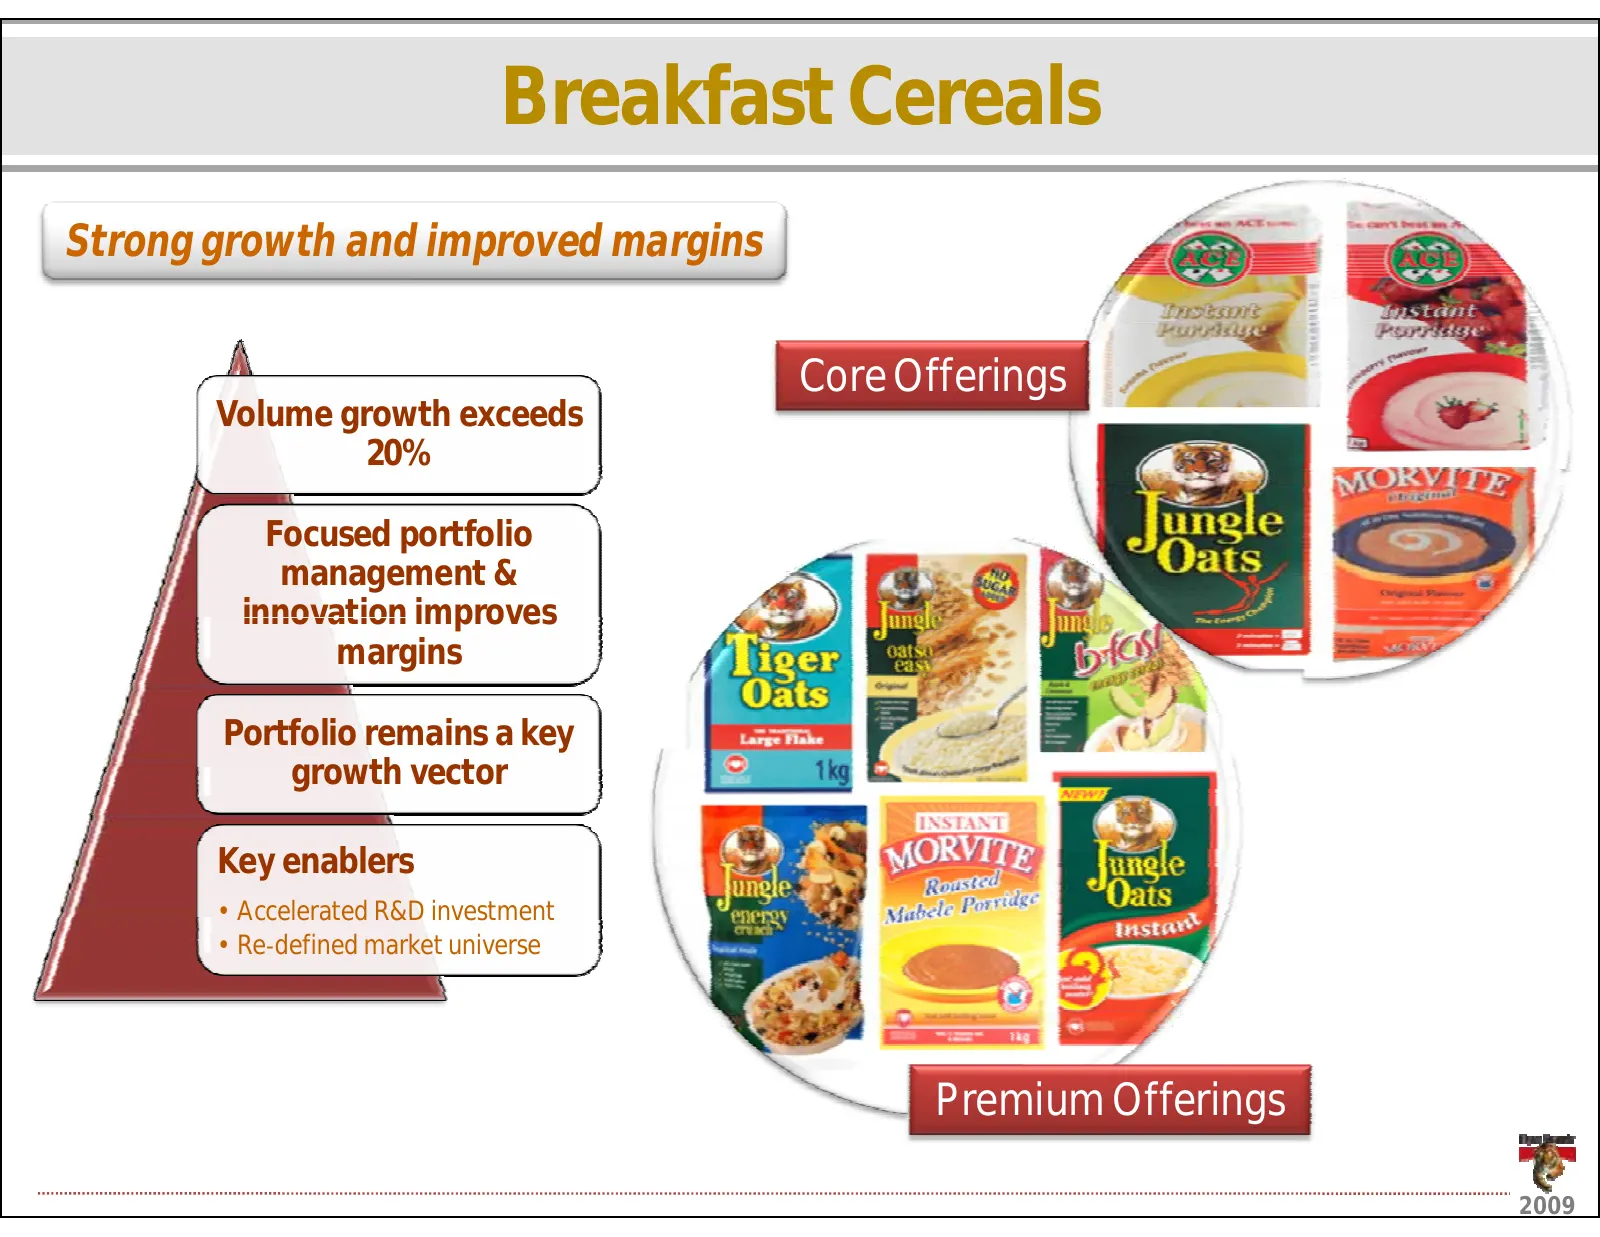
Slide 30: Breakfast Cereals
BreakfastCereals Stronggrowthandimprovedmargins CoreOfferings Volumegrowthexceeds 20% Focusedportfolio management& innovation improves innovationimproves margins Portfolioremainsakey gro th ector growthvector Keyenablers • AcceleratedR&Dinvestment Accelerated R&D investment • ReǦdefinedmarketunivers
Slide 31: Summary
SUMMARY ¾ Restorationofmarginsachieved ¾ Conservativeprocurementstrategysucceeds ¾ Marketsharesremainrobust ¾ Investmentinmanufacturingfacilitiesdeliversconsistent Investment in manufacturing facilities delivers consistent efficiencies ¾ Capitalinvestmentpositionsbusinessforfuturegrowth 2009
Slide 32: Consumer Brands
CONSUMERBRANDS NeilBrimacombe Executive Director ExecutiveDirector OperationalPerformance 2009
Slide 33: Groceries
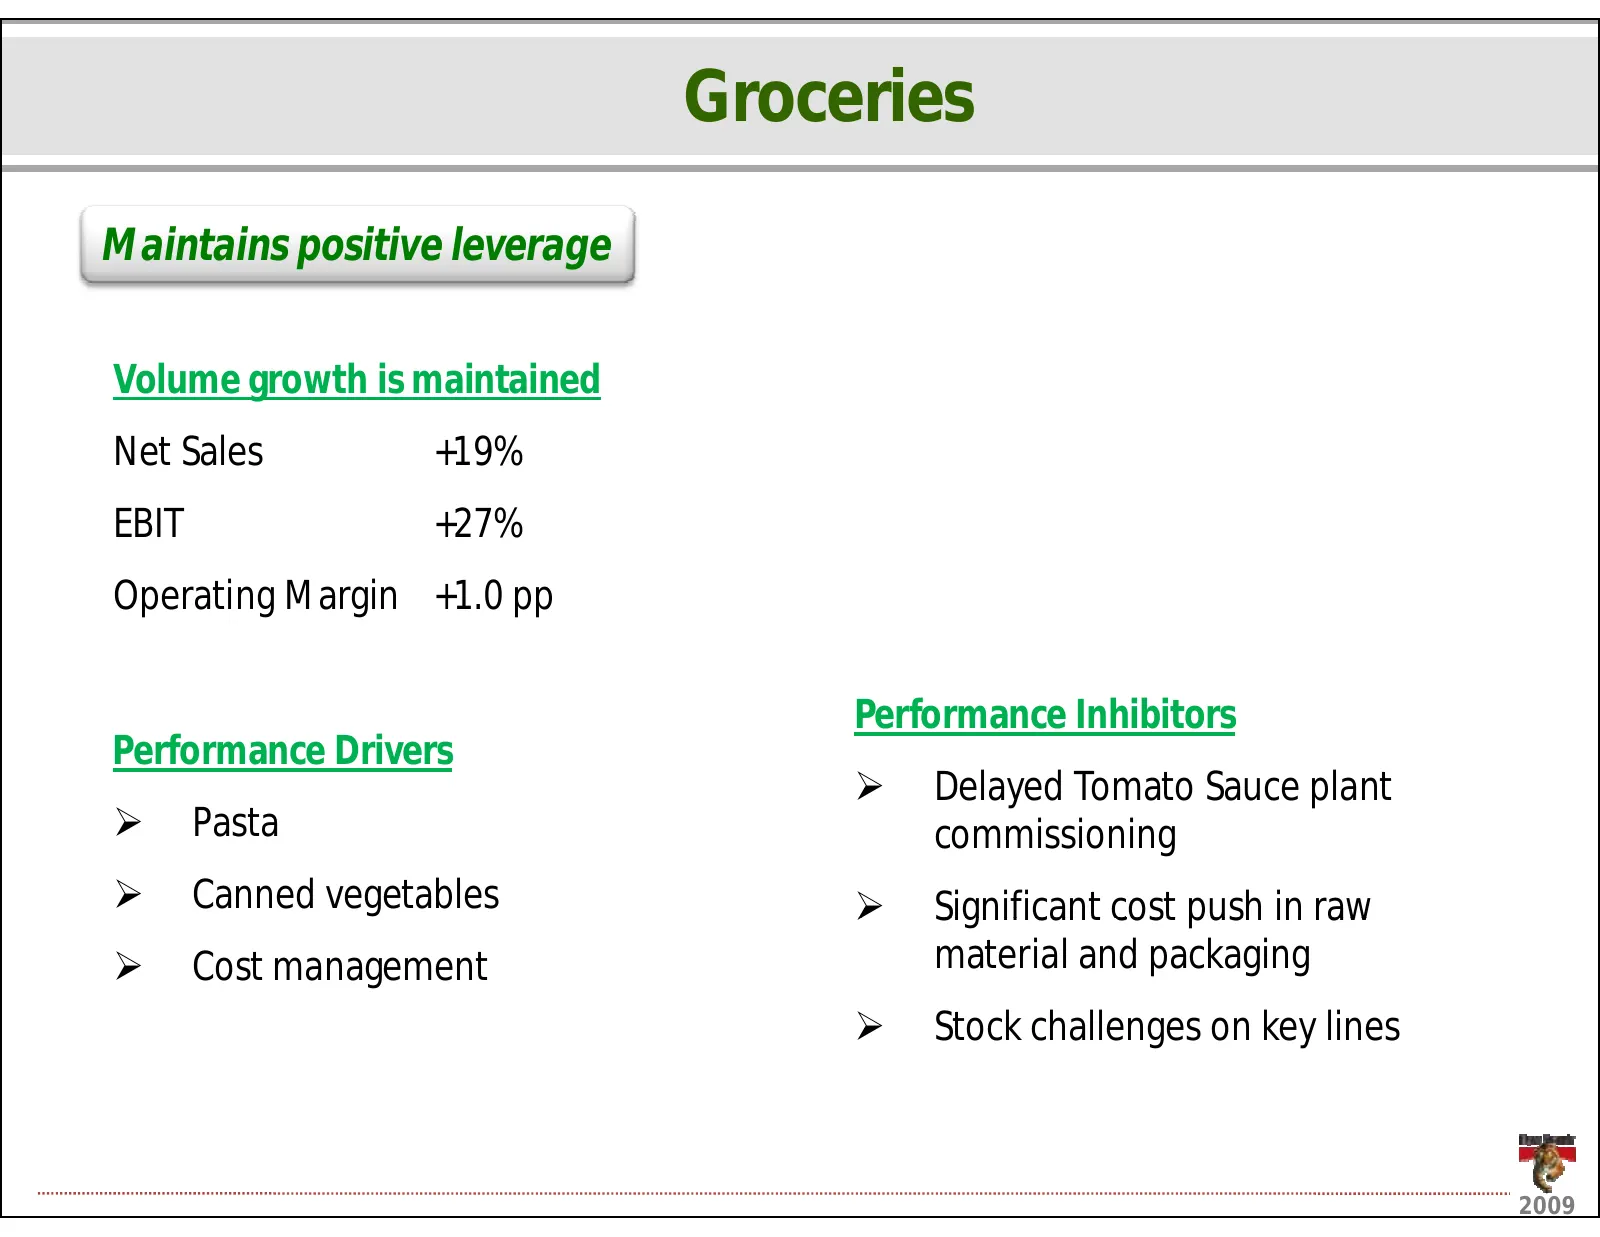
Groceries Maintainspositiveleverage Volumegrowthismaintained NetSales +19% EBIT +27% OperatingMargin +1.0pp PerformanceInhibitors PerformanceDrivers ¾ DelayedTomatoSauceplant ¾ Pasta commissioning ¾ Cannedvegetables ¾ Significantcostpushinraw Significant cost push in raw ¾ Costmanagement materialand
Slide 34: Groceries EBIT
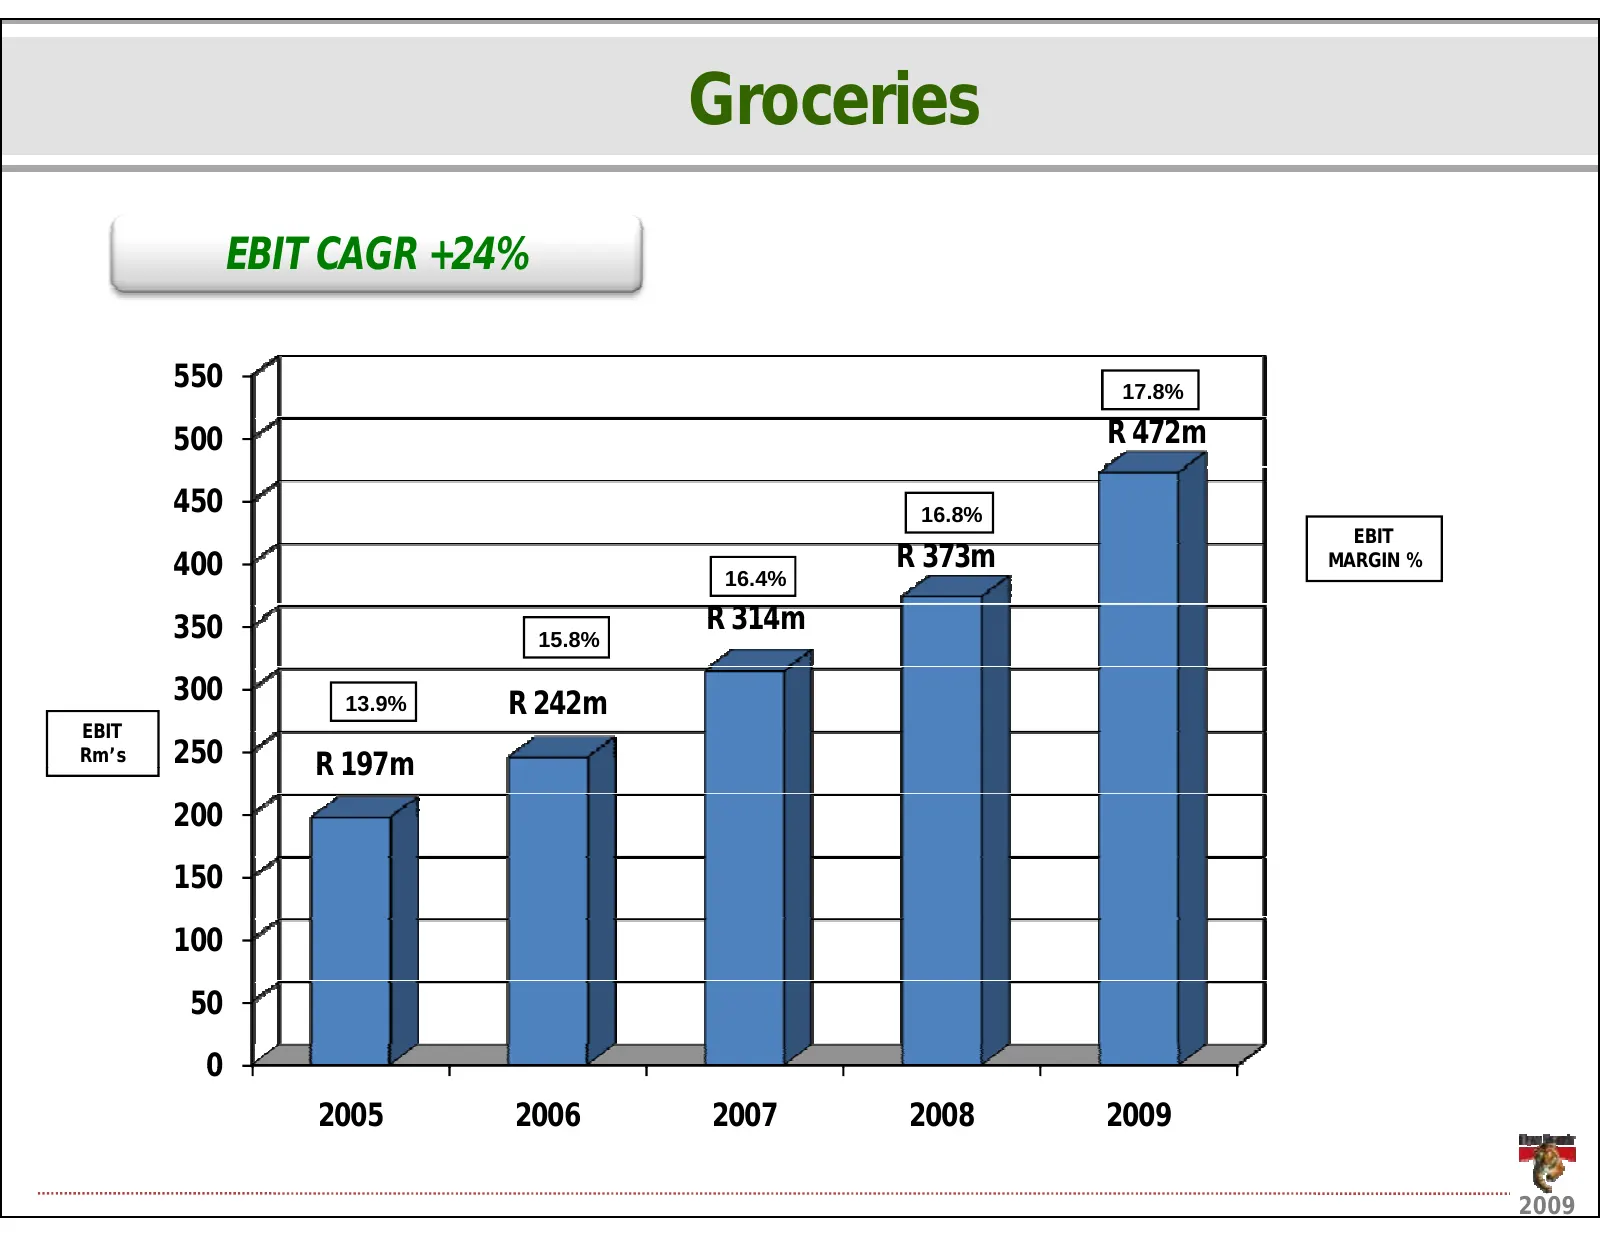
Groceries EBITCAGR+24% 550 17.8% 500 R472m 450 16.8% EBIT 400 R373m MARGIN % 16.4% 350 R 314m R314m 15.8% 300 13.9% R242m EBIT Rm’s 250 R 197m R197m 200 150 100 50 0 2005 2006 2007 2008 2009 2009
Slide 35: Groceries: Sustained investment drives growth
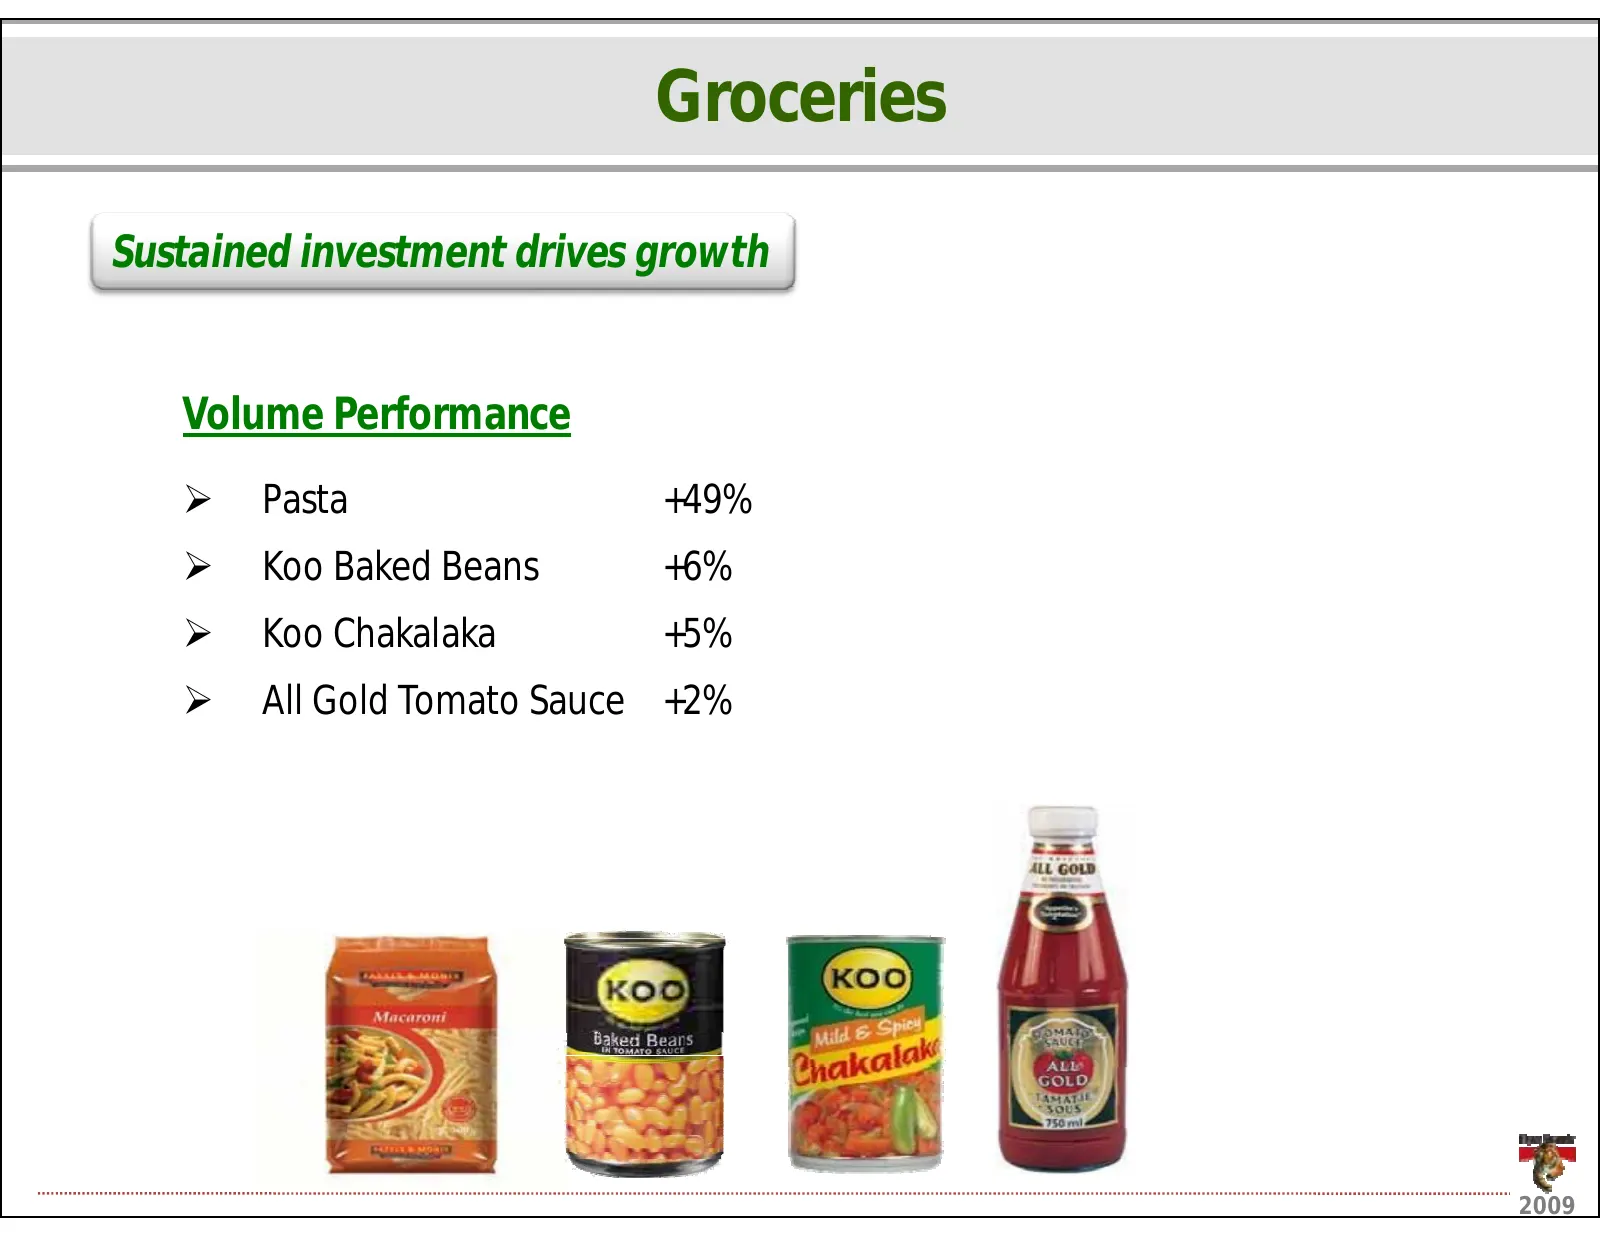
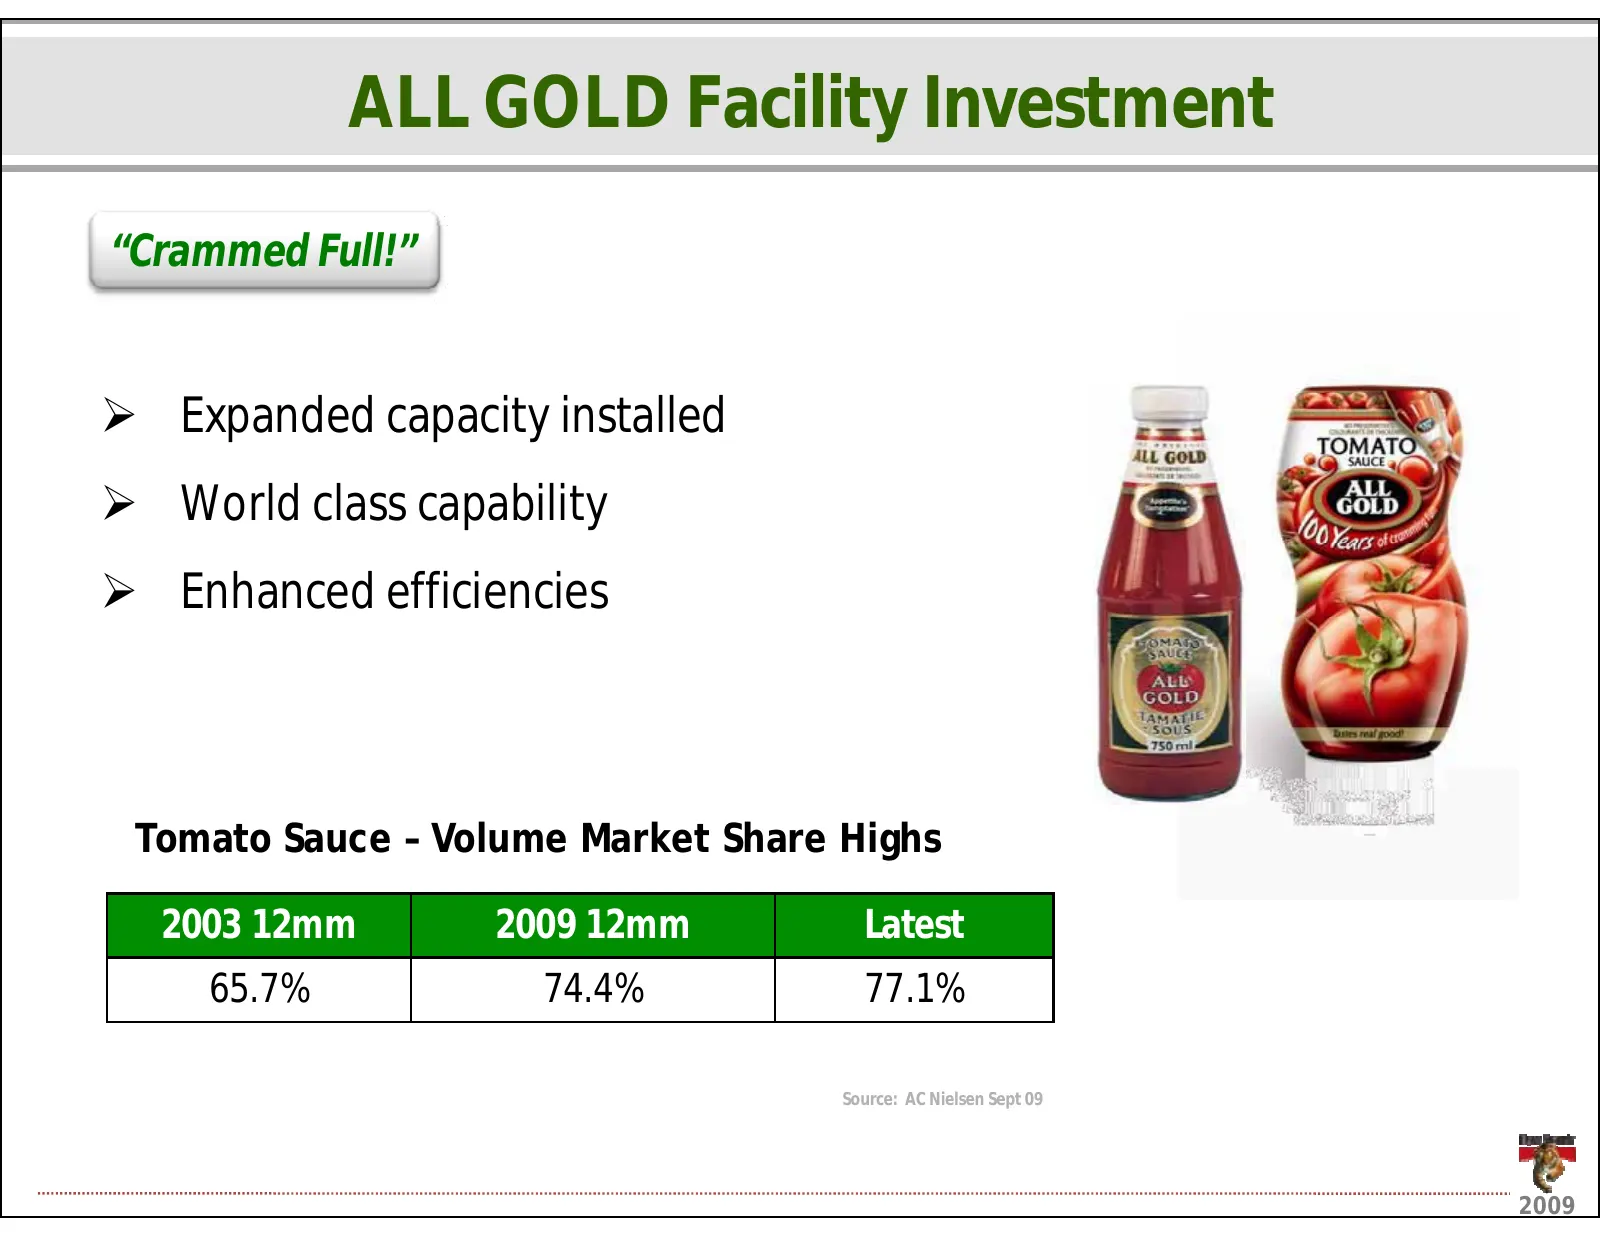
Groceries Sustainedinvestmentdrivesgrowth VolumePerformance ¾ Pasta +49% ¾ KooBakedBeans +6% ¾ KooChakalaka +5% ¾ AllGoldTomatoSauce +2% 2009
Slide 36: Market Share
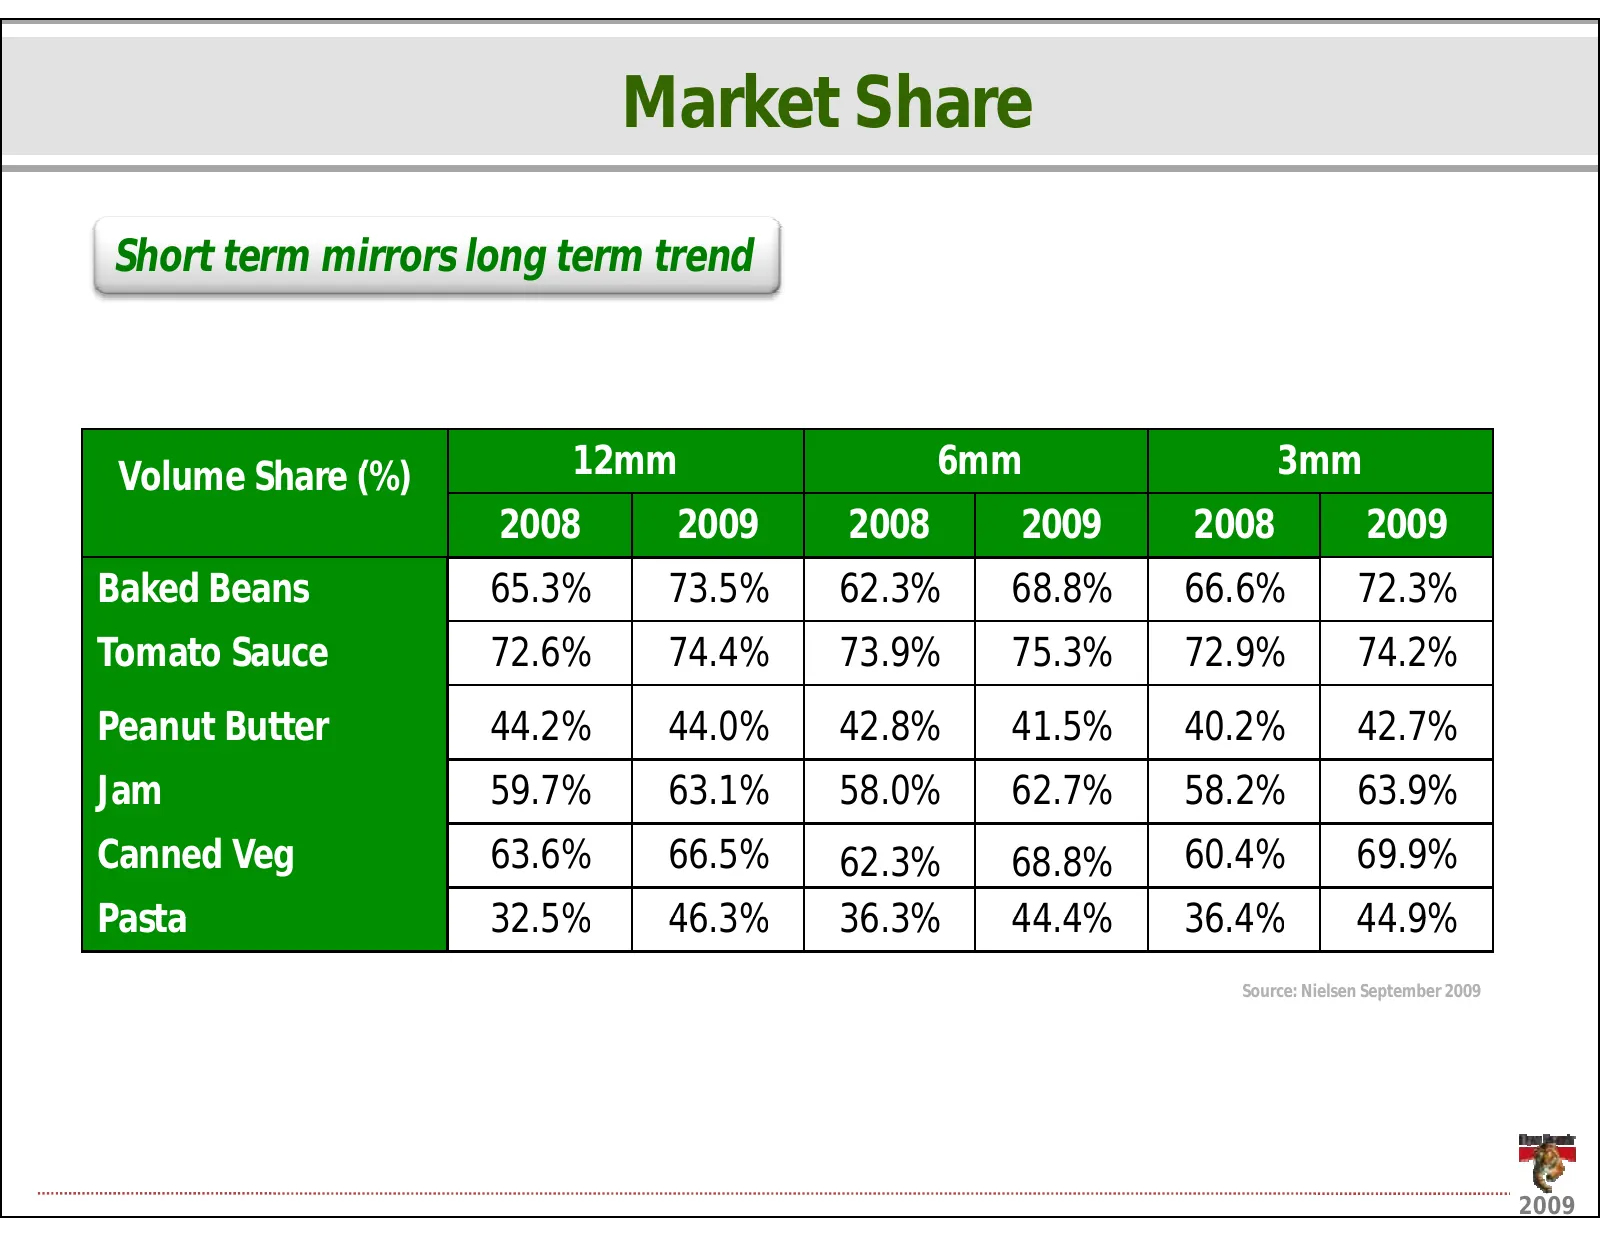
MarketShare Shorttermmirrorslongtermtrend V l VolumeShare(%) Sh (%) 12mm 6mm 3mm 2008 2009 2008 2009 2008 2009 BakedBeans 65.3% 73.5% 62.3% 68.8% 66.6% 72.3% TomatoSauce 72.6% 74.4% 73.9% 75.3% 72.9% 74.2% PeanutButter 44.2% 44.0% 42.8% 41.5% 40.2% 42.7% Jam 59.7% 63.1% 58.0% 62.7% 58.2% 63.9% Canne
Slide 37: ALL GOLD Facility Investment
ALLGOLDFacilityInvestment “CrammedFull!” ¾ Expandedcapacityinstalled ¾ Worldclasscapability ¾ Enhancedefficiencies Tomato Sauce – Volume Market Share Highs 2003 12 200312mm 2009 12 200912mm L t t Latest 65.7% 74.4% 77.1% Source:ACNielsenSept09 2009
Slide 38: Fatti's & Moni's Re-launch
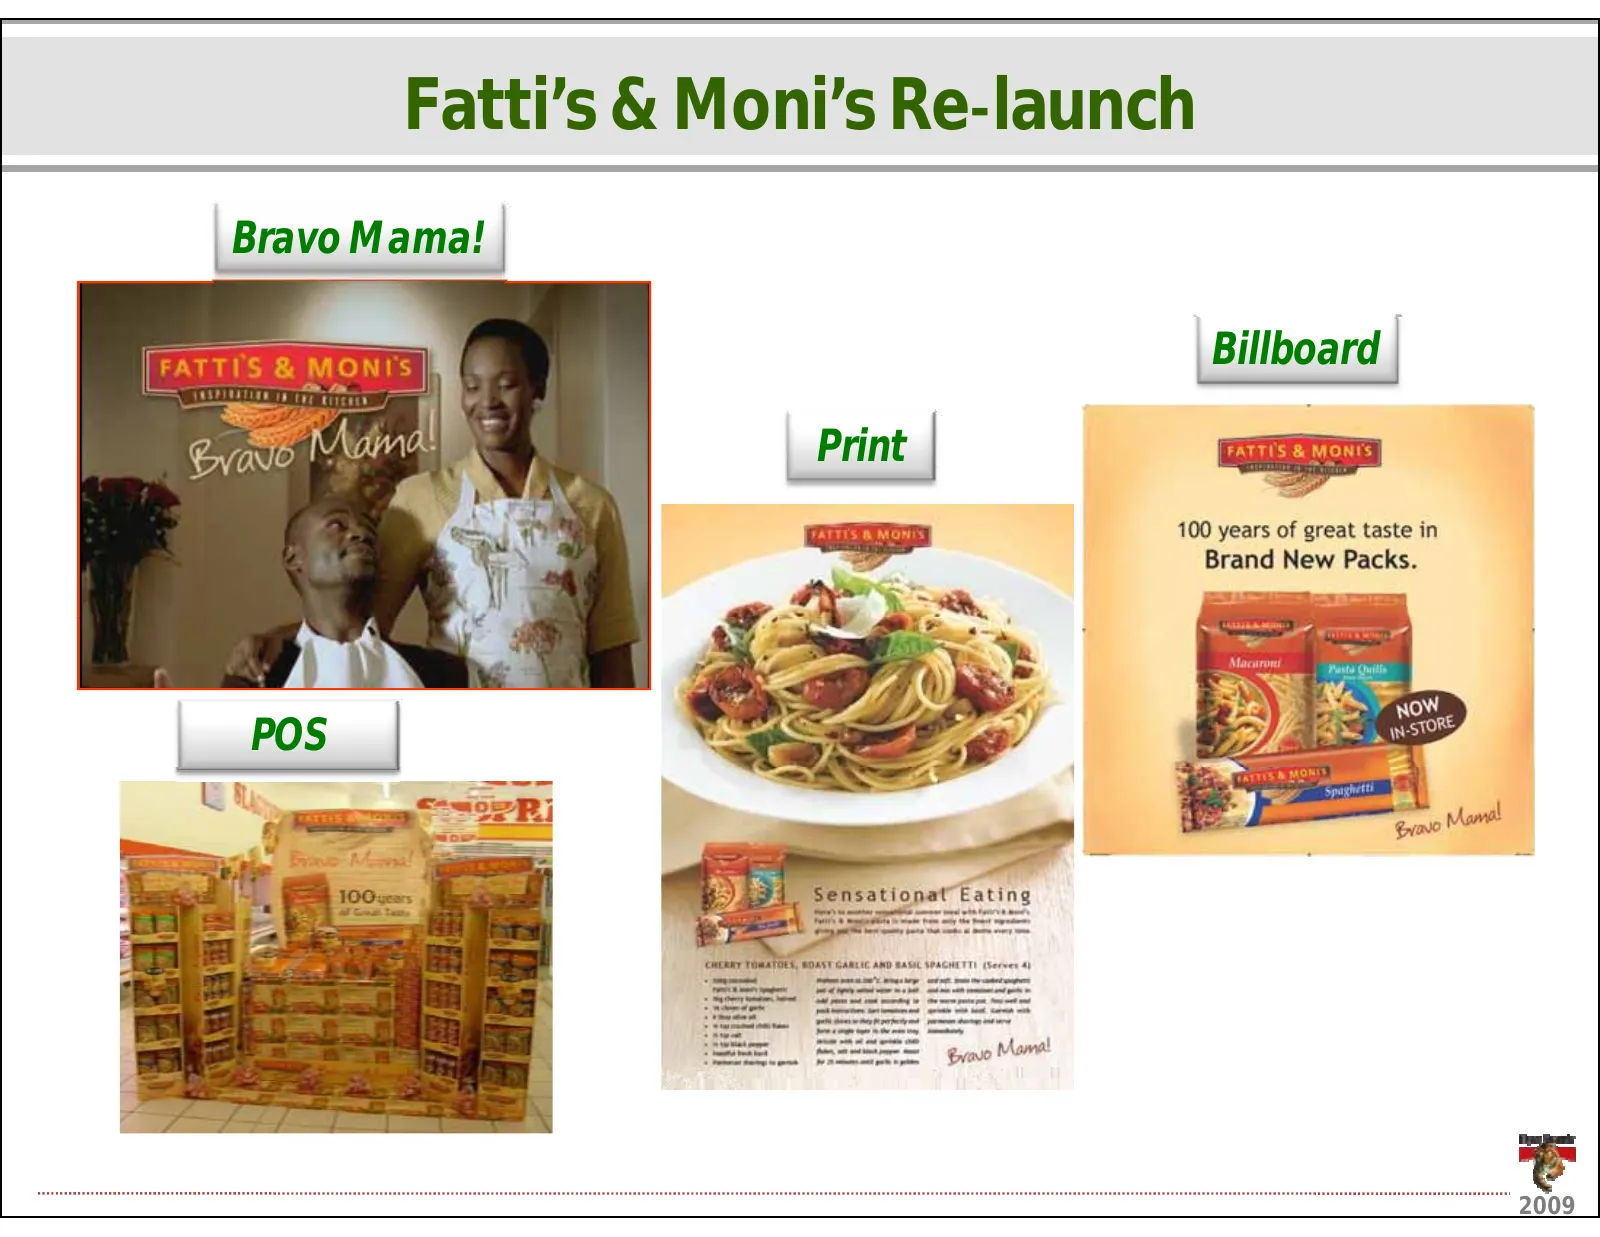
Fatti’s&Moni’sReǦlaunch BravoMama! Billboard Print POS 2009
Source: Internet Archive copy of tigerbrands.com
More decks from Tiger Brands Limited
 H1 2026 Earnings Presentation37 slides · Jun 1, 2026
 H1 2026 Earnings Presentation38 slides · Jun 1, 2026
 FY2025 Earnings Presentation38 slides · Nov 26, 2025
 H1 2025 Earnings Presentation43 slides · May 28, 2025
 H1 FY2024 Earnings Presentation38 slides · May 27, 2024
 FY2023 Earnings Presentation45 slides · Dec 1, 2023