Flutter Entertainment plc · NYSE:FLUT
Flutter Entertainment — Paddy Power — FY2011 Earnings Presentation
30 slides from Flutter Entertainment's earnings presentation, 2012
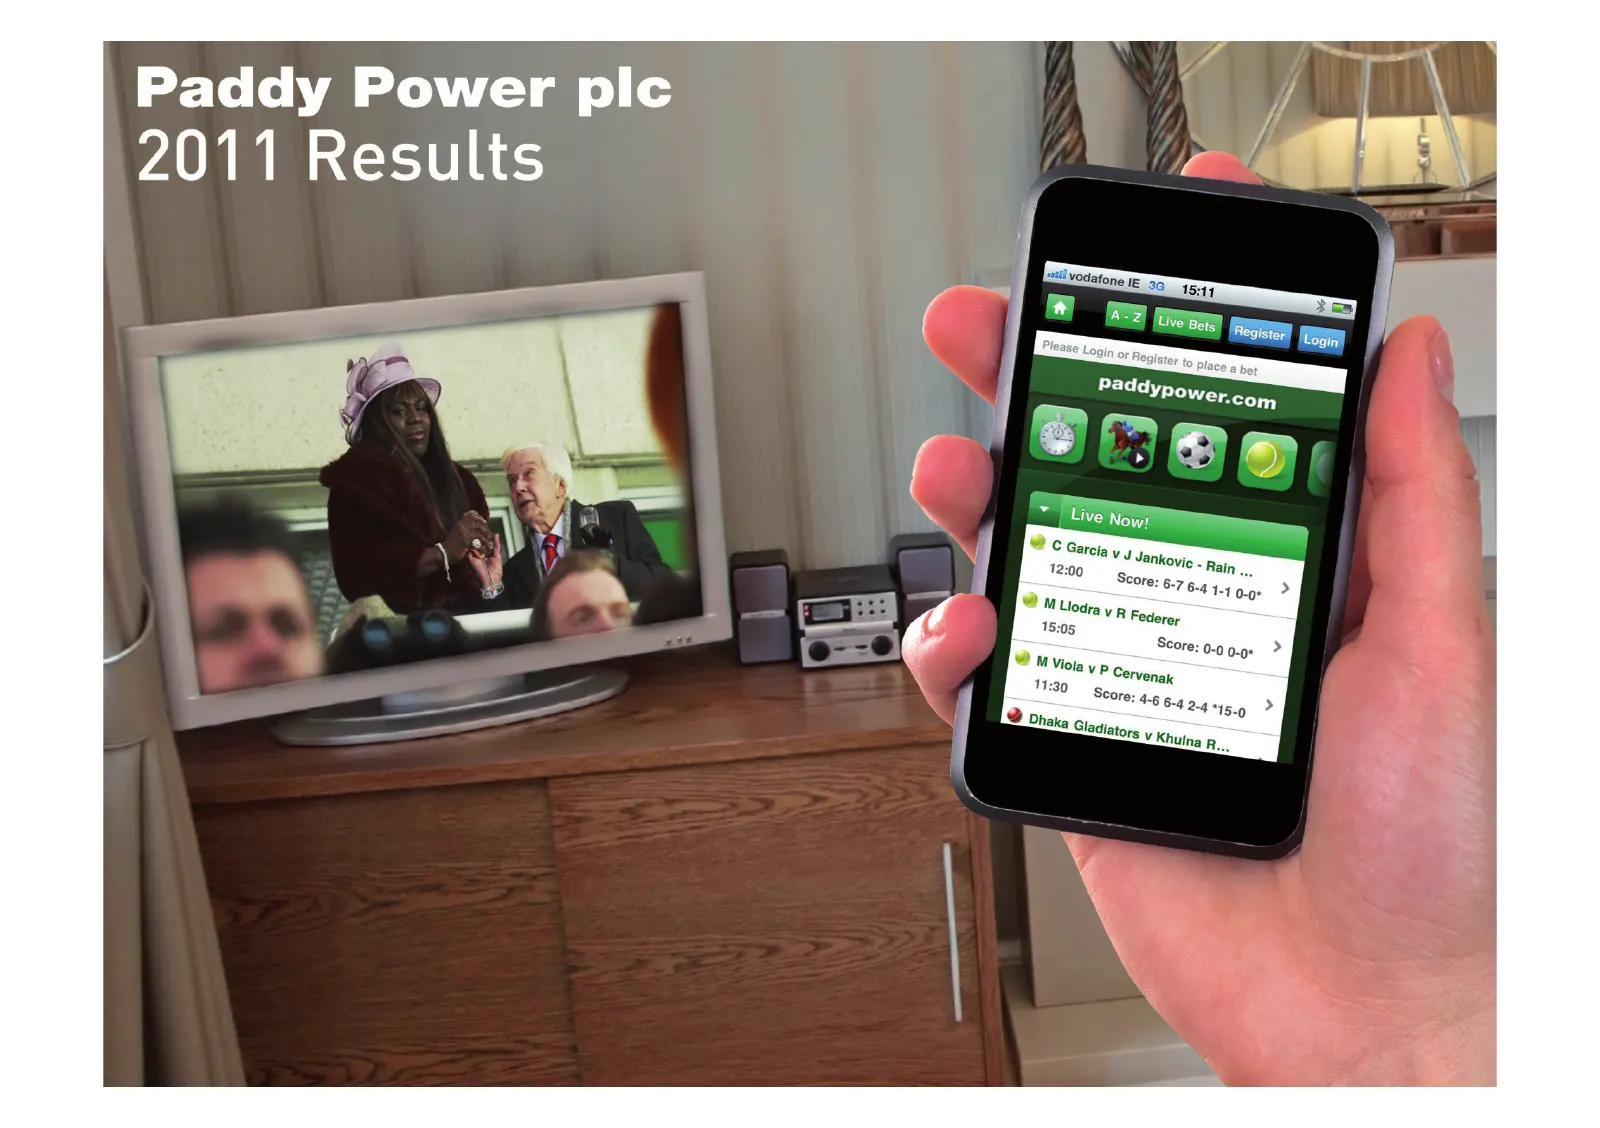
Slide 1: Paddy Power 2011 Results
Ic ddy Power p 2011 Results @ C carcia VU Jar NkOVie - Rain 12:00 Score: 6-7 6.4 1.4.
Slide 2: Introduction
Introduction Financial Performance Operational Review Strategy & Outlook Page 2
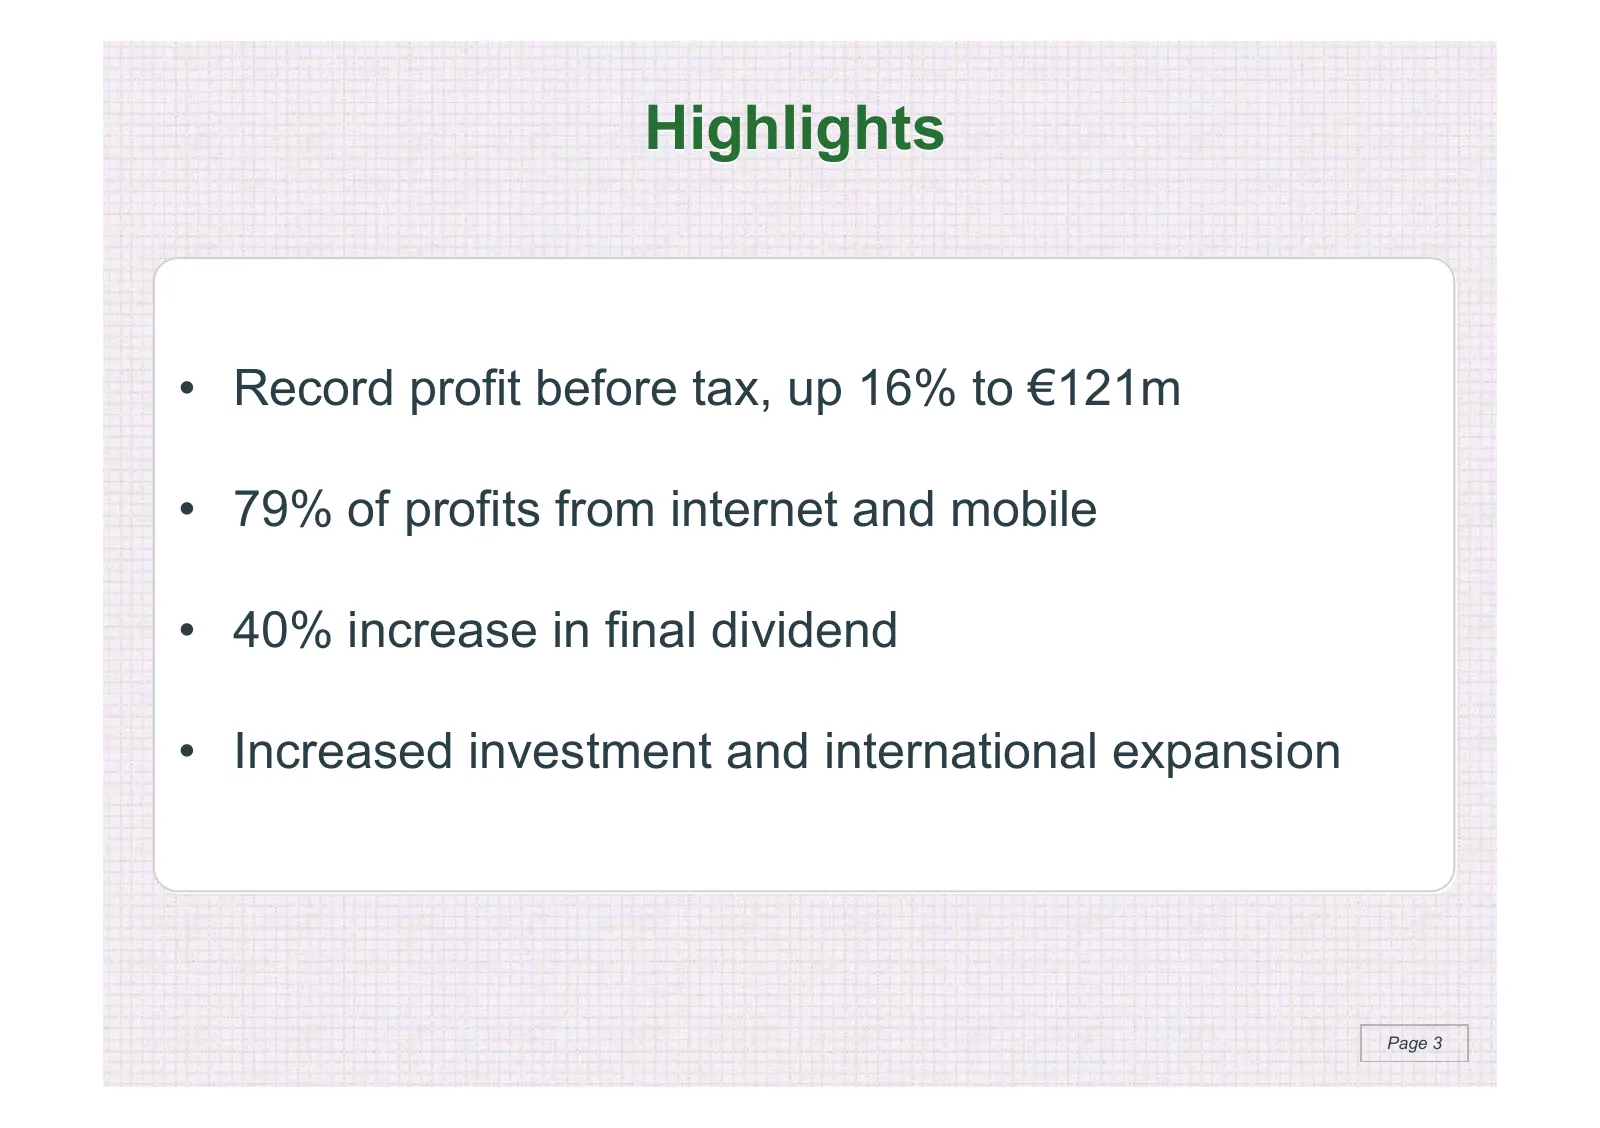
Slide 3: Highlights
Highlights • Record profit before tax, up 16% to €121m • 79% of profits from internet and mobile • 40% increase in final dividend • Increased investment and international expansion Page 3
Slide 4: Financial Performance
Introduction Financial Performance Operational Review Strategy & Outlook Page 4
Slide 5: Financial Highlights
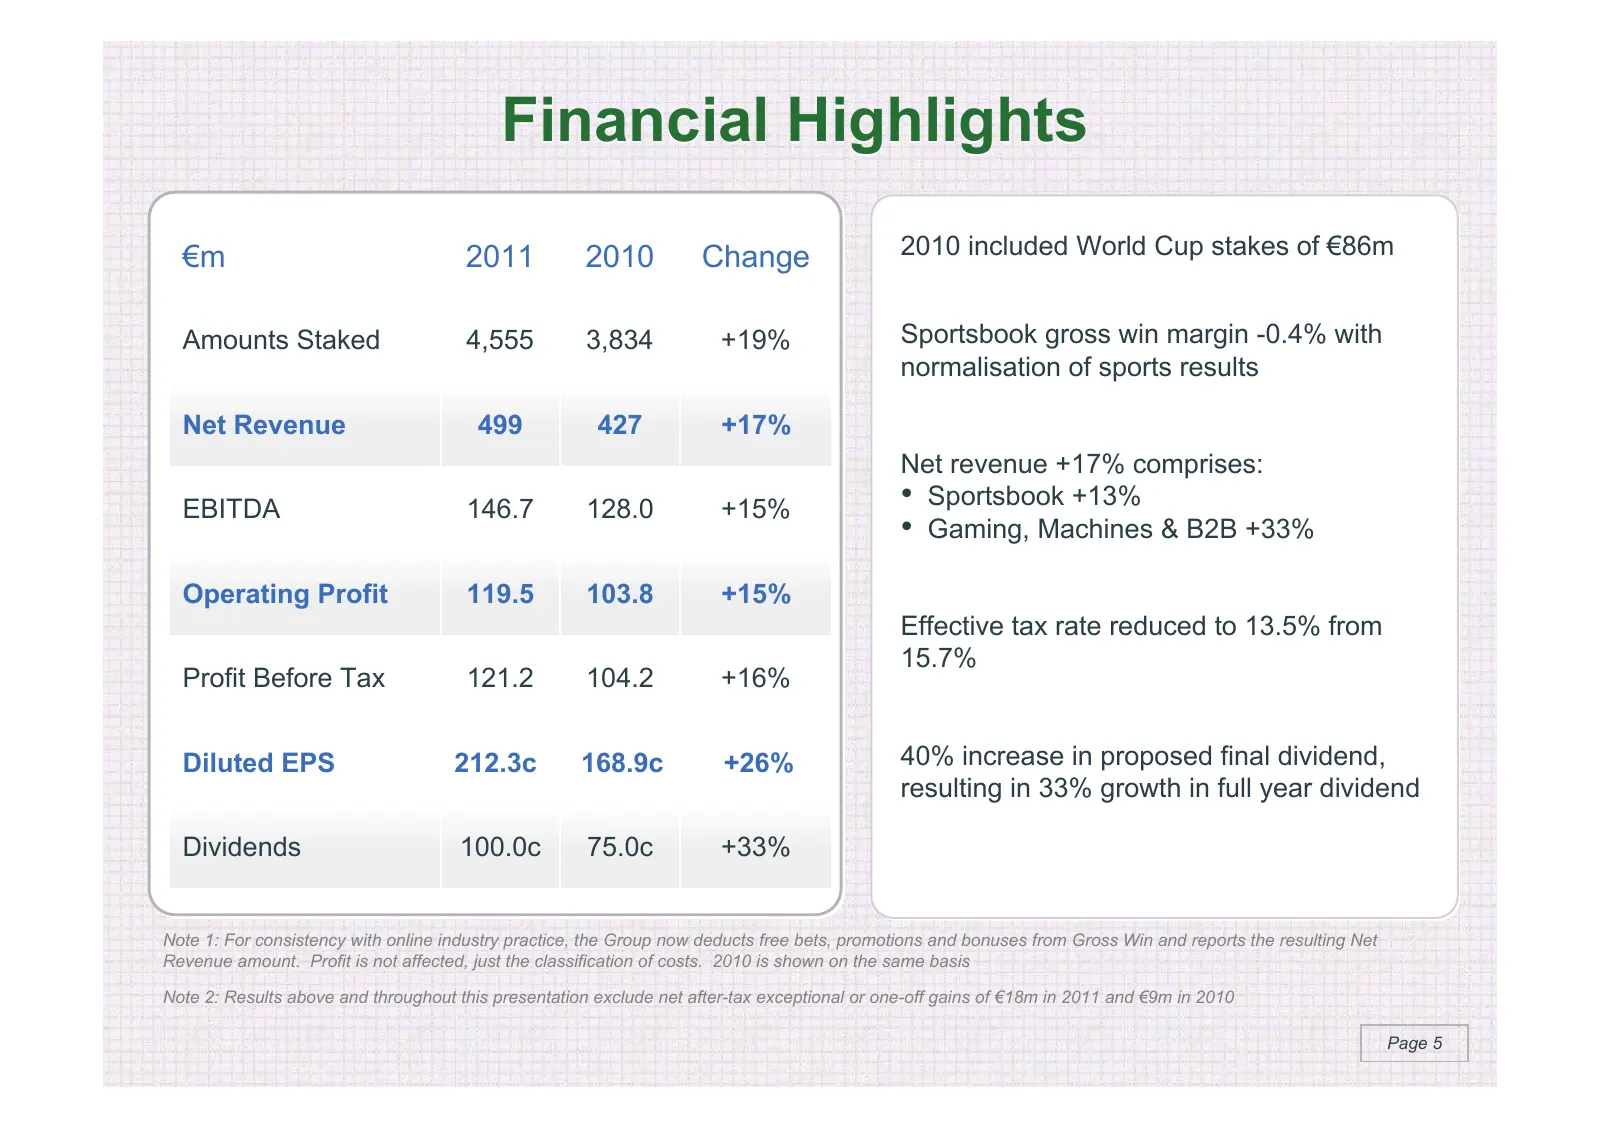
Financial Highlights €m 2011 2010 Change 2010 included World Cup stakes of €86m Amounts Staked 4,555 3,834 +19% Sportsbook gross win margin -0.4% with normalisation of sports results Net Revenue 499 427 +17% Net revenue +17% comprises: EBITDA 146.7 128.0 +15% • Sportsbook +13% • Gaming, Machines & B
Slide 6: Operating Cost Growth
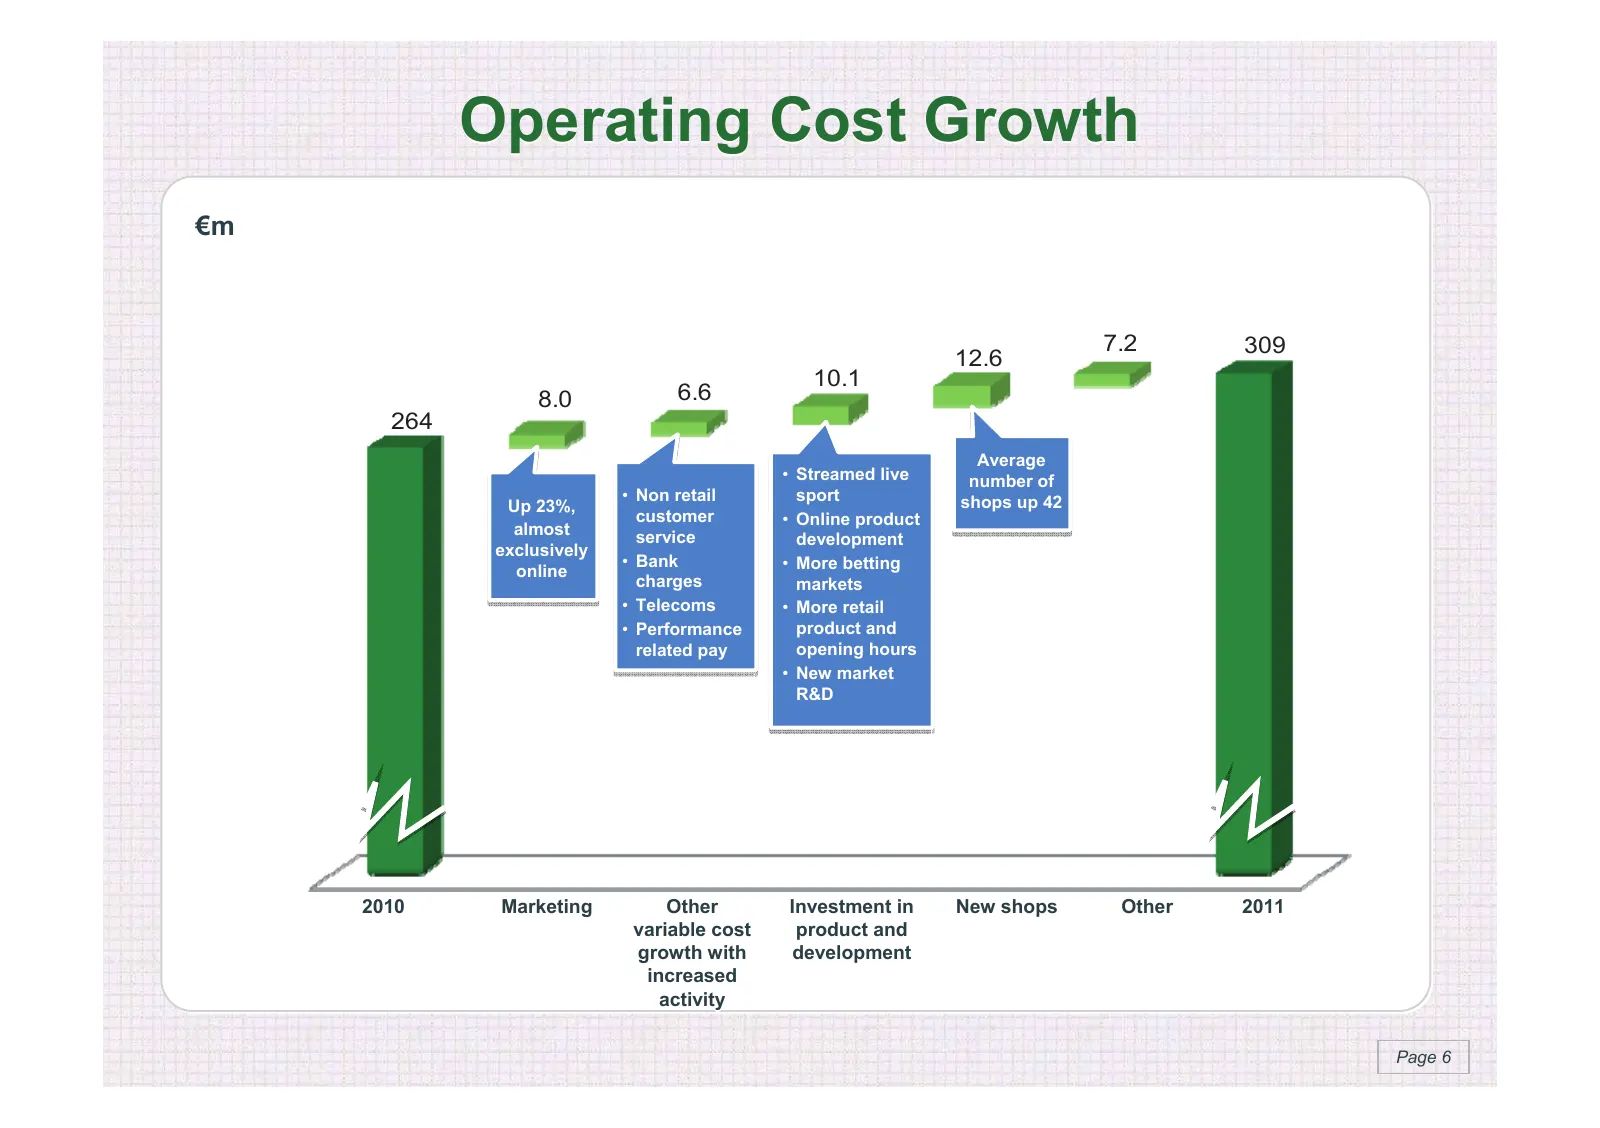
Operating Cost Growth €m 7.2 309 12.6 10.1 8.0 6.6 264 Average • Streamed live number of • Non retail sport shops up 42 Up 23%, customer • Online product almost service development exclusively • Bank • More betting online charges markets • Telecoms • More retail • Performance product and related pay
Slide 7: Financial Highlights - Divisional
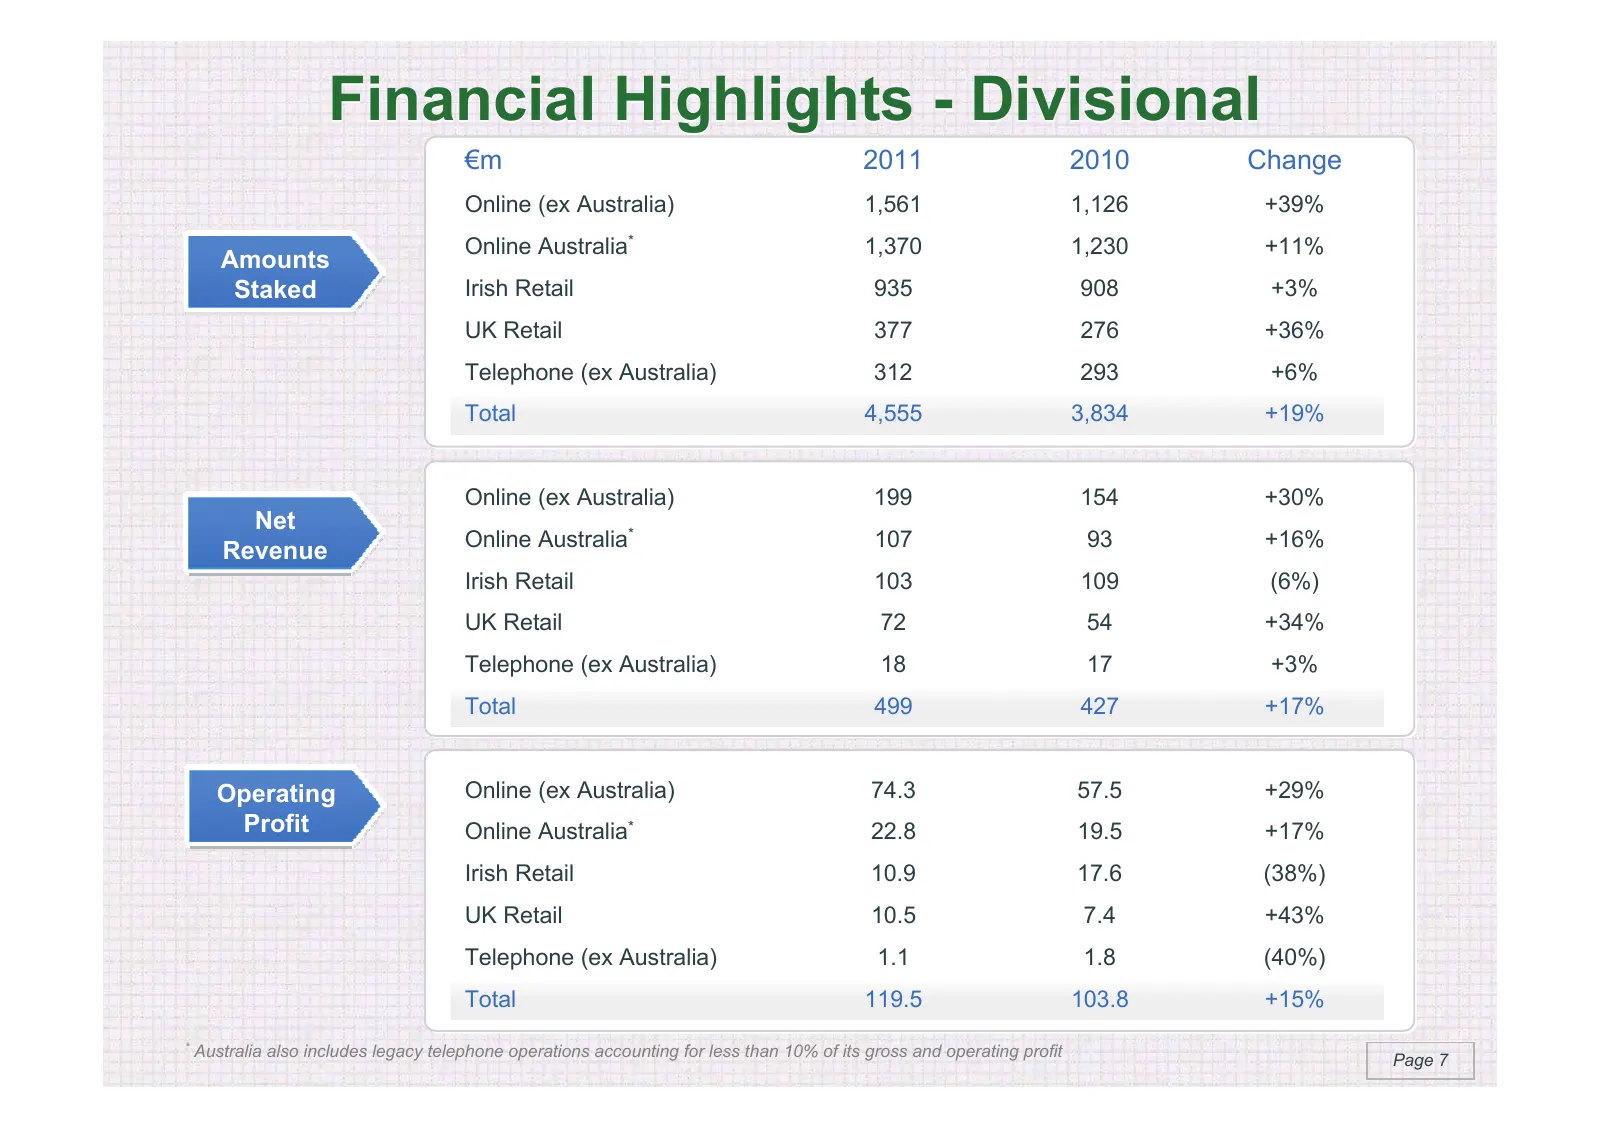
Financial Highlights - Divisional €m 2011 2010 Change Online (ex Australia) 1,561 1,126 +39% Online Australia * 1,370 1,230 +11% Amounts Staked Irish Retail 935 908 +3% UK Retail 377 276 +36% Telephone (ex Australia) 312 293 +6% Total 4,555 3,834 +19% Online (ex Australia) 199 154 +30% Net Online Au
Slide 8: Cash Flow
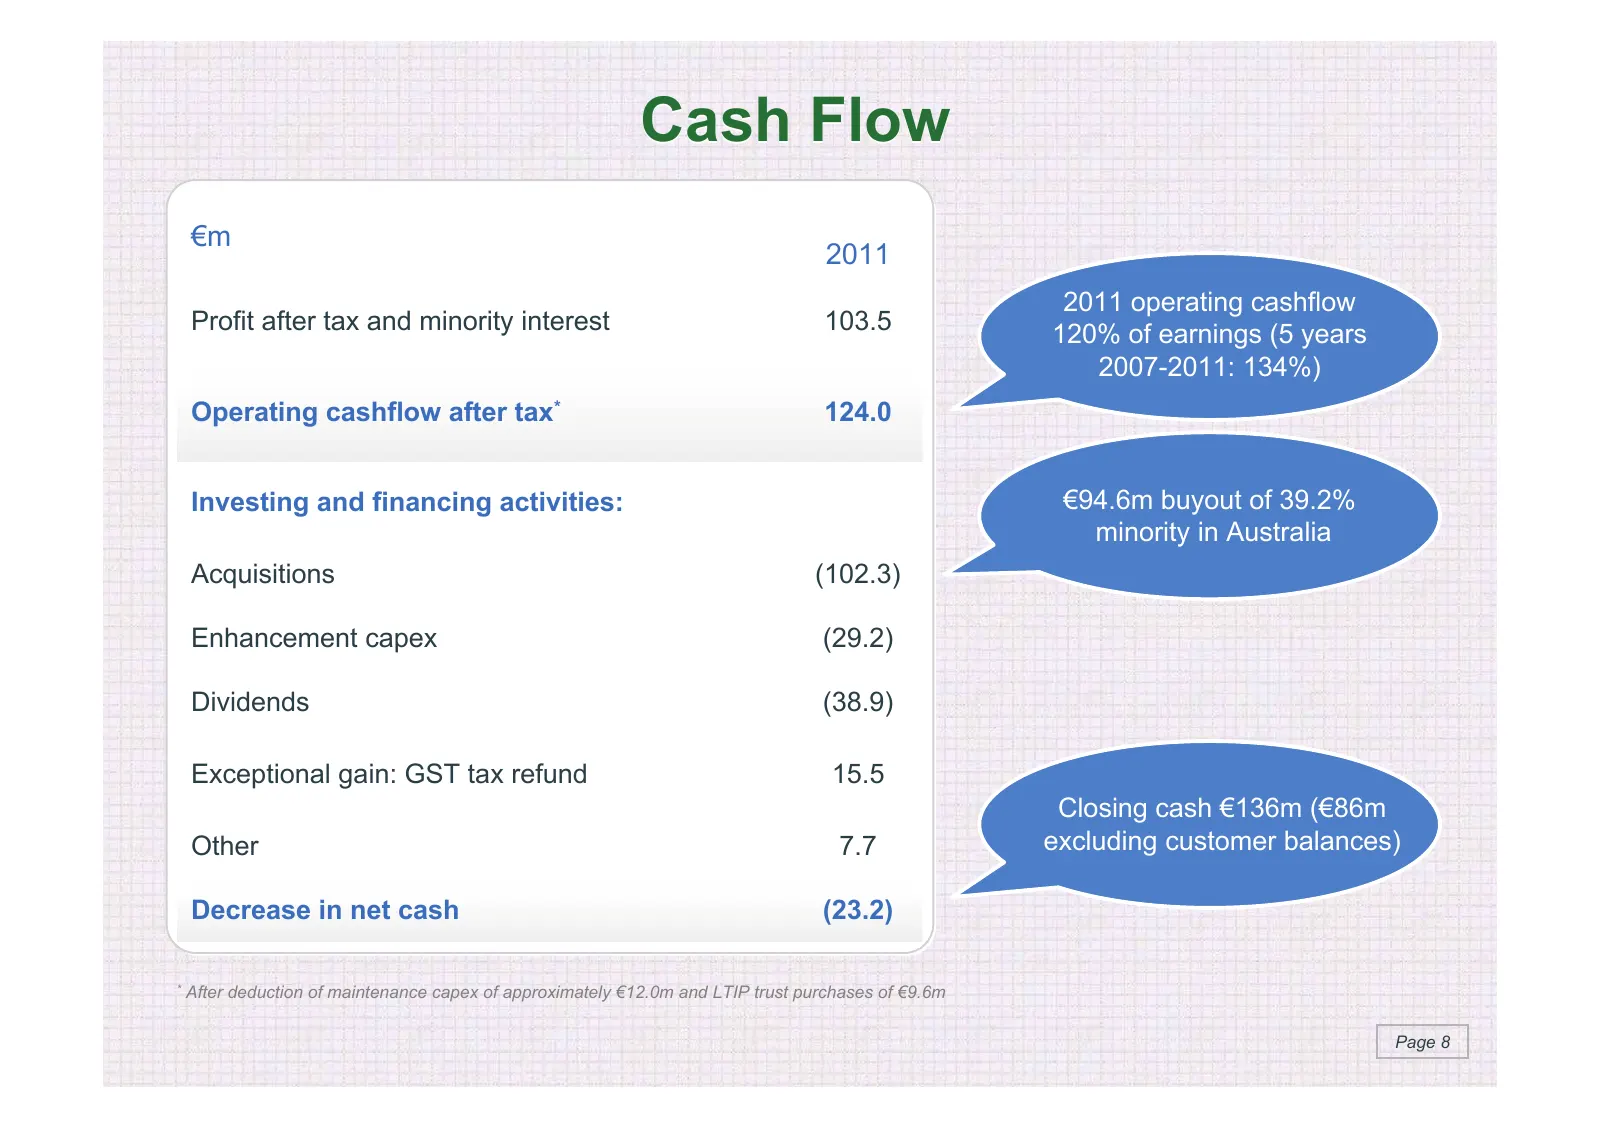
Cash Flow €m 2011 2011 operating cashflow Profit after tax and minority interest 103.5 120% of earnings (5 years 2007-2011: 134%) Operating cashflow after tax* 124.0 Investing and financing activities: €94.6m buyout of 39.2% minority in Australia Acquisitions (102.3) Enhancement capex (29.2) Dividen
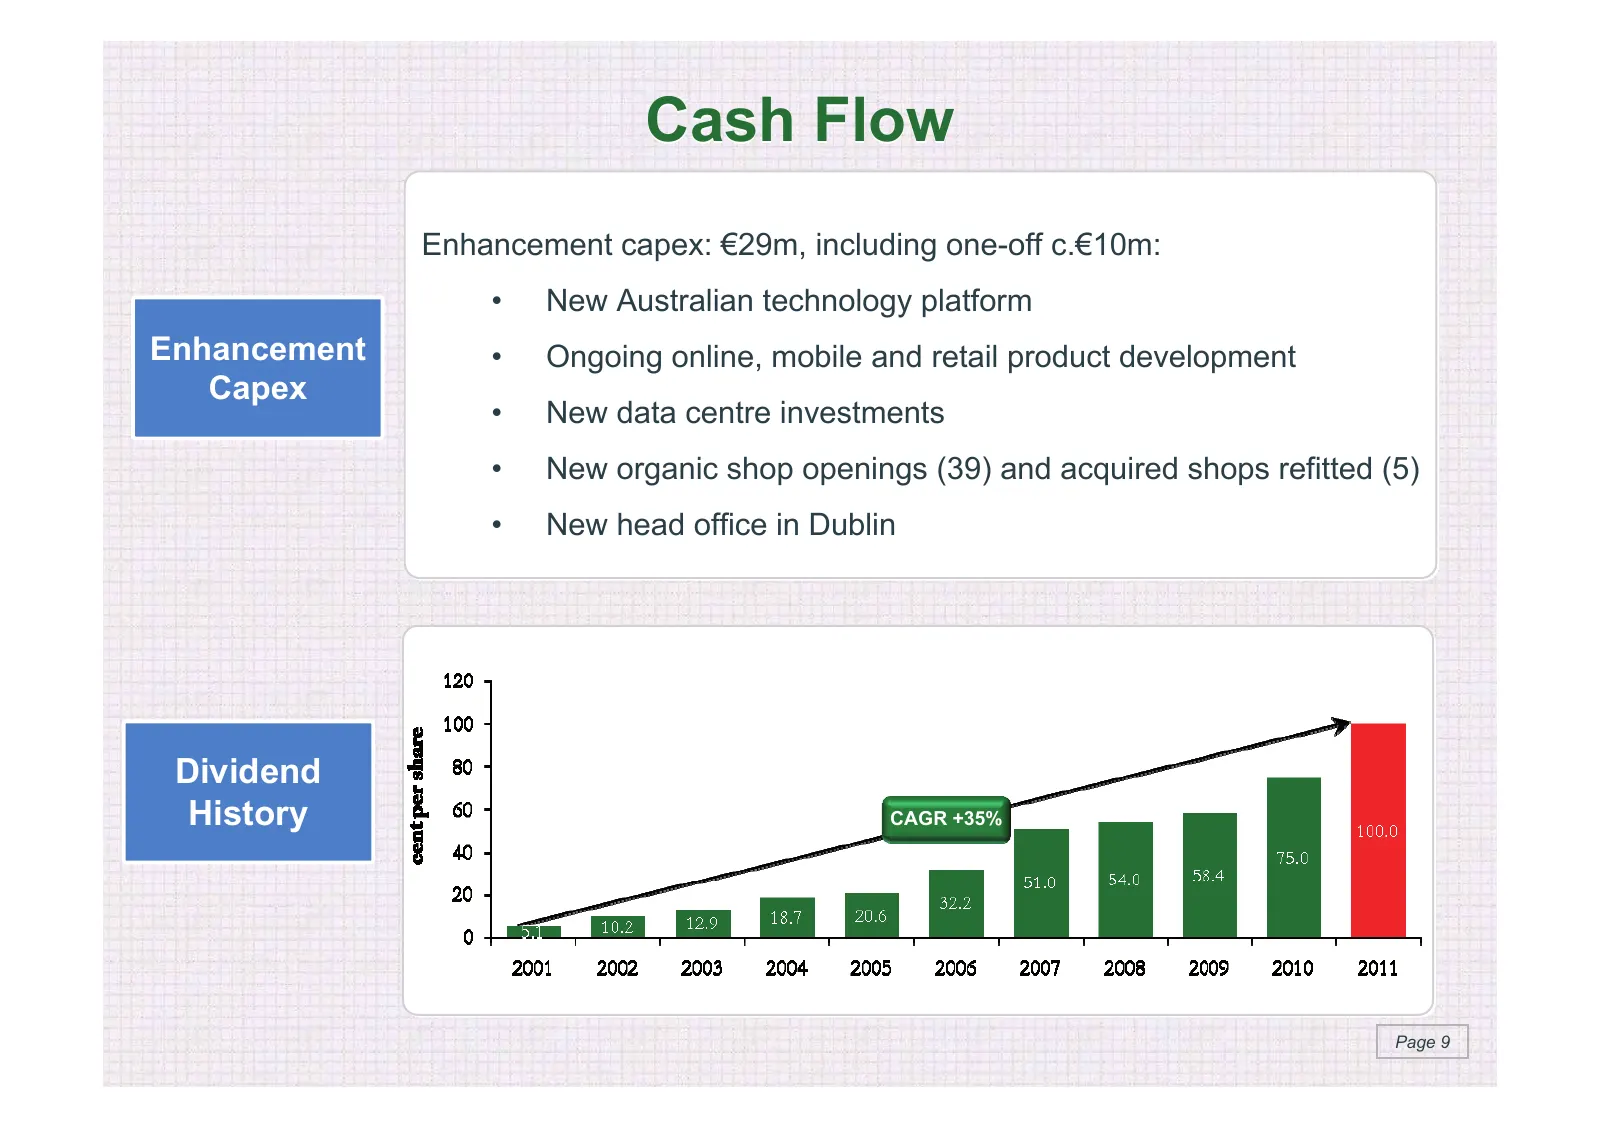
Slide 9: Cash Flow - Capex and Dividend History
Cash Flow Enhancement capex: €29m, including one-off c.€10m: • New Australian technology platform Enhancement • Ongoing online, mobile and retail product development Capex • New data centre investments • New organic shop openings (39) and acquired shops refitted (5) • New head office in Dublin Divid
Slide 10: Operational Review
Introduction Financial Performance Operational Review Strategy & Outlook Page 10
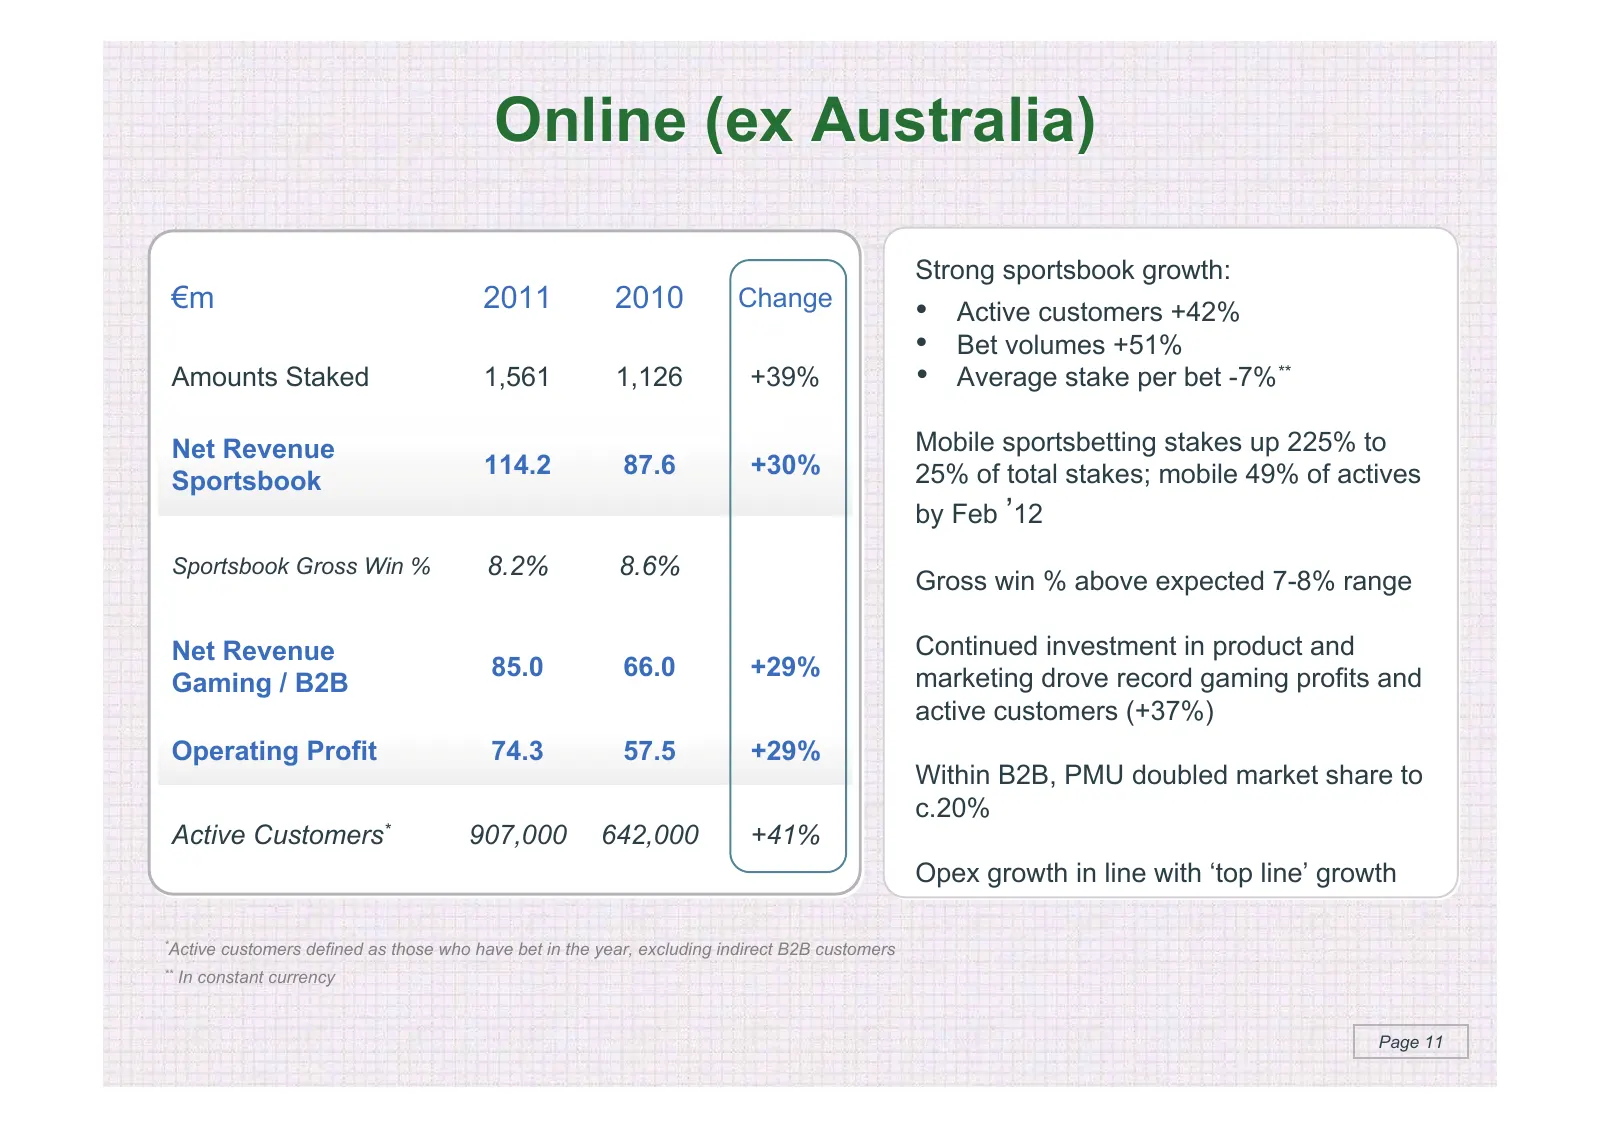
Slide 11: Online (ex Australia)
Online (ex Australia) Strong sportsbook growth: €m 2011 2010 Change • Active customers +42% • Bet volumes +51% Amounts Staked 1,561 1,126 +39% • Average stake per bet -7%** Net Revenue Mobile sportsbetting stakes up 225% to 114.2 87.6 +30% 25% of total stakes; mobile 49% of actives Sportsbook by Feb
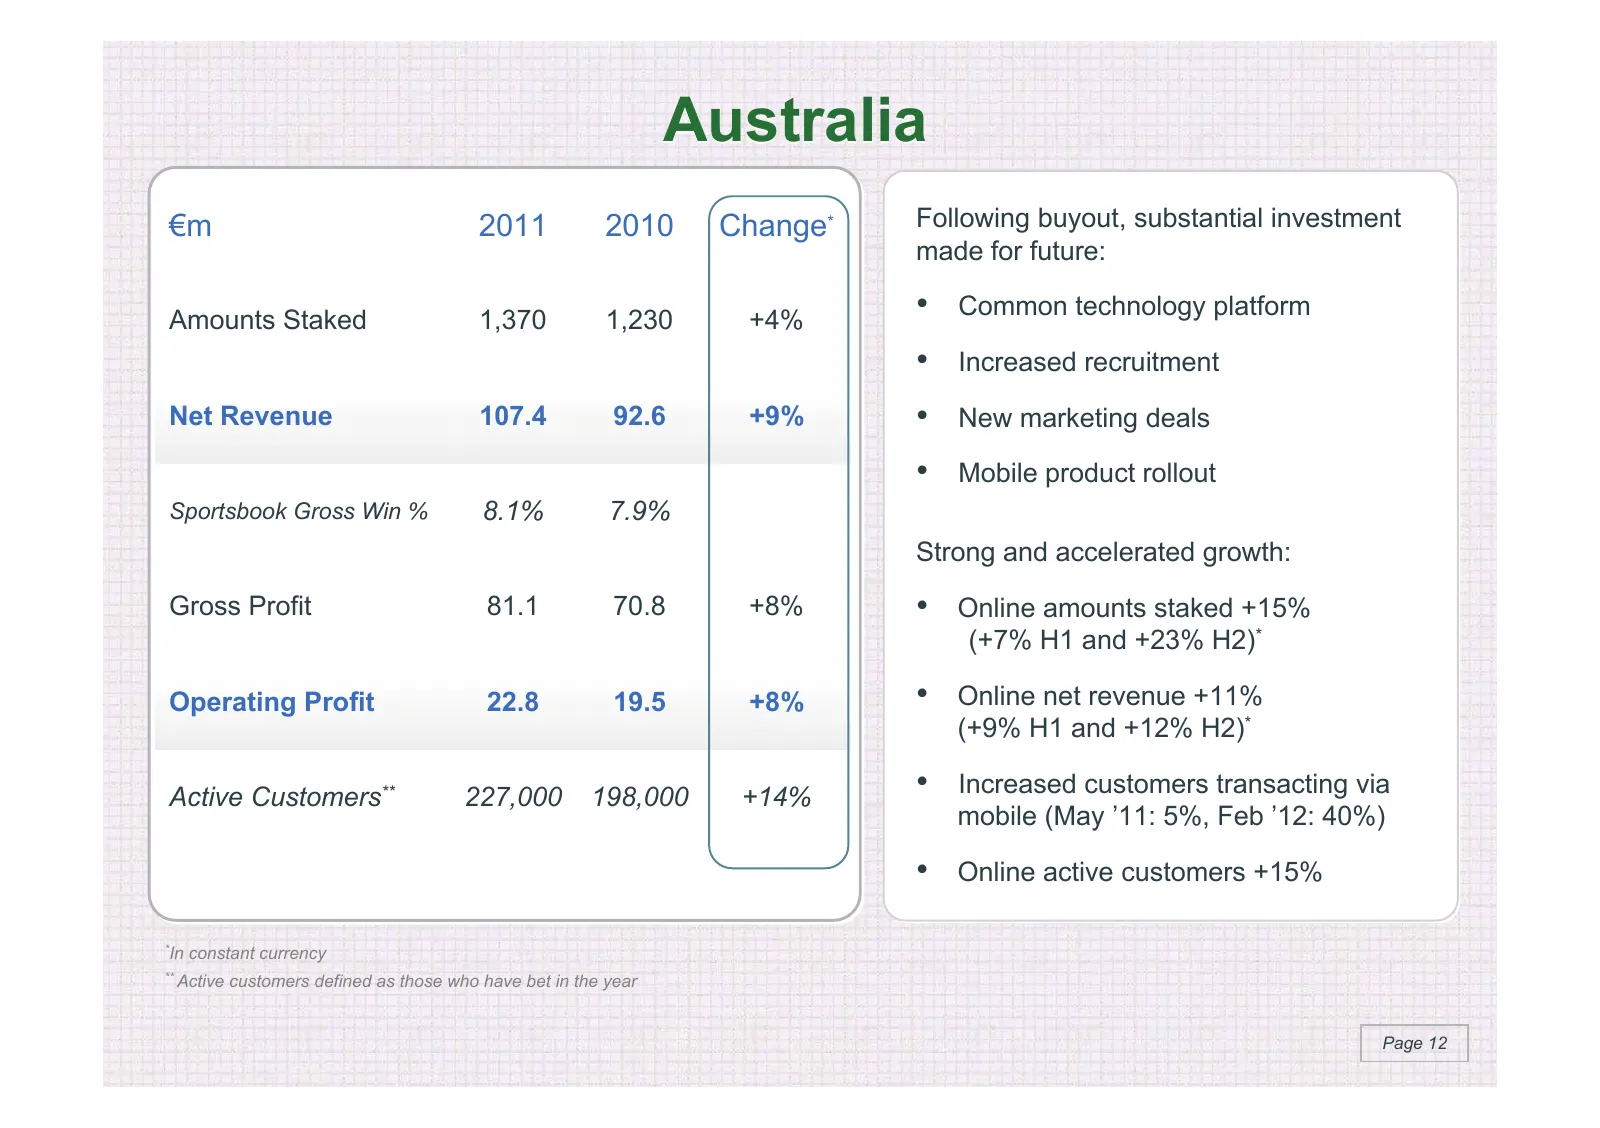
Slide 12: Australia
Australia €m 2011 2010 Change* Following buyout, substantial investment made for future: Amounts Staked 1,370 1,230 +4% • Common technology platform • Increased recruitment Net Revenue 107.4 92.6 +9% • New marketing deals • Mobile product rollout Sportsbook Gross Win % 8.1% 7.9% Strong and accelerat
Slide 13: Irish Retail
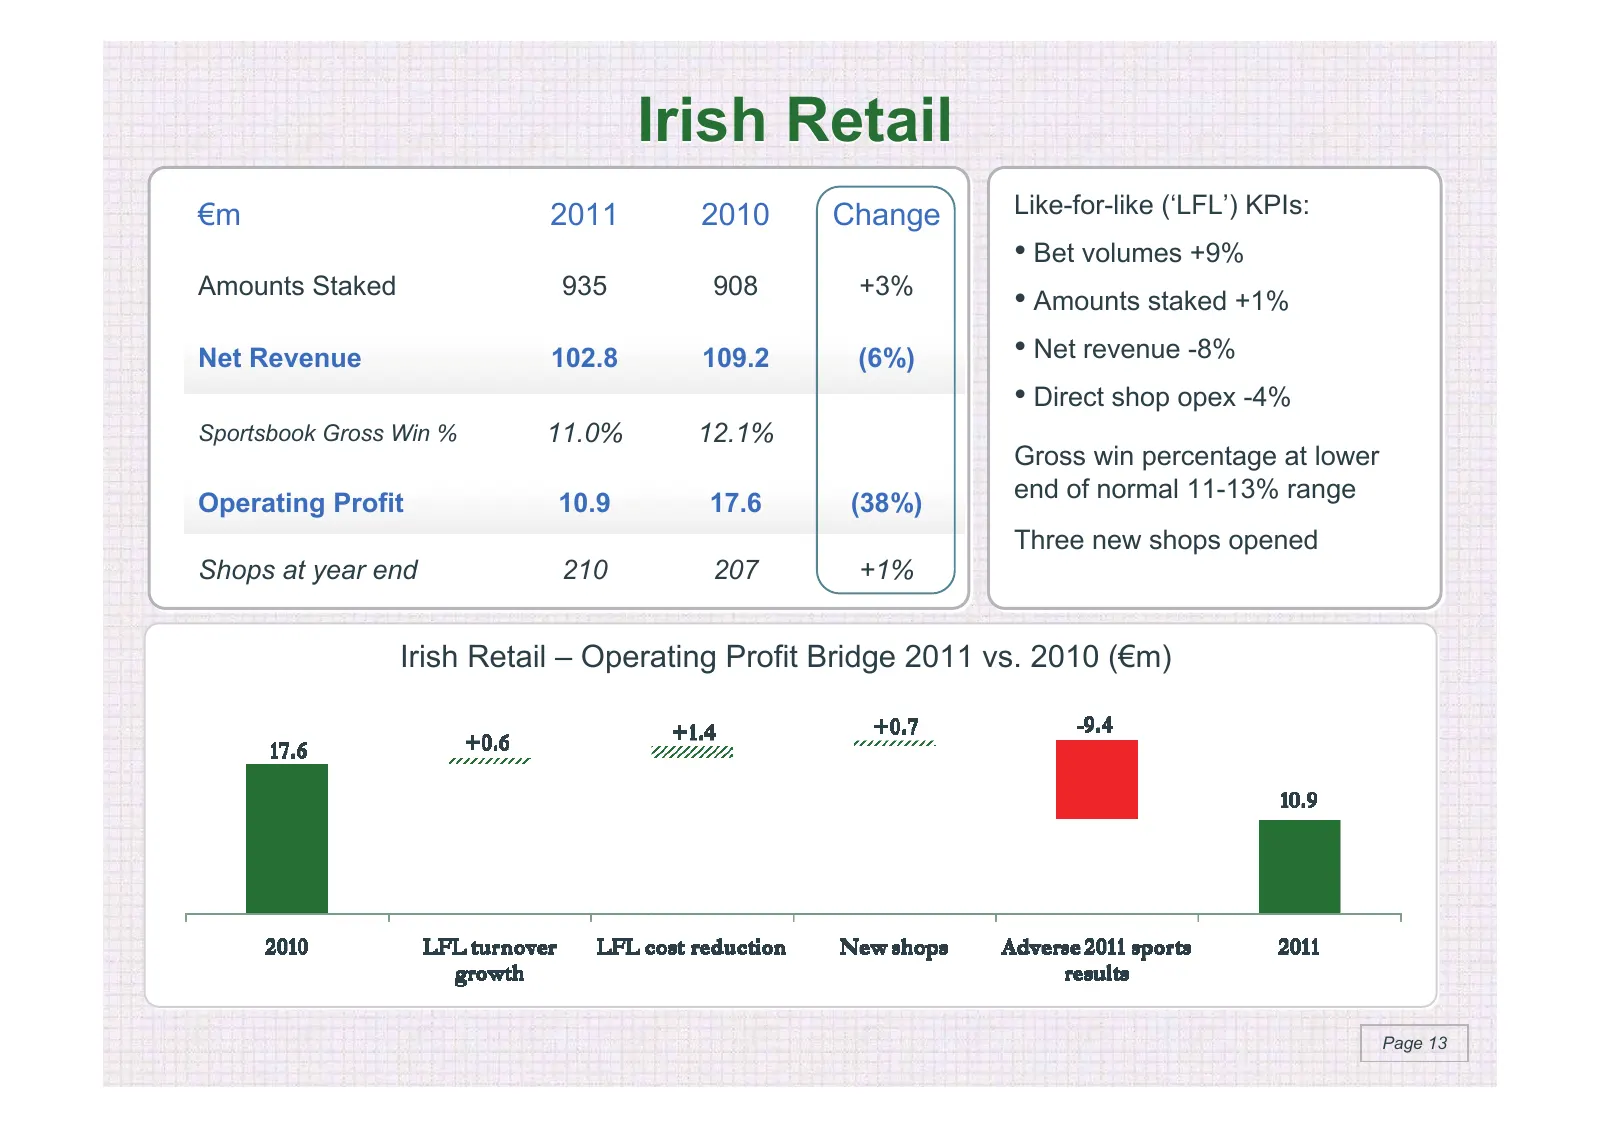
Irish Retail €m 2011 2010 Change Like-for-like (‘LFL’) KPIs: • Bet volumes +9% Amounts Staked 935 908 +3% • Amounts staked +1% Net Revenue 102.8 109.2 (6%) • Net revenue -8% • Direct shop opex -4% Sportsbook Gross Win % 11.0% 12.1% Gross win percentage at lower end of normal 11-13% range Operating P
Slide 14: UK Retail
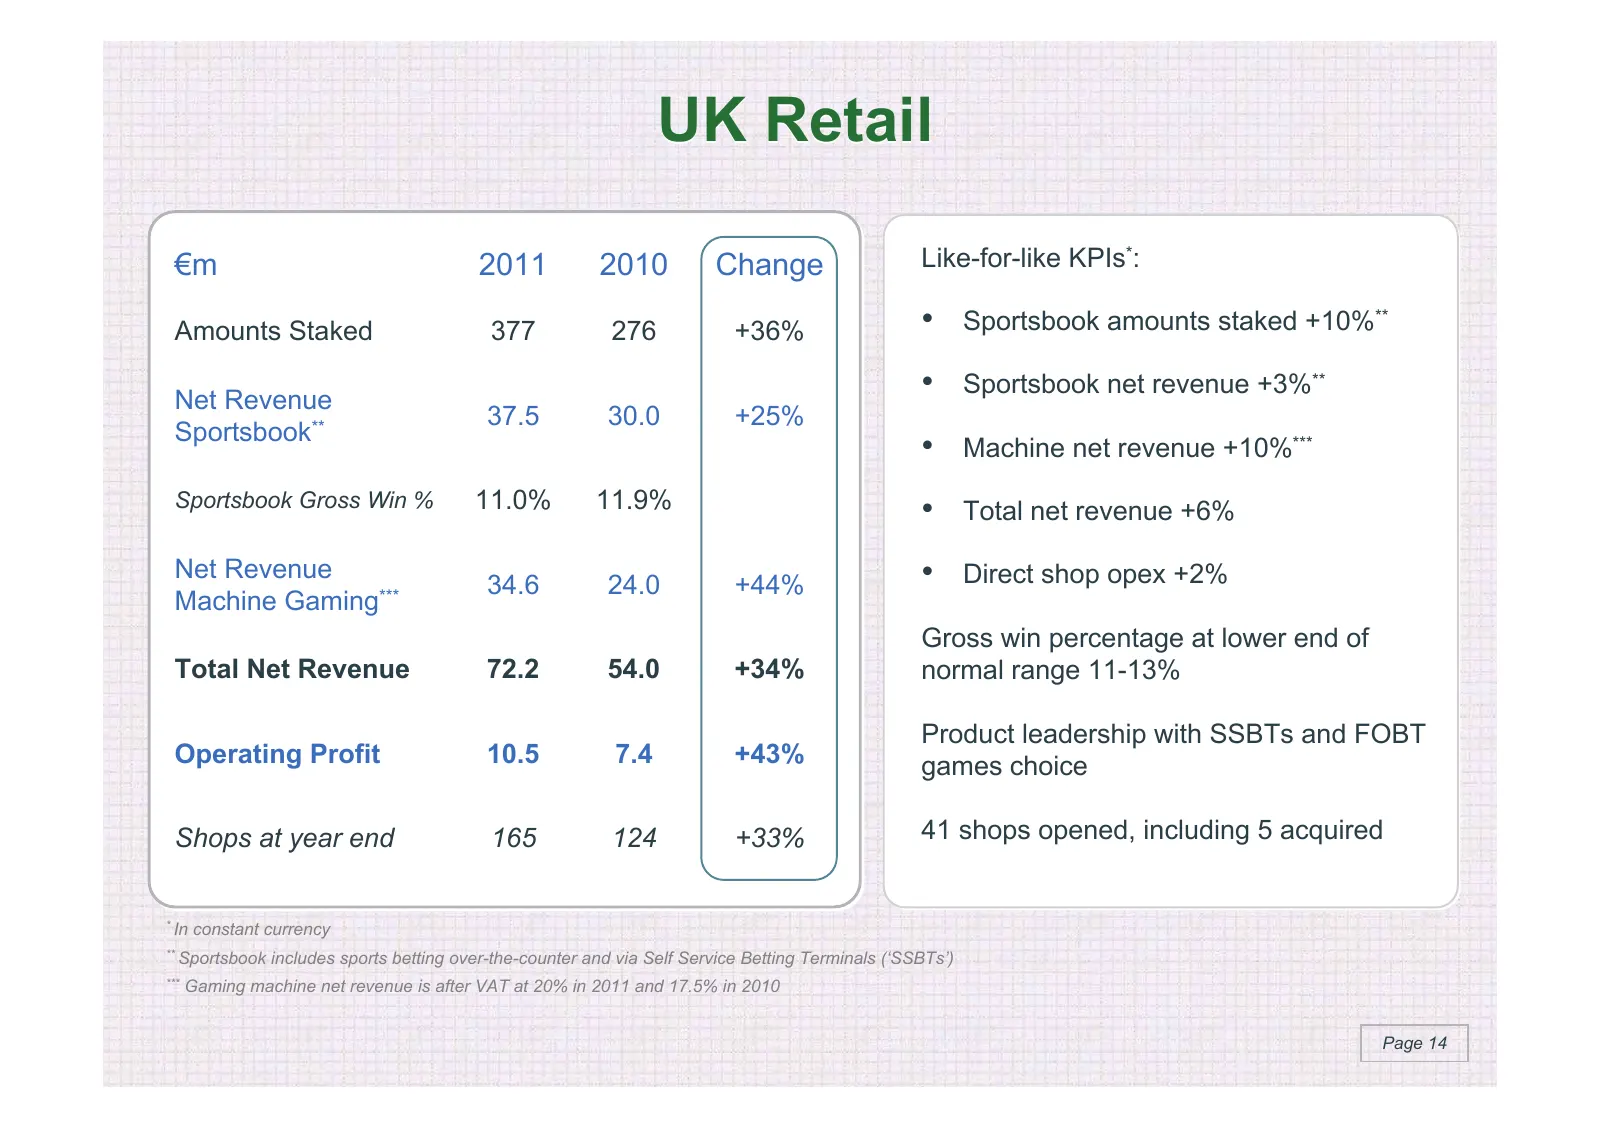
UK Retail €m 2011 2010 Change Like-for-like KPIs*: Amounts Staked 377 276 +36% • Sportsbook amounts staked +10%** Net Revenue • Sportsbook net revenue +3%** 37.5 30.0 +25% Sportsbook** • Machine net revenue +10%*** Sportsbook Gross Win % 11.0% 11.9% • Total net revenue +6% Net Revenue 34.6 24.0 +44%
Slide 15: UK Retail: Significant Returns and Opportunity
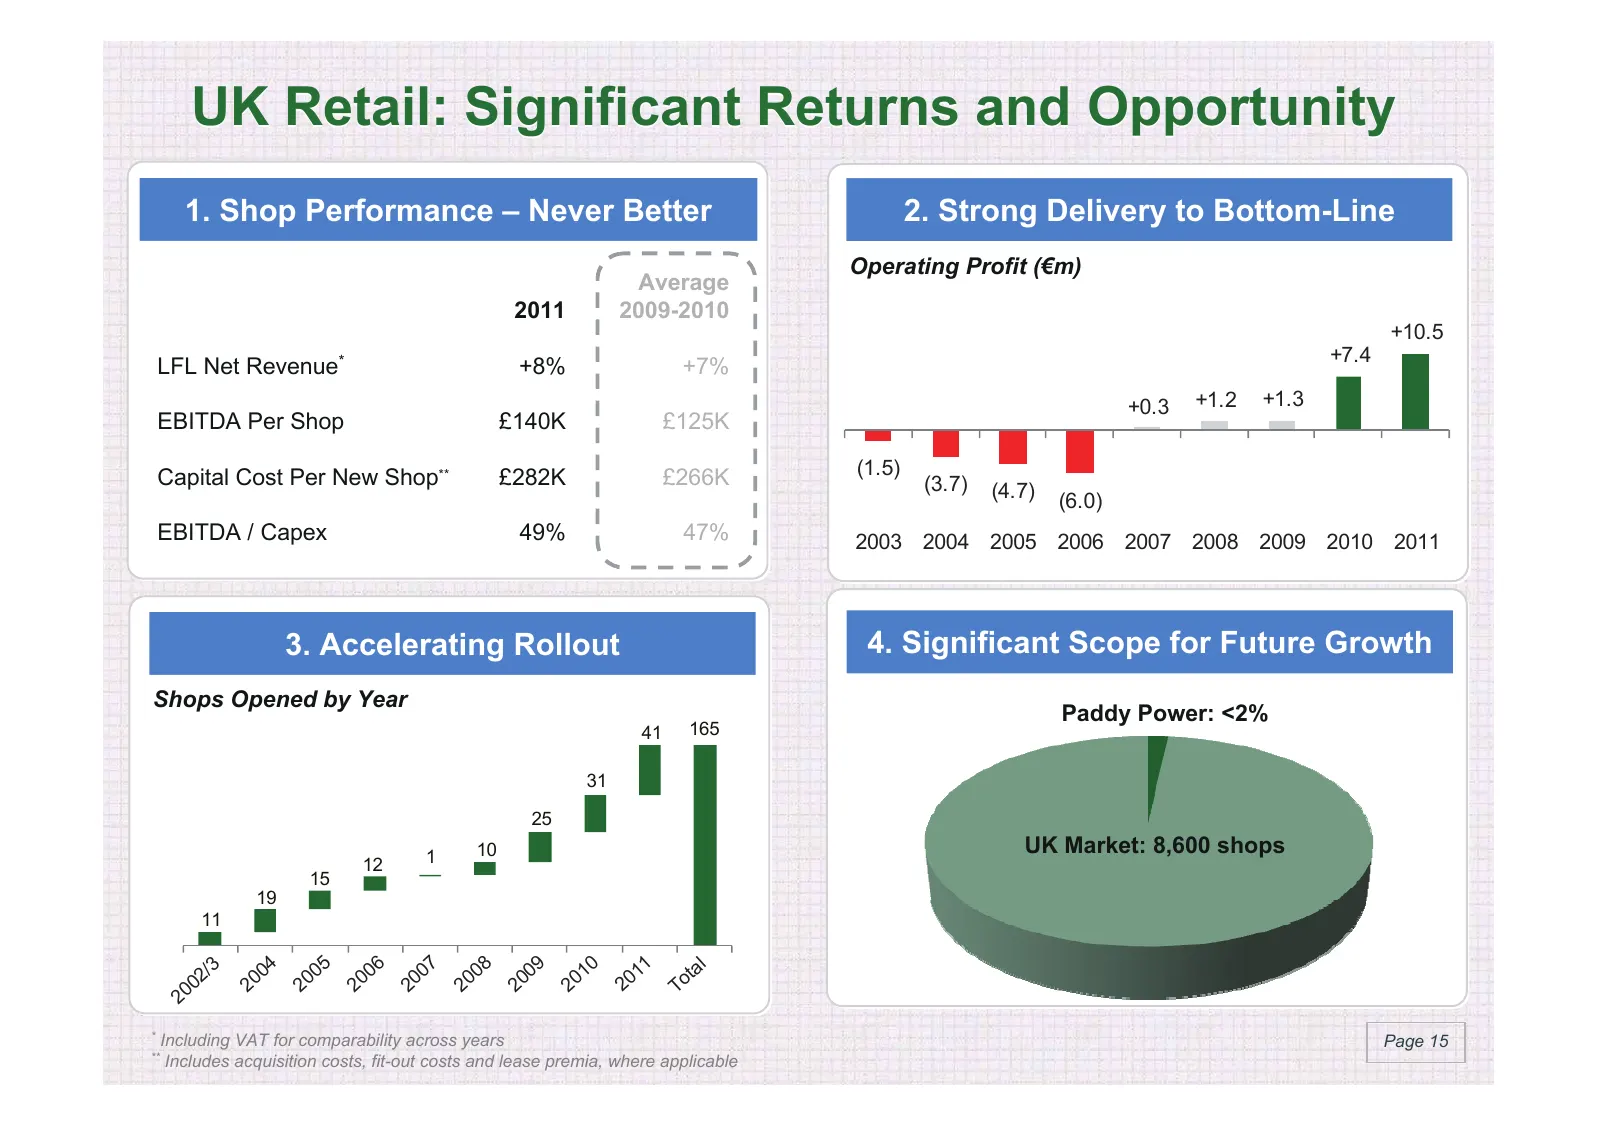
UK Retail: Significant Returns and Opportunity 1. Shop Performance – Never Better 2. Strong Delivery to Bottom-Line Operating Profit (€m) Average 2011 2009-2010 +10.5 +7.4 LFL Net Revenue* +8% +7% +0.3 +1.2 +1.3 EBITDA Per Shop £140K £125K Capital Cost Per New Shop** £282K £266K (1.5) (3.7) (4.7) (6
Slide 16: Telephone
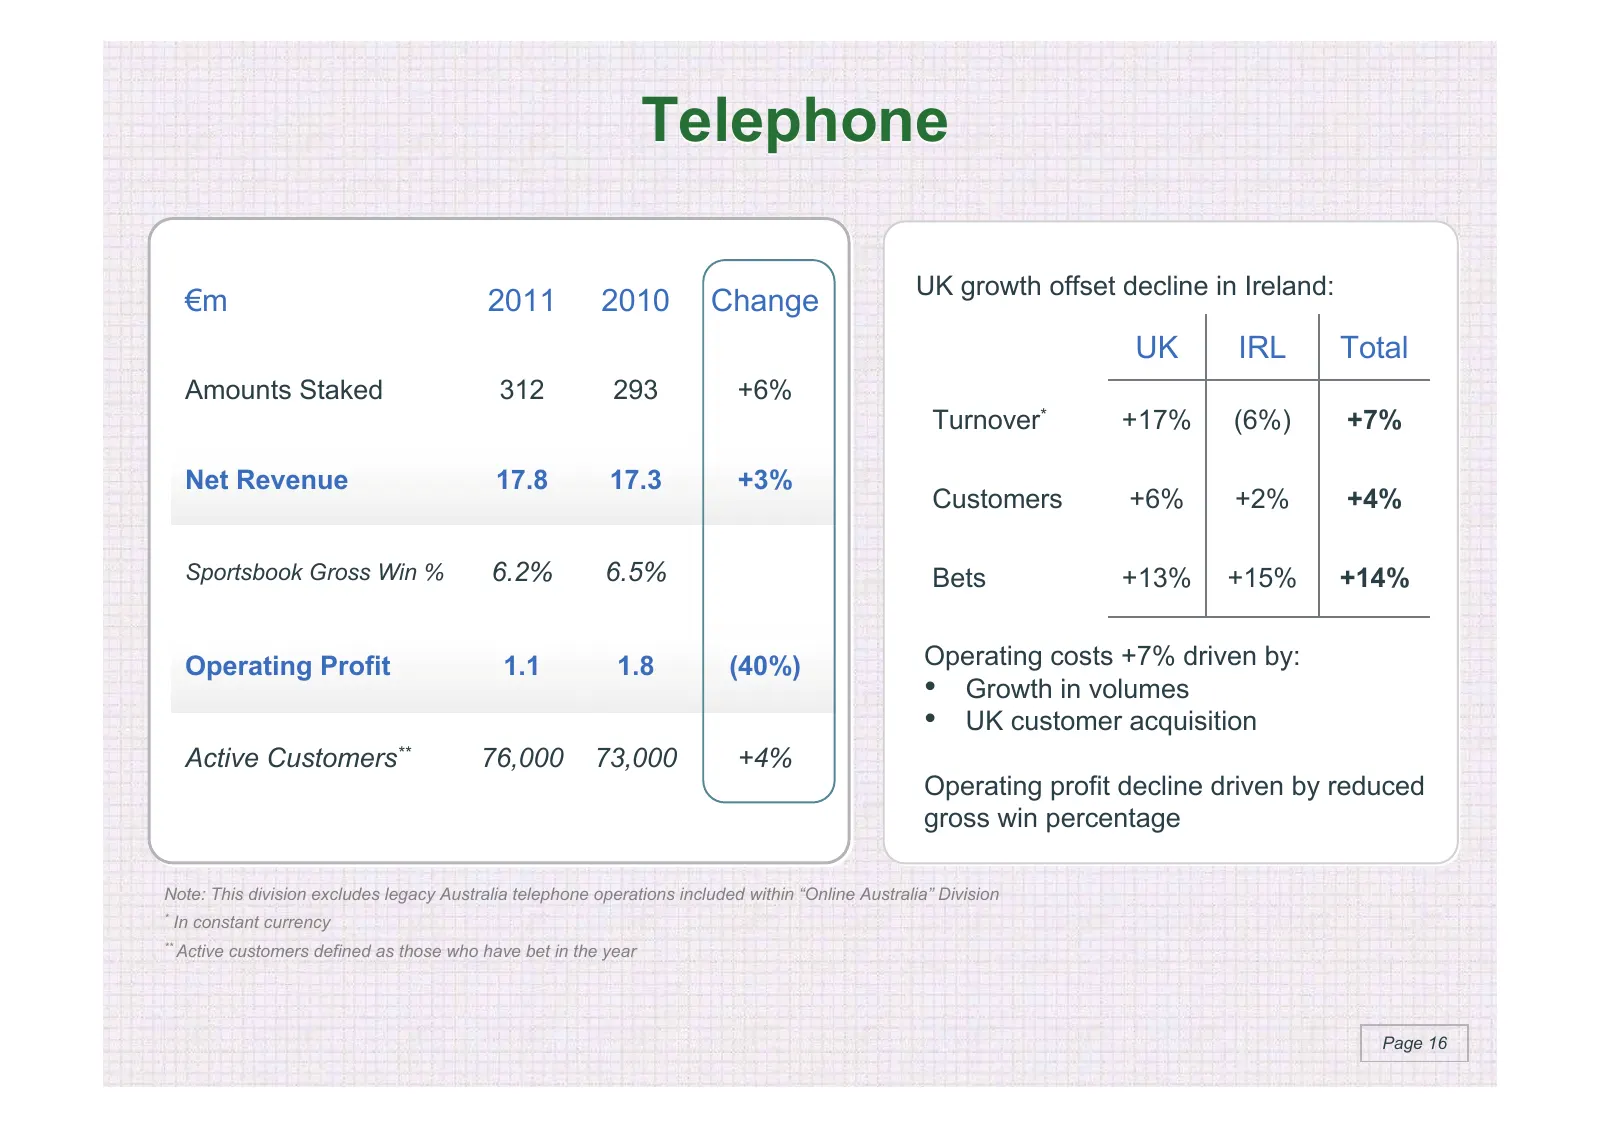
Telephone UK growth offset decline in Ireland: €m 2011 2010 Change UK IRL Total Amounts Staked 312 293 +6% Turnover* +17% (6%) +7% Net Revenue 17.8 17.3 +3% Customers +6% +2% +4% Sportsbook Gross Win % 6.2% 6.5% Bets +13% +15% +14% Operating Profit 1.1 1.8 (40%) Operating costs +7% driven by: • Grow
Slide 17: Online: Tax & Regulatory Developments
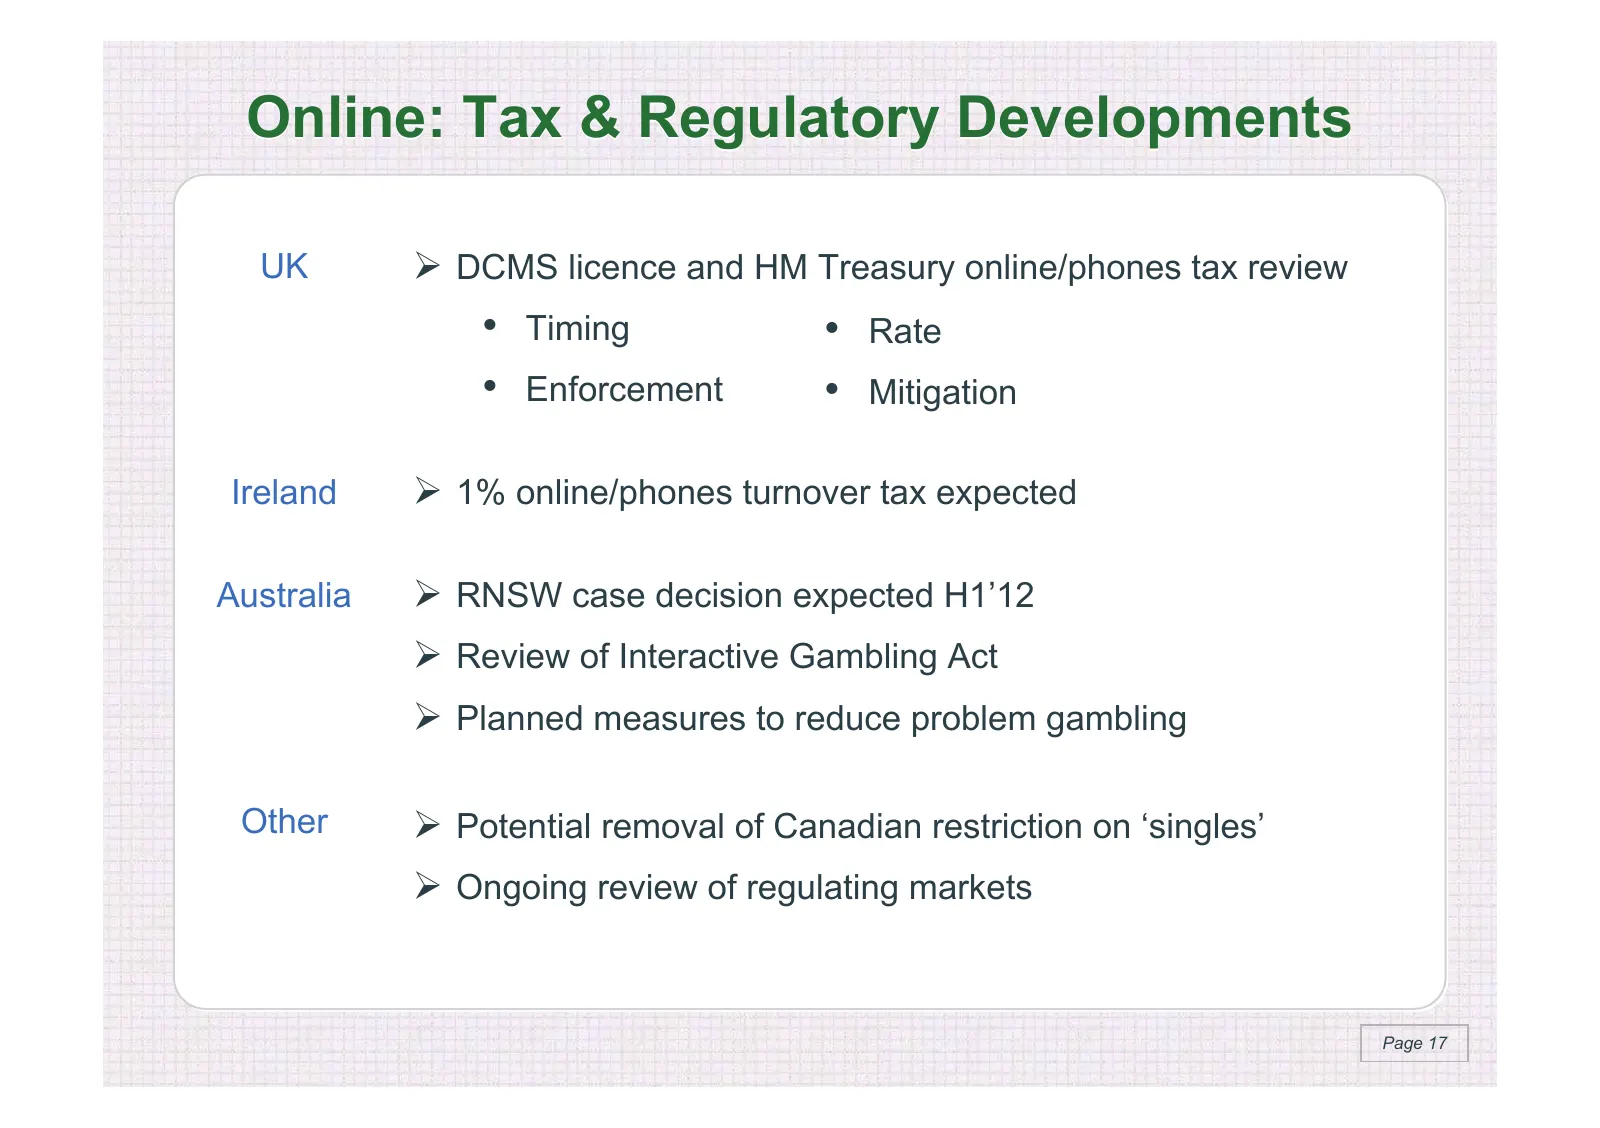
Online: Tax & Regulatory Developments UK DCMS licence and HM Treasury online/phones tax review • Timing • Rate • Enforcement • Mitigation Ireland 1% online/phones turnover tax expected Australia RNSW case decision expected H1’12 Review of Interactive Gambling Act Planned measures to reduce
Slide 18: Strategy & Outlook
Introduction Financial Performance Operational Review Strategy & Outlook Page 18
Slide 19: Strategy & Outlook
Strategy & Outlook 1. Market Dynamics 2. Investment 3. Payback 4. Conclusion Page 19
Slide 20: Market Dynamics – UK Online Sportsbook
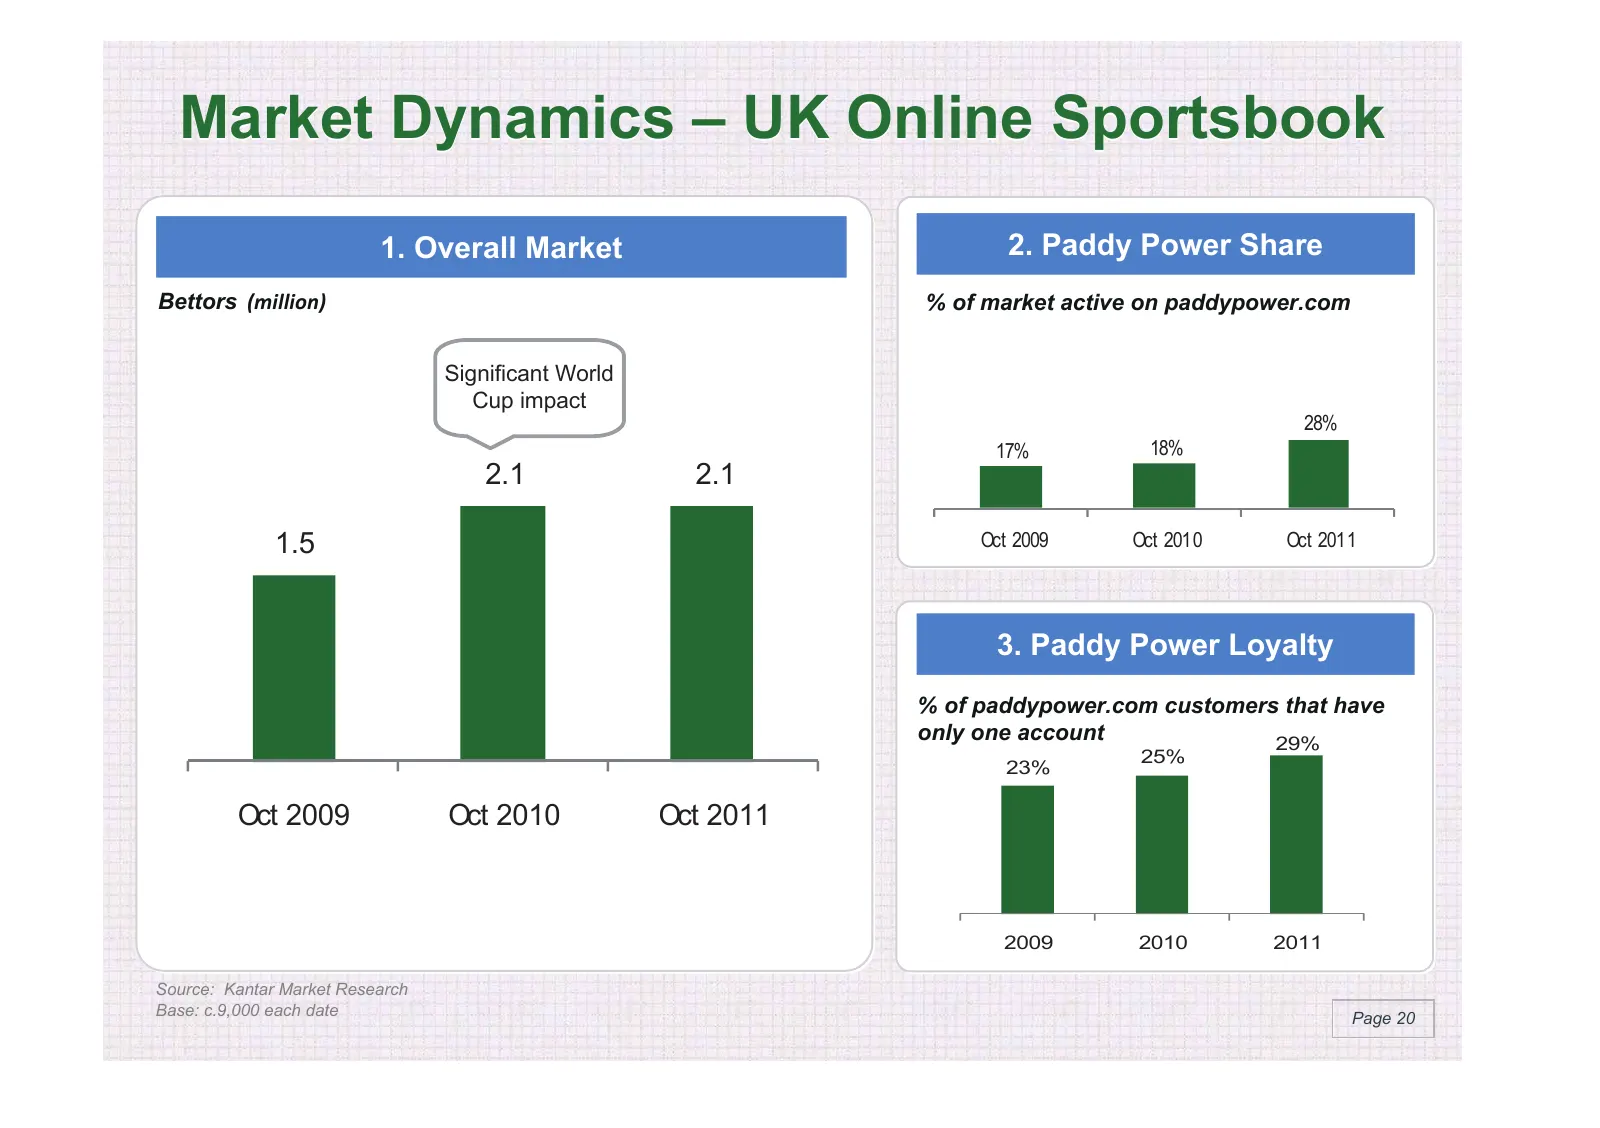
Market Dynamics – UK Online Sportsbook 1. Overall Market 2. Paddy Power Share Bettors (million) % of market active on paddypower.com Significant World Cup impact 28% 17% 18% 2.1 2.1 1.5 Oct 2009 Oct 2010 Oct 2011 3. Paddy Power Loyalty % of paddypower.com customers that have only one account 29% 25%
Slide 21: Market Dynamics – Australia Online
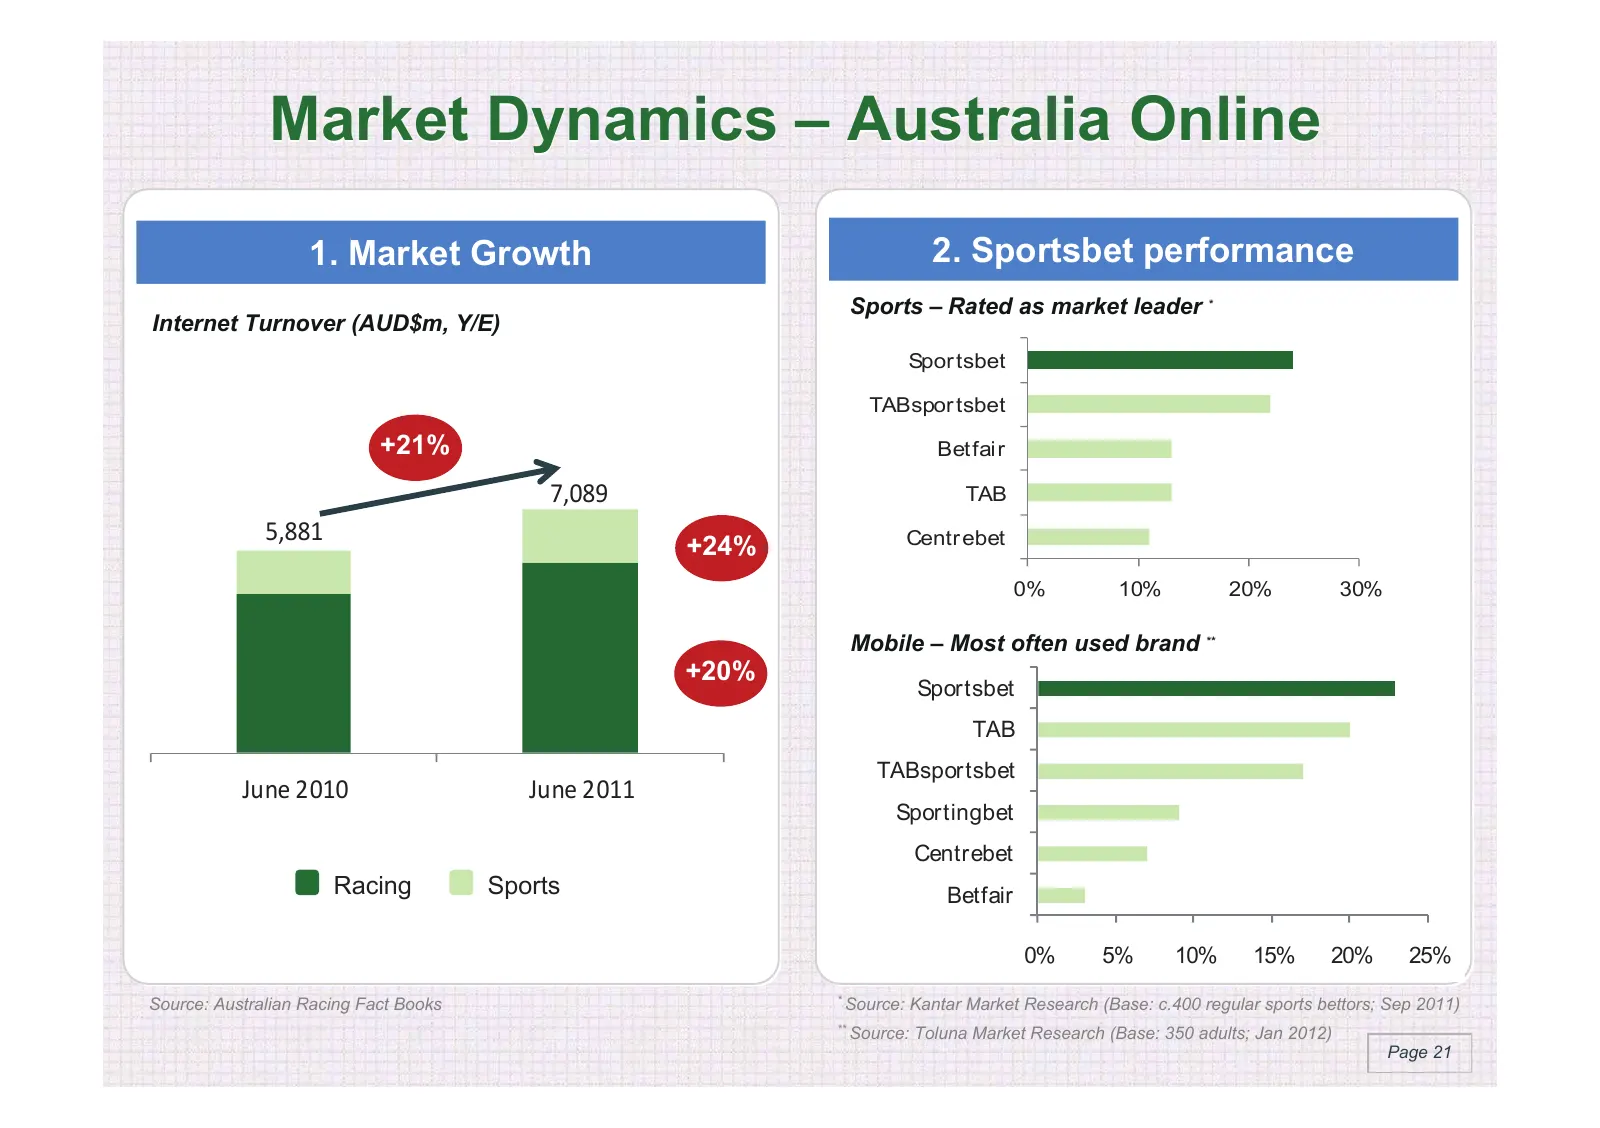
Market Dynamics – Australia Online 1. Market Growth 2. Sportsbet performance Sports – Rated as market leader * Internet Turnover (AUD$m, Y/E) Spor tsbet TABspor tsbet +21% Bet fair 7,089 TAB 5,881 Centr ebet +24% 0% 10% 20% 30% Mobile – Most often used brand ** +20% Sportsbet TAB TABsportsbet June 2
Slide 22: Investment: People
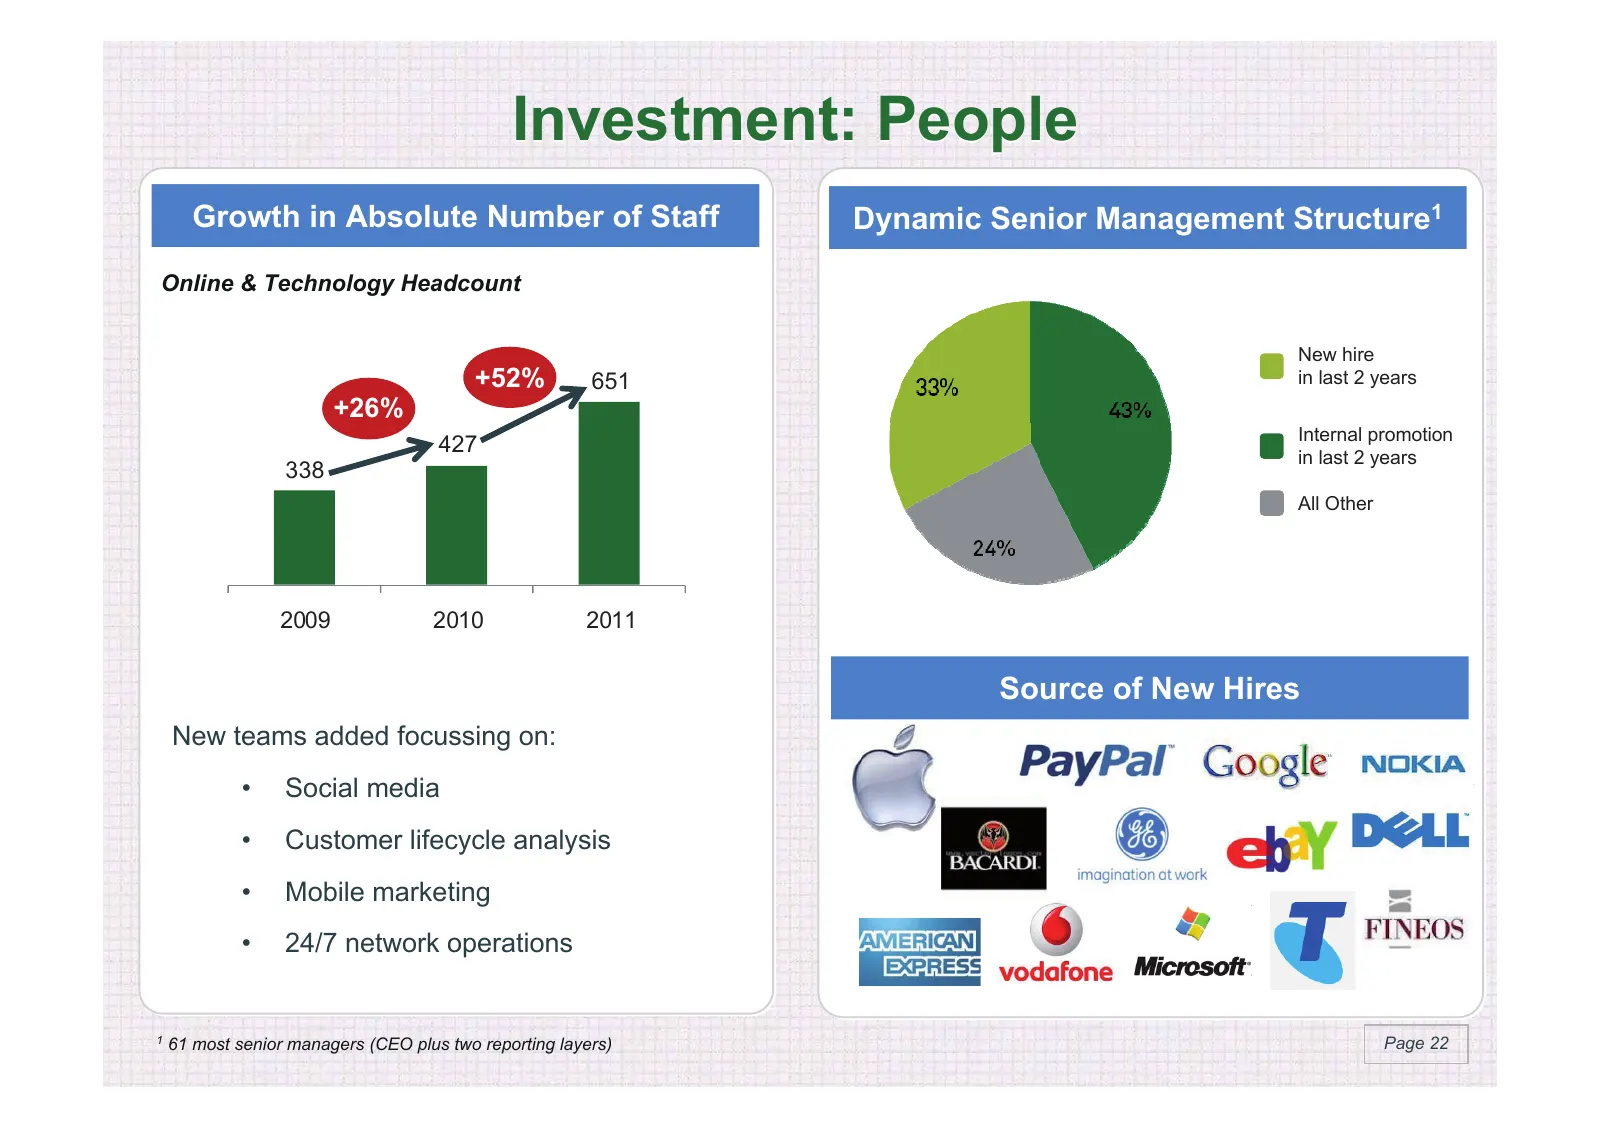
Investment: People Growth in Absolute Number of Staff Dynamic Senior Management Structure1 Online & Technology Headcount New hire +52% 651 in last 2 years +26% Internal promotion 427 in last 2 years 338 All Other 2009 2010 2011 Source of New Hires New teams added focussing on: • Social media • Custo
Slide 23: Investment: Operations
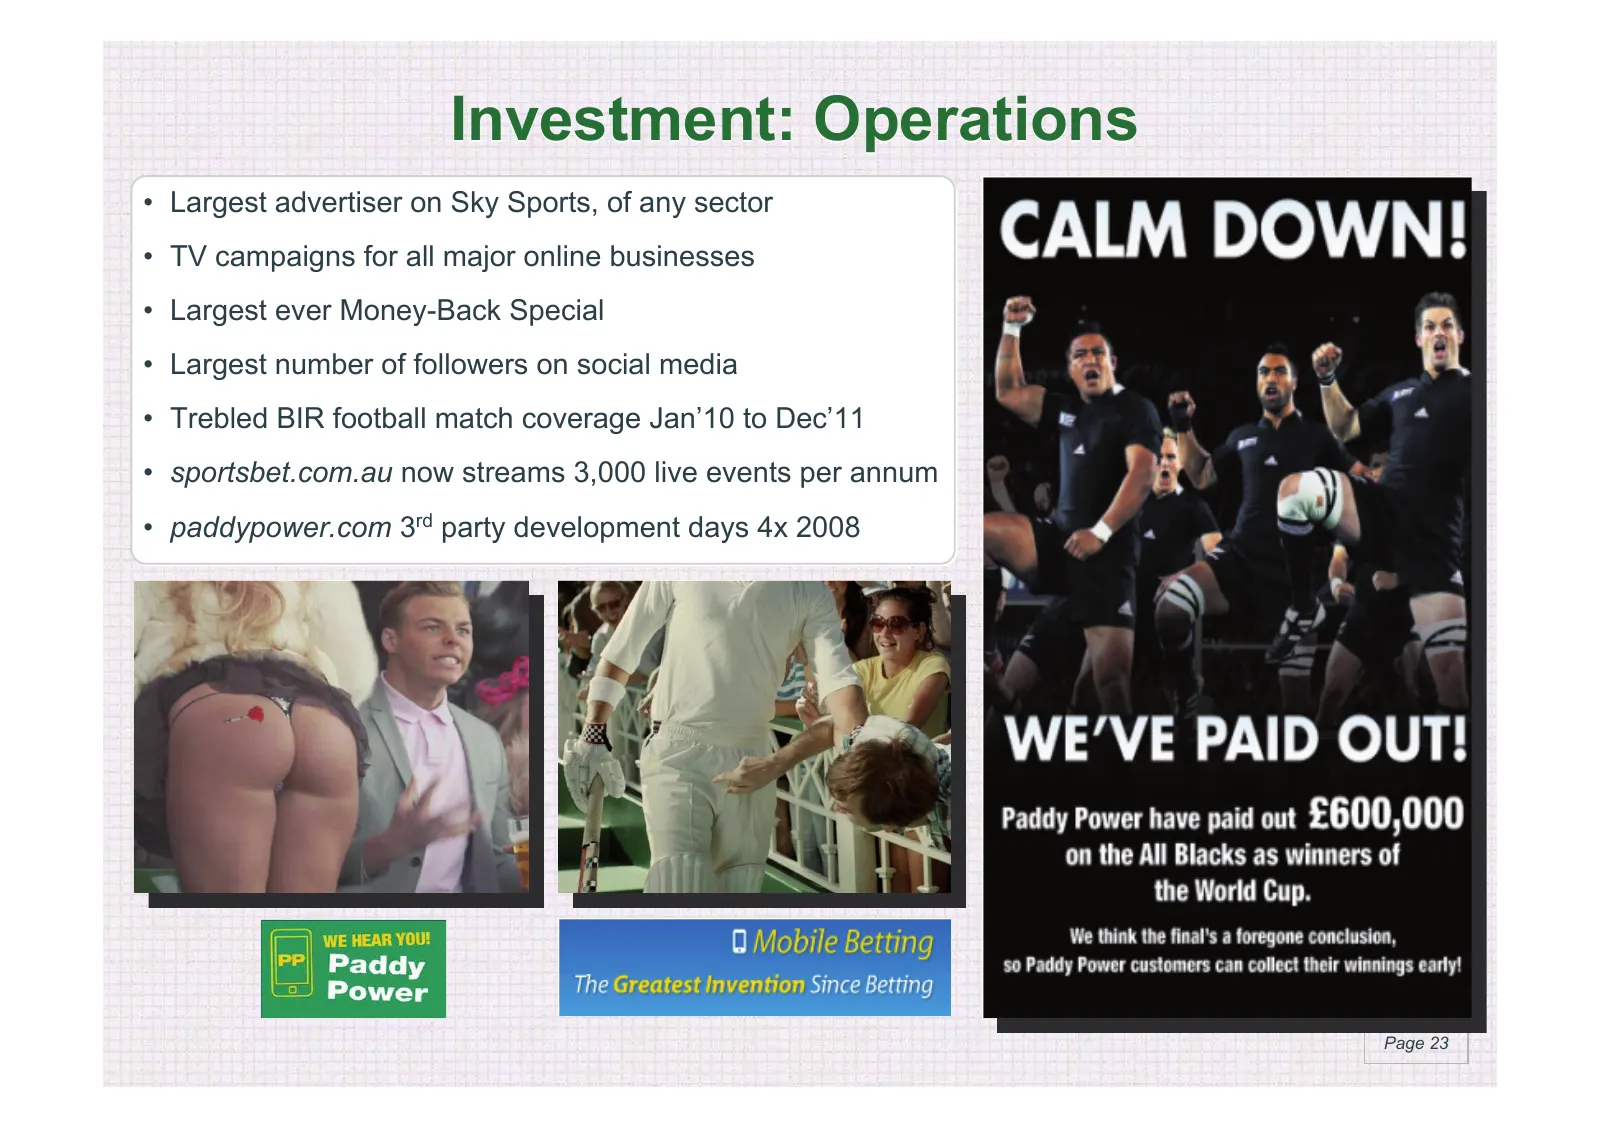
Investment: Operations • Largest advertiser on Sky Sports, of any sector • TV campaigns for all major online businesses • Largest ever Money-Back Special • Largest number of followers on social media • Trebled BIR football match coverage Jan’10 to Dec’11 • sportsbet.com.au now streams 3,000 live eve
Slide 24: Investment: New Geographies
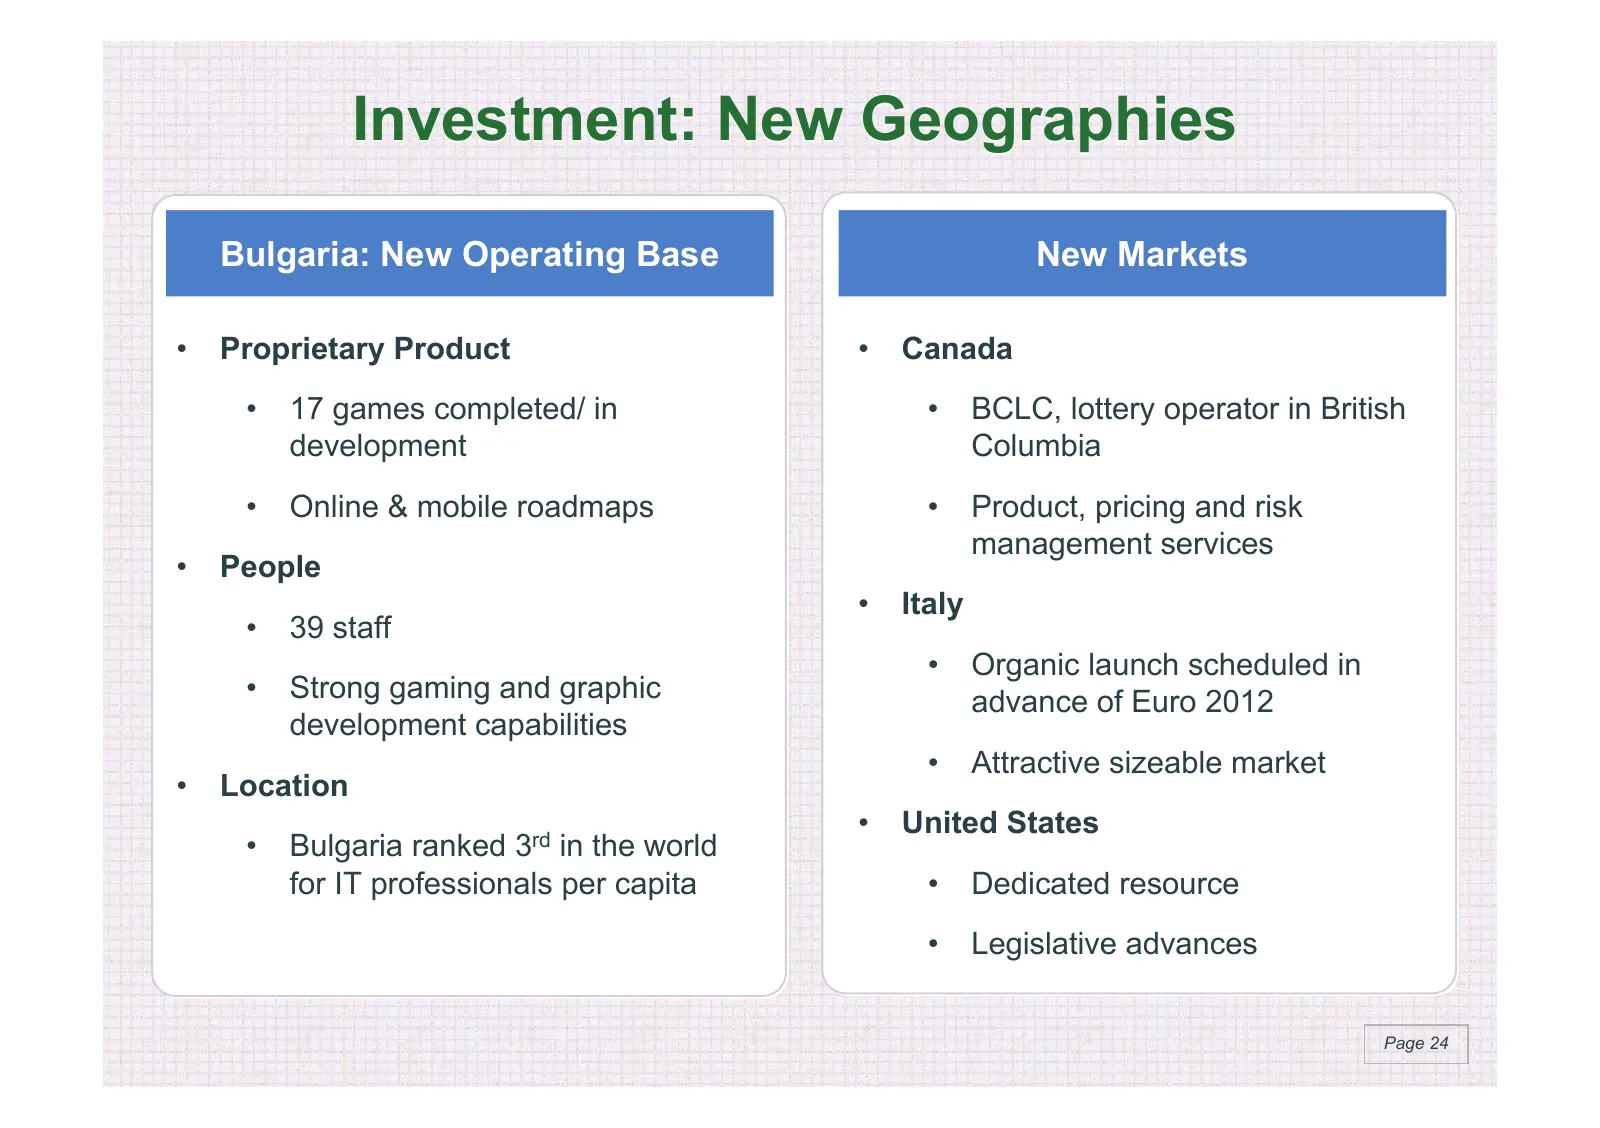
Investment: New Geographies Bulgaria: New Operating Base New Markets • Proprietary Product • Canada • 17 games completed/ in • BCLC, lottery operator in British development Columbia • Online & mobile roadmaps • Product, pricing and risk management services • People • Italy • 39 staff • Organic launc
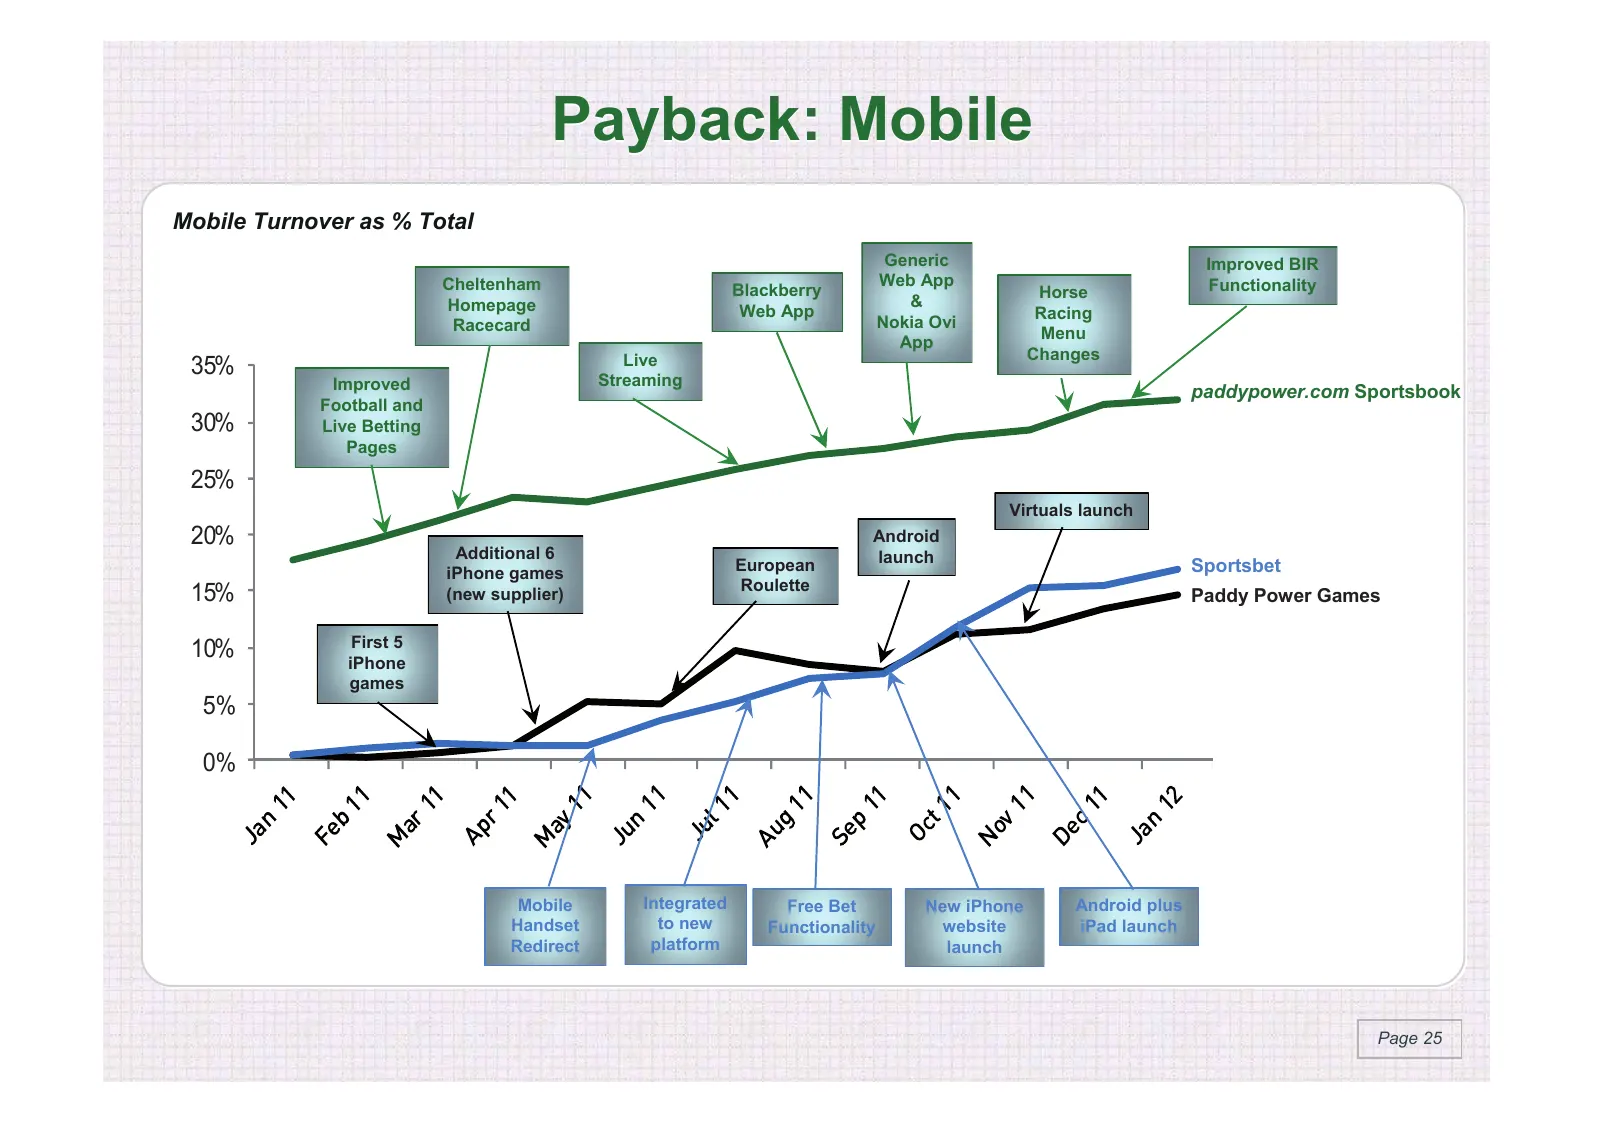
Slide 25: Payback: Mobile
Payback: Mobile Mobile Turnover as % Total Generic Improved BIR Cheltenham Web App Functionality Blackberry Horse Homepage & Web App Racing Racecard Nokia Ovi Menu App Live Changes 35% Streaming Improved paddypower.com Sportsbook Football and 30% Live Betting Pages 25% Virtuals launch 20% Android Ad
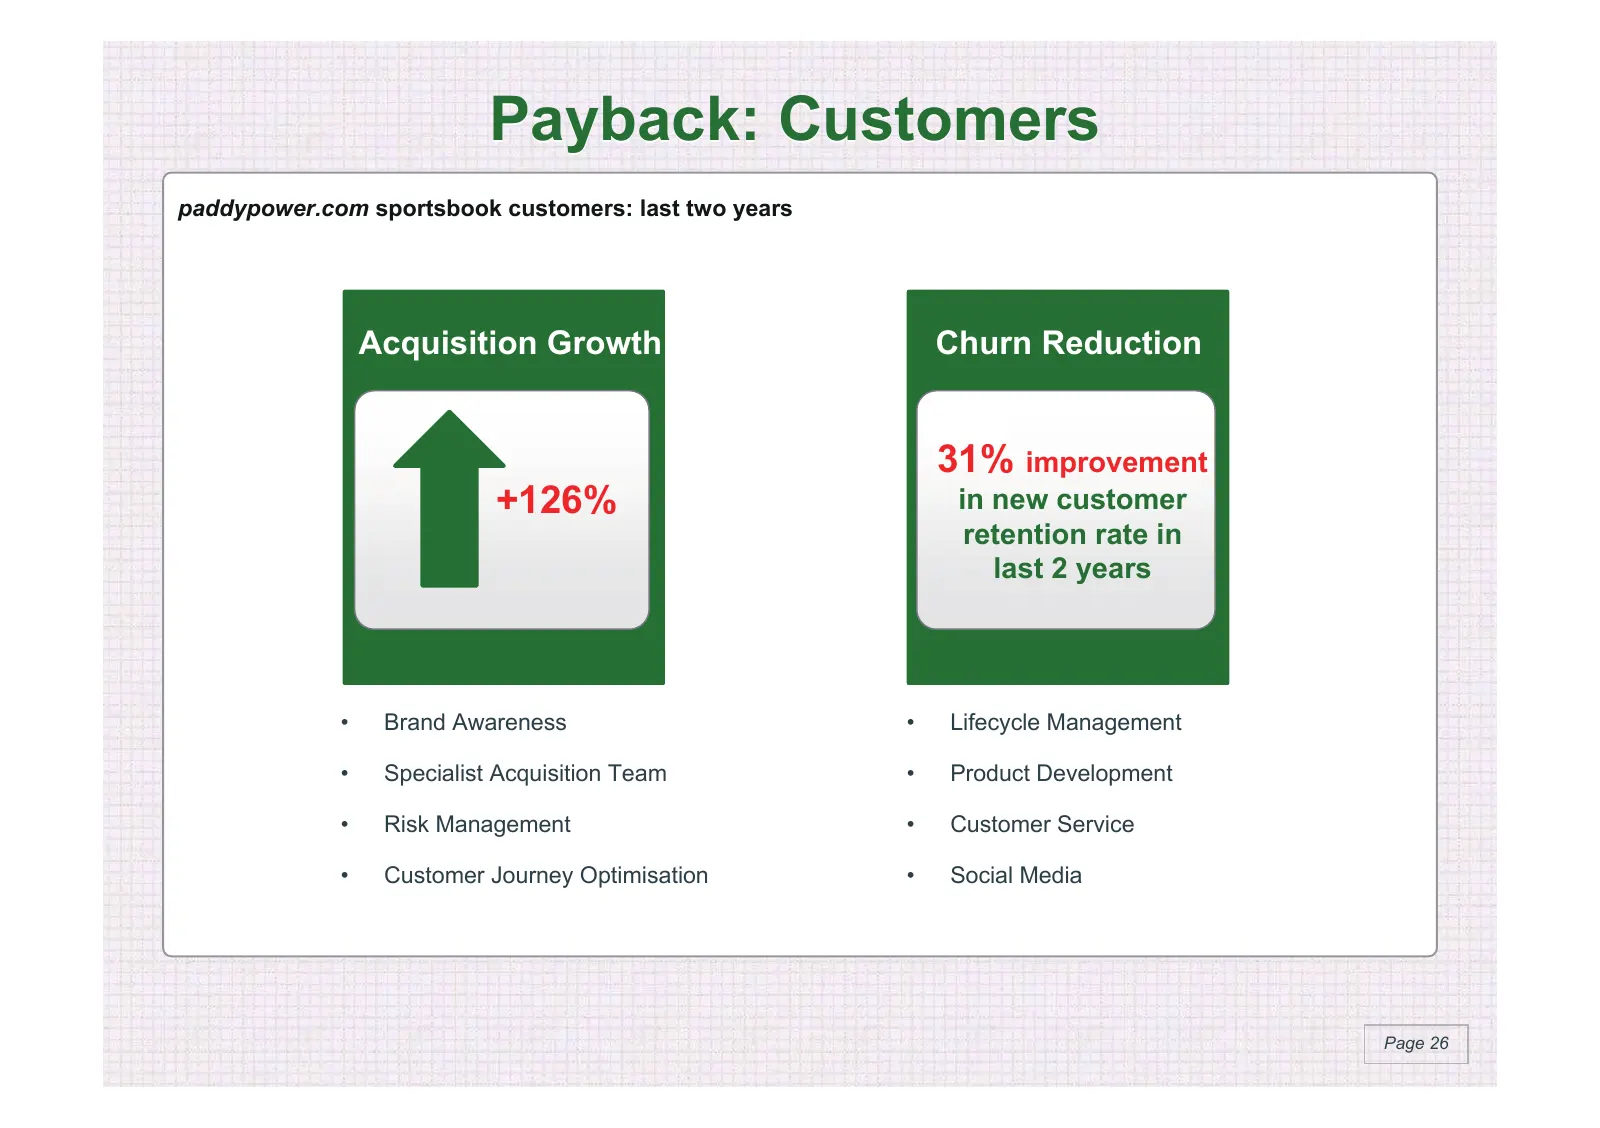
Slide 26: Payback: Customers
Payback: Customers paddypower.com sportsbook customers: last two years Acquisition Growth Churn Reduction 31% improvement +126% in new customer retention rate in last 2 years • Brand Awareness • Lifecycle Management • Specialist Acquisition Team • Product Development • Risk Management • Customer Ser
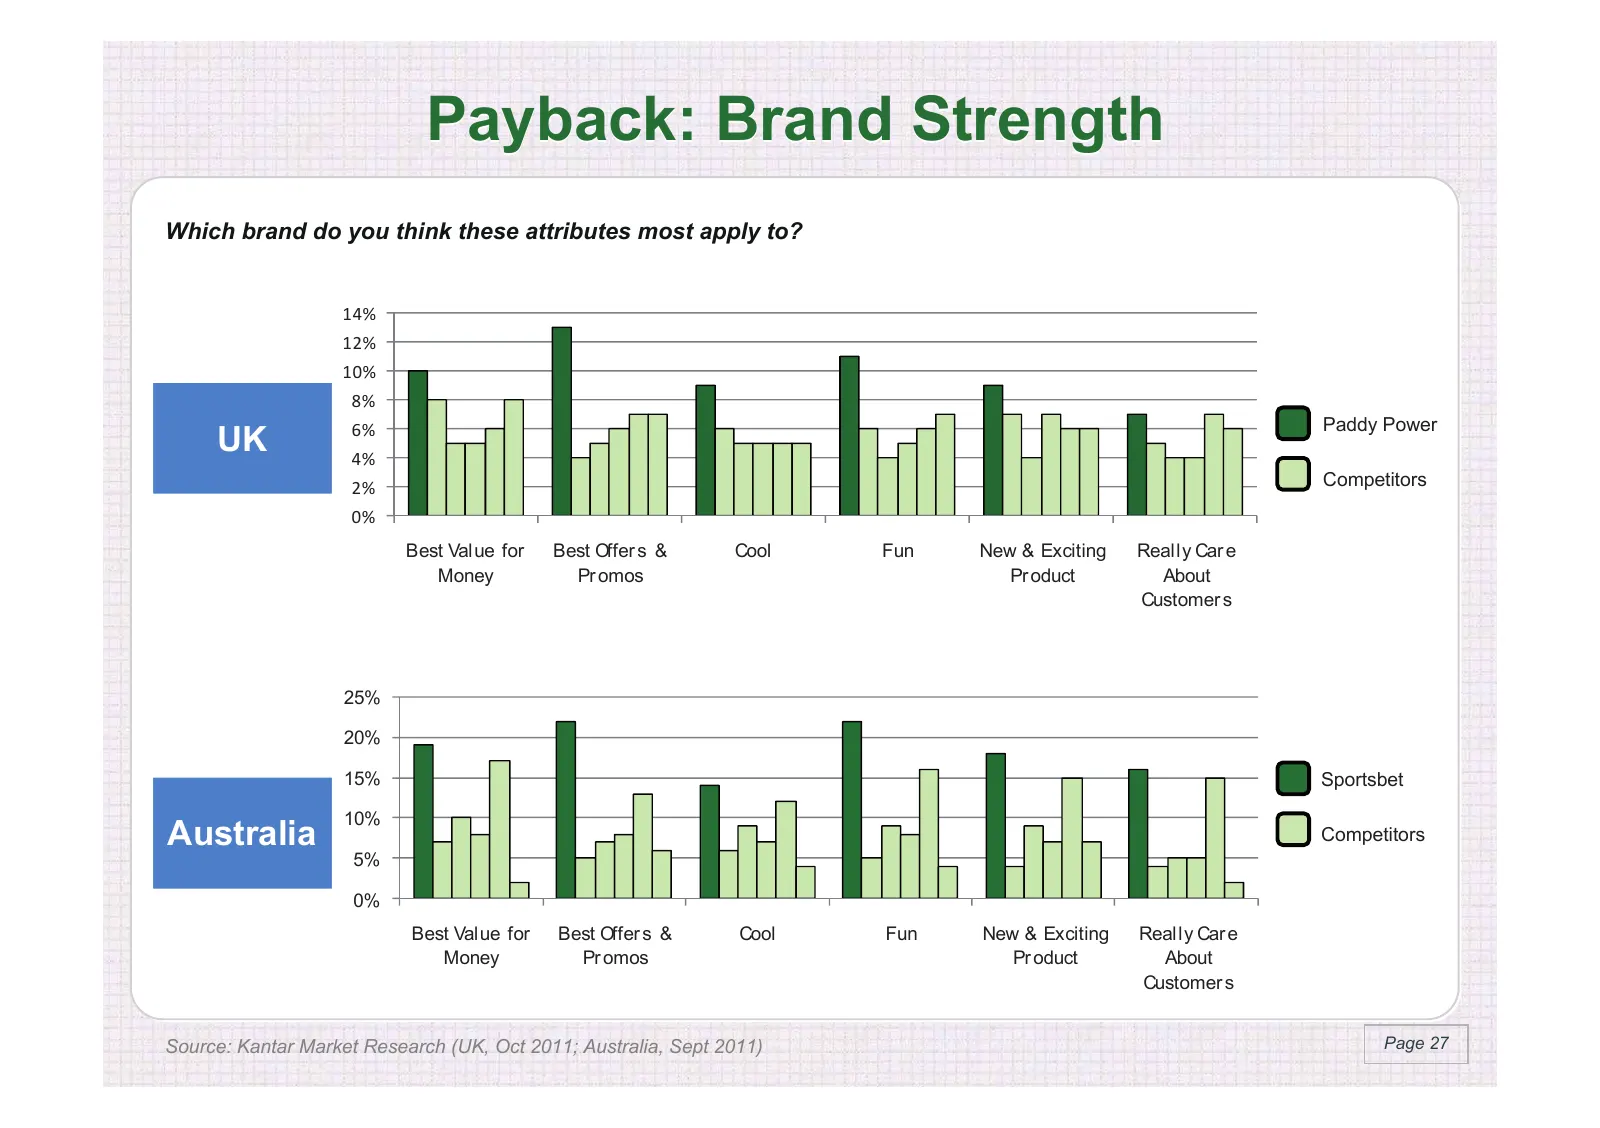
Slide 27: Payback: Brand Strength
Payback: Brand Strength Which brand do you think these attributes most apply to? 14% 12% 10% 8% Paddy Power UK 6% 4% 2% Competitors 0% Best Value for Best Offer s & Cool Fun New & Exciting Really Car e Money Pr omos Pr oduct About Customer s 25% 20% 15% Sportsbet 10% Australia Competitors 5% 0% Best
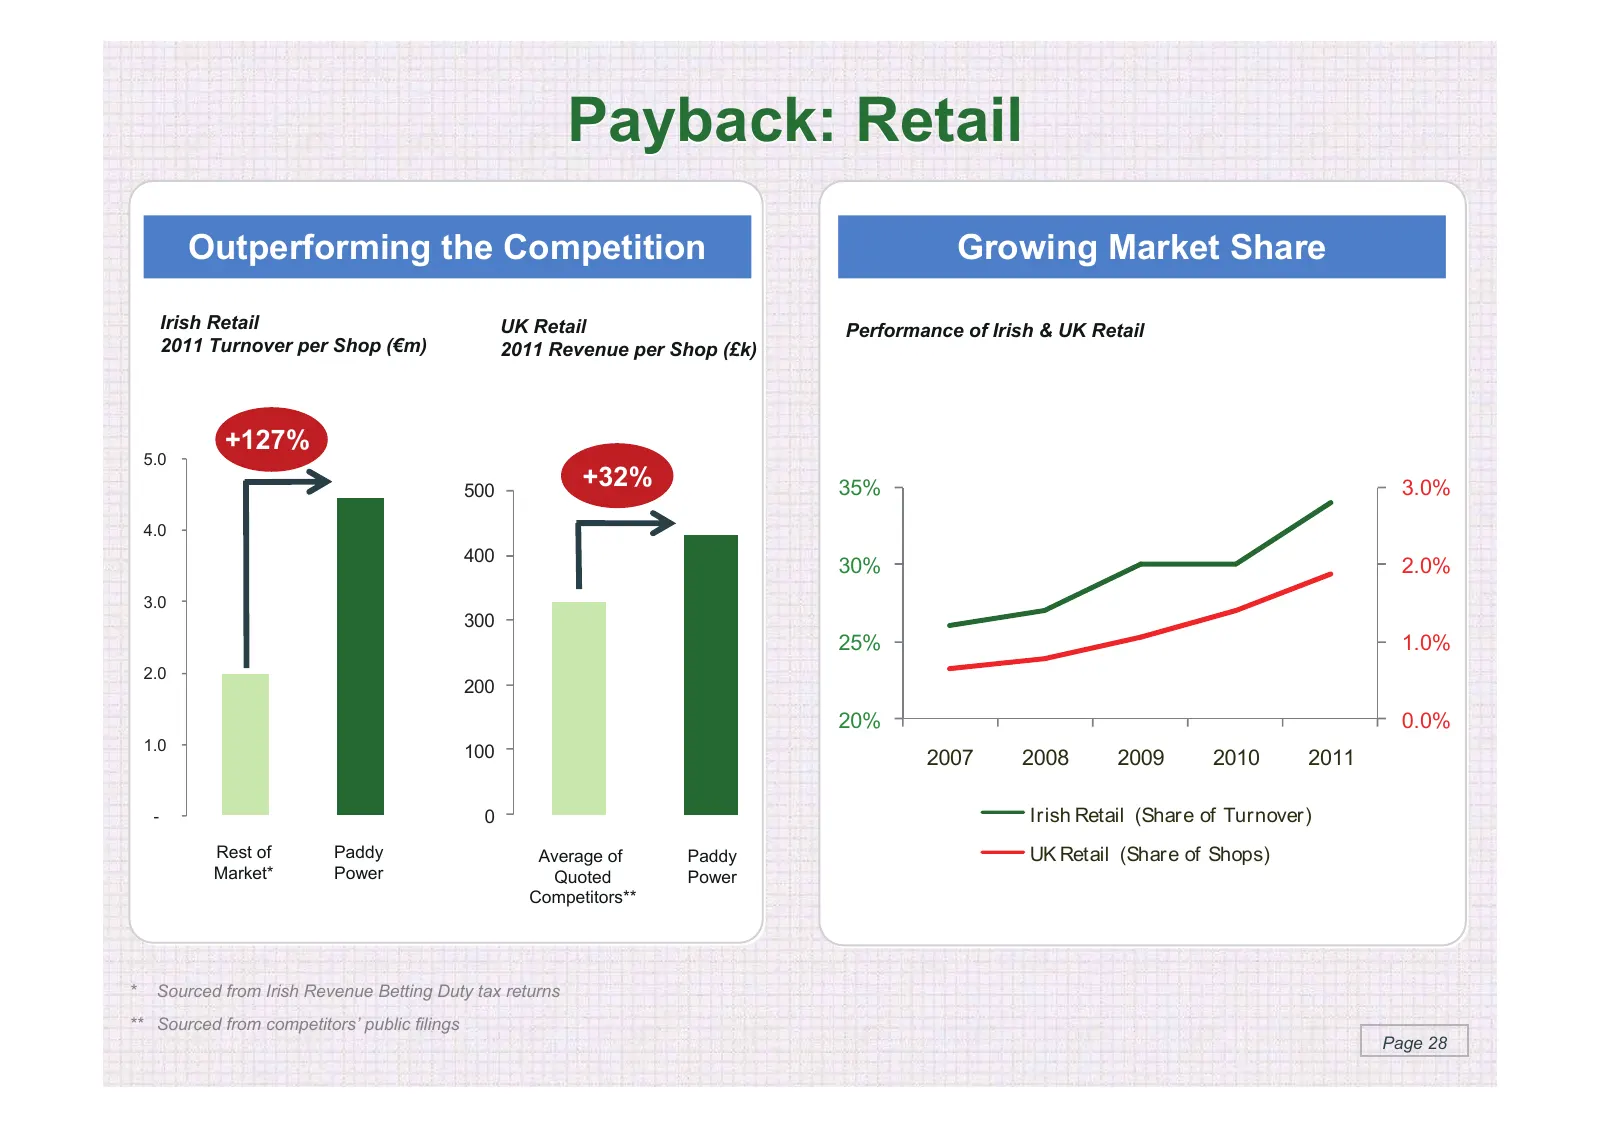
Slide 28: Payback: Retail
Payback: Retail Outperforming the Competition Growing Market Share Irish Retail UK Retail Performance of Irish & UK Retail 2011 Turnover per Shop (€m) 2011 Revenue per Shop (£k) +127% 5.0 500 +32% 35% 3.0% 4.0 400 30% 2.0% 3.0 300 25% 1.0% 2.0 200 20% 0.0% 1.0 100 2007 2008 2009 2010 2011 - 0 Irish
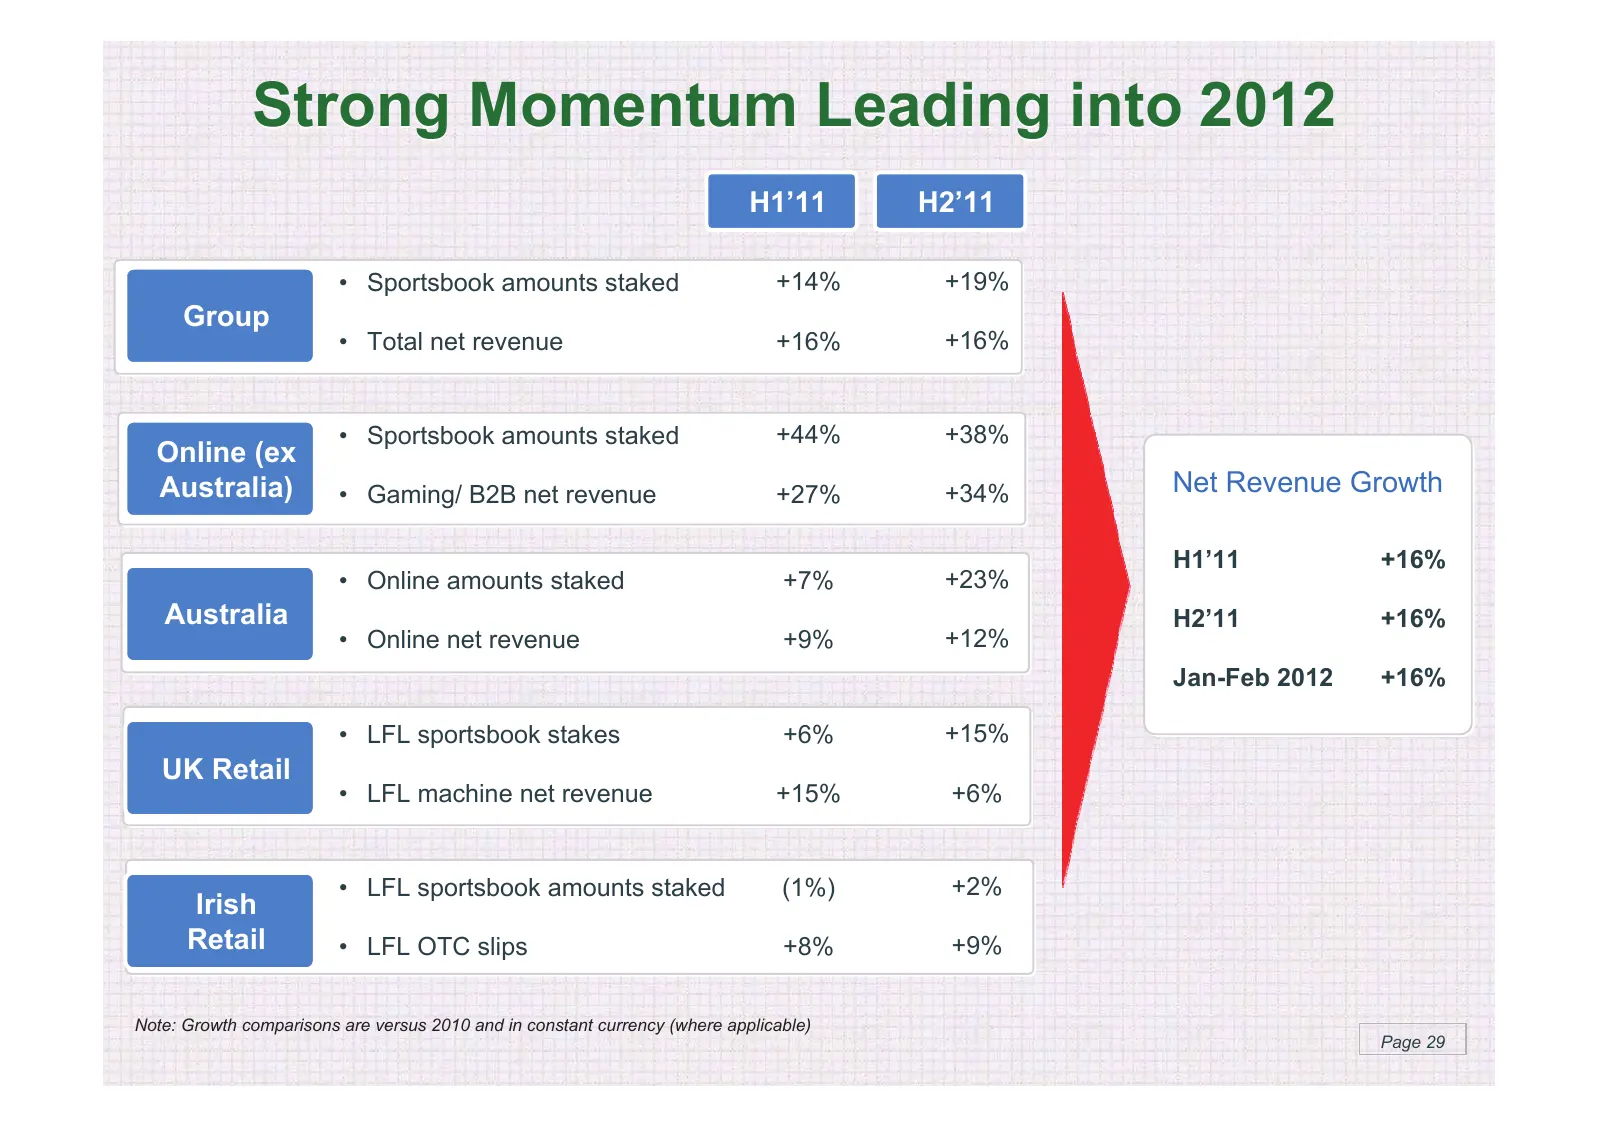
Slide 29: Strong Momentum Leading into 2012
Strong Momentum Leading into 2012 H1’11 H2’11 • Sportsbook amounts staked +14% +19% Group • Total net revenue +16% +16% • Sportsbook amounts staked +44% +38% Online (ex Australia) • Gaming/ B2B net revenue +27% +34% Net Revenue Growth H1’11 +16% • Online amounts staked +7% +23% Australia H2’11 +16%
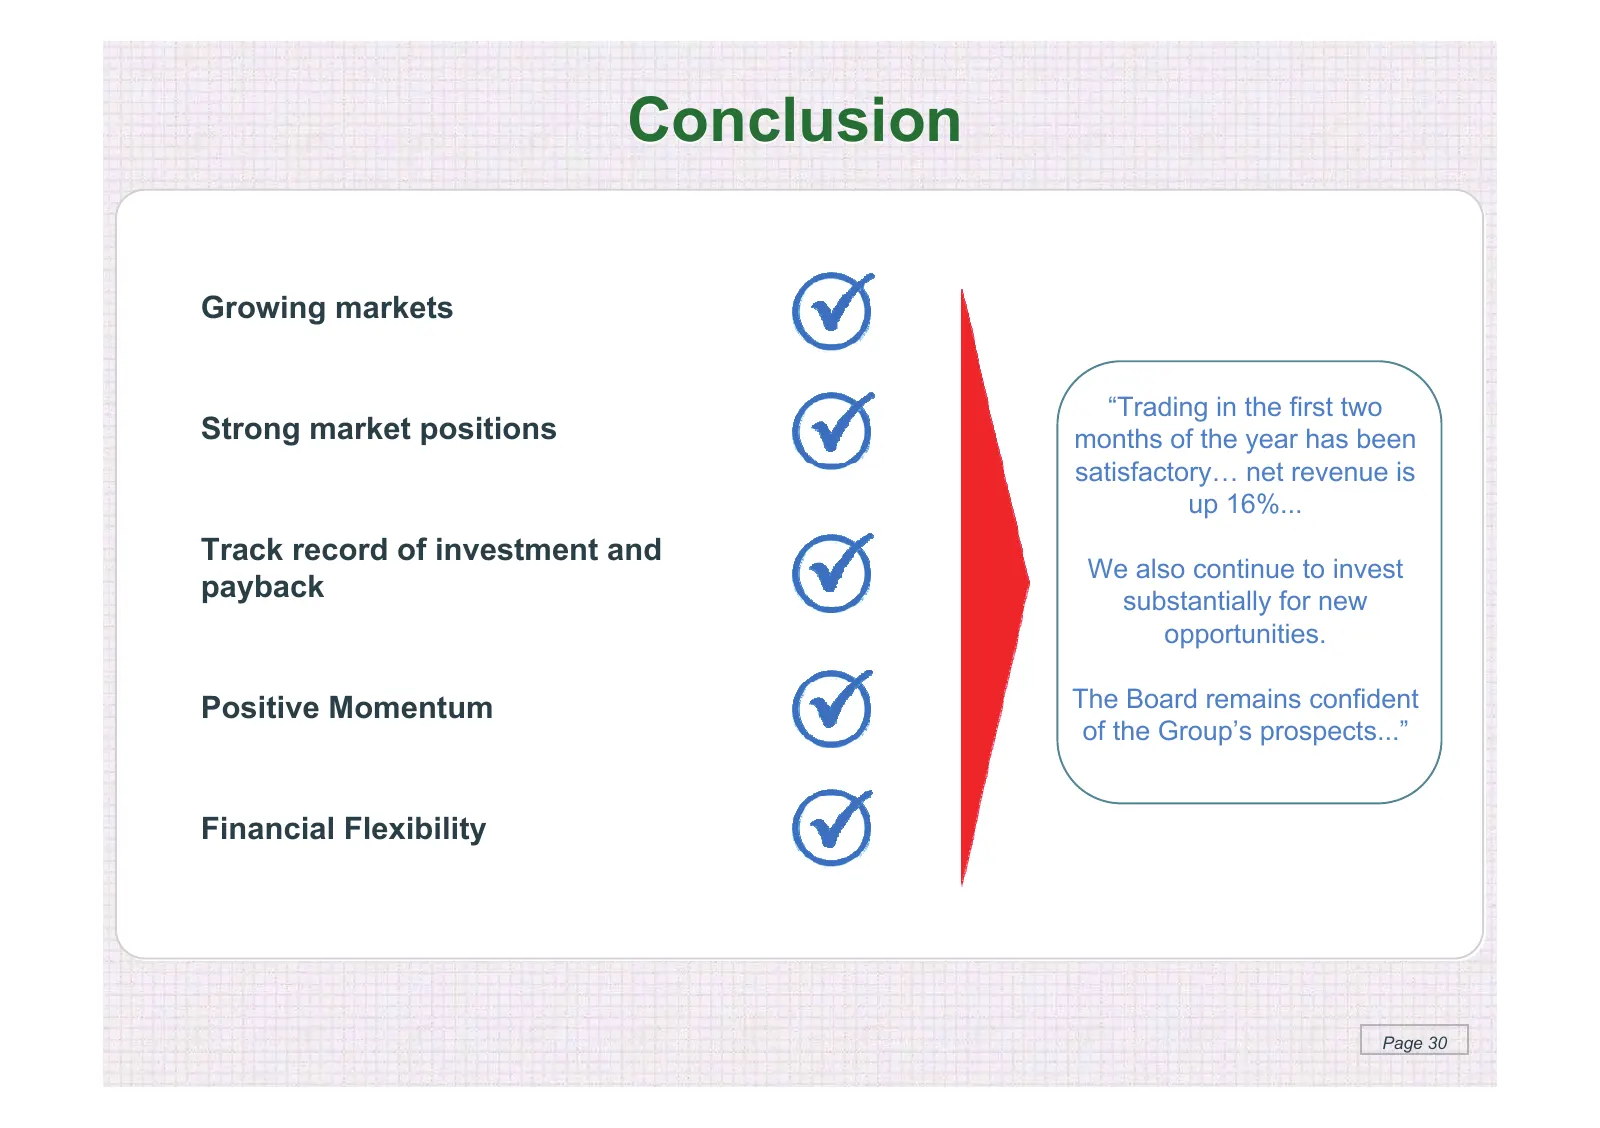
Slide 30: Conclusion
Conclusion Growing markets “Trading in the first two Strong market positions months of the year has been satisfactory… net revenue is up 16%... Track record of investment and We also continue to invest payback substantially for new opportunities. Positive Momentum The Board remains confident of the
Source: Internet Archive copy of flutter.com
More decks from Flutter Entertainment plc
 Q3 2026 Earnings Presentation15 slides · Nov 4, 2026
 Q2 2026 Earnings Presentation14 slides · Aug 5, 2026
 Investor Day (September 2024)152 slides · Sep 25, 2024
 Q2 2024 Earnings Presentation20 slides · Aug 13, 2024
 Q1 2024 Earnings Presentation20 slides · May 14, 2024
 FY2023 Earnings Presentation36 slides · Mar 26, 2024