United Financial Bancorp — Rockville Financial — Investor Presentation (April 2012)
37 slides from United Financial Bancorp's investor presentation, Apr 3, 2012
Slide 1: Analyst Presentation April 3, 2012
Transition • Values • Success Transition • Values • Success NASDAQ Global Select Market RCKB Analyst Presentation April 3, 2012
Slide 2: Forward-looking statements
2 This significant to identify looking of disclosures HIFS, historical this HARL, Presentation Presentation. statement. forward-looking risks of oraand current forward-looking andTHRD. Factors contains We uncertainties. facts. do statements The that not Words forward-looking undertake data could nat
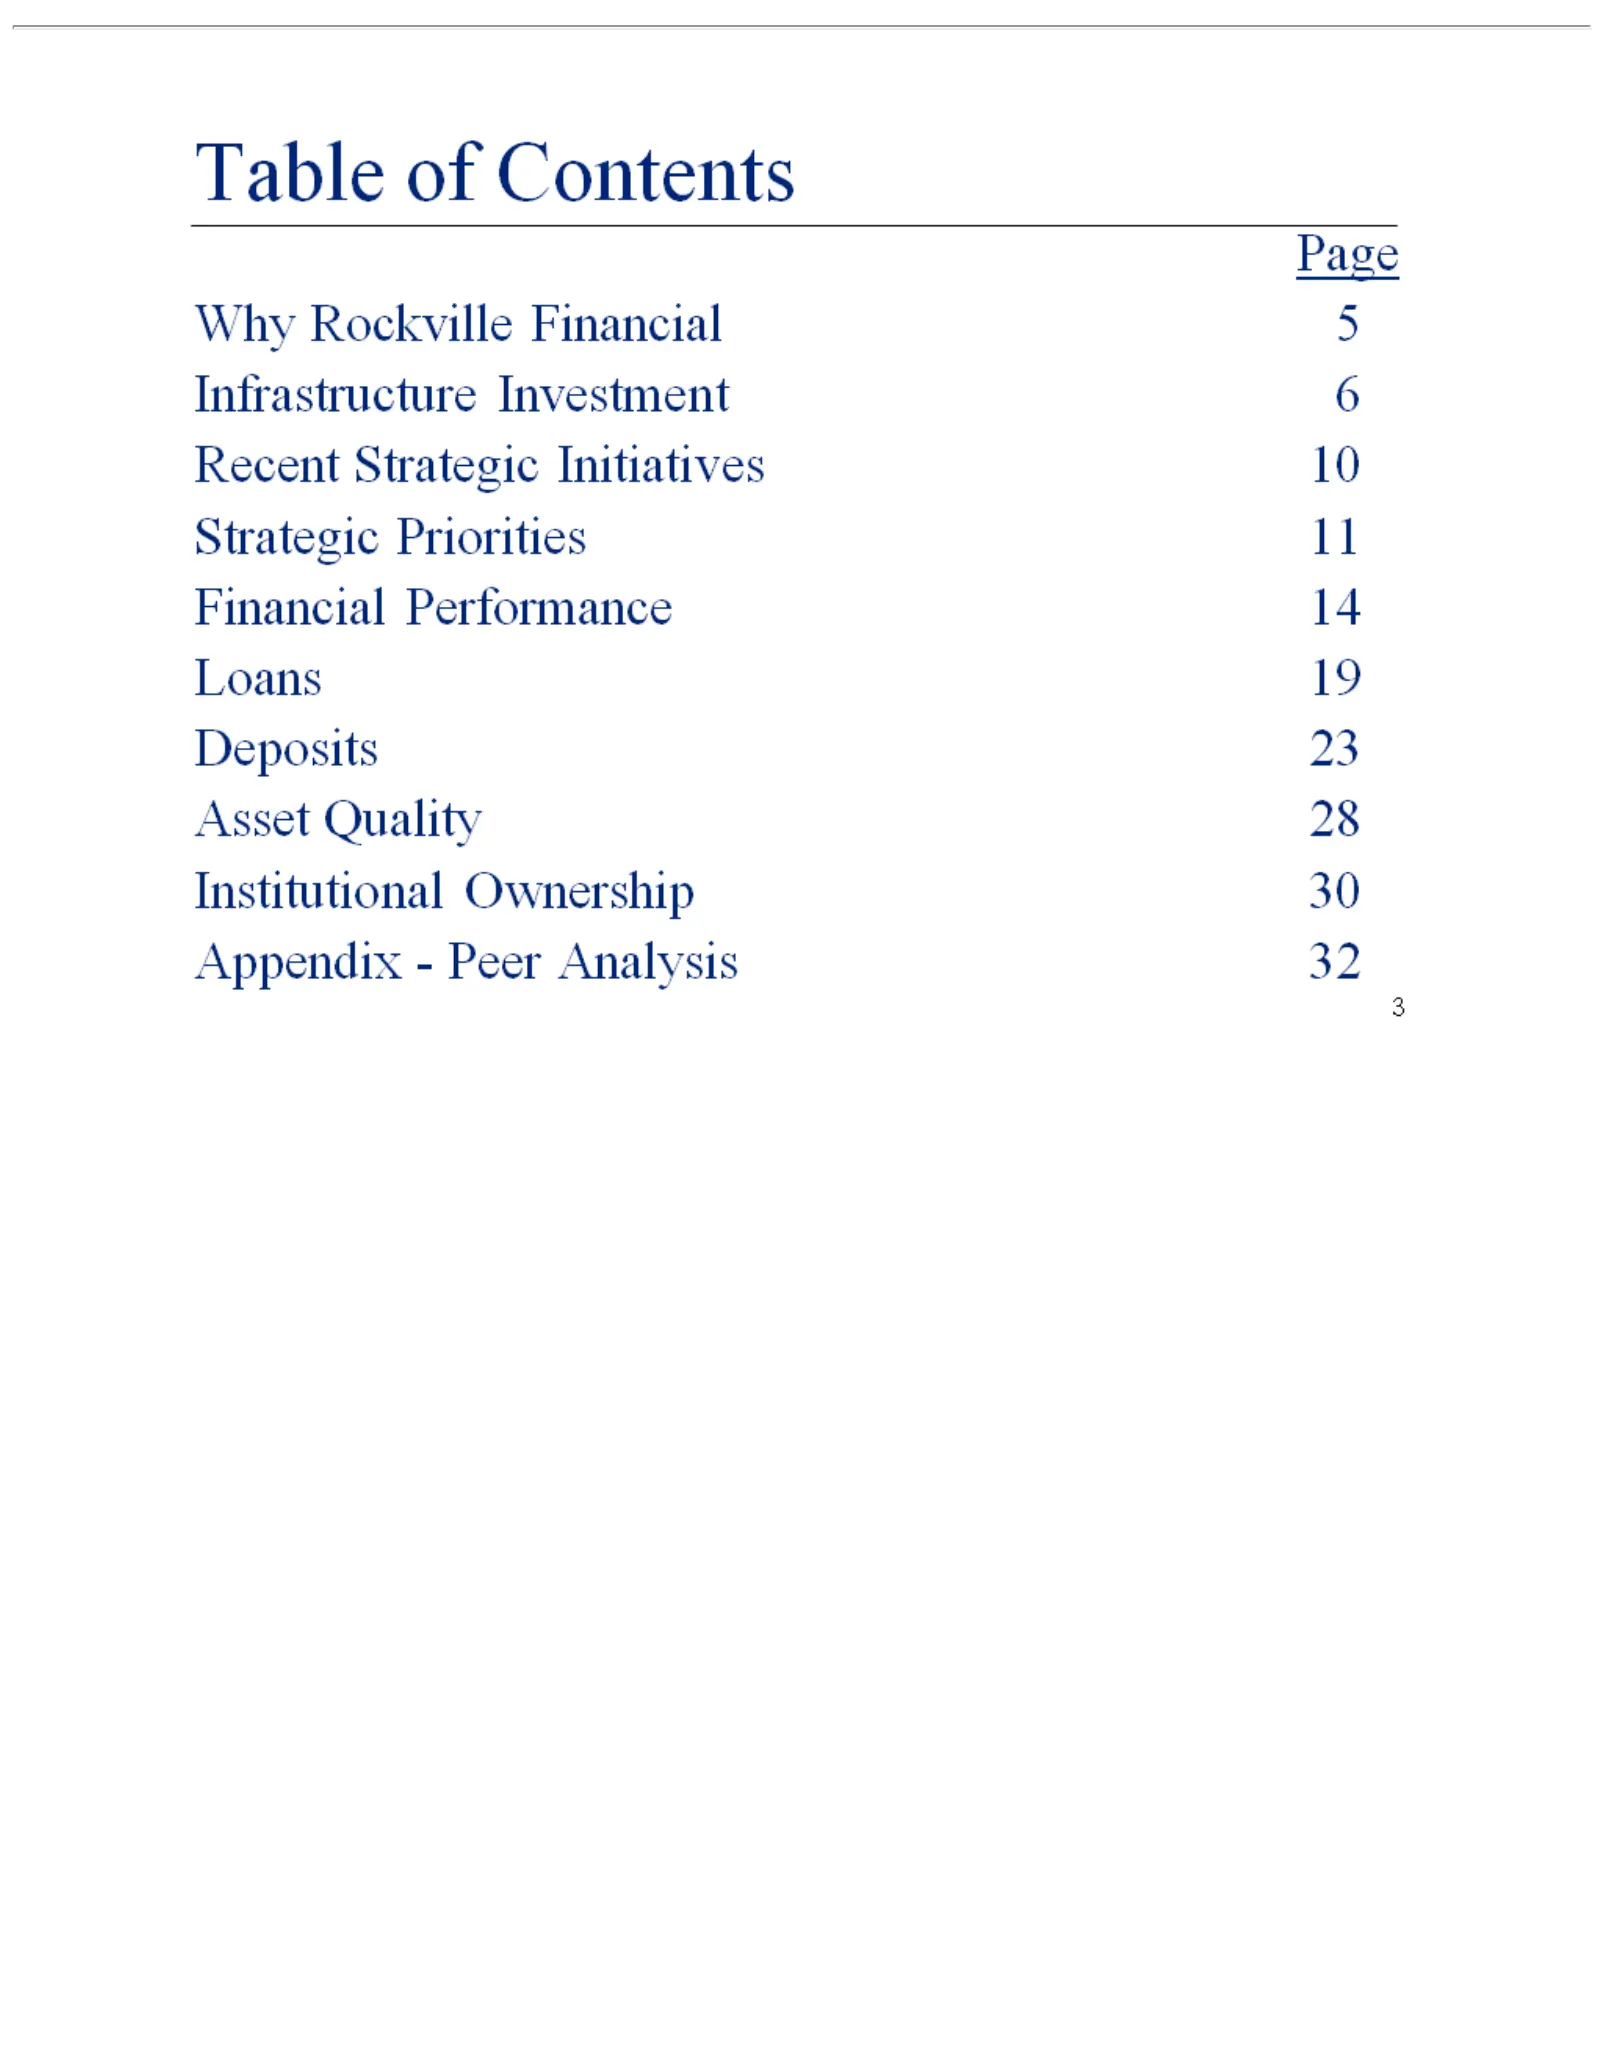
Slide 3: Table of Contents
3 Table of32Contents Page Why Rockville Financial 5 Infrastructure Investment 6 Recent Strategic Initiatives 10 Strategic Priorities 11 Financial Performance 14 Loans 19 Deposits 23 Asset Quality 28 Institutional Ownership 30 Appendix—Peer Analysis
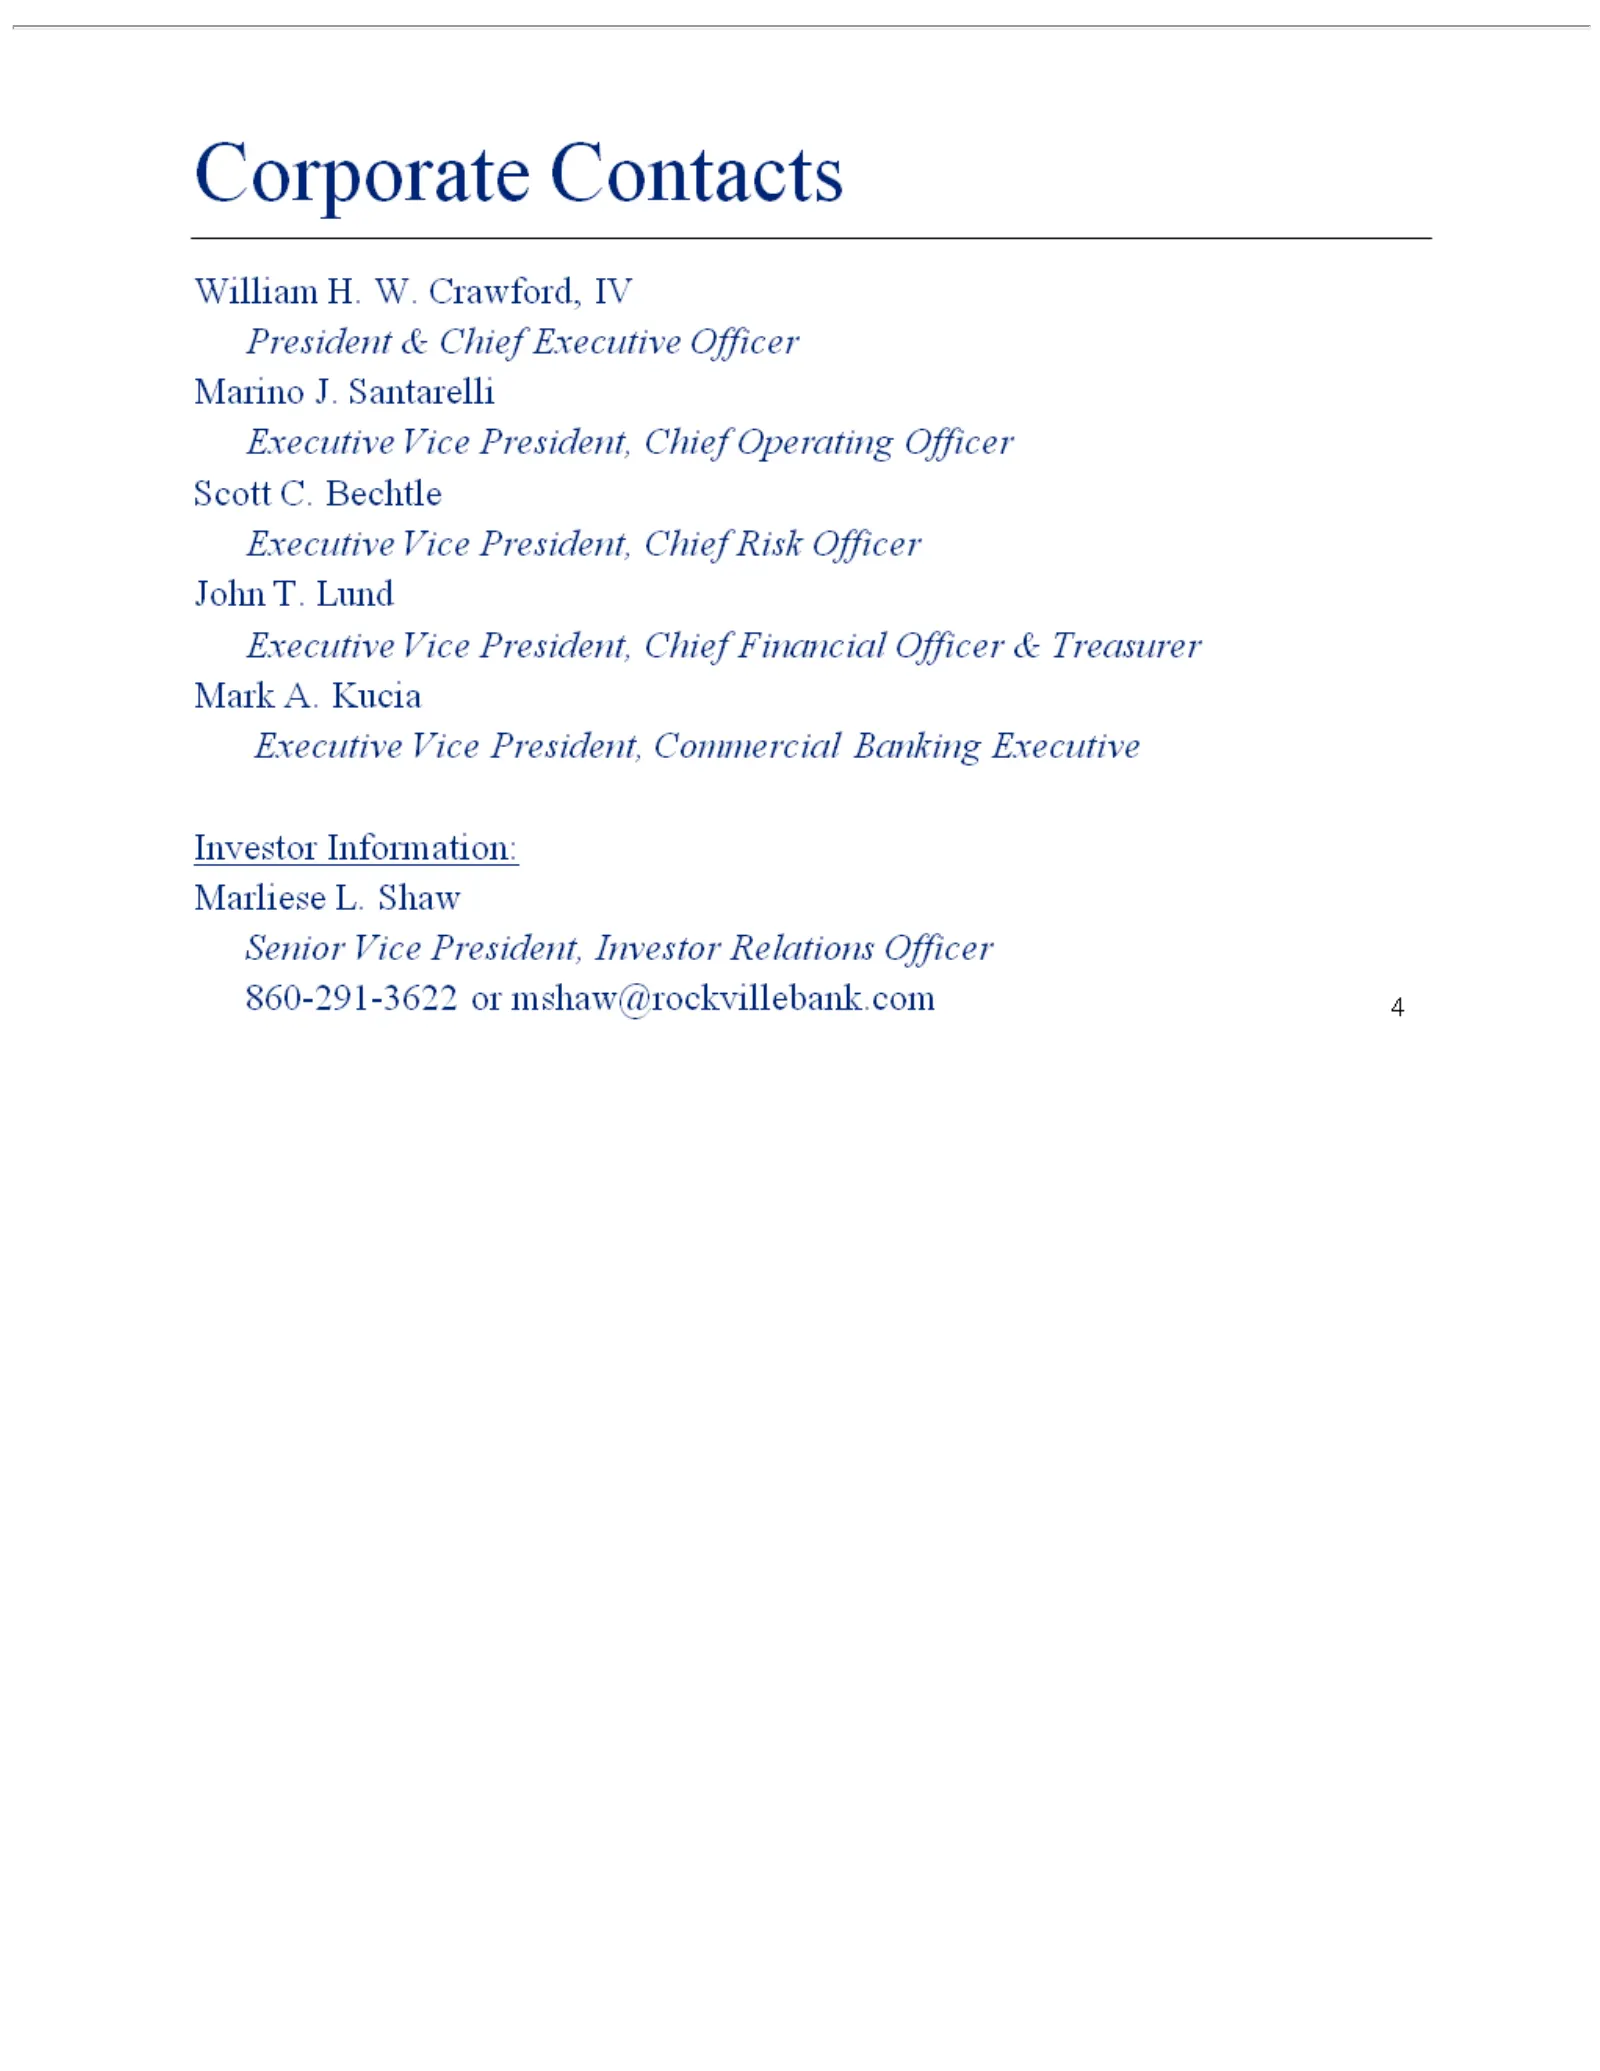
Slide 4: Corporate Contacts
4 Corporate President, mshaw@rockvillebank.com Chief Contacts Financial William Officer H. W. & Crawford, Treasurer Mark IV President A. Kucia&Executive Chief Executive Vice President, Officer Marino Commercial J. Santarelli Banking Executive Executive Vice Investor President, Information: Chief Ope
Slide 5: Why Rockville Financial
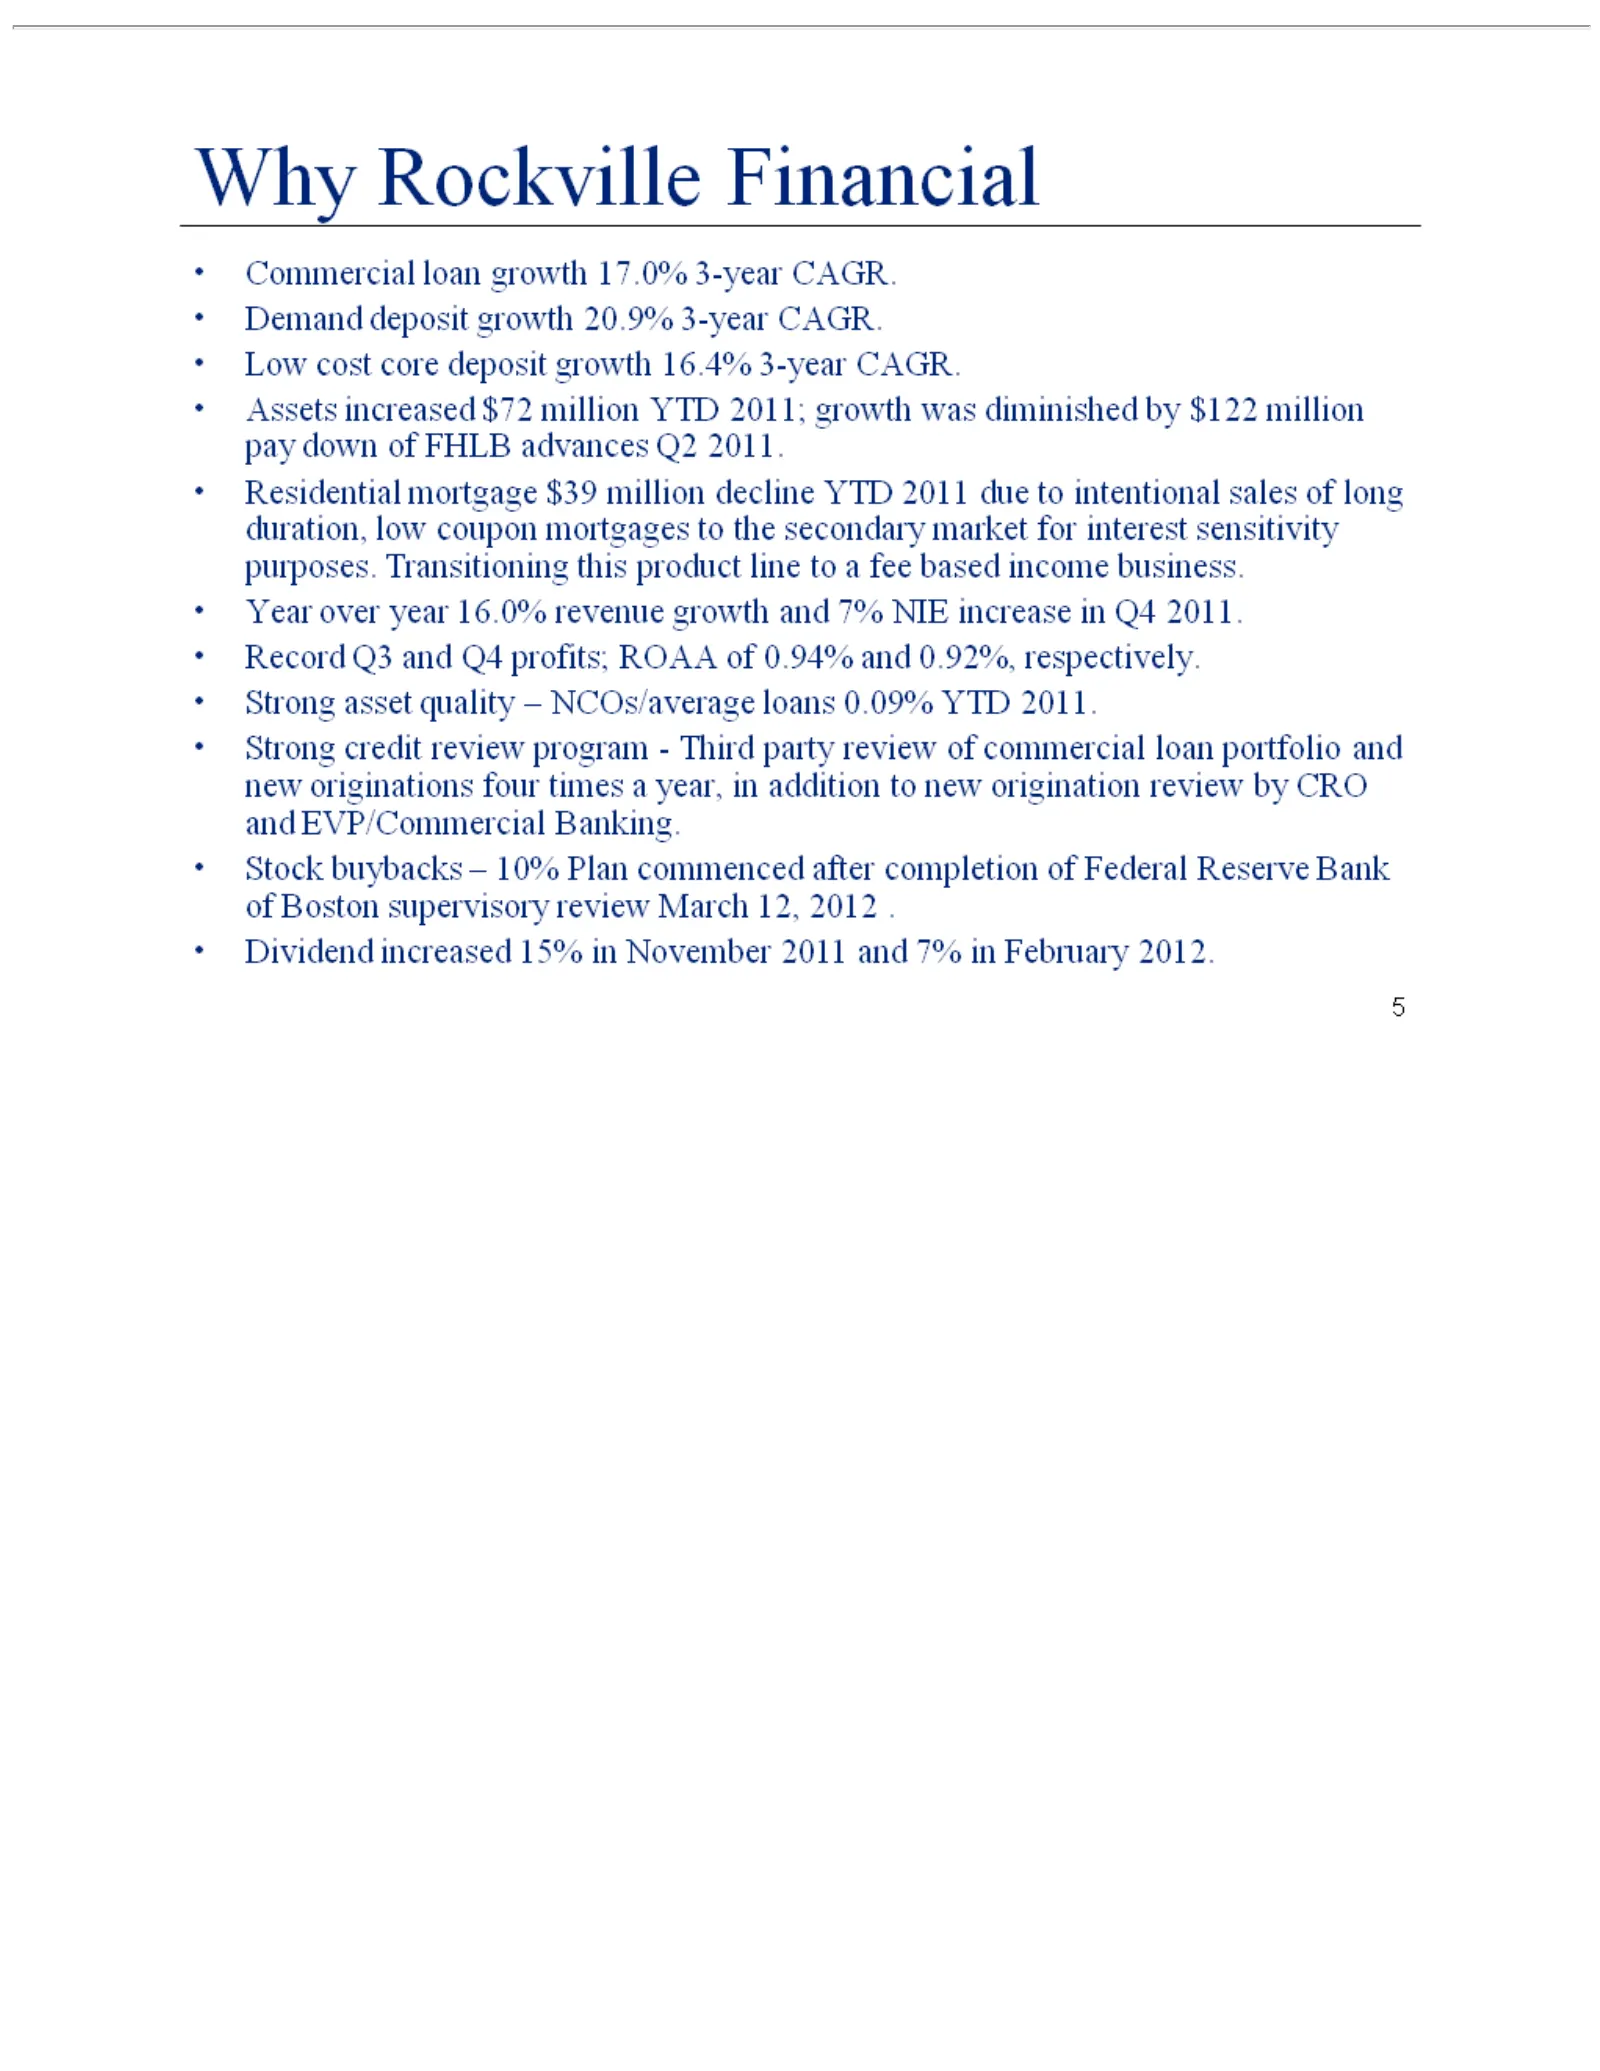
5 Why million line credit of Federal toreview aRockville pay feeReserve down based program—Third Financial of income Bank FHLB ofbusiness. Commercial advances Boston partysupervisory Year review Q2loan 2011. over ofgrowth year commercial Residential review 16.0% 17.0% March revenue loan mortgage 3-y
Slide 6: Infrastructure Investment
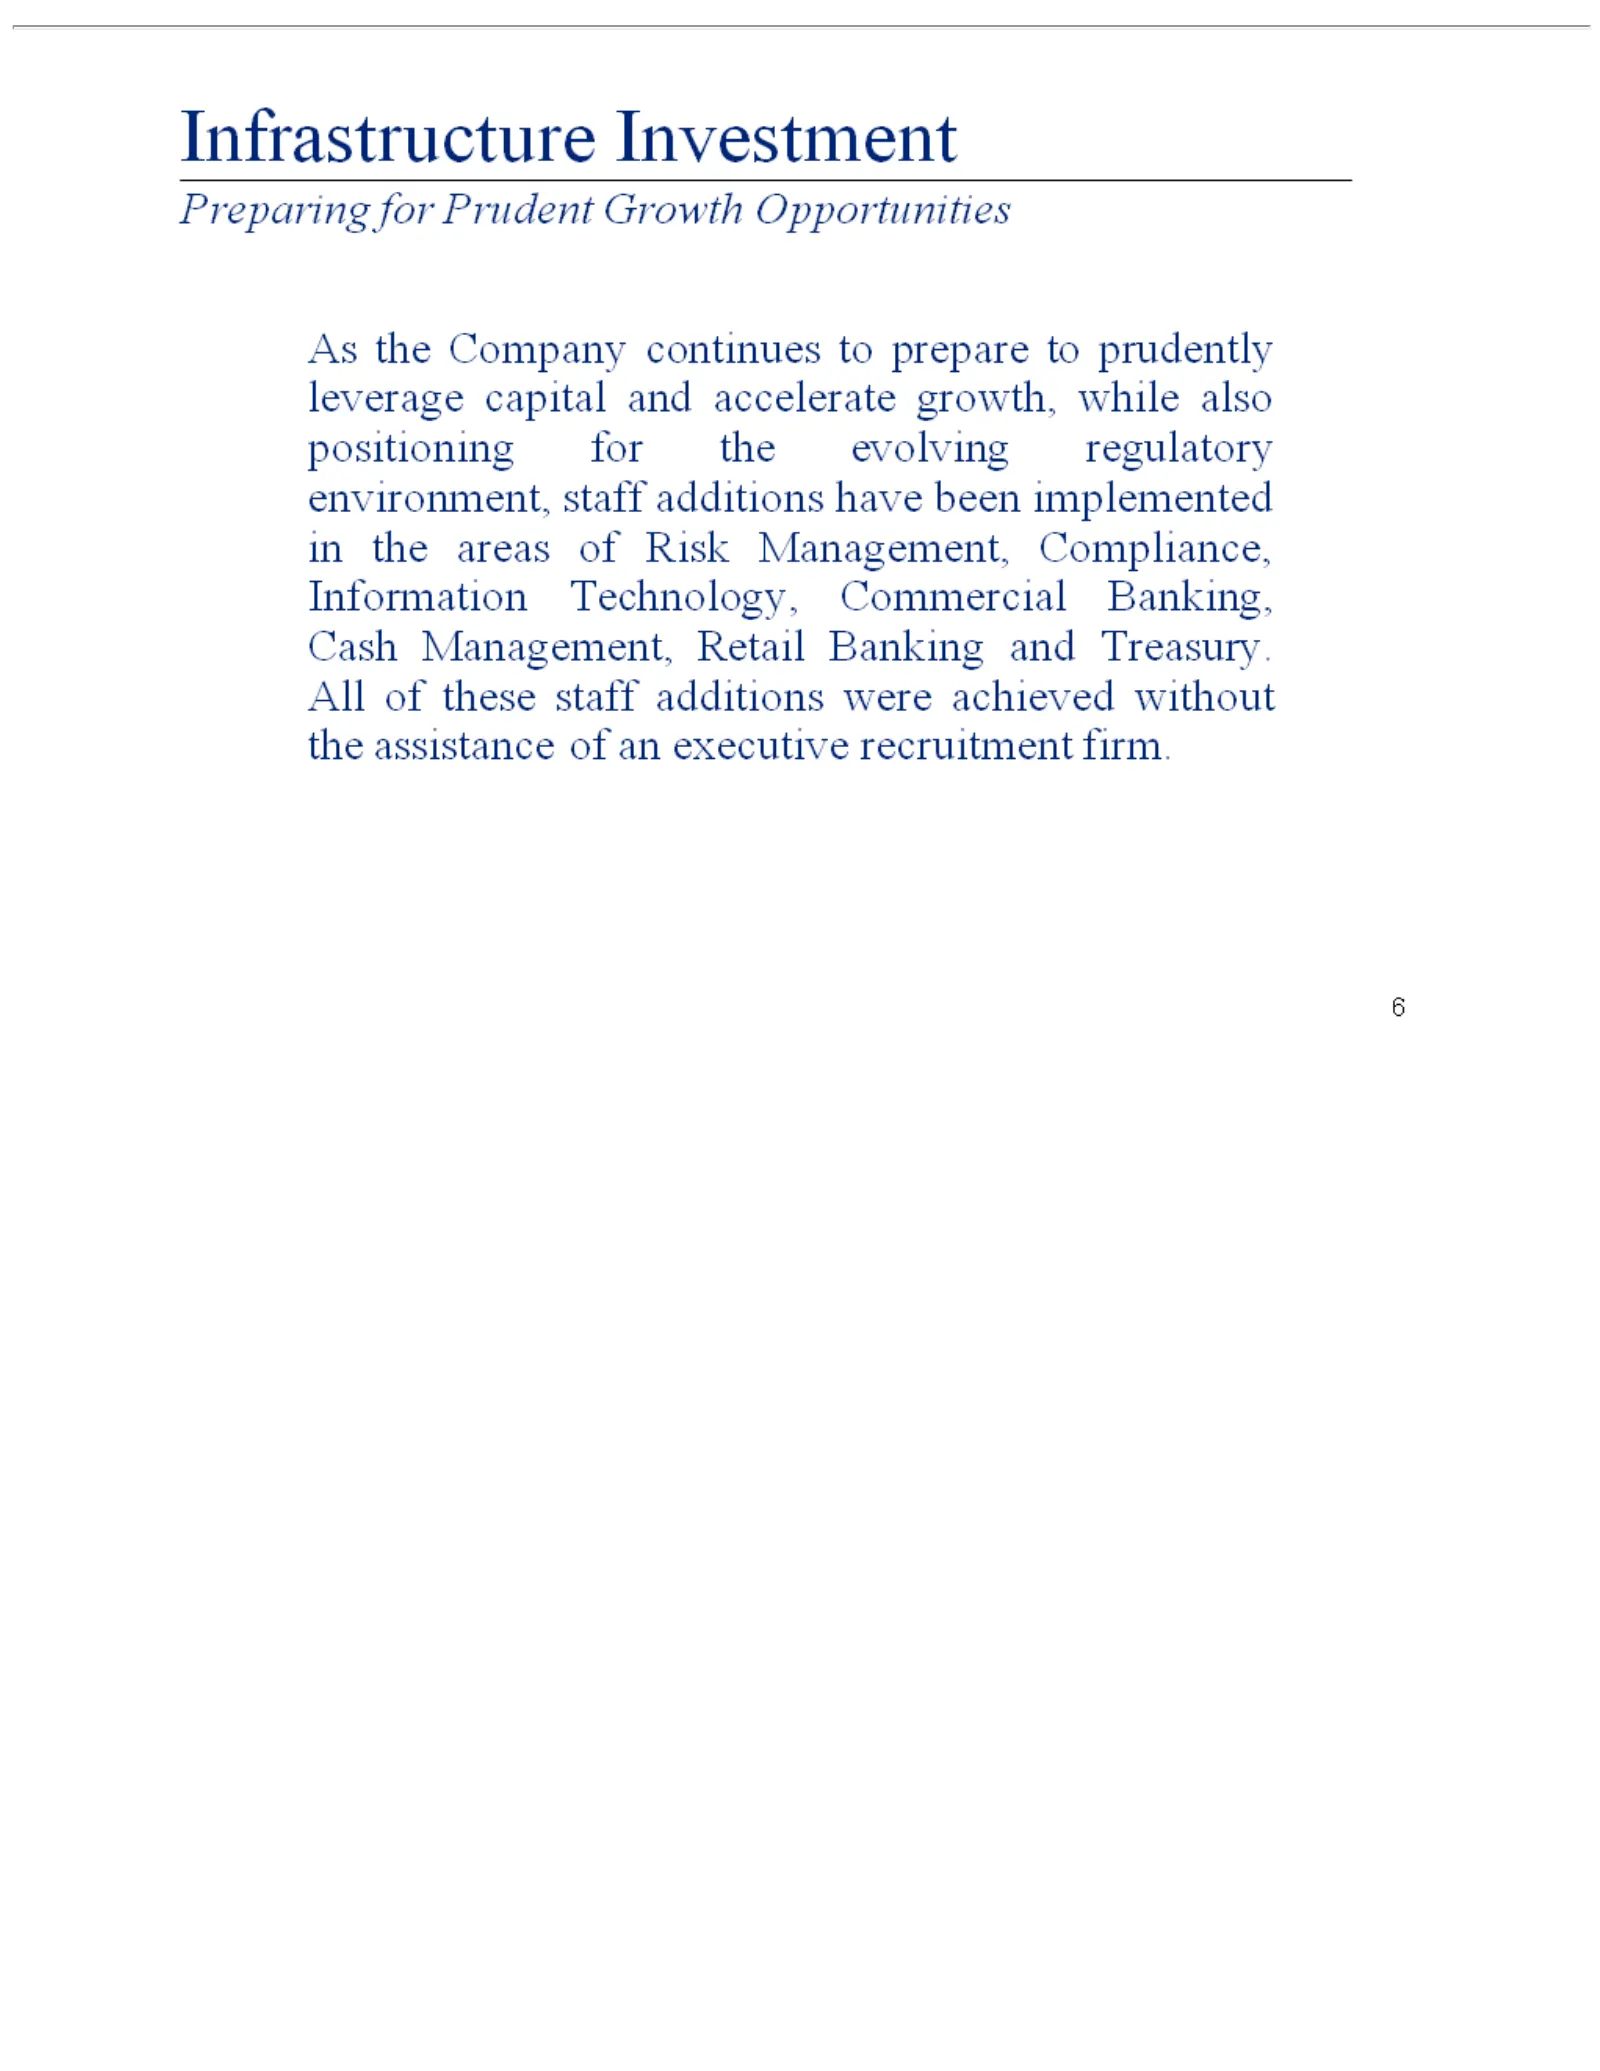
6 Infrastructure been recruitment implemented firm.Investment in the areas Preparing of Riskfor Management, Prudent Growth Compliance, Opportunities Information As theTechnology, Company continues Commercial to prepare Banking, to prudently Cash Management, leverage capital Retailand Banking acceler
Slide 7: Infrastructure Investment
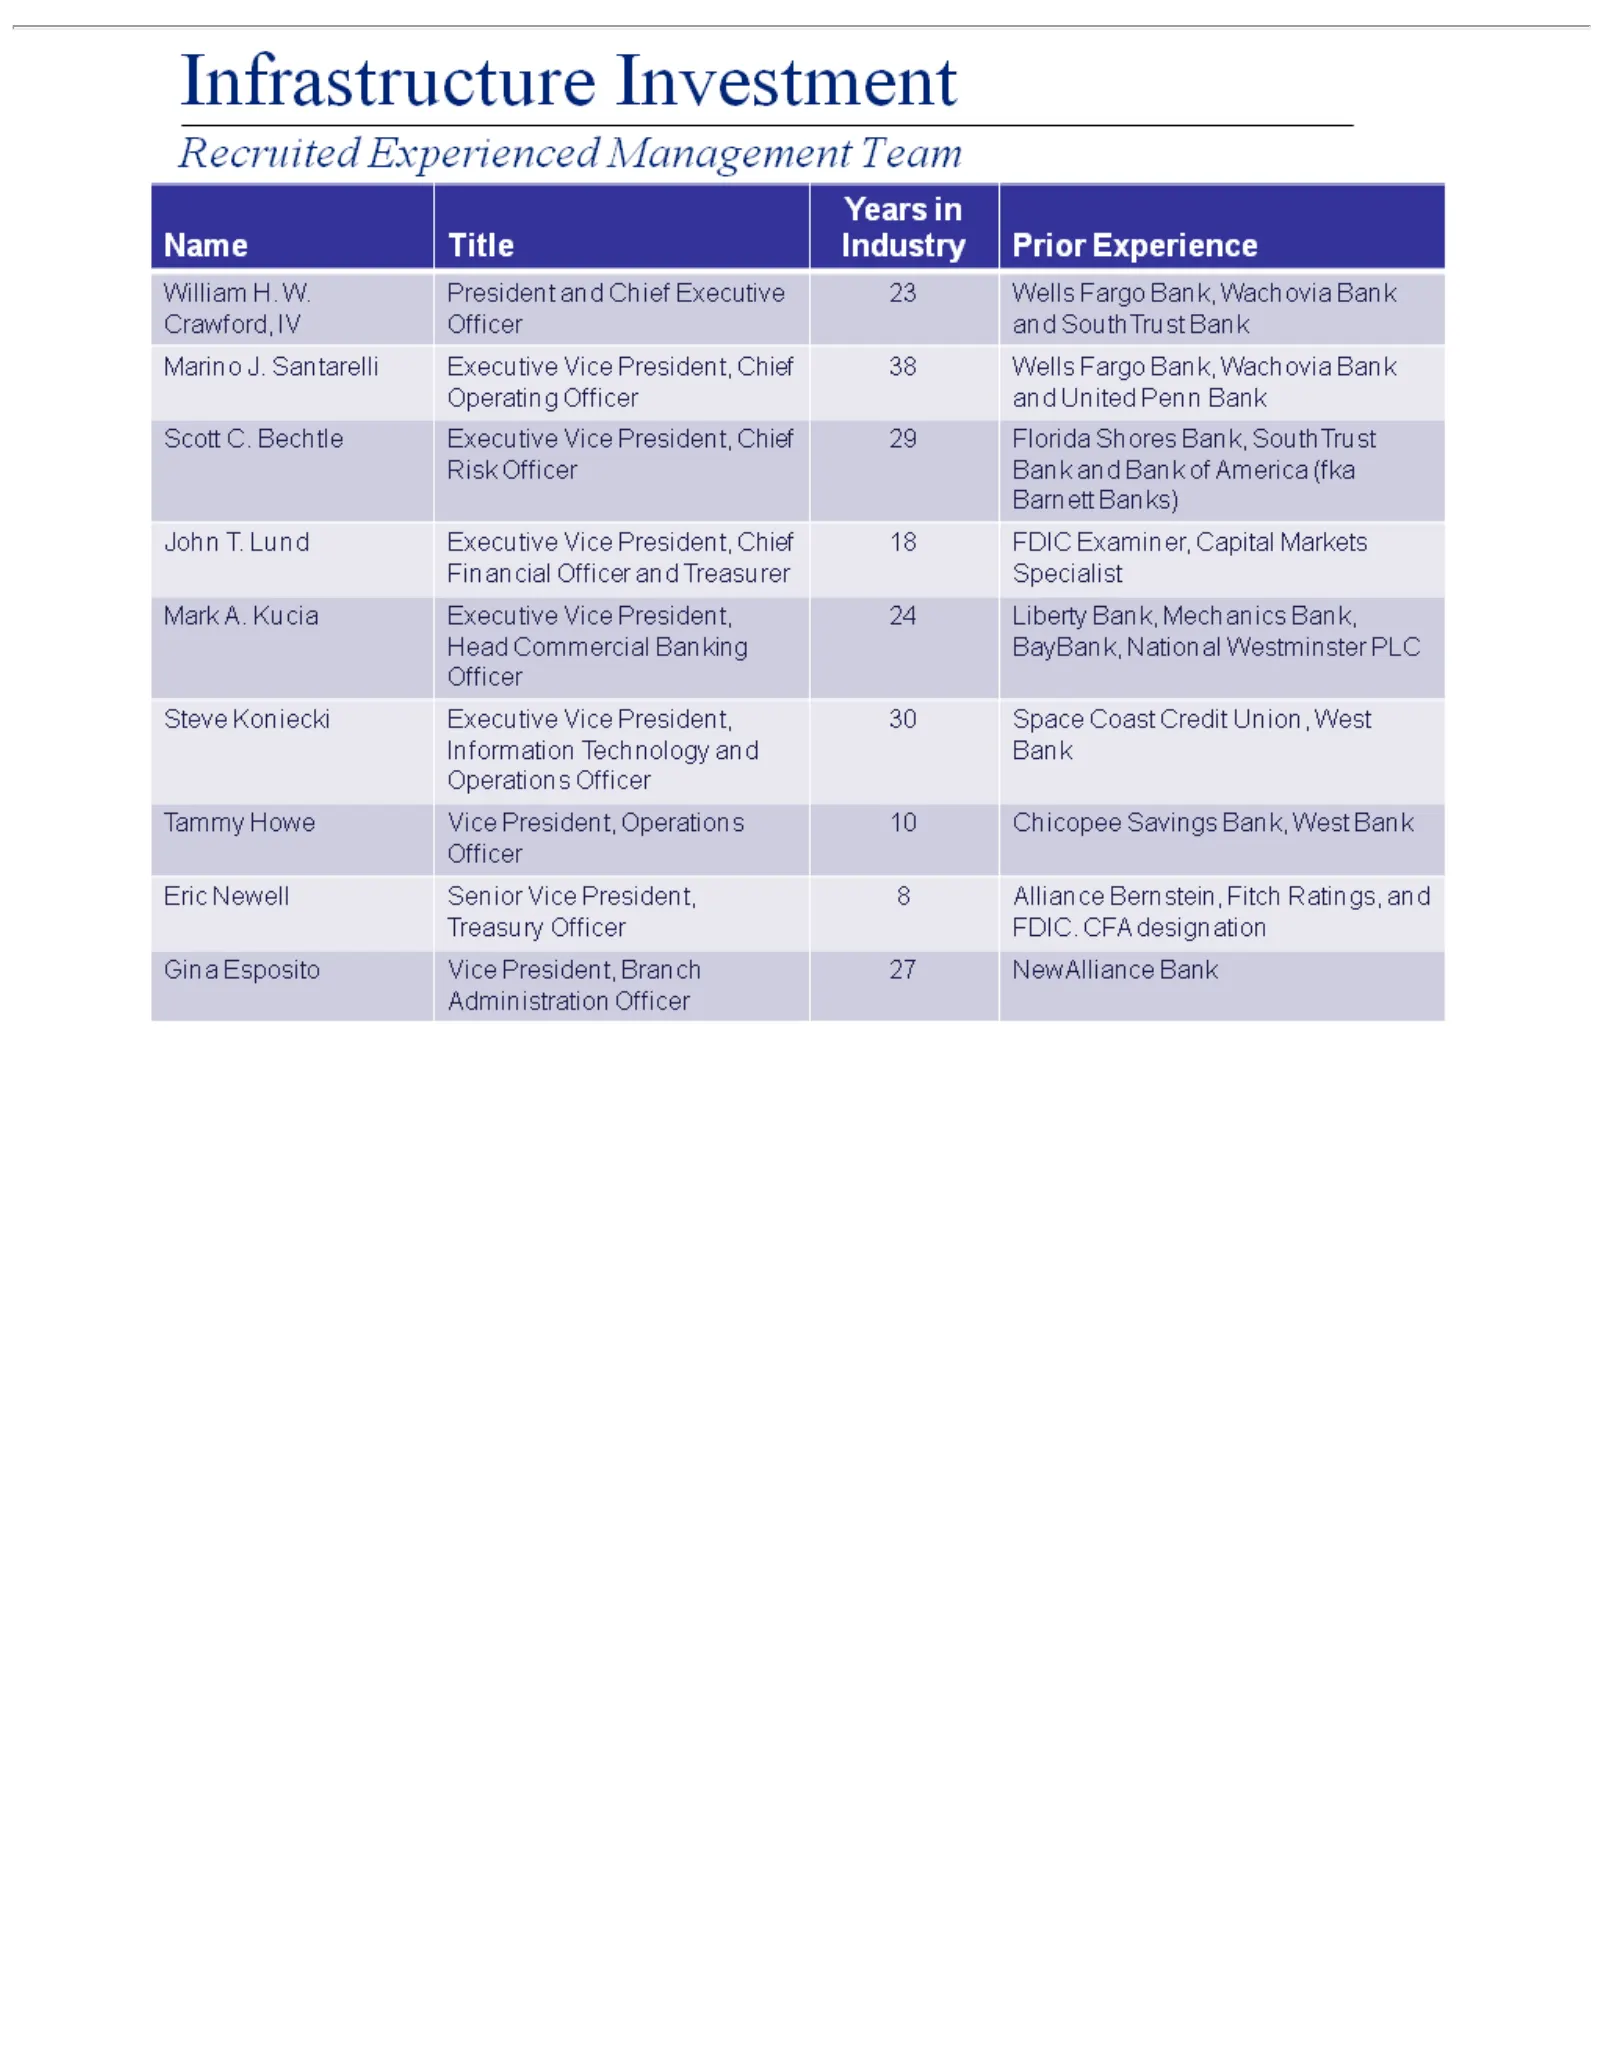
7 Infrastructure Marino America Mechanics Savings J.Bank, (fka Santarelli Bank, Barnett West Investment BayBank, Executive Bank Banks) Eric Recruited National John Vice Newell T.President, Lund Westminster Experienced Senior Executive Vice Chief PLC Management President, Operating Vice Steve Preside
Slide 8: Infrastructure Investment
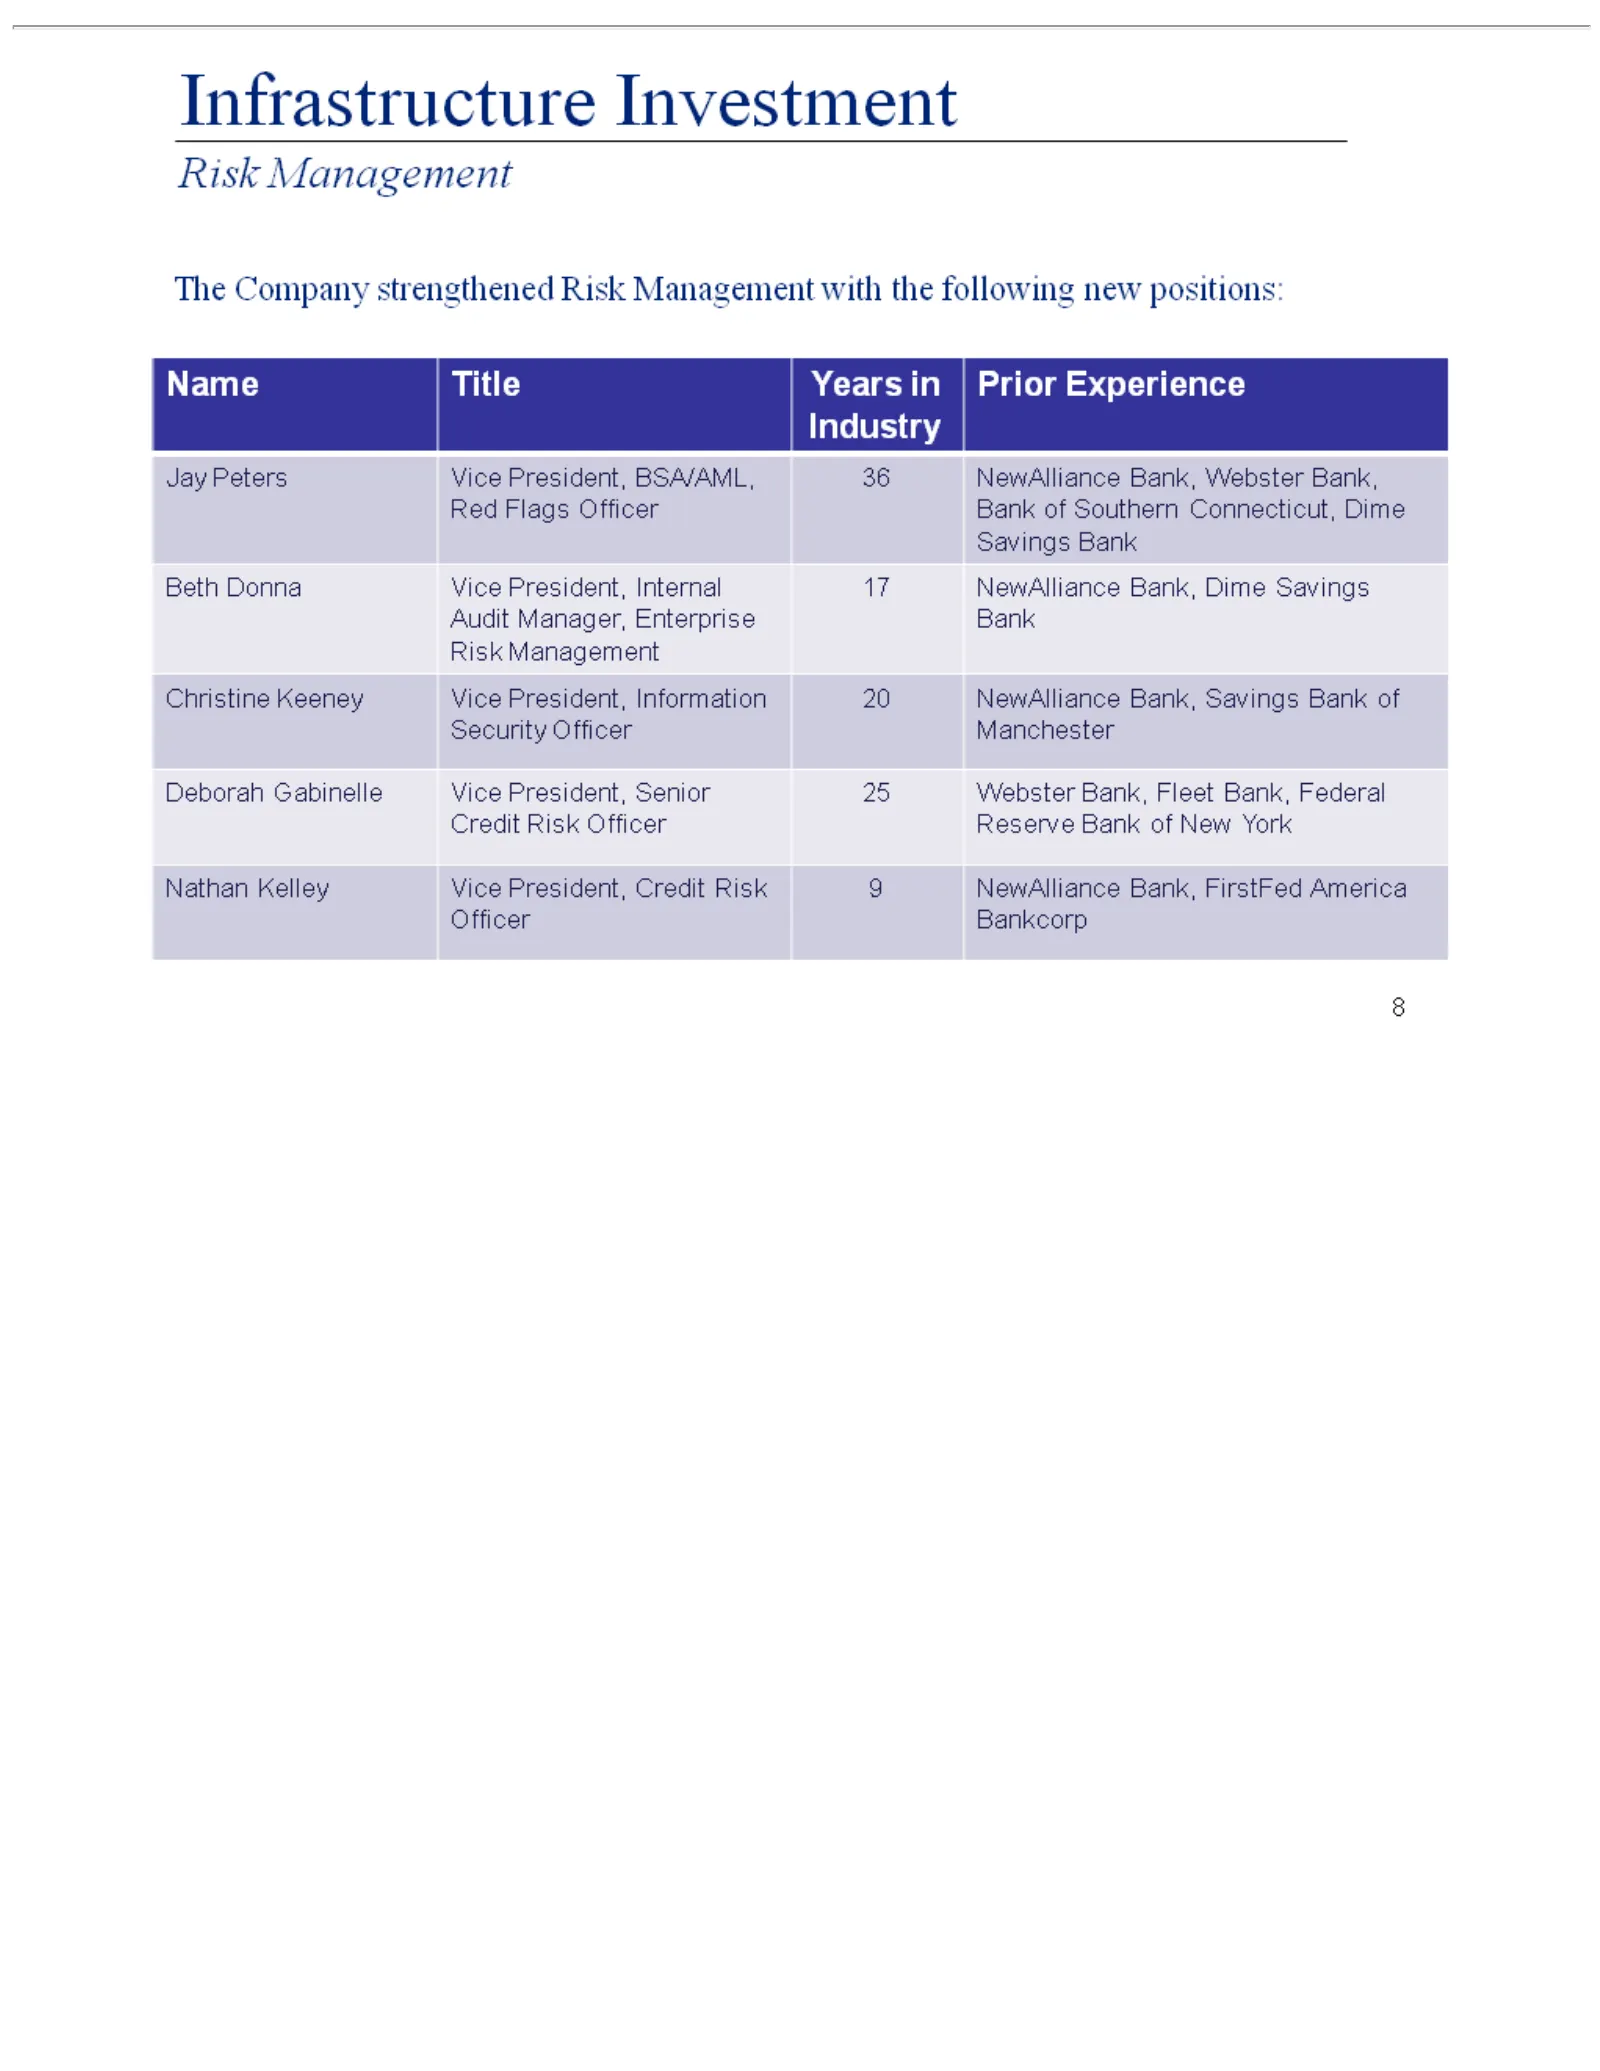
8 Infrastructure Donna Gabinelle Risk Management Vice Vice President, President, Investment withInternal theSenior following RiskAudit Management Credit Manager, newRisk positions: Officer Name Enterprise 25 Title Webster Years Risk Management in Bank, Industry FleetPrior Bank, 17 NewAlliance Experi
Slide 9: Infrastructure Investment
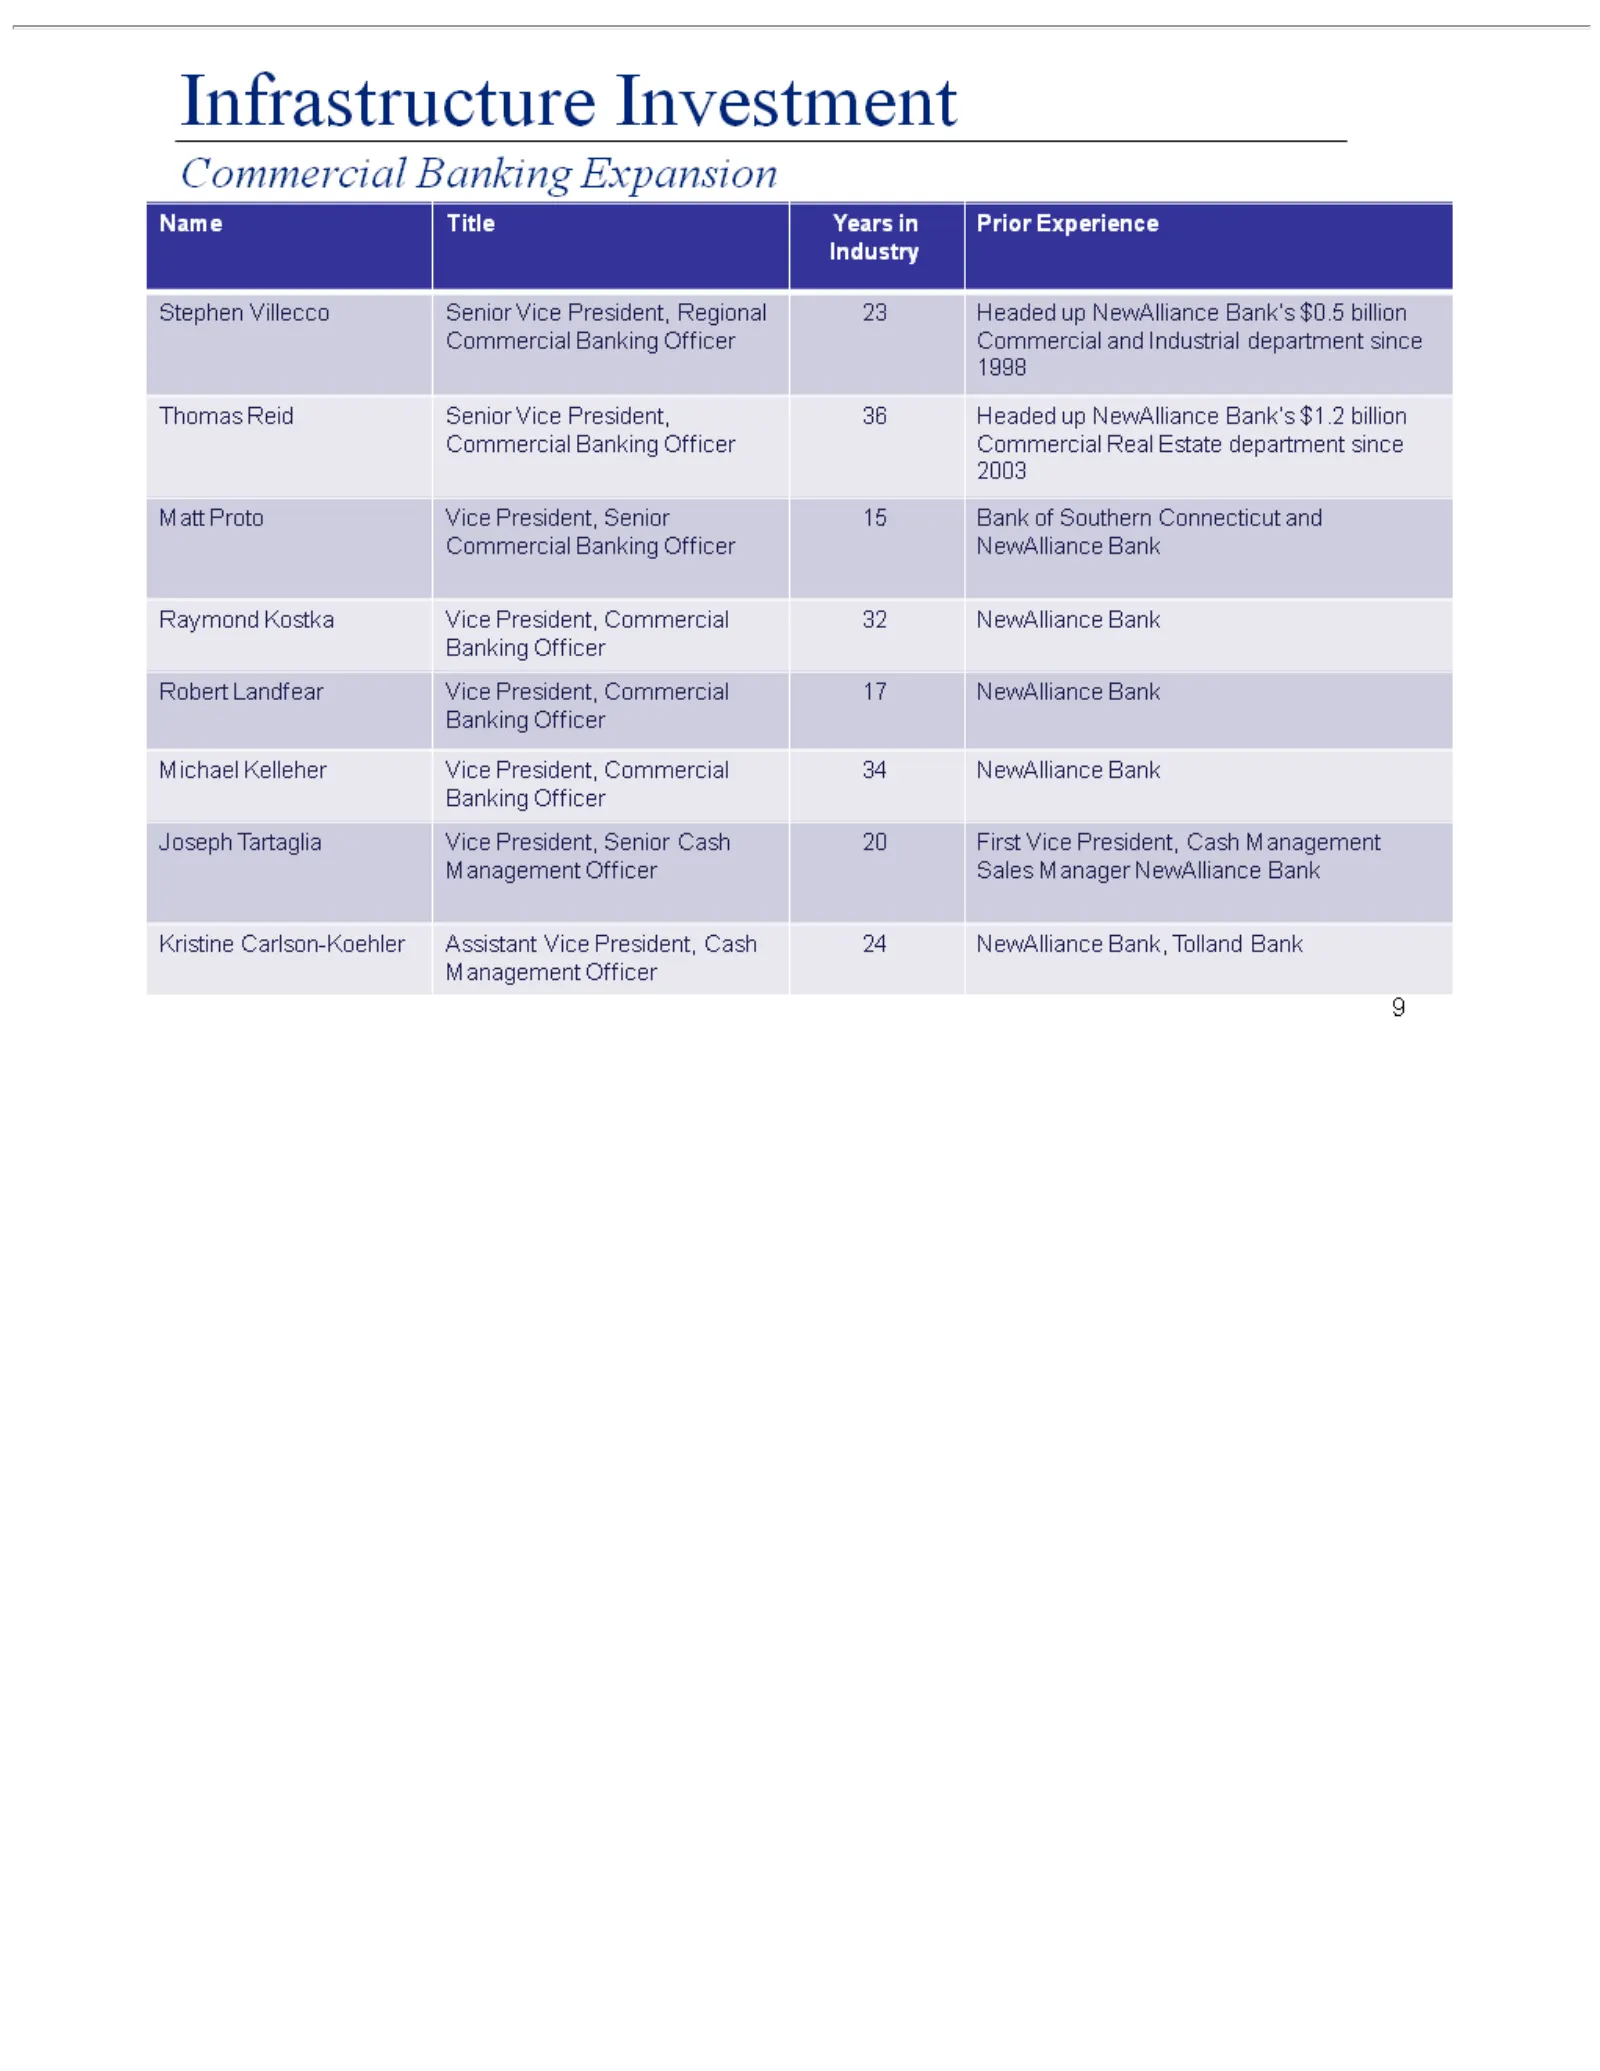
9 Infrastructure and Banking Michael Koehler Industrial Assistant Kelleher Officer department Investment 15 Vice Vice Bank President, President, of since Commercial Southern 1998 Commercial Cash Thomas Connecticut Management Banking Reid Banking Expansion and Senior Officer NewAlliance Officer Vice
Slide 10: Recent Strategic Initiatives
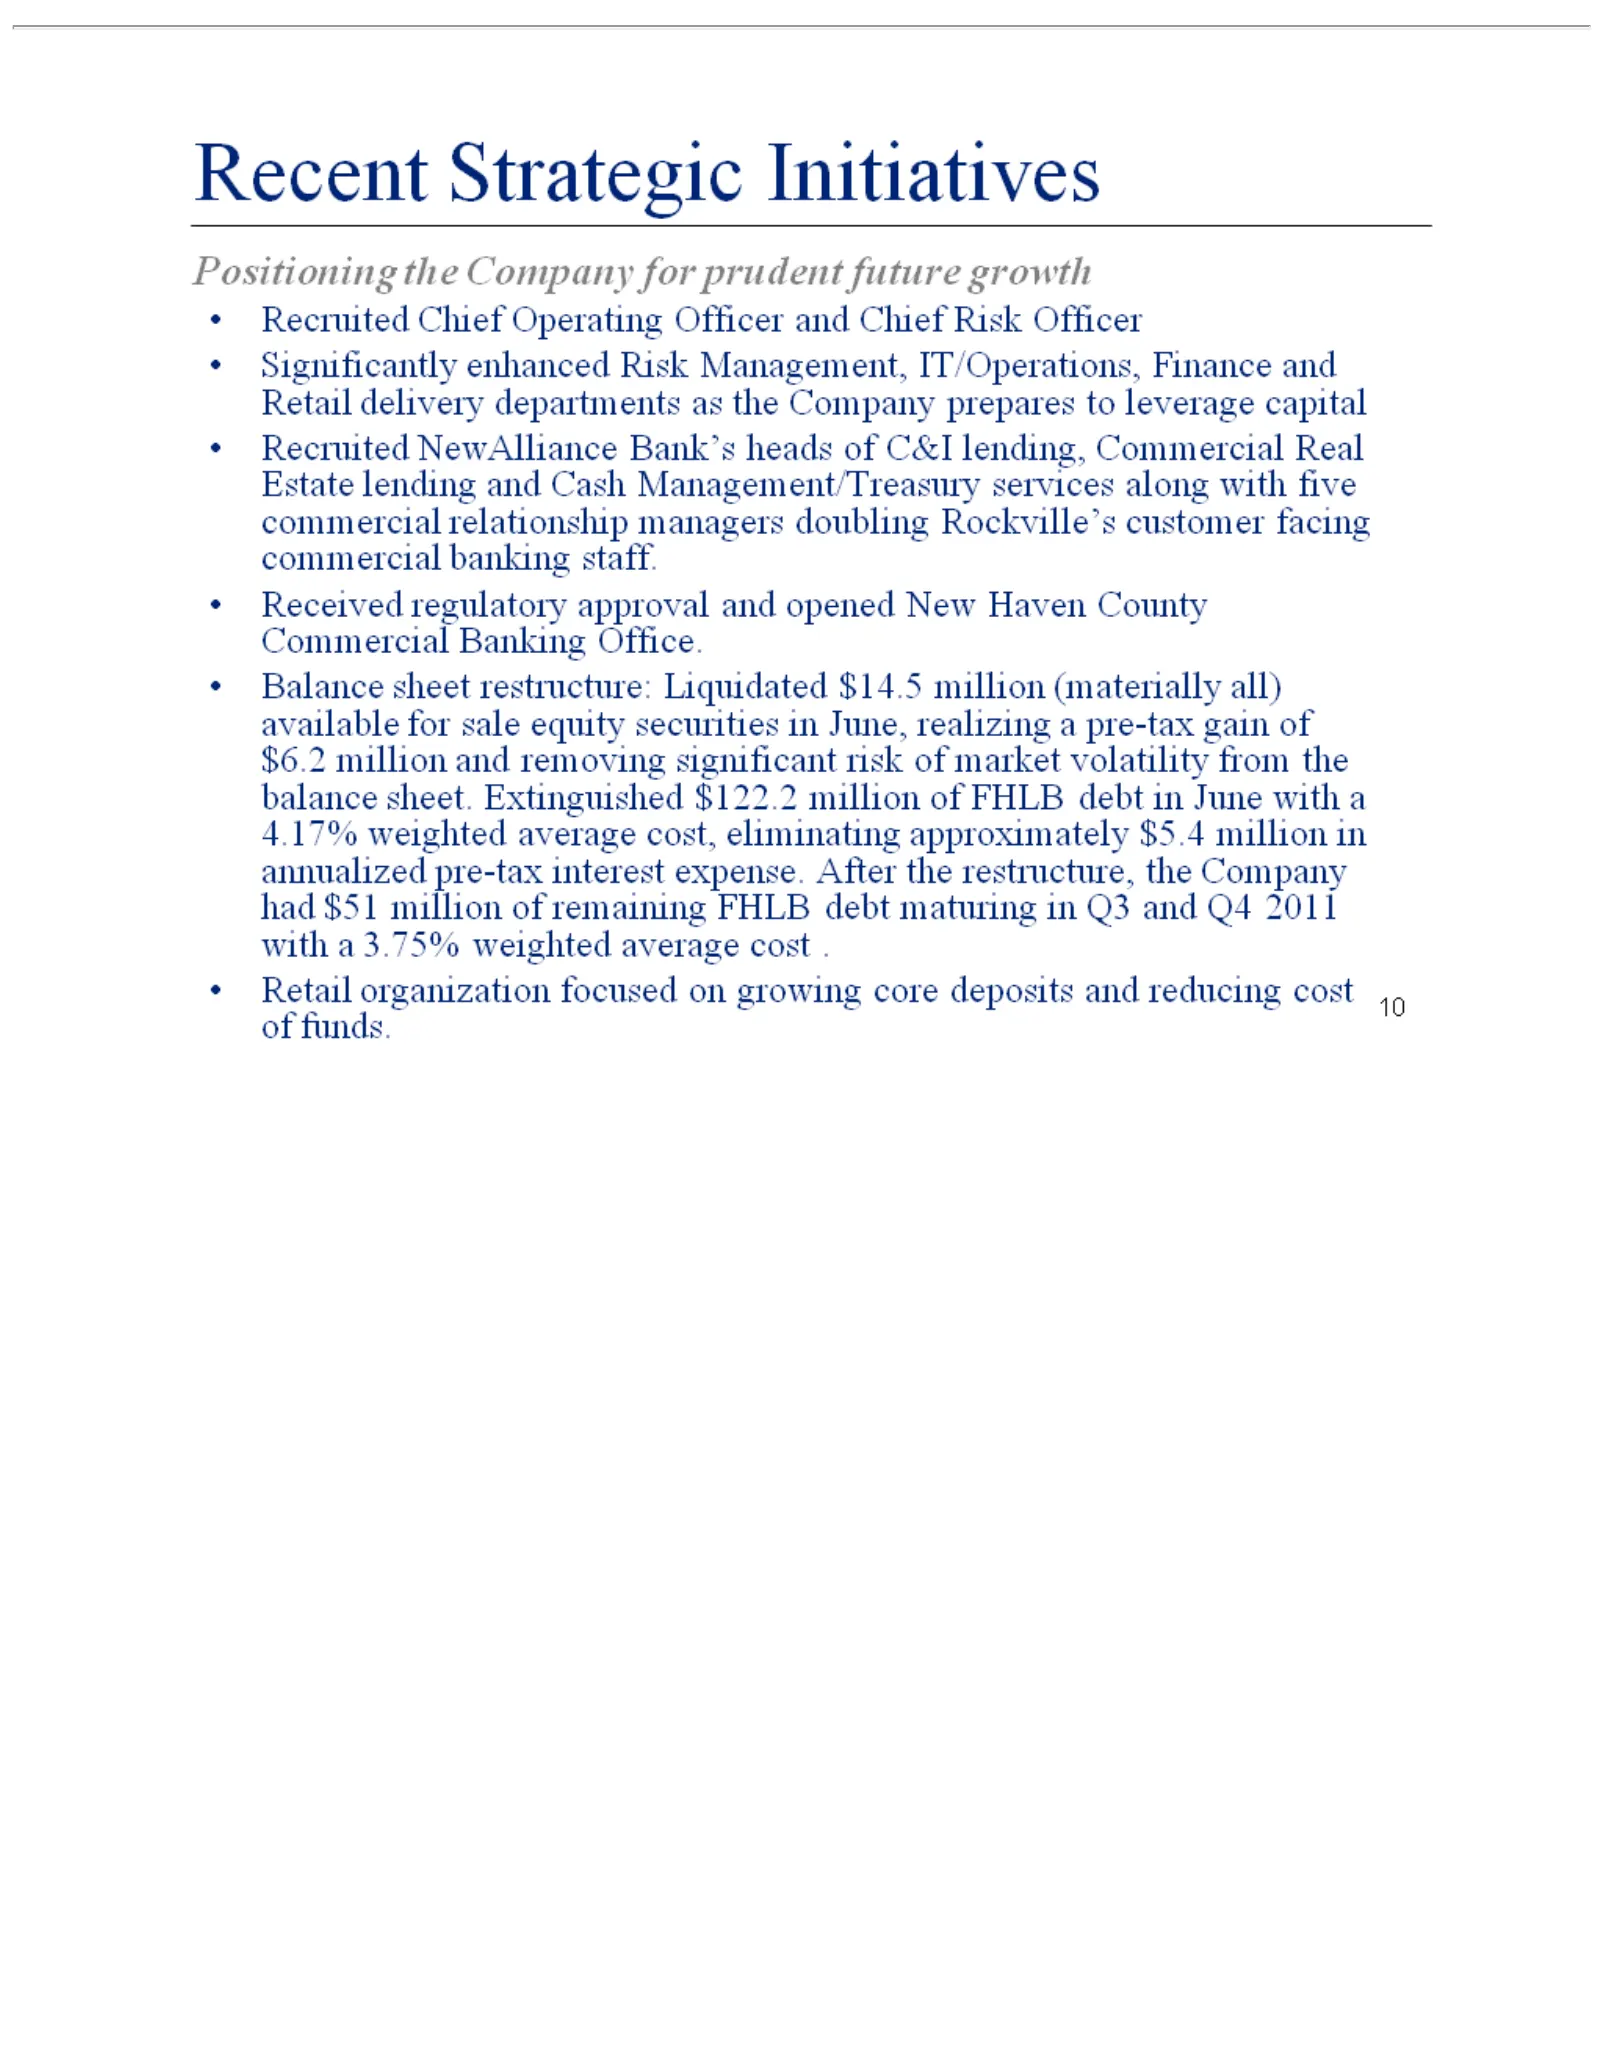
10 Recent NewAlliance regulatory significant the growth Company Strategic approval riskBank’s had of market $51 Initiatives and heads million opened volatility of C&I of Recruited New remaining lending, from Haven the Chief FHLB Commercial balance County Operating debt Commercial sheet. maturing Rea
Slide 11: Strategic Priorities
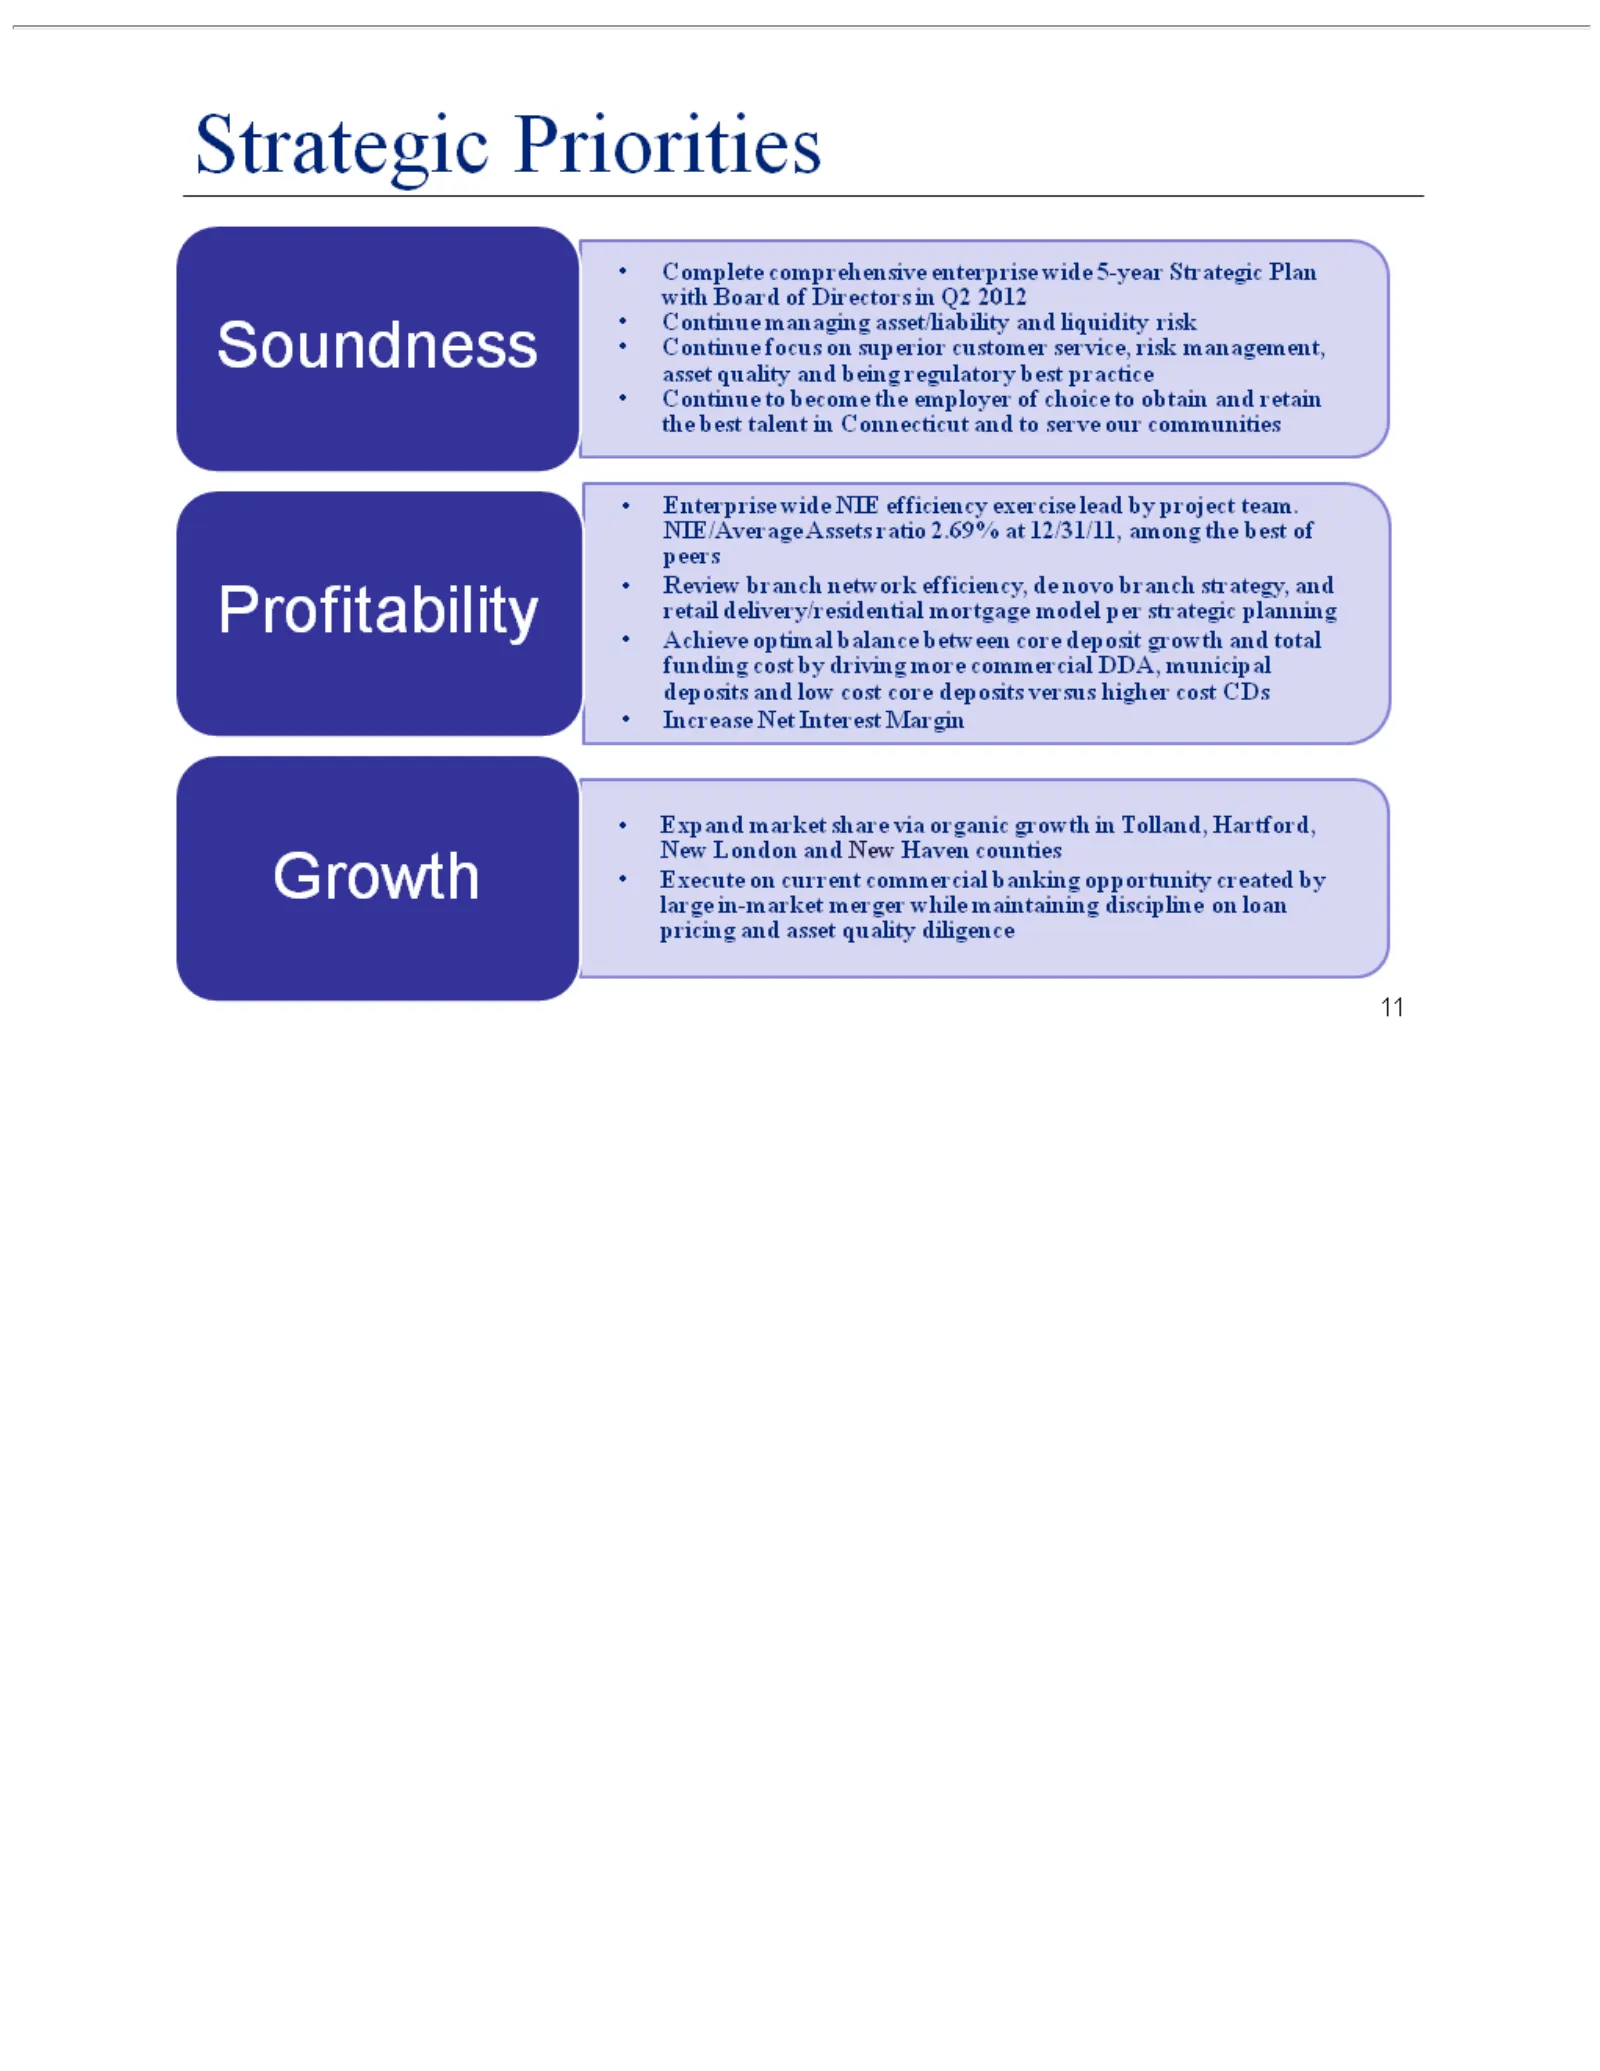
Strategicmarket Complete Continue Enterprise Review Achieve Increase Expand Execute 11 branch on Net optimal Priorities managing focus to comprehensive wide current become Interest network share on NIE balance superior commercial asset/liability the efficiency Margin viaemployer efficiency, organic
Slide 12: Strategic Priorities
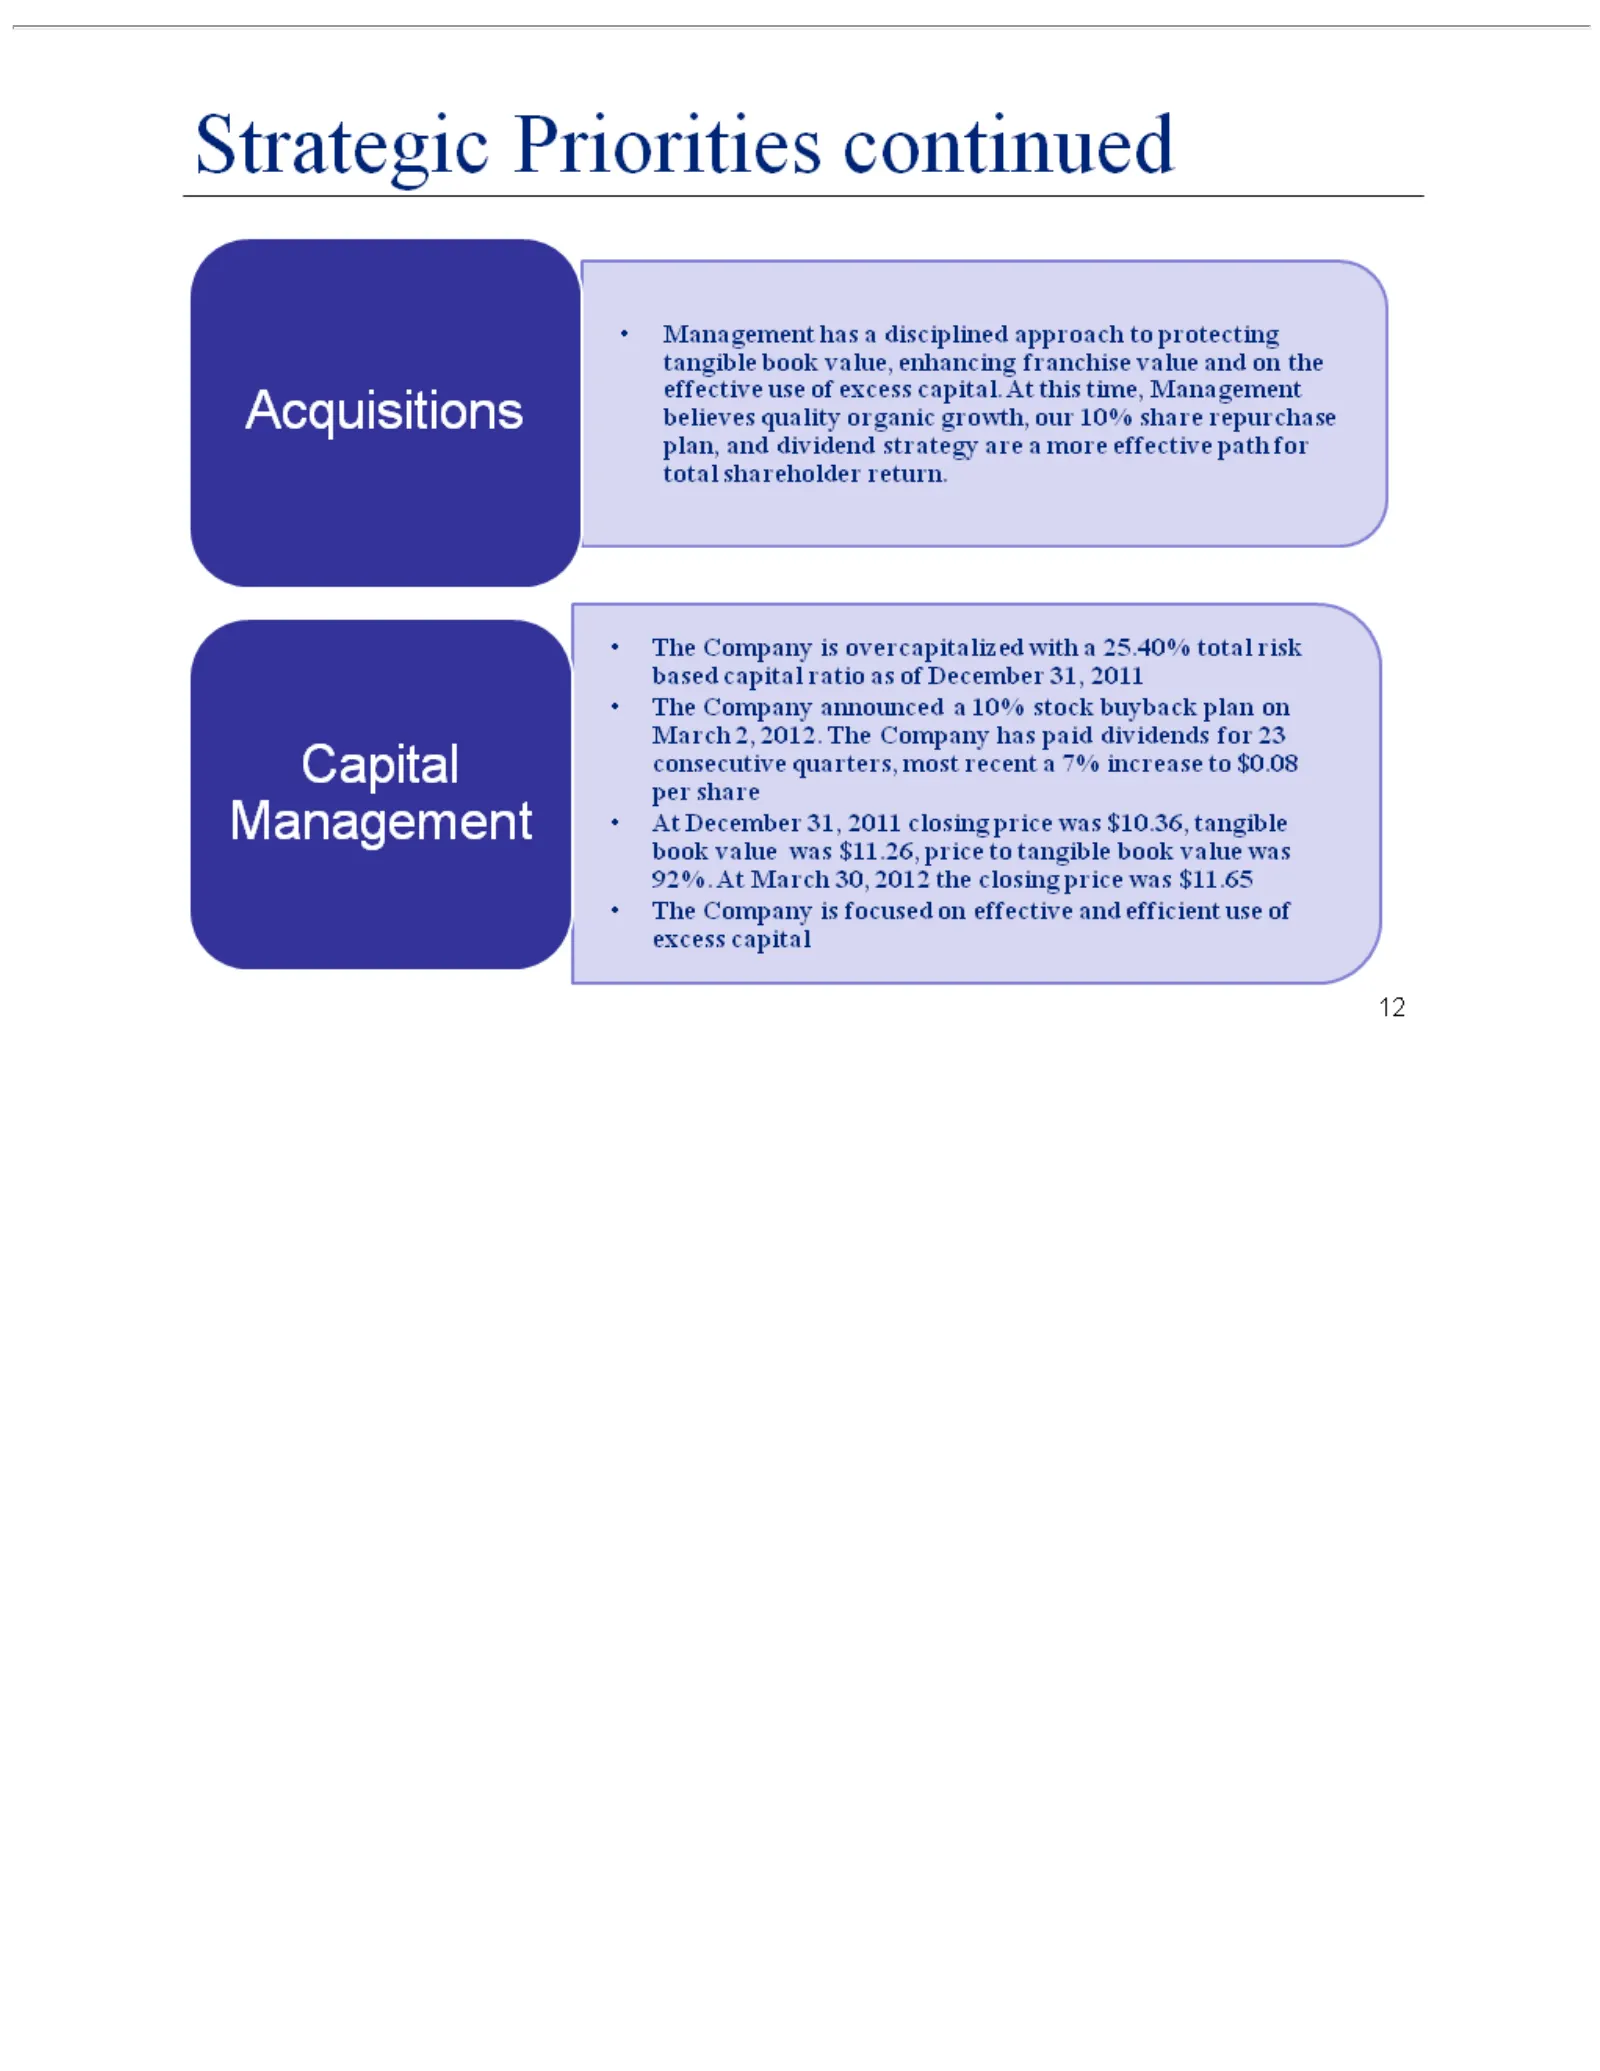
Strategic Acquisitions strategy -Capital 12 At The Management December Company Management are Priorities a more has 31, announced is overcapitalized focused 2011 acontinued12 continued effective disciplined closing on a path 10% effective approach price for with stock total was and abuyback 25.40% t
Slide 13: Strategic Priorities
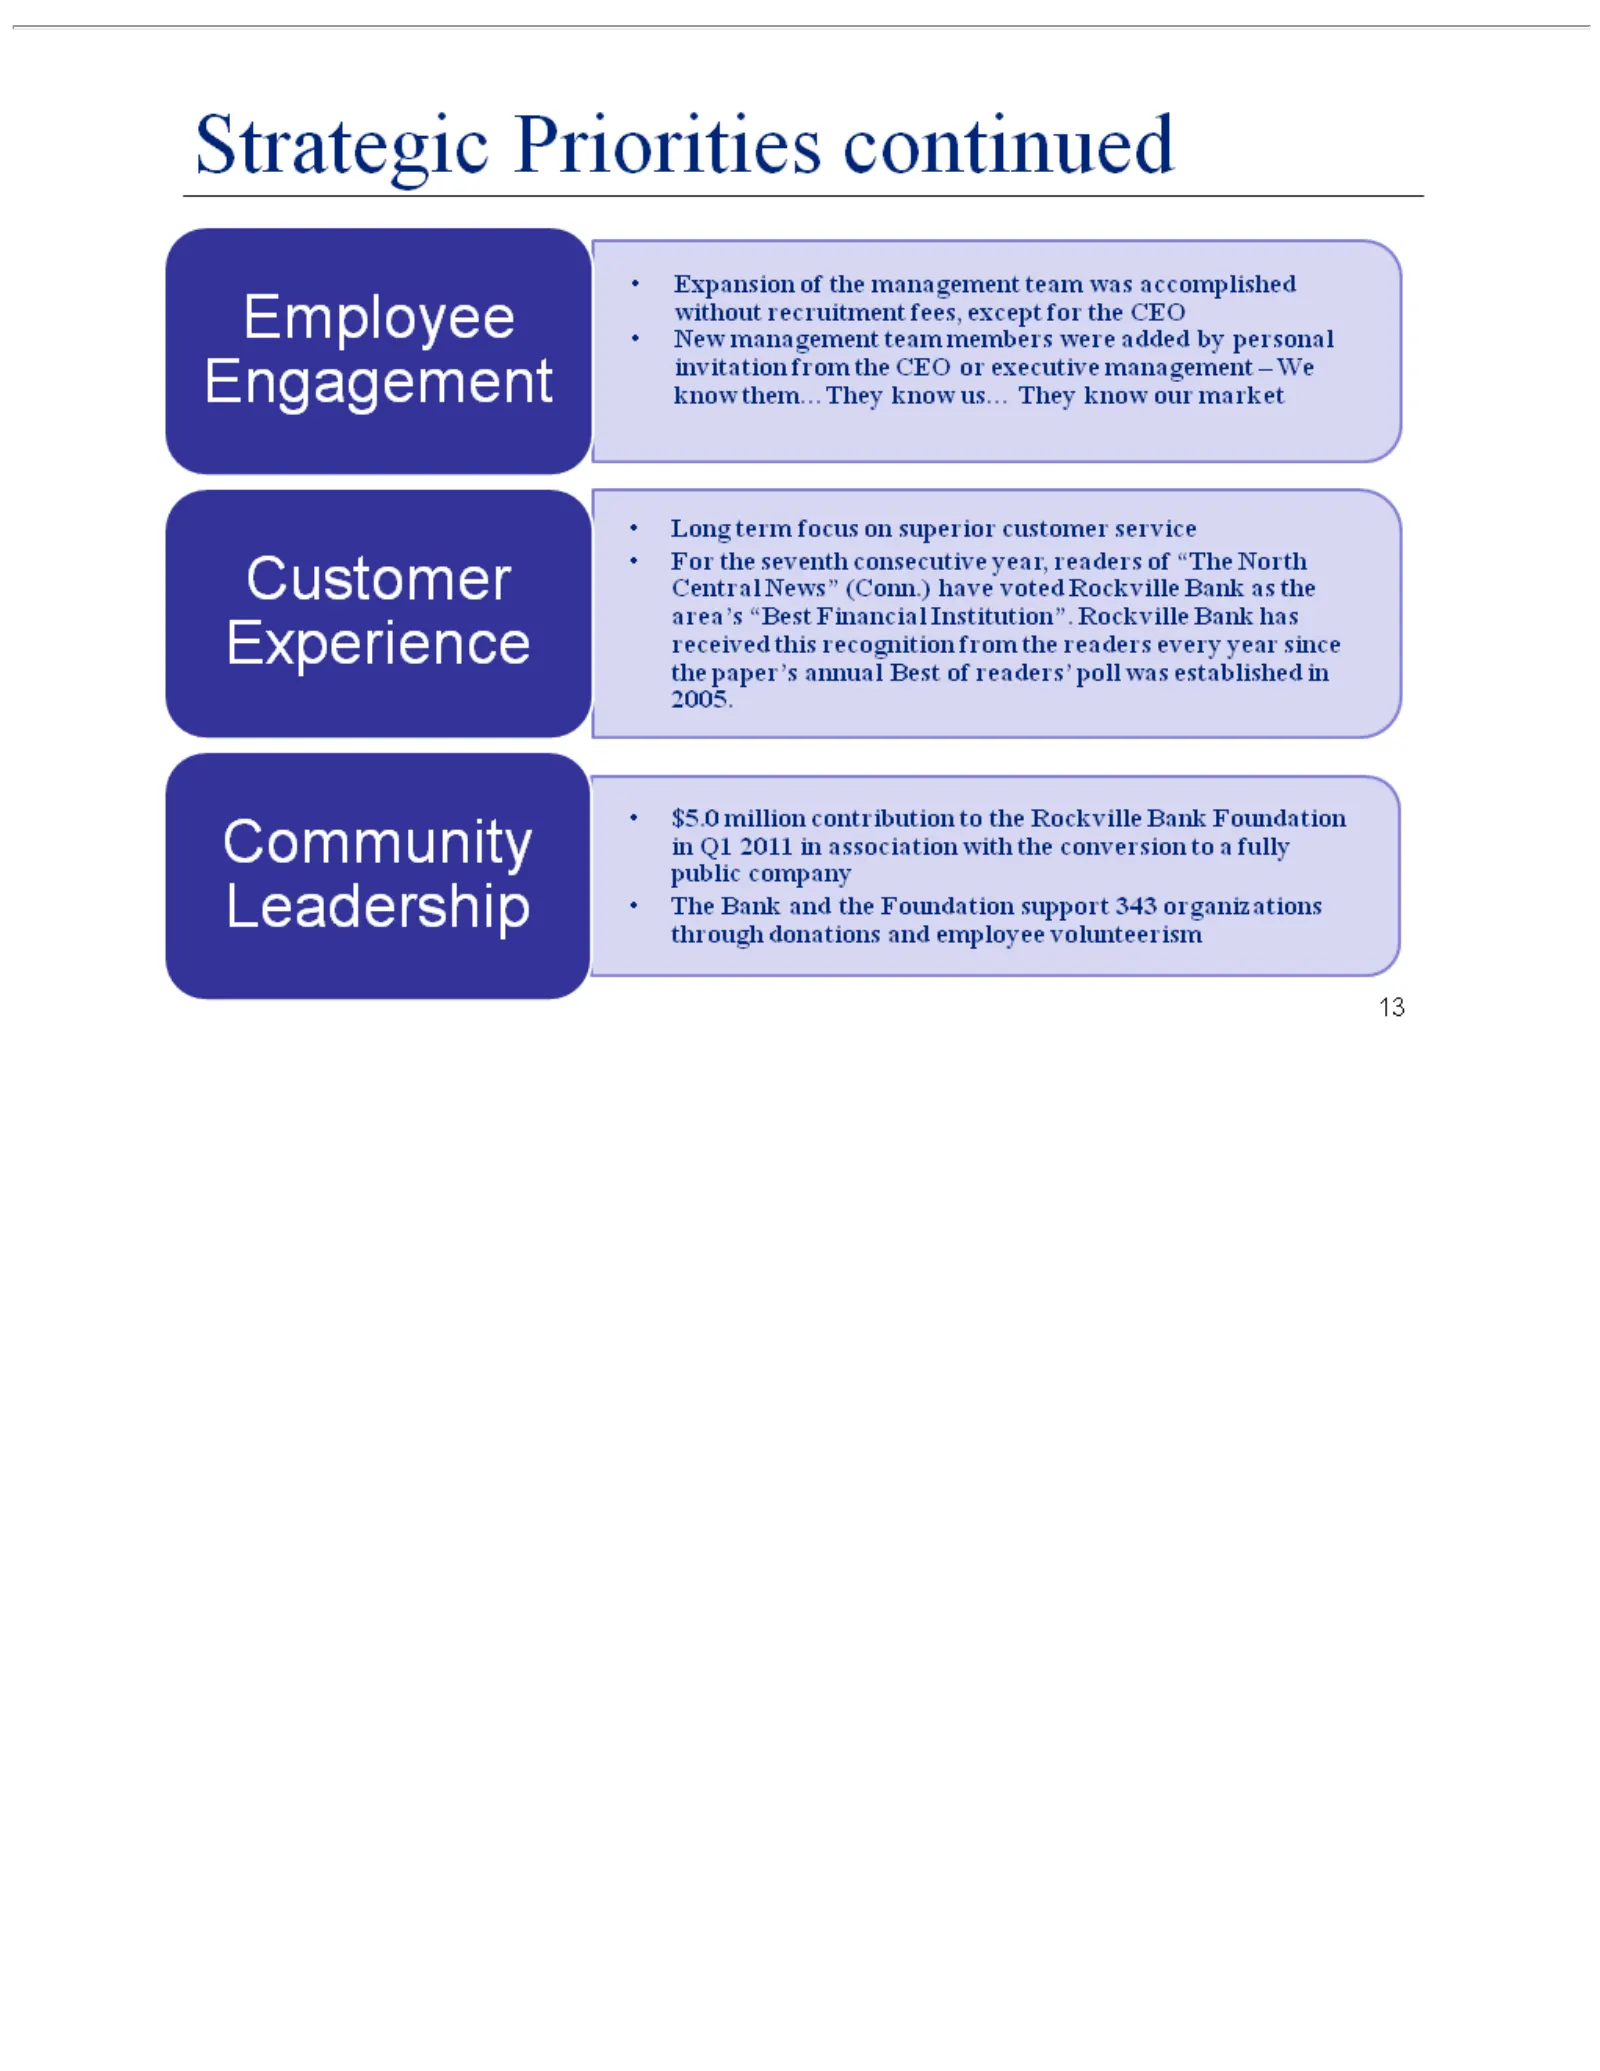
13 Strategic Expansion New Long For readers’ $5.0 The the Bank million management term seventh poll and focus ofPriorities contribution was the the consecutive on established management Foundation team superior continued members to the year, customer insupport team 2005. Rockville 13 readers were wa
Slide 14: Solid Performance Since Current Management
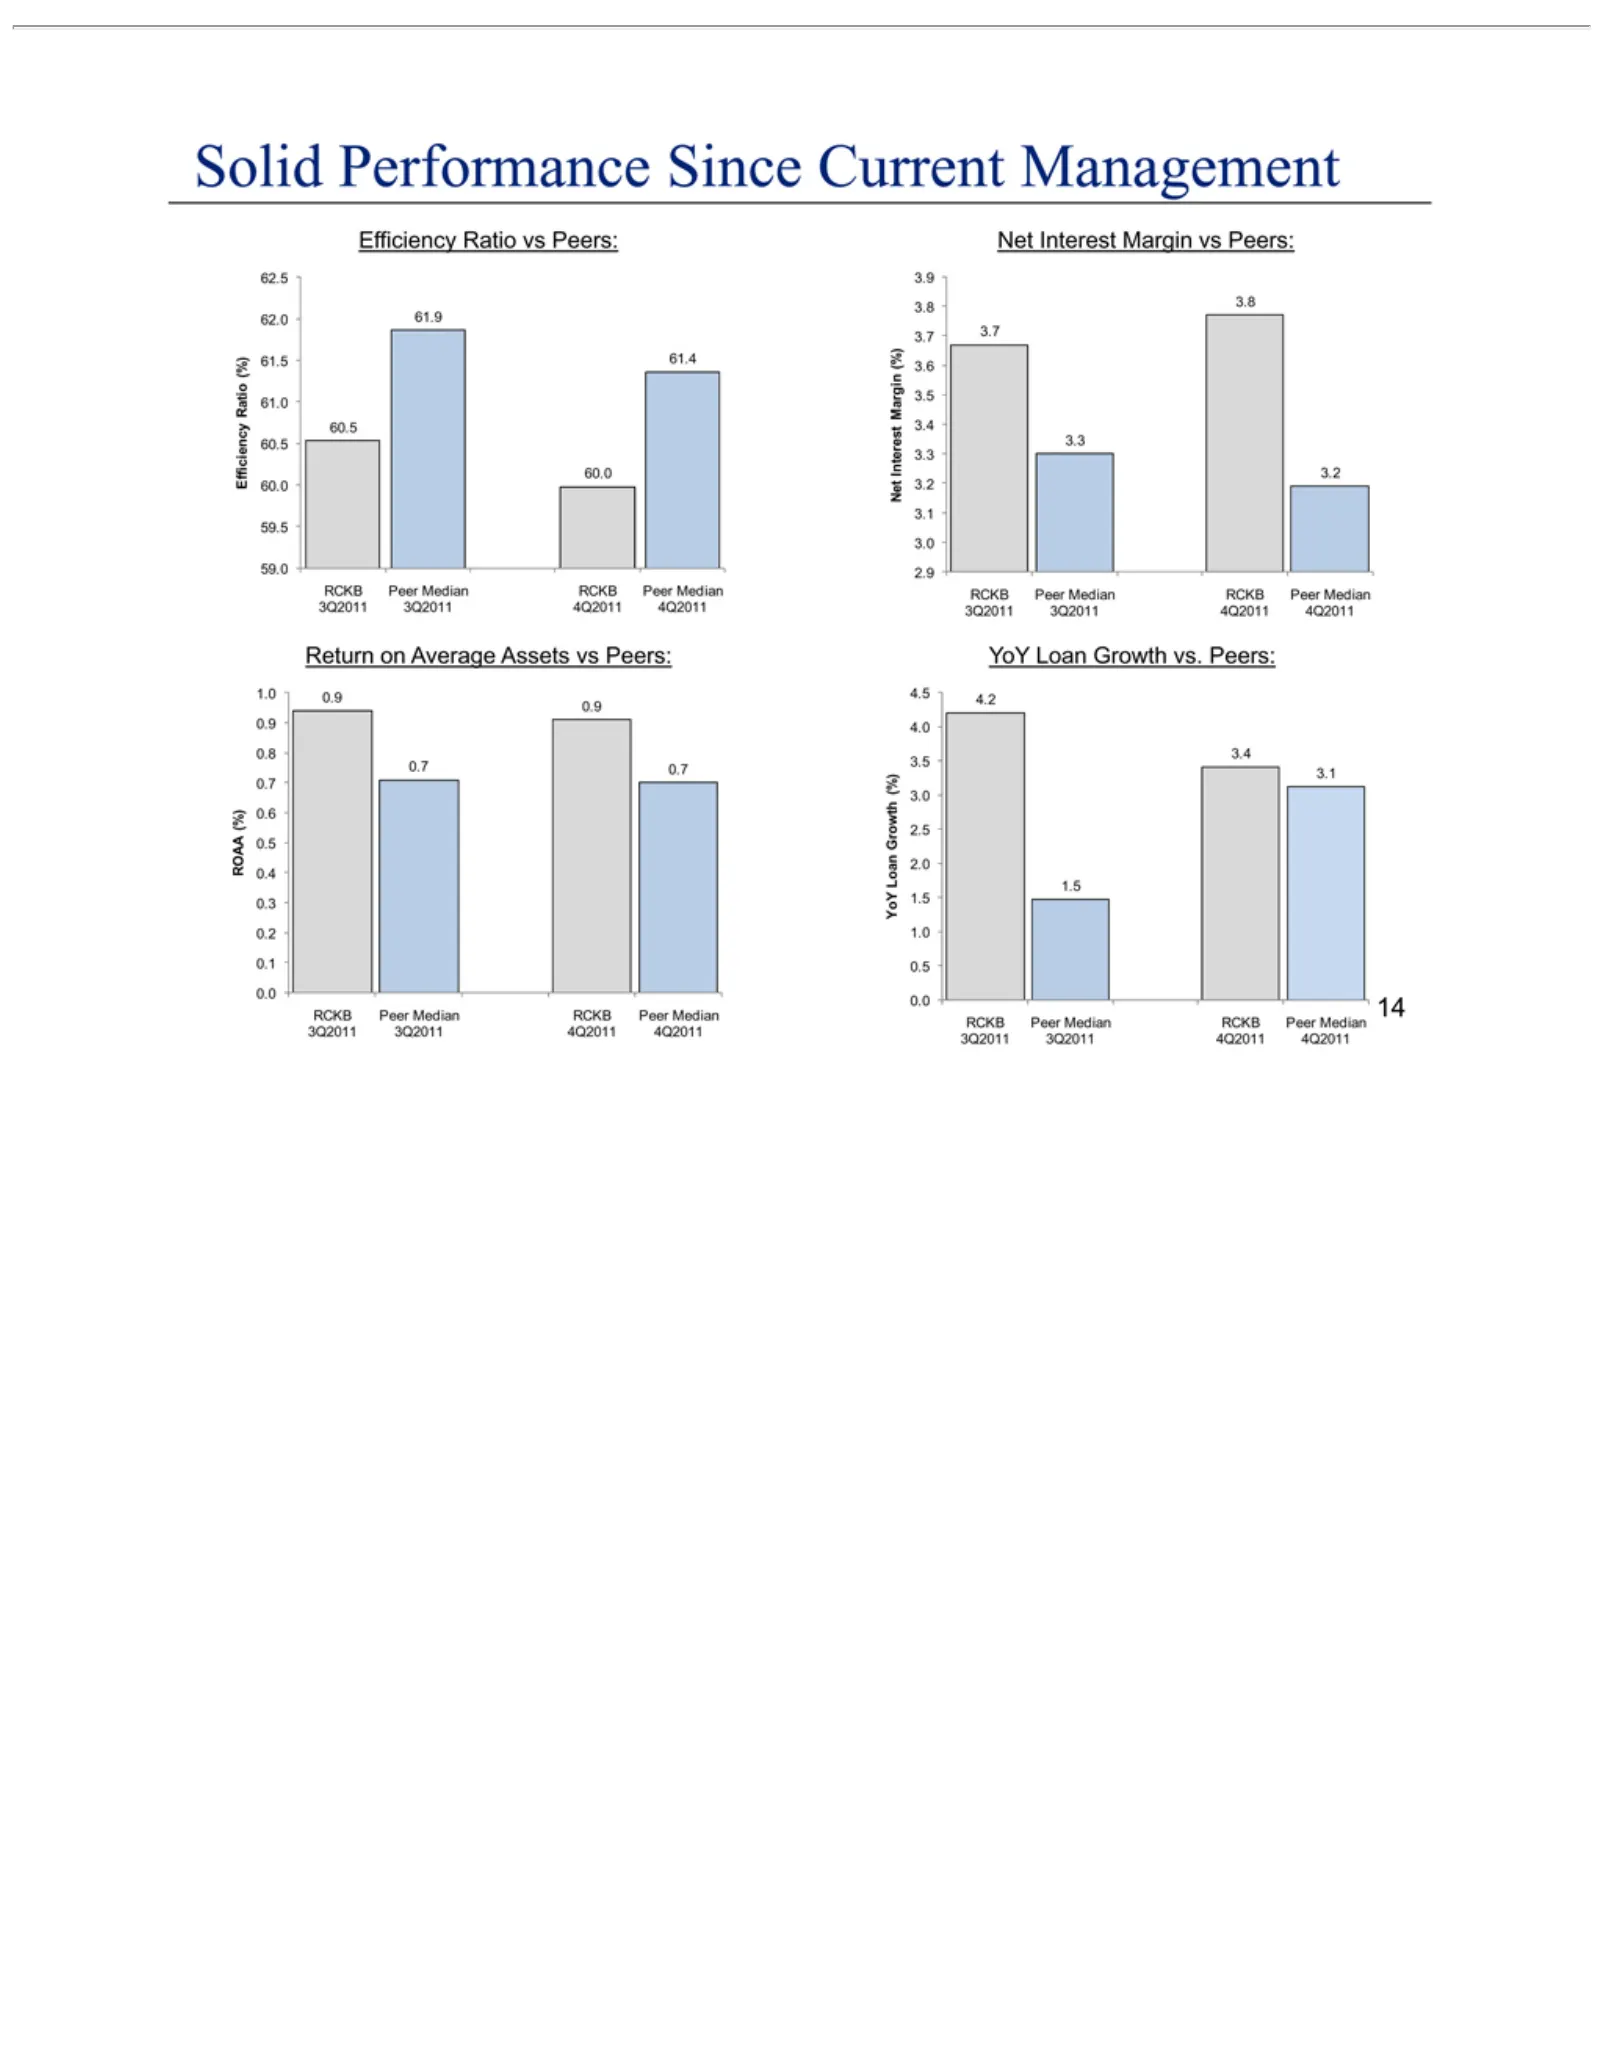
Solid Performance Return on Average Assets Since Current vs Peers: Management YoY Loan Growth vs. Peers: 14 Efficiency Ratio vs Peers: Net Interest Margin vs Peers: Solid Performance Since Current Management
Slide 15: Total Assets growth
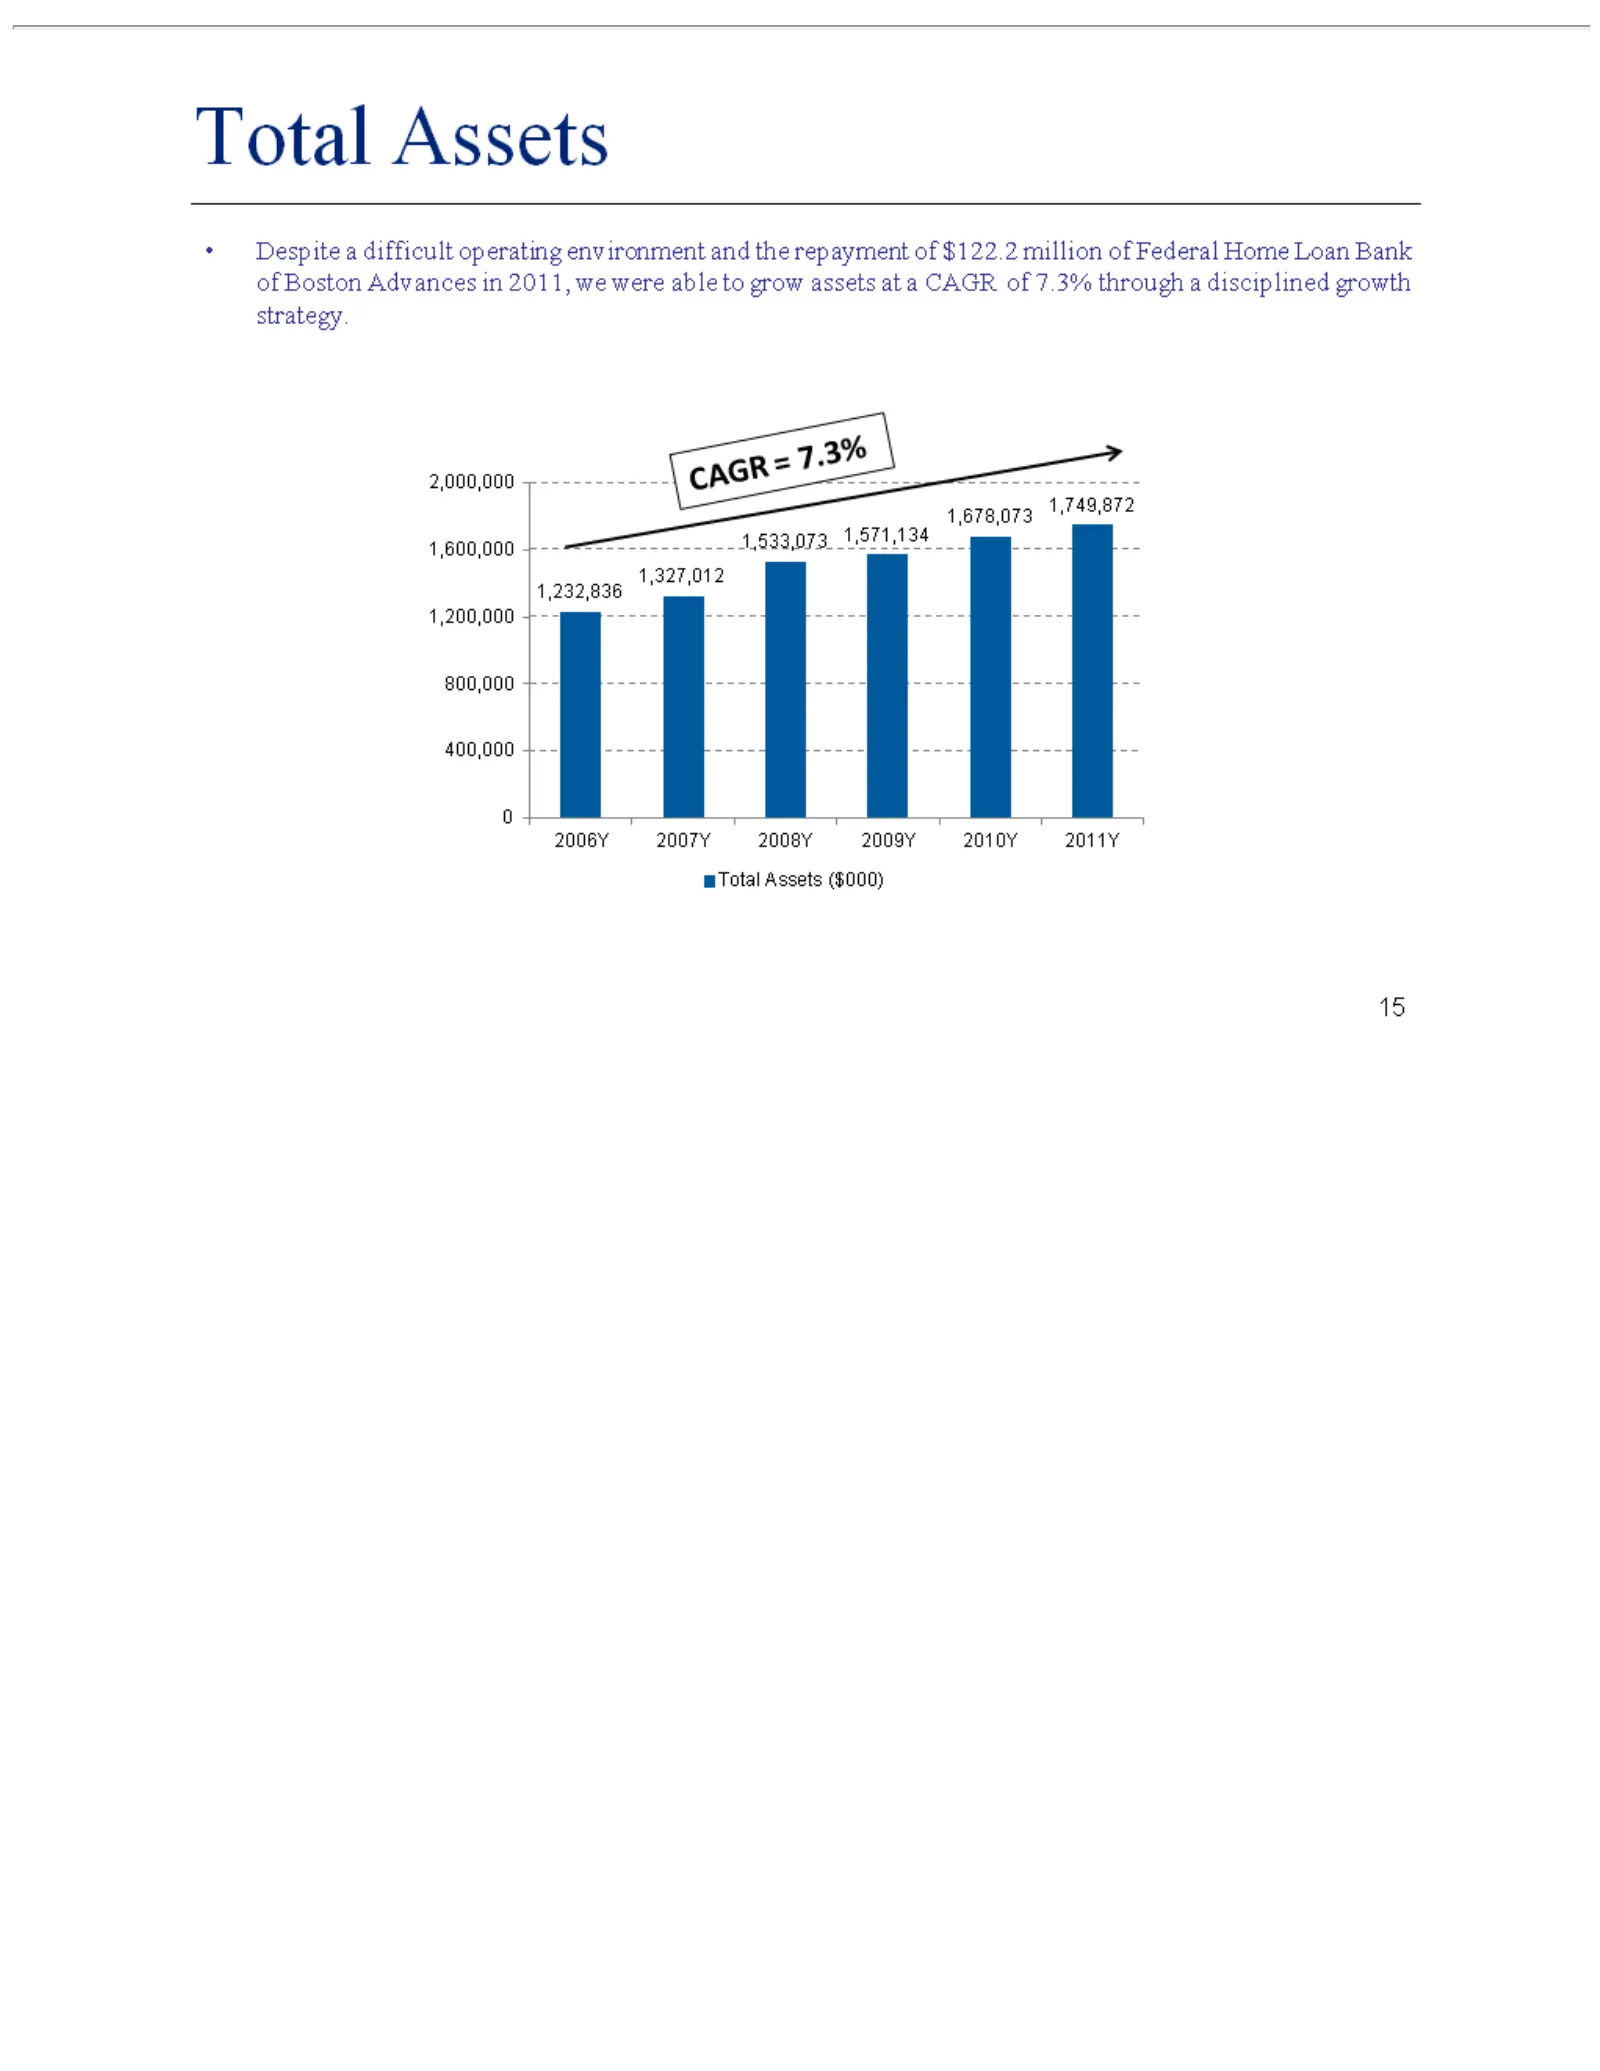
02Despite 400,000 800,000 1,200,000 1,600,000 2,000,000 Total 2011Y 2010Y 2009Y 2008Y 2007Y CAGAR=7.3% 1,749,872 1,678,073 1,571,134 1,533,073 1,327,012 1,232,836 006YAssets a difficult ($000)operating environment and the repayment of $122.2 million of Federal Home Loan Bank of Boston Advances in 20
Slide 16: Capital
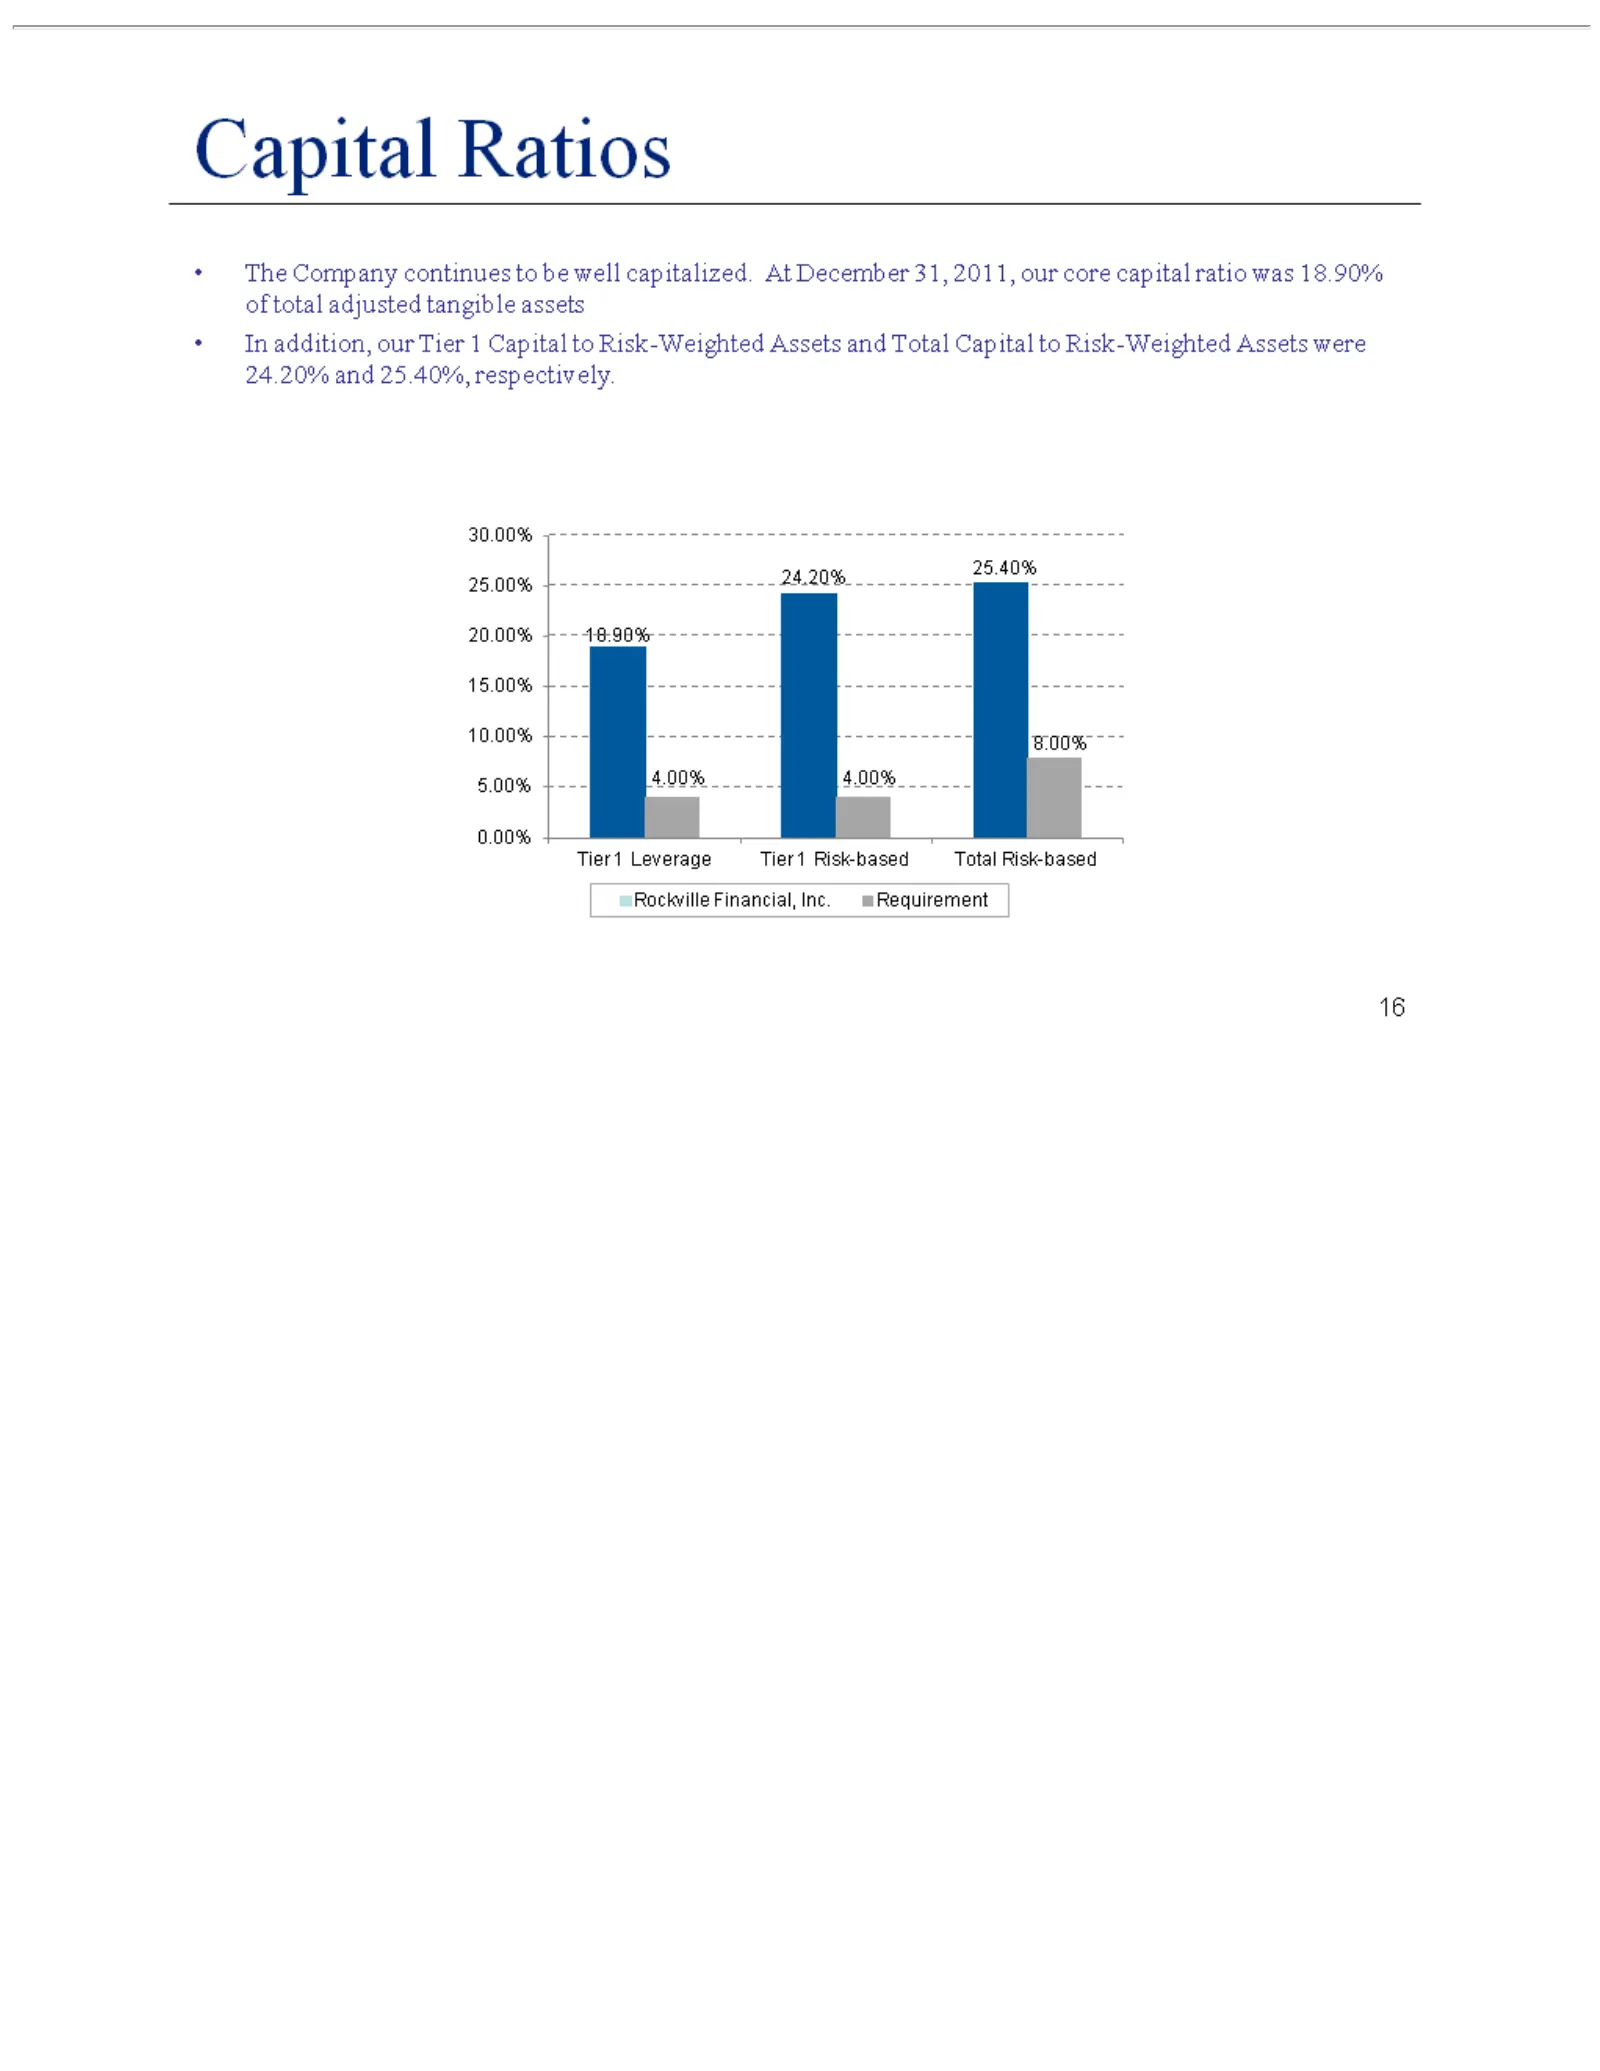
16 Capital Assets 8.00% 25.40% 24.20% 4.00% 18.90% 0.00% 5.00% 10.00% 15.00% 20.00% 25.00% 30.00% Tler Total Rockvlle 1Risk-based Leverage Risk-based were Financial. Ratios 24.20% TheInc and Company Requirement 25.40%,continues respectively. to be(CHART) well capitalized. At December 31, 2011, our c
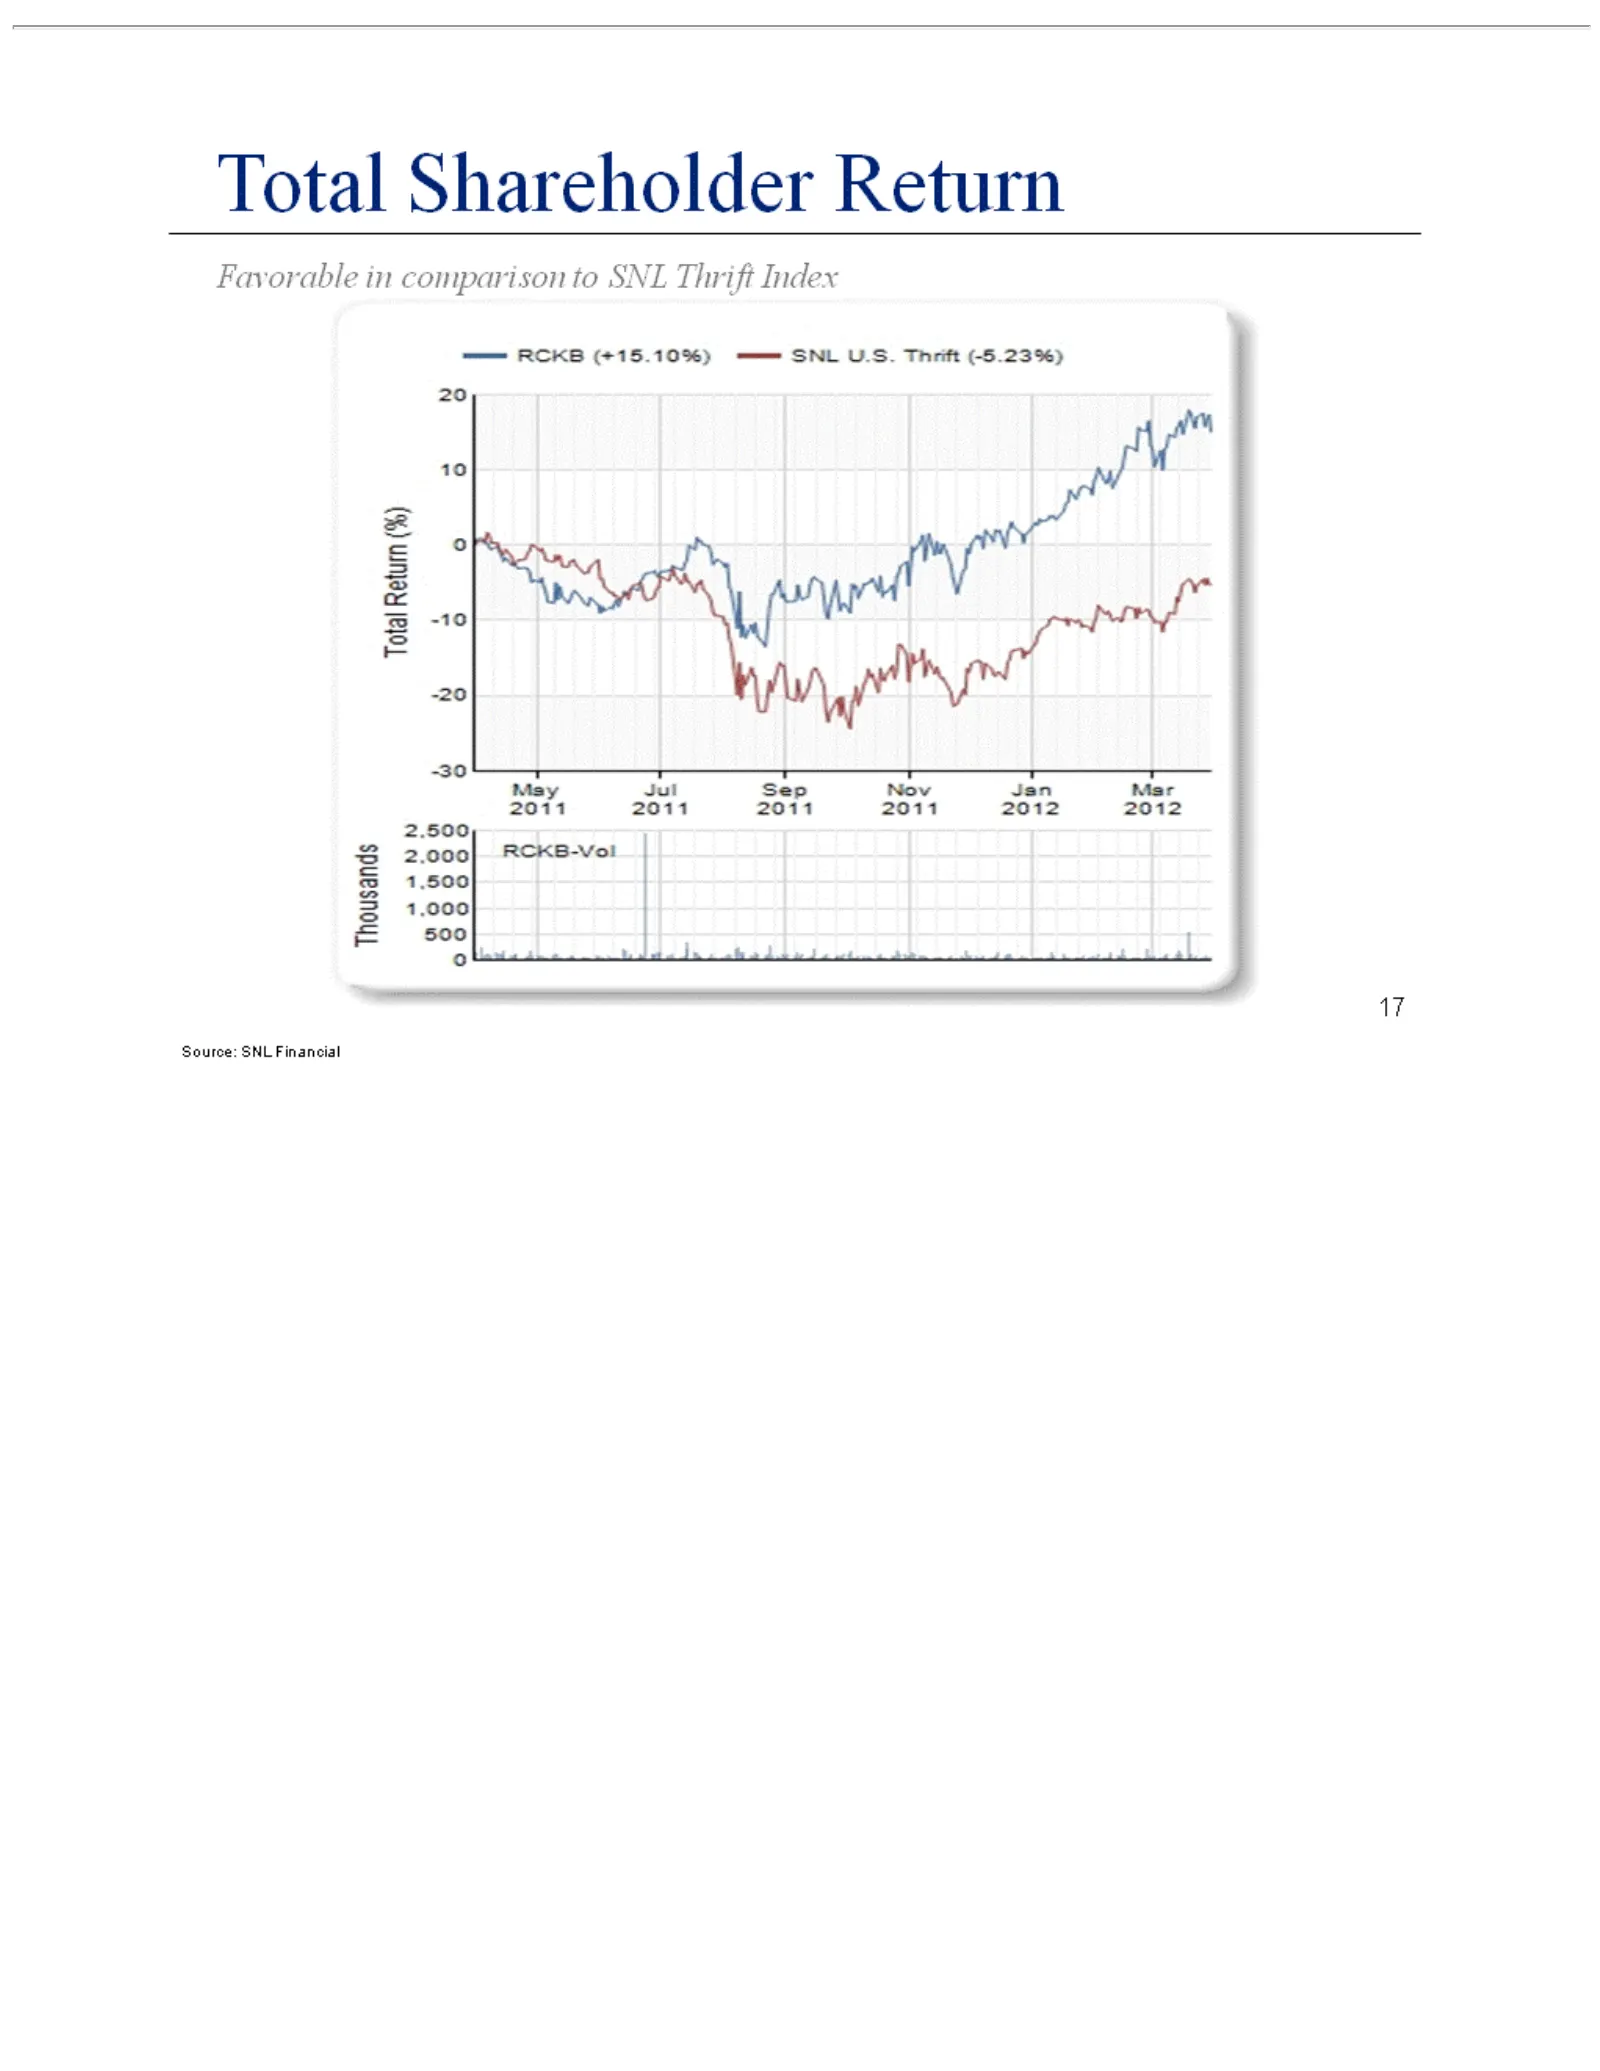
Slide 17: Total Shareholder Return
17 --RCKB 10 23 -20 May Jul Sep Nov Jan 0Mar 1,000 1,500 2,000 2,500 10 Thousands Total 2011 Total 2012 2011 2012 2011 2011 (+15.10%) Shareholder Return (%)– Return SNL U.S. Favorable Thrift (-5.23%) in comparison to SNL Thrift Index Source: SNL Financial
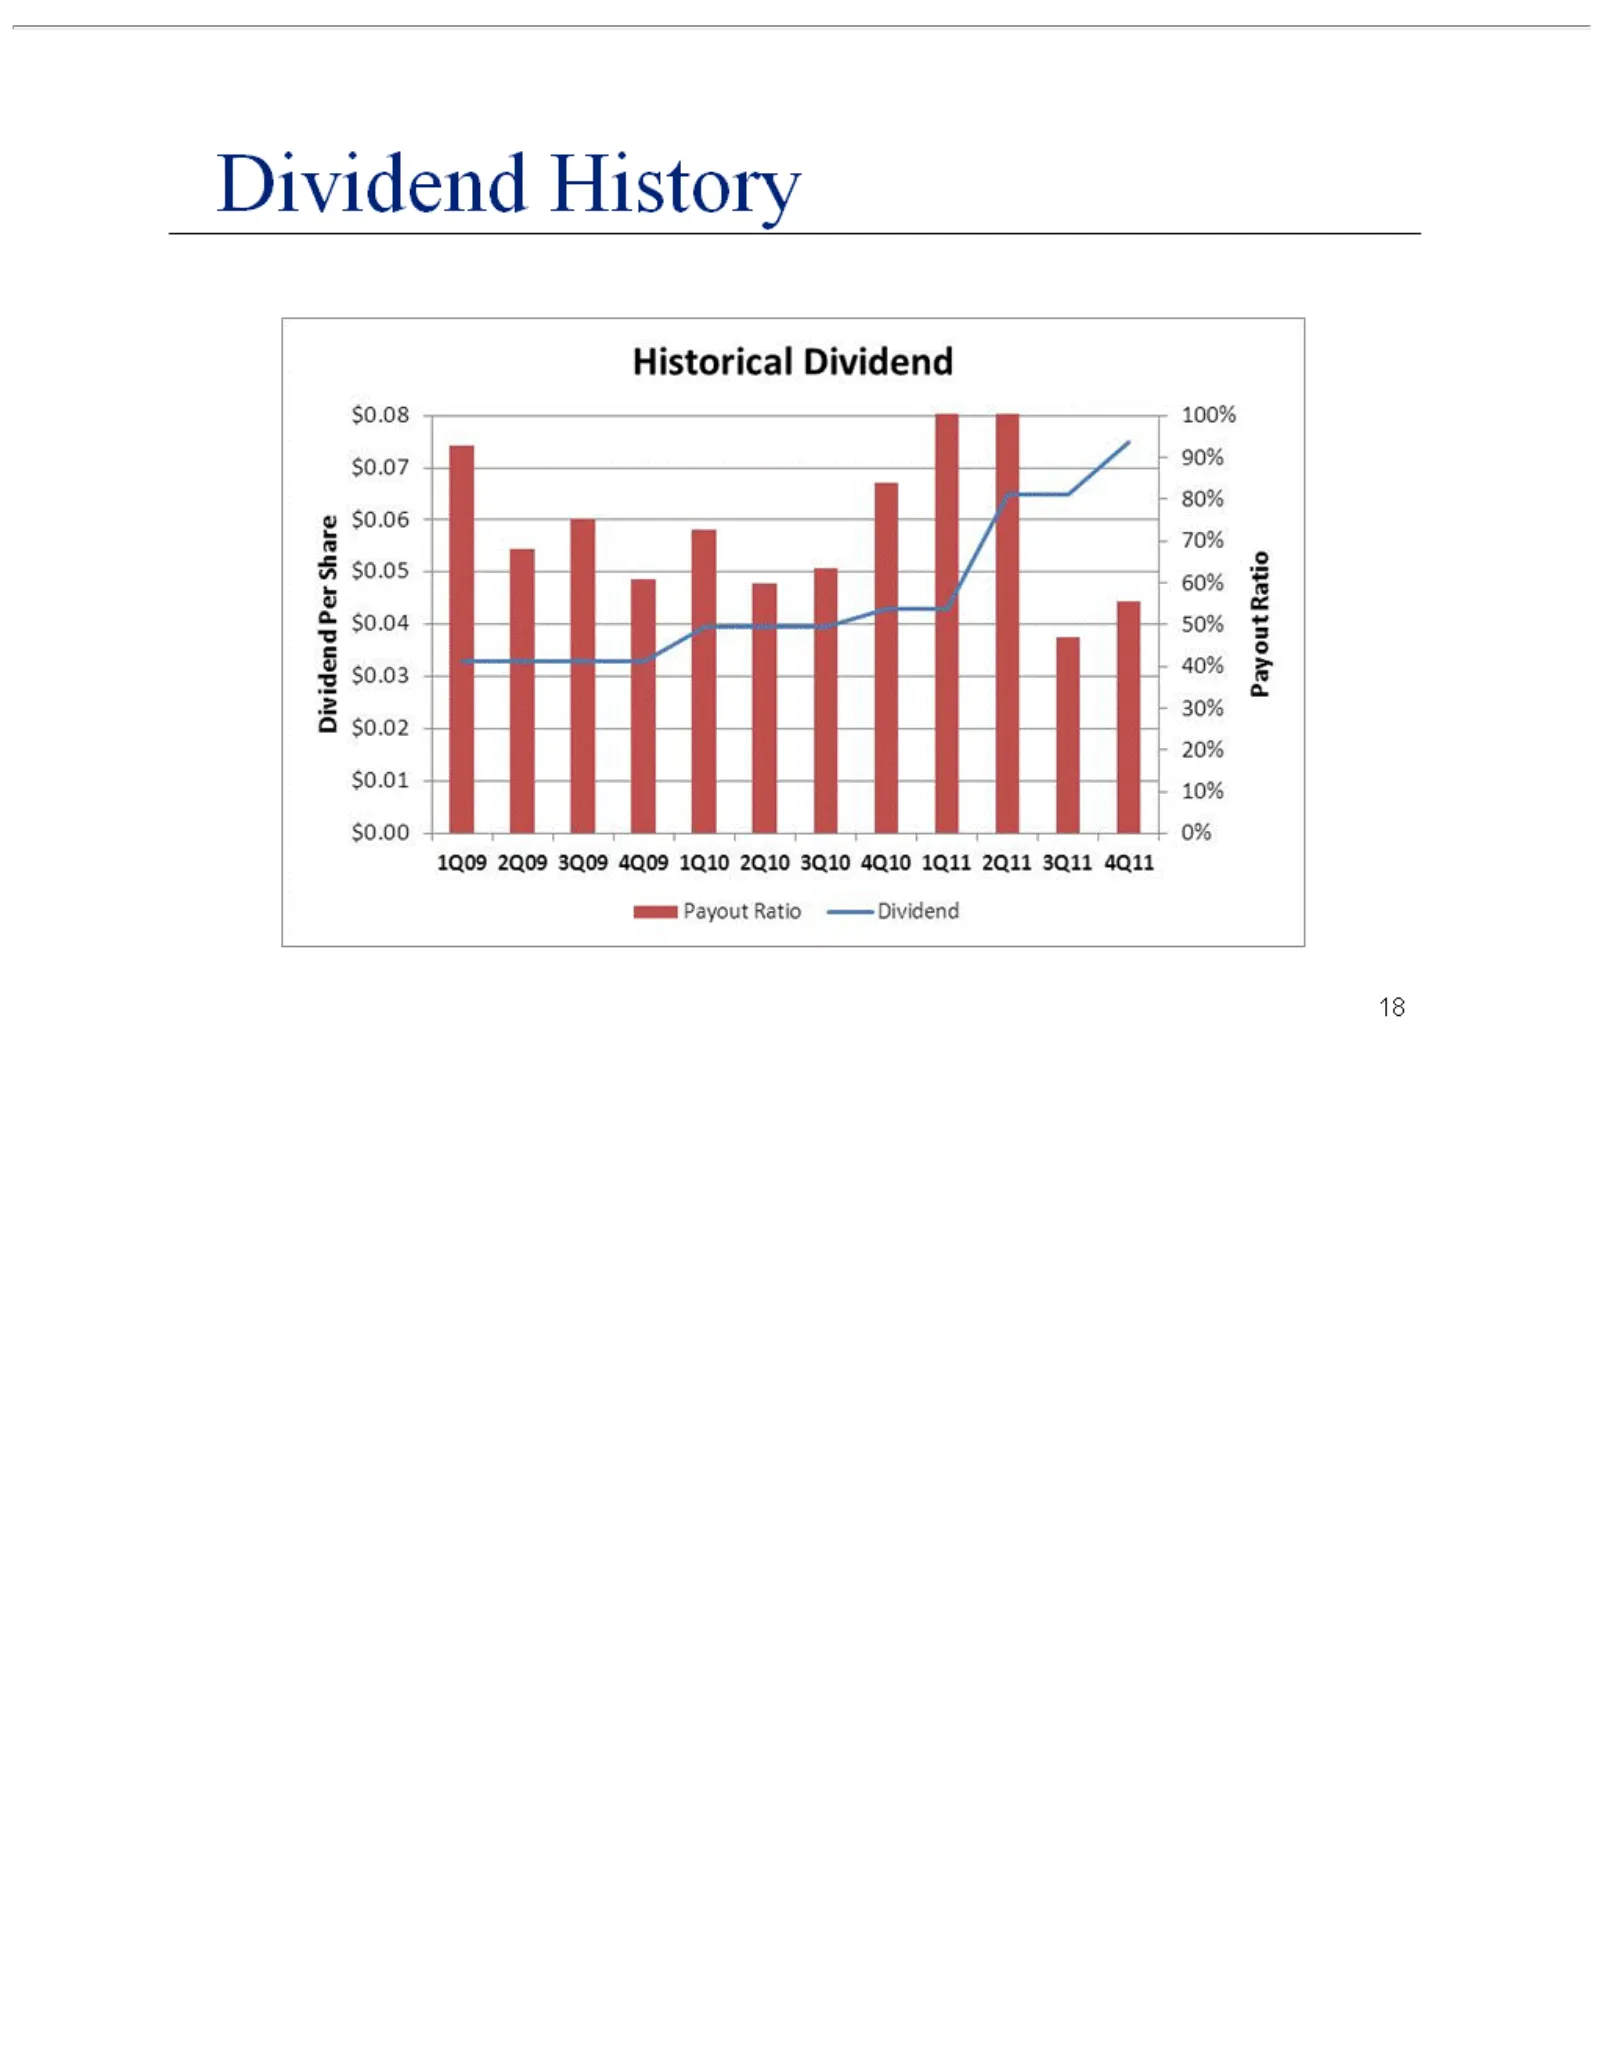
Slide 18: Dividend History
18 Dividend Historical $0.00 $0.01 $0.02 $0.03 $0.04 $0.05 $0.06 $0.07 $0.08 Payout 4Q11 3Q11 2Q11 1Q11 4Q10 3Q10 2Q10 1Q10 4Q09 3Q09 2Q09 1Q09 Payment 0% 10% 20% 30% 40% 50% 60% 70% 80% 90% 100% DividendRatio Ratio Per Dividend History Share
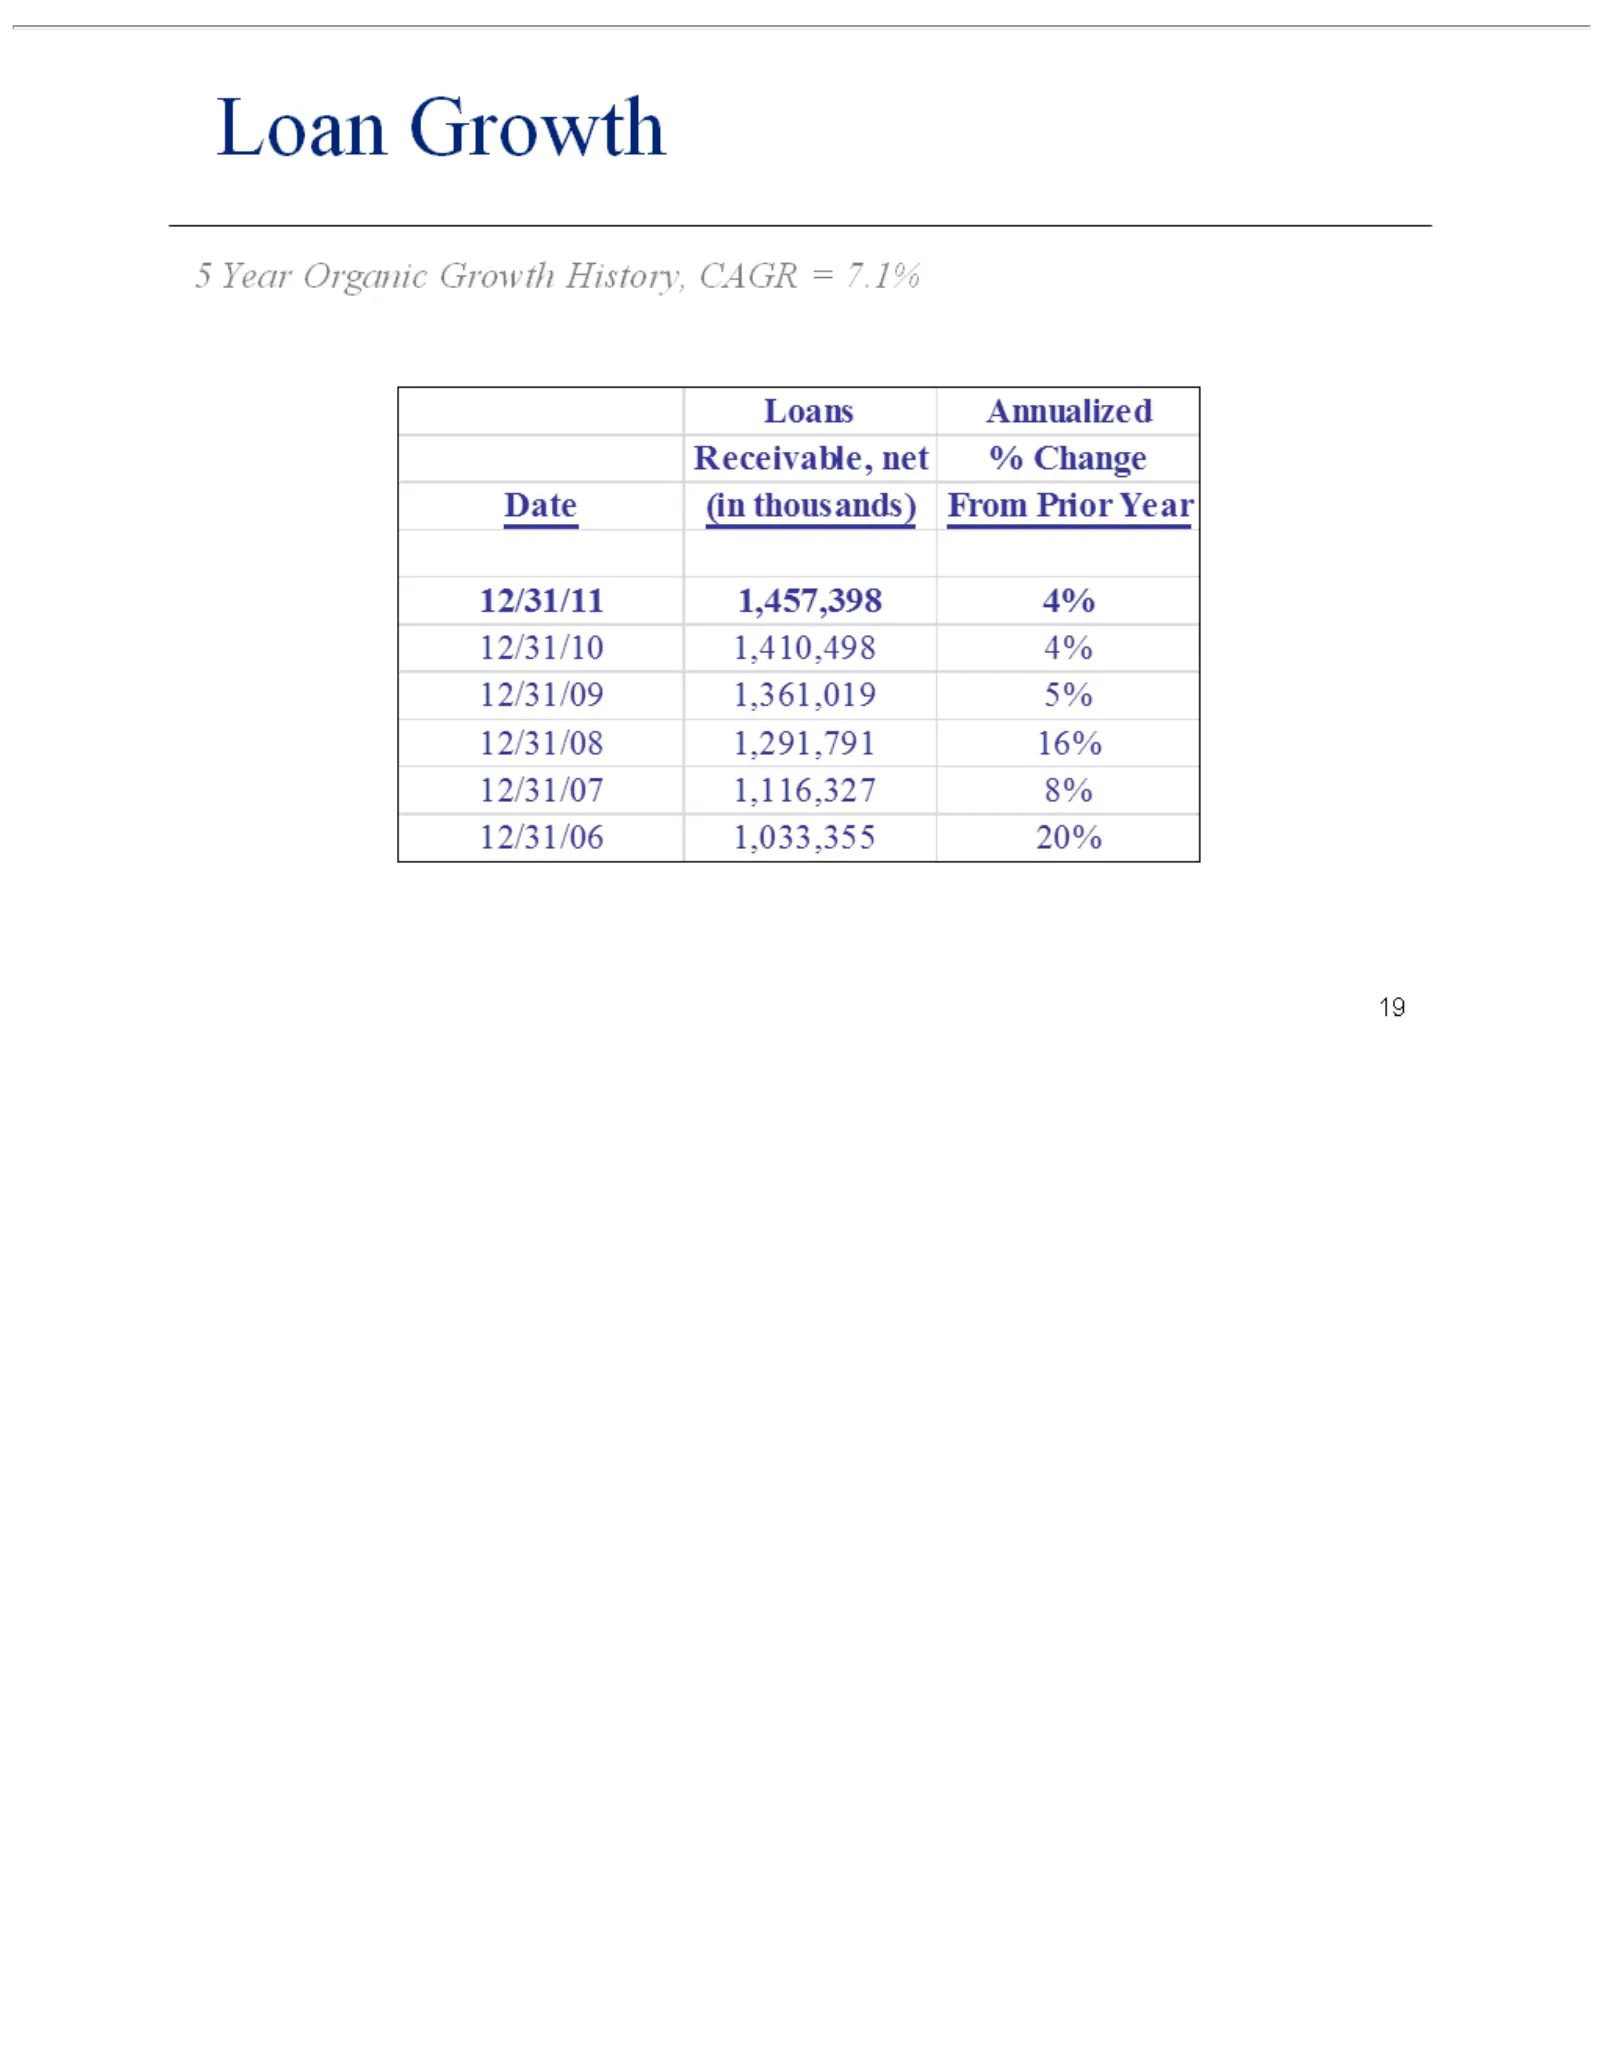
Slide 19: Loan Growth
19 Loan Growth 5 Year Organic Growth History, CAGR = 7.1%
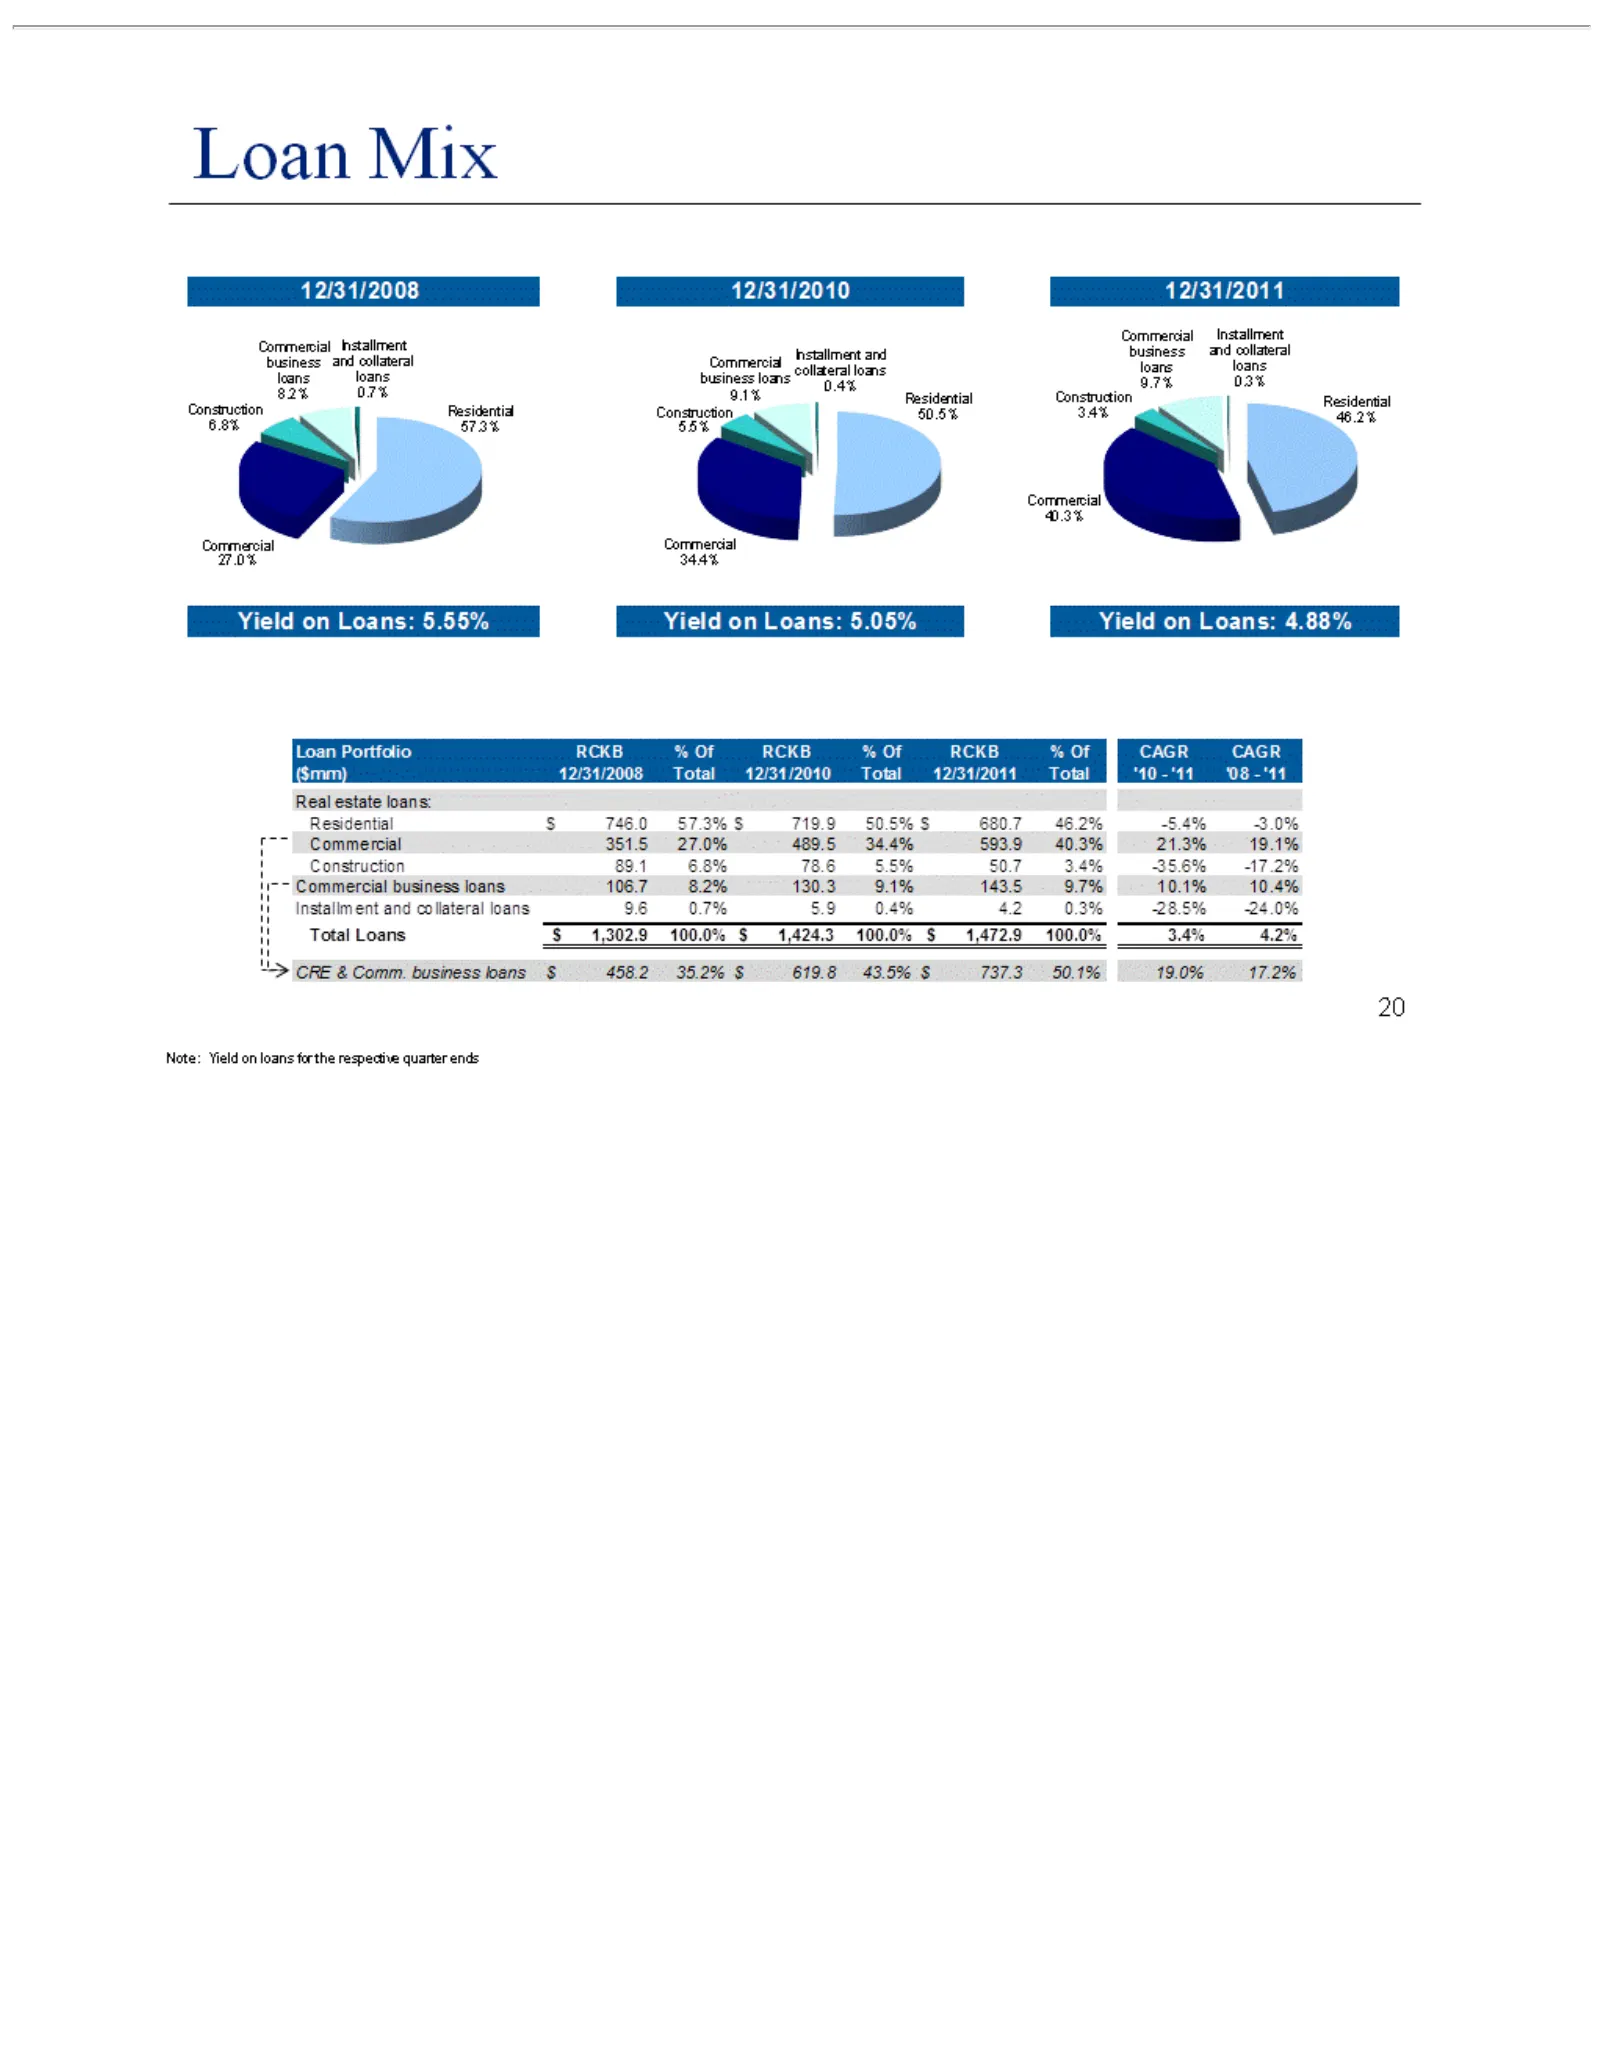
Slide 20: Loan Mix
20 Loan Mix Note: Yield on loans for the respective quarter ends
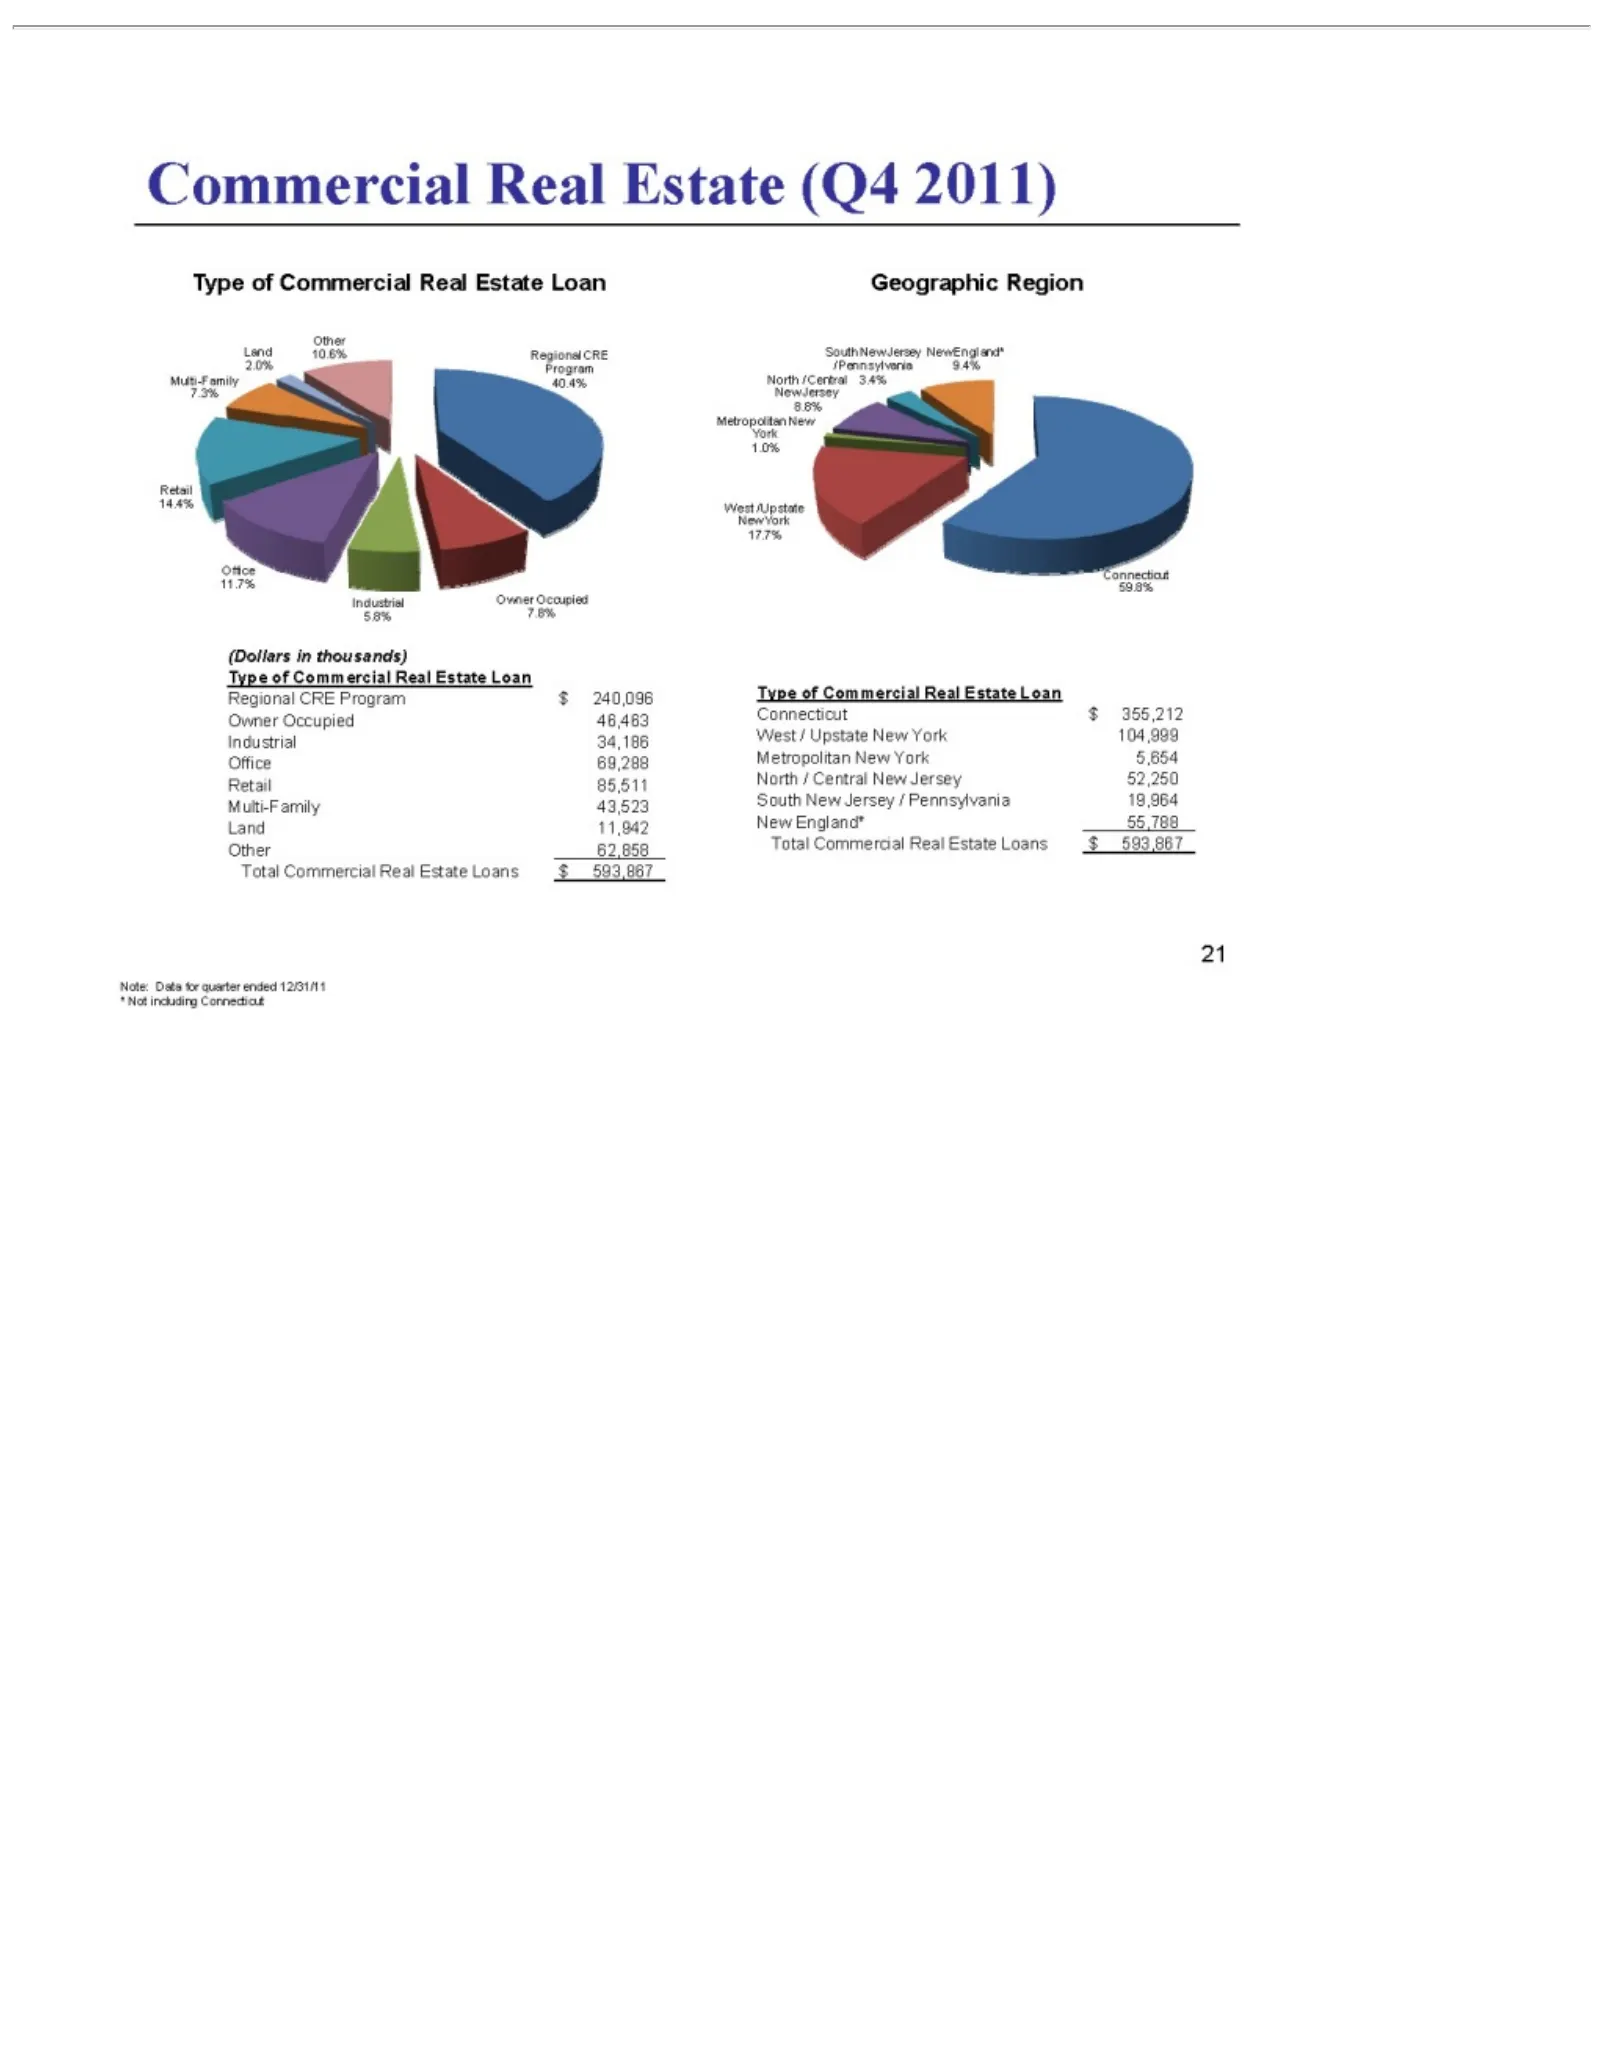
Slide 21: Commercial Real Estate Geographic Data
*21 England* Commercial Geographic (Dollars Regional Owner Industrial Office Retail Multi-Family Land Other Type Connecticut West Metropolitan North South New Total Note: /of Commercial 11,942 Data 62,858 /New 85,511 Upstate 69,288 Occupied Central Commercial inCRE Not 34,186 thousands) for Jersey R
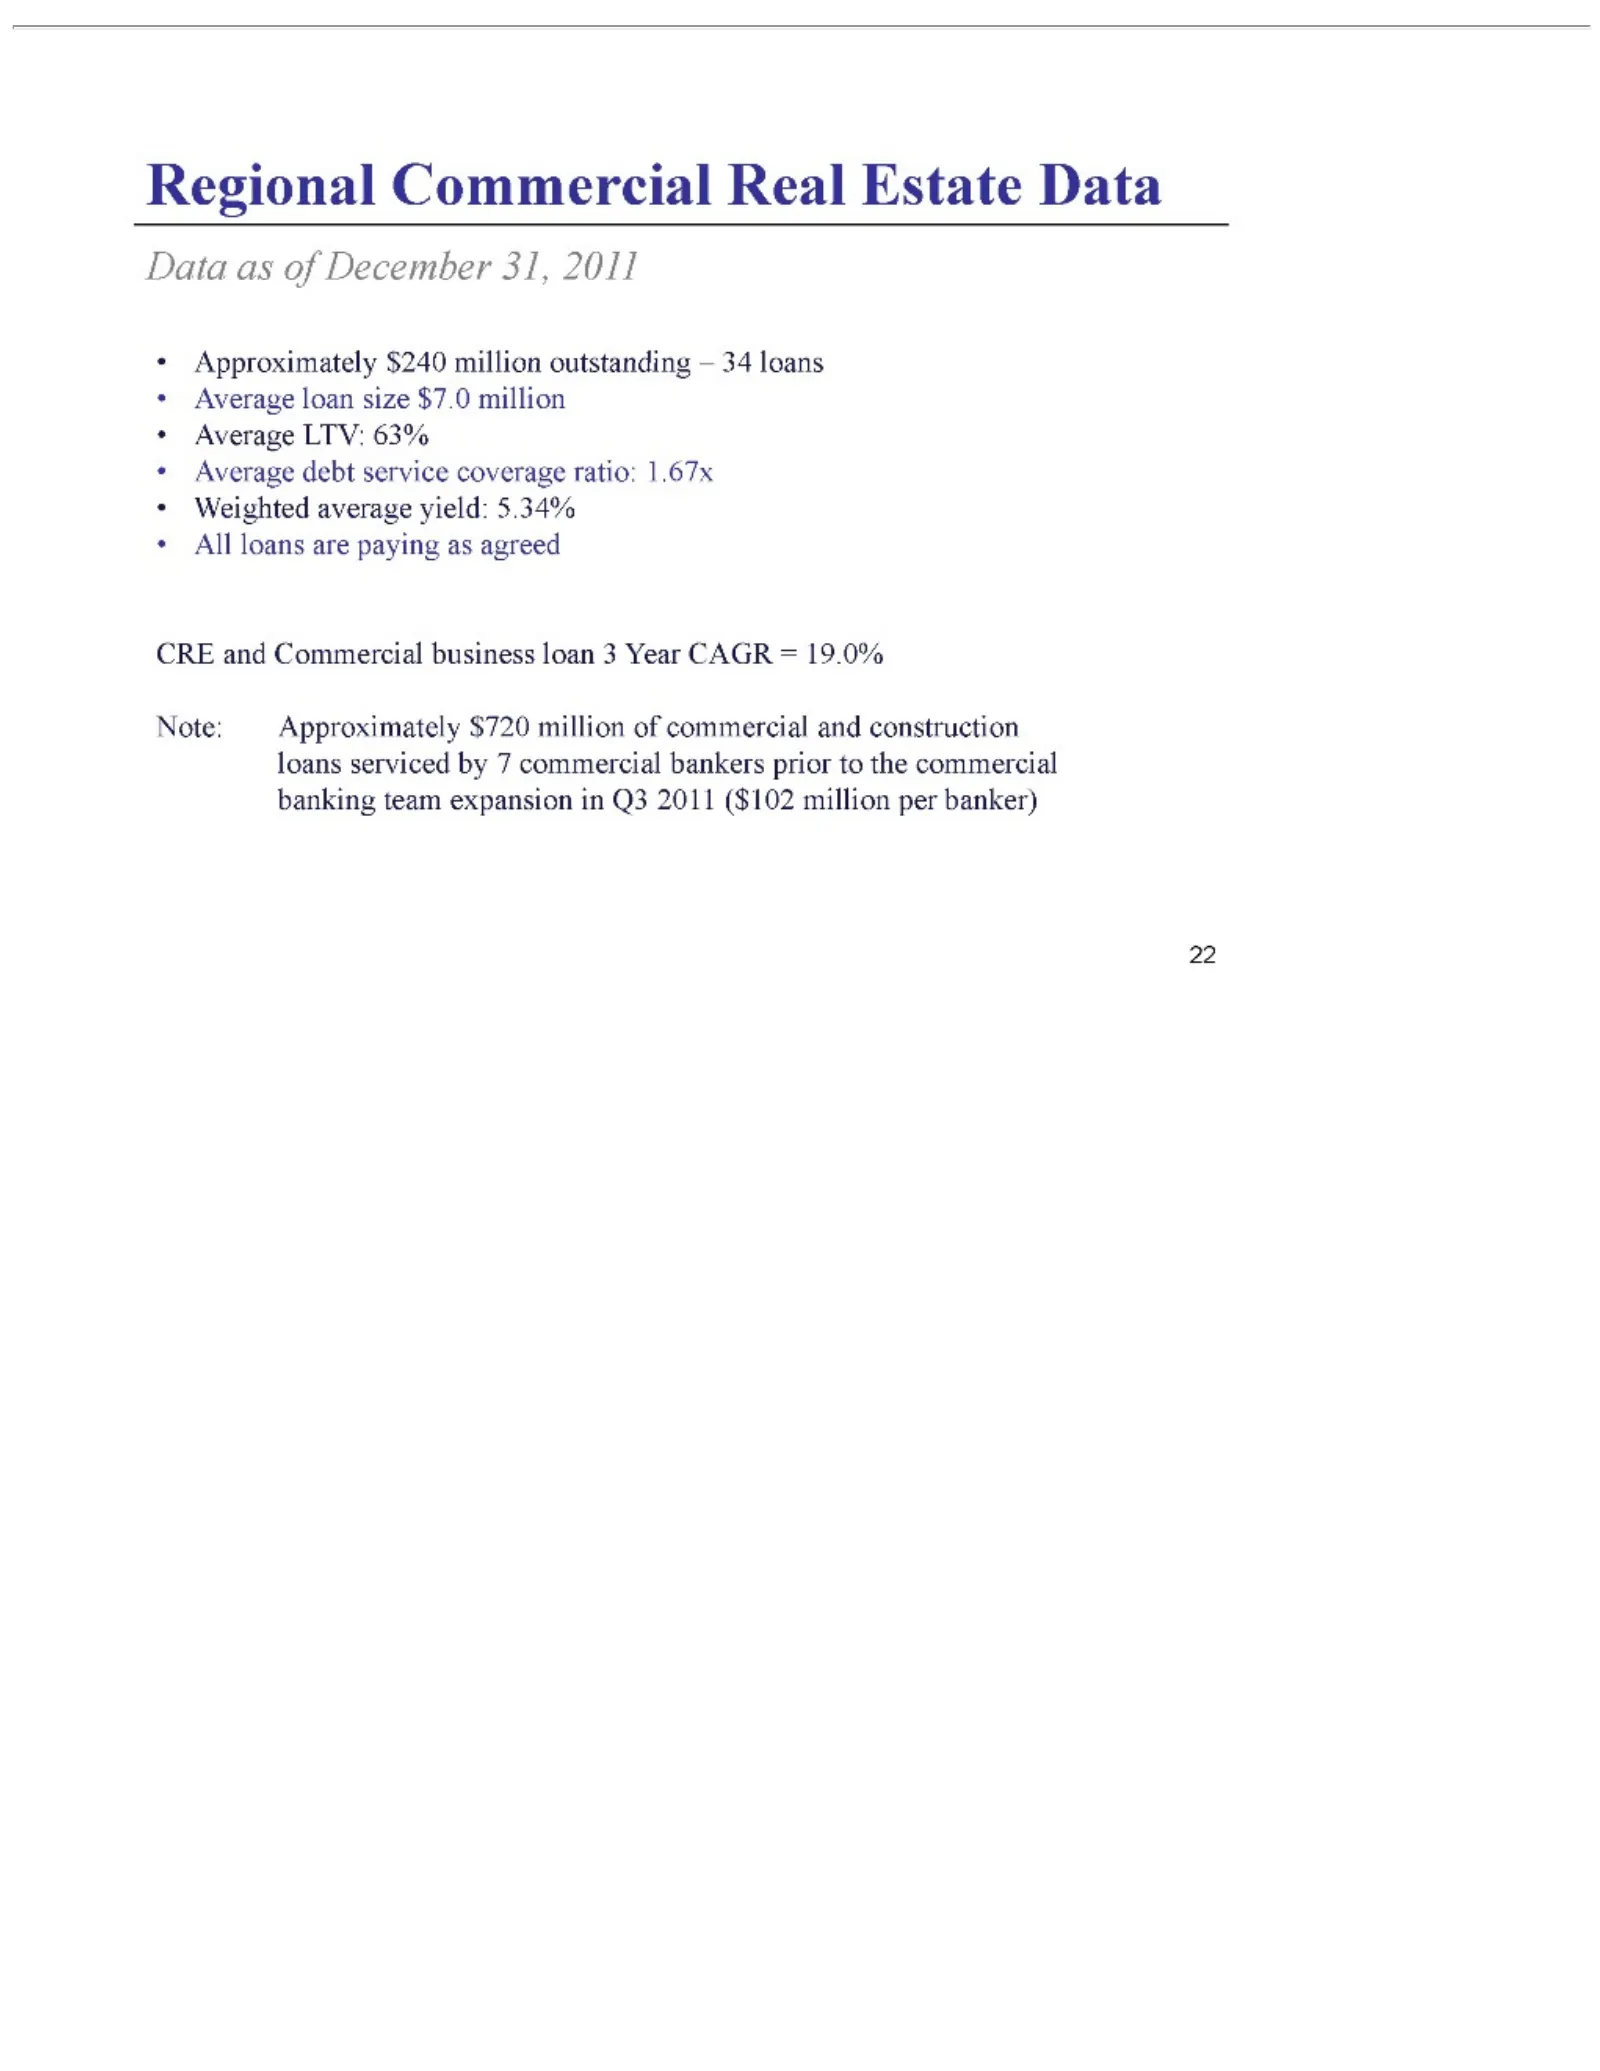
Slide 22: Regional CRE Data
Regional •Data CRE Note: 22 Approximately Average All Weighted loans as and Approximately ofCommercial loan LTV: debt December are average paying size service 63% $240 $7.0 yield: 31, $720 as Real business million coverage million agreed 2011 5.34% million Estate outstanding loan ratio: Data of3comm
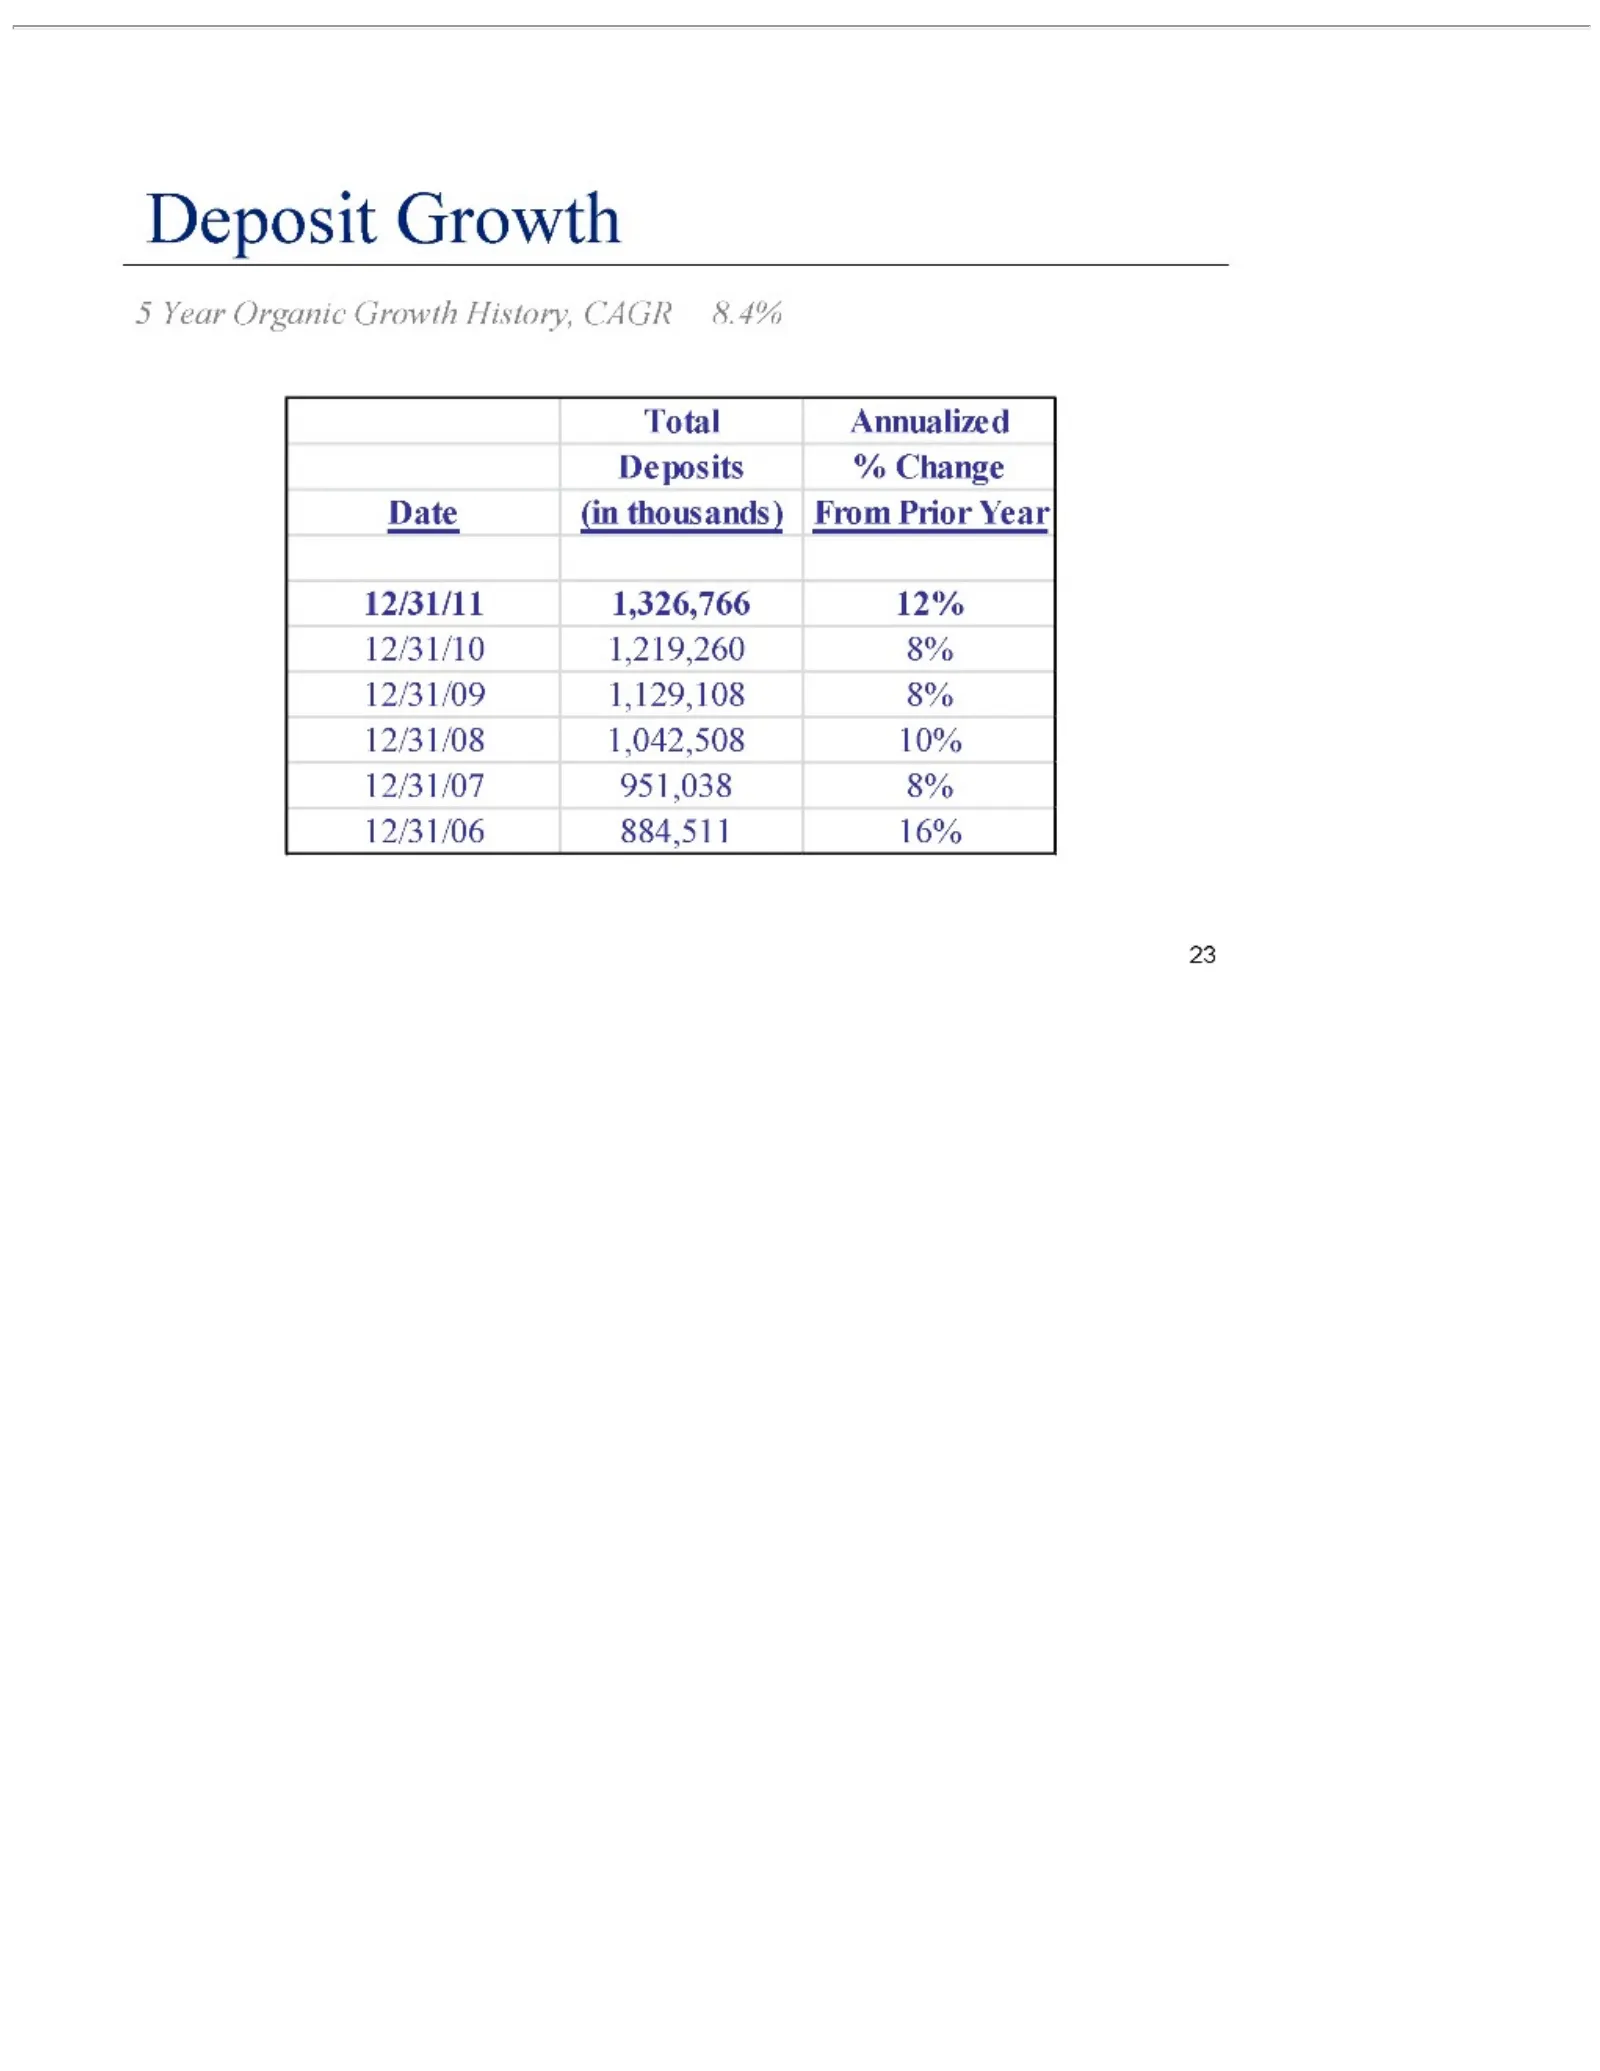
Slide 23: Deposit Growth
523 Deposit Total (in Deposits Date 12/31/11 12/31/10 12/31/09 12/31/08 12/31/07 12/31/06 Growth Year Annualized Organic thousands) % 1,326,766 1,219,260 1,129,108 1, 951,038 884,511 042,508 Change 16% 8% 12% 8% Growth From 10% History, CAGR = 8.4% Prior Year
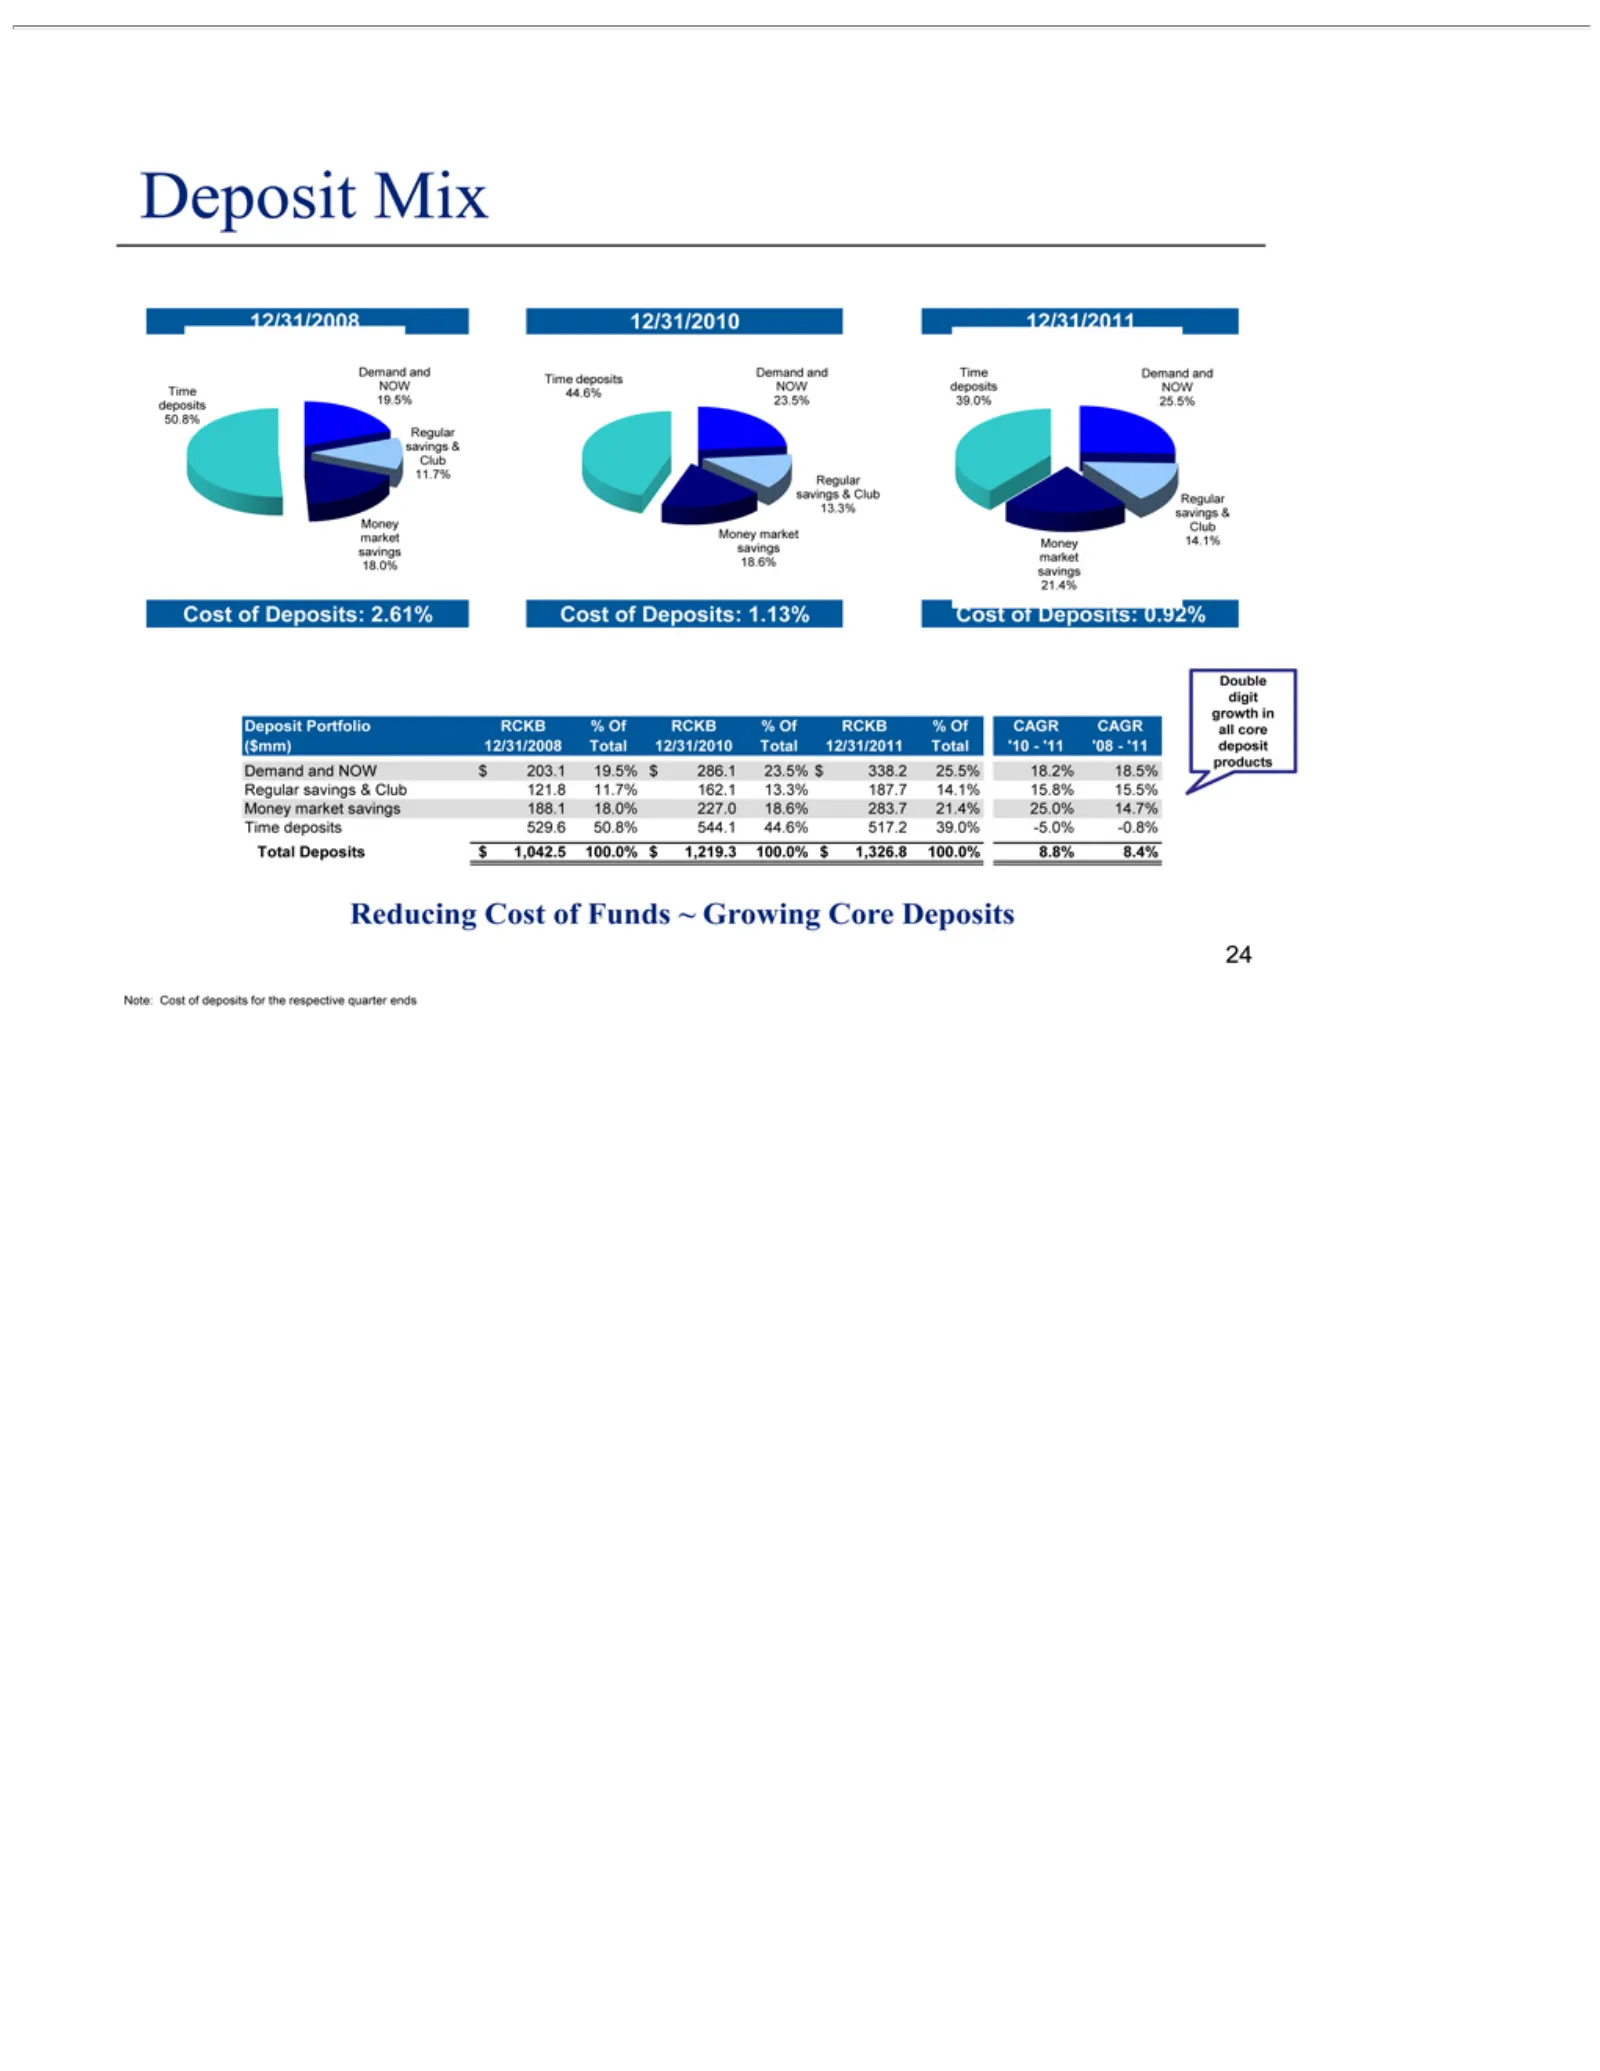
Slide 24: Deposit Mix and Cost of Deposits
12/31/2011 12/31/2010 12/31/2008 Cost 21.4% Deposit ($mm) Demand Regular Money Time Total Double Reducing Note: 24 of Deposits deposits Cost 12/31/2008 market Deposits: digit Mix Portfolio savings and Cost ofgrowth NOW deposits 529.6 $savings of& 1,042.5 RCKB 2.61% 1.13% 0.92% Funds Club Total $50.8
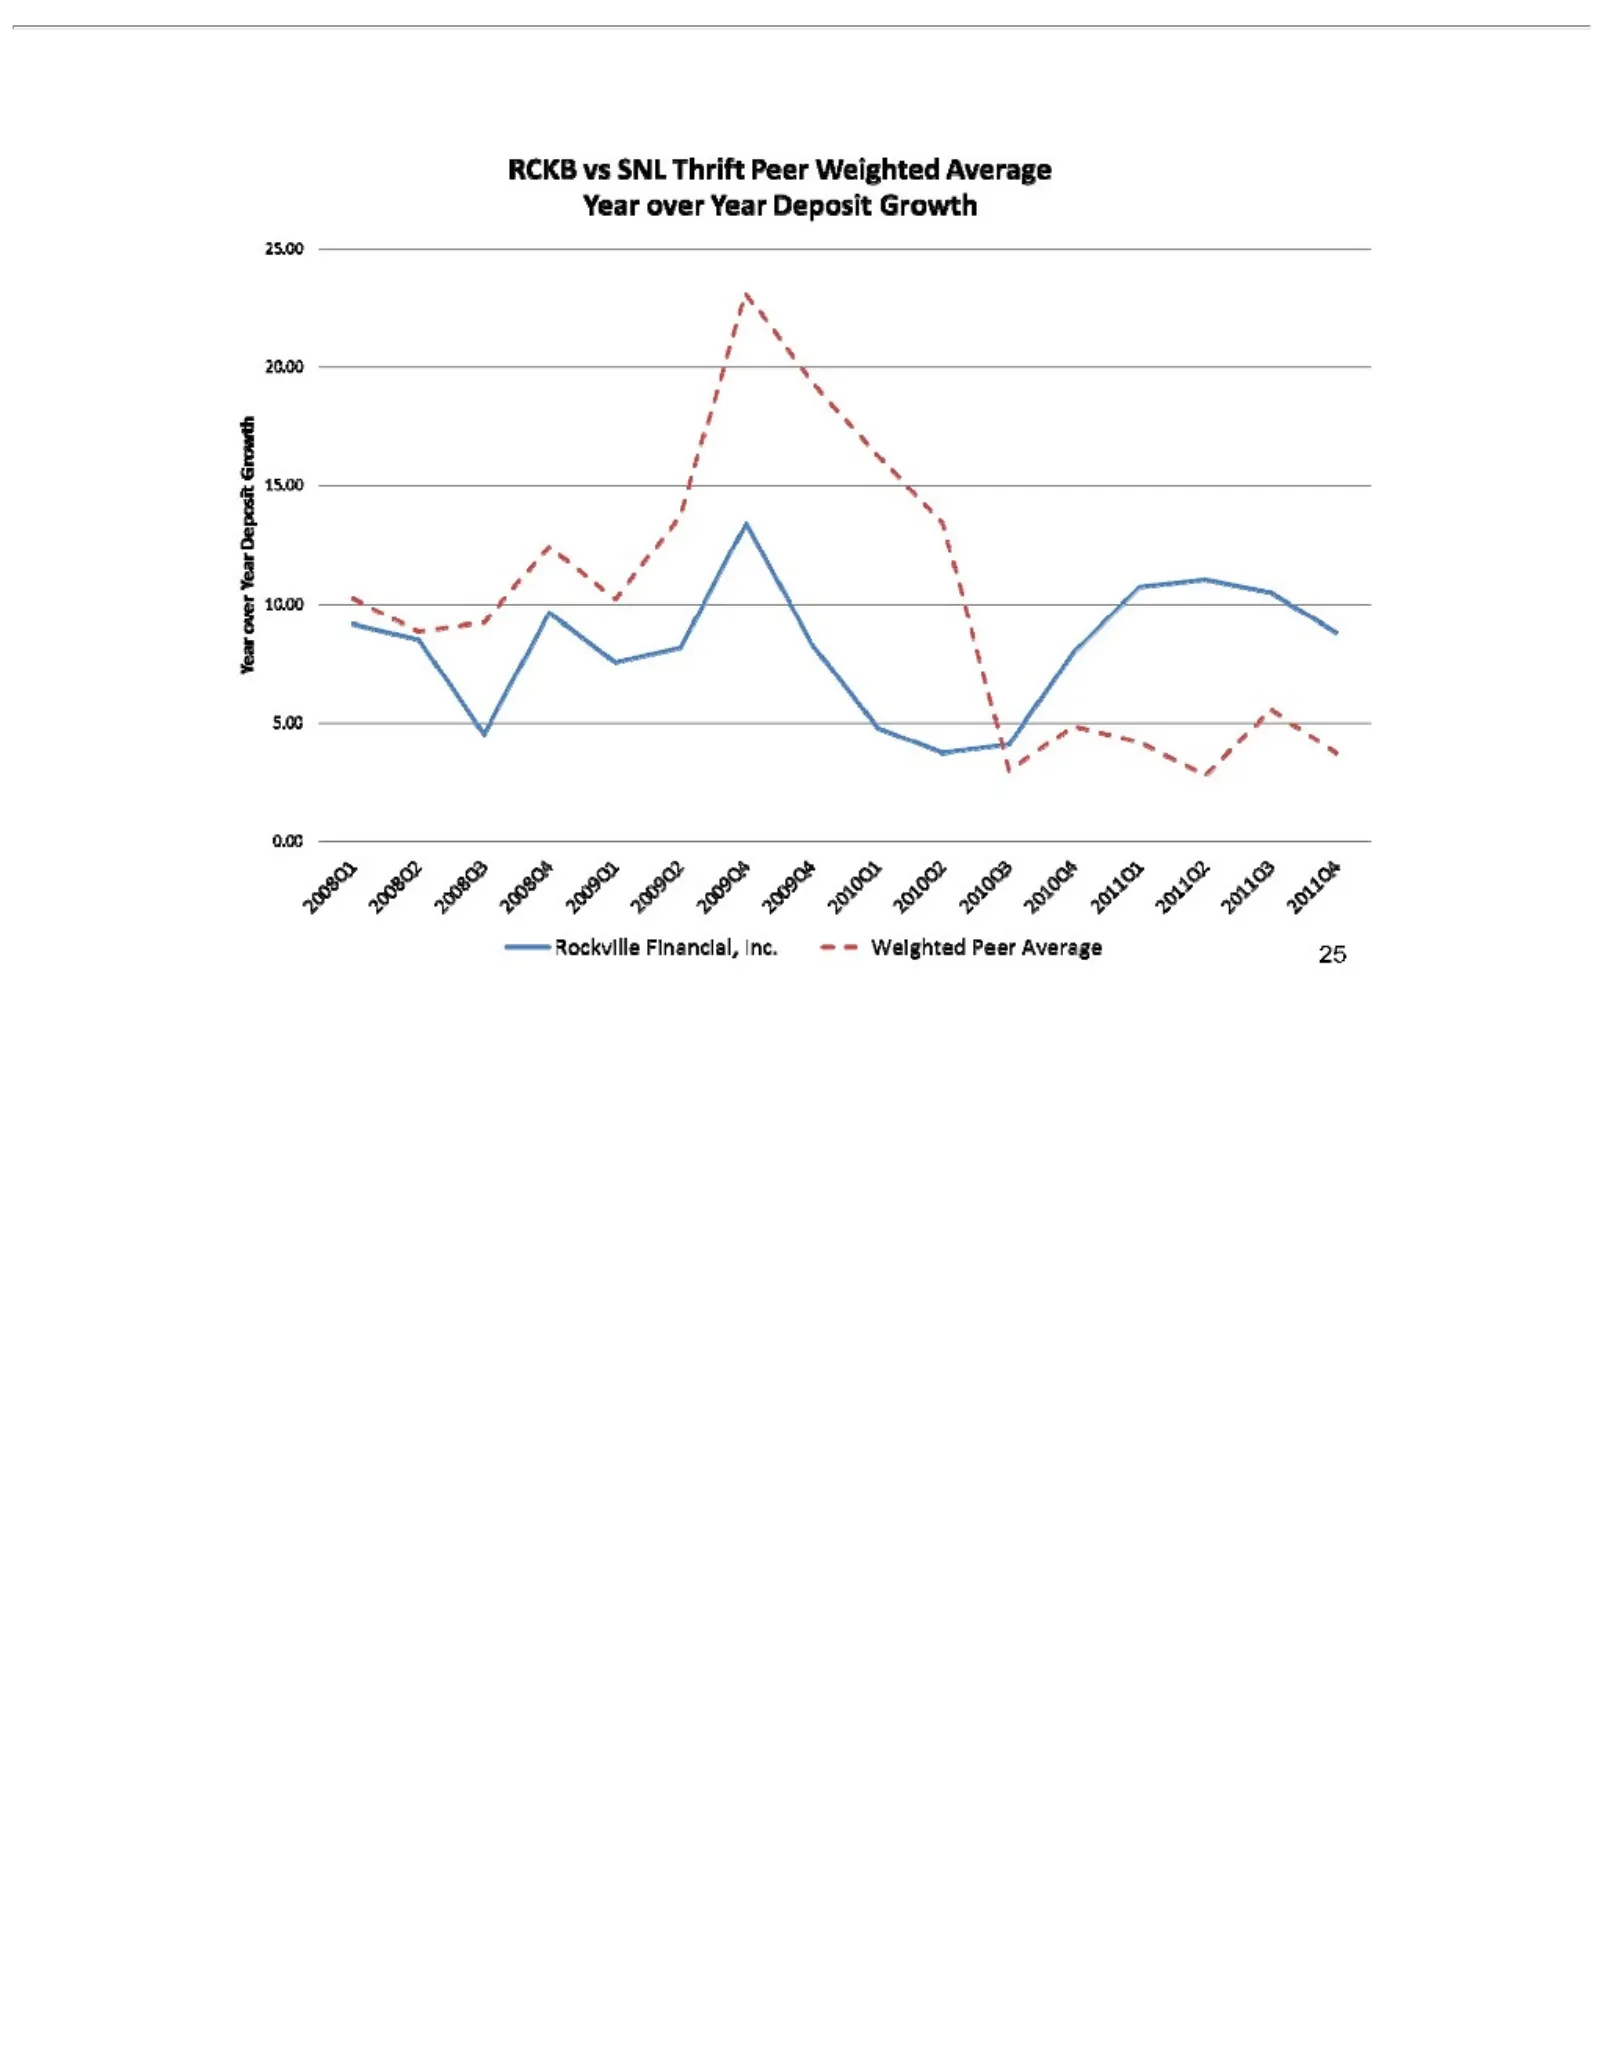
Slide 25: Year over Year Deposit Growth vs Peers
28.00 20.00 PEP EEEPPPEEBEEES RCKB vs SNL Thrift Peer Weighted Average Year over Year Deposit Growth mr Rockville Financial, inc. = = Welghted Peer Average 25
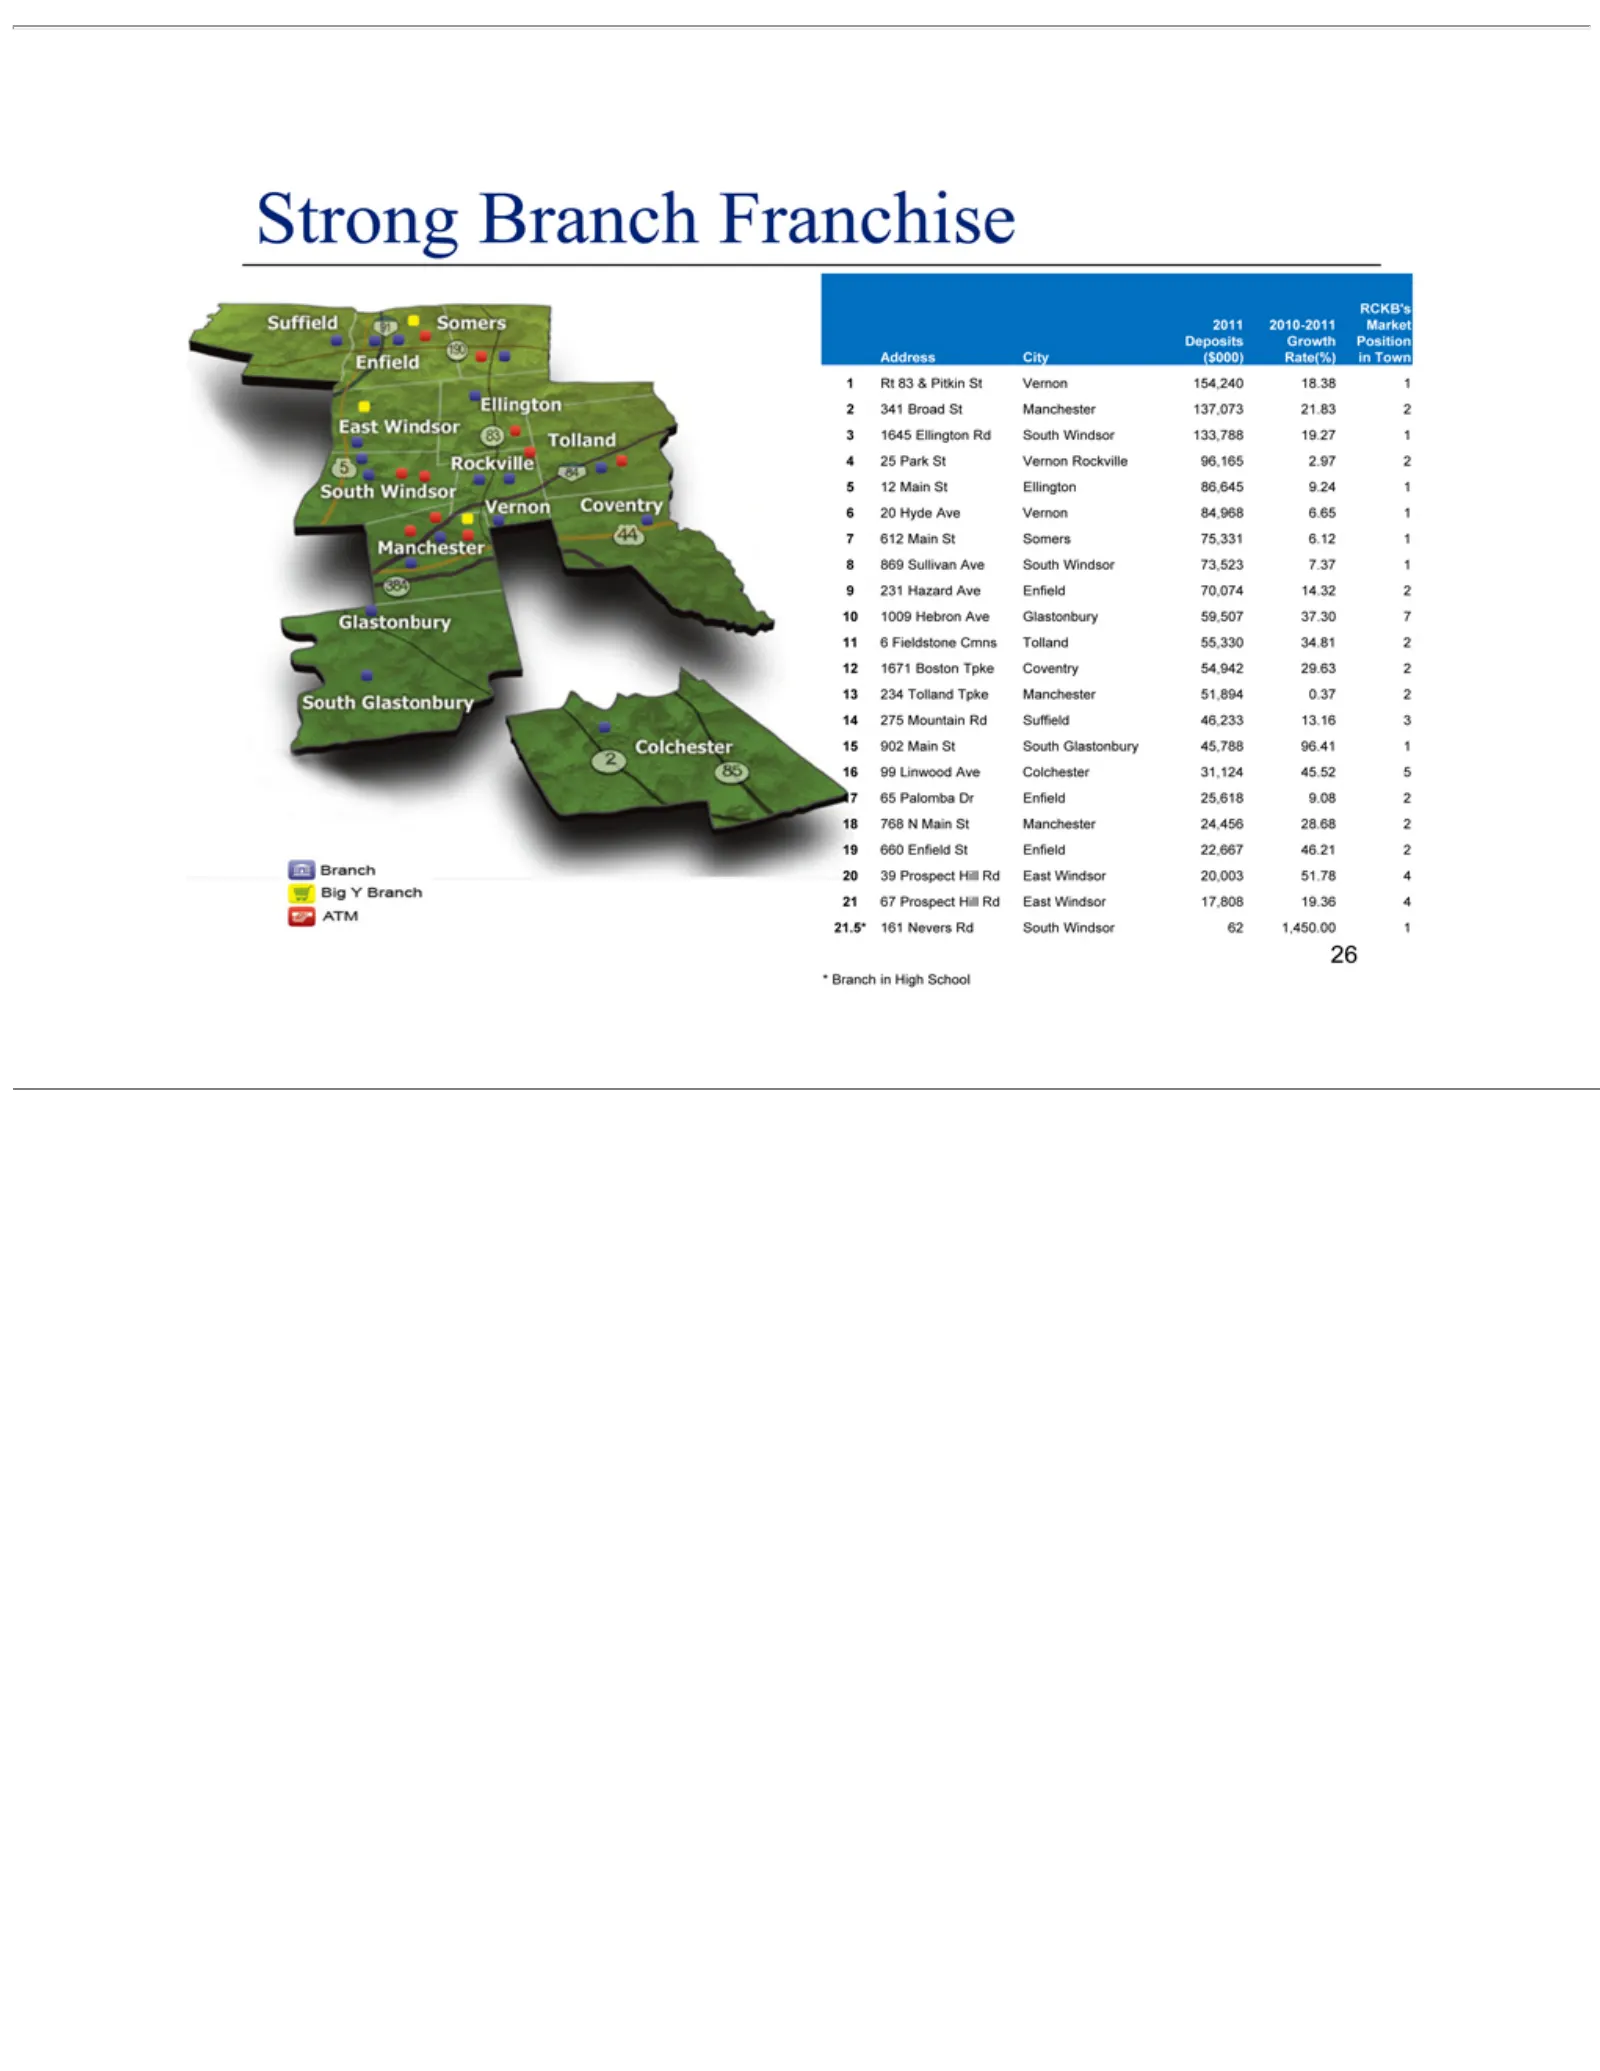
Slide 26: Strong Franchise and Market Position
Strong 2011 RCKB’s Deposits 4321Address 2010-2011 Branch City Growth Rt 34183 1645($000) Franchise &Market Position BroadPitkin Rate(%) St Ellington St RdVernon in84,968 ManchesterTown South 154,240 137,073 Windsor 18.38 21.83 122 19.27 1 98765 231 10 11 12 13 14 15 16 17 18 19 20 21 *21.5* 26 667 1
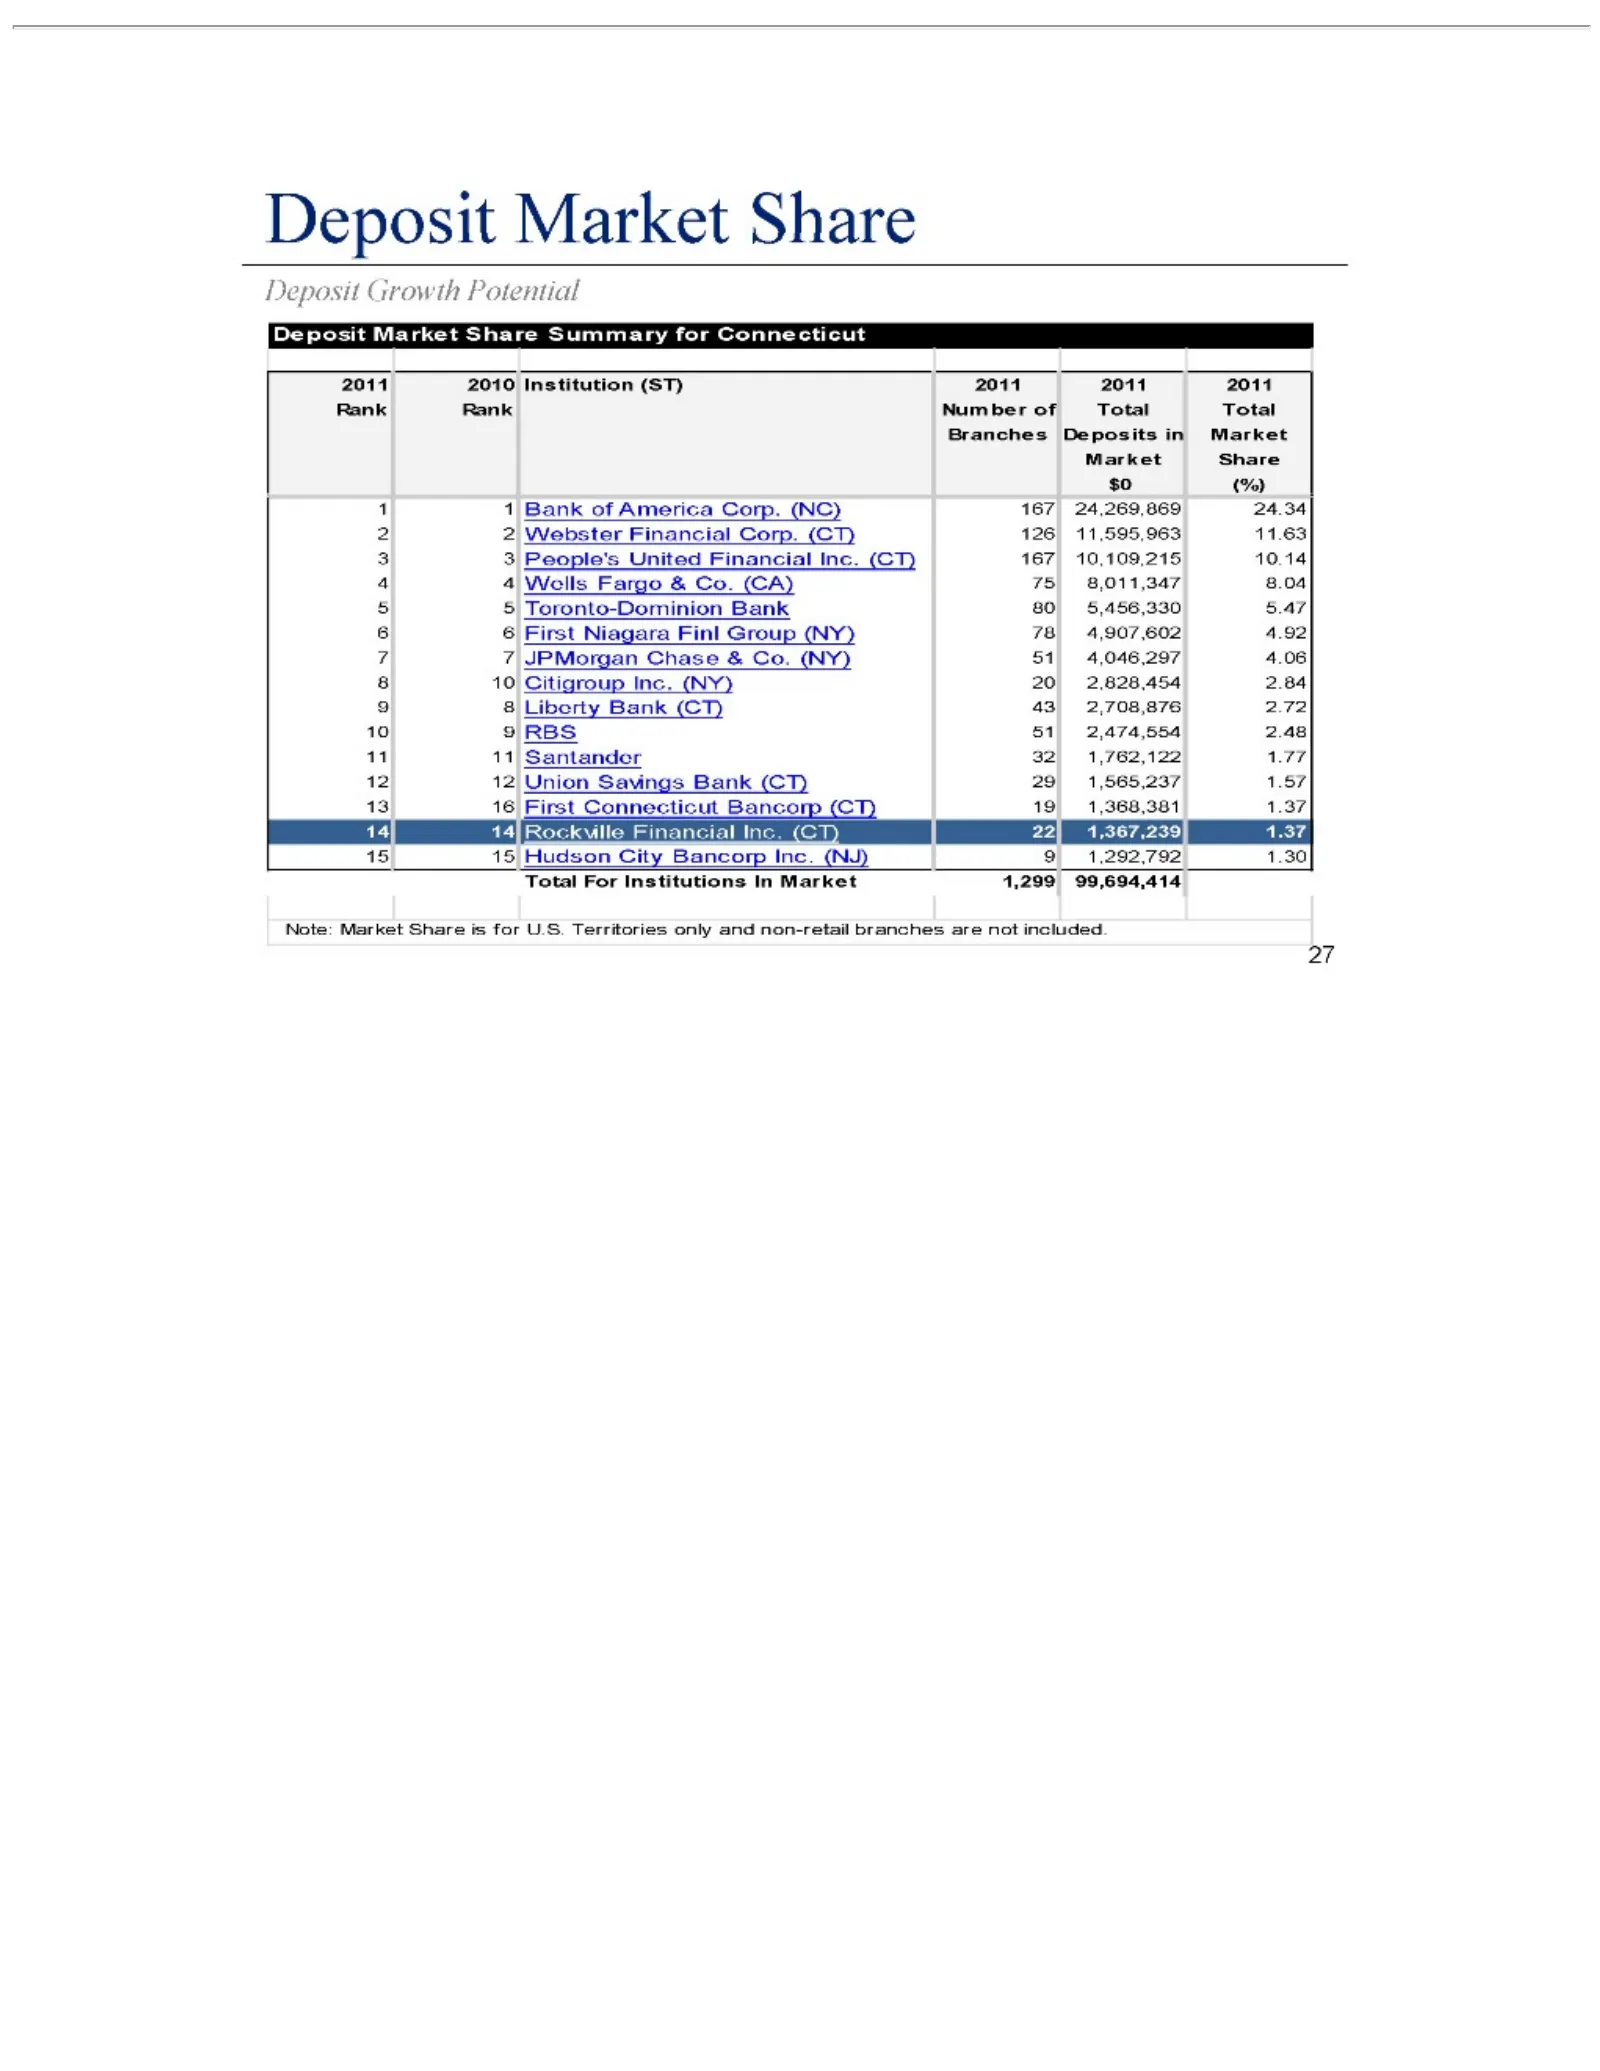
Slide 27: Deposit Market Share
Deposit 2011 Rank Branches Market 21$0 (%)2010 Rank Share Growth Market Deposits 21Institution Number BankShare WebsterPotential ofinAmerica ofMarket (ST) Summary Total Financial 2011 Total Corp. 2011 for(NC) Corp. Connecticut 2011 (CT) 167 126 24,269,869 11,595,963 24.34 11.63 10.14 7654327 98 811
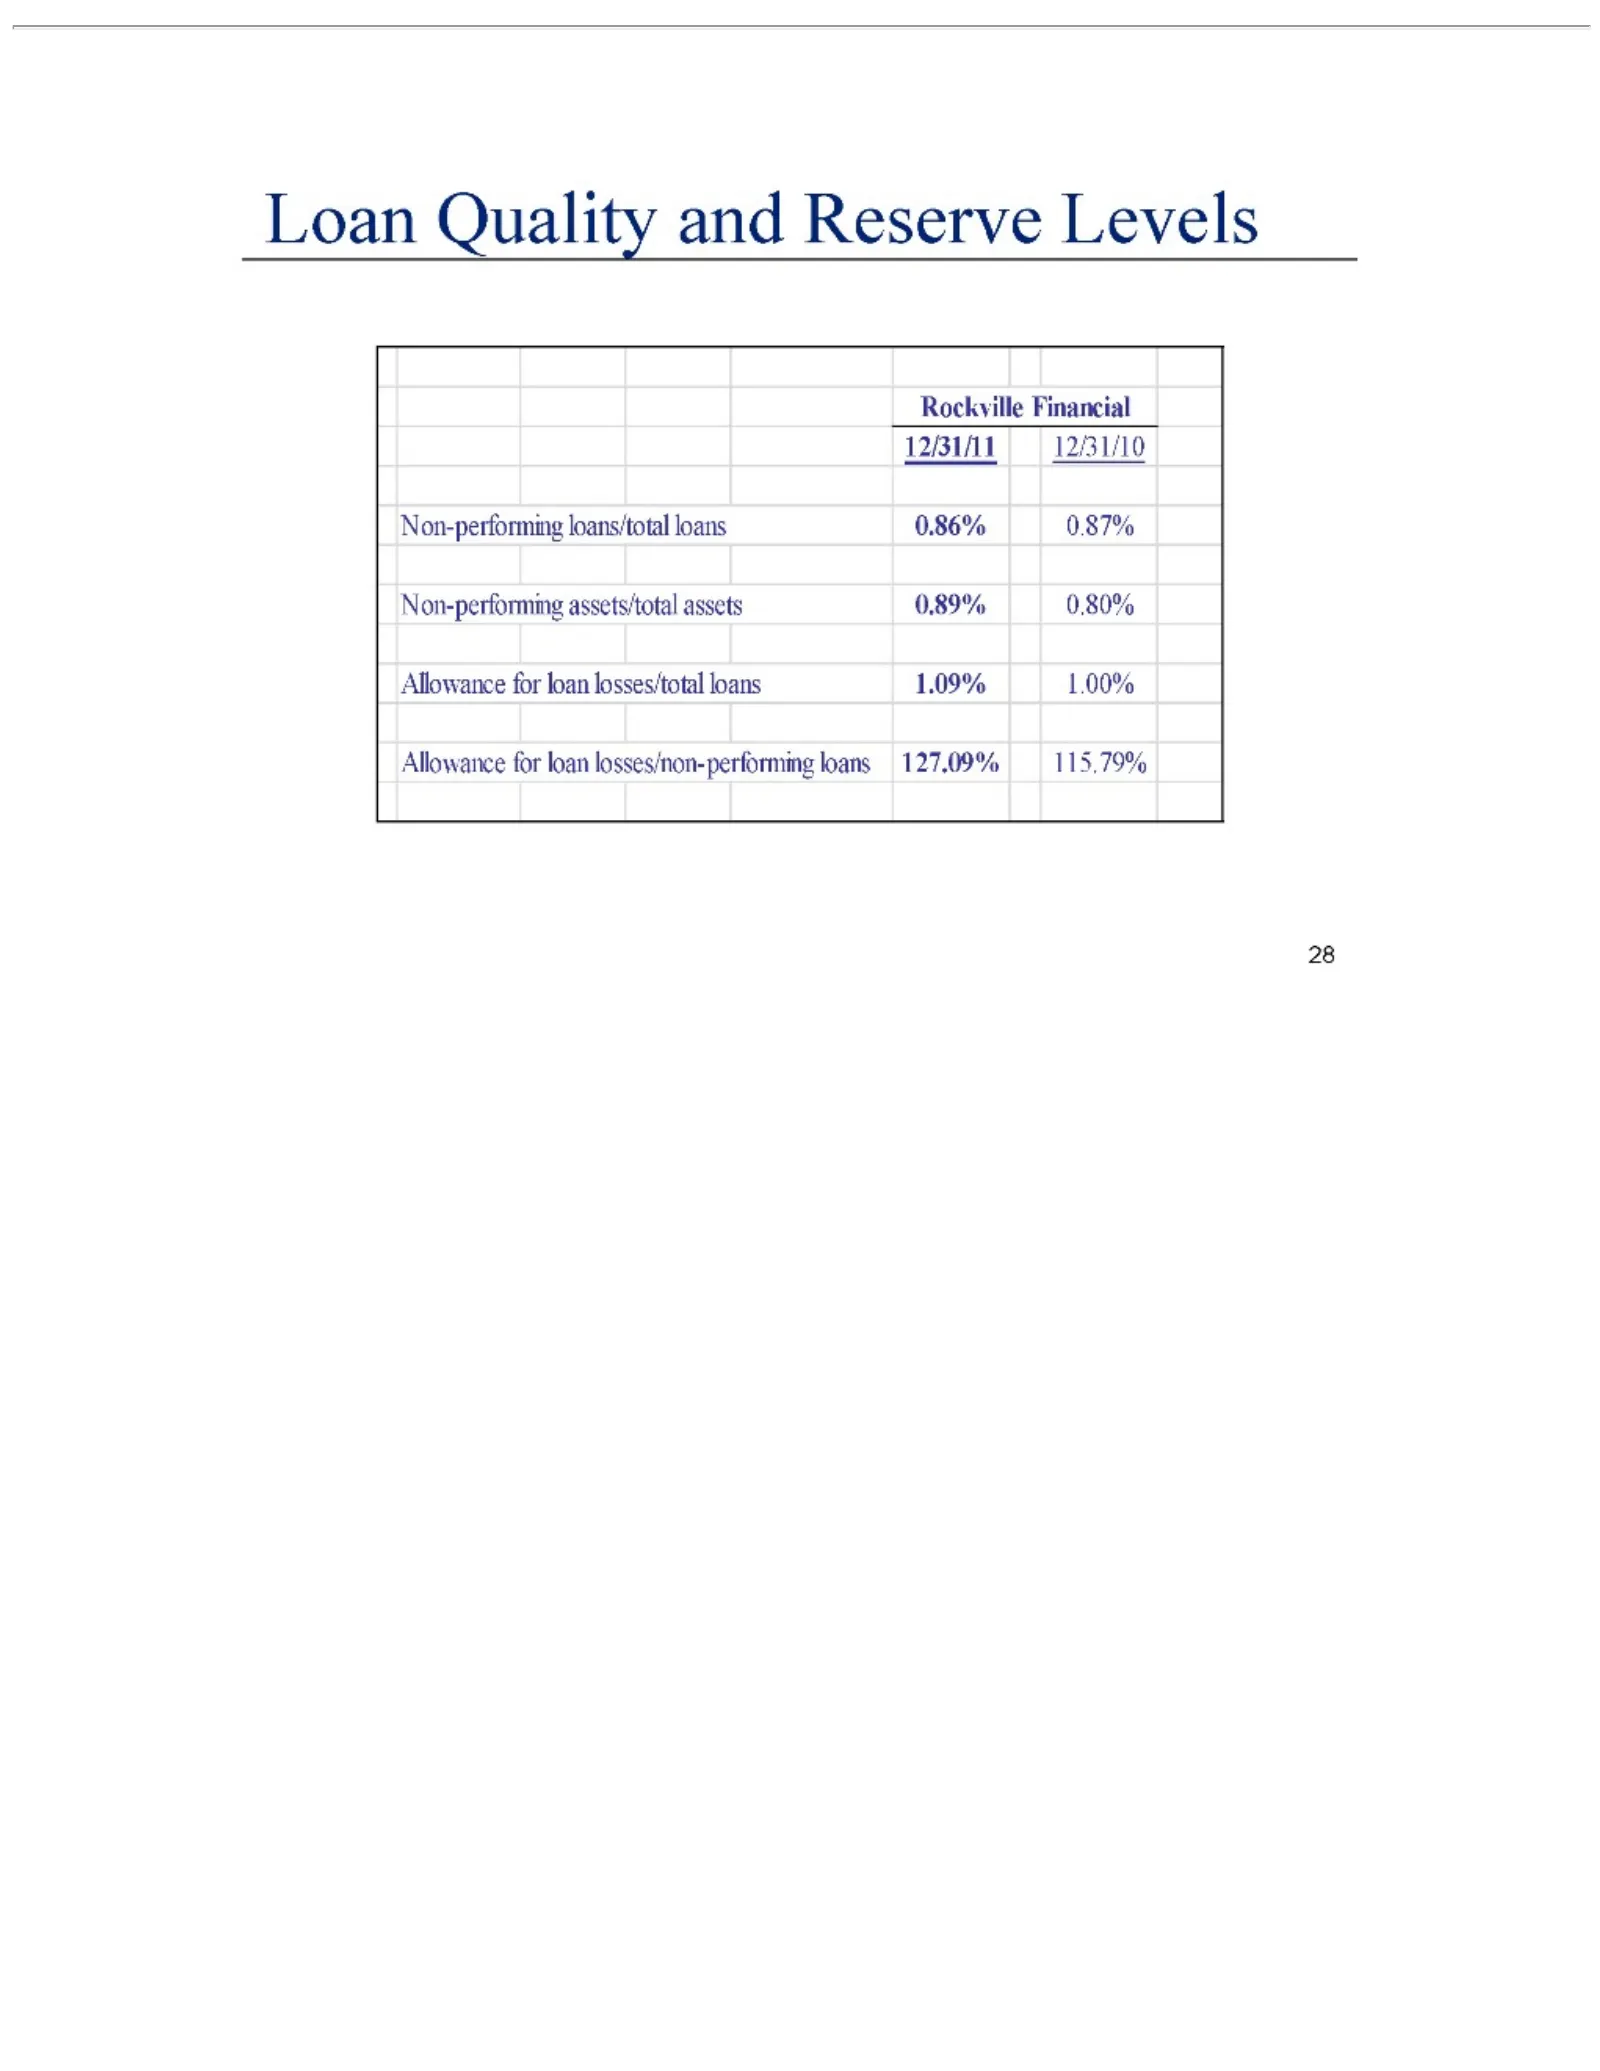
Slide 28: Loan Quality
Loan Quality Rockville 12/31/11 Non-performing Allowance 28 12/31/10 Financial forand loan loans/total assets/total Reserve losses/total losses/non-performing Levels loans assets loans 0.86% 0.89% 1.09% 0.87% 0.80% loans 1.00% 127.09% 115.79%
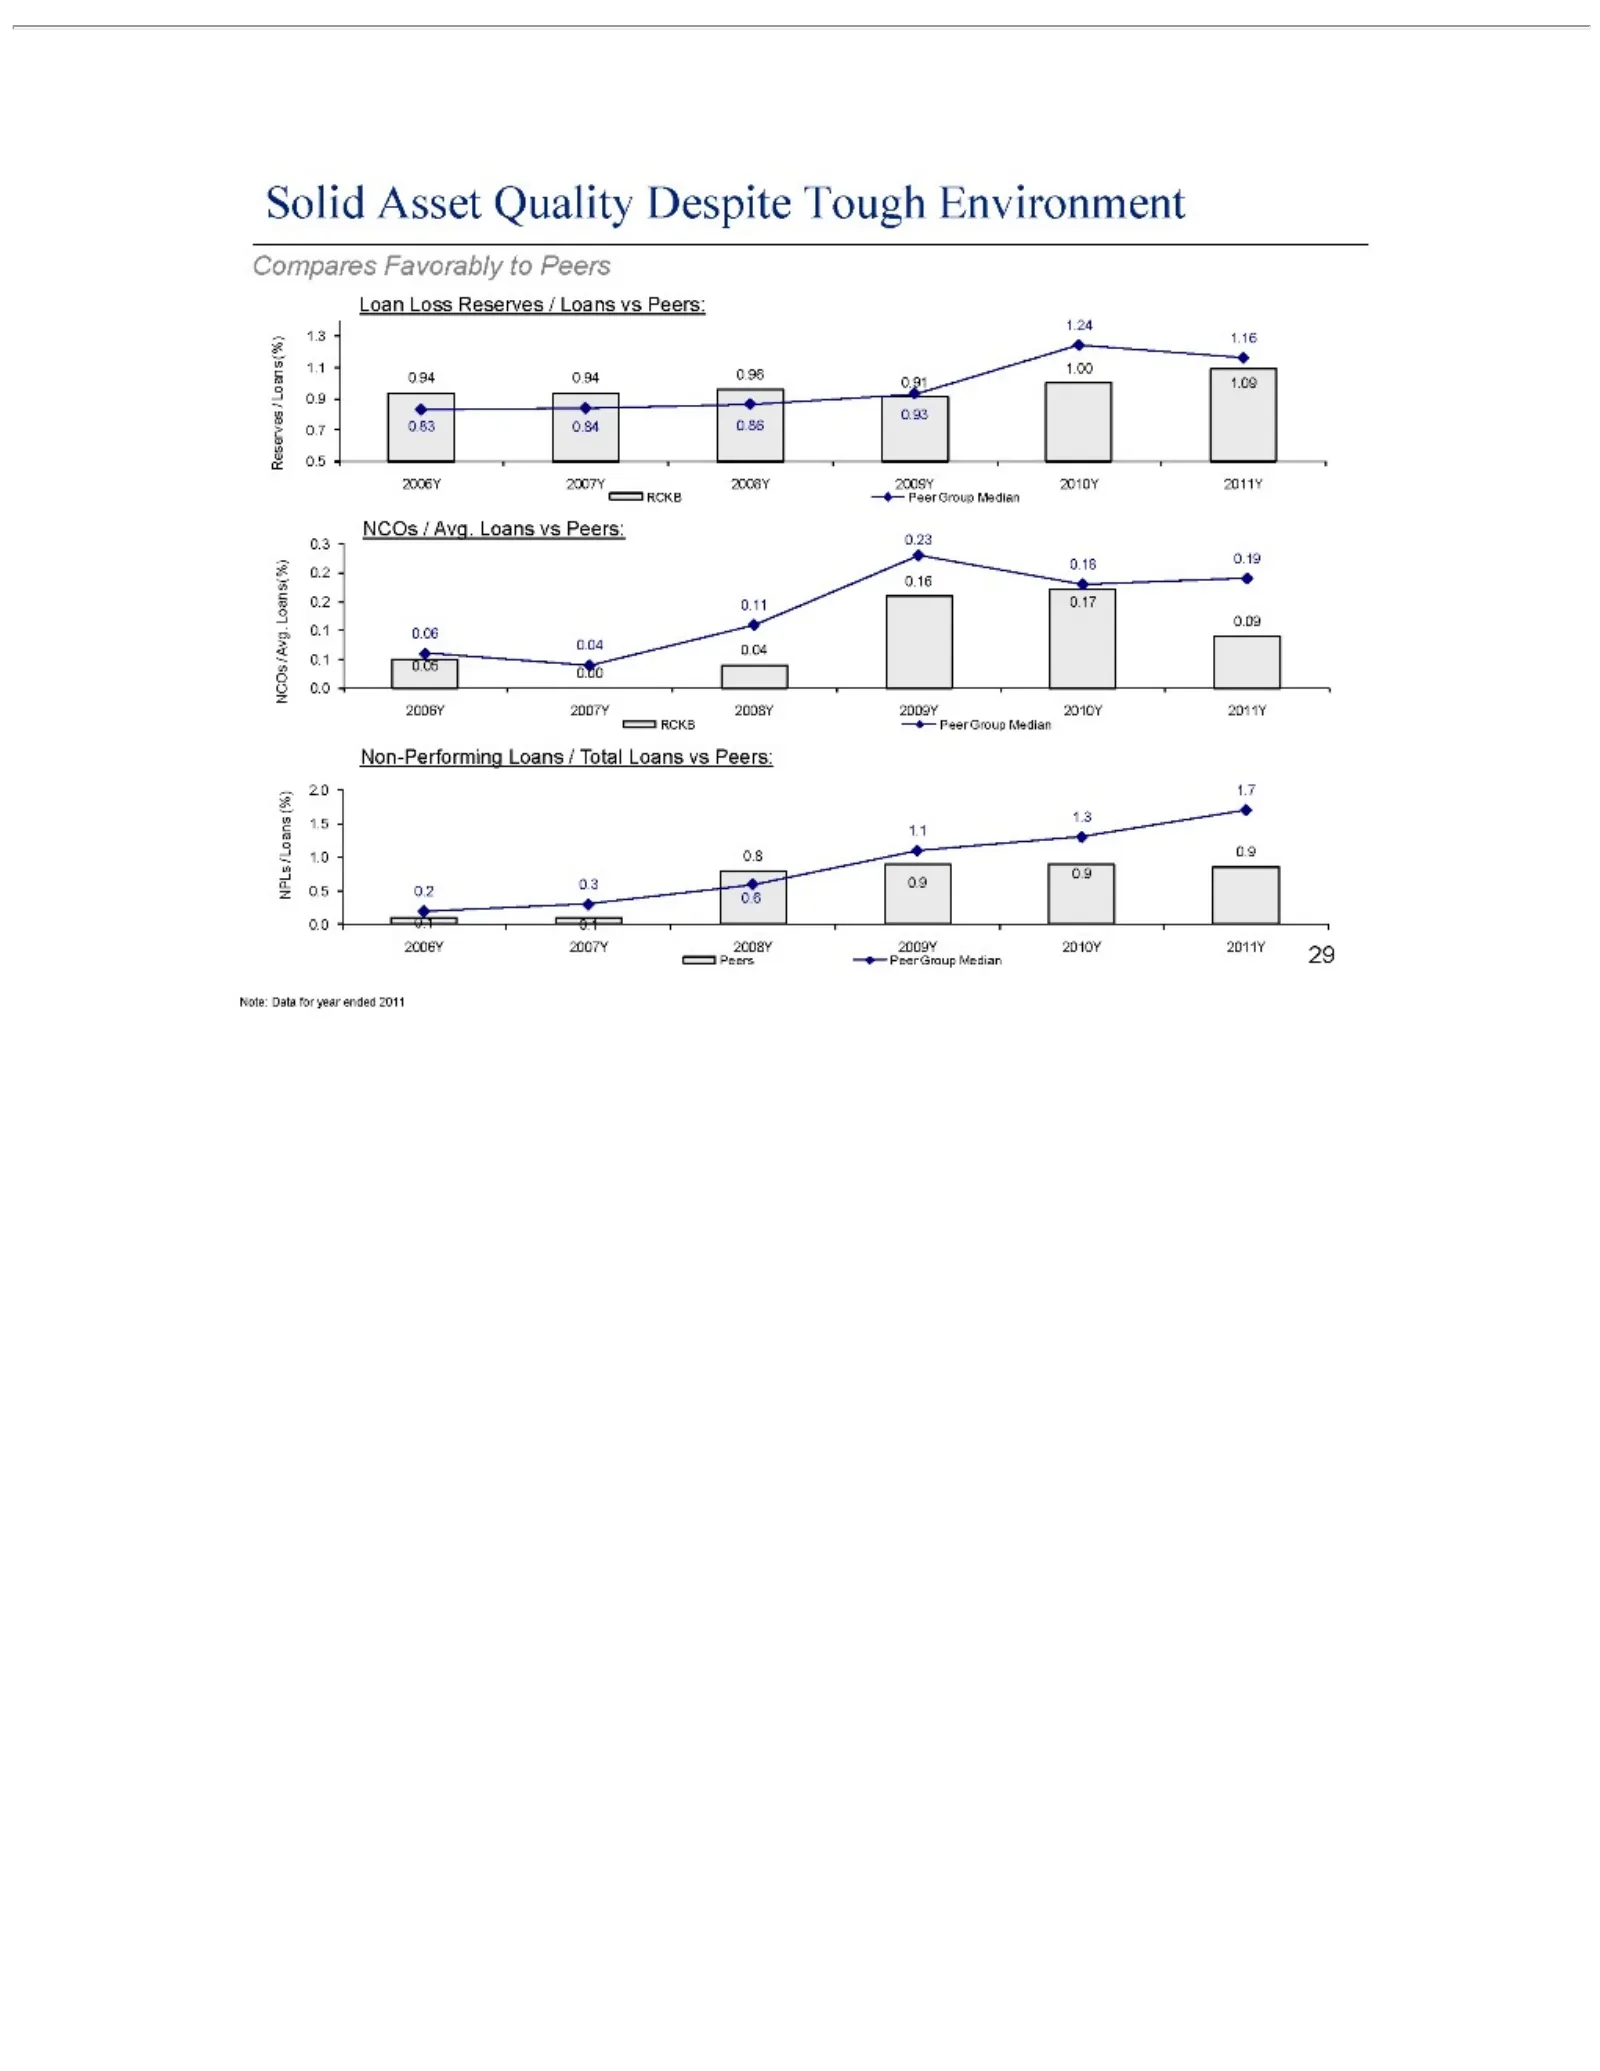
Slide 29: Asset Quality Compares Favorably vs Peers
Solid Loss Compares Loan NCOs Non-Performing Note: 29 Asset Data / Avg. Favorably Reserves for Quality Loans year Loans ended Despite vs /to Loans Peers: /Peers Total 2011 Tough vsLoans Peers: Environment vs Peers:
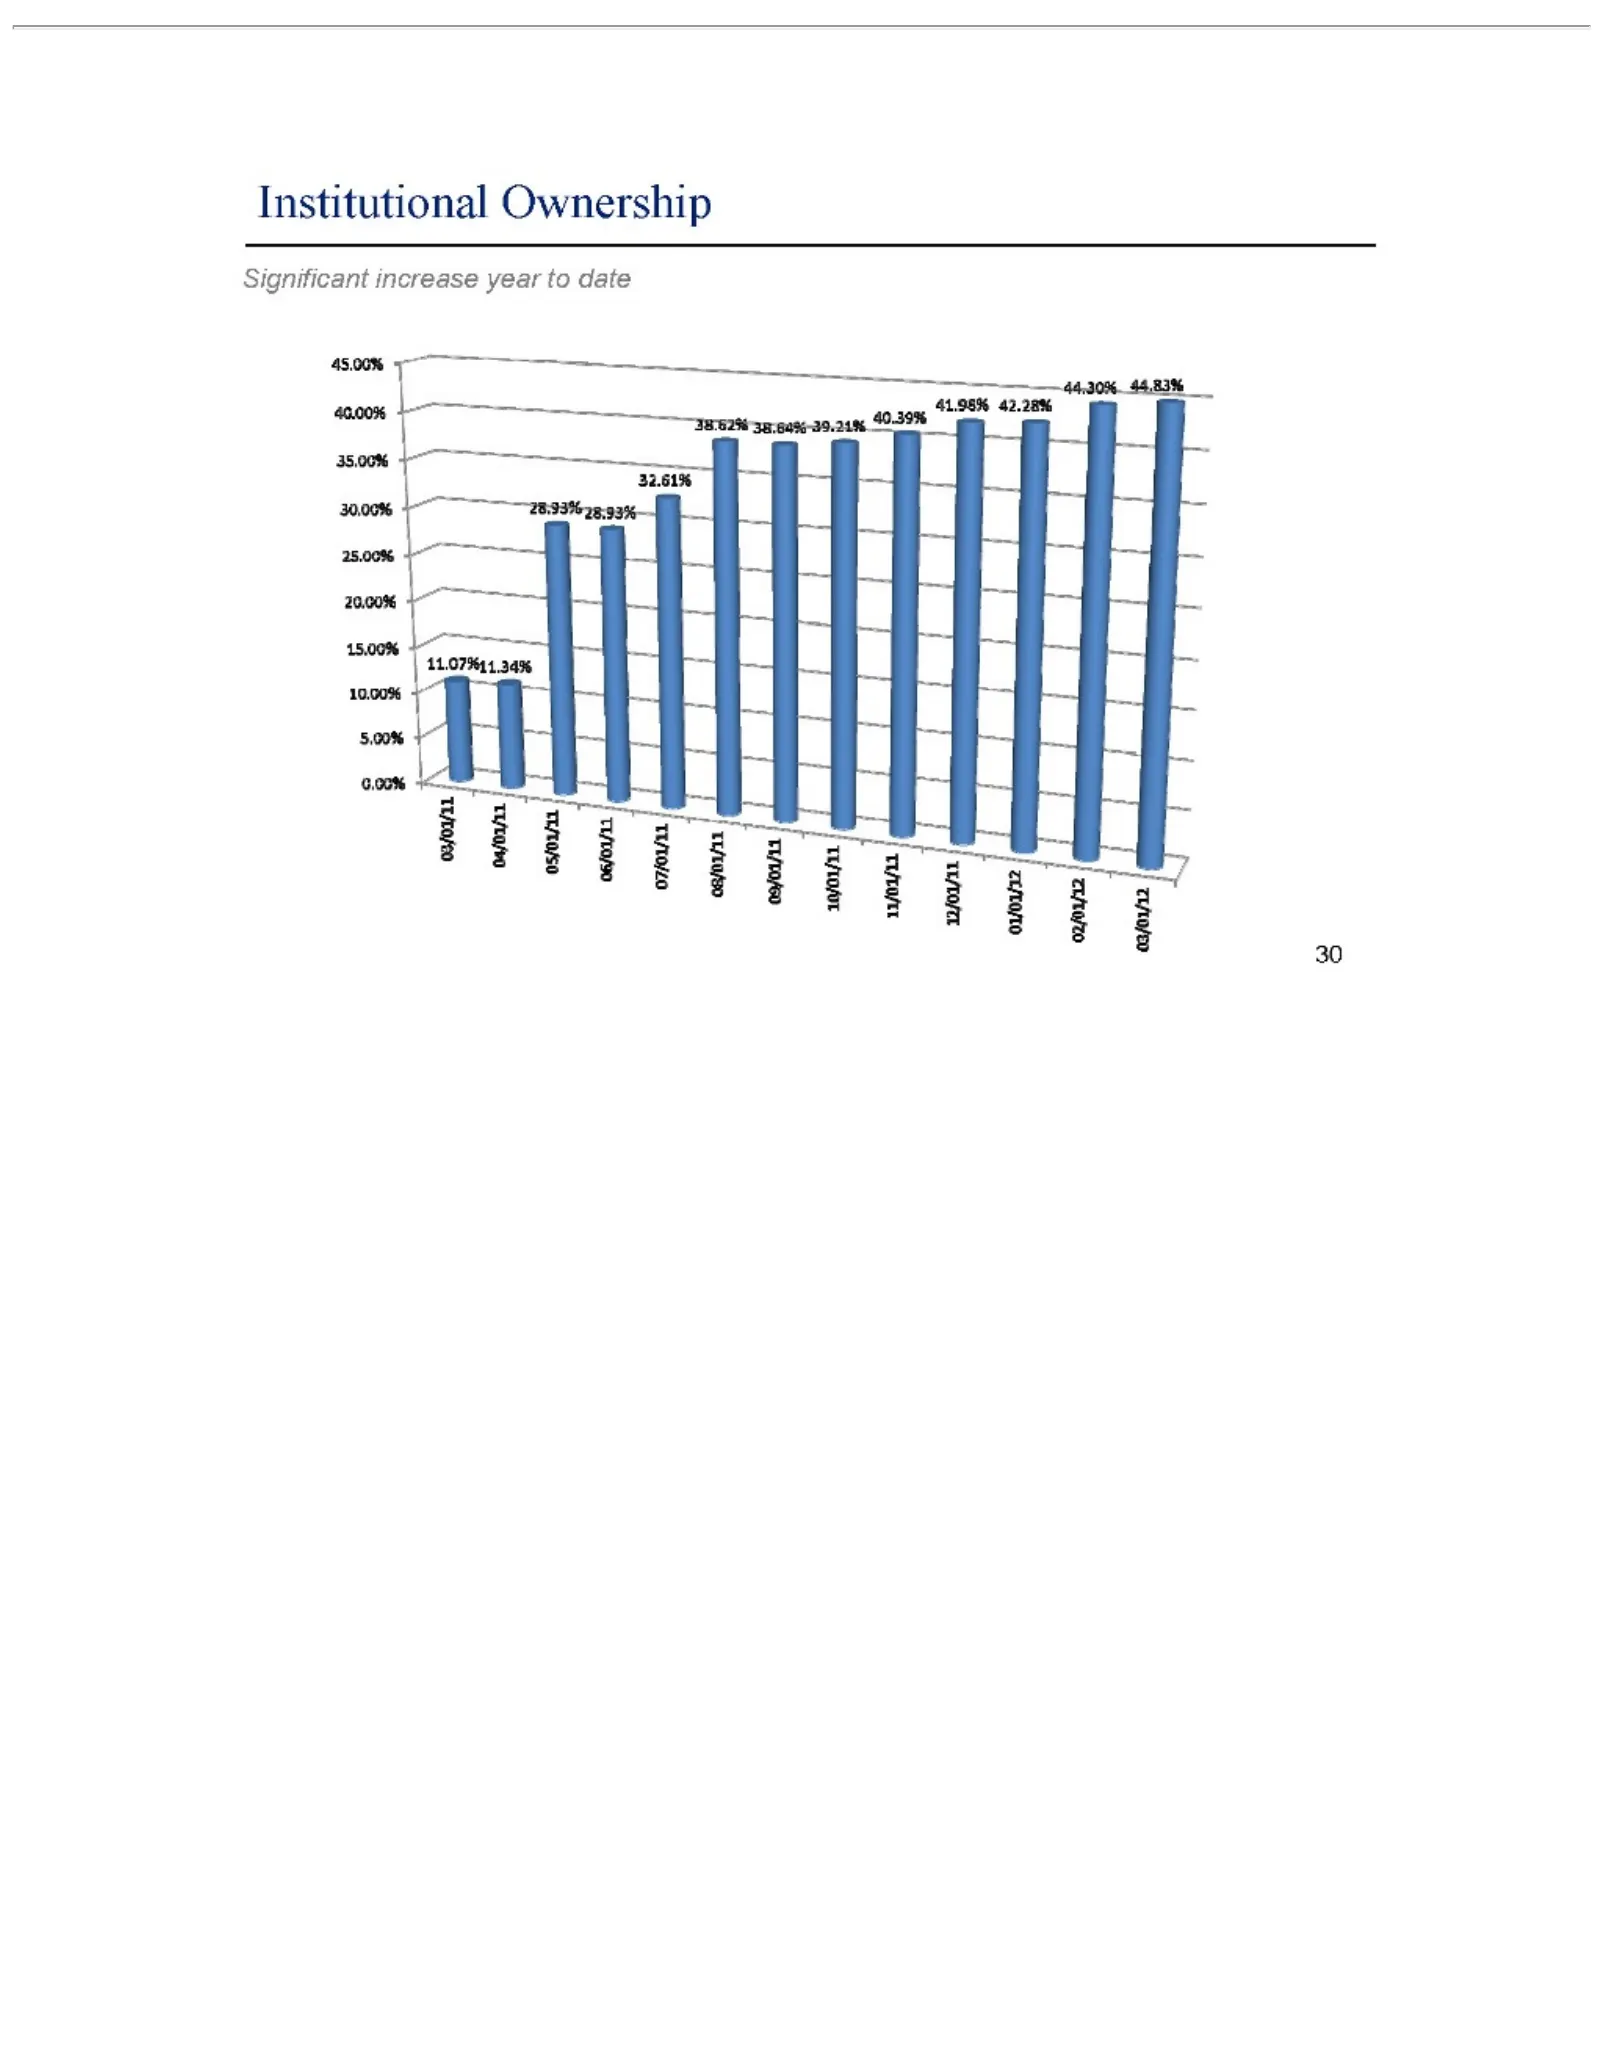
Slide 30: Significant Institutional Ownership
Institutionalincrease Significant 30 Ownership year to date
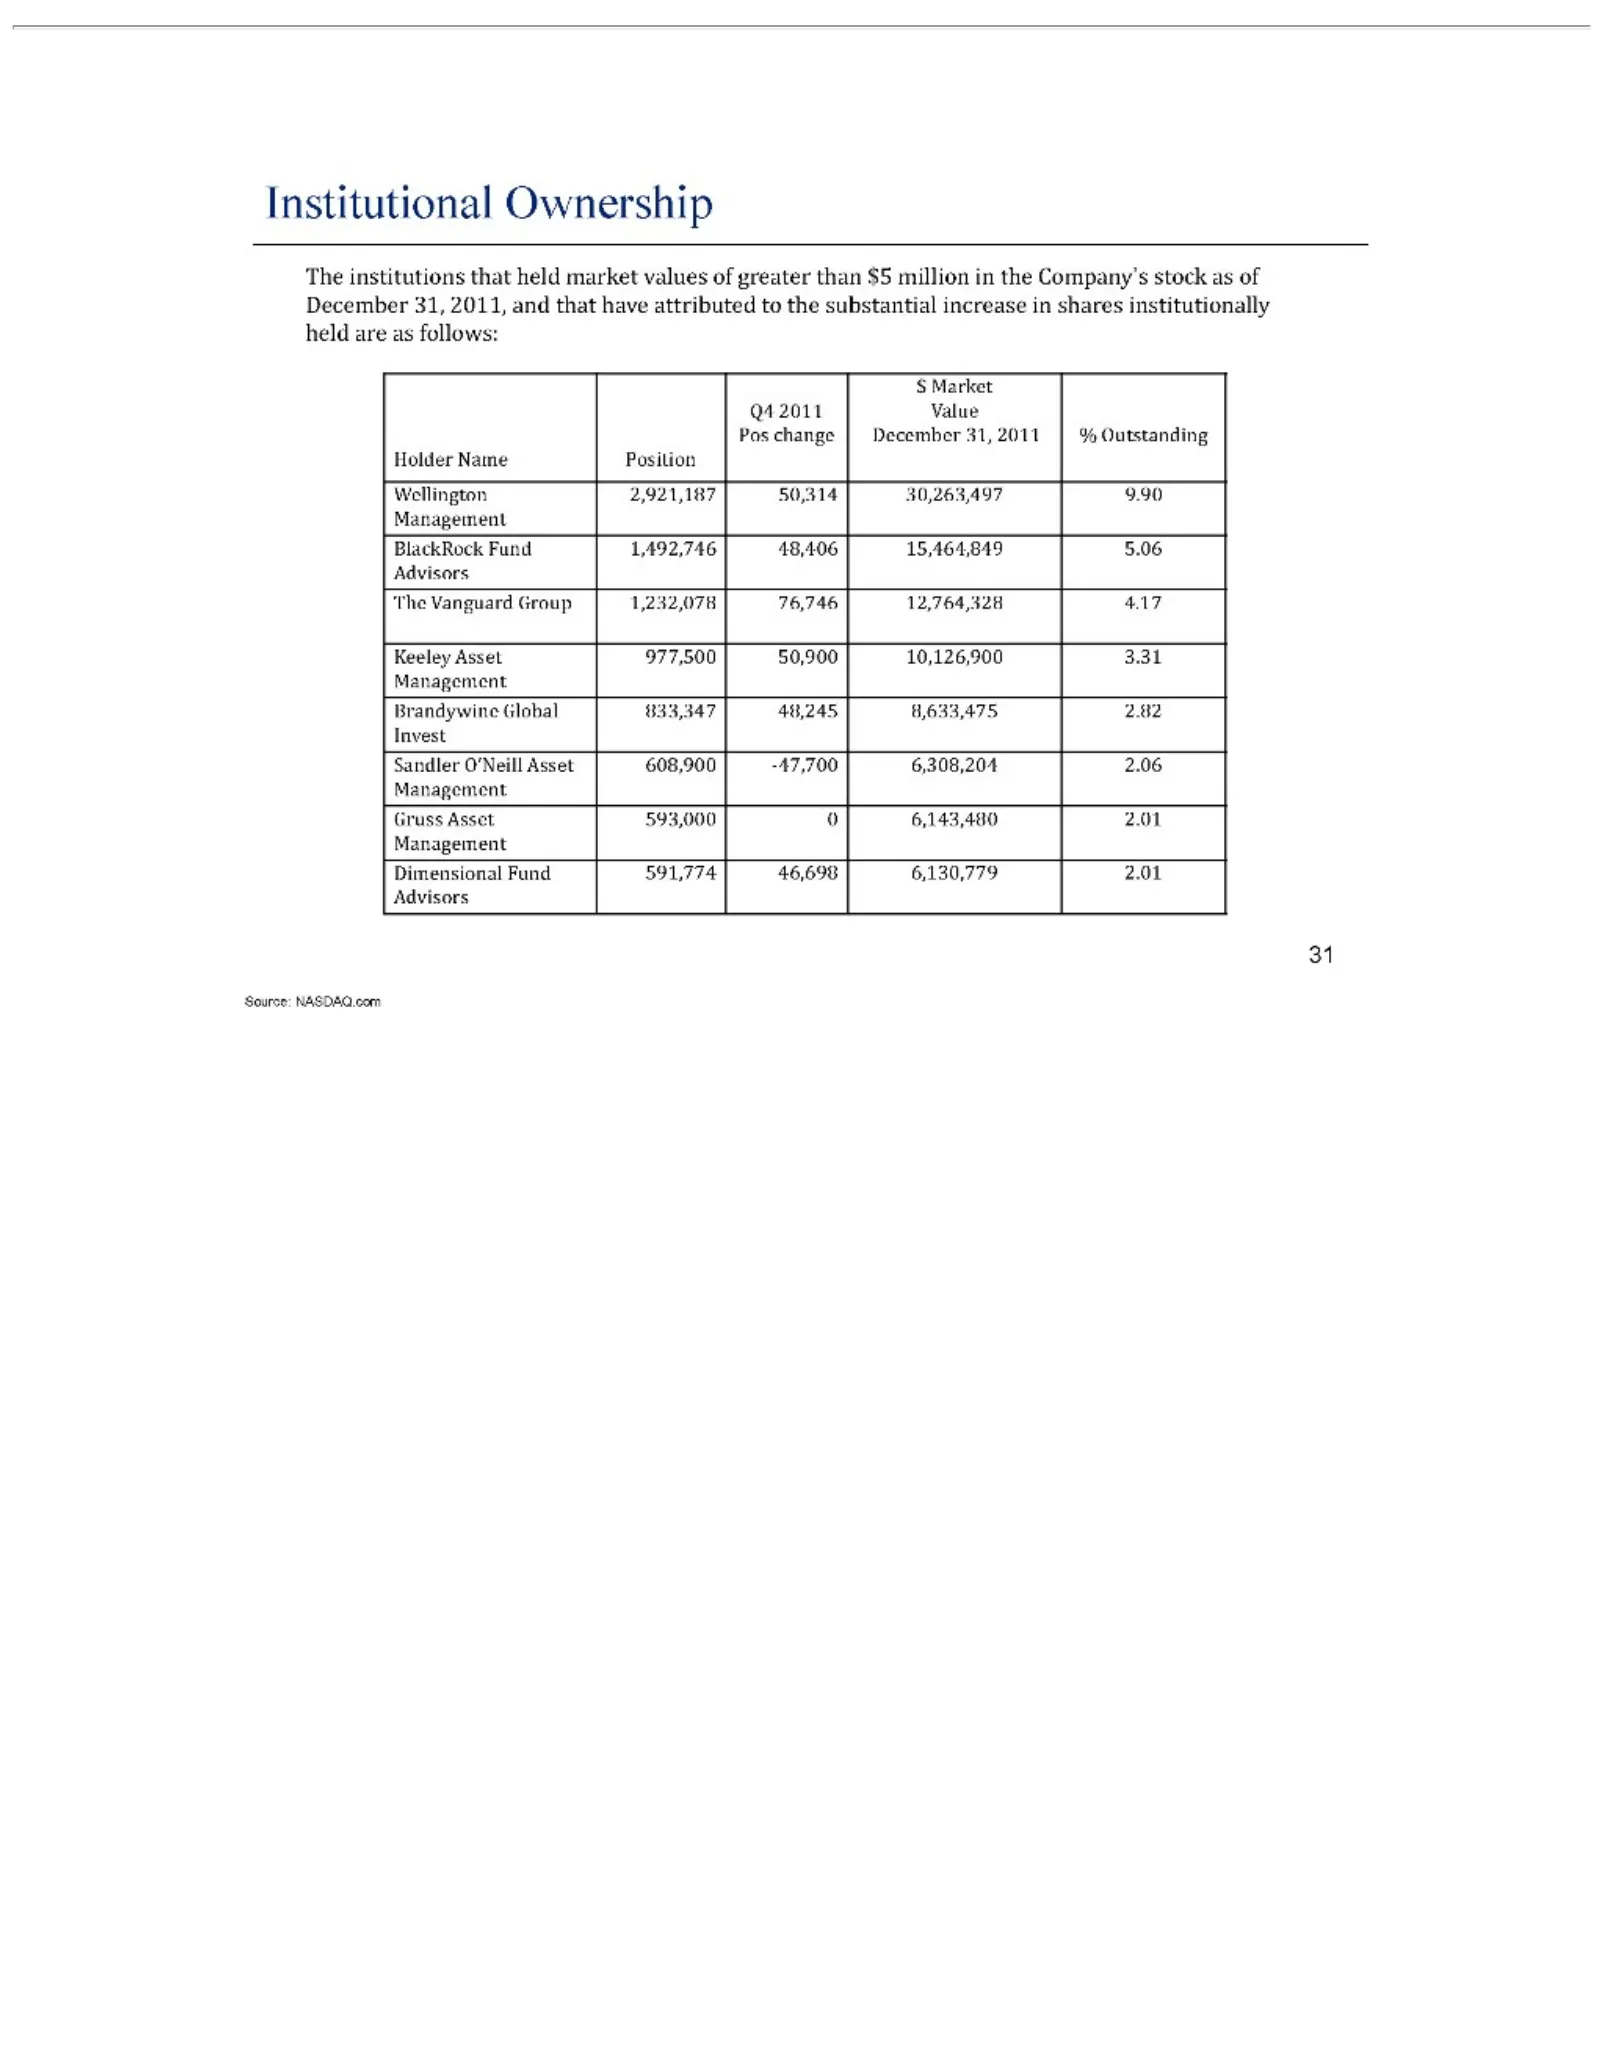
Slide 31: Institutional Ownership
$Institutional Q4 Pos Holder Wellington BlackRock The Keeley Brandywine Sandler Invest Gruss Dimensional Management Source: Advisors 31Market 2011 change Vanguard institutions Asset Asset Name NASDAQ.com O’Neill Value 2,921,187 Fund December 593,000 Ownership Global Fund 977,500 Position Group that
Slide 32: Appendix
32 APPENDIX
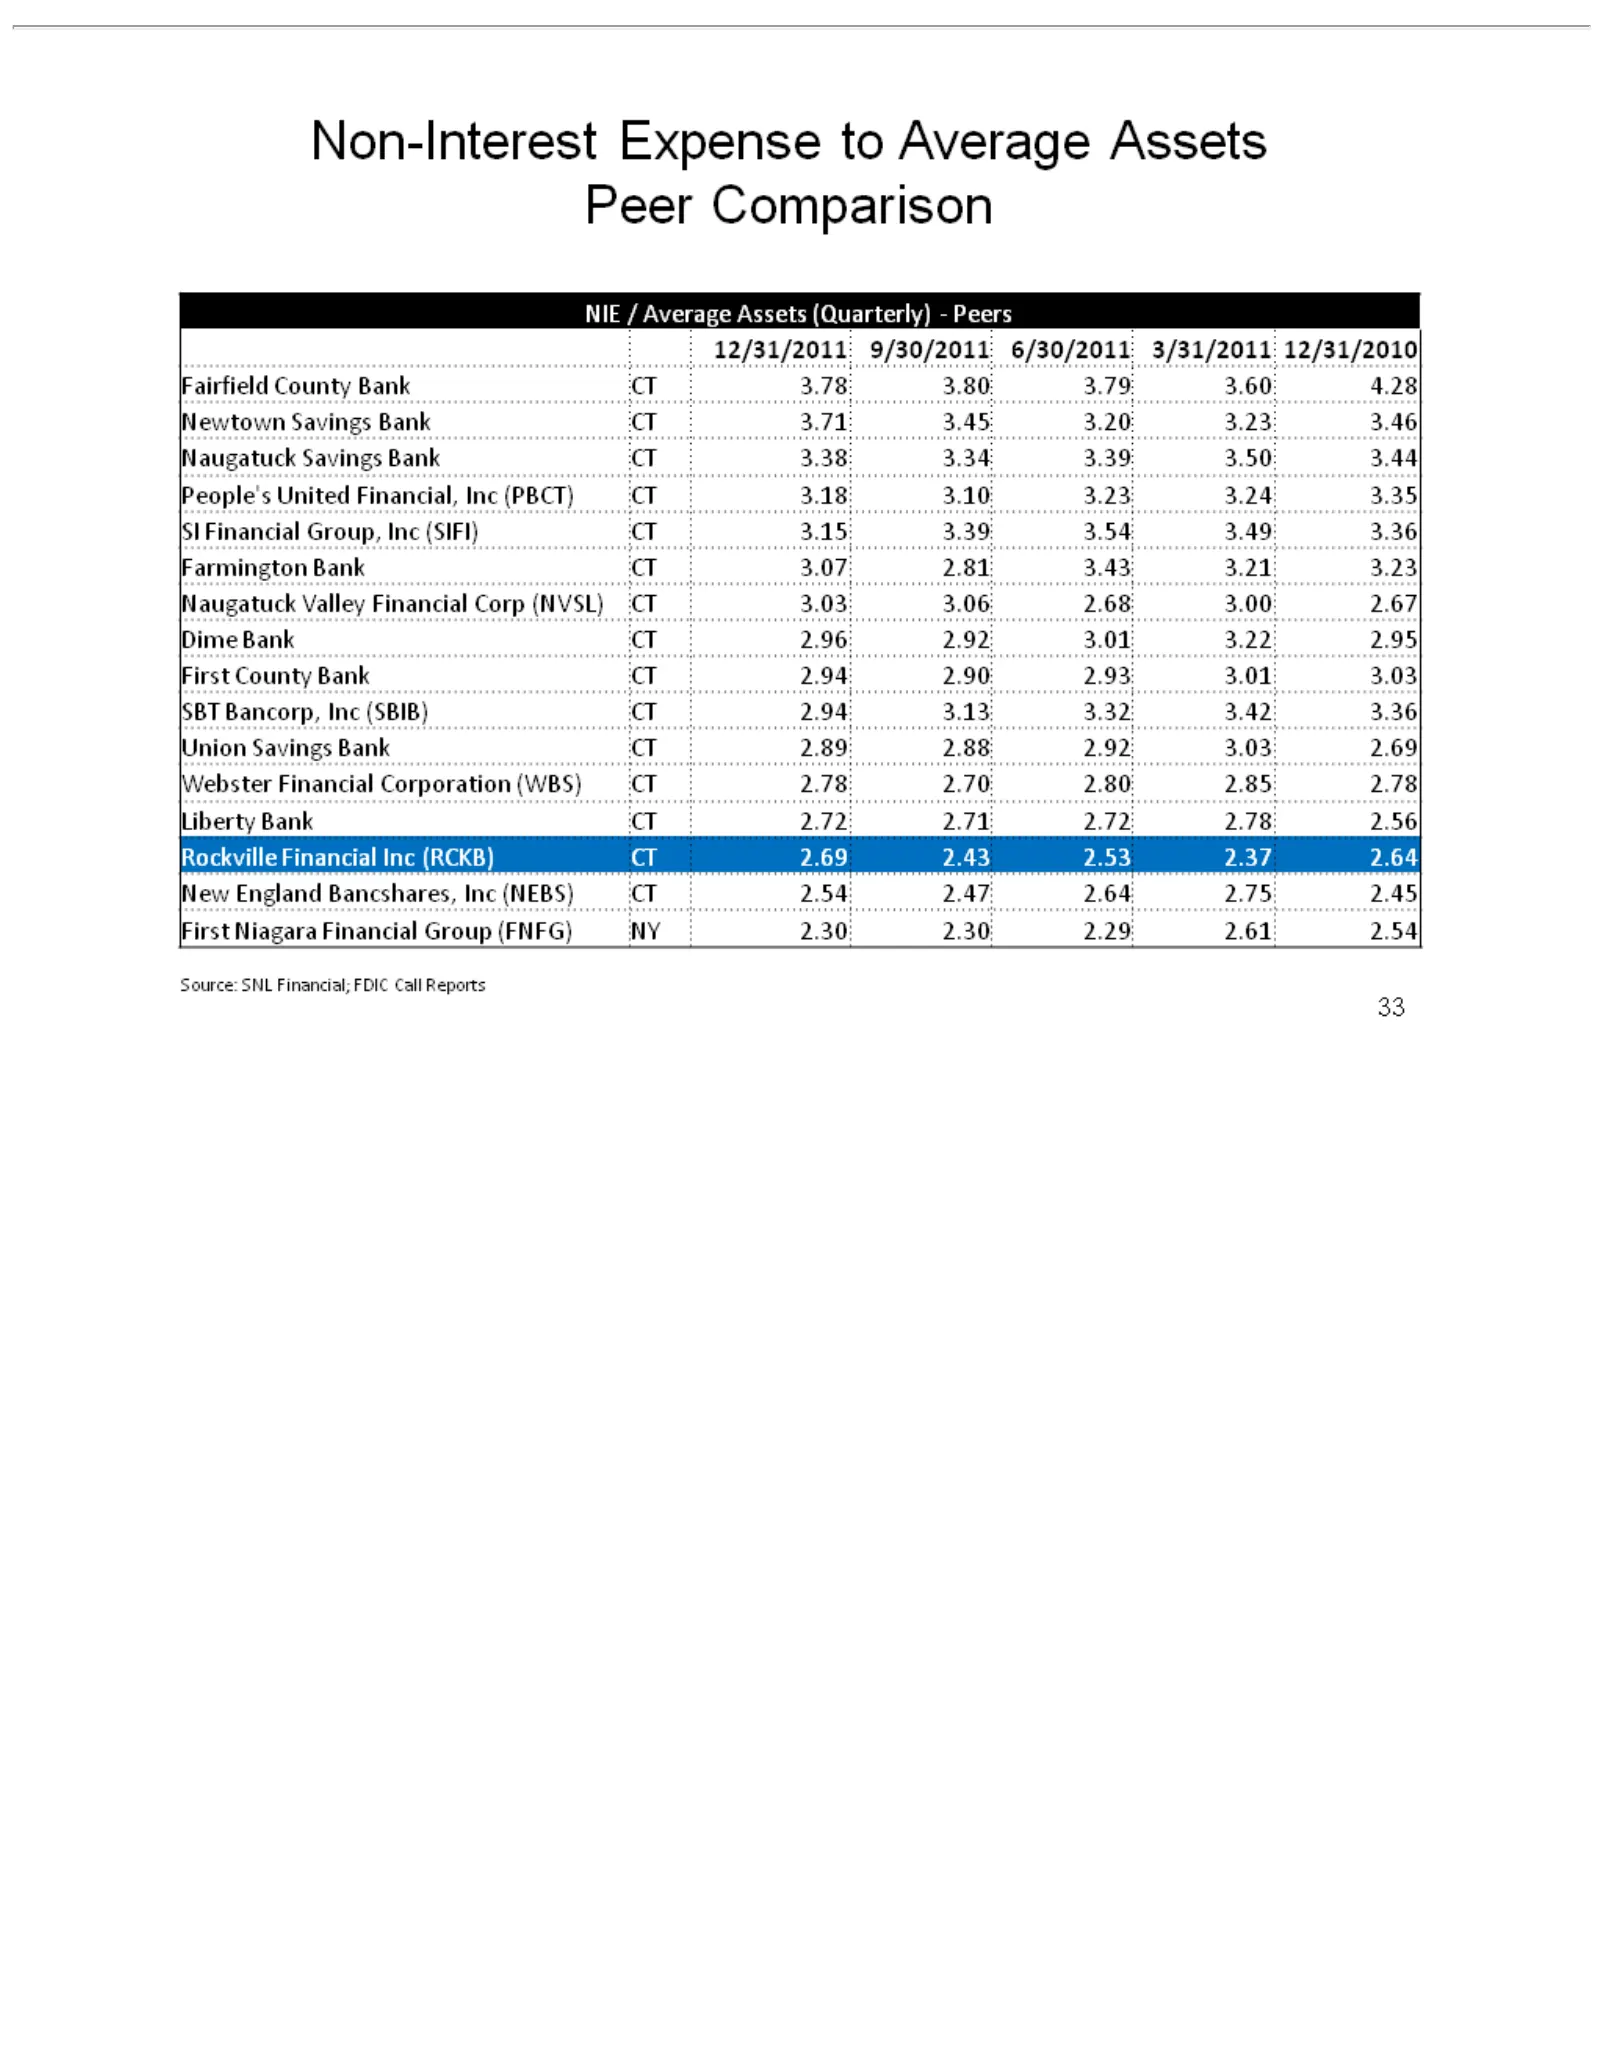
Slide 33: Non-Interest Expense to Average Assets
Non-Interest NIE 12/31/2011 Fairfield Inc Bancorp, 2.69 Source: 33 (SIFI) /2.43 Average SNL County Inc 2.53 CT 9/30/2011 Expense Financial; (SBIB) 3.15 Assets 2.37 Bank 3.39 2.64 CT (Quarterly)—Peers to 6/30/2011 CT FDIC 3.54 Average New 2.94 3.78 3.49 3.13 England Call 3.80 3/31/2011 Assets 3.36 3.
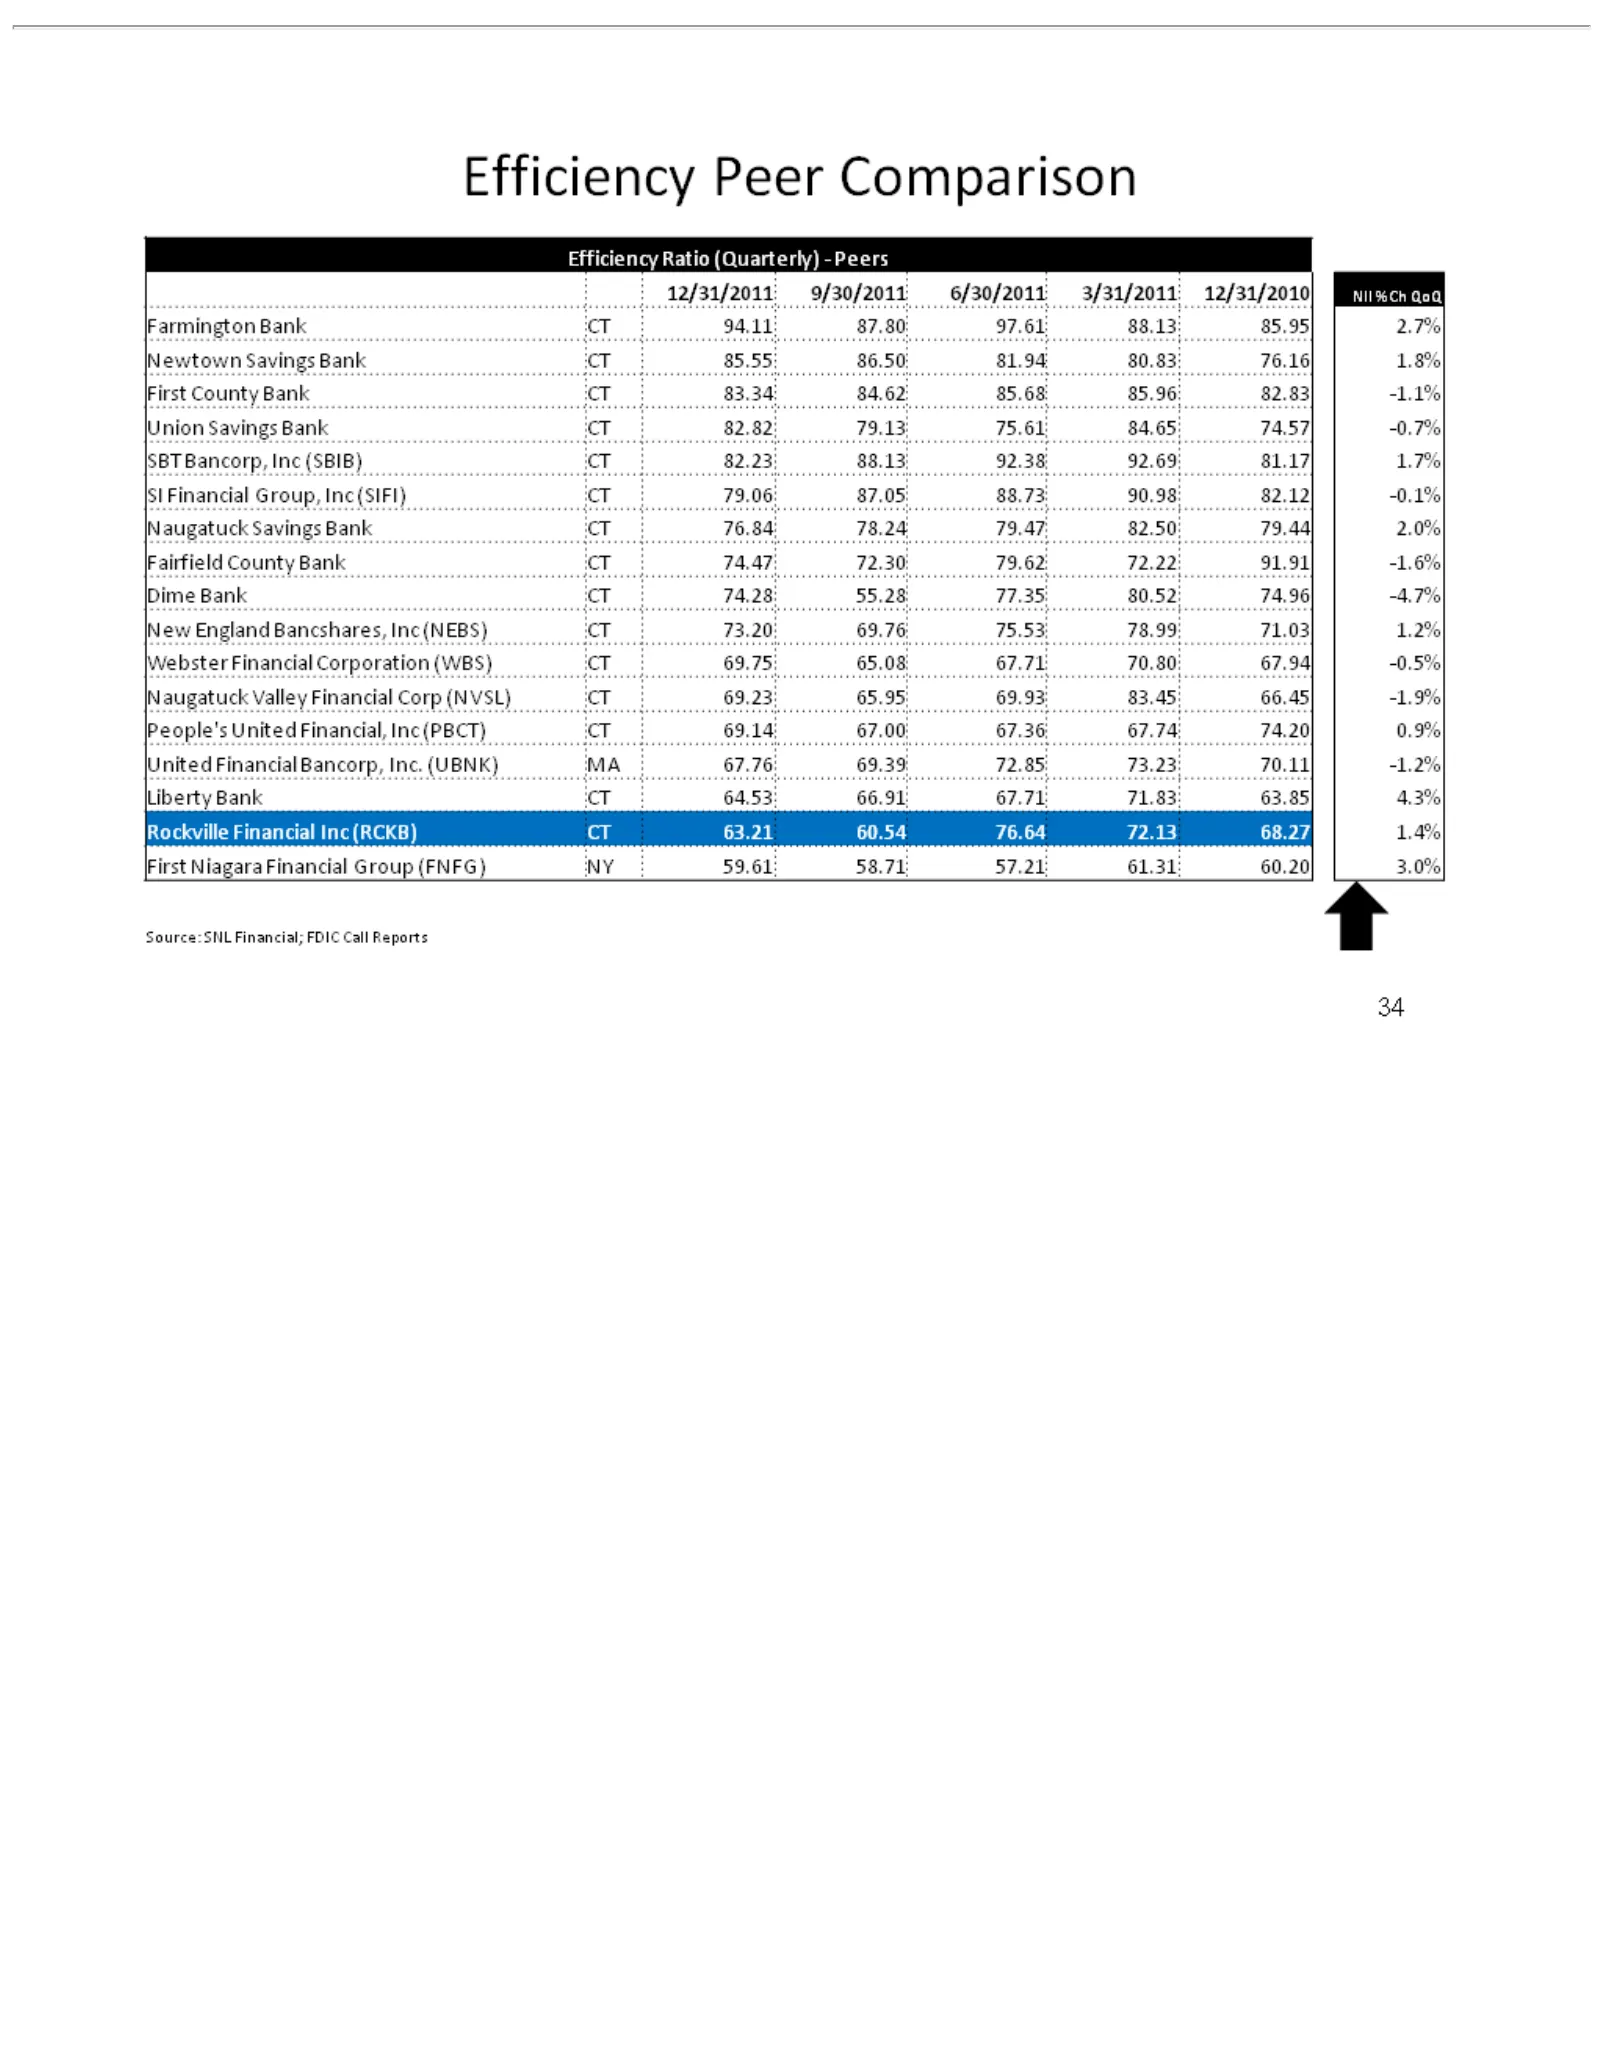
Slide 34: Efficiency Ratio Peer Comparison
Efficiency 12/31/2011 Farmington Newtown Union SBT SI Fairfield Dime New Webster Naugatuck People’s United Liberty Rockville First NII 1.8% 2.7% 1.7% 2.0% 1.2% 0.9% Source: 3.0% 1.4% 4.3% 34 Financial %Ch Bancorp, County Niagara England -1.1% -0.1% -1.6% -0.5% -1.2% Bank Savings Financial Bank SNL F
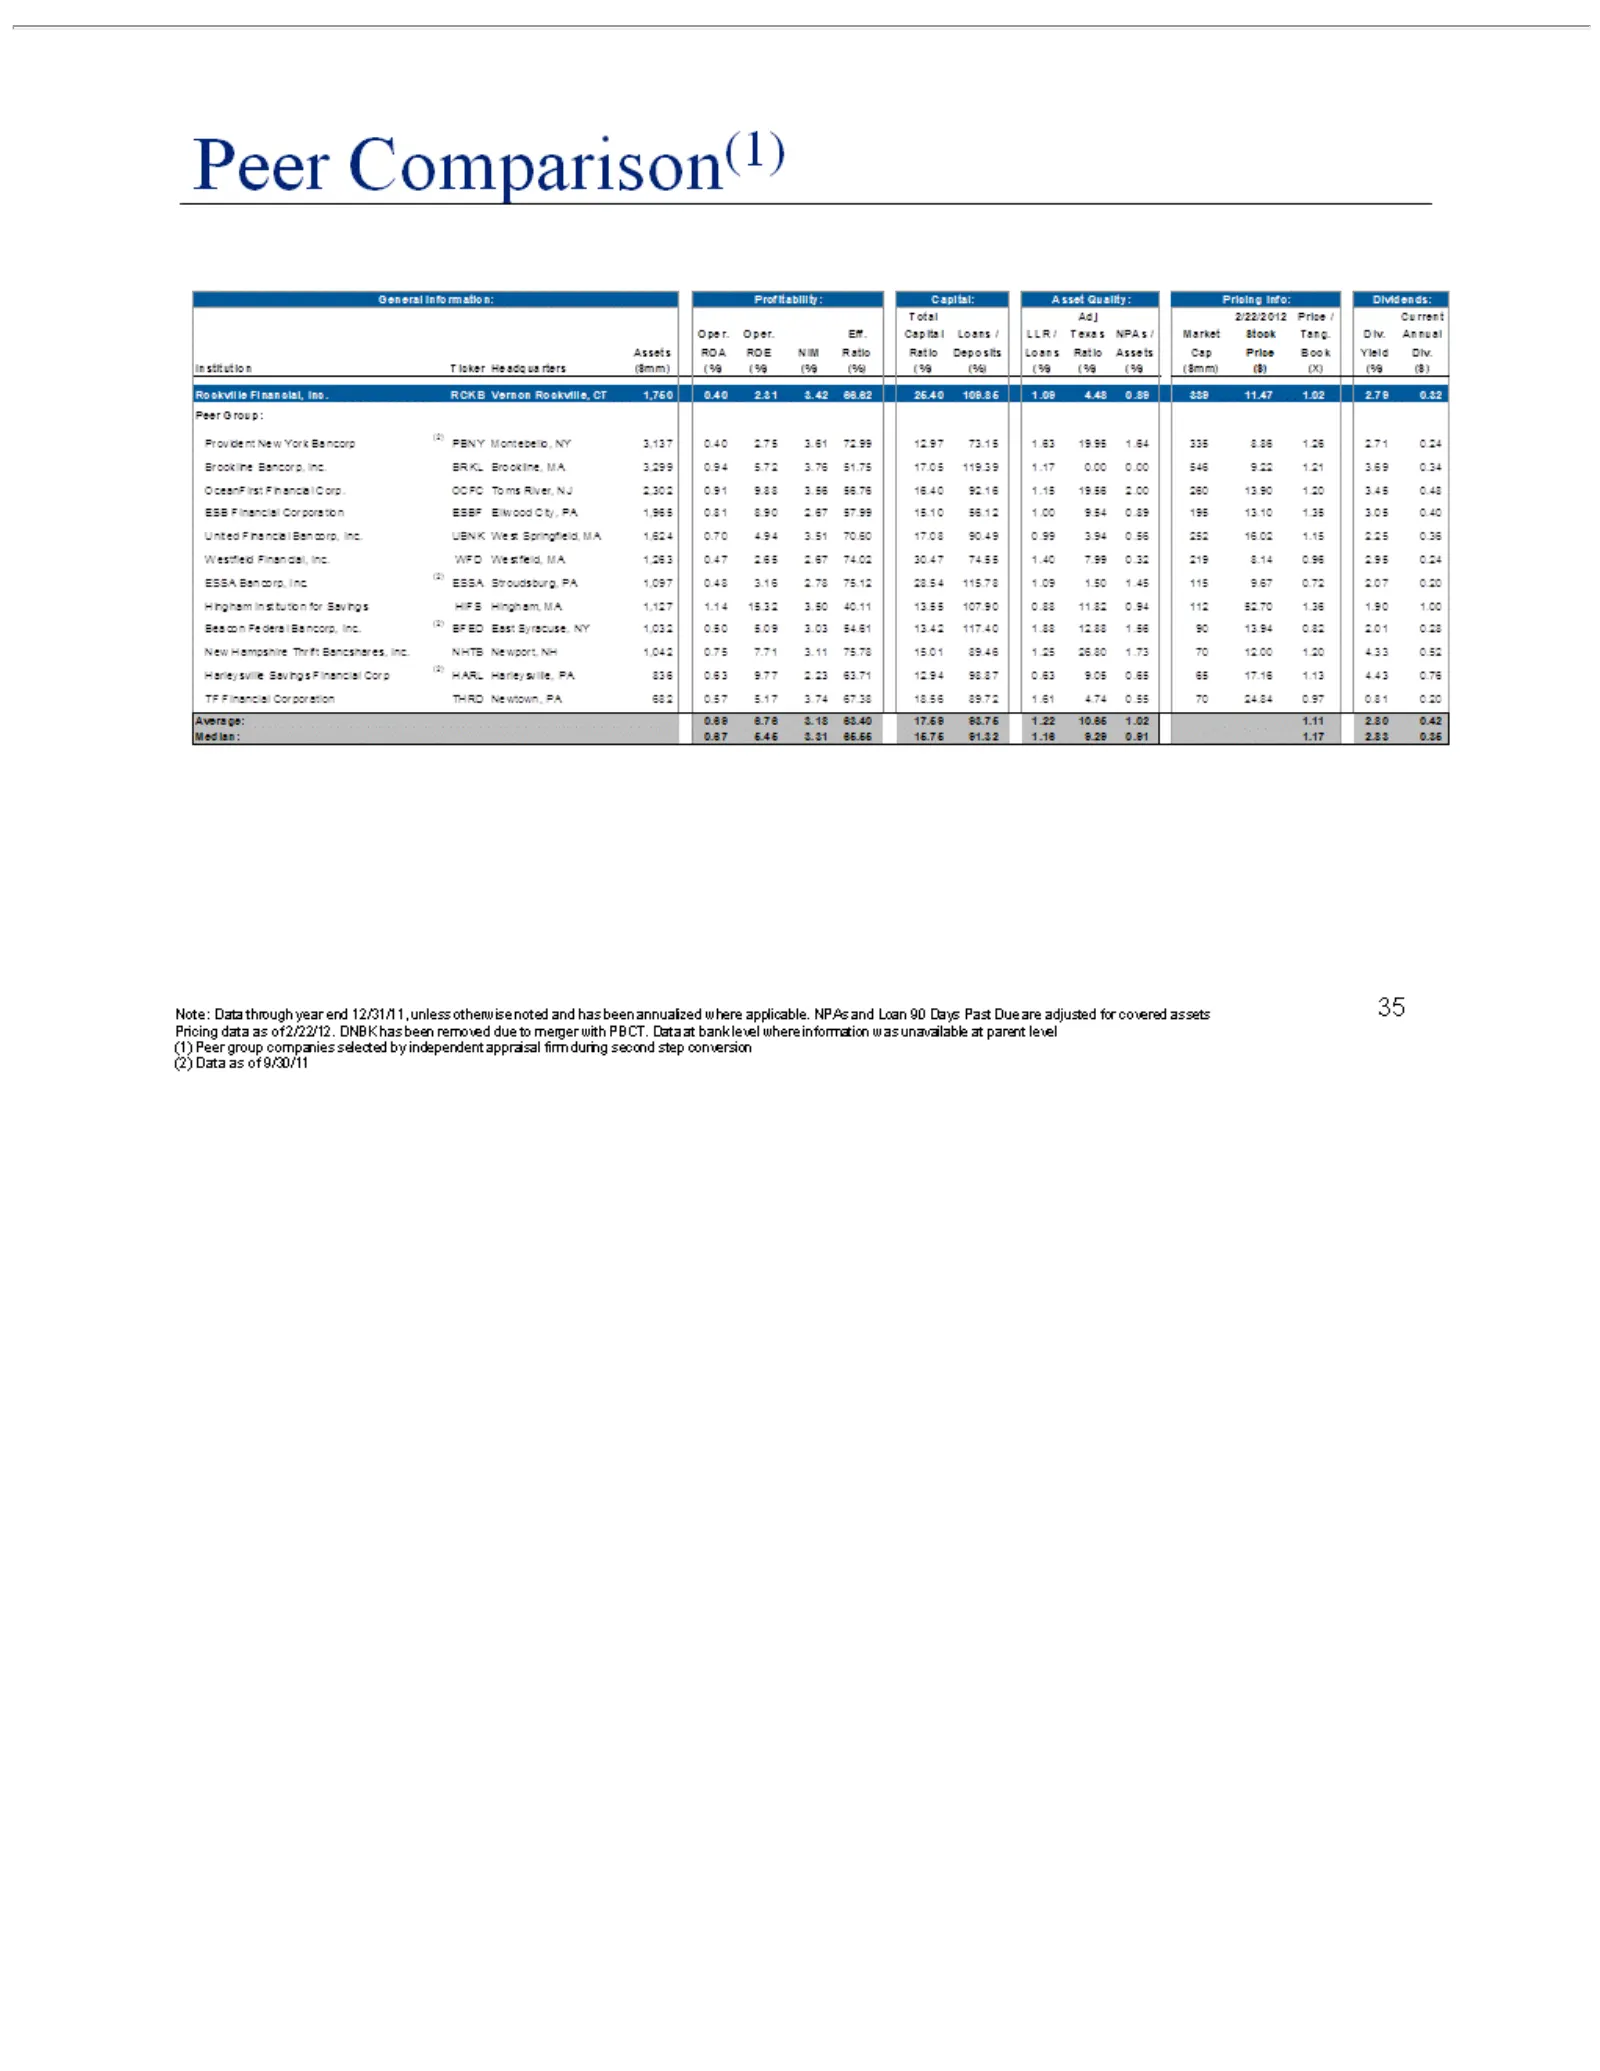
Slide 35: General Financial Comparison
General Total Oper. Assets Institution Rockville Peer Provident Brookline OceanFirst ESB United Westfield ESSA Hingham Beacon New Harleysville TF Average: Median: Note: Data 35 Financial Comparison(1) Group: Financial at Hampshire Adj Oper. Data Bancorp, ROA Financial bank Federal Information: 0.67
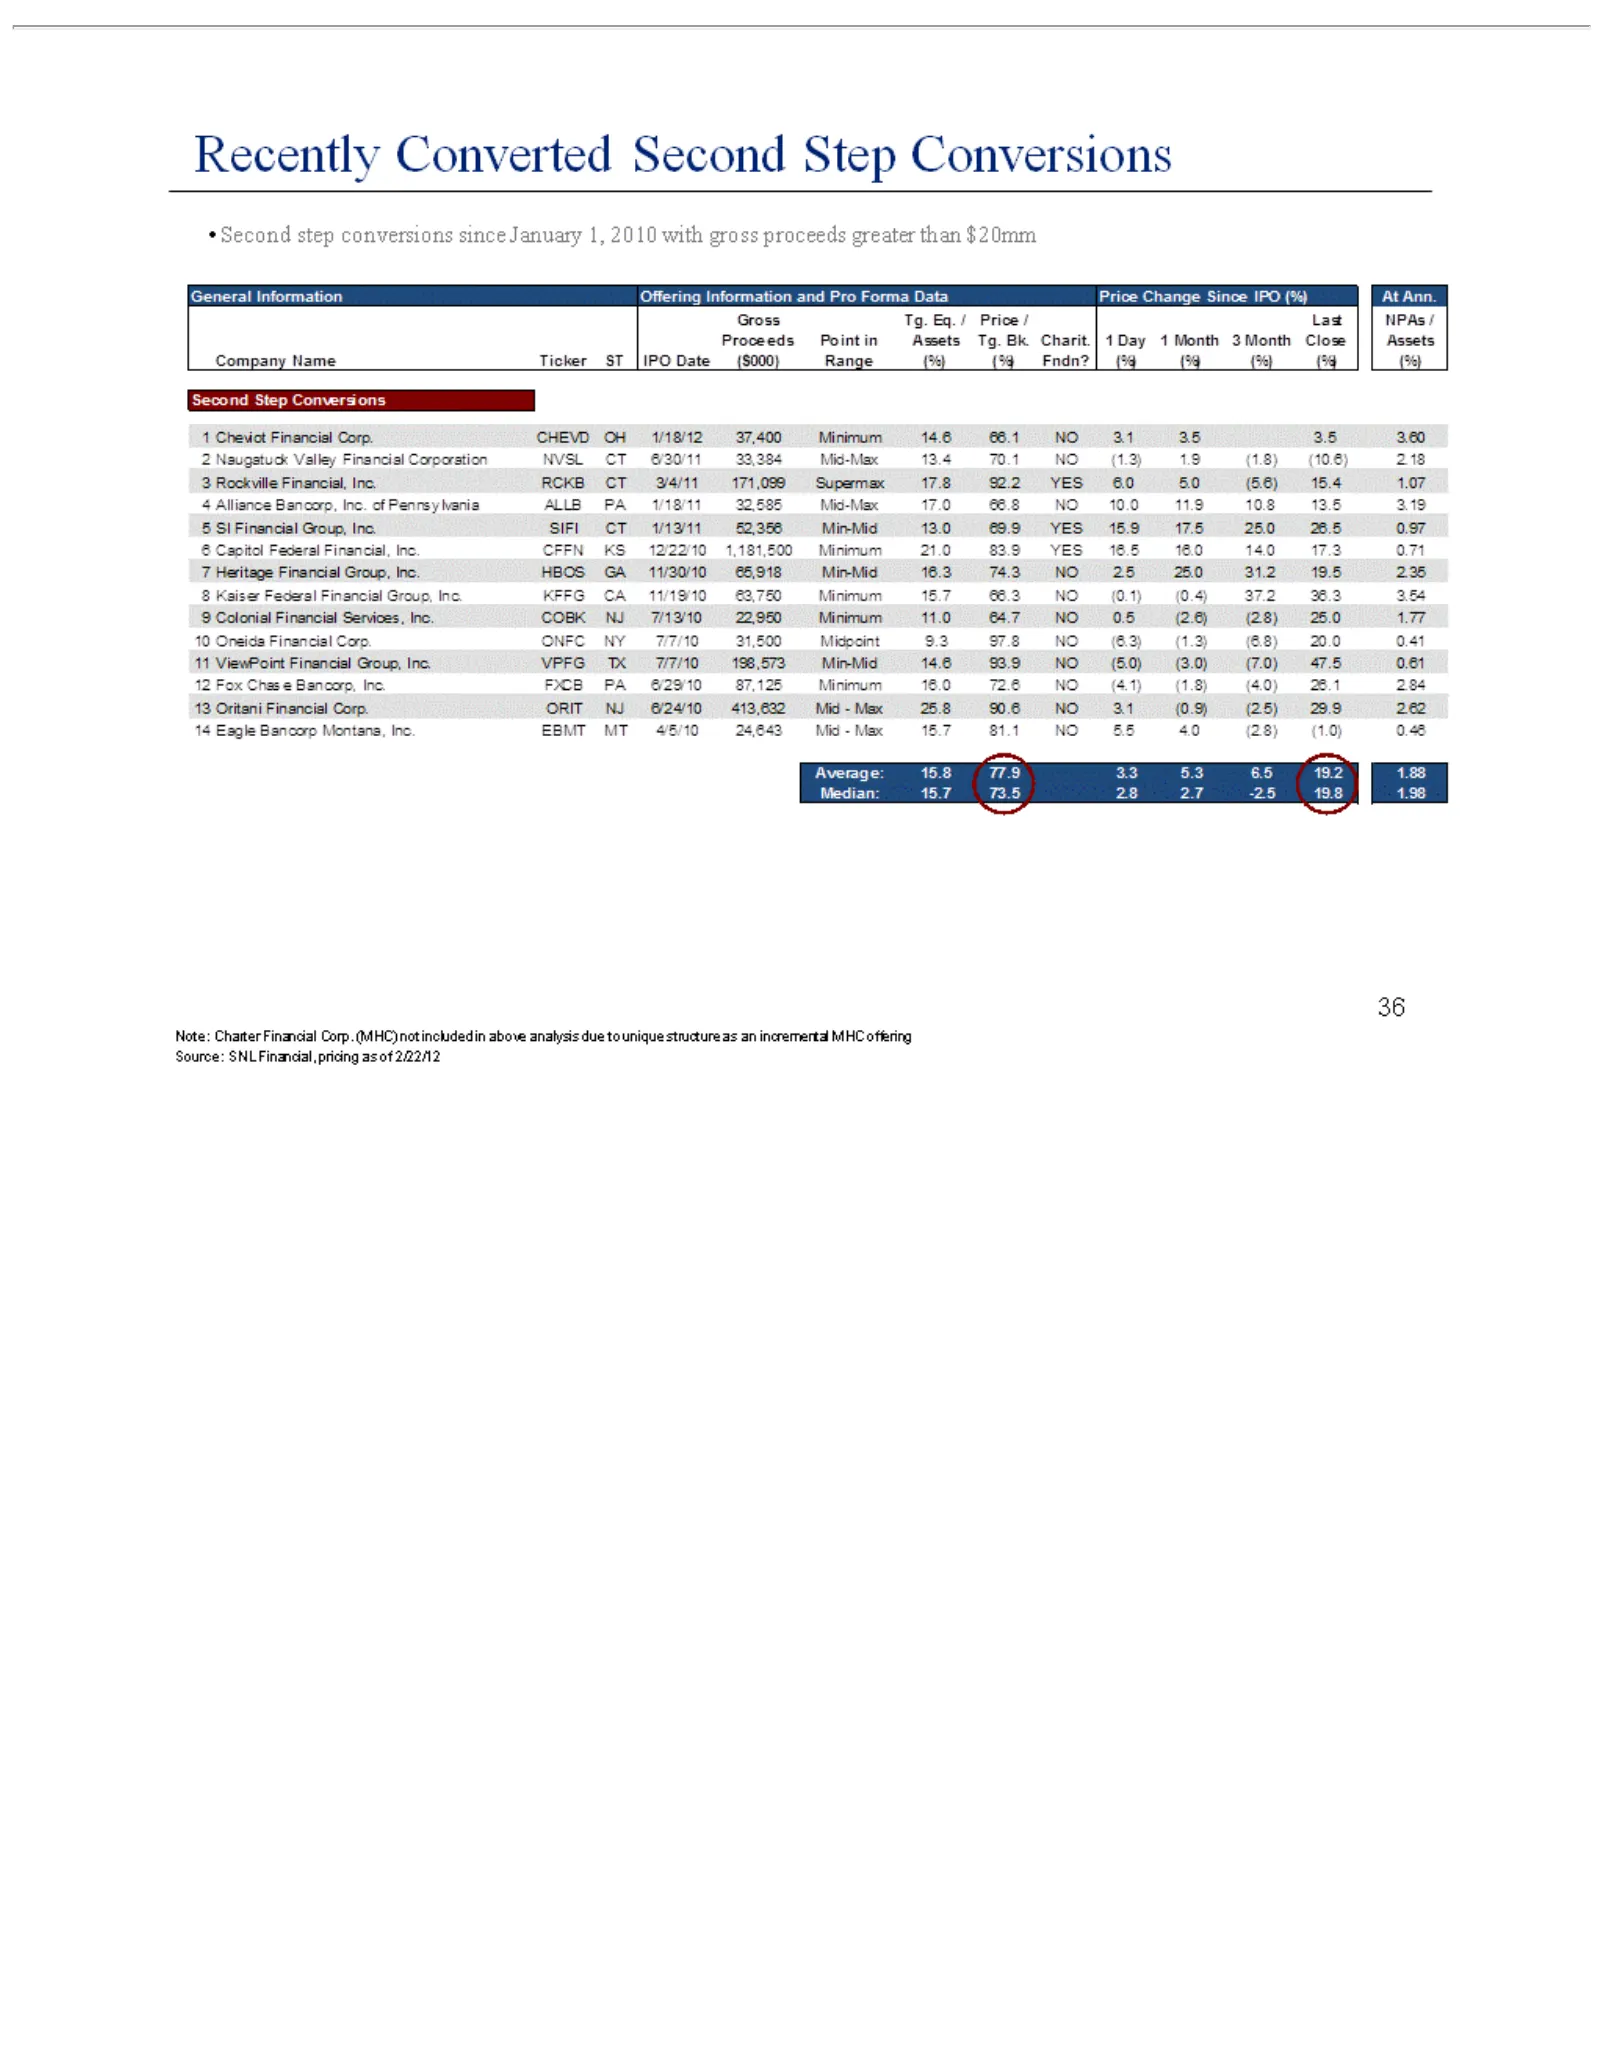
Slide 36: Recently Converted Second Step Conversions
•Recently General Date 21Second Second Cheviot ($000) Step Information step Converted NaugatuckRange Conversions Financial conversions (%) Second Offering Valley Corp. (%) since Fndn? Step FinancialCHEVD Information January Conversions (%)CT OH (%) 1,3/4/11 Corporation and 1/18/12 2010 (%)Pro (%) NV
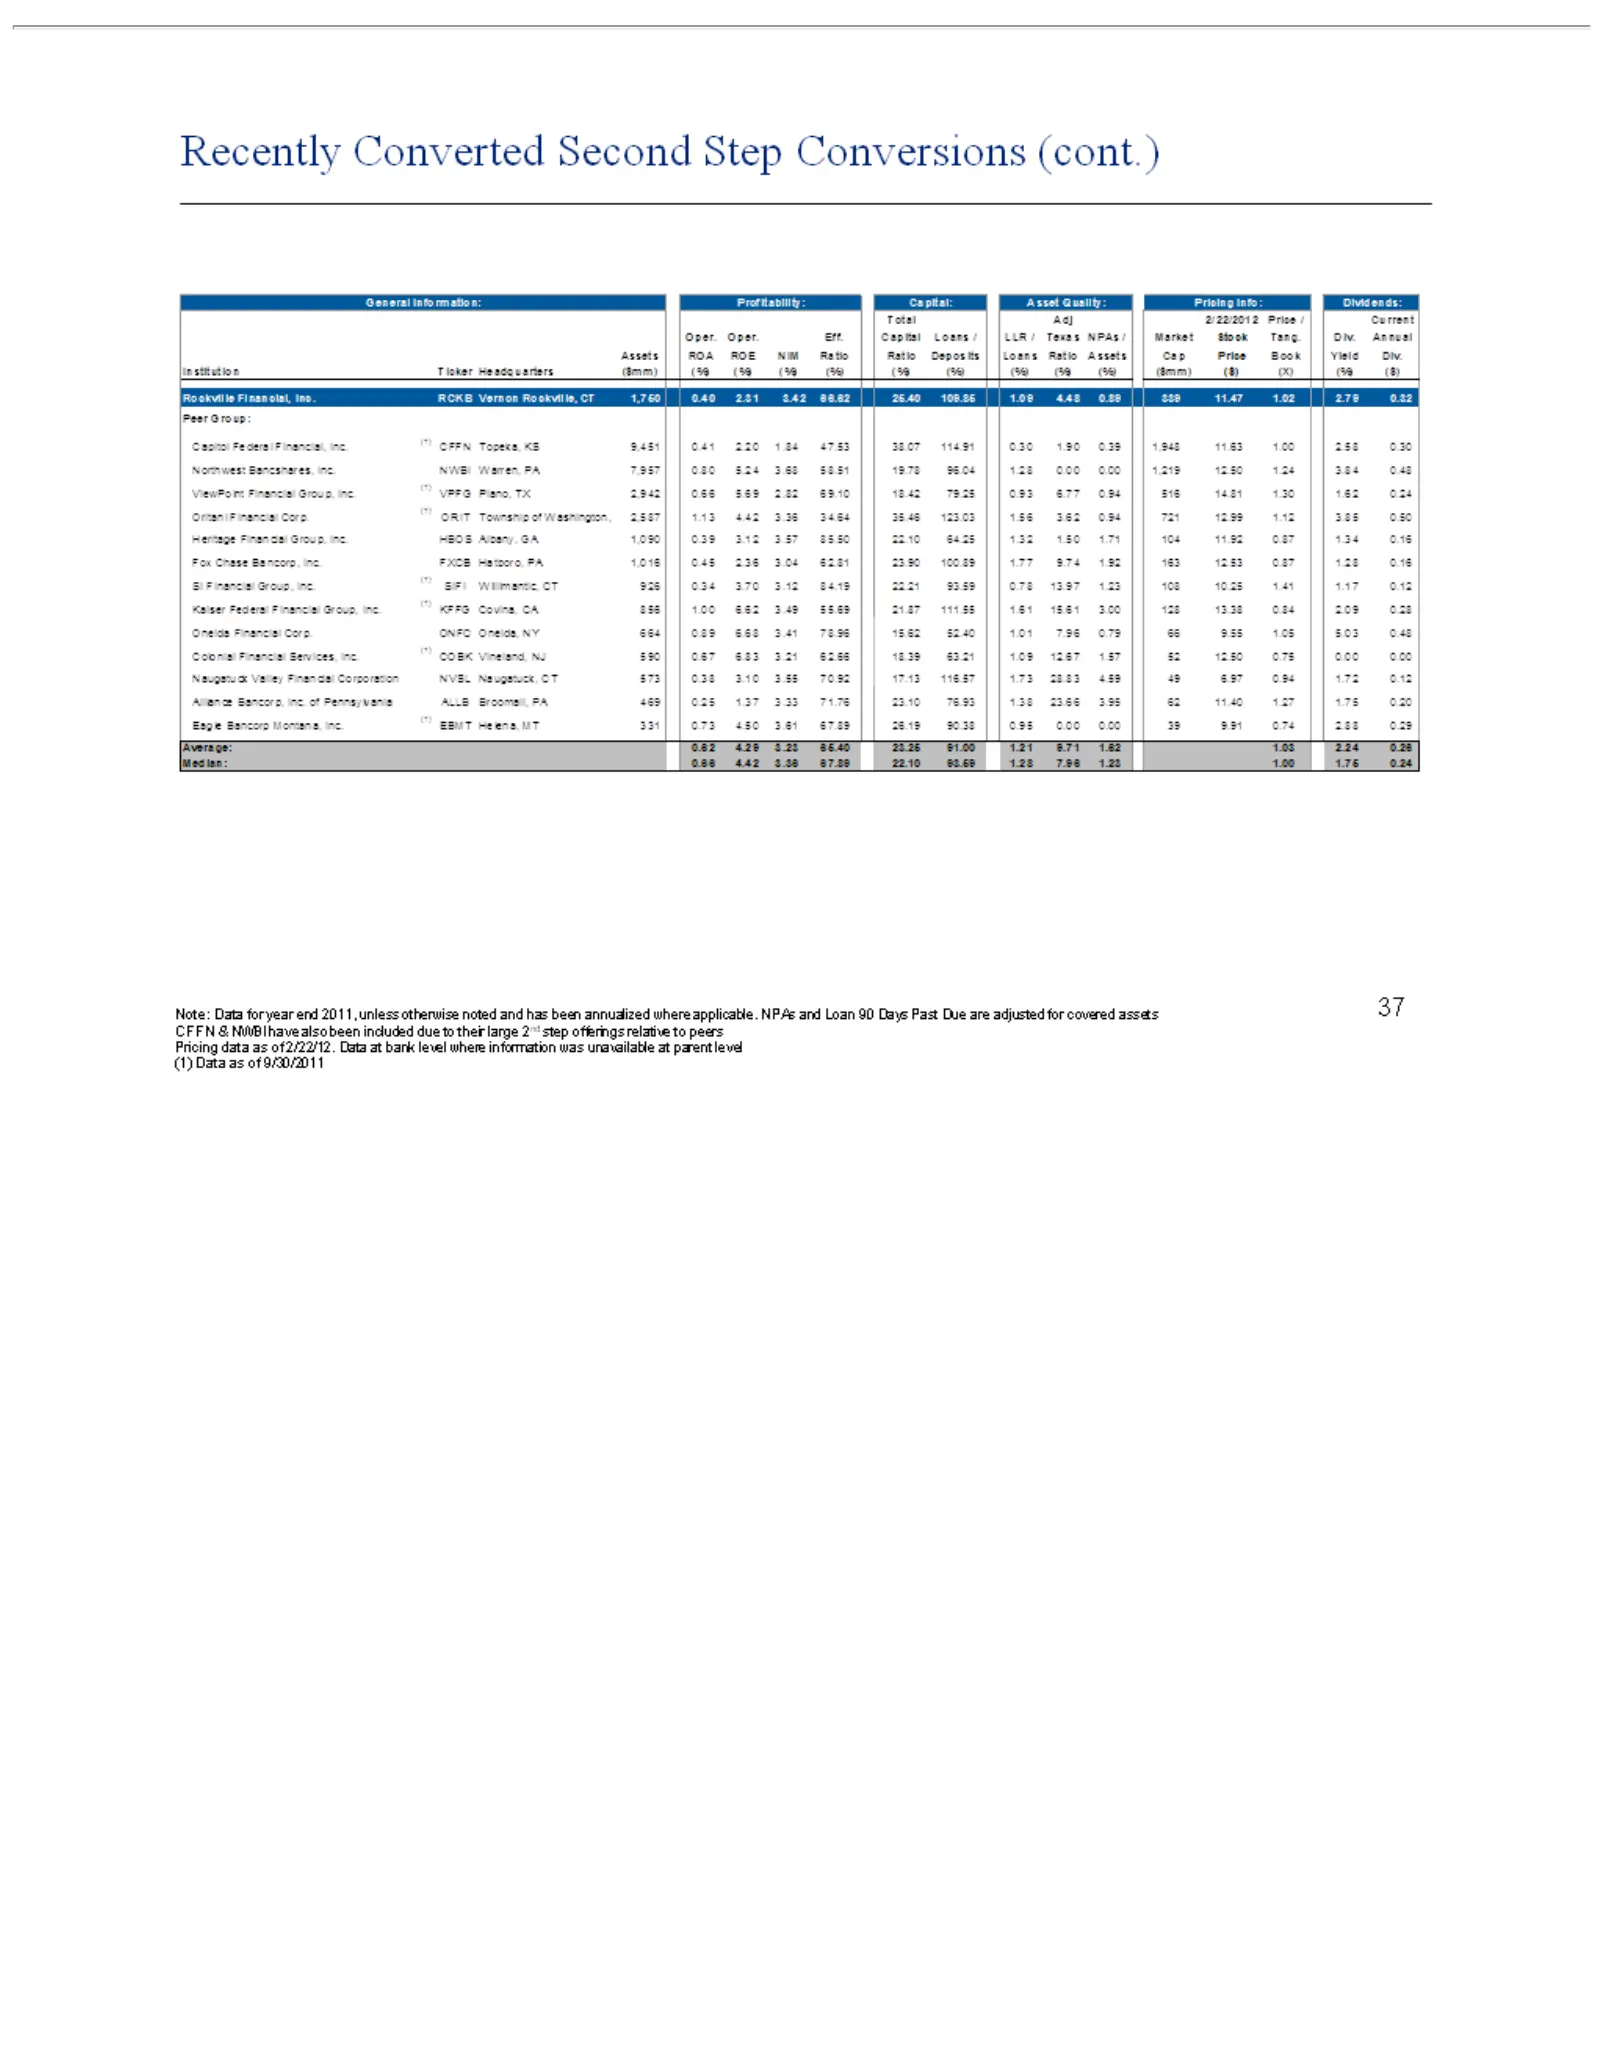
Slide 37: Recently Converted Second Step Conversions (cont.)
Recently General Loans Institution Rockville Capitol 12.50 123.03 62.81 856 Vineland, Bancorp, 2.88 Average: Note: peers 37 1.00 0.29 Pricing Data 1.24 23.90 Ratio 1.56 Federal Information: 6.62 Converted 0.62 Inc. NJ Financial, Ticker 3.84 for 3.62 100.89 Assets 590 data of 3.49 4.29 year Financial
Source: SEC EDGAR · 8-K filed Apr 3, 2012
More decks from United Financial Bancorp Inc
 Merger or Acquisition (July 2019)10 slides · Jul 15, 2019
 Shareholder Meeting (May 2019)14 slides · May 13, 2019
 Q1 2019 Earnings Presentation27 slides · Apr 16, 2019
 Q4 2018 Earnings Presentation26 slides · Jan 22, 2019
 Q3 2018 Earnings Presentation25 slides · Oct 16, 2018
 Q2 2018 Earnings Presentation25 slides · Jul 17, 2018