Grenergy Renovables S.A · BME:GRE
Grenergy Renovables — FY2018 Earnings Presentation
33 slides from Grenergy Renovables's earnings presentation, Apr 9, 2019
Slide 1: Madrid, 9th April 2019
Madrid, 9th April 2019
Slide 2: Disclaimer
Disclaimer This document and the conference-call webcast (including the Q&A session) may contain forward-looking statements and information (hereinafter, the “Statements”) relating to Grenergy Renovables SA. (hereinafter indistinctly, “GRENERGY”, the "Company“ or the “Group") or otherwise. These Sta
Slide 3: Index
INDEX 1 Grenergy Renovables 2 Financial Results 3 Pipeline
Slide 4: 1 Grenergy Renovables
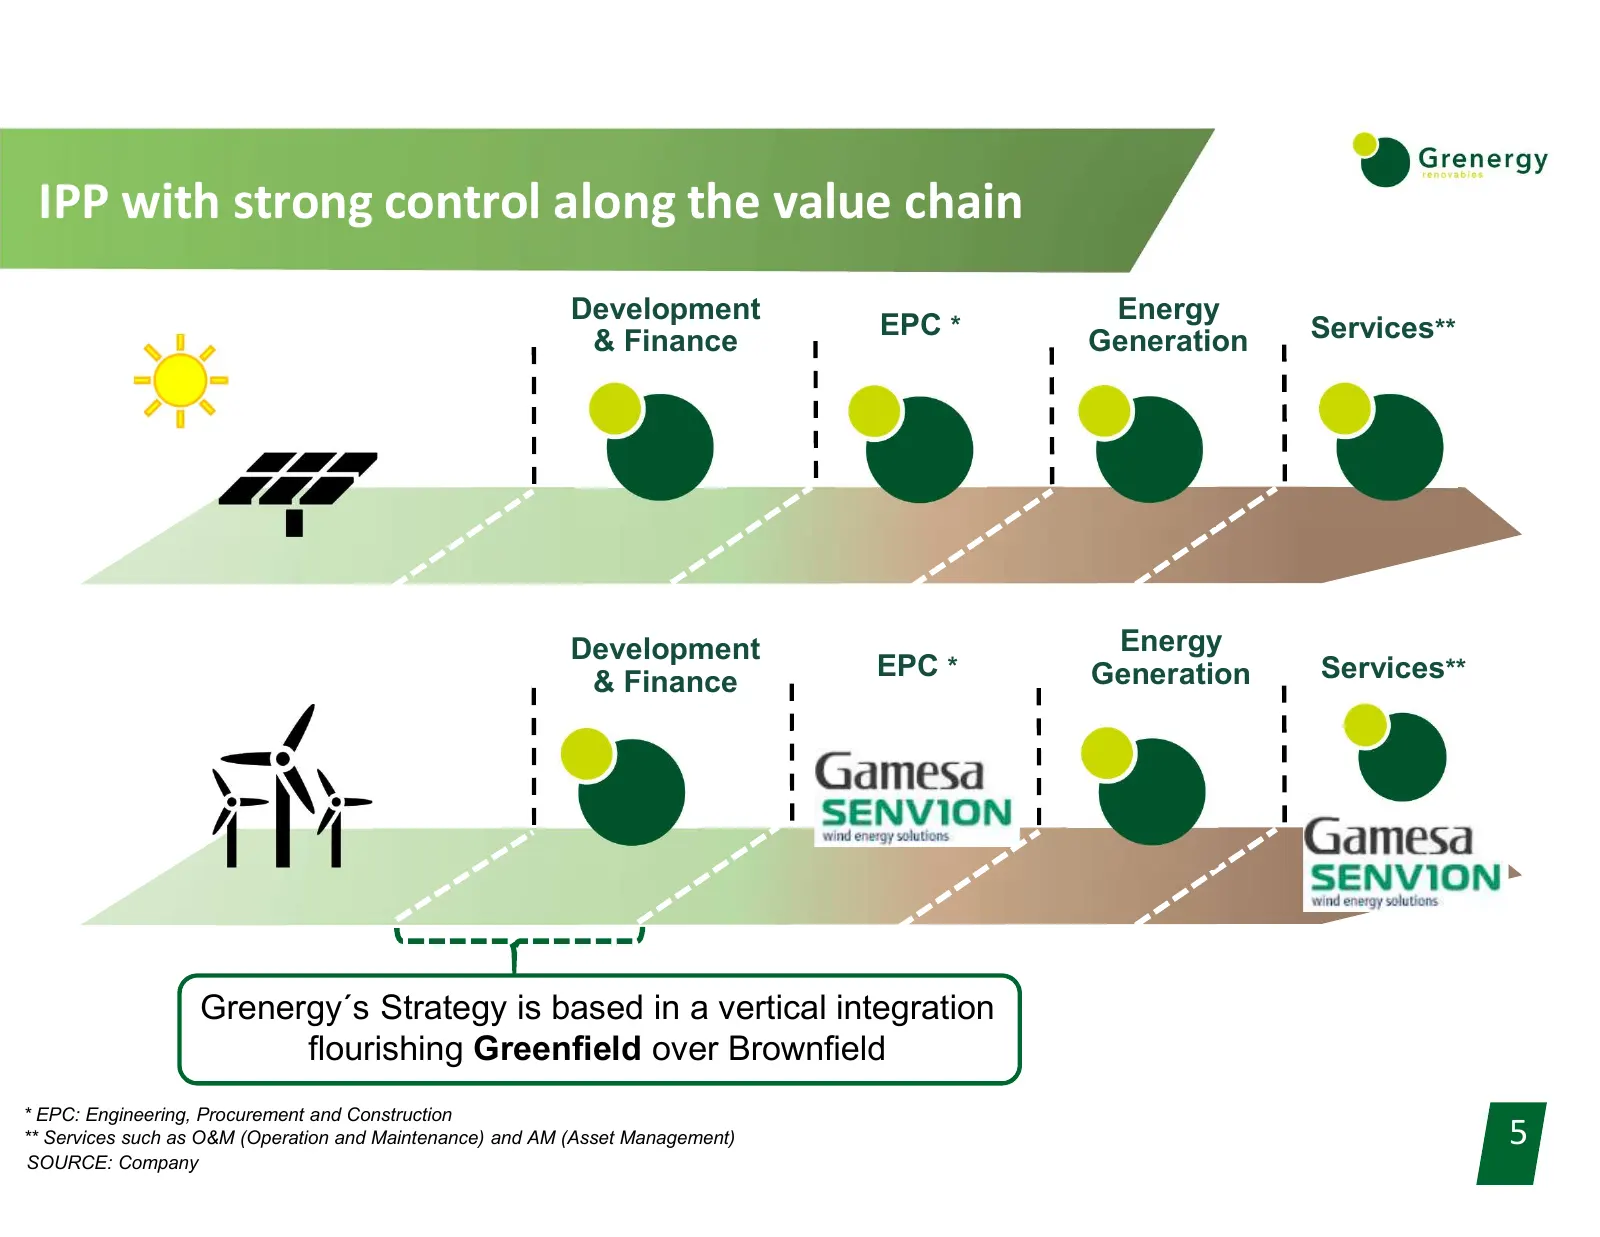
Slide 5: IPP with strong control along the value chain
IPP with strong control along the value chain Development Energy EPC * Services** & Finance Generation Development Energy EPC * Generation Services** & Finance Grenergy´s Strategy is based in a vertical integration flourishing Greenfield over Brownfield * EPC: Engineering, Procurement and Constructi
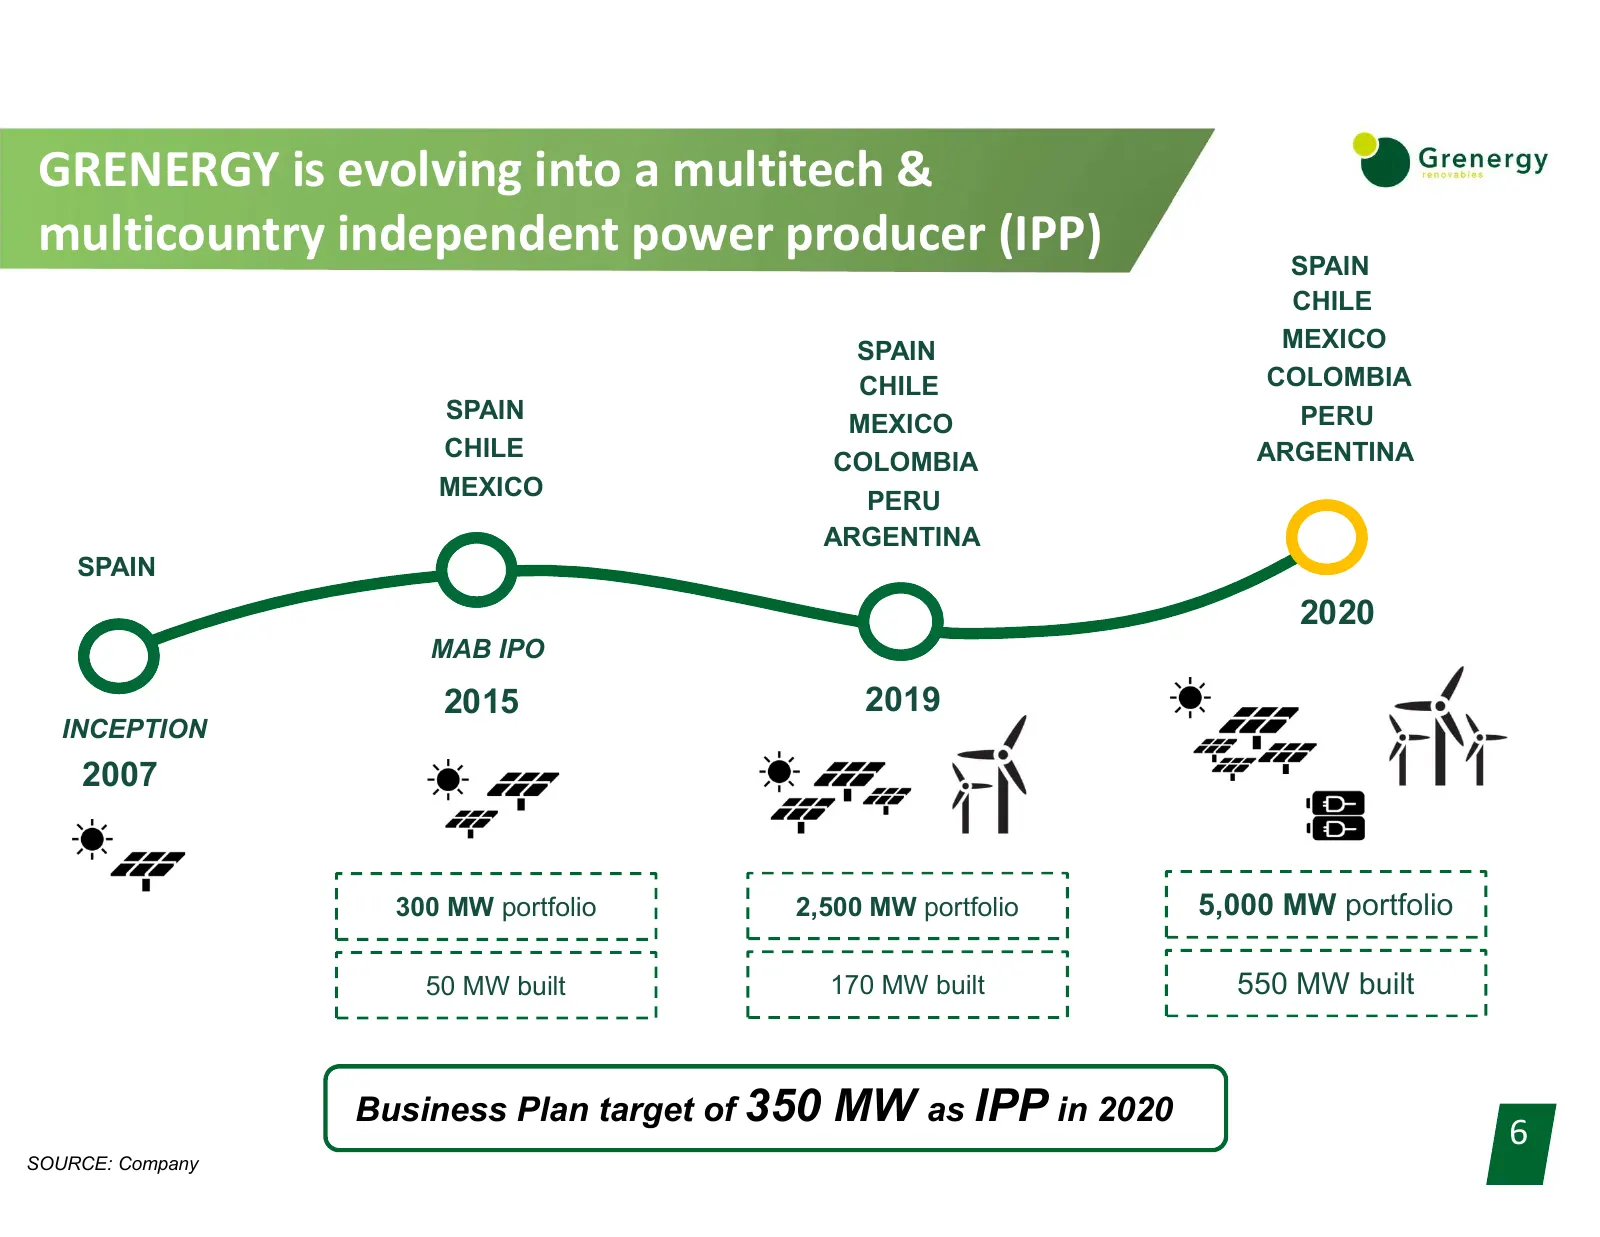
Slide 6: GRENERGY is evolving into a multitech & multicountry independent power producer (IPP)
GRENERGY is evolving into a multitech & multicountry independent power producer (IPP) SPAIN CHILE SPAIN MEXICO CHILE COLOMBIA SPAIN PERU MEXICO CHILE COLOMBIA ARGENTINA MEXICO PERU ARGENTINA SPAIN 2020 MAB IPO 2015 2019 INCEPTION 2007 300 MW portfolio 2,500 MW portfolio 5,000 MW portfolio 50 MW buil
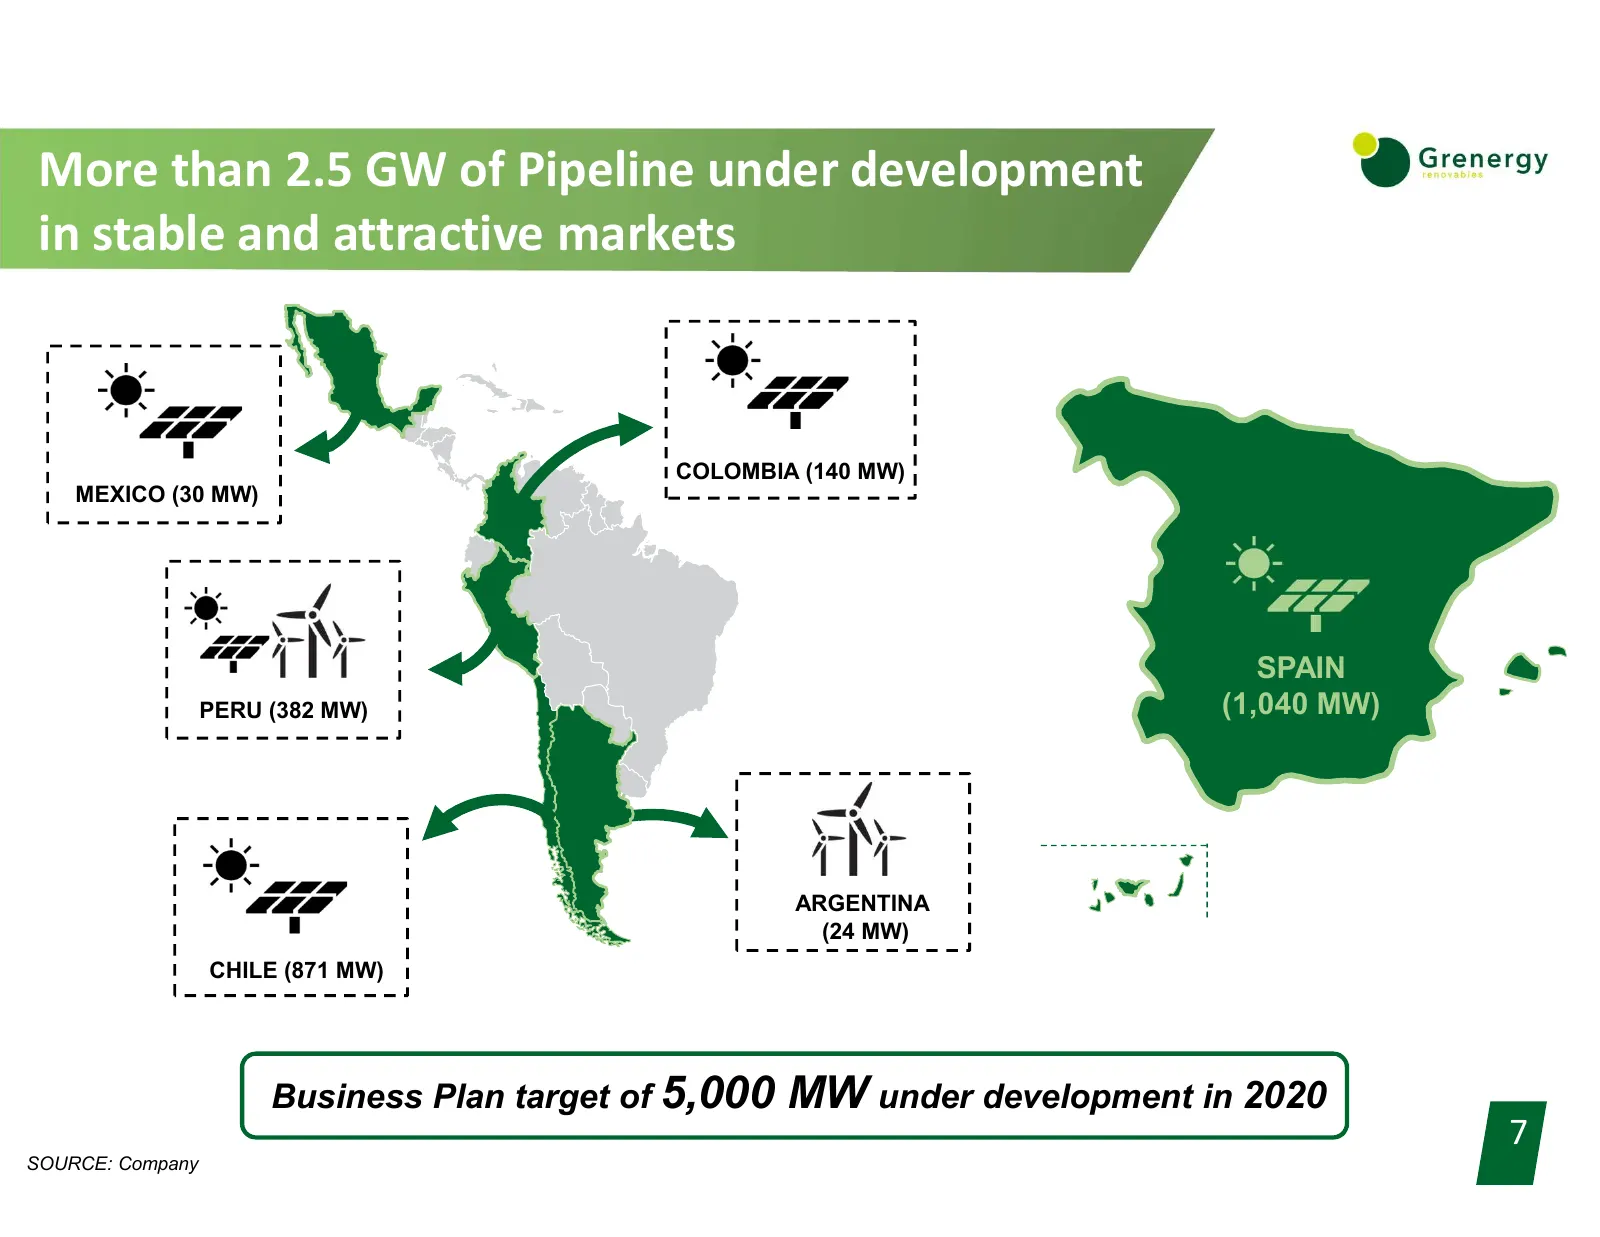
Slide 7: More than 2.5 GW of Pipeline under development in stable and attractive markets
More than 2.5 GW of Pipeline under development in stable and attractive markets COLOMBIA (140 MW) MEXICO (30 MW) SPAIN PERU (382 MW) (1,040 MW) ARGENTINA (24 MW) CHILE (871 MW) Business Plan target of 5,000 <> MW under development in 2020 7 SOURCE: Company
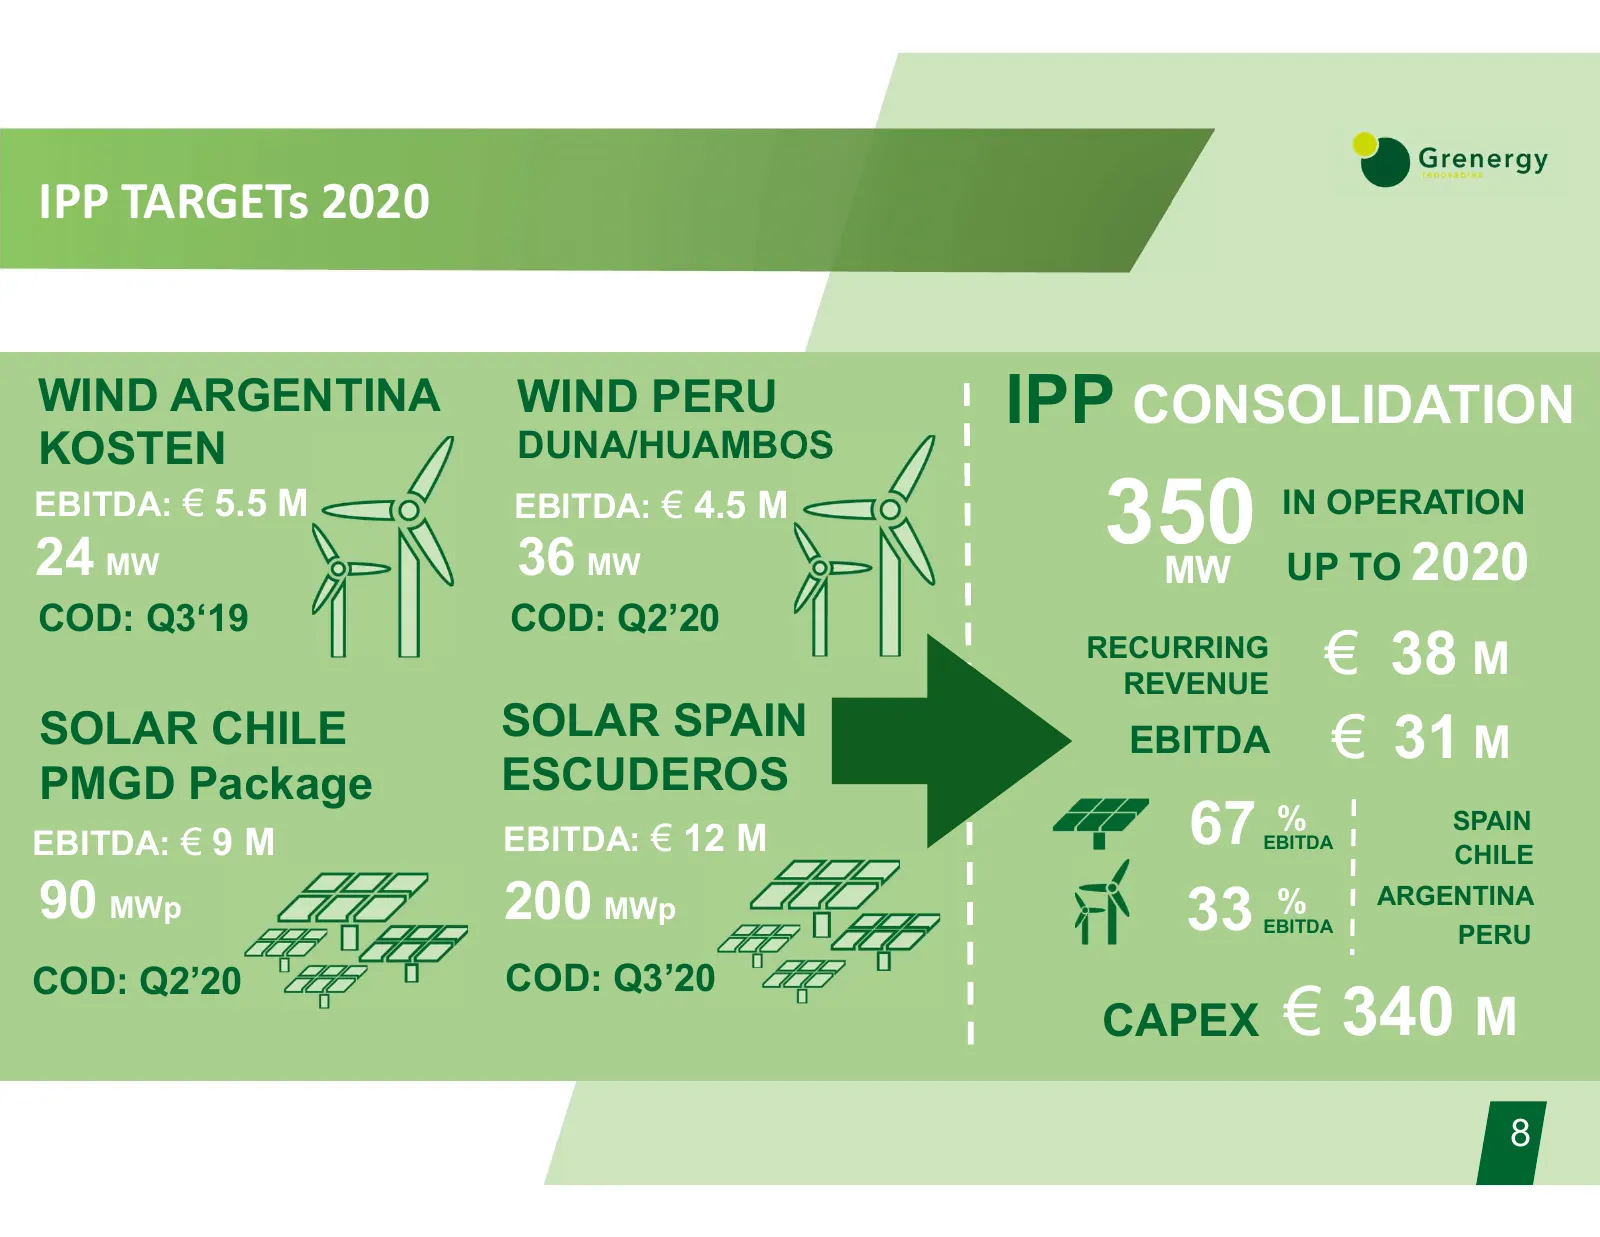
Slide 8: IPP Consolidation Capex € 340 M
IPP TARGETs 2020 WIND ARGENTINA WIND PERU IPP CONSOLIDATION KOSTEN DUNA/HUAMBOS EBITDA: € 5.5 M 24 MW EBITDA: € 4.5 M 36 MW 350 IN OPERATION MW UP TO 2020 COD: Q3‘19 COD: Q2’20 RECURRING REVENUE € 38 M SOLAR CHILE SOLAR SPAIN EBITDA € 31 M PMGD Package ESCUDEROS 67 % SPAIN EBITDA: € 9 M EBITDA: € 12
Slide 9: Financial Results FY 2018
Financial Results FY 2018
Slide 10: Key Features
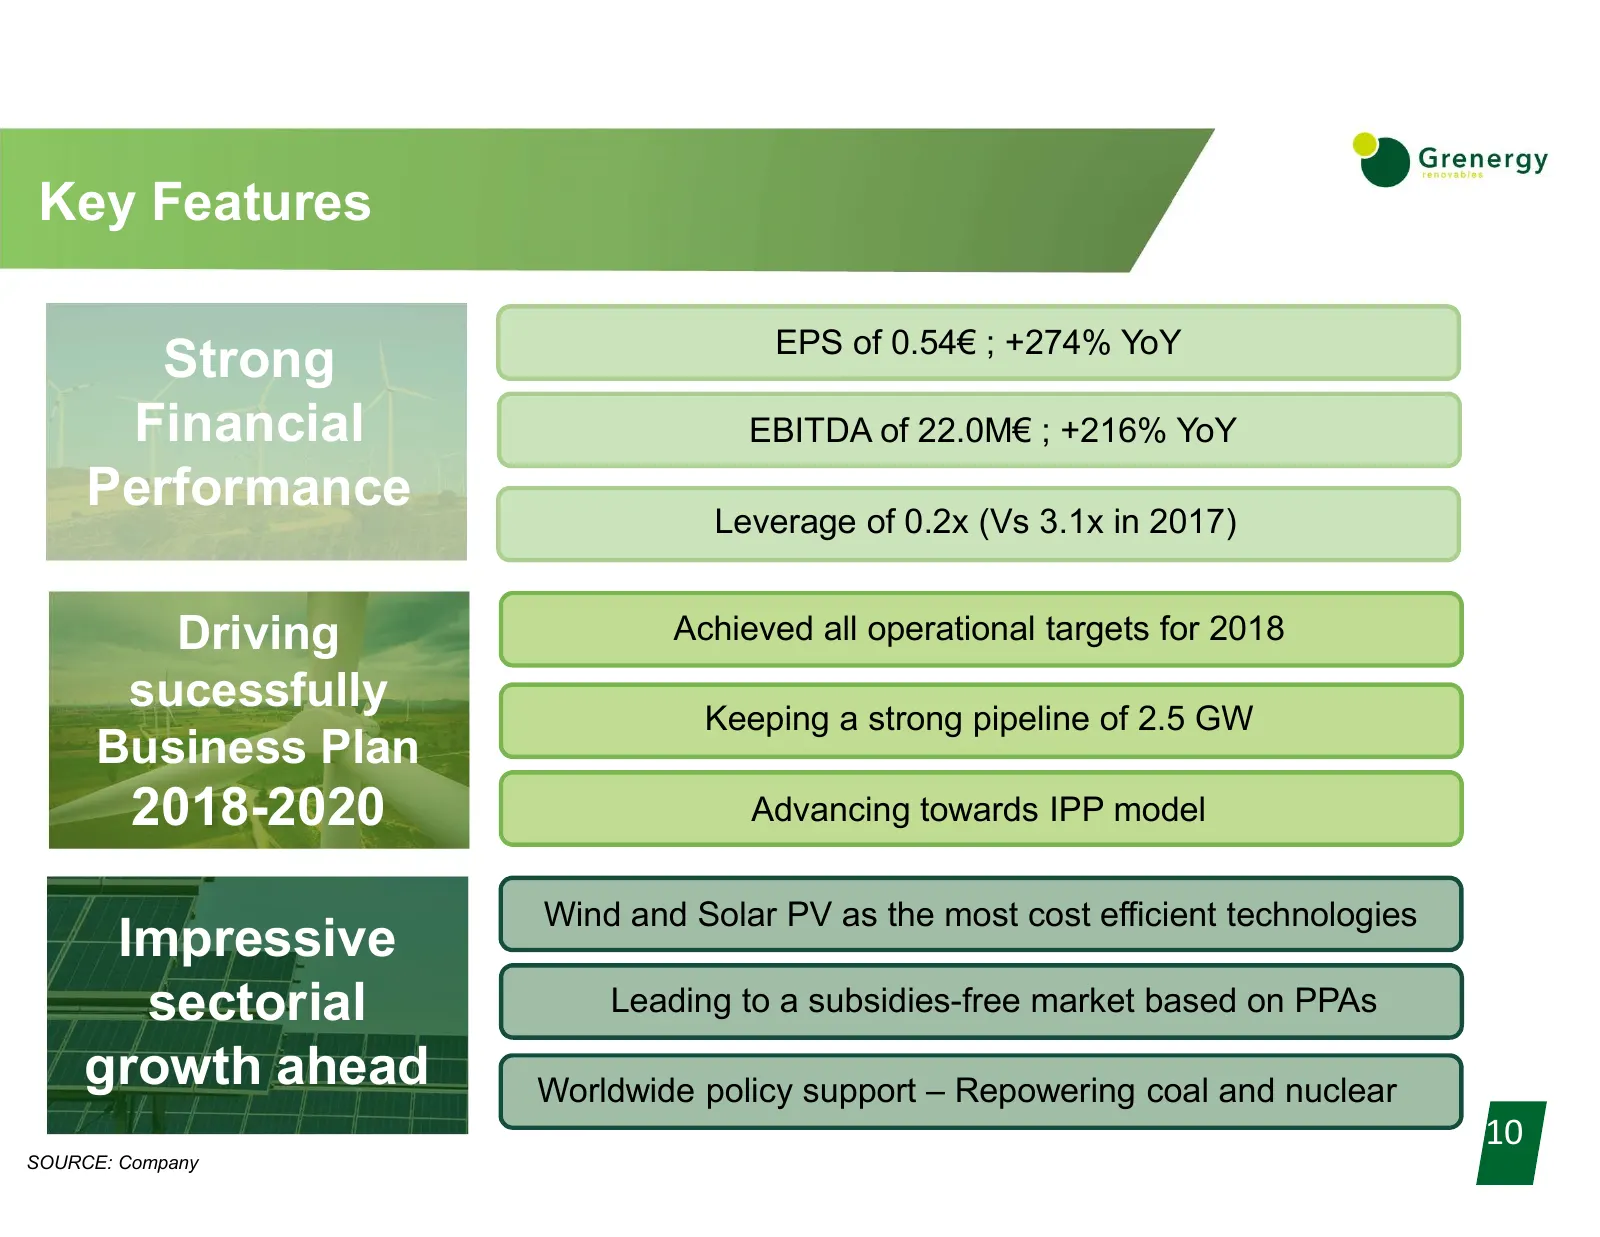
Key Features EPS of 0.54€ ; +274% YoY Strong Financial EBITDA of 22.0M€ ; +216% YoY Performance Leverage of 0.2x (Vs 3.1x in 2017) Driving Achieved all operational targets for 2018 sucessfully Keeping a strong pipeline of 2.5 GW Business Plan 2018-2020 Advancing towards IPP model Wind and Solar PV a
Slide 11: Business plan review
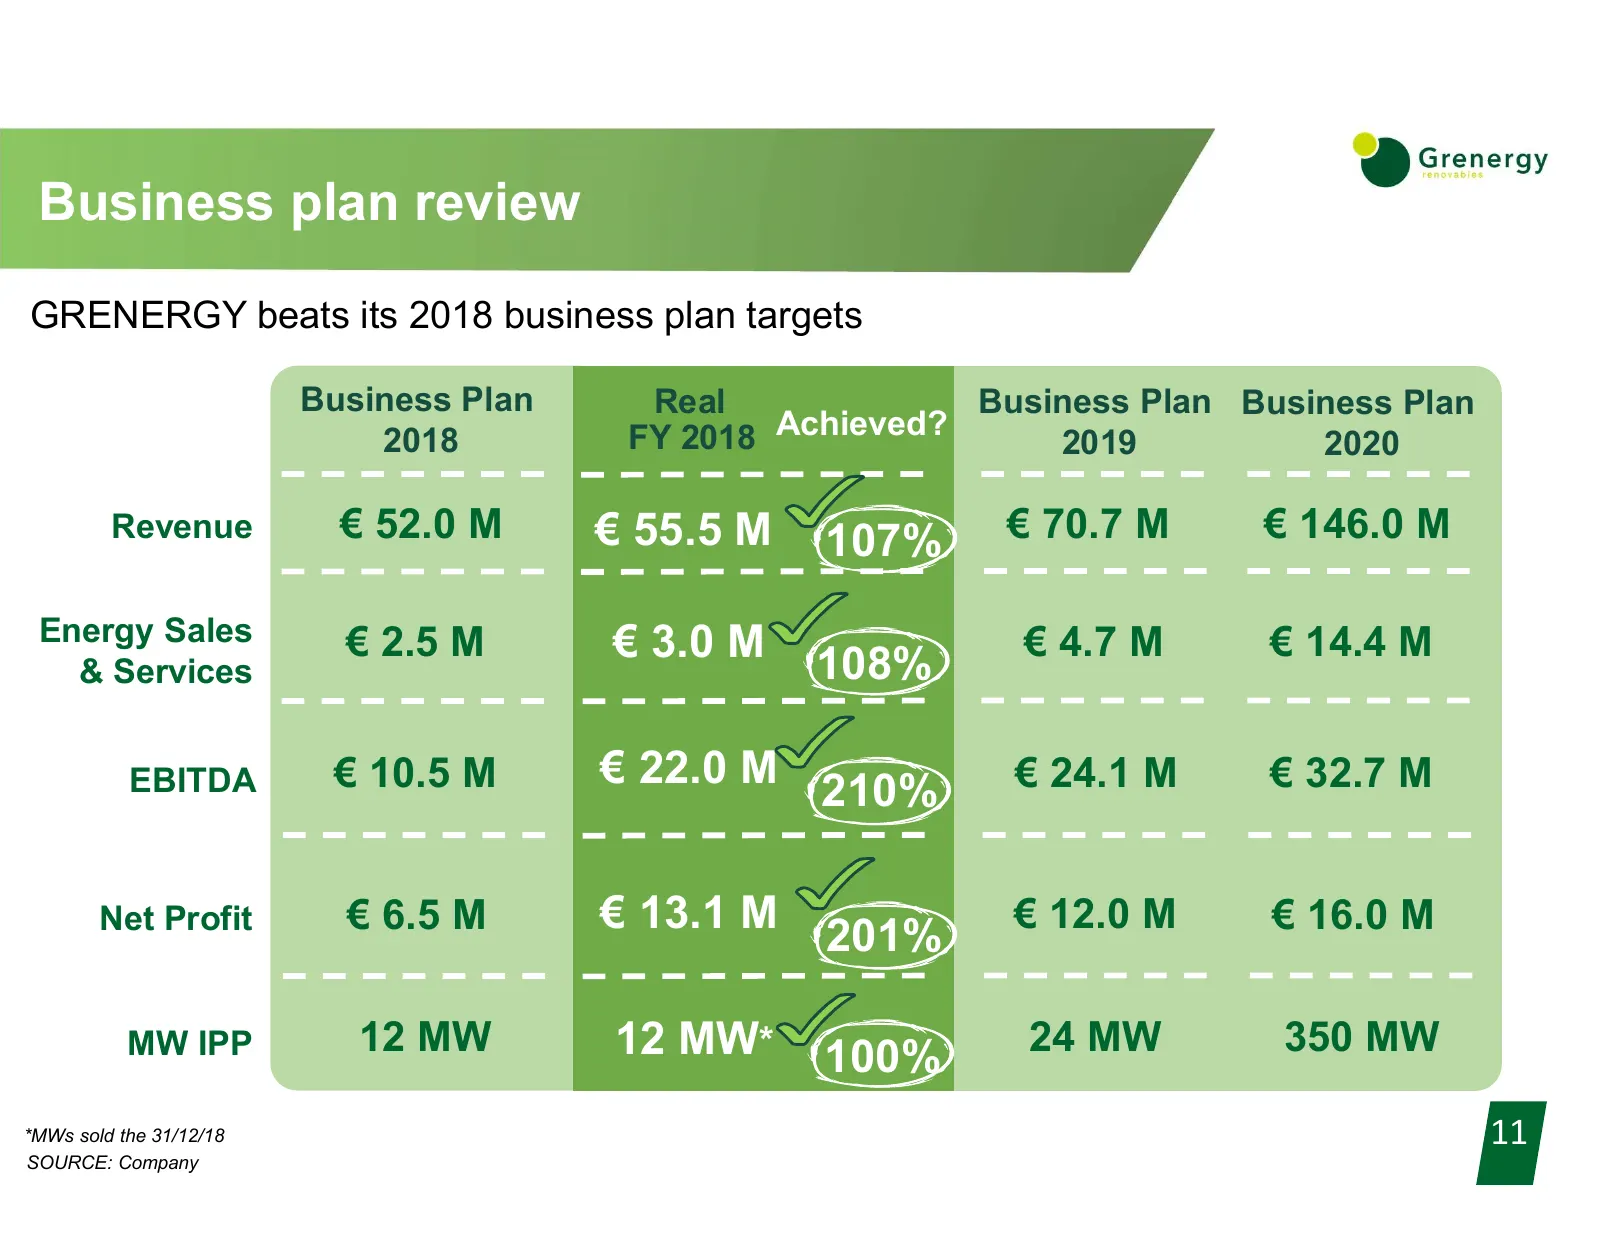
Business plan review GRENERGY beats its 2018 business plan targets Business Plan Real Business Plan Business Plan FY 2018 Achieved? 2018 2019 2020 Revenue € 52.0 M € 55.5 M 107% € 70.7 M € 146.0 M Energy Sales € 2.5 M € 3.0 M € 4.7 M € 14.4 M & Services 108% EBITDA € 10.5 M € 22.0 M € 24.1 M € 32.7
Slide 12: Revenue FY18
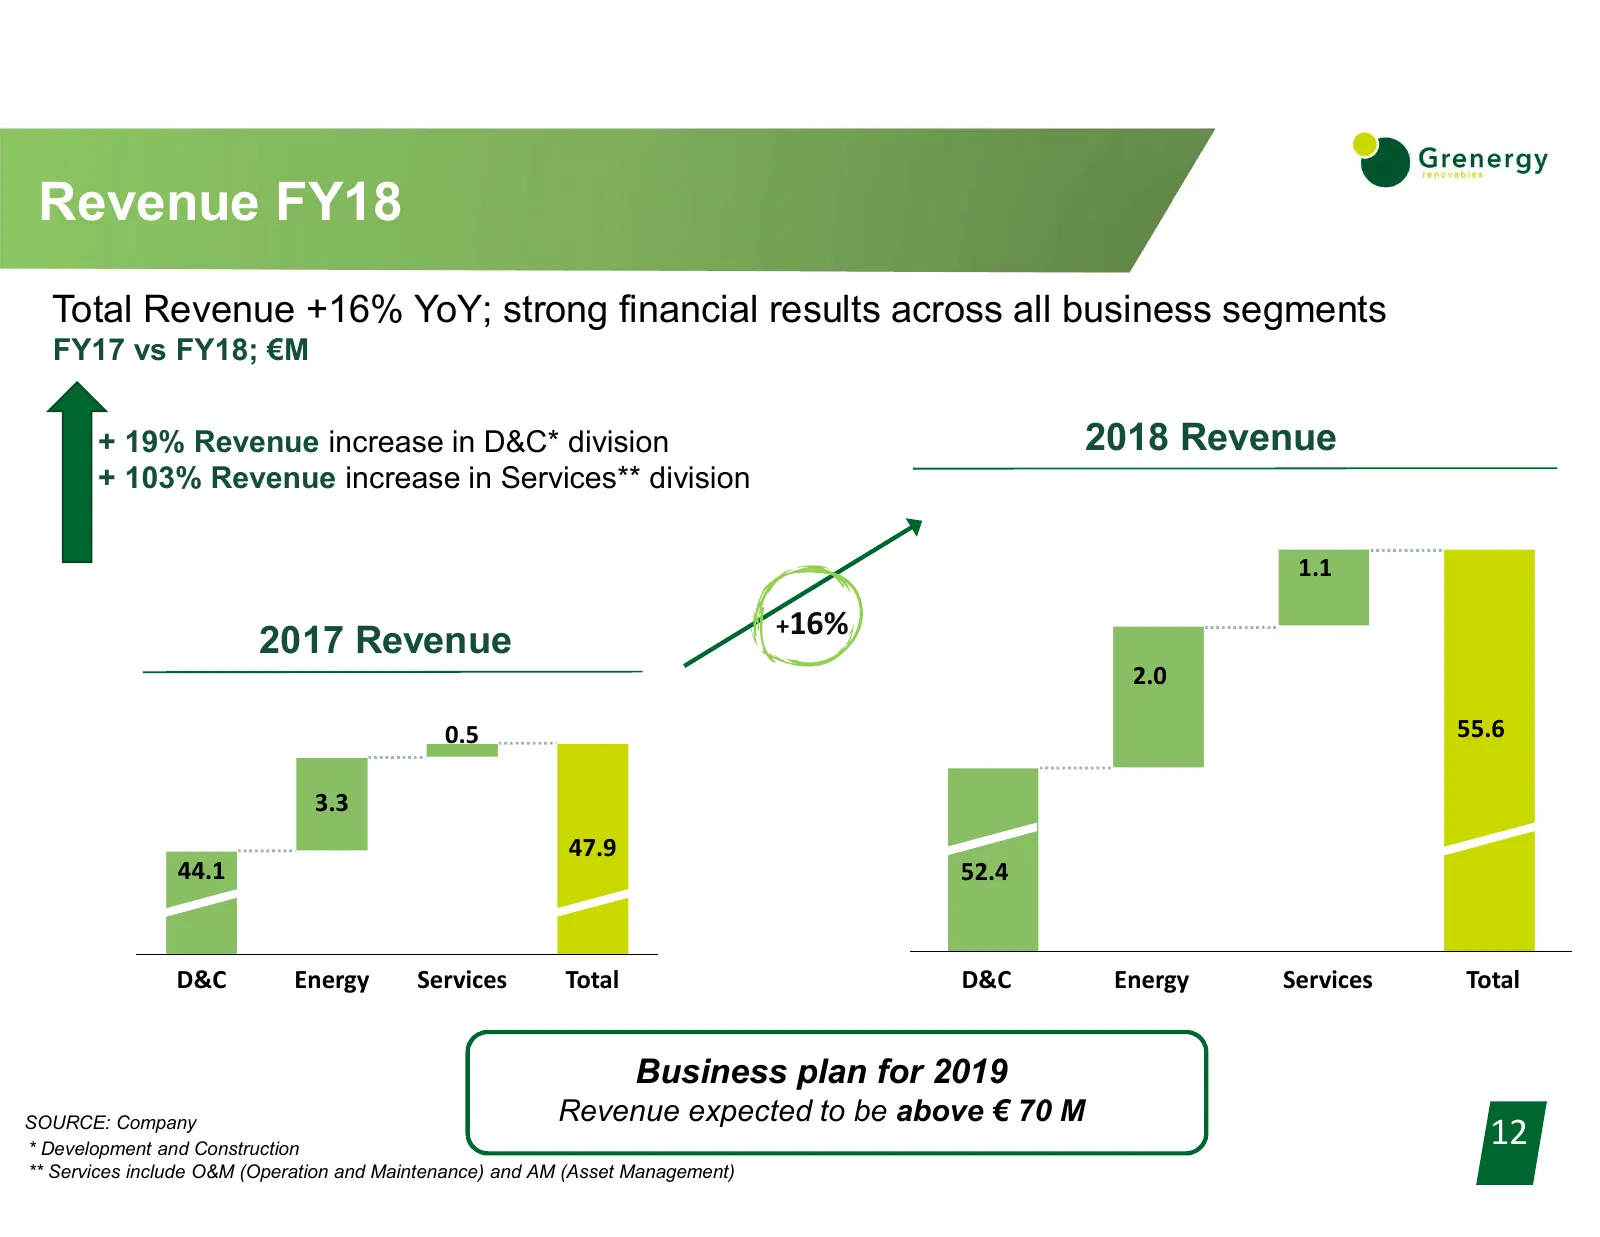
Revenue FY18 Total Revenue +16% YoY; strong financial results across all business segments FY17 vs FY18; €M + 19% Revenue increase in D&C* division 2018 Revenue + 103% Revenue increase in Services** division 1.1 +16% 2017 Revenue 2.0 0.5 55.6 3.3 47.9 44.1 52.4 D&C Energy Services Total D&C Energy S
Slide 13: EBITDA tripled in FY18
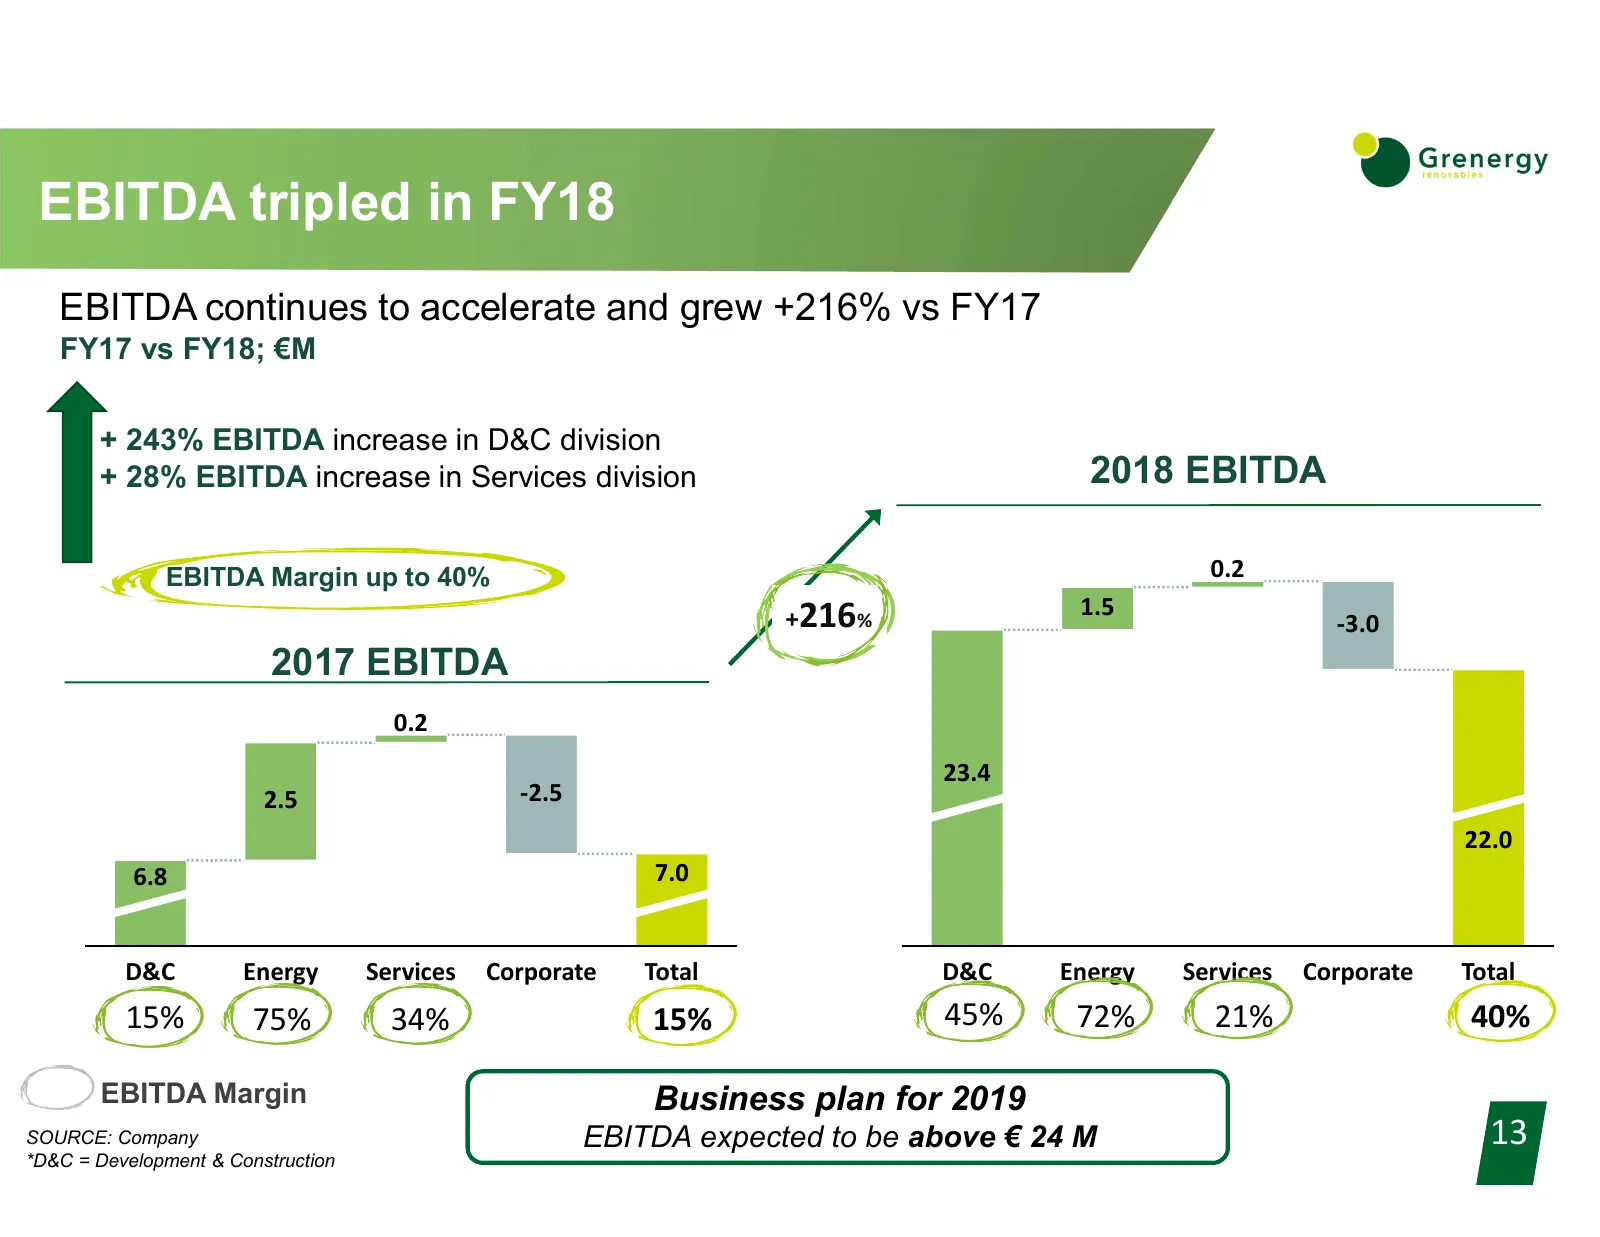
EBITDA tripled in FY18 EBITDA continues to accelerate and grew +216% vs FY17 FY17 vs FY18; €M + 243% EBITDA increase in D&C division + 28% EBITDA increase in Services division 2018 EBITDA EBITDA Margin up to 40% 0.2 +216% 1.5 -3.0 2017 EBITDA 0.2 23.4 2.5 -2.5 22.0 6.8 7.0 D&C Energy Services Corpor
Slide 14: Change in Net Debt and Leverage
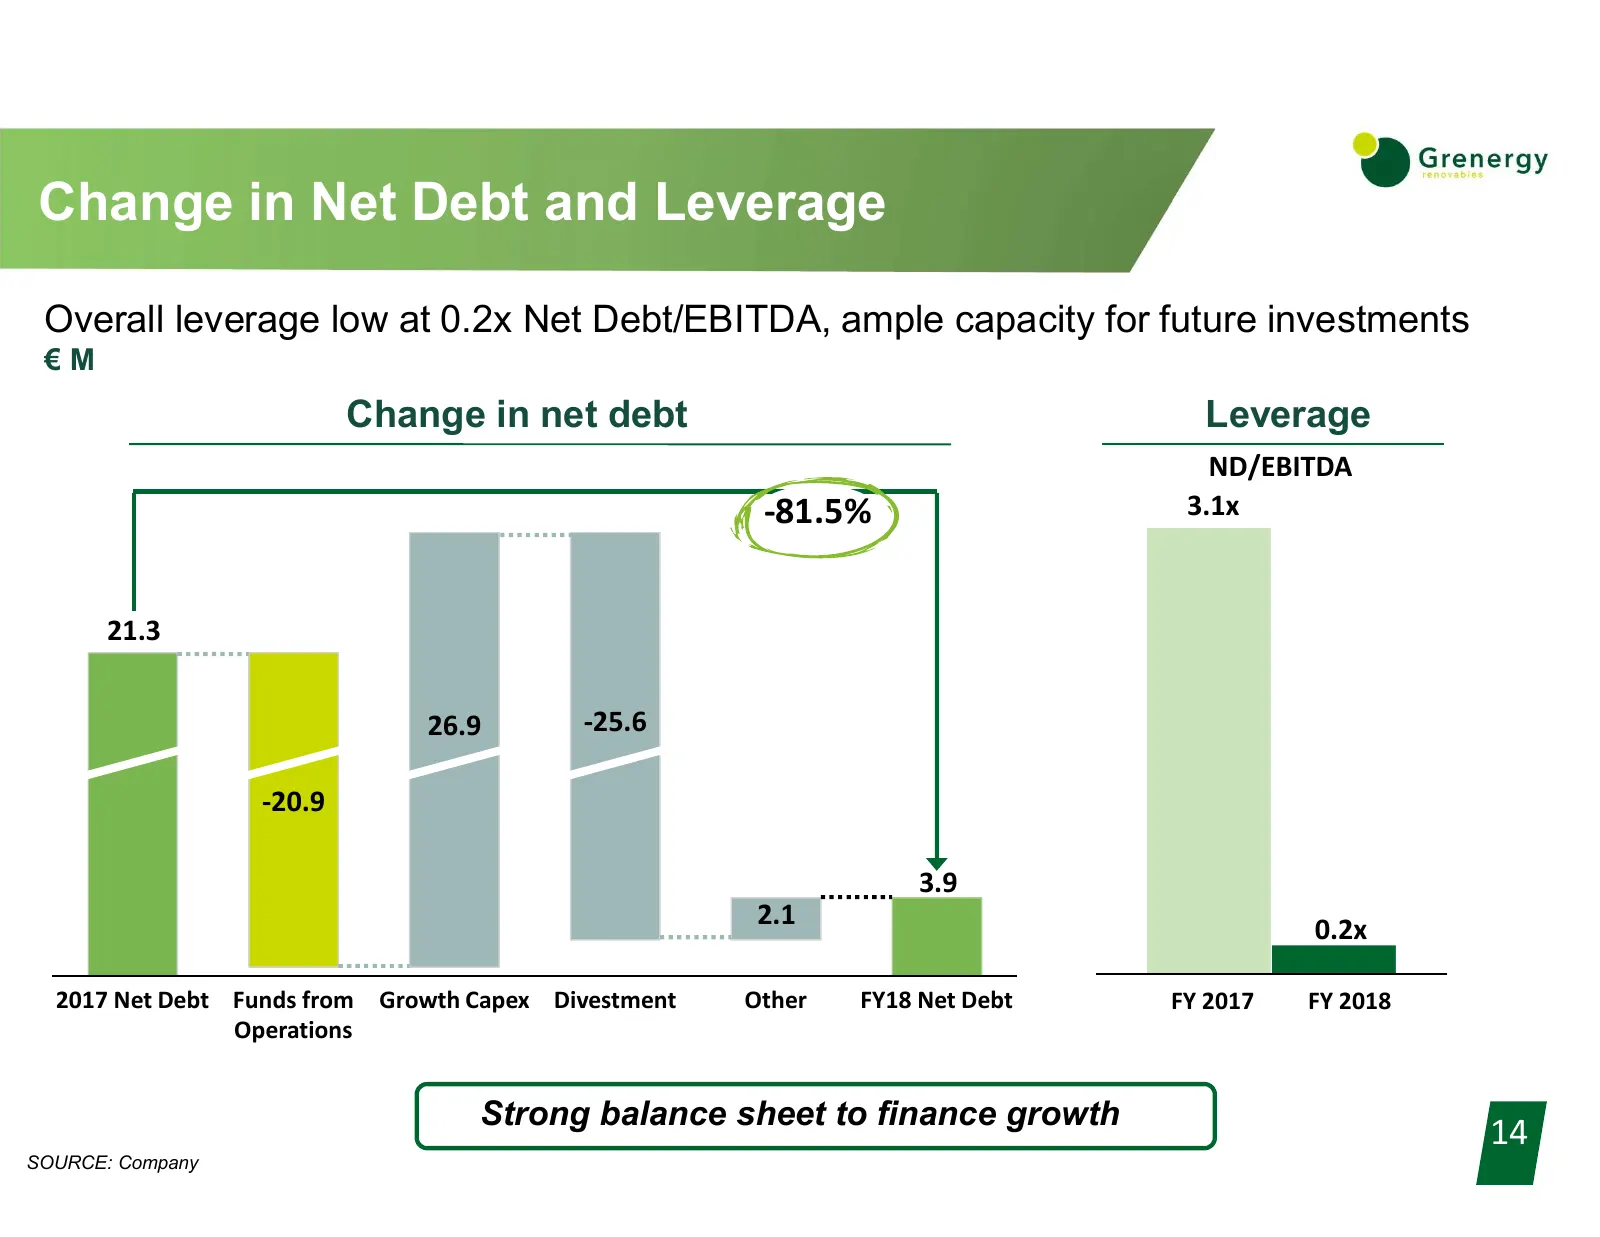
Change in Net Debt and Leverage Overall leverage low at 0.2x Net Debt/EBITDA, ample capacity for future investments €M Change in net debt Leverage ND/EBITDA -81.5% 3.1x 21.3 26.9 -25.6 -20.9 3.9 2.1 0.2x 2017 Net Debt Funds from Growth Capex Divestment Other FY18 Net Debt FY 2017 FY 2018 Operations
Slide 15: Cash Flow FY18
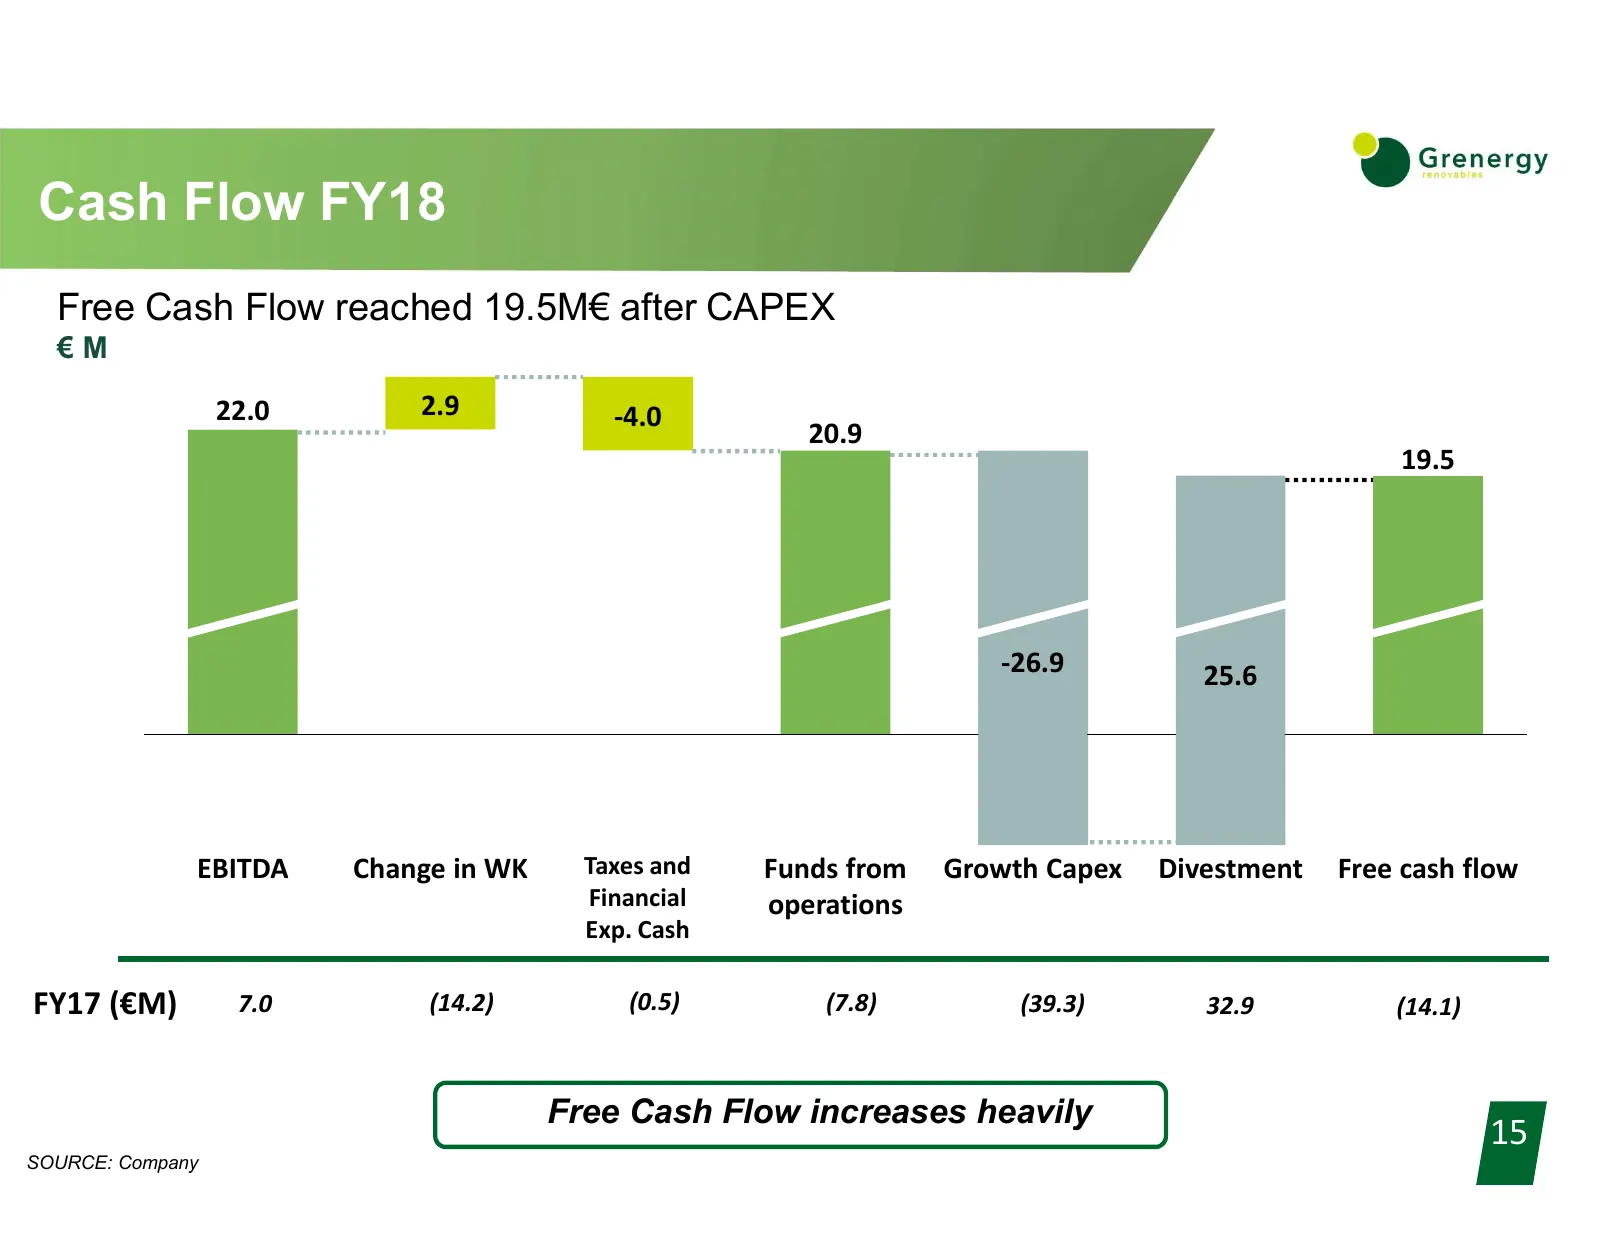
Cash Flow FY18 Free Cash Flow reached 19.5M€ after CAPEX €M 22.0 2.9 -4.0 20.9 19.5 -26.9 25.6 EBITDA Change in WK Taxes and Funds from Growth Capex Divestment Free cash flow Financial operations Exp. Cash FY17 (€M) 7.0 (14.2) (0.5) (7.8) (39.3) 32.9 (14.1) Free Cash Flow increases heavily 15 SOURCE
Slide 16: 3 Pipeline
Slide 17: Pipeline stages
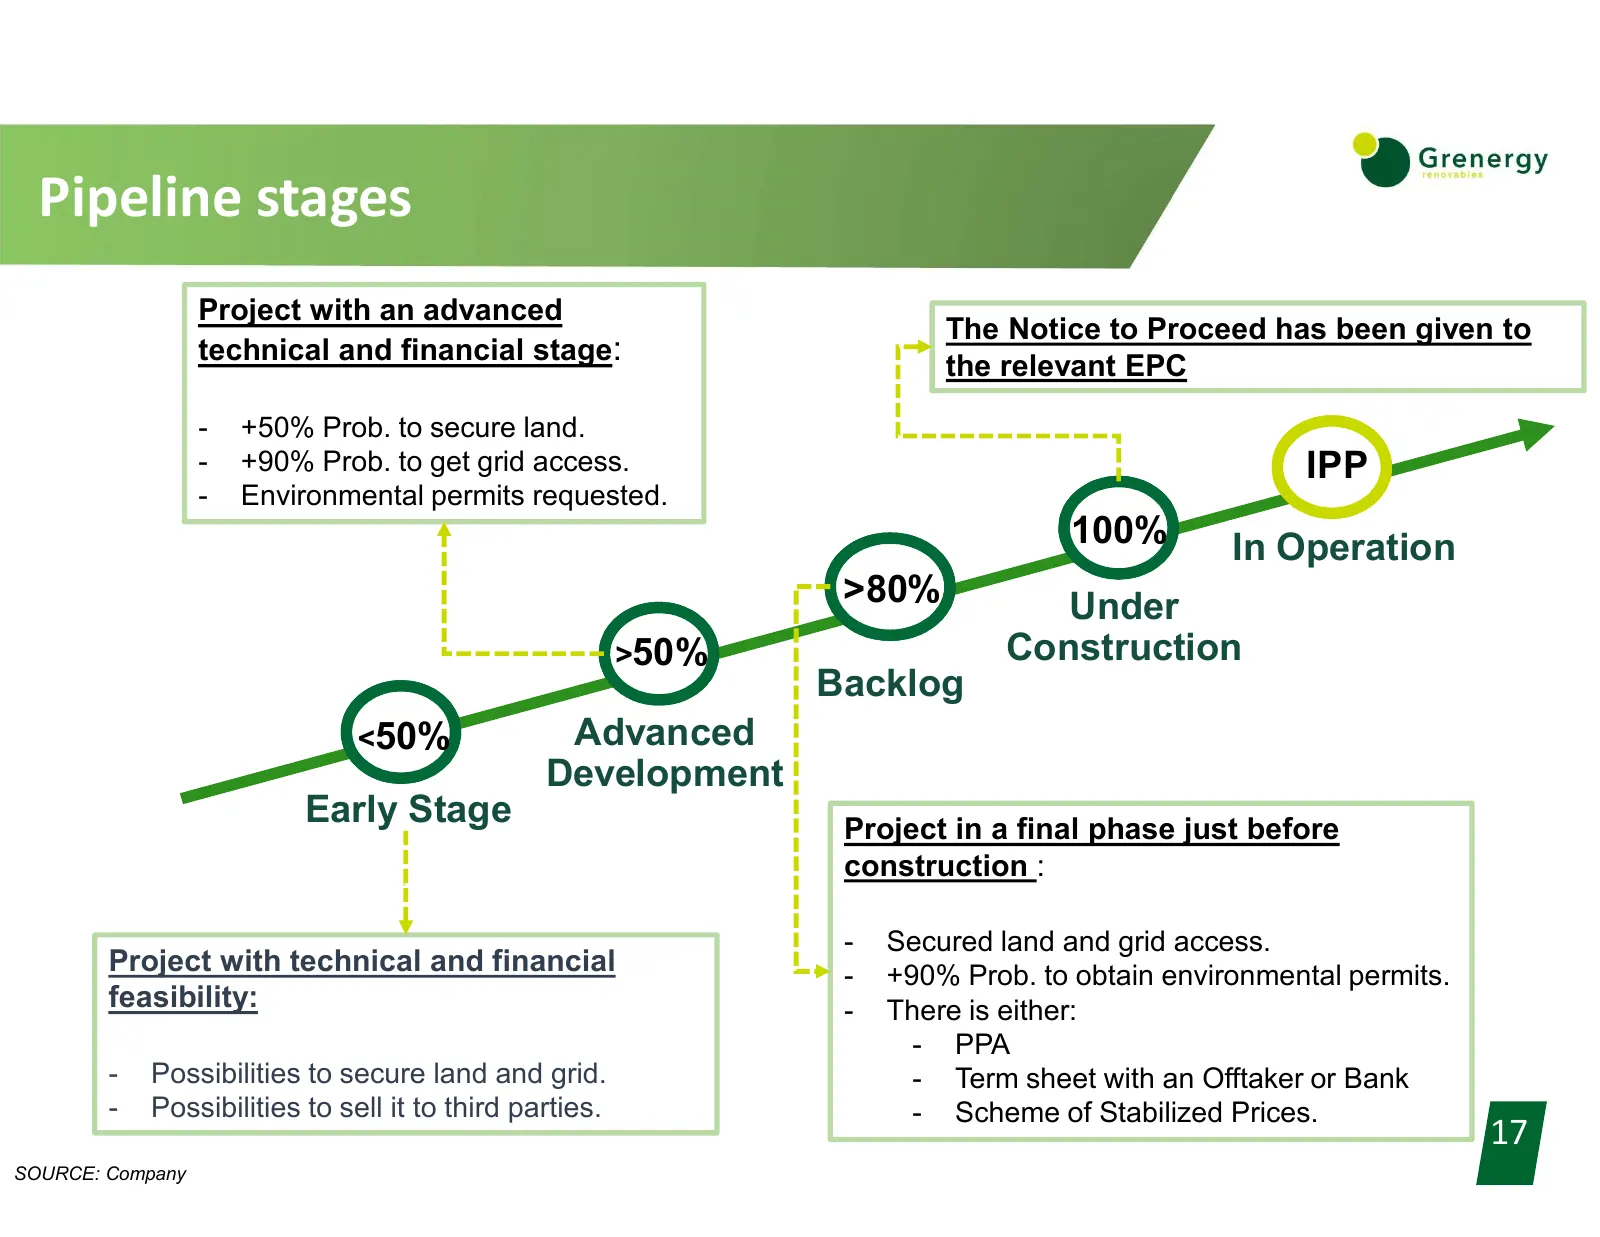
Pipeline stages Project with an advanced The Notice to Proceed has been given to technical and financial stage: the relevant EPC - +50% Prob. to secure land. - +90% Prob. to get grid access. IPP - Environmental permits requested. 100% In Operation >80% Under >50% Construction Backlog <50% Advanced D
Slide 18: Operations Update – Solar PV
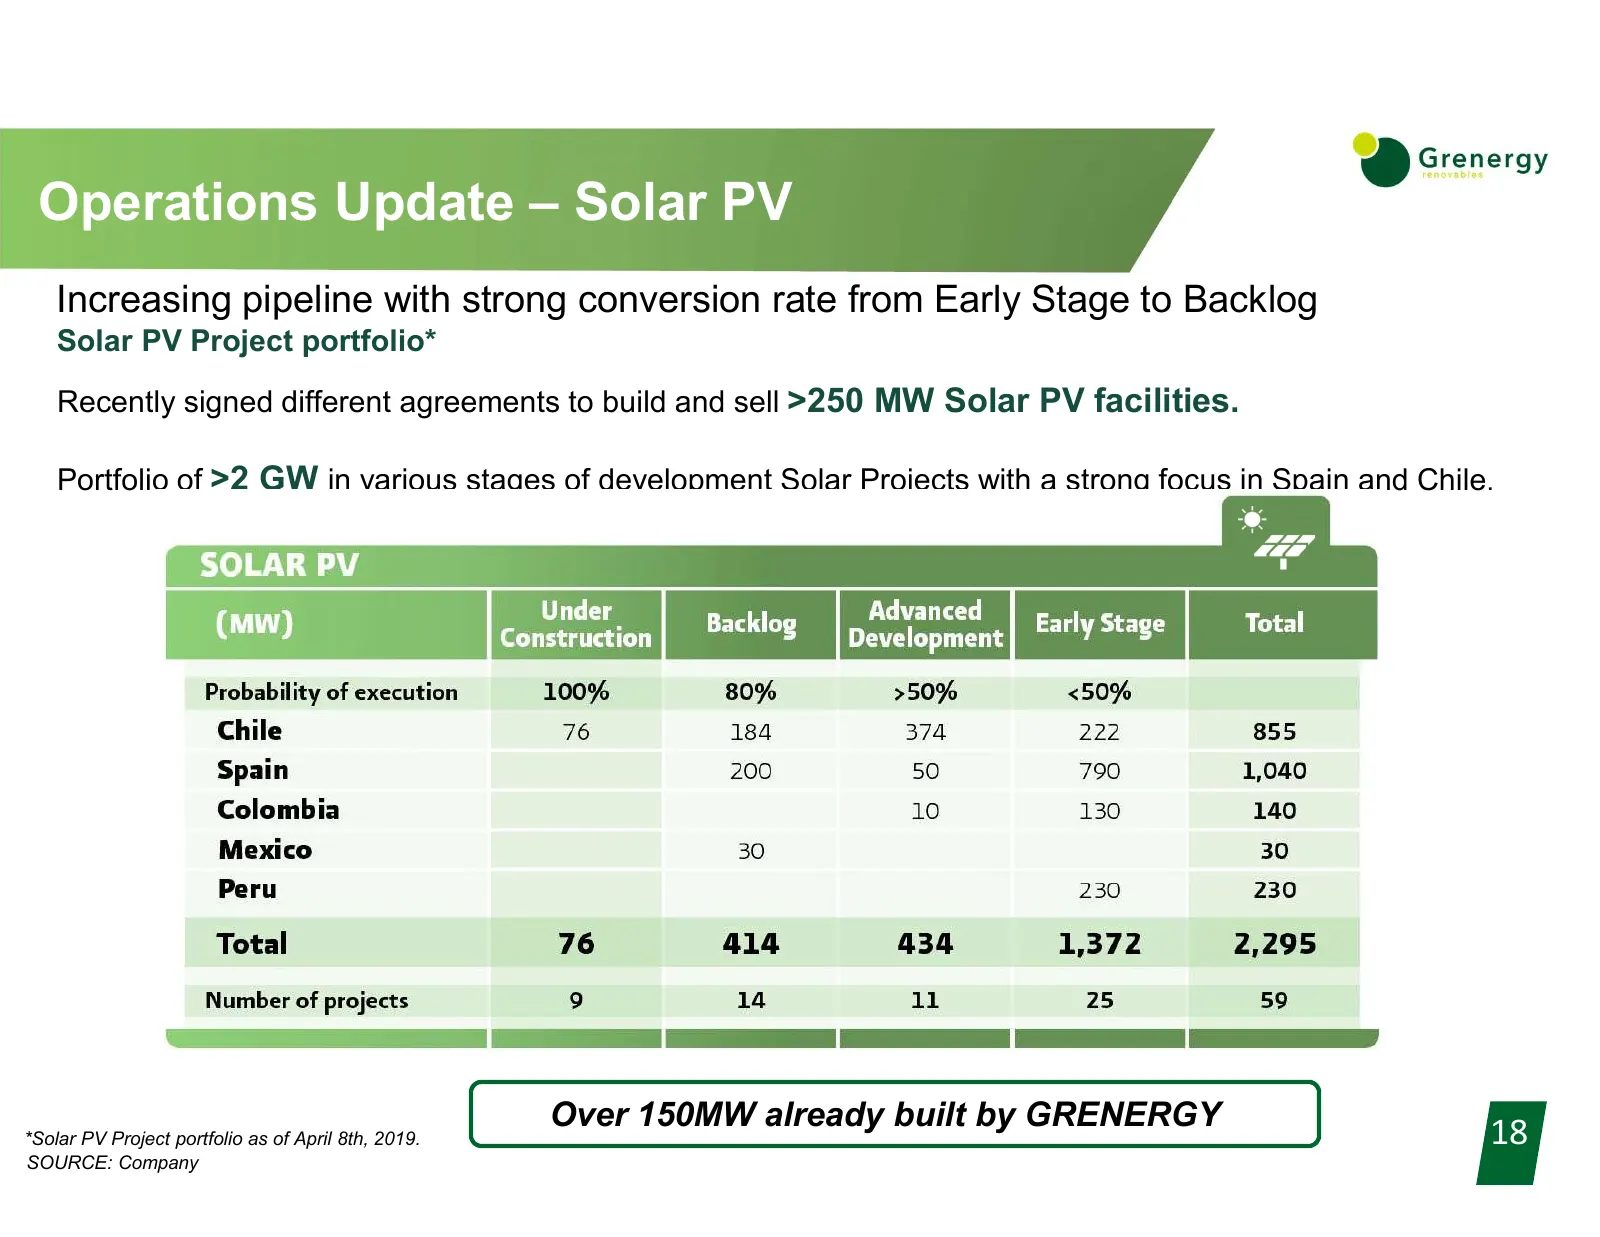
Operations Update – Solar PV Increasing pipeline with strong conversion rate from Early Stage to Backlog Solar PV Project portfolio* Recently signed different agreements to build and sell >250 MW Solar PV facilities. Portfolio of >2 GW in various stages of development Solar Projects with a strong fo
Slide 19: Operations Update – Wind
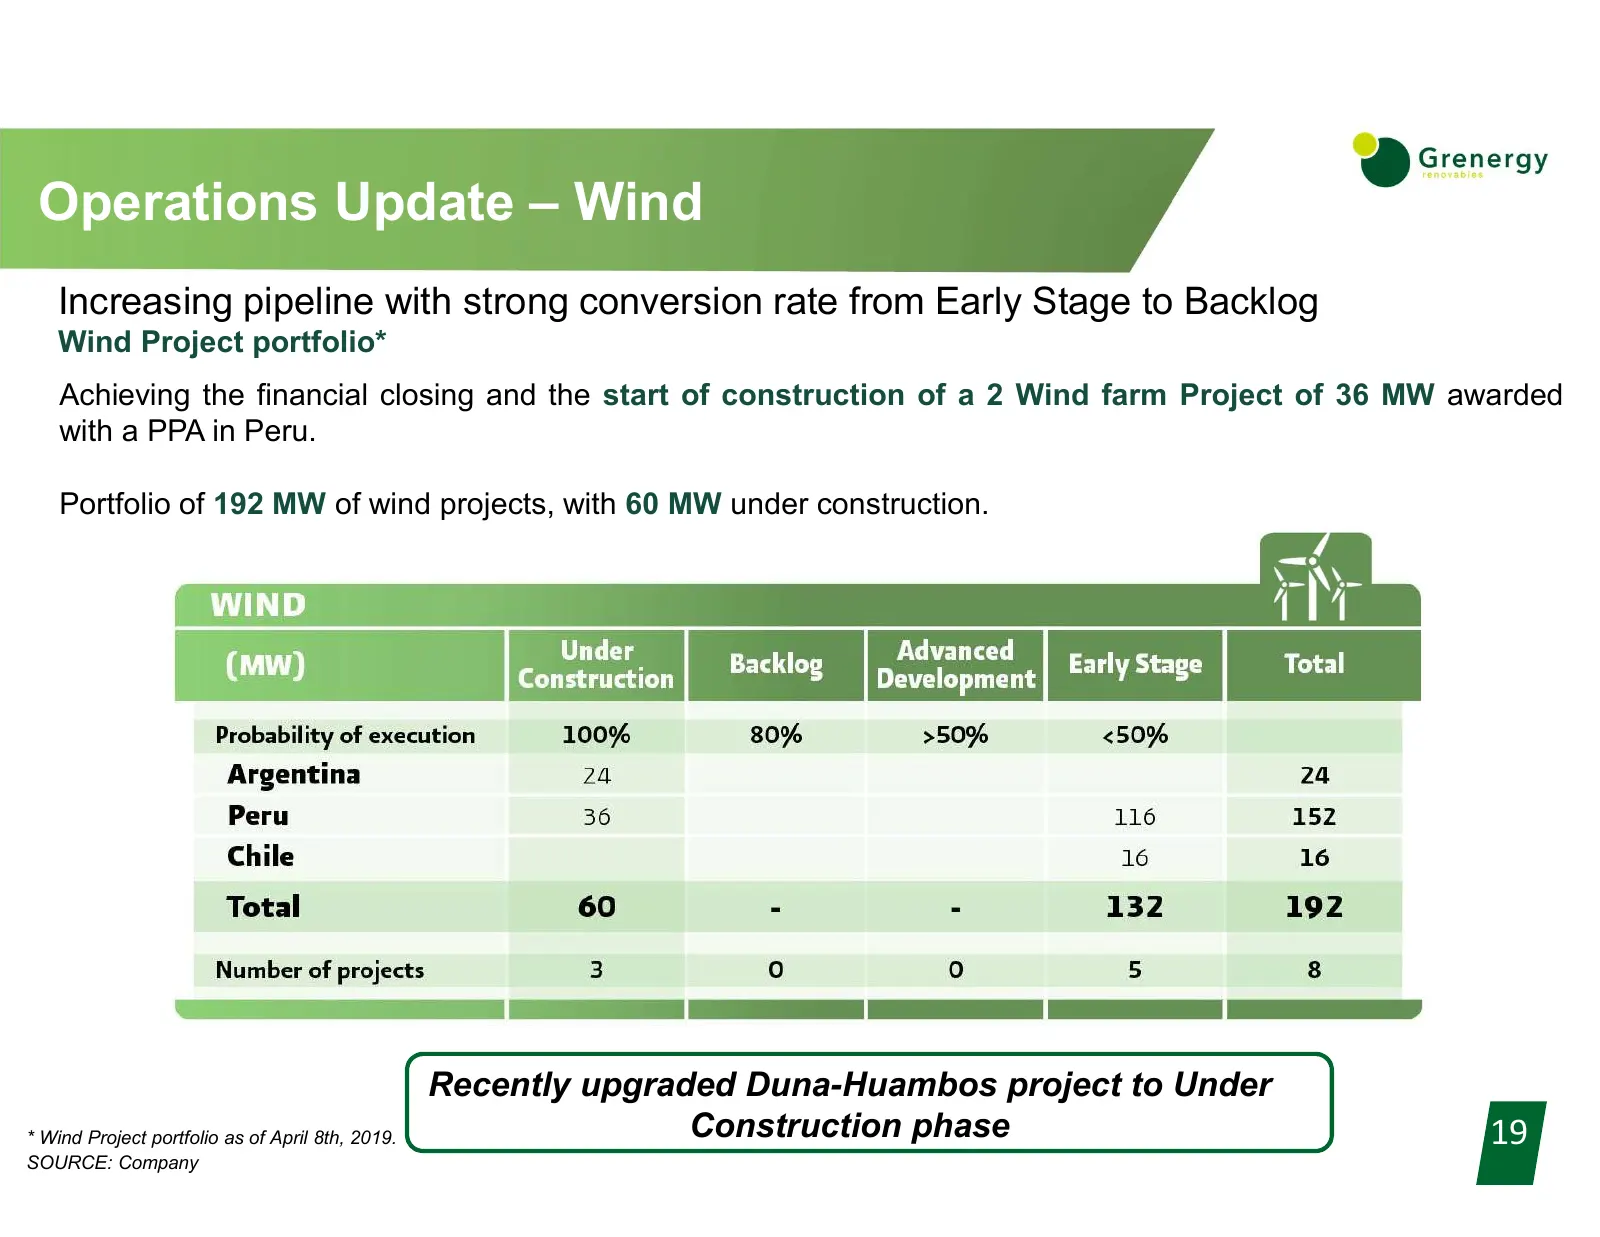
Operations Update – Wind Increasing pipeline with strong conversion rate from Early Stage to Backlog Wind Project portfolio* Achieving the financial closing and the start of construction of a 2 Wind farm Project of 36 MW awarded with a PPA in Peru. Portfolio of 192 MW of wind projects, with 60 MW un
Slide 20: Operations Update
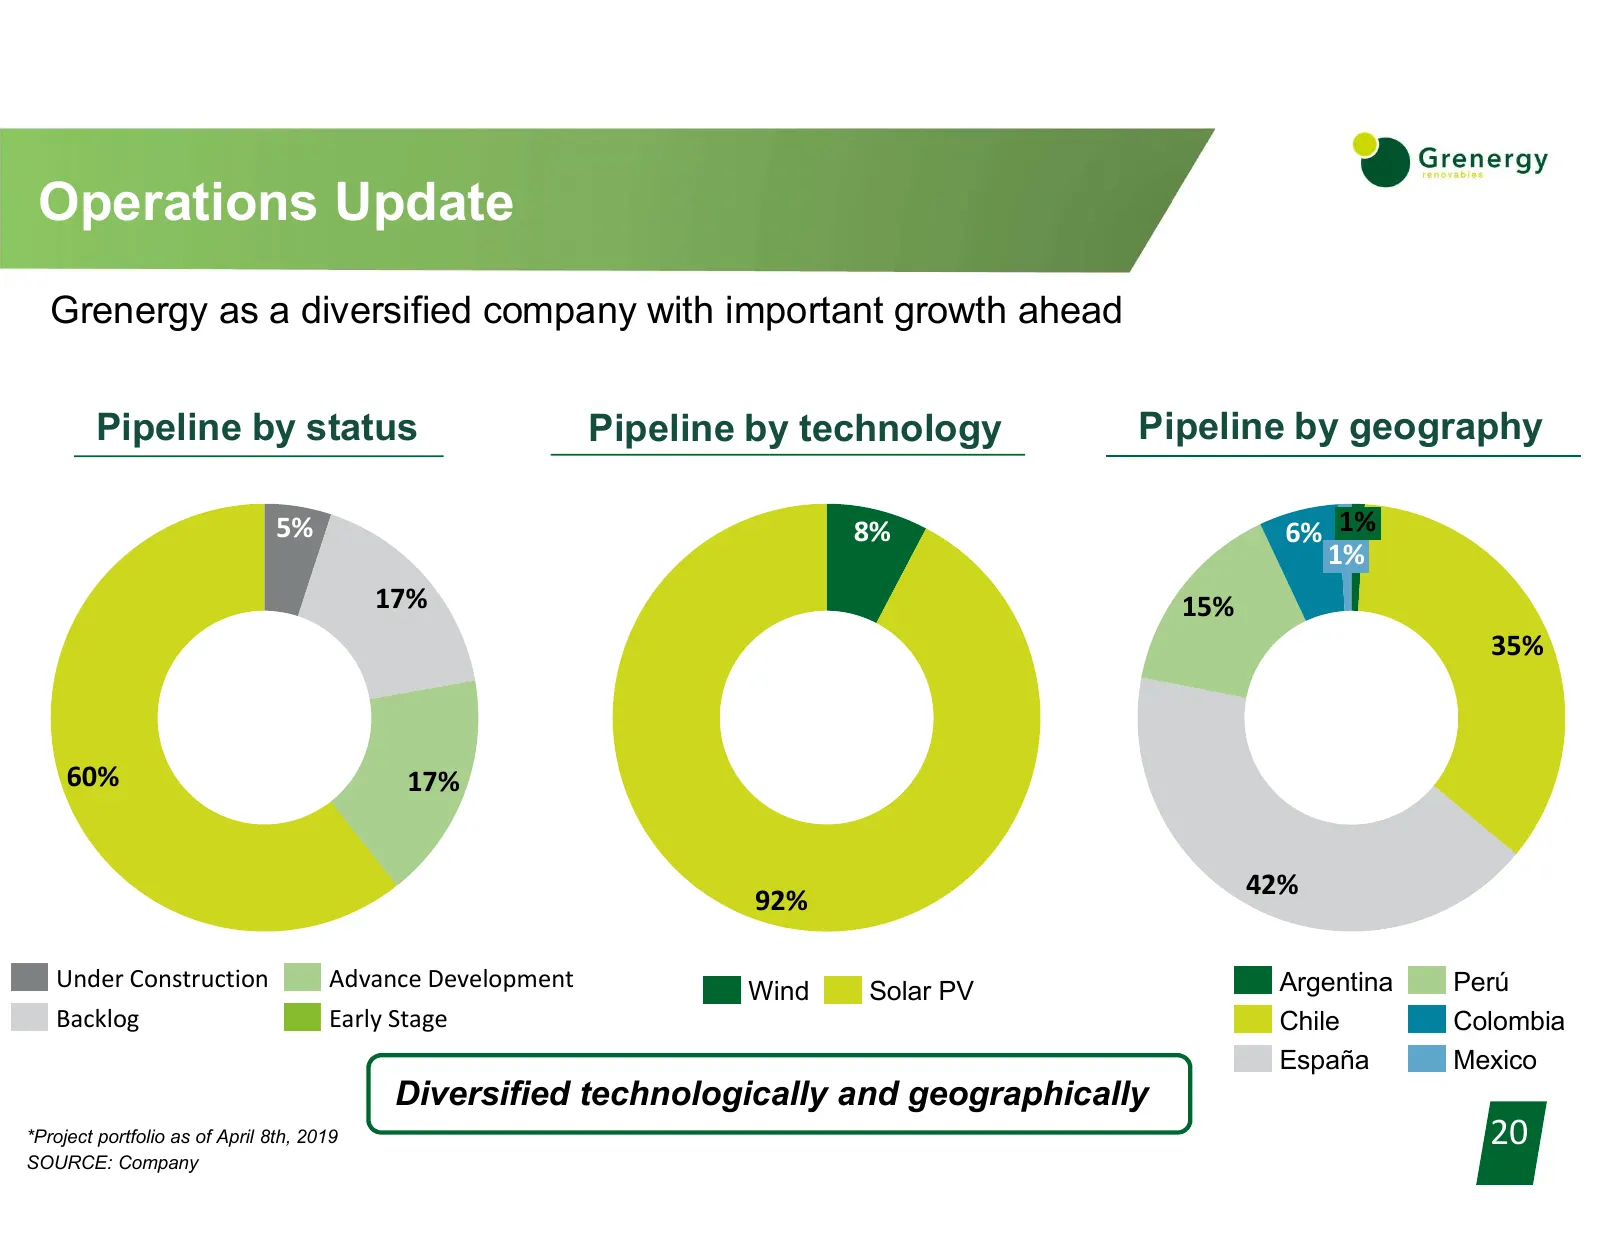
Operations Update Grenergy as a diversified company with important growth ahead Pipeline by status Pipeline by technology Pipeline by geography 5% 8% 6% 1% 1% 17% 15% 35% 60% 17% 42% 92% Under Construction Advance Development Wind Solar PV Argentina Perú Backlog Early Stage Chile Colombia España Mex
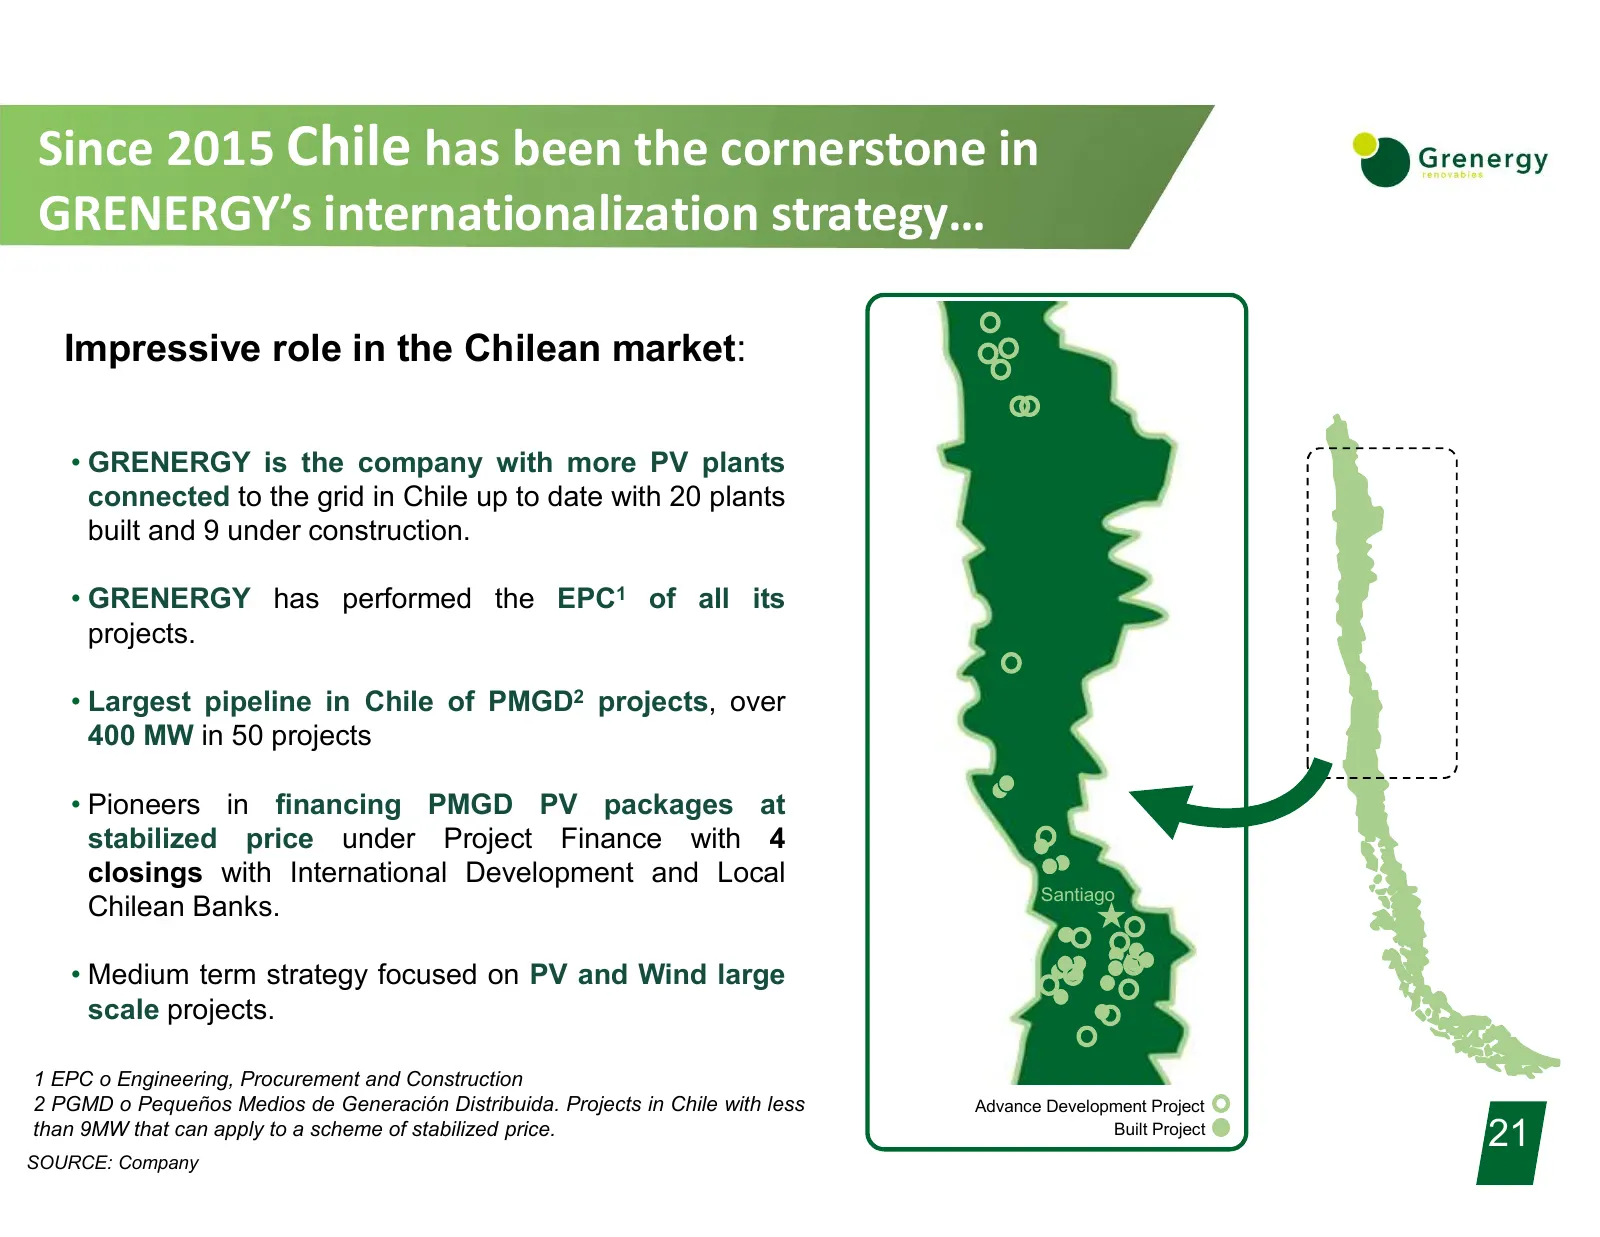
Slide 21: Since 2015 Chile has been the cornerstone in GRENERGY's internationalization strategy
Since 2015 Chile has been the cornerstone in GRENERGY’s internationalization strategy… Impressive role in the Chilean market: • GRENERGY is the company with more PV plants connected to the grid in Chile up to date with 20 plants built and 9 under construction. • GRENERGY has performed the EPC1 of al
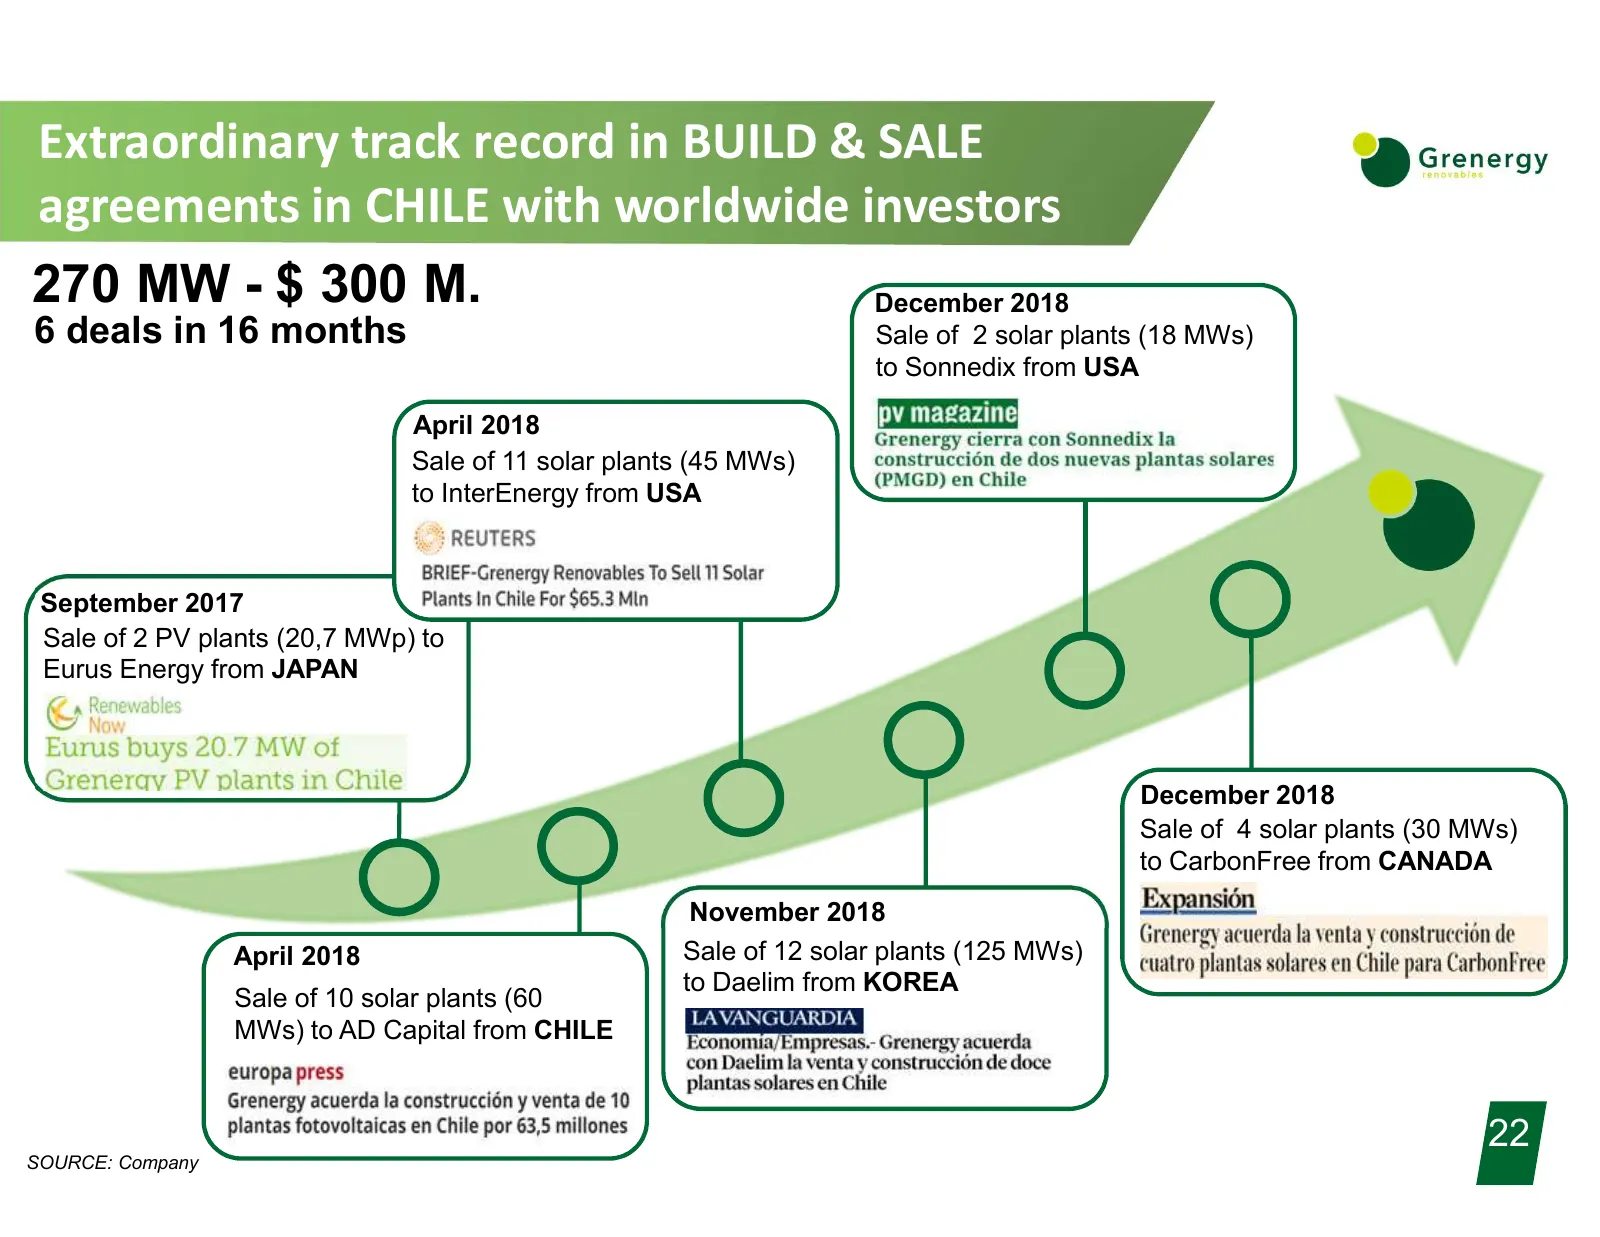
Slide 22: Extraordinary track record in BUILD & SALE agreements in Chile
Extraordinary track record in BUILD & SALE agreements in CHILE with worldwide investors 270 MW - $ 300 M. December 2018 6 deals in 16 months Sale of 2 solar plants (18 MWs) to Sonnedix from USA April 2018 Sale of 11 solar plants (45 MWs) to InterEnergy from USA September 2017 Sale of 2 PV plants (20
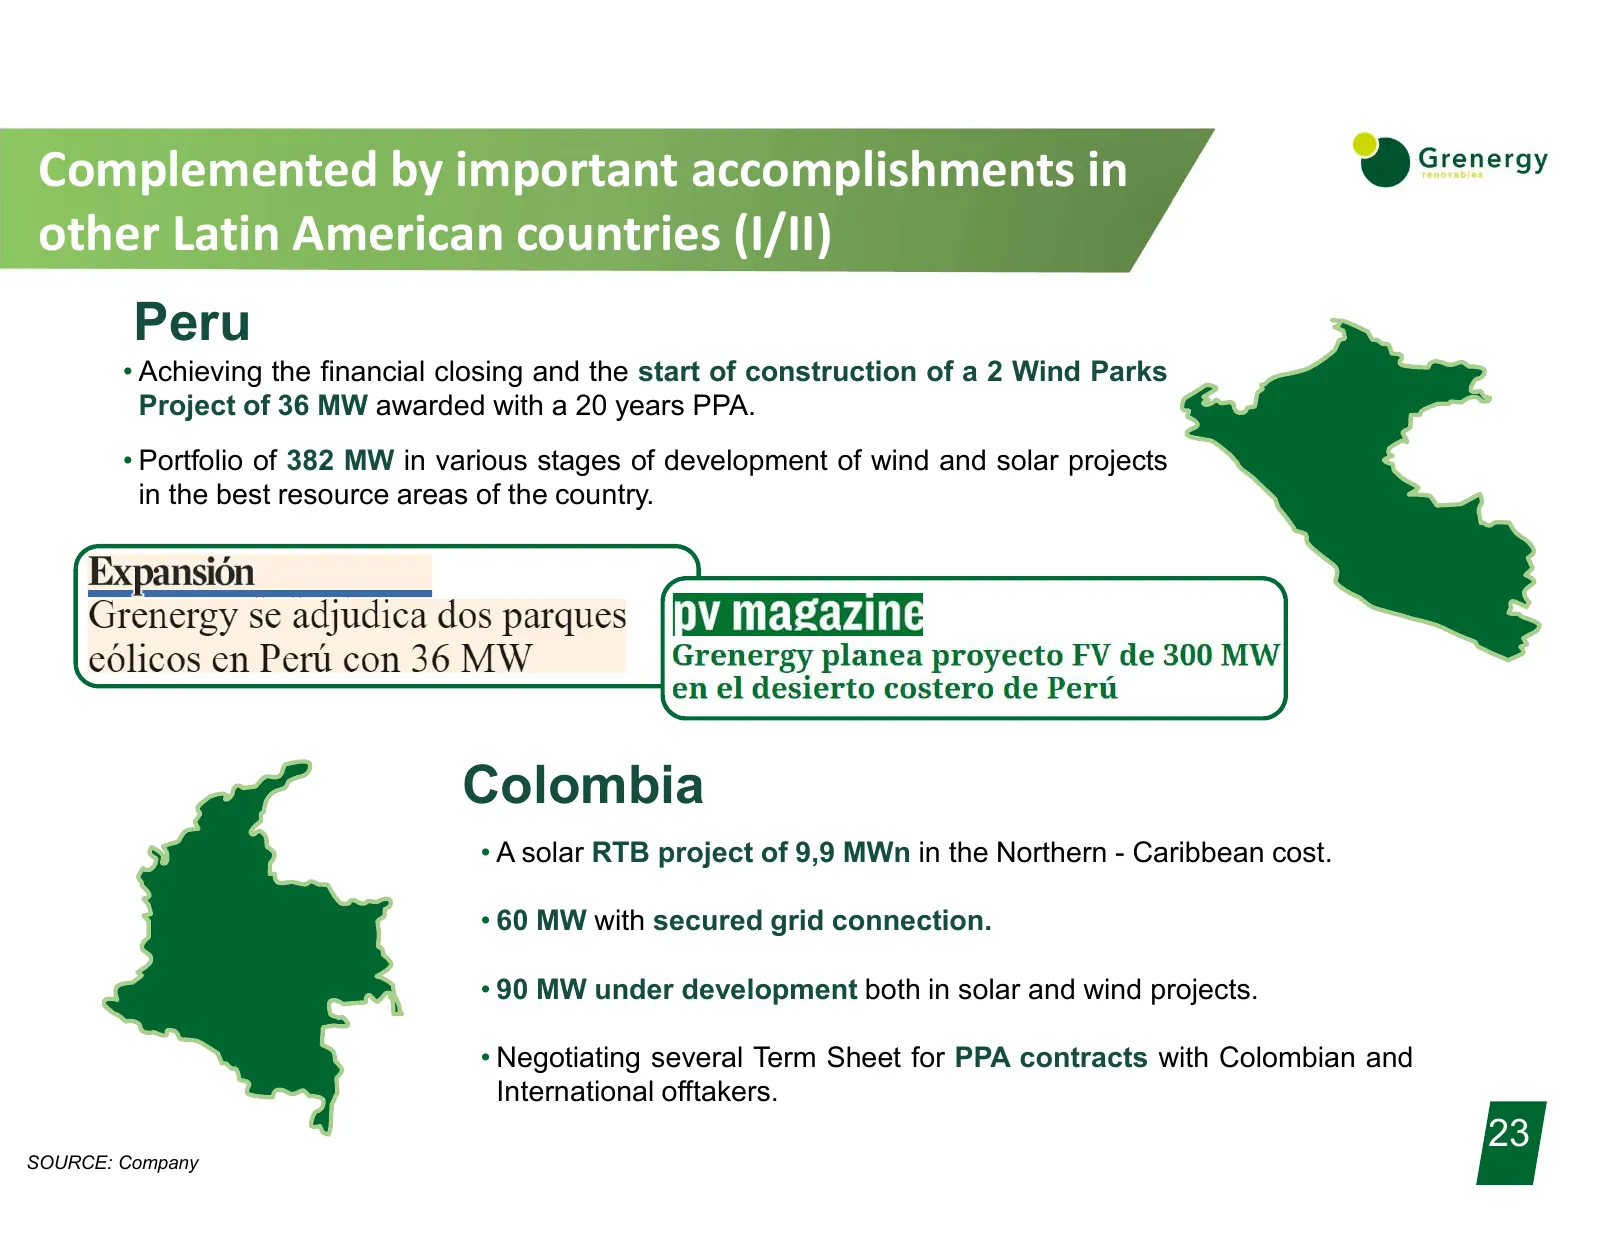
Slide 23: Important accomplishments in other Latin American countries (I/II)
Complemented by important accomplishments in other Latin American countries (I/II) Peru • Achieving the financial closing and the start of construction of a 2 Wind Parks Project of 36 MW awarded with a 20 years PPA. • Portfolio of 382 MW in various stages of development of wind and solar projects in
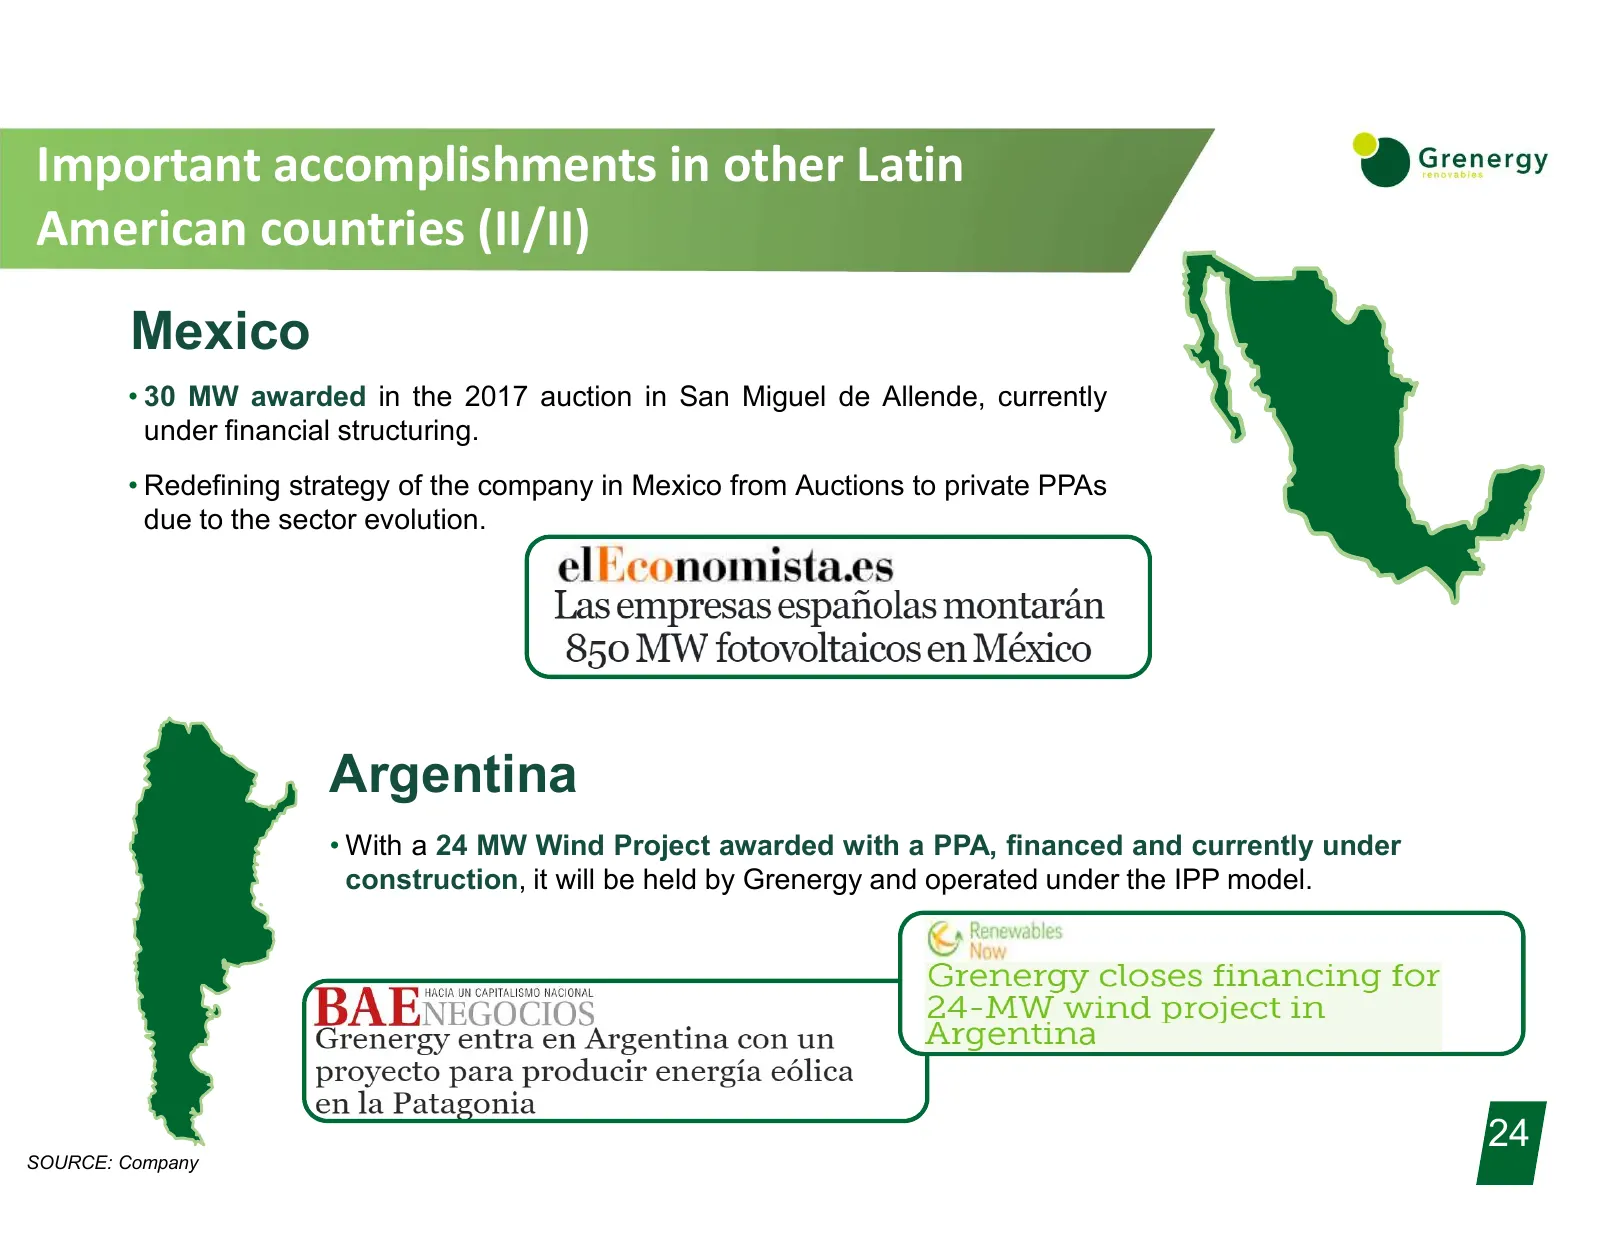
Slide 24: Important accomplishments in other Latin American countries (II/II)
Important accomplishments in other Latin American countries (II/II) Mexico • 30 MW awarded in the 2017 auction in San Miguel de Allende, currently under financial structuring. • Redefining strategy of the company in Mexico from Auctions to private PPAs due to the sector evolution. Argentina • With a
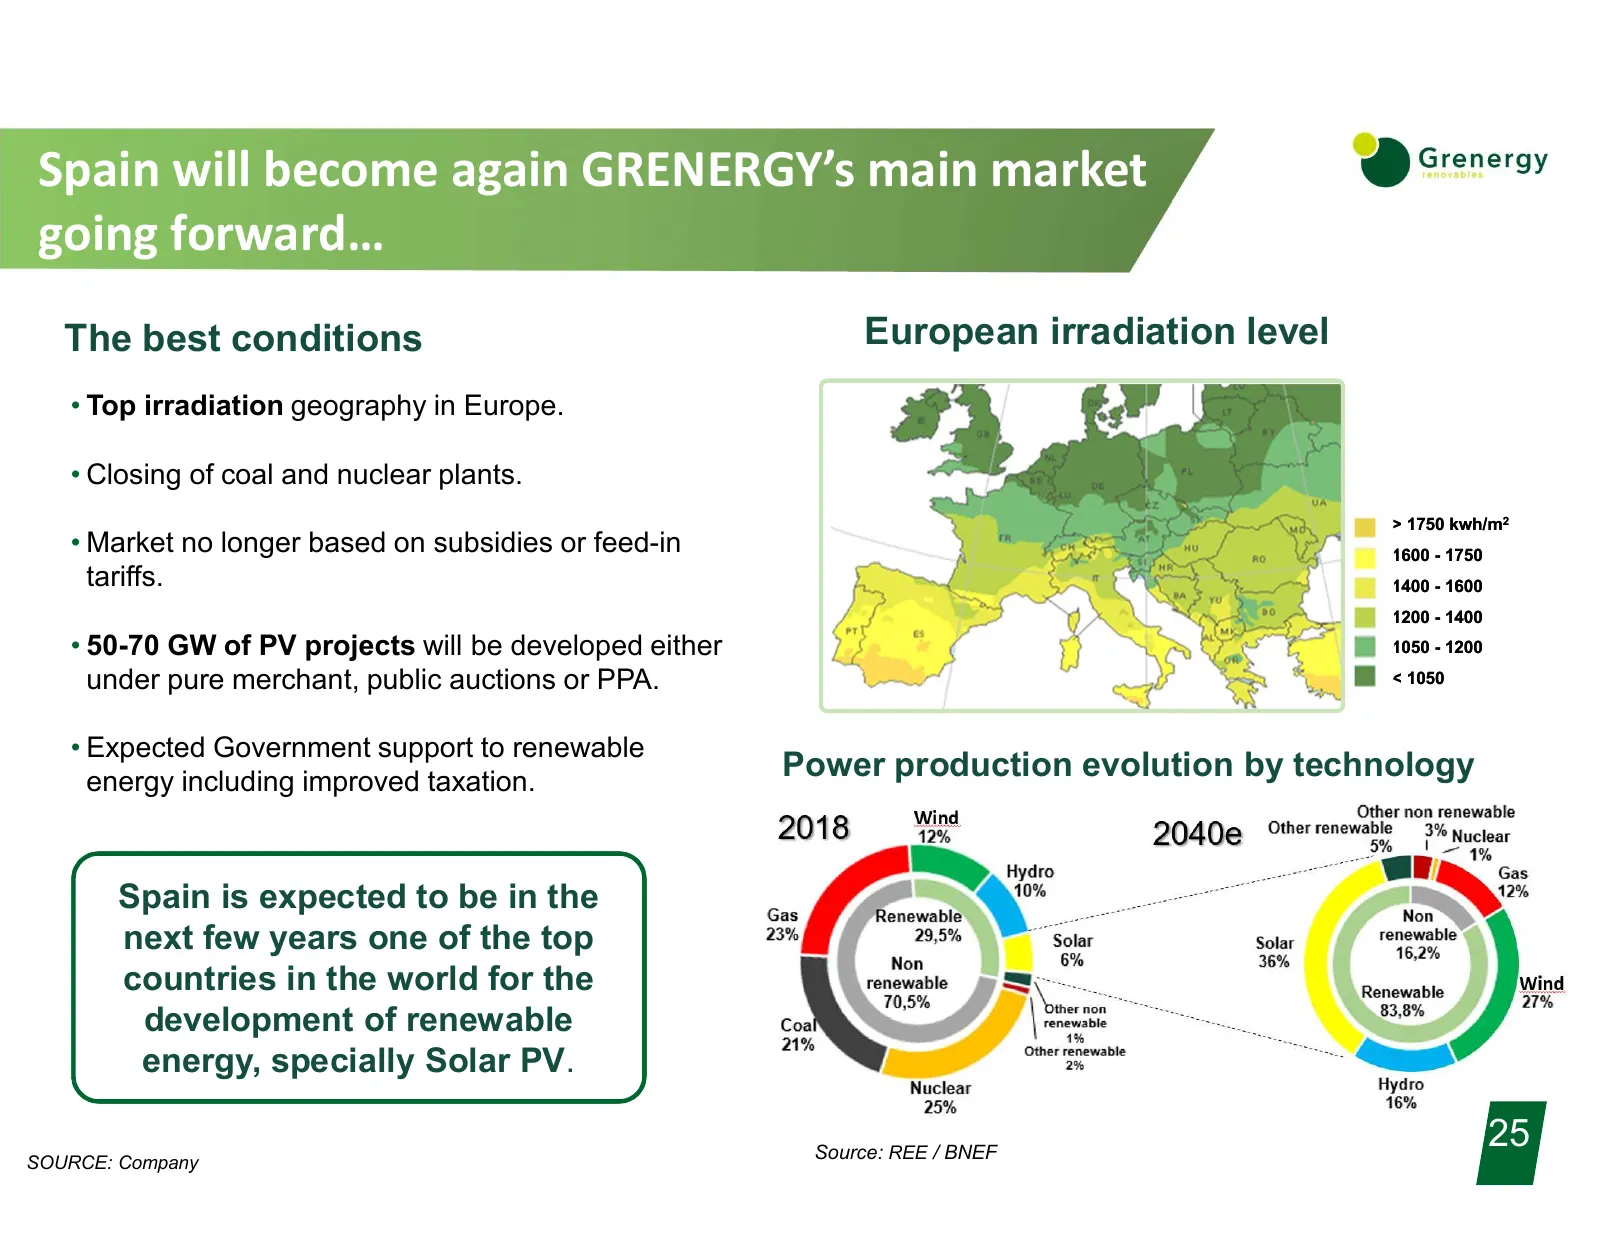
Slide 25: Spain will become again GRENERGY's main market going forward
Spain will become again GRENERGY’s main market going forward… The best conditions European irradiation level • Top irradiation geography in Europe. • Closing of coal and nuclear plants. > 1750 kwh/m2 • Market no longer based on subsidies or feed-in 1600 - 1750 tariffs. 1400 - 1600 1200 - 1400 • 50-7
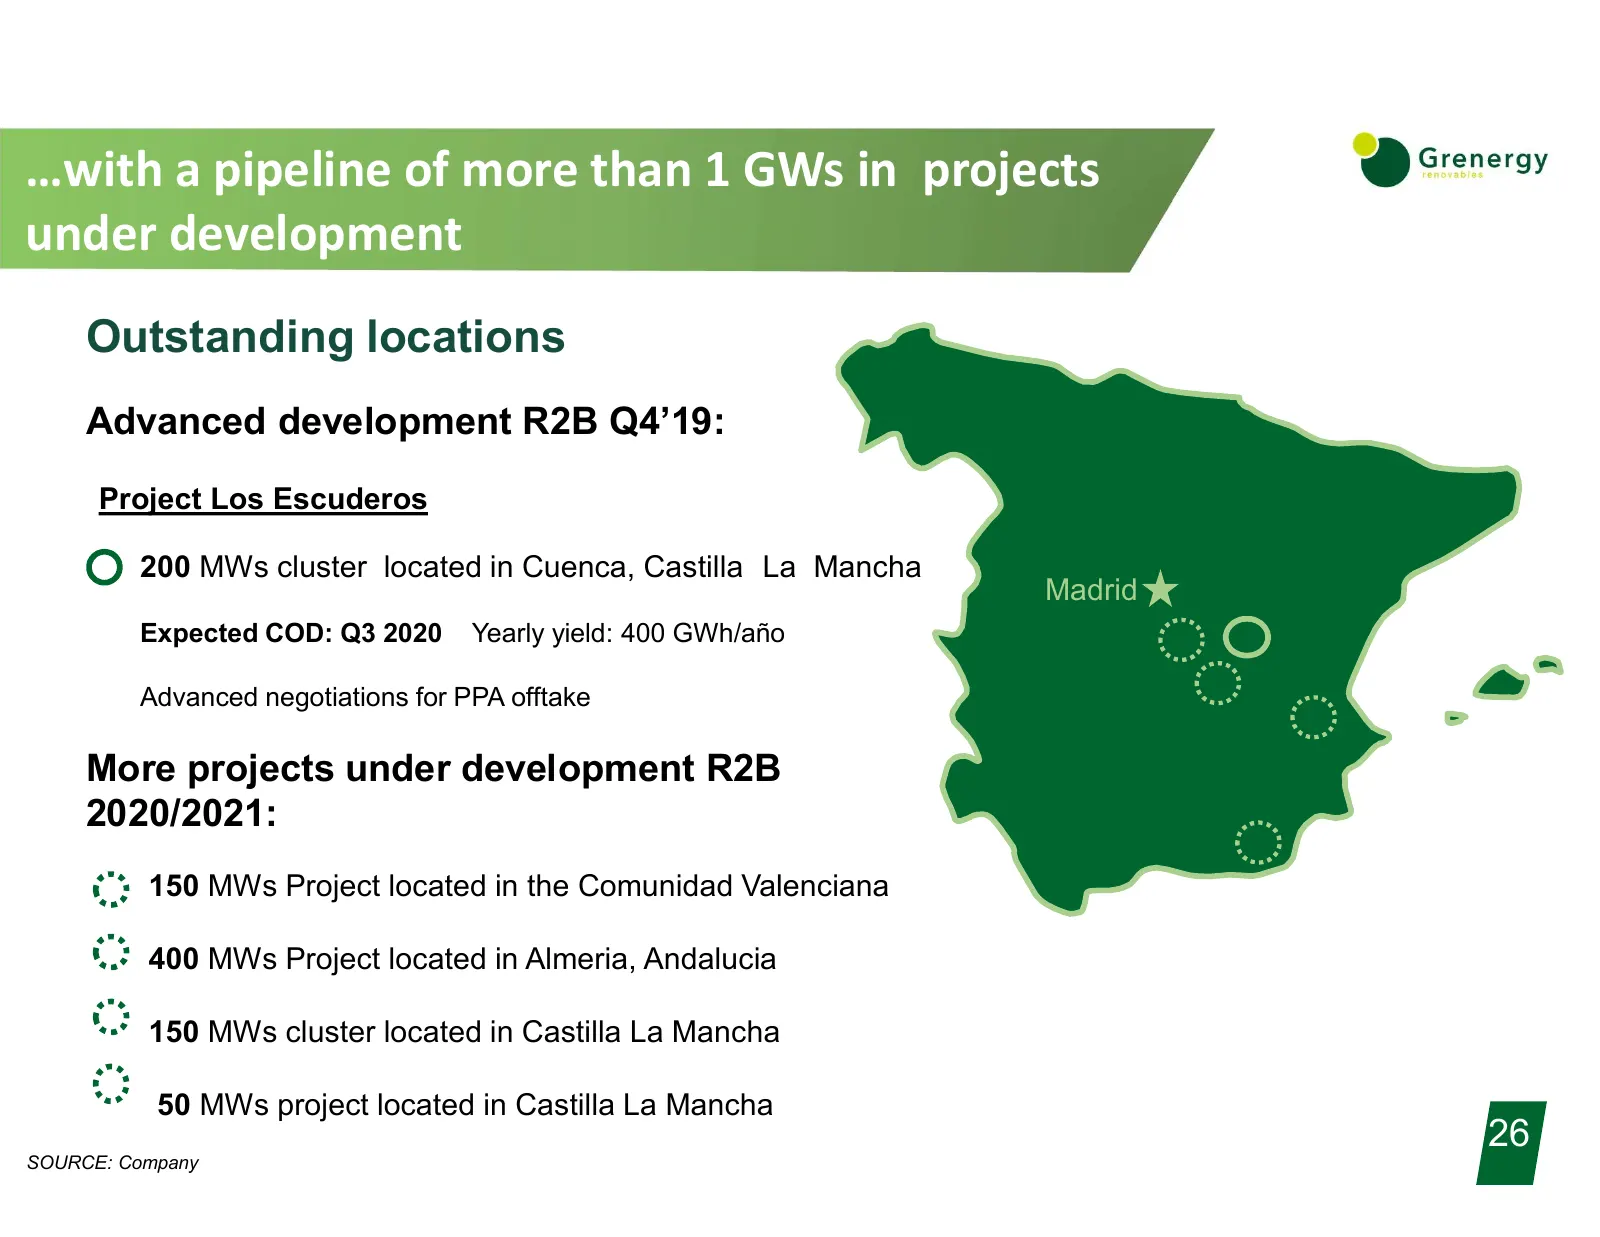
Slide 26: …with a pipeline of more than 1 GW in projects under development
…with a pipeline of more than 1 GWs in projects under development Outstanding locations Advanced development R2B Q4’19: Project Los Escuderos 200 MWs cluster located in Cuenca, Castilla La Mancha Madrid Expected COD: Q3 2020 Yearly yield: 400 GWh/año Advanced negotiations for PPA offtake More projec
Slide 27: Appendix
Appendix”
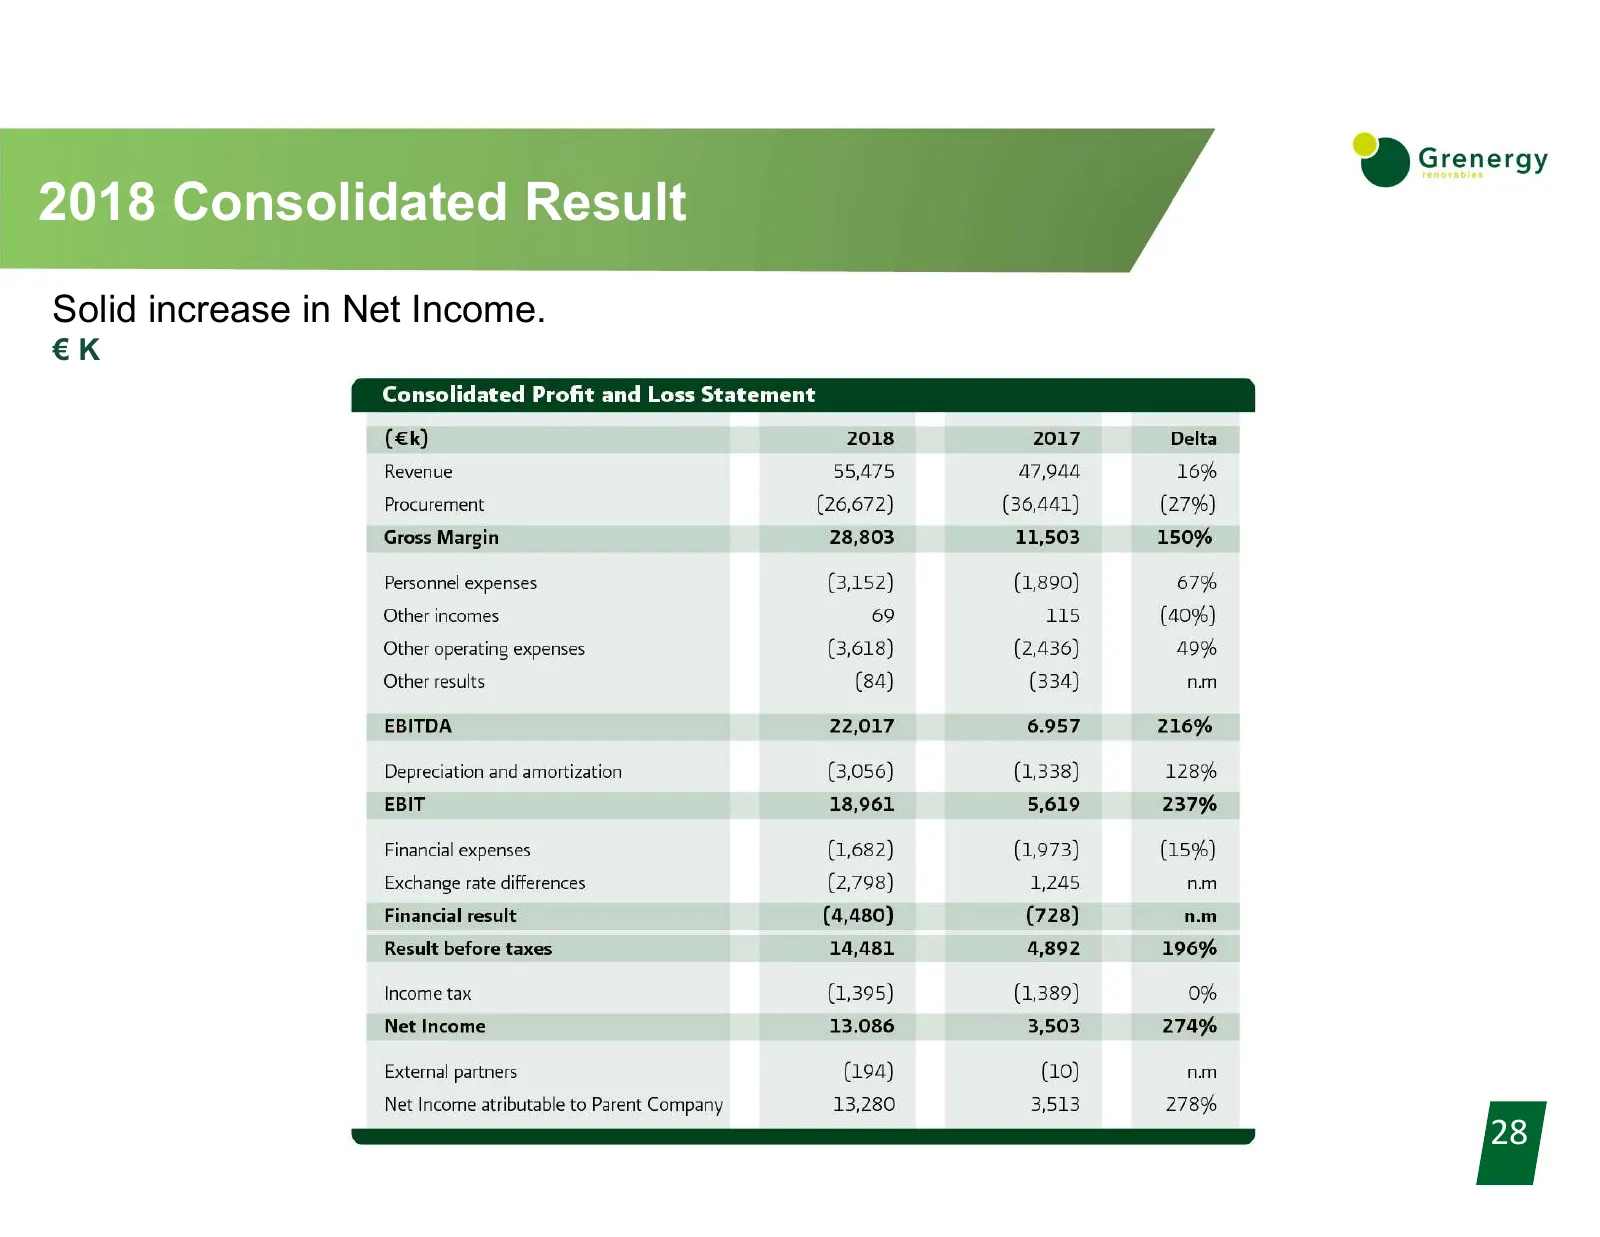
Slide 28: 2018 Consolidated Result
2018 Consolidated Result Solid increase in Net Income. Leverage4 €K Debt/Annualized EBITDA 28
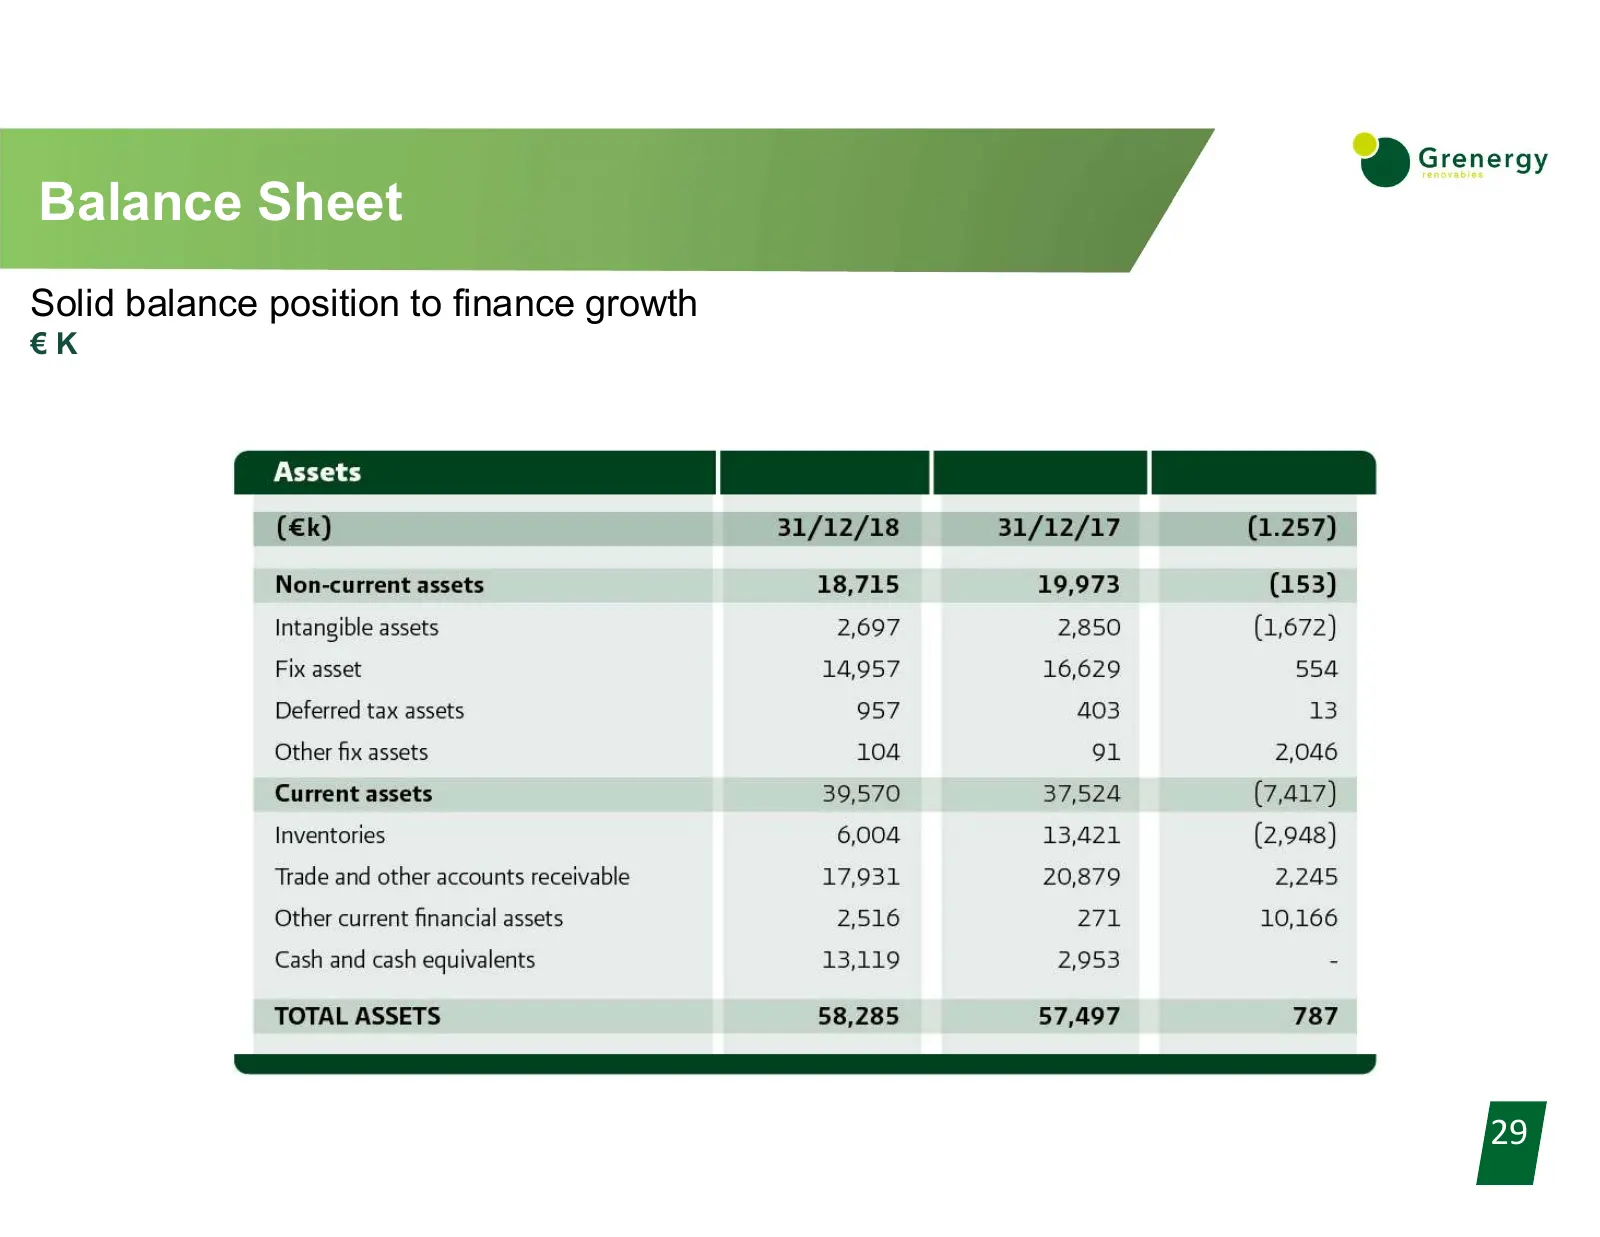
Slide 29: Balance Sheet
Balance Sheet Solid balance position to finance growth €K 29
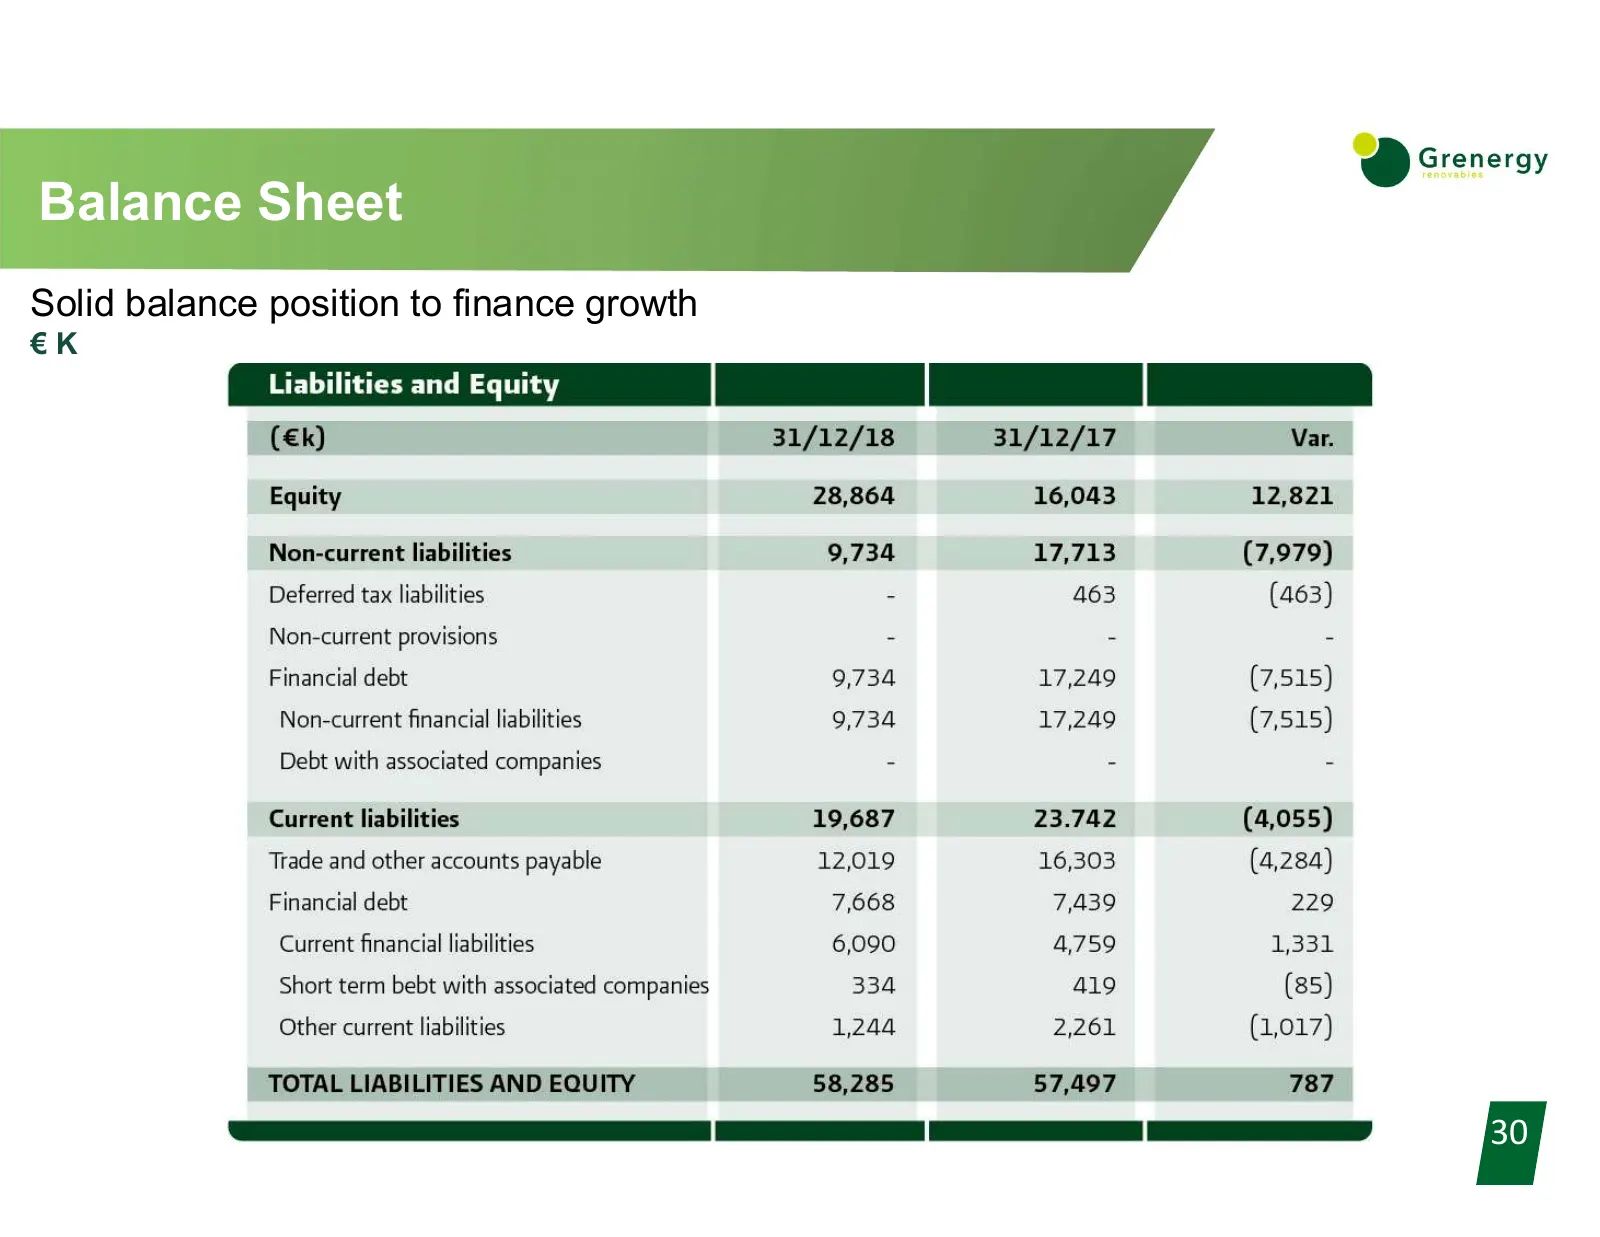
Slide 30: Balance Sheet
Balance Sheet Solid balance position to finance growth €K 30
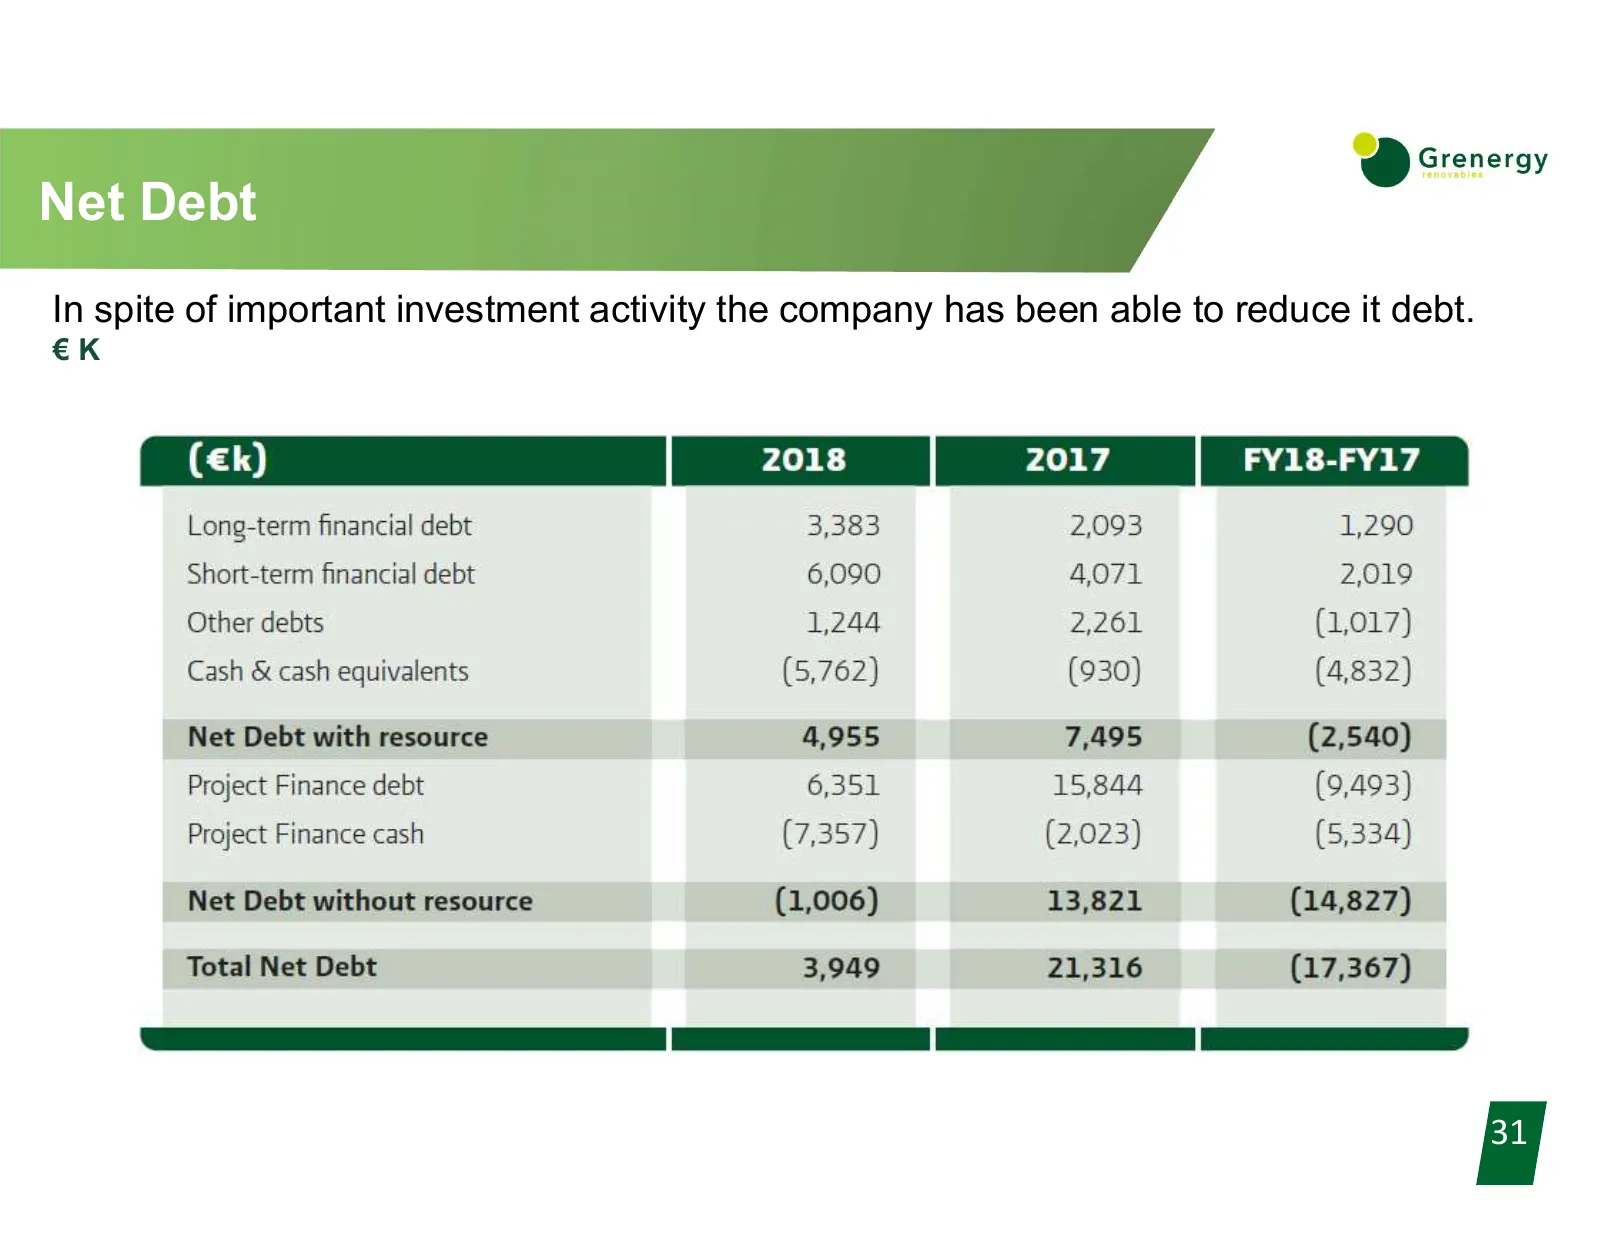
Slide 31: Net Debt
Net Debt In spite of important investment activity the company has been able to reduce it debt. €K 31
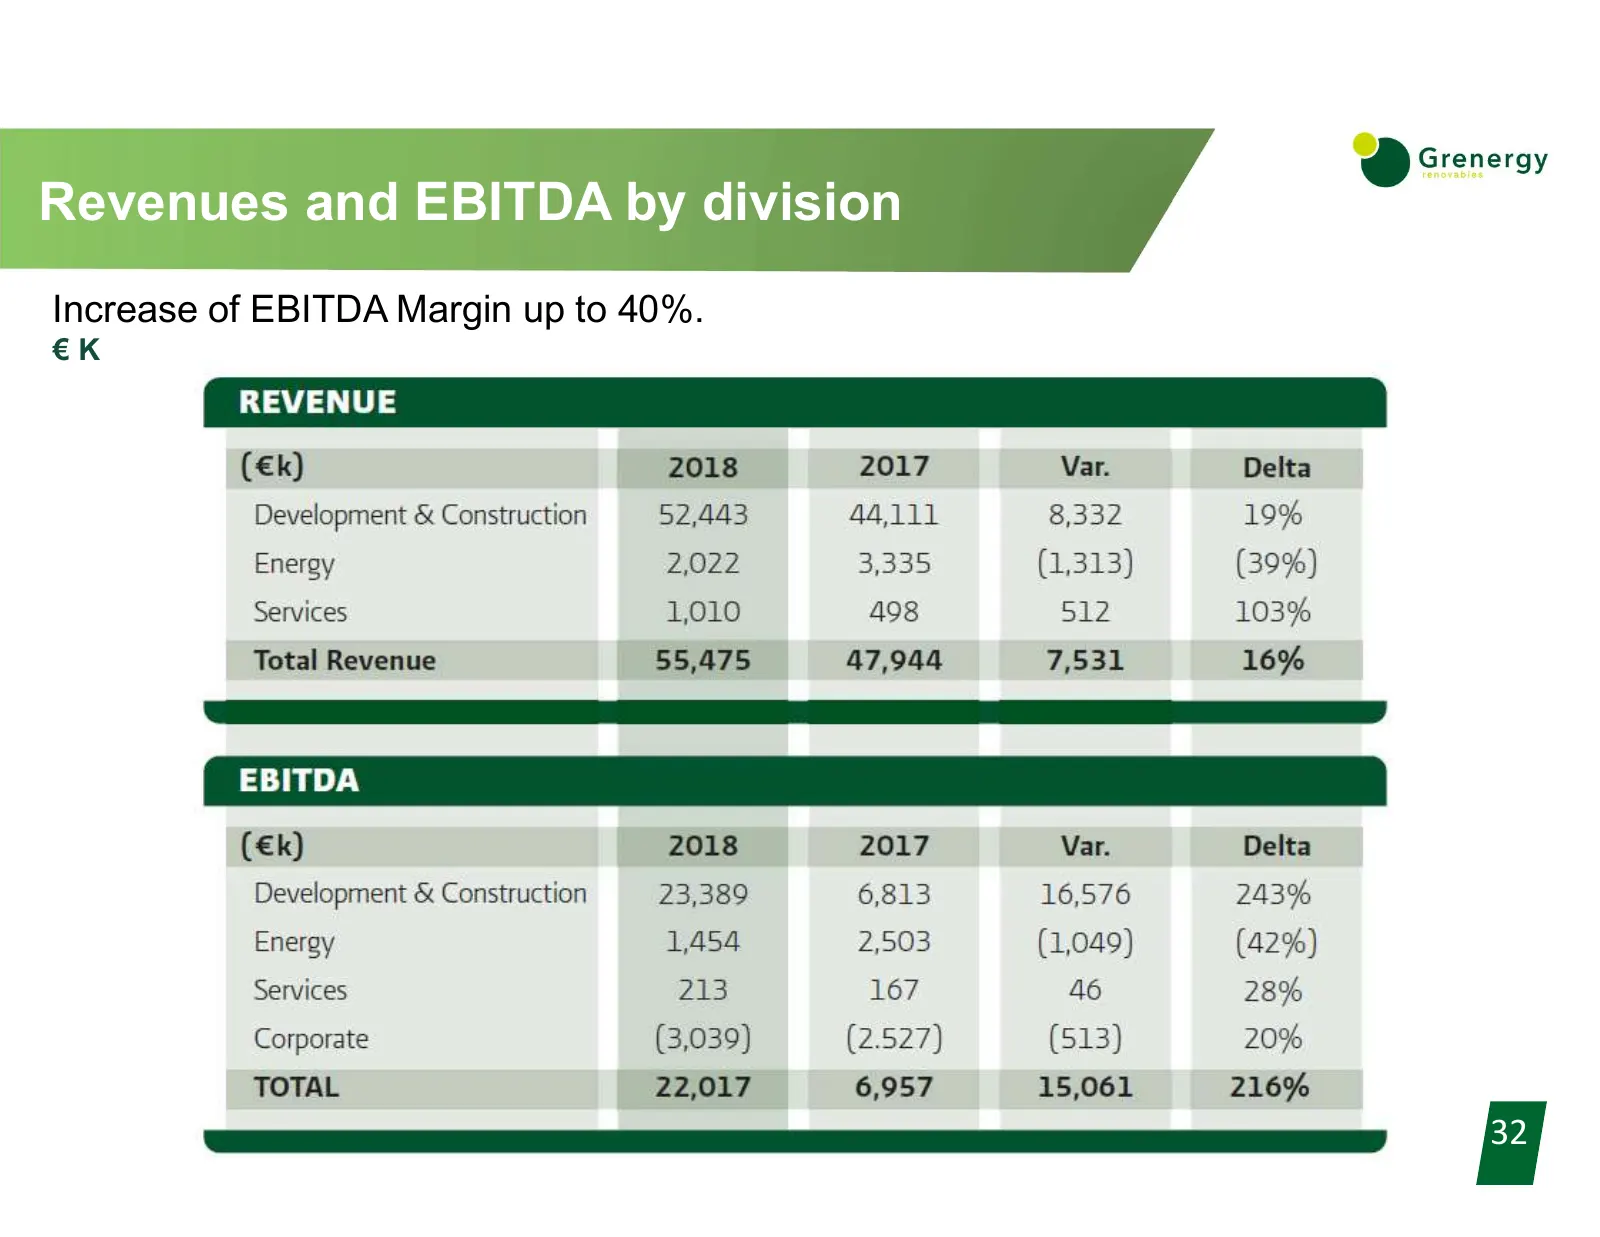
Slide 32: Revenues and EBITDA by division
Revenues and EBITDA by division Increase of EBITDA Margin up to 40%. €K 32
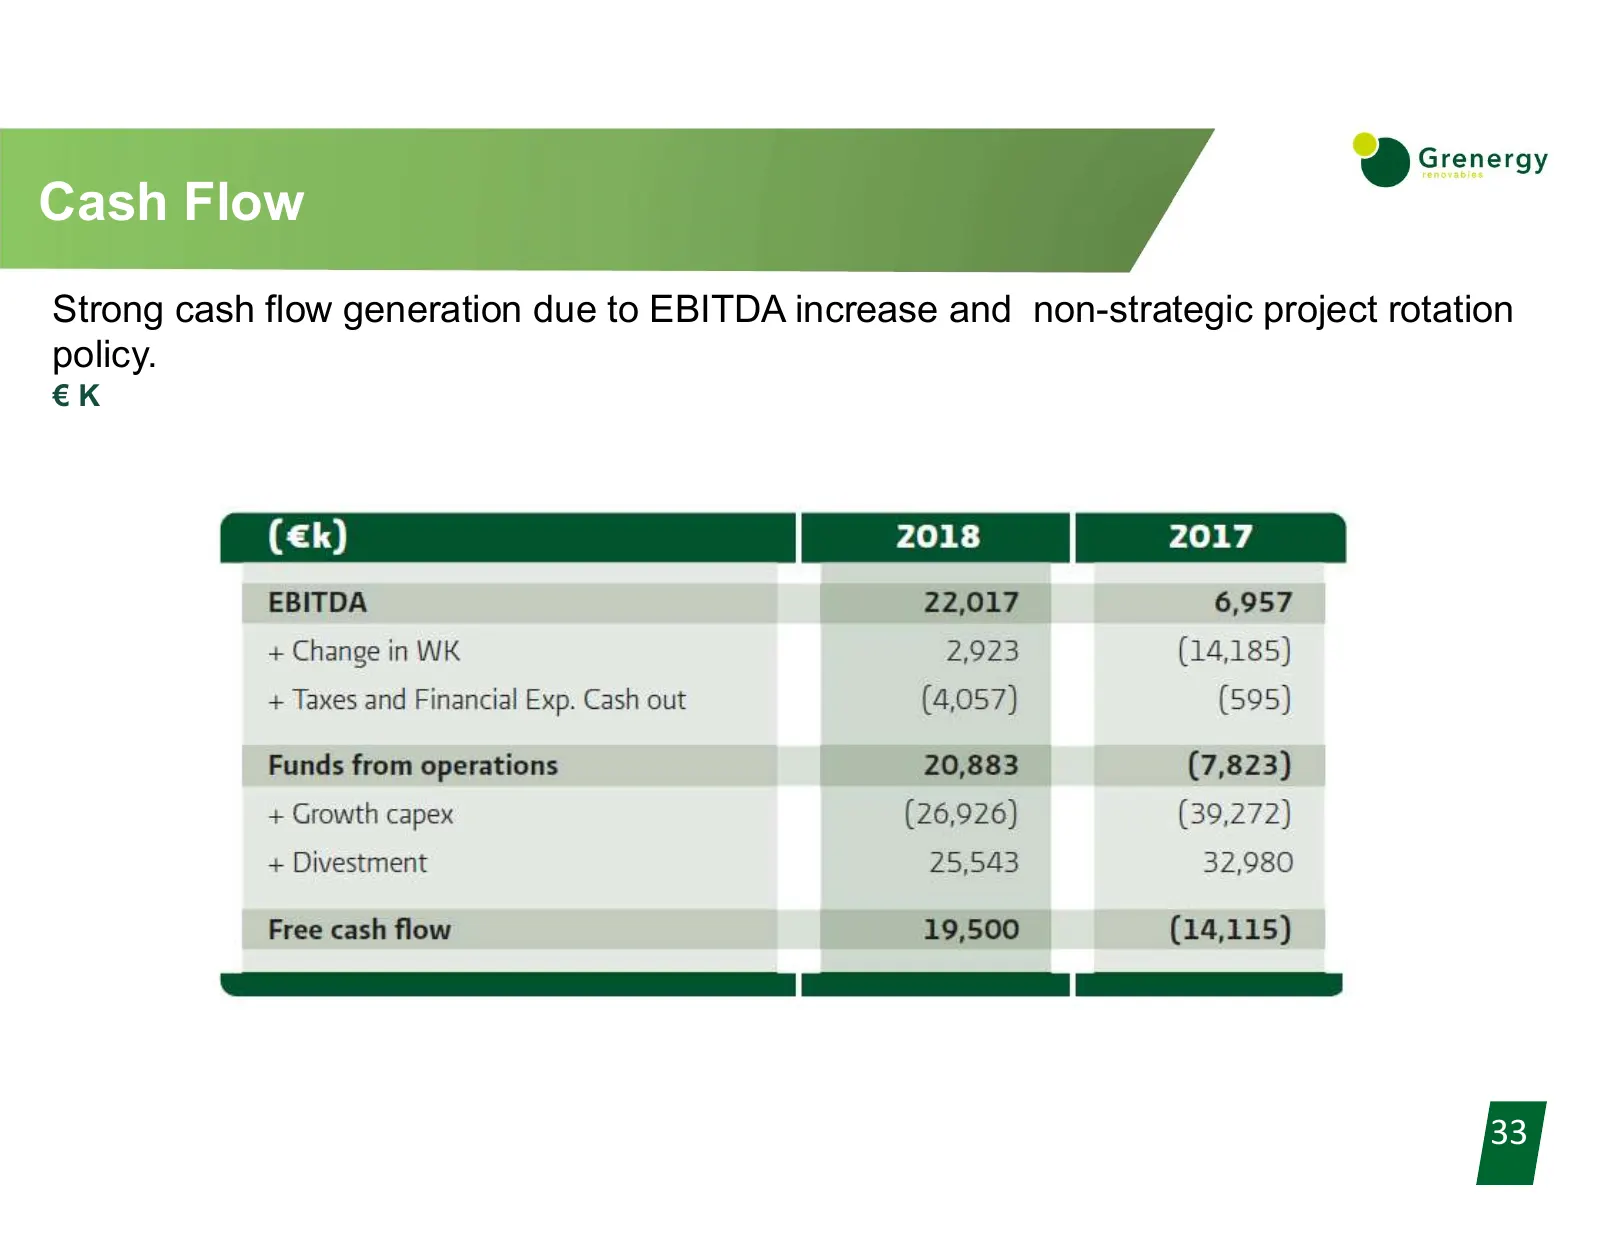
Slide 33: Cash Flow
Cash Flow Strong cash flow generation due to EBITDA increase and non-strategic project rotation policy. €K 33
Source: Internet Archive copy of grenergy.eu
More decks from Grenergy Renovables S.A
 H1 2026 Earnings Presentation38 slides · Sep 16, 2026
 Investor Presentation (September 2026)55 slides · September 2026
 Investor Presentation (July 2026)46 slides · July 2026
 Q1 2026 Earnings Presentation50 slides · May 27, 2026
 9M 2025 Earnings Presentation36 slides · Nov 27, 2025
 Investor Day (May 2025)50 slides · May 28, 2025