CastlePoint — KBW Insurance Conference 2008
24 slides from CastlePoint's conference presentation, Sep 4, 2008
Slide 1: Presentation to Investors KBW Insurance Conference
Presentation to Investors KBW Insurance Conference SEPTEMBER 4, 2008 TOWER GROUP, INC.
Slide 2: Forward-Looking Statements
Forward-Looking Statements The Private Securities Litigation Reform Act of 1995 provides a "safe harbor" for forward-looking statements. This presentation or any other written or oral statements made by or on behalf of CastlePoint and Tower Group, Inc. may include forward-looking statements that ref
Slide 3: Overview
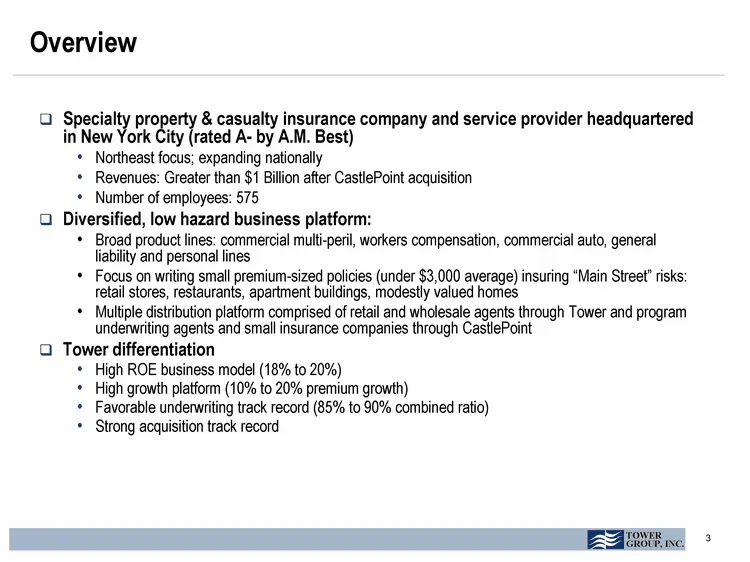
Overview Specialty property & casualty insurance company and service provider headquartered in New York City (rated A- by A.M. Best) Northeast focus; expanding nationally Revenues: Greater than $1 Billion after CastlePoint acquisition Number of employees: 575 Diversified, low hazard business platfor
Slide 4: History
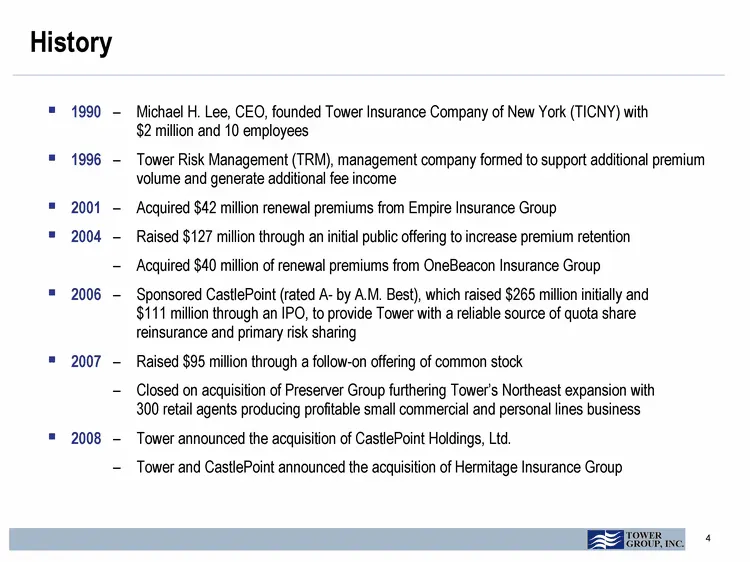
History 1990 - Michael H. Lee, CEO, founded Tower Insurance Company of New York (TICNY) with $2 million and 10 employees 1996 - Tower Risk Management (TRM), management company formed to support additional premium volume and generate additional fee income 2001 - Acquired $42 million renewal premiums
Slide 5: Premium Growth Drivers
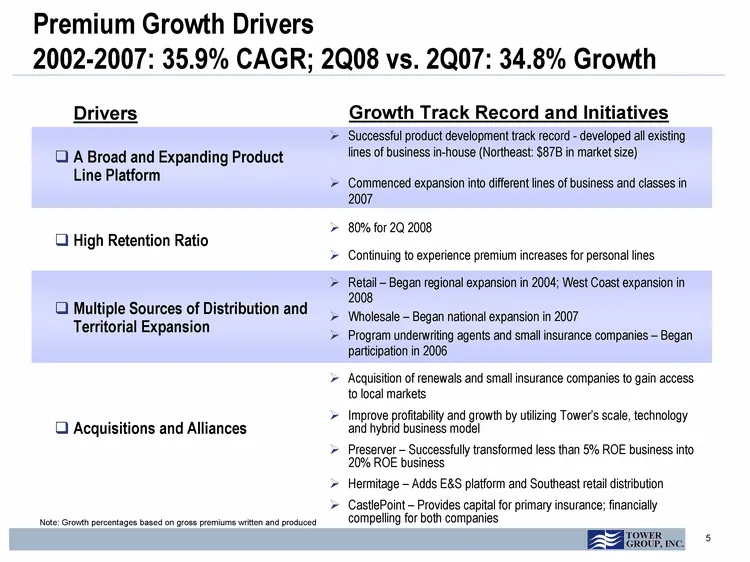
Premium Growth Drivers 2002-2007: 35.9% CAGR; 2Q08 vs. 2Q07: 34.8% Growth A Broad and Expanding Product Line Platform High Retention Ratio Multiple Sources of Distribution and Territorial Expansion Acquisitions and Alliances Successful product development track record - developed all existing lines
Slide 6: Underwriting Profitability
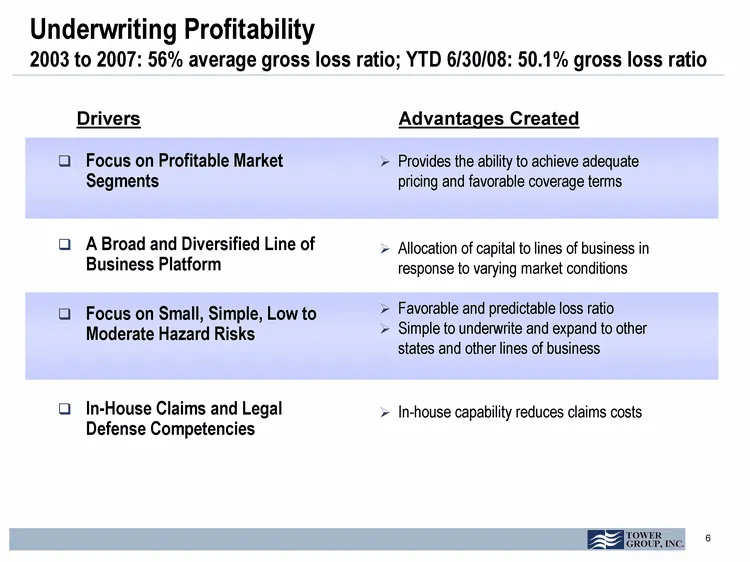
Underwriting Profitability 2003 to 2007: 56% average gross loss ratio; YTD 6/30/08: 50.1% gross loss ratio Focus on Profitable Market Segments A Broad and Diversified Line of Business Platform Focus on Small, Simple, Low to Moderate Hazard Risks In-House Claims and Legal Defense Competencies Provide
Slide 7: Underwriting Profitability: Historical performance
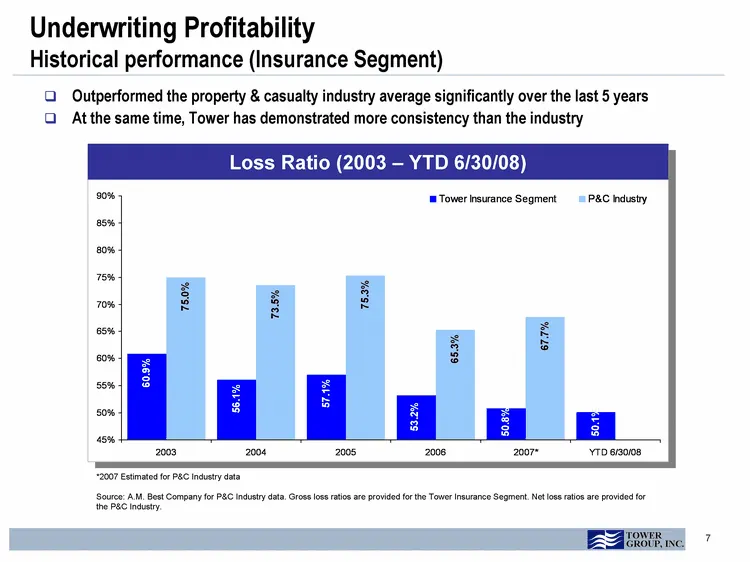
Underwriting Profitability Historical performance (Insurance Segment) *2007 Estimated for P&C Industry data Source: A.M. Best Company for P&C Industry data. Gross loss ratios are provided for the Tower Insurance Segment. Net loss ratios are provided for the P&C Industry. Outperformed the property &
Slide 8: Gross and Adjusted Net Expense Ratio
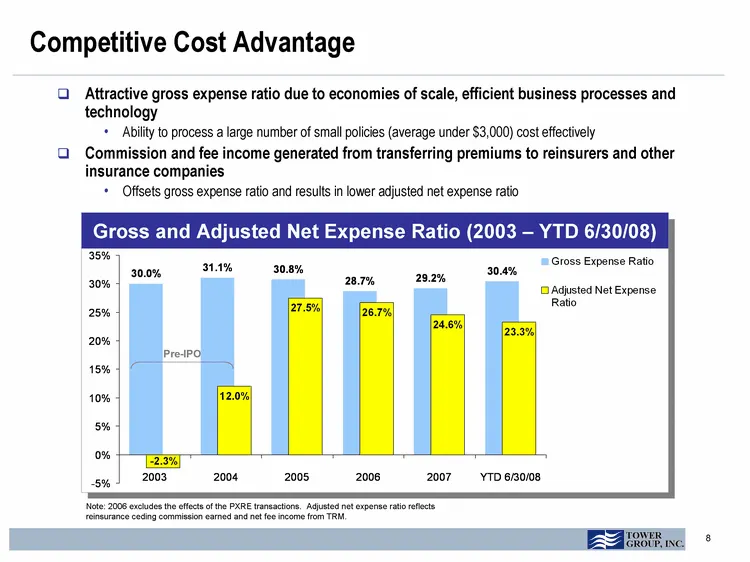
Attractive gross expense ratio due to economies of scale, efficient business processes and technology Ability to process a large number of small policies (average under $3,000) cost effectively Commission and fee income generated from transferring premiums to reinsurers and other insurance companies
Slide 9: Transaction Summary: Tower Acquisition of CastlePoint
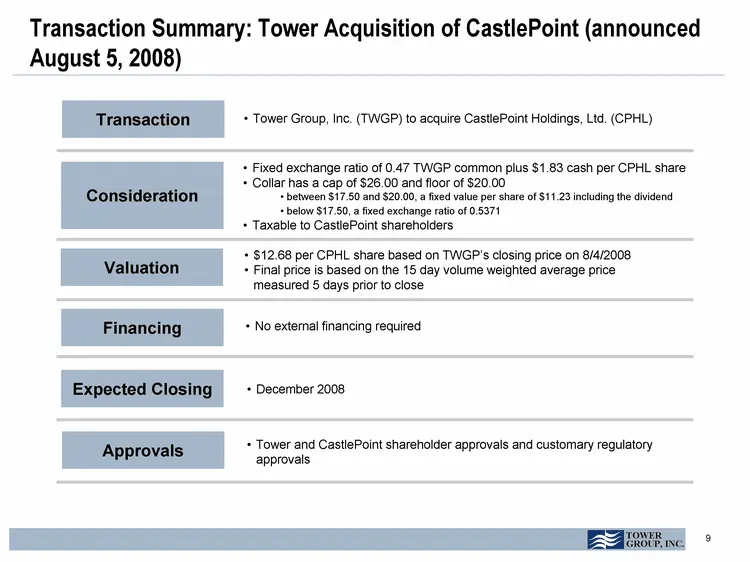
Transaction Summary: Tower Acquisition of CastlePoint (announced August 5, 2008) Transaction Tower Group, Inc. (TWGP) to acquire CastlePoint Holdings, Ltd. (CPHL) Valuation $12.68 per CPHL share based on TWGP's closing price on 8/4/2008 Final price is based on the 15 day volume weighted average pric
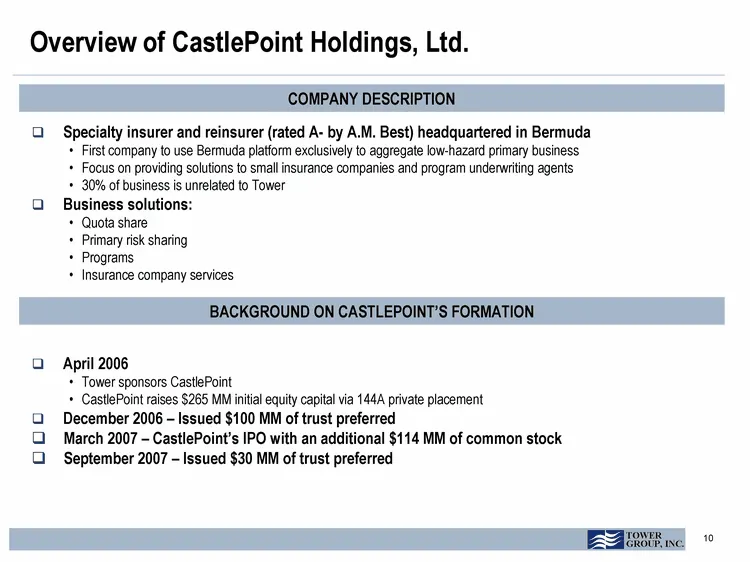
Slide 10: Overview of CastlePoint Holdings, Ltd.
Overview of CastlePoint Holdings, Ltd. COMPANY DESCRIPTION Specialty insurer and reinsurer (rated A- by A.M. Best) headquartered in Bermuda First company to use Bermuda platform exclusively to aggregate low-hazard primary business Focus on providing solutions to small insurance companies and program
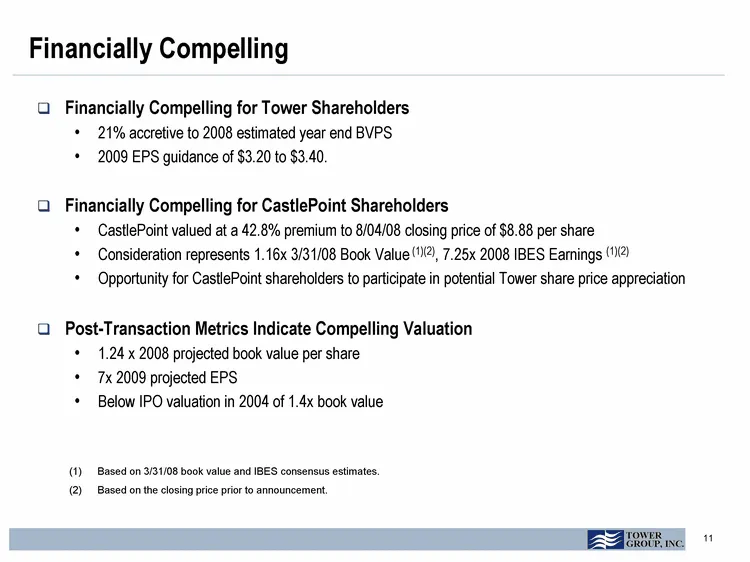
Slide 11: Financially Compelling
Financially Compelling Financially Compelling for Tower Shareholders 21% accretive to 2008 estimated year end BVPS 2009 EPS guidance of $3.20 to $3.40. Financially Compelling for CastlePoint Shareholders CastlePoint valued at a 42.8% premium to 8/04/08 closing price of $8.88 per share Consideration
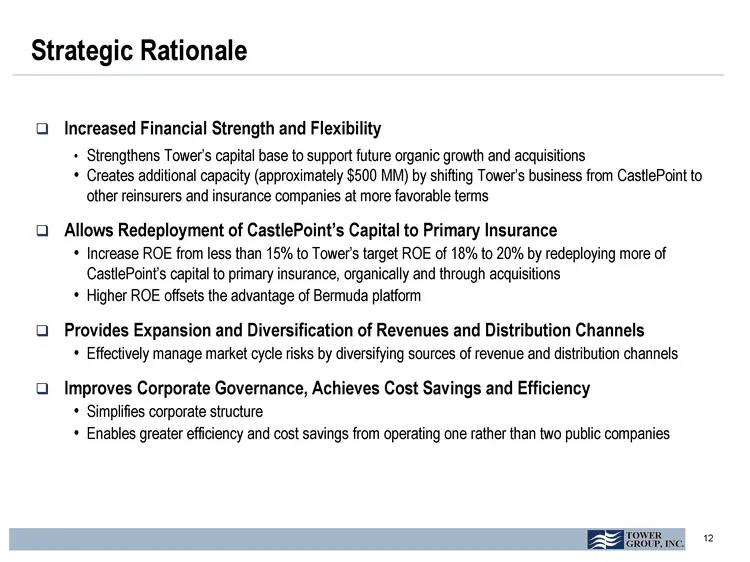
Slide 12: Strategic Rationale
Strategic Rationale Increased Financial Strength and Flexibility Strengthens Tower's capital base to support future organic growth and acquisitions Creates additional capacity (approximately $500 MM) by shifting Tower's business from CastlePoint to other reinsurers and insurance companies at more fa
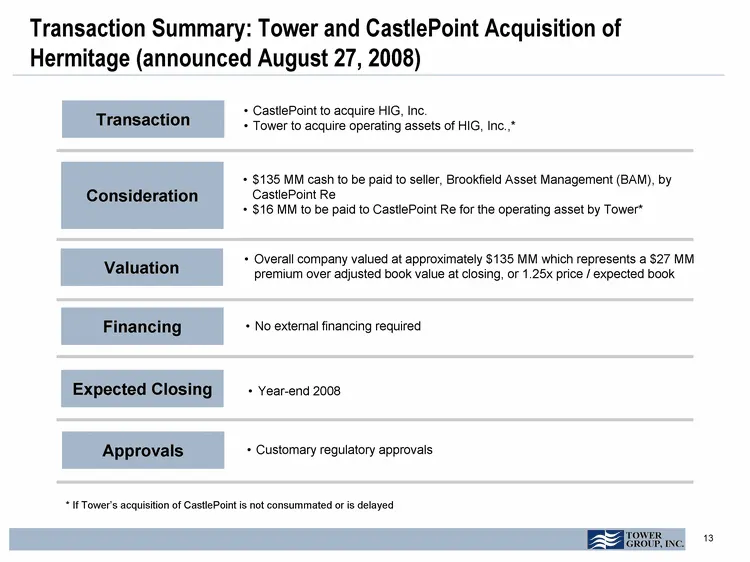
Slide 13: Transaction Summary: Acquisition of Hermitage
Transaction Summary: Tower and CastlePoint Acquisition of Hermitage (announced August 27, 2008) Transaction CastlePoint to acquire HIG, Inc. Tower to acquire operating assets of HIG, Inc.,* Valuation Overall company valued at approximately $135 MM which represents a $27 MM premium over adjusted book
Slide 14: Overview of Hermitage Insurance Group (HIG)
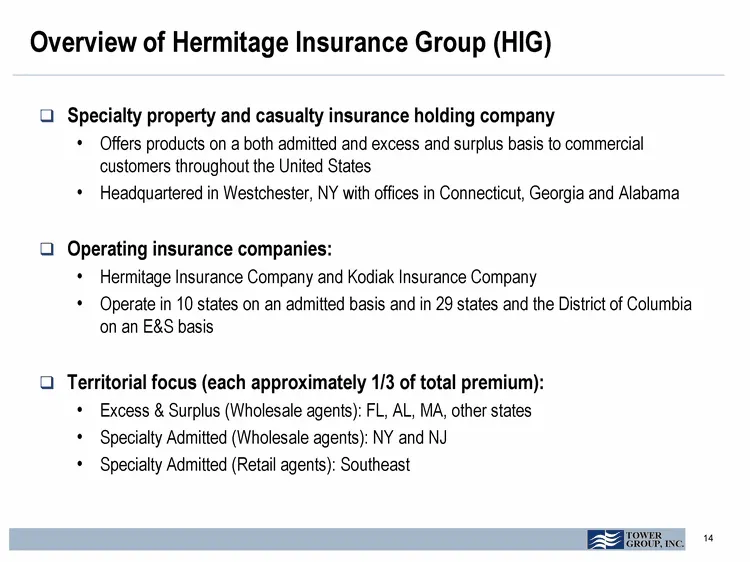
Overview of Hermitage Insurance Group (HIG) Specialty property and casualty insurance holding company Offers products on a both admitted and excess and surplus basis to commercial customers throughout the United States Headquartered in Westchester, NY with offices in Connecticut, Georgia and Alabama
Slide 15: Hermitage: Strategic Benefits and Transaction Rationale
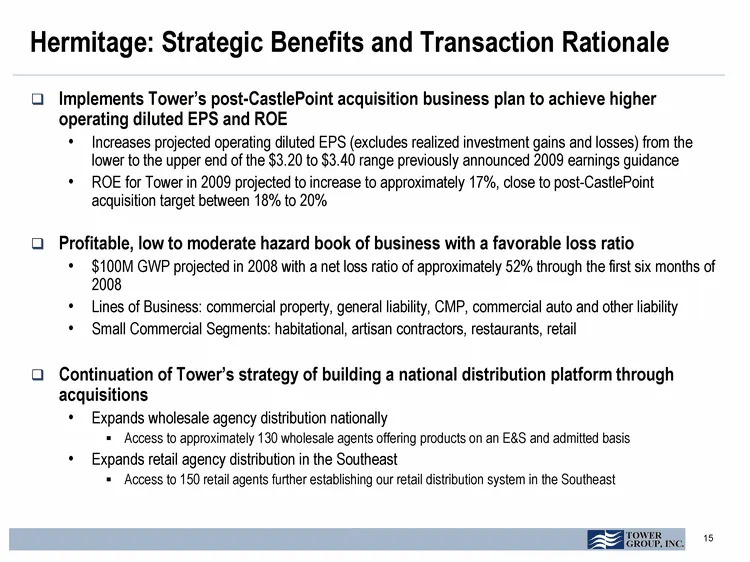
Hermitage: Strategic Benefits and Transaction Rationale Implements Tower's post-CastlePoint acquisition business plan to achieve higher operating diluted EPS and ROE Increases projected operating diluted EPS (excludes realized investment gains and losses) from the lower to the upper end of the $3.20
Slide 16: Increasing ROE Using Tower's Hybrid Business Model
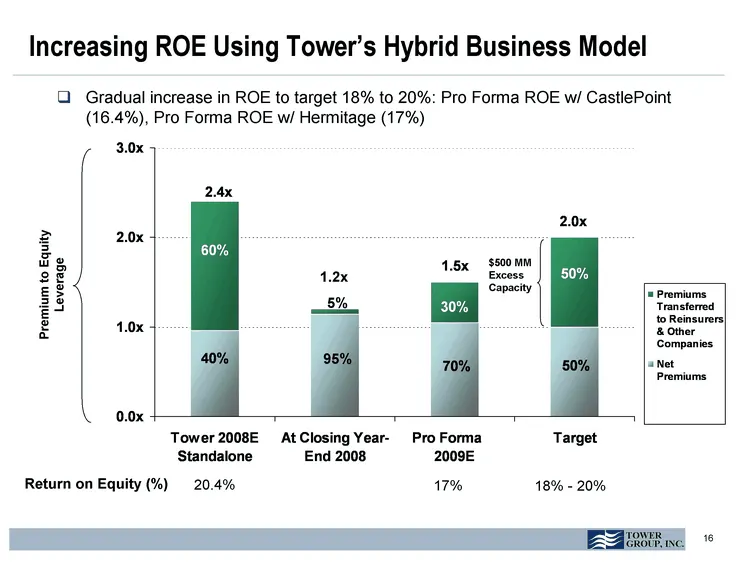
Increasing ROE Using Tower's Hybrid Business Model Gradual increase in ROE to target 18% to 20%: Pro Forma ROE w/ CastlePoint (16.4%), Pro Forma ROE w/ Hermitage (17%) Return on Equity (%) Tower 2008E Standalone At Closing Year-End 2008 Pro Forma 2009E Target Net Premiums 0.96 1.14 1.05 1 Premiums T
Slide 17: Gross Premiums Written and Produced
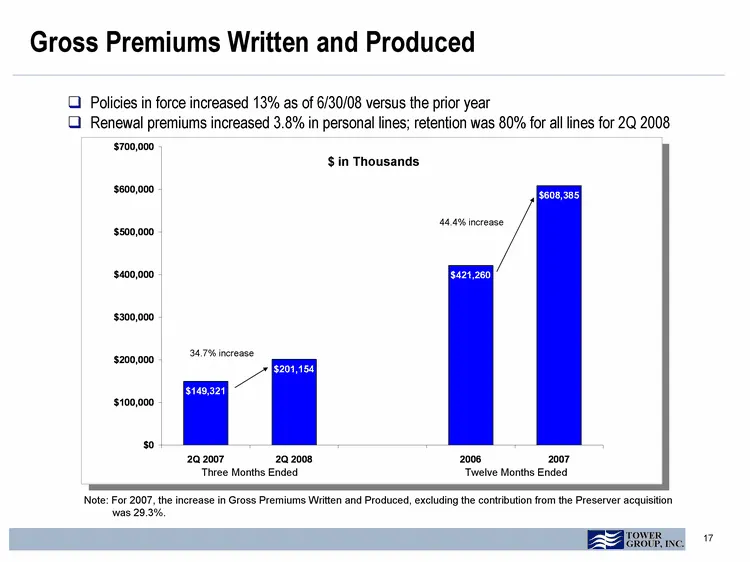
Gross Premiums Written and Produced Policies in force increased 13% as of 6/30/08 versus the prior year Renewal premiums increased 3.8% in personal lines; retention was 80% for all lines for 2Q 2008 Three Months Ended Twelve Months Ended $ in Thousands 44.4% increase 34.7% increase 34.7% increase No
Slide 18: Net Operating Income
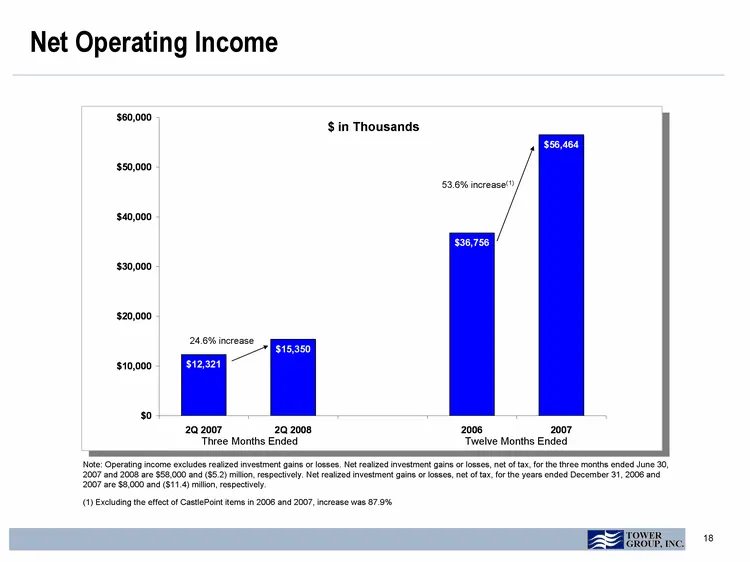
Net Operating Income $ in Thousands Three Months Ended Nine Months Ended Three Months Ended Twelve Months Ended $ in Thousands Note: Operating income excludes realized investment gains or losses. Net realized investment gains or losses, net of tax, for the three months ended June 30, 2007 and 2008 a
Slide 19: Diluted EPS Growth
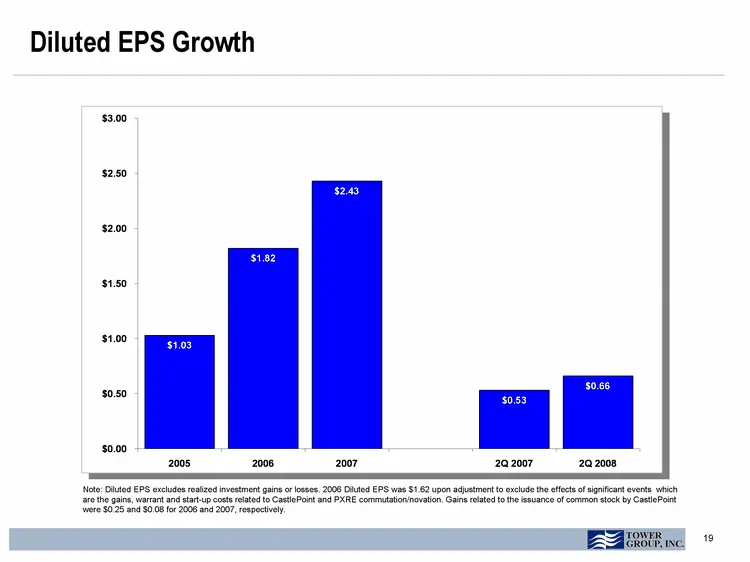
Diluted EPS Growth Note: Diluted EPS excludes realized investment gains or losses. 2006 Diluted EPS was $1.62 upon adjustment to exclude the effects of significant events which are the gains, warrant and start-up costs related to CastlePoint and PXRE commutation/novation. Gains related to the issuan
Slide 20: High Quality Reinsurance
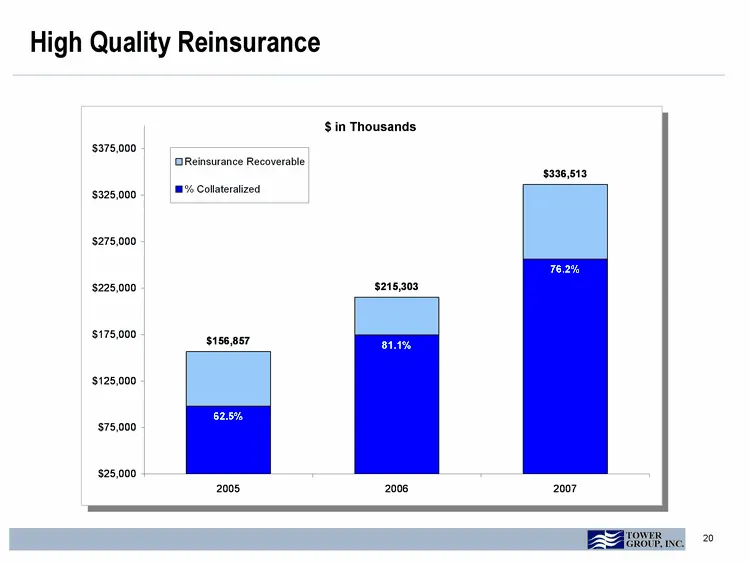
High Quality Reinsurance $ in Thousands $ in Thousands
Slide 21: Predictable Loss Reserves
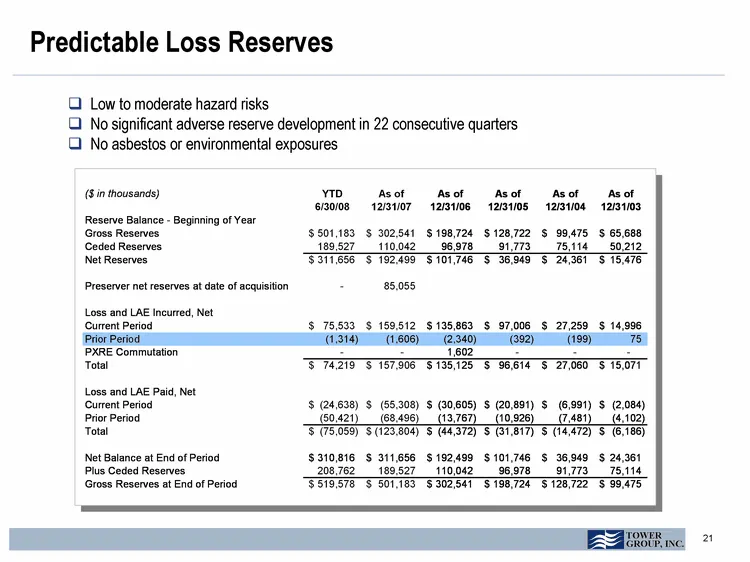
Predictable Loss Reserves Low to moderate hazard risks No significant adverse reserve development in 22 consecutive quarters No asbestos or environmental exposures No asbestos or environmental exposures No asbestos or environmental exposures No asbestos or environmental exposures
Slide 22: Investments
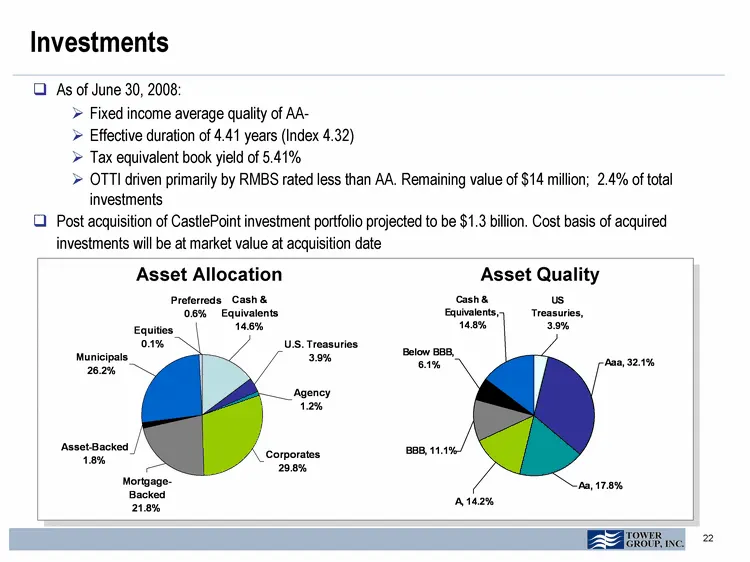
Investments As of June 30, 2008: Fixed income average quality of AA- Effective duration of 4.41 years (Index 4.32) Tax equivalent book yield of 5.41% OTTI driven primarily by RMBS rated less than AA. Remaining value of $14 million; 2.4% of total investments Post acquisition of CastlePoint investment
Slide 23: Key Investment Considerations
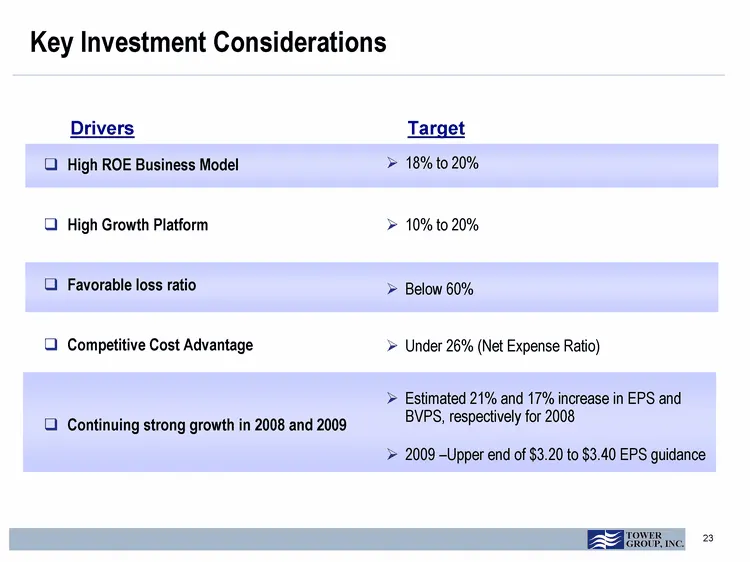
Key Investment Considerations High ROE Business Model High Growth Platform Favorable loss ratio Competitive Cost Advantage Continuing strong growth in 2008 and 2009 Drivers Target 18% to 20% 10% to 20% Below 60% Under 26% (Net Expense Ratio) Estimated 21% and 17% increase in EPS and BVPS, respective
Slide 24: Broadway, 31st Floor, New York, NY 10271 www.twrgrp.com
120 Broadway, 31st Floor, New York, NY 10271 www.twrgrp.com
Source: SEC EDGAR · 8-K filed Sep 4, 2008