U.S. Concrete — BB&T Commercial & Industrial Conference 2011
30 slides from U.S. Concrete's conference presentation, Apr 6, 2011
Slide 1: BB&T Commercial & Industrial Conference
BB&T Commercial & Industrial Conference April 7, 2011
Slide 2: Forward-Looking Statement
Forward-Looking Statement Certain statements provided in this presentation, including those that express a belief, expectation or intention and those that are not of historical fact, are “forward-looking statements” within the meaning of Section 27A of the Securities Act of 1933 and Section 21E of t
Slide 3: Company Overview
Company Overview
Slide 4: Top Producer of Ready Mixed Concrete in the U.S.
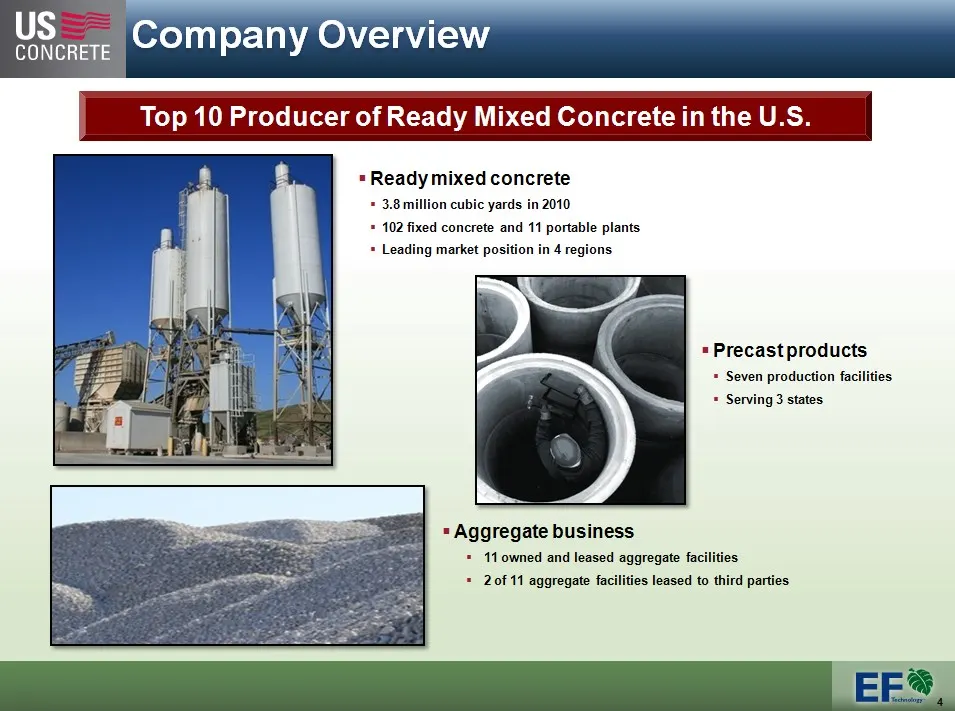
Top 10 Producer of Ready Mixed Concrete in the U.S. Ready mixed concrete 3.8 million cubic yards in 2010 102 fixed concrete and 11 portable plants Leading market position in 4 regions Precast products Seven production facilities Serving 3 states Aggregate business 11 owned and leased aggregate facil
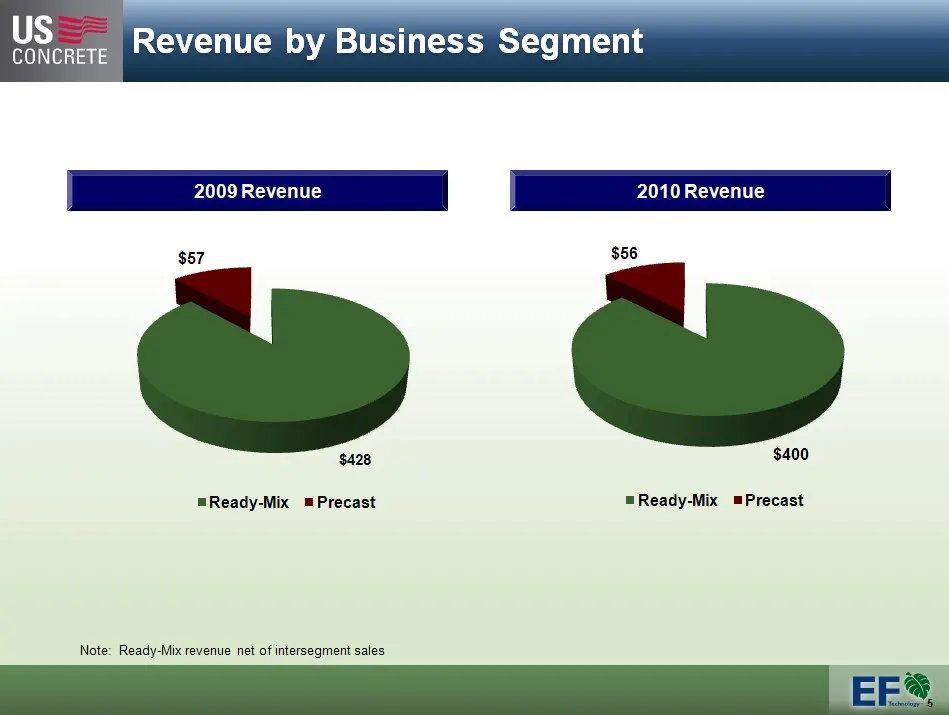
Slide 5: Revenue by Business Segment
Revenue by Business Segment 2009 Revenue 2010 Revenue $57 $428 $56 $400 Ready Mix Precast Note: Ready-Mix revenue net of intersegment sales
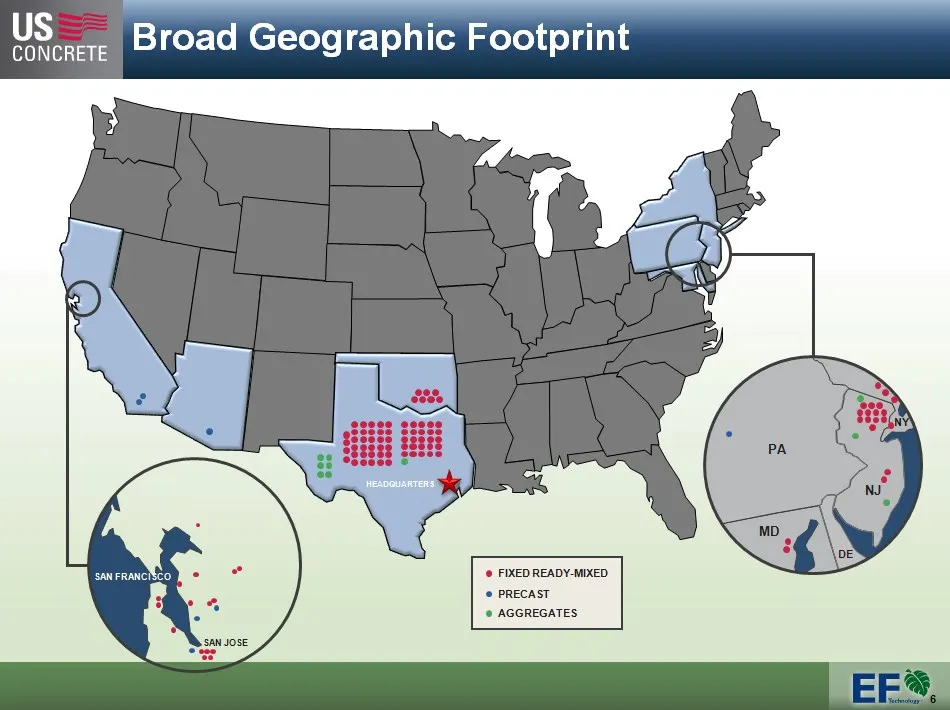
Slide 6: Broad Geographic Footprint
Broad Geographic Footprint HEADQUARTERs FIXED READY-MIXED PRECAST AGGREGATES
Slide 7: Plants, reserves and fleet key facts
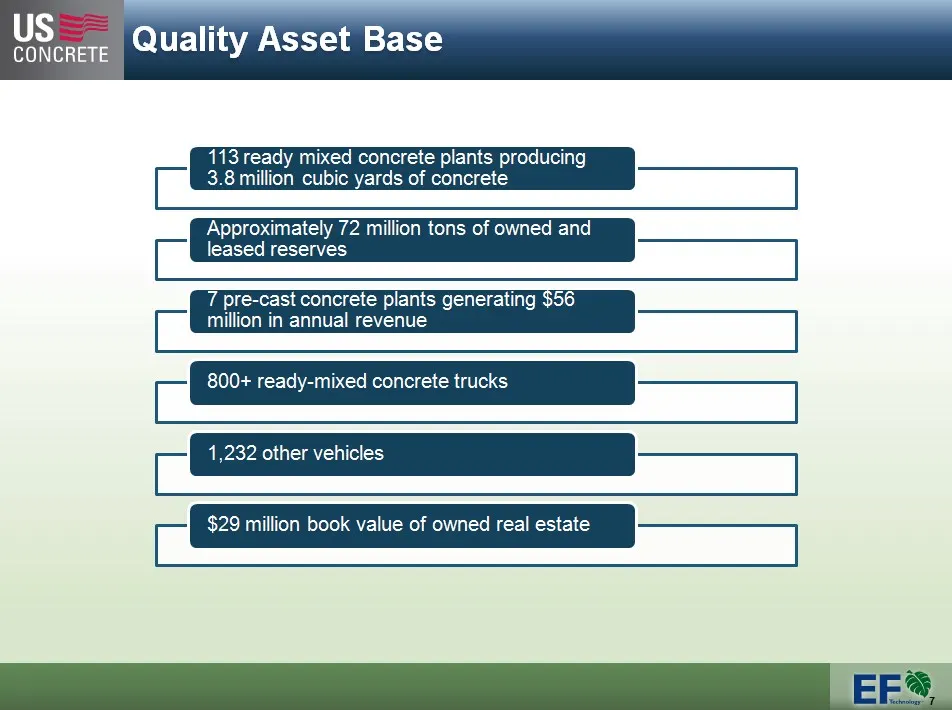
113 ready mixed concrete plants producing 3.8 million cubic yards of concrete Approximately 72 million tons of owned and leased reserves 7 pre-cast concrete plants generating $56 million in annual revenue 800+ ready-mixed concrete trucks 1,232 other vehicles $29 million book value of owned real esta
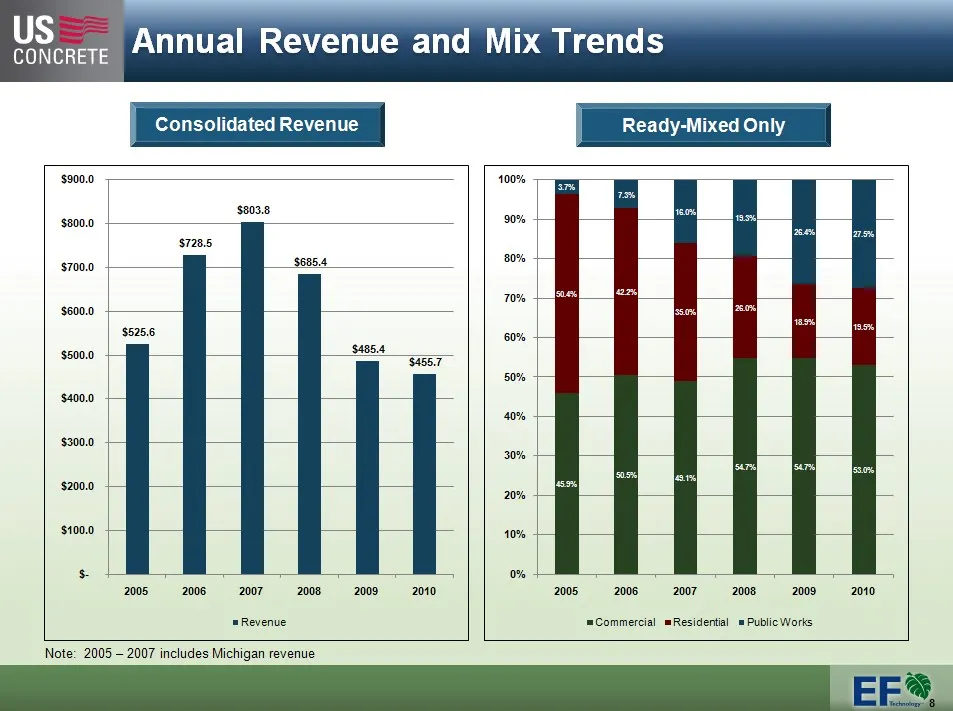
Slide 8: Consolidated Revenue Ready-Mixed Only
Consolidated Revenue Ready-Mixed Only Note: 2005 – 2007 includes Michigan revenue Revenue Series 2 Series 3 2005 $525.6 2.4 2 2006 $728.5 4.4 2 2007 $803.8 1.8 3 2008 $685.4 2.8 5 2009 $485.4 2010 $455.7 Commercial Residential Public Works 2005 45.9% 50.4% 3.7% 2006 50.5% 42.2% 7.3% 2007 49.1% 35.0%
Slide 9: Industry Overview
—— US —— CONCRETE Industry Overview
Slide 10: Industry Overview Large, Fragmented Market
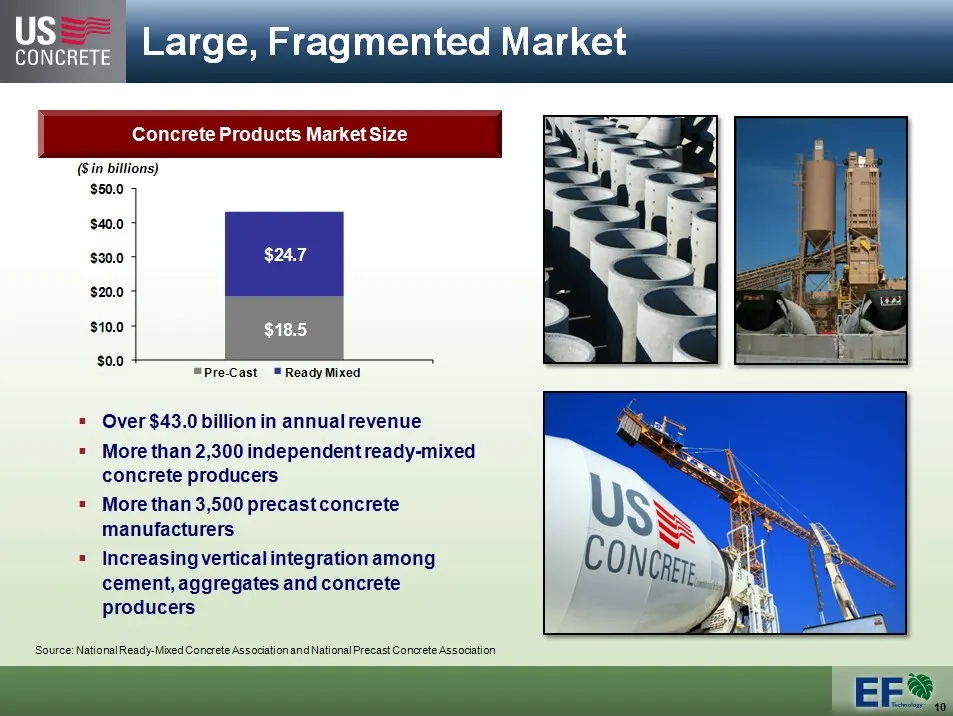
Industry Overview Large, Fragmented Market Concrete Products Market Size Over $43.0 billion in annual revenue More than 2,300 independent ready-mixed concrete producers More than 3,500 precast concrete manufacturers Increasing vertical integration among cement, aggregates and concrete producers & 60
Slide 11: Route to Market
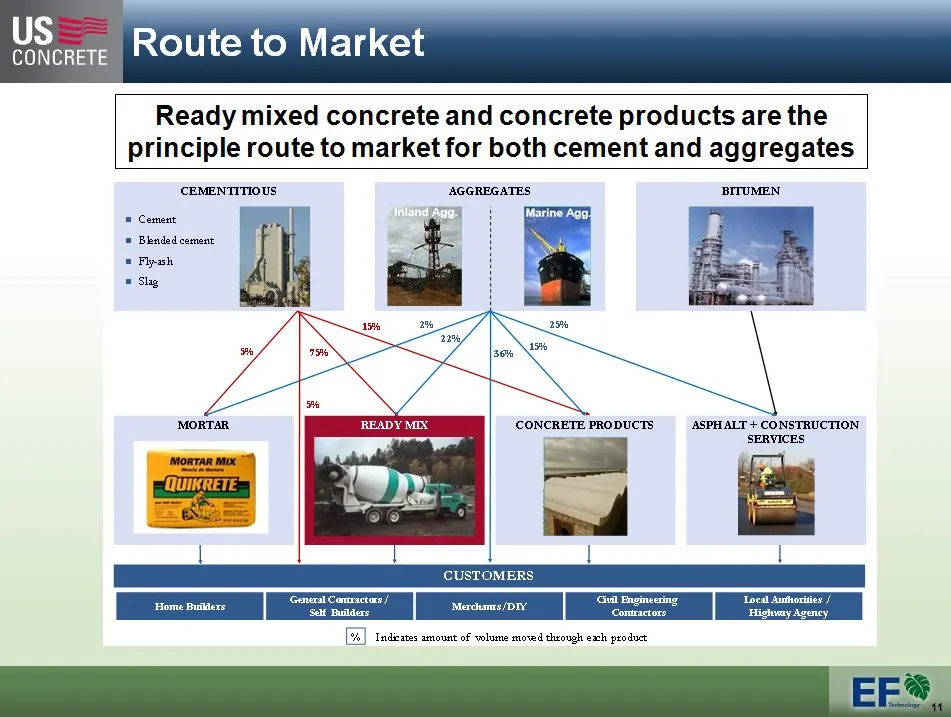
Route to Market r eady mixed concrete and concrete products are the principle route to market for both cement and aggregates Cementitious Aggregates Inland Agg. Marine Agg. Bitumen Mortor Ready Mix Concrete Products Asphalt + Construction Services Customer Home Builders General Contractors/ Self Bui
Slide 12: Ready-Mixed Concrete End Use Markets
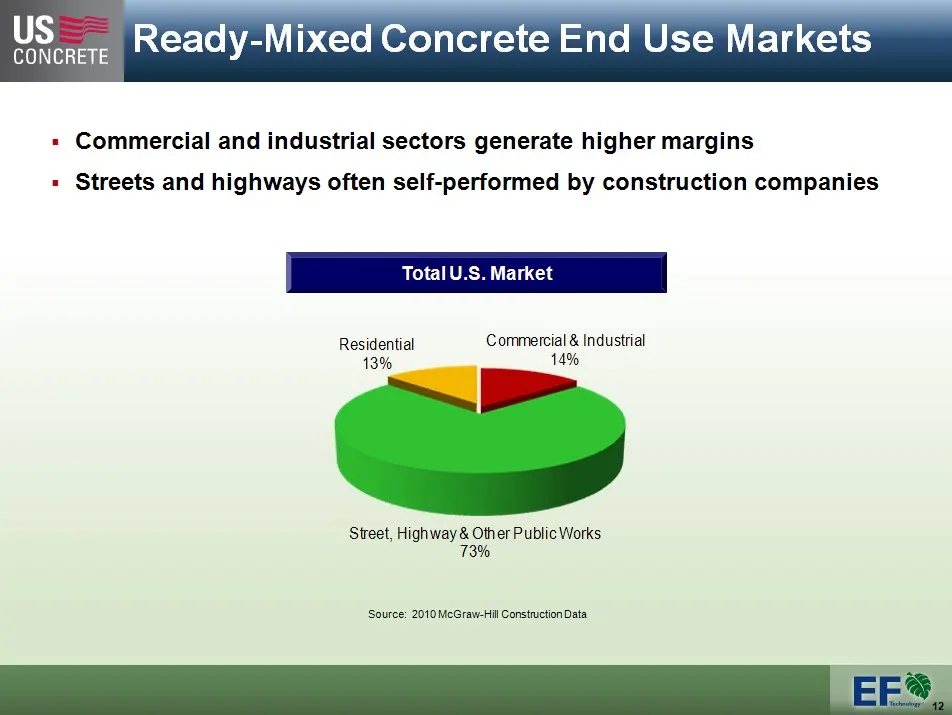
Ready-Mixed Concrete End Use Markets Commercial and industrial sectors generate higher margins Streets and highways often self-performed by construction companies Total U.S. Market Street, Highway & Other Public Works 73% Commercial & Industrial 14% Residential Source: 2010 McGraw-Hill Construction

Slide 13: Economic Conditions and Forecast
Economic Conditions and Forecast
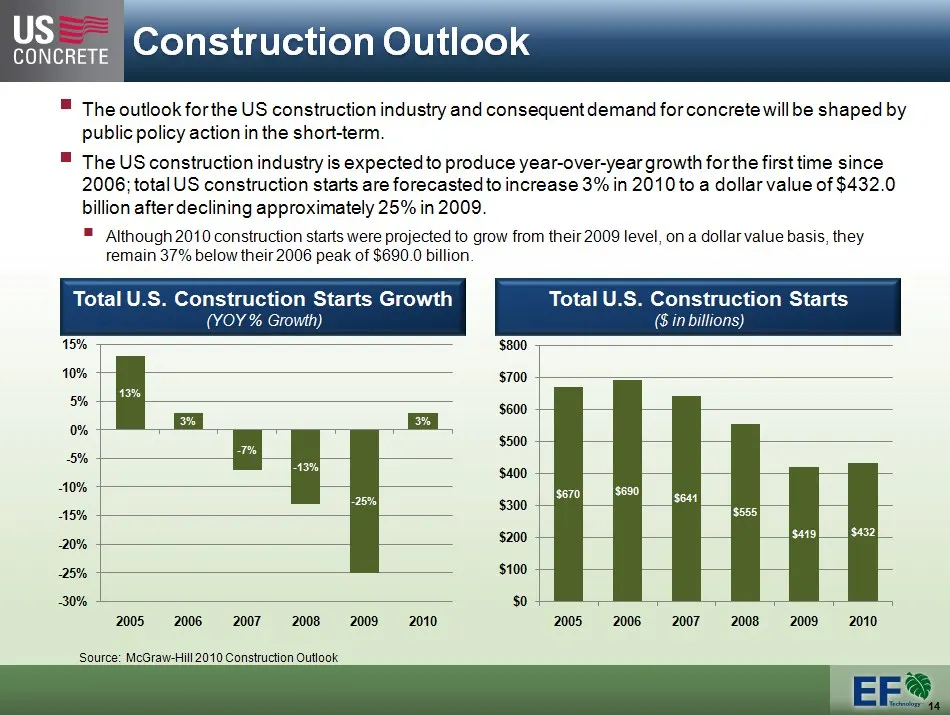
Slide 14: Construction Outlook
Construction Outlook The outlook for the US construction industry and consequent demand for concrete will be shaped by public policy action in the short-term. The US construction industry is expected to produce year-over-year growth for the first time since 2006; total US construction starts are for
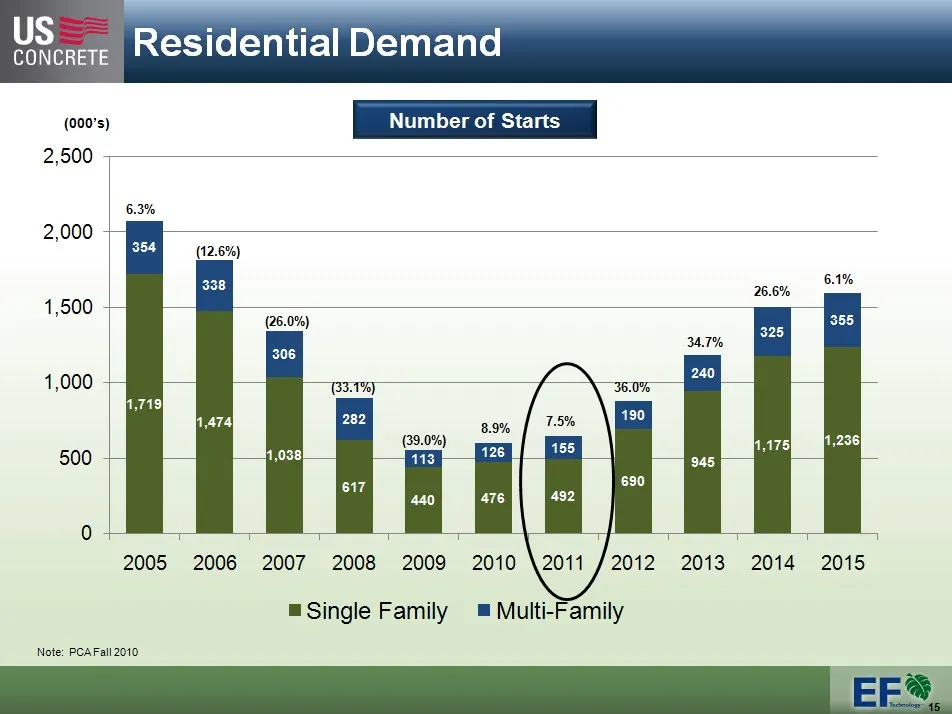
Slide 15: Residential Demand
Residential Demand Number of Starts Note: PCA Fall 2010 Single Family Multi-Family 2005 1,719 354 2006 1,474 338 2007 1,038 306 2008 617 282 2009 440 113 2010 476 126 2011 492 155 2012 690 190 2013 945 240 2014 1,175 325 2015 1,236 355 2005 $2,073.0 2006 $1,812.0 -12.6% 2007 $1,344.0 -25.8% 2008 $89
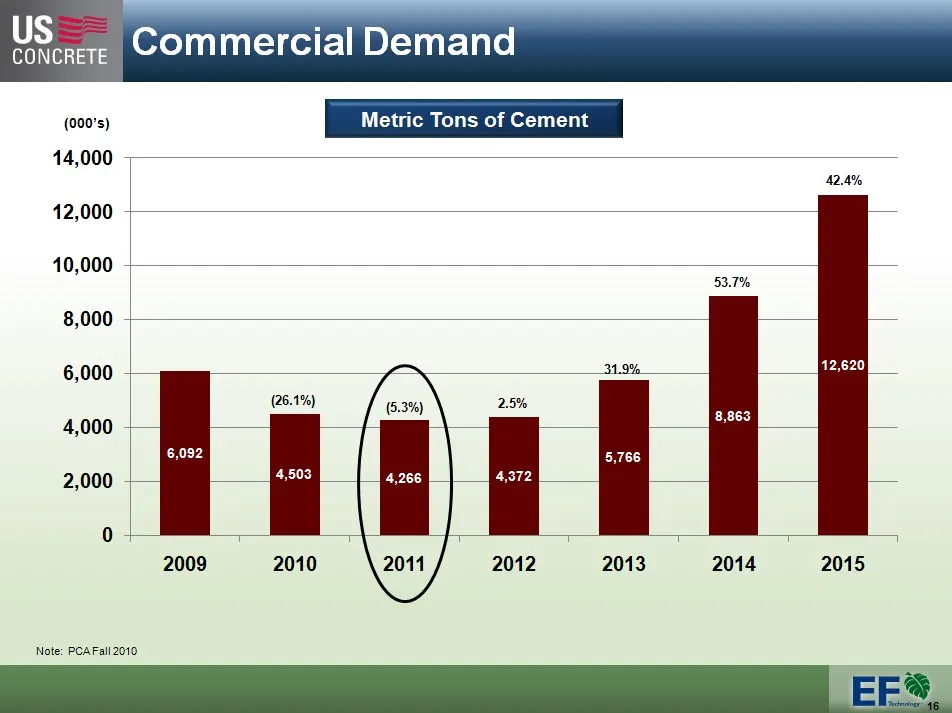
Slide 16: Commercial Demand
Commercial Demand Metric Tons of Cement Note: PCA Fall 2010 2009 6,092 2010 4,503 2011 4,266 2012 4,372 2013 5,766 2014 8,863 2015 12,620 2009 $6,092.0 2010 $4,503.0 -26.1% 2011 $4,266.0 -5.3% 2012 $4,372.0 2.5% 2013 $5,766.0 31.9% 2014 $8,863.0 53.7% 2015 $12,620.0 42.4%
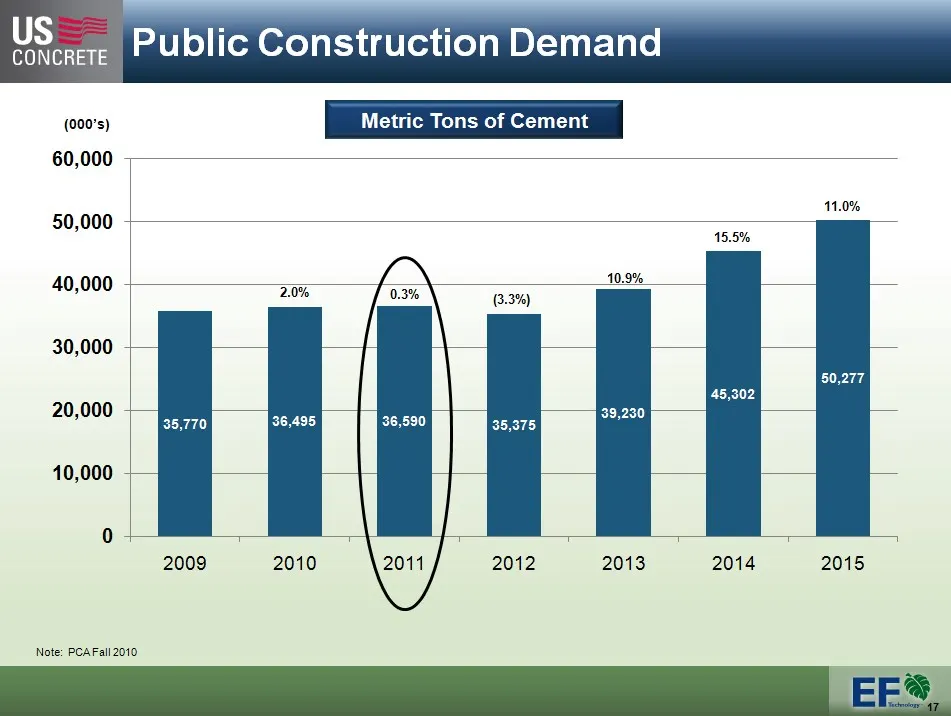
Slide 17: Public Construction Demand
Public Construction Demand Metric Tons of Cement Note: PCA Fall 2010 2009 35,770 2010 36,495 2011 36,590 2012 35,375 2013 39,230 2014 45,302 2015 50,277 2009 $35,770.0 2010 $36,495.0 2.0% 2011 $36,590.0 0.3% 2012 $35,375.0 -3.3% 2013 $39,230.0 10.9% 2014 $45,302.0 15.5% 2015 $50,277.0 11.0%
Slide 18: Company Strategy and Focus
Company Strategy and Focus
Slide 19: Strategic Plan Key Elements
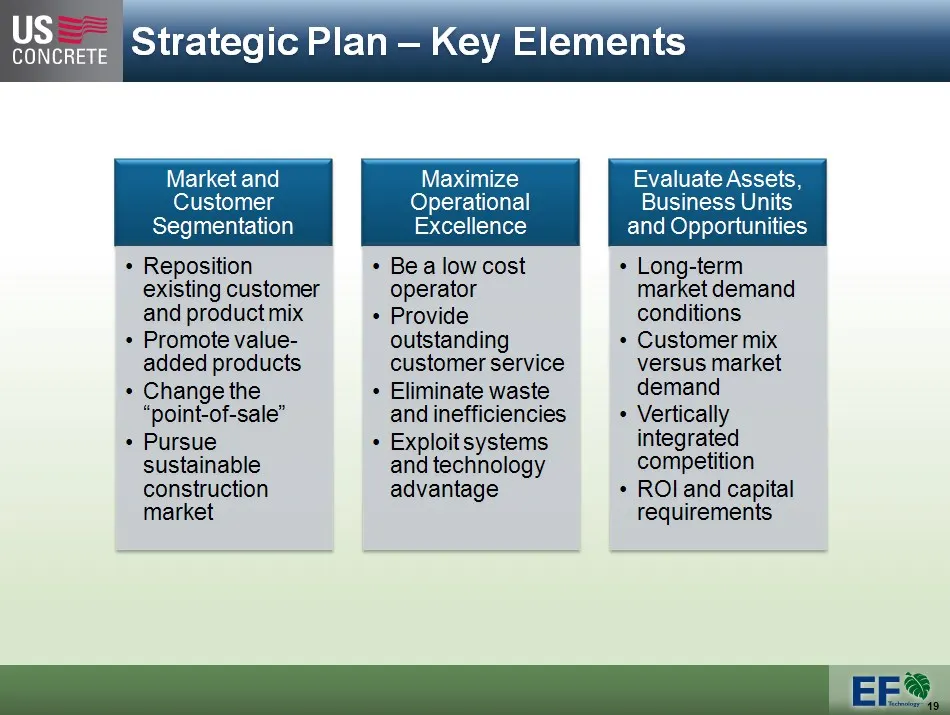
Strategic Plan Key Elements Market and Customer Segmentation Reposition existing customer and product mix Promote value-added products Change the point-of-sale Pursue sustainable construction market Maximize Operational Excellence Be a low cost operator Provide outstanding customer service Eliminate
Slide 20: Continue to aggressively manage through current economic cycle
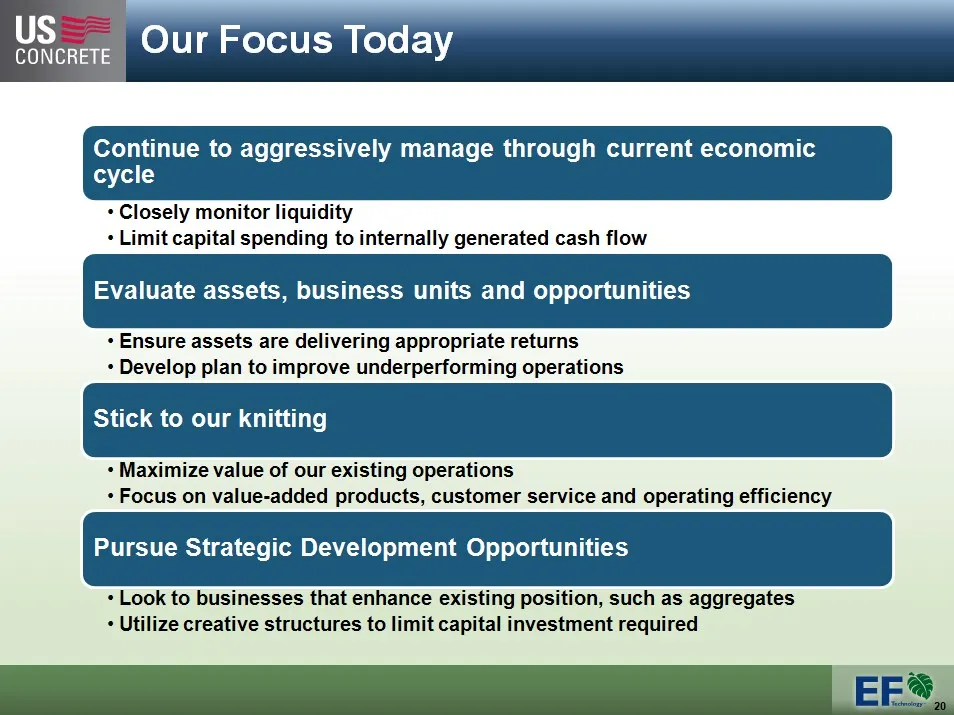
Continue to aggressively manage through current economic cycle Closely monitor liquidity Limit capital spending to internally generated cash flow Evaluate assets, business units and opportunities Ensure assets are delivering appropriate returns Develop plan to improve underperforming operations Stic
Slide 21: Financial Summary
$s US ——— ay CONCRETE Financial Summary
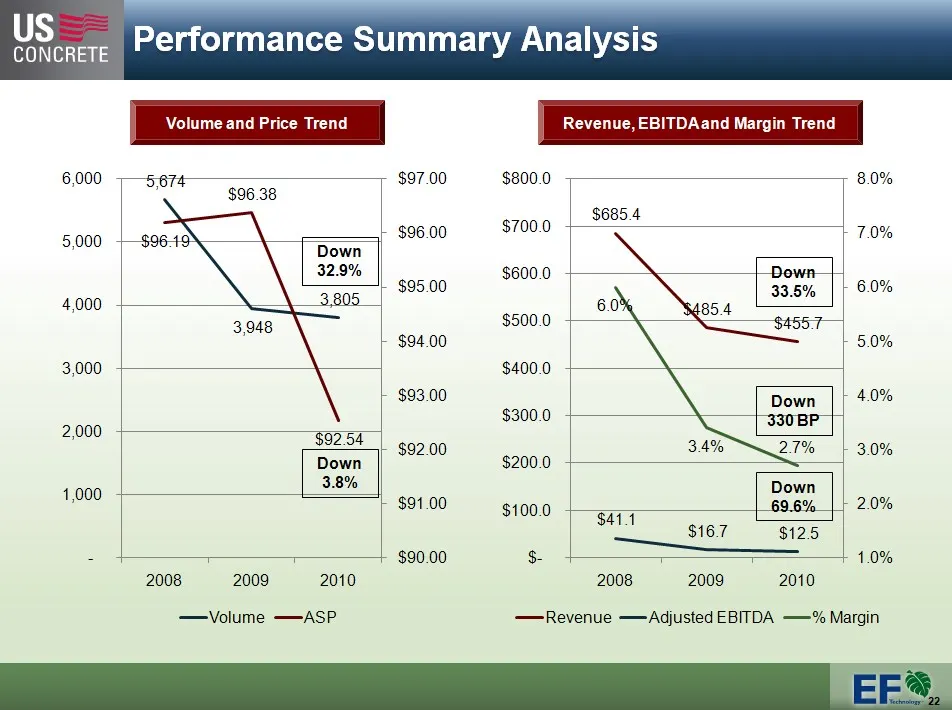
Slide 22: Performance Summary Analysis
Performance Summary Analysis Volume and Price Trend Revenue, EBITDA and Margin Trend Volume ASP Series 3 2008 5,674 $96.19 2 2009 3,948 $96.38 2 2010 3,805 $92.54 3 Category 4 4.5 2.8 5 Revenue Adjusted EBITDA % Margin 2008 $685.4 $41.1 6.0% 2009 $485.4 $16.7 3.4% 2010 $455.7 $12.5 2.7% Category 4 $
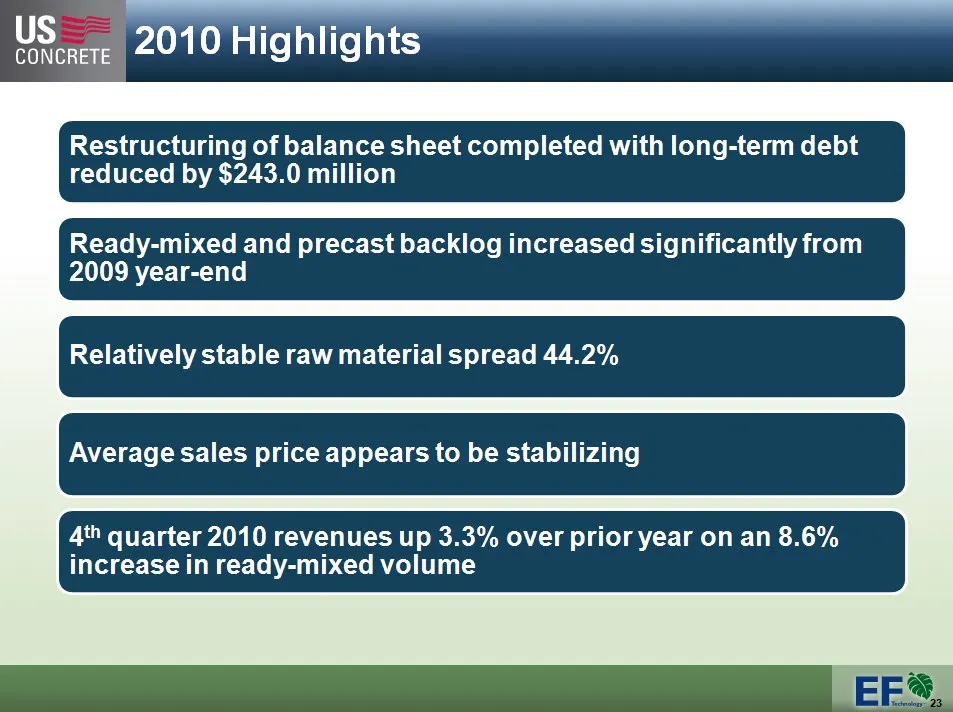
Slide 23: 2010 Highlights
2010 Highlights Restructuring of balance sheet completed with long-term debt reduced by $243.0 million Ready-mixed and precast backlog increased significantly from 2009 year-end Relatively stable raw material spread 44.2% Average sales price appears to be stabilizing 4 th quarter 2010 revenues up 3.
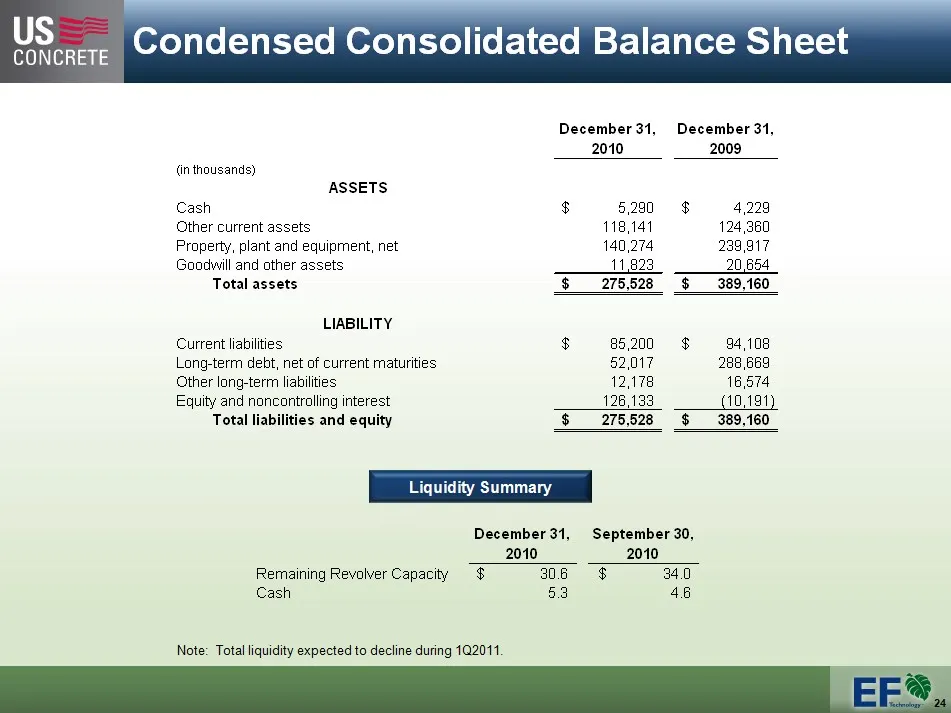
Slide 24: Condensed Consolidated Balance Sheet
Condensed Consolidated Balance Sheet "December 31, 2010" "December 31, 2009" (in thousands) ASSETS Cash $5,290 $4,229 Other current assets 118,141 124,360 Property, plant and equipment, net 140,274 239,917 Goodwill and other assets 11,823 20,654 Total assets $275,528 $389,160 LIABILITY Current liabi
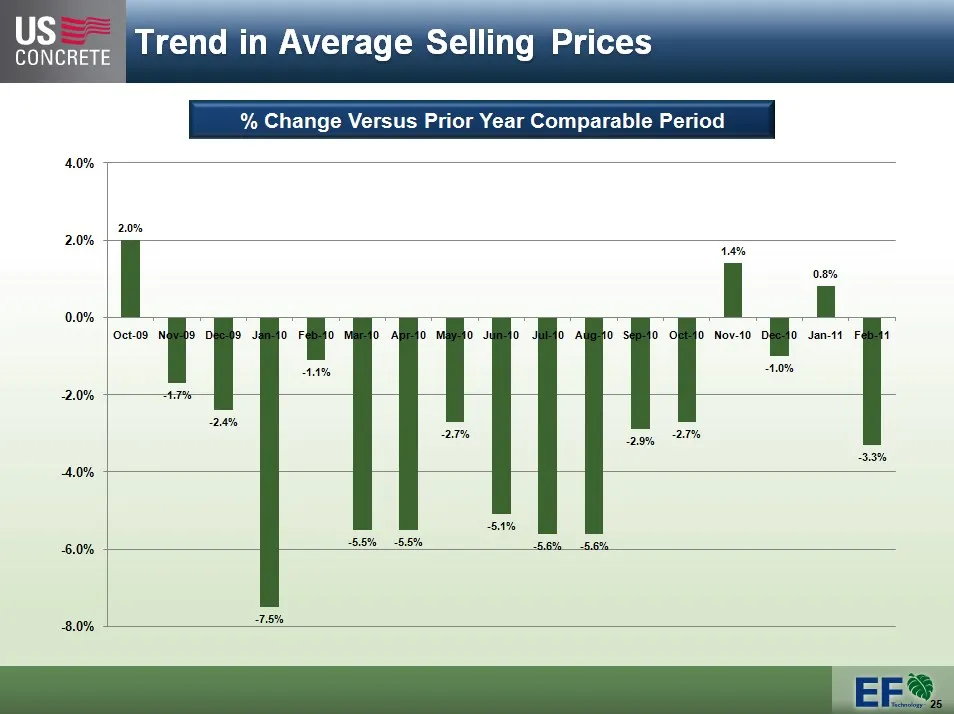
Slide 25: Trend in Average Selling Prices
Trend in Average Selling Prices % Change Versus Prior Year Comparable Period Oct-09 2.0% Nov-09 -1.7% Dec-09 -2.4% Jan-10 -7.5% Feb-10 -1.1% Mar-10 -5.5% Apr-10 -5.5% May-10 -2.7% Jun-10 -5.1% Jul-10 -5.6% Aug-10 -5.6% Sep-10 -2.9% Oct-10 -2.7% Nov-10 1.4% Dec-10 -1.0% Jan-11 0.8% Feb-11 -3.3%
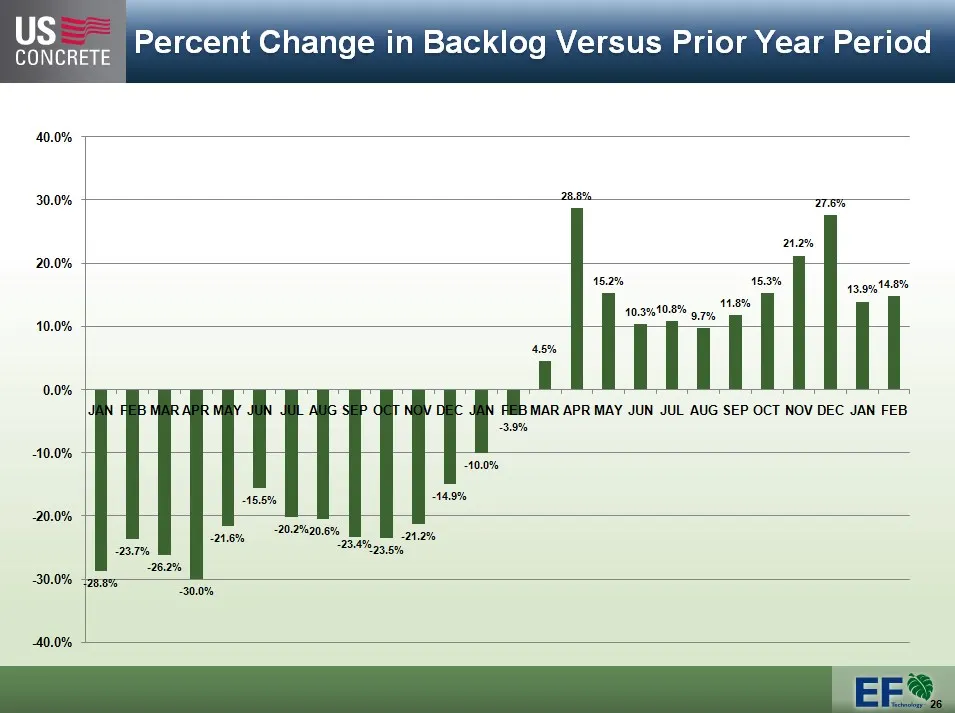
Slide 26: Percent Change in Backlog Versus Prior Year Period
Percent Change in Backlog Versus Prior Year Period JAN -28.8% 2.4 2 FEB -23.7% 4.4 2 MAR -26.2% 1.8 3 APR -30.0% 2.8 5 MAY -21.6% JUN -15.5% JUL -20.2% AUG -20.6% SEP -23.4% OCT -23.5% NOV -21.2% DEC -14.9% JAN -10.0% FEB -3.9% MAR 4.5% APR 28.8% MAY 15.2% JUN 10.3% JUL 10.8% AUG 9.7% SEP 11.8% OCT
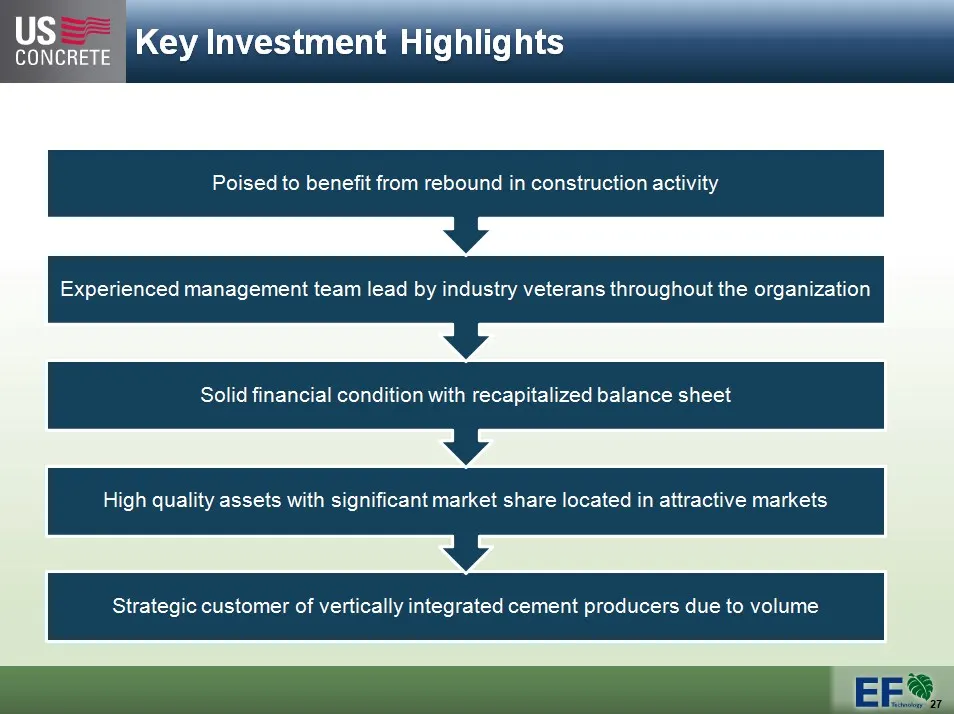
Slide 27: Key Investment Highlights
Key Investment Highlights Poised to benefit from rebound in construction activity Experienced management team lead by industry veterans throughout the organization Solid financial condition with recapitalized balance sheet High quality assets with significant market share located in attractive marke
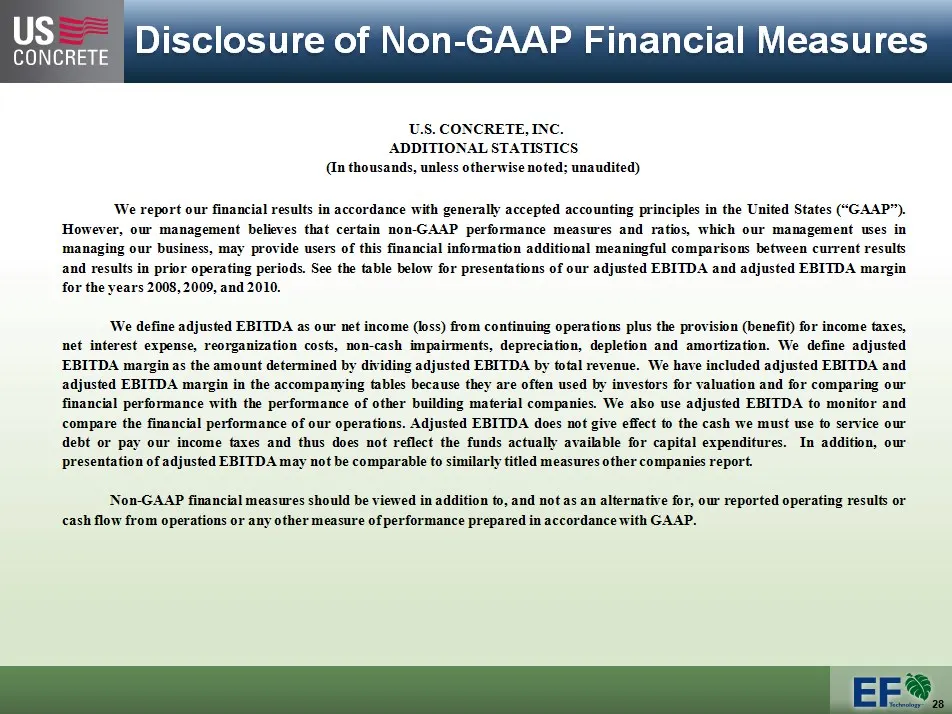
Slide 28: Disclosure of Non-GAAP Financial Measures
Disclosure of Non-GAAP Financial Measures U.S. CONCRETE, INC. ADDITIONAL STATISTICS (In thousands, unless otherwise noted; unaudited) We report our financial results in accordance with generally accepted accounting principles in the United States (“GAAP”). However, our management believes that certa
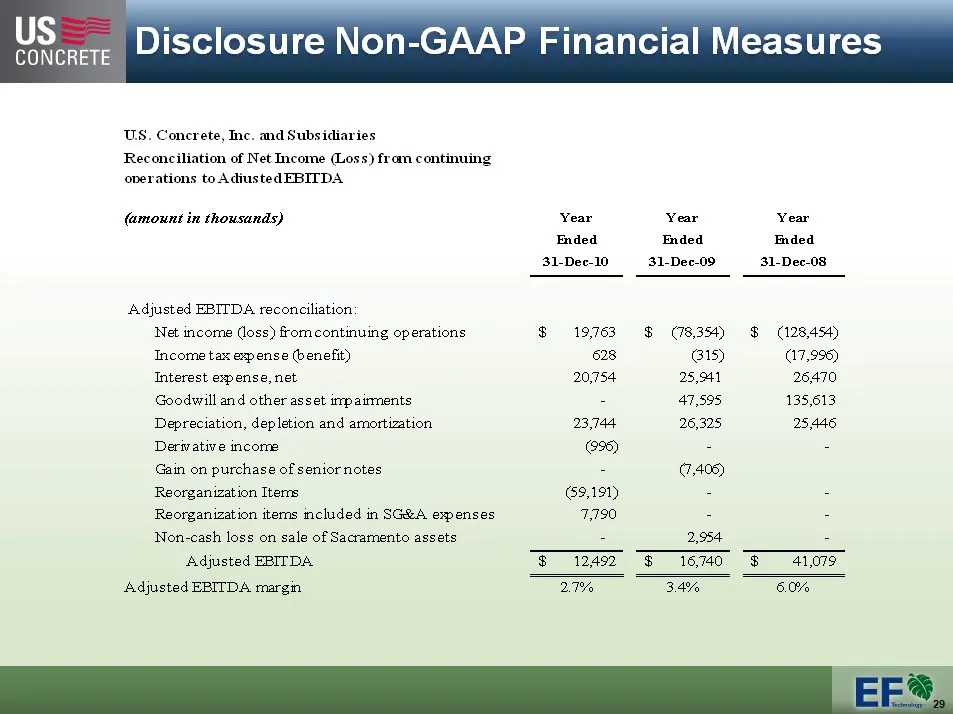
Slide 29: Reconciliation of Net Income (Loss) to Adjusted EBITDA
Disclosure Non-GAAP Financial Measures U.S. Concrete, Inc. and Subsidiaries Reconciliation of Net Income (Loss) from continuing operations to Adjusted EBITDA (amount in thousands) Year Year Year Ended Ended Ended 31-Dec-10 31-Dec-09 31-Dec-08 Adjusted EBITDA reconciliation: Net income (loss) from co
Slide 30: BB&T Commercial & Industrial Conference
BB&T Commercial & Industrial Conference April 7, 2011
Source: SEC EDGAR · 8-K filed Apr 6, 2011
More decks from U.S. Concrete Inc
 ESG Presentation (April 2021)31 slides · Apr 1, 2021
 Investor Presentation (March 2021)36 slides · Mar 23, 2021
 Investor Presentation (November 2020)36 slides · Nov 12, 2020
 Investor Presentation (June 2020)22 slides · Jun 3, 2020
 Investor Presentation (March 2019)16 slides · Mar 22, 2019
 Investor Presentation (November 2018)17 slides · Nov 5, 2018