Embassy Bancorp, Inc. · OTC:EMYB
Embassy Bancorp — Shareholder Meeting (June 2025)
56 slides from Embassy Bancorp's shareholder meeting presentation, Jun 18, 2025
Slide 1: Annual Meeting of Shareholders June 18, 2025
Annual Meeting of Shareholders June 18, 2025 Embassy Bancorp, Inc.
Slide 2: Caution on Forward Looking Statements
Caution on Forward Looking Statements This presentation may contain forward-looking statements, including statements of goals, intentions, and expectations as to future trends, plans, events or results of Embassy Bancorp, Inc.’s (“Company”) operations and policies and regarding general economic cond
Slide 3: Board of Directors
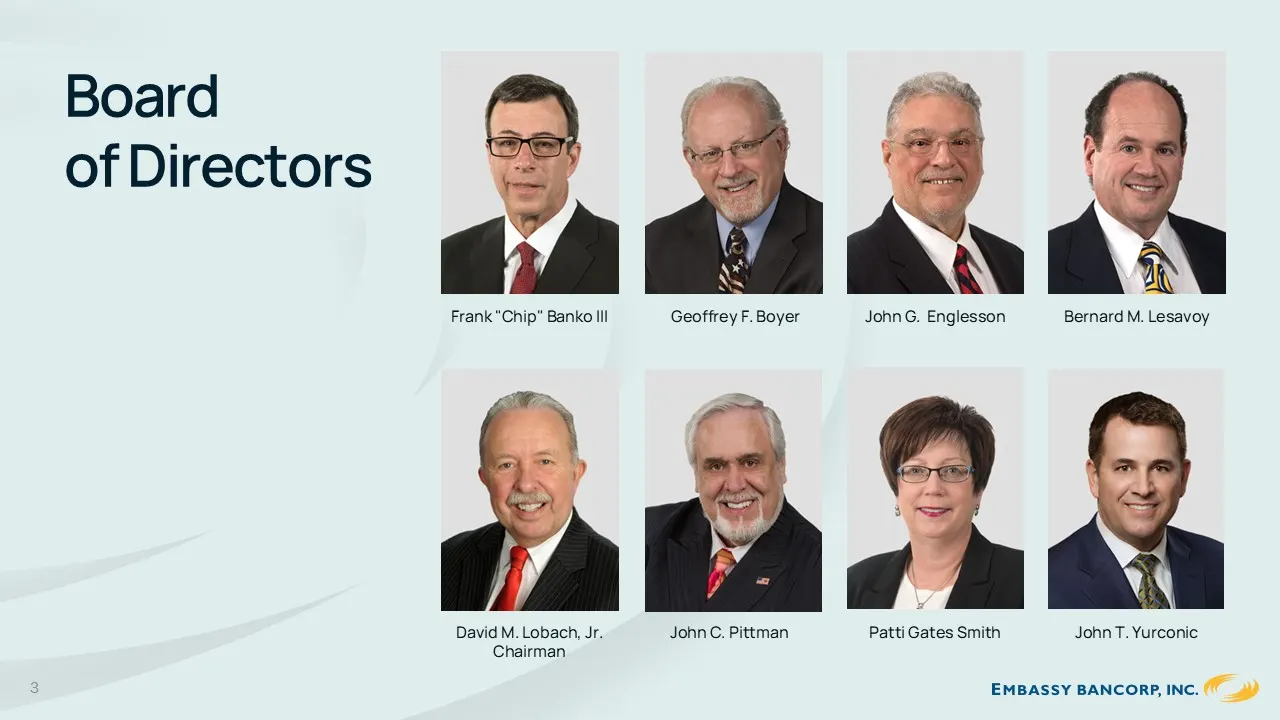
Board of Directors Frank "Chip" Banko III Geoffrey F. Boyer John G. Englesson Bernard M. Lesavoy David M. Lobach, Jr. Chairman John C. Pittman Patti Gates Smith John T. Yurconic 3 Embassy Bancorp, Inc.
Slide 4: Leadership Team
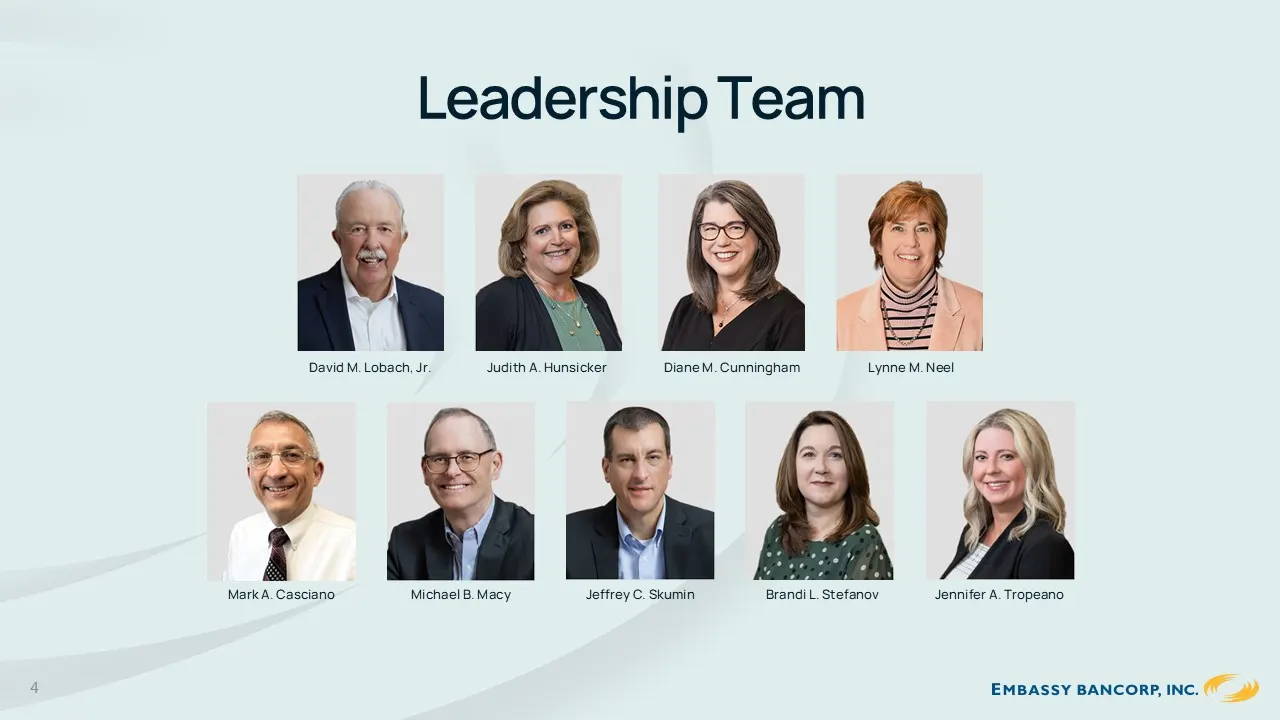
Leadership Team David M. Lobach, Jr. Judith A. Hunsicker Diane M. Cunningham Lynne M. Neel Mark A. Casciano Michael B. Macy Jeffrey C. Skumin Brandi L. Stefanov Jennifer A. Tropeano 4 Embassy Bancorp, Inc.

Slide 5: Business of the Meeting
Business of the Meeting 5 David M. Lobach, Jr. Judith A. Hunsicker Embassy Bancorp, Inc.
Slide 6: Business of the Meeting: Determination of a Quorum
Business of the Meeting 6 Determination of a Quorum
Slide 7: Proposal #1: Election of Directors
Business of the Meeting 7 Proposal #1 To elect four Class 3 Directors of the Company for a term of 3 years: •Bernard M. Lesavoy •David M. Lobach, Jr., Chairman •John C. Pittman •John T. Yurconic
Slide 8: Proposals #2 and #3: Executive Compensation
Business of the Meeting 8 Proposal #2 To approve an advisory, non-binding resolution regarding executive compensation. Proposal #3 To approve an advisory, non-binding proposal on the frequency of future advisory votes regarding executive compensation.
Slide 9: Proposals #4 and #5: Auditor Ratification and Shareholder Proposal
Business of the Meeting 9 Proposal #4 To ratify the appointment of Baker Tilly US, LLP as the Company’s independent registered public accounting firm for the year ended December 31, 2025. Proposal #5 A non-binding shareholder proposal, if properly presented at the meeting
Slide 10: The Polls are Now Closed
Business of the Meeting 10 The Polls are Now Closed
Slide 11: Team Community Customer
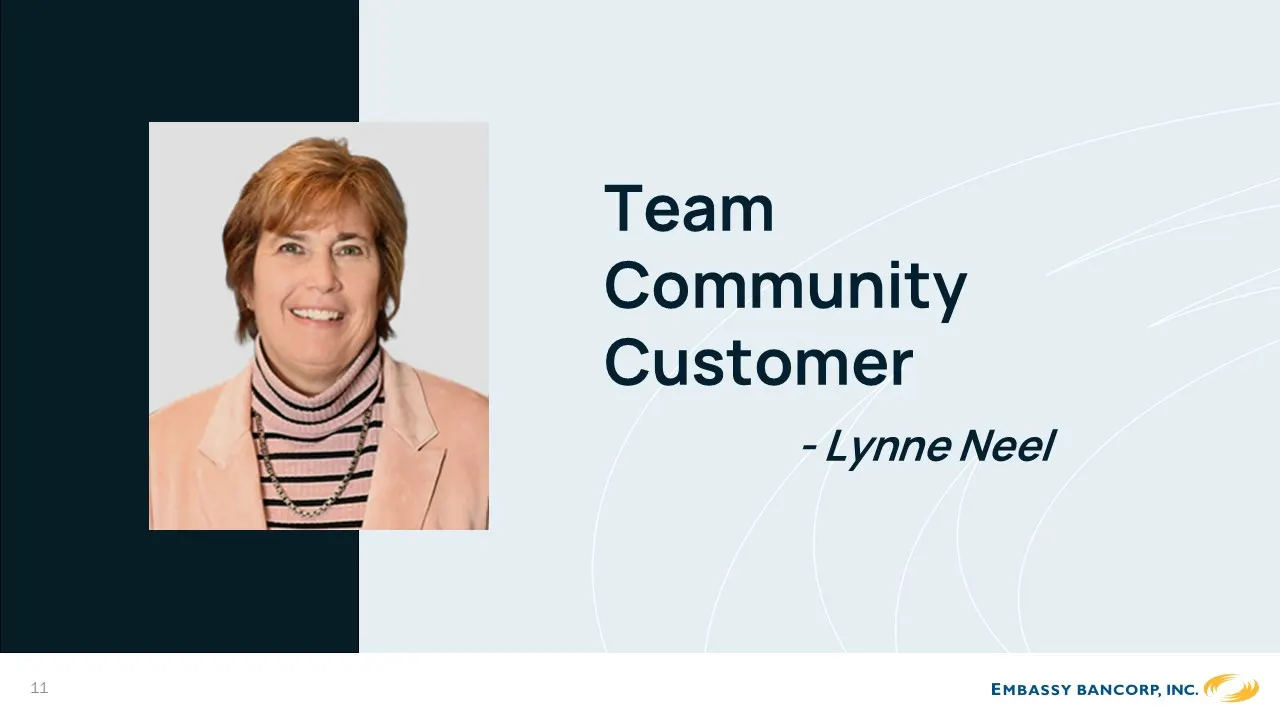
Team Community Customer - Lynne Neel 11
Slide 12: Figures as of 3/31/2025
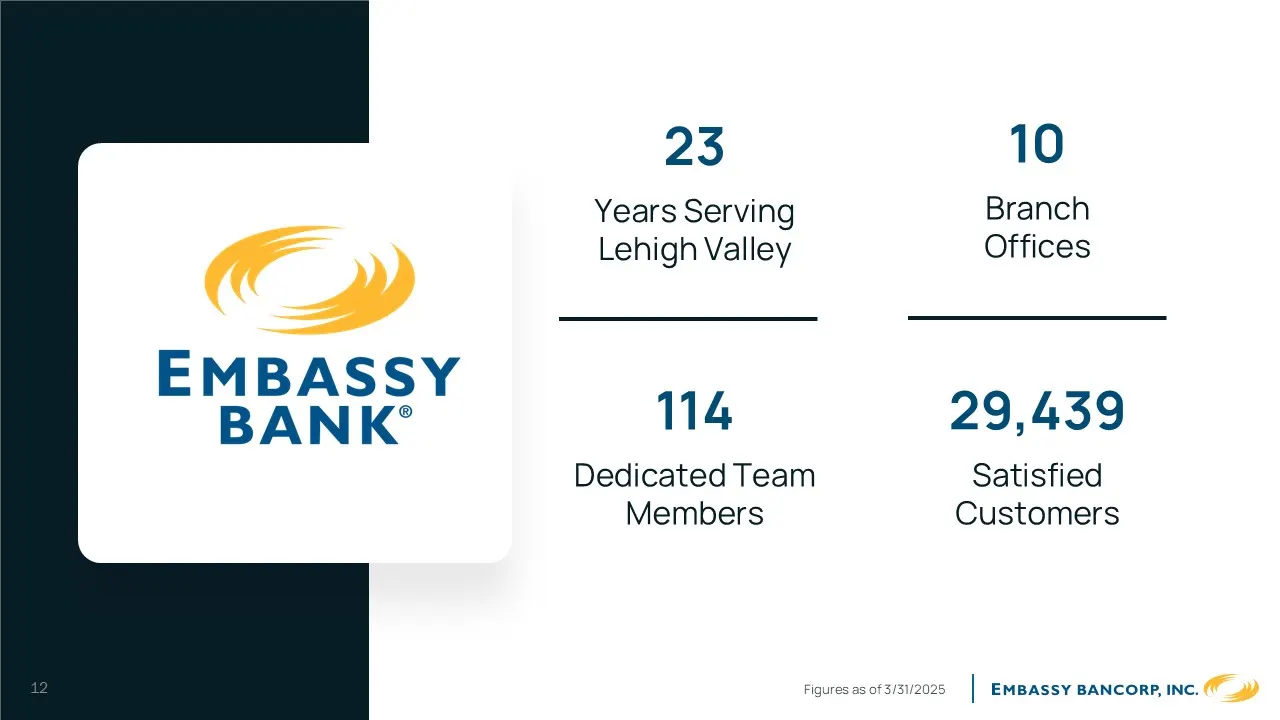
12 Figures as of 3/31/2025 10 Branch Offices 114 Dedicated Team Members 23 Years Serving Lehigh Valley 29,439 Satisfied Customers
Slide 13: Customer Relationships and Digital Bank Users
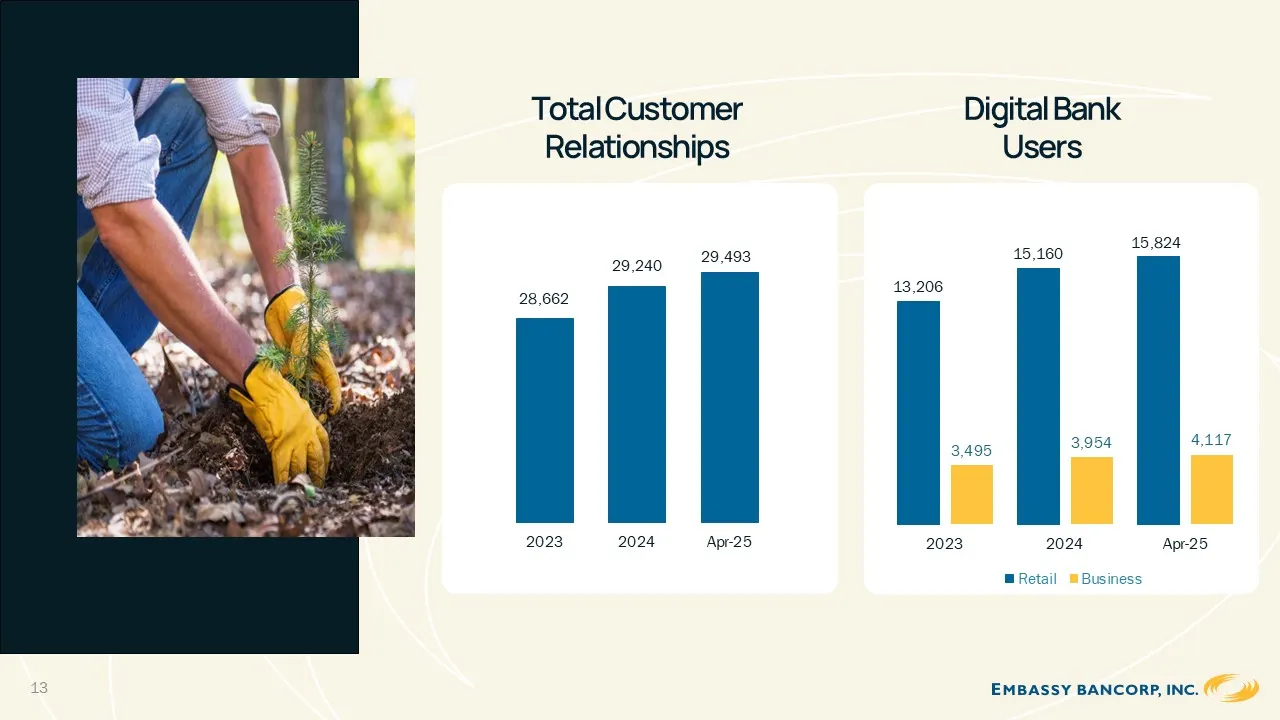
28,662 29,240 29,493 2023 2024 Apr-25 13,206 15,160 15,824 3,495 3,954 4,117 2023 2024 Apr-25 Retail Business Total Customer Relationships Digital Bank Users
Slide 14: Excellence in Banking
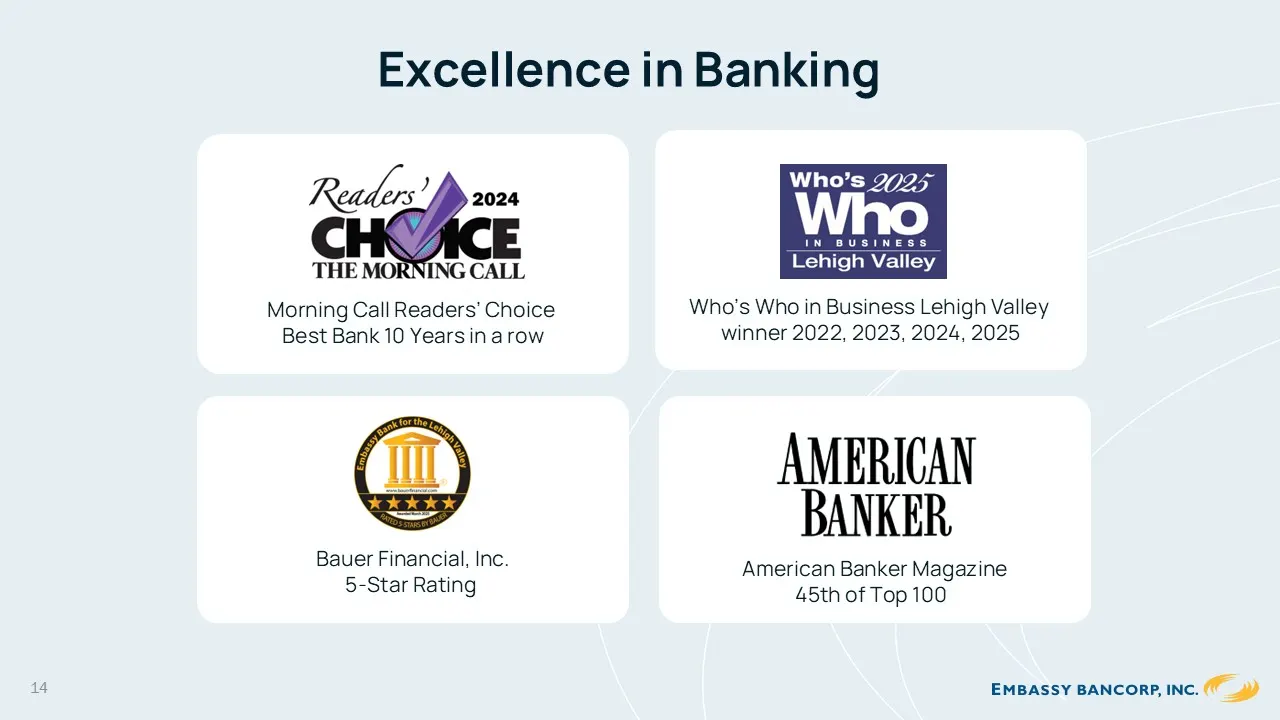
Excellence in Banking Bauer Financial, Inc. 5-Star Rating Who’s Who in Business Lehigh Valley Bauer Financial, Inc. winner 2022, 2023, 2024, 2025 Morning Call Readers’ Choice Best Bank 10 Years in a row American Banker American Banker Magazine 45th of Top 100 Readers’ 2024 Choice the morning Call wh
Slide 15: Community Engagement & Recognition
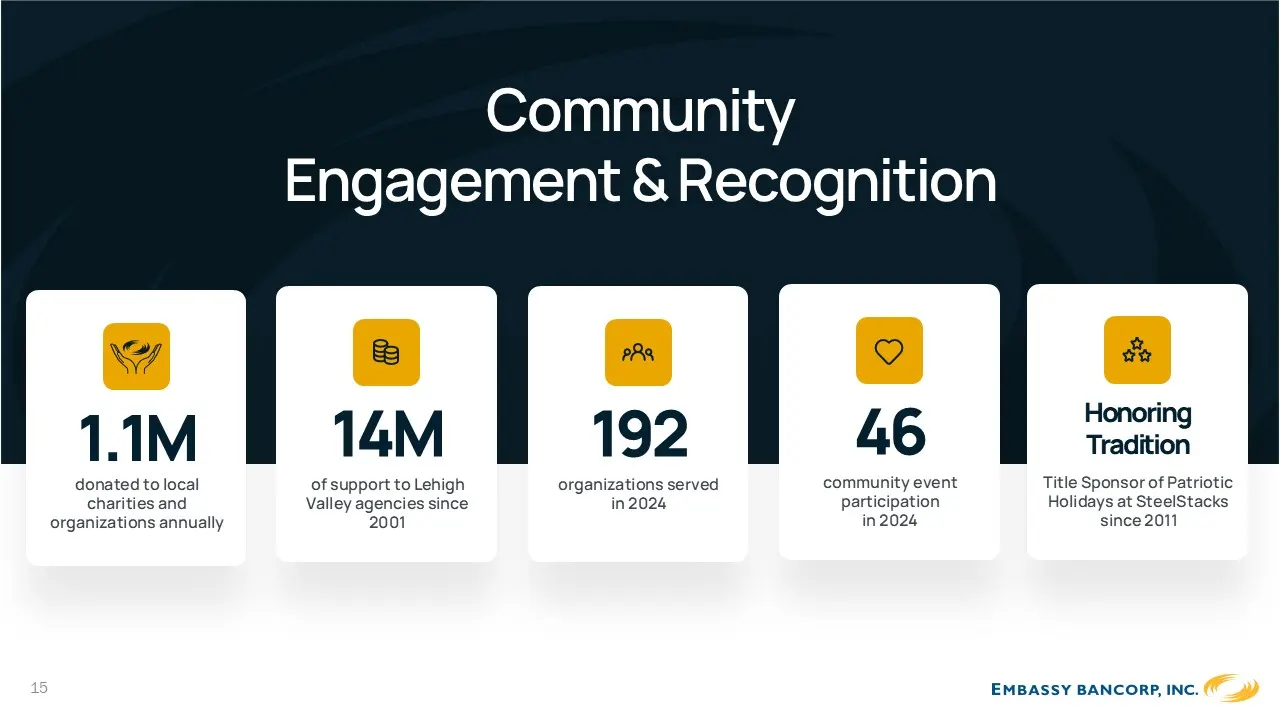
Community Engagement & Recognition 1.1M donated to local charities and organizations annually 14M of support to Lehigh Valley agencies since 2001 192 organizations served in 2024 46 community event participation in 2024 Honoring Tradition Title Sponsor of Patriotic Holidays at SteelStacks since 2011
Slide 16: 5-Year Growth Trends
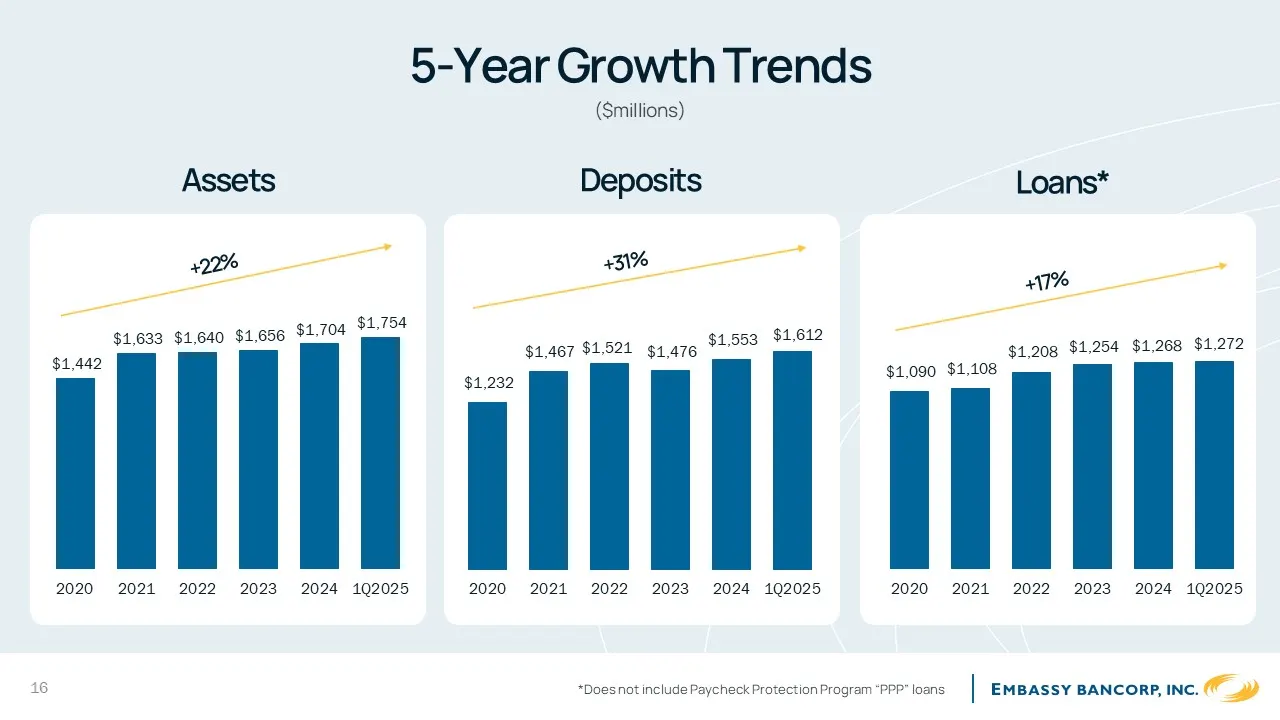
5-Year Growth Trends ($millions) 16 *Does not include Paycheck Protection Program “PPP” loans $1,442 $1,633 $1,640 $1,656 $1,704 $1,754 2020 2021 2022 2023 2024 1Q2025 $1,232 $1,467 $1,521 $1,476 $1,553 $1,612 2020 2021 2022 2023 2024 1Q2025 $1,090 $1,108 $1,208 $1,254 $1,268 $1,272 2020 2021 2022 2
Slide 17: 10-Year Growth Trends
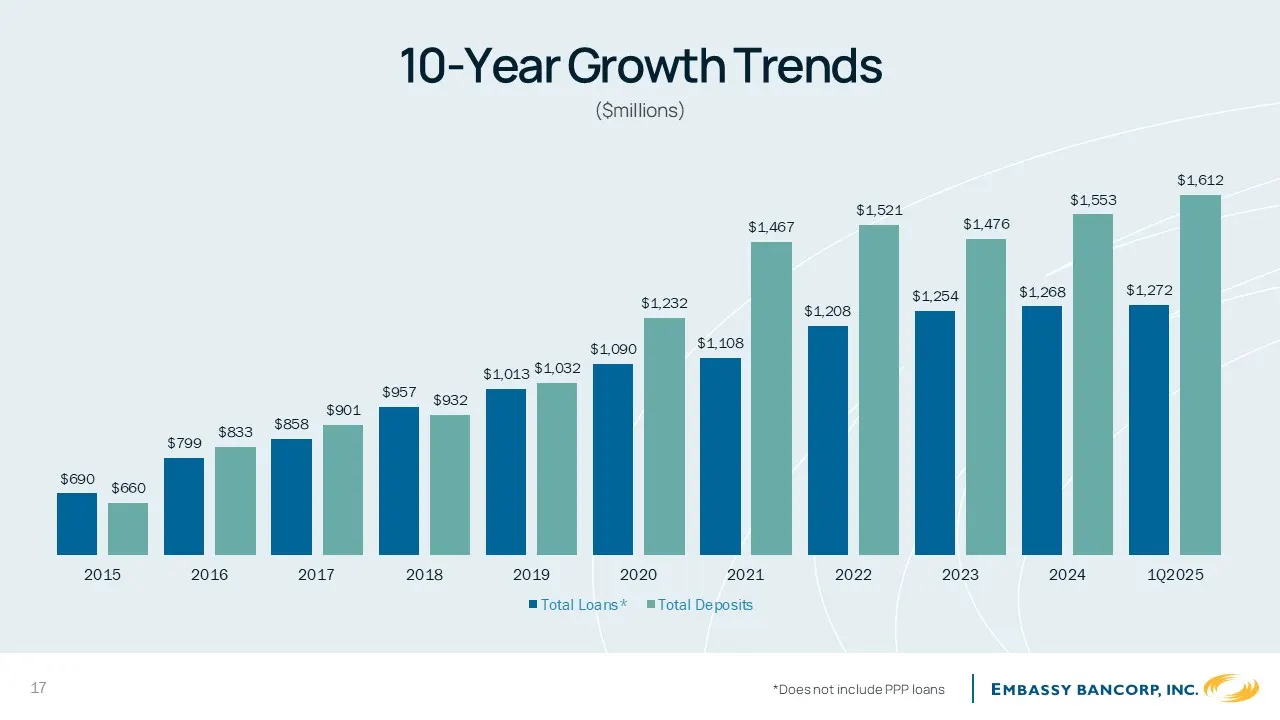
10-Year Growth Trends ($millions) 17 *Does not include PPP loans $690 $799 $858 $957 $1,013 $1,090 $1,108 $1,208 $1,254 $1,268 $1,272 $660 $833 $901 $932 $1,032 $1,232 $1,467 $1,521 $1,476 $1,553 $1,612 2015 2016 2017 2018 2019 2020 2021 2022 2023 2024 1Q2025 Total Loans* Total Deposits
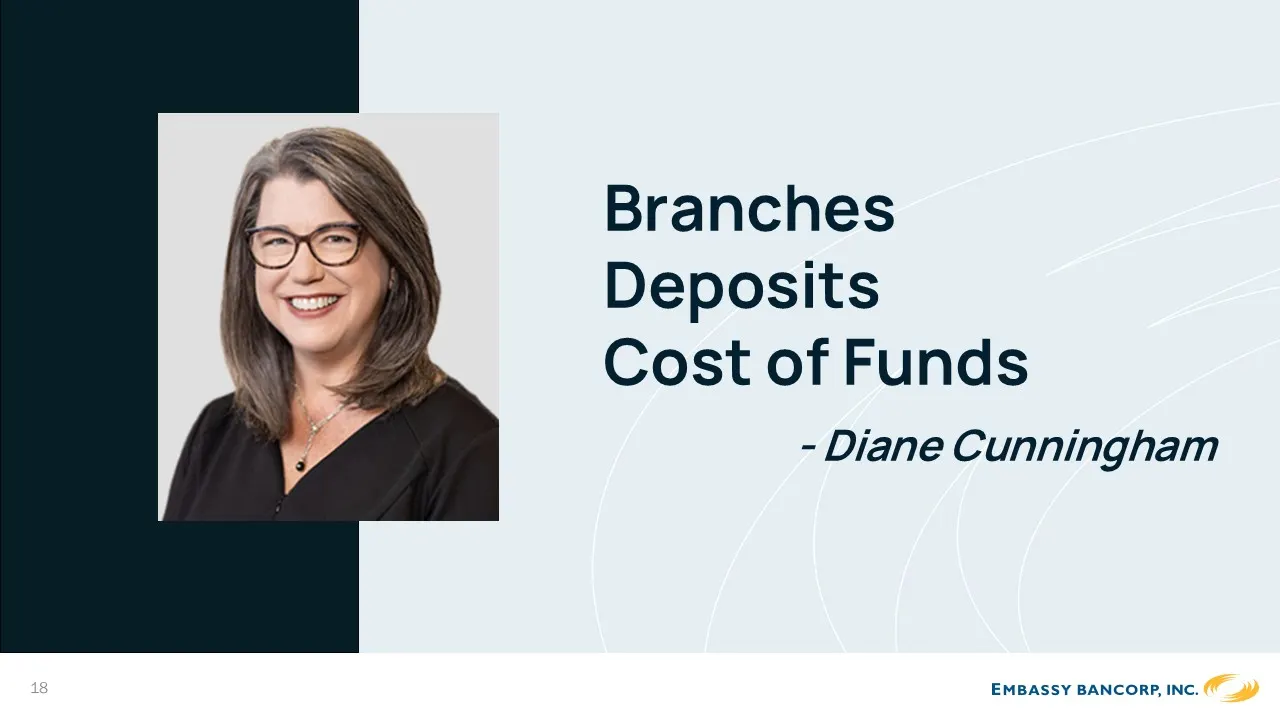
Slide 18: Branches Deposits Cost of Funds
Branches Deposits Cost of Funds - Diane Cunningham 18
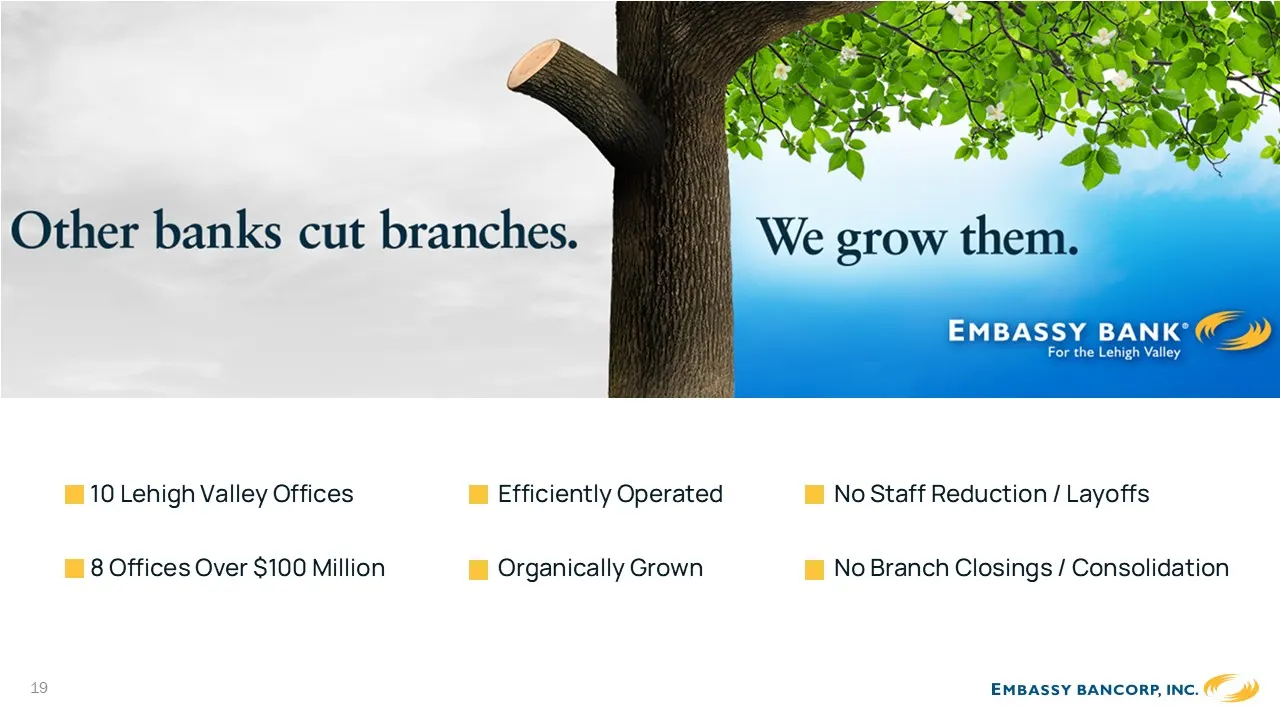
Slide 19: Lehigh Valley Offices
10 Lehigh Valley Offices 8 Offices Over $100 Million No Staff Reduction / Layoffs No Branch Closings / Consolidation Organically Grown Efficiently Operated 19 Other banks cut branches. We grow them. Embassy Bank for the lehigh valley
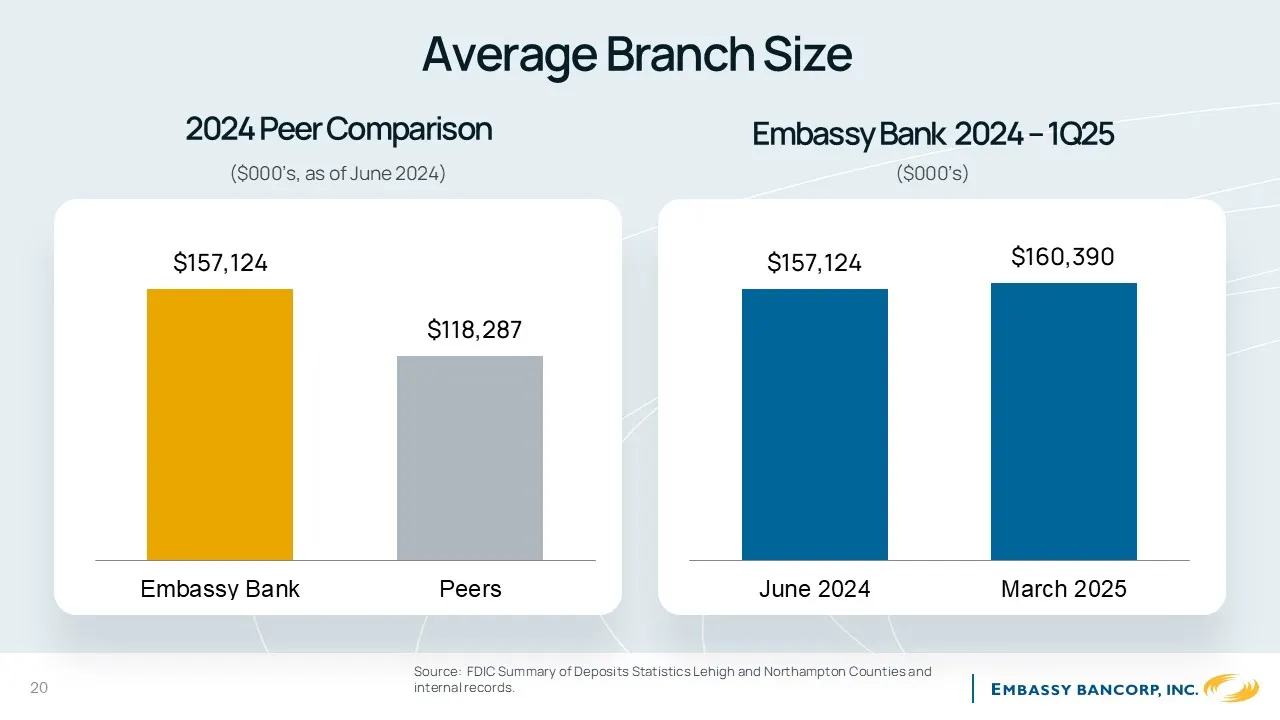
Slide 20: Average Branch Size
Average Branch Size $157,124 $160,390 June 2024 March 2025 Embassy Bank 2024 – 1Q25 ($000’s) 20 Source: FDIC Summary of Depos its Statis tics Lehigh and Northampton Counties and internal records . 2024 Peer Comparison ($000’s , as of June 2024) $157,124 $118,287 Embassy Bank Peers
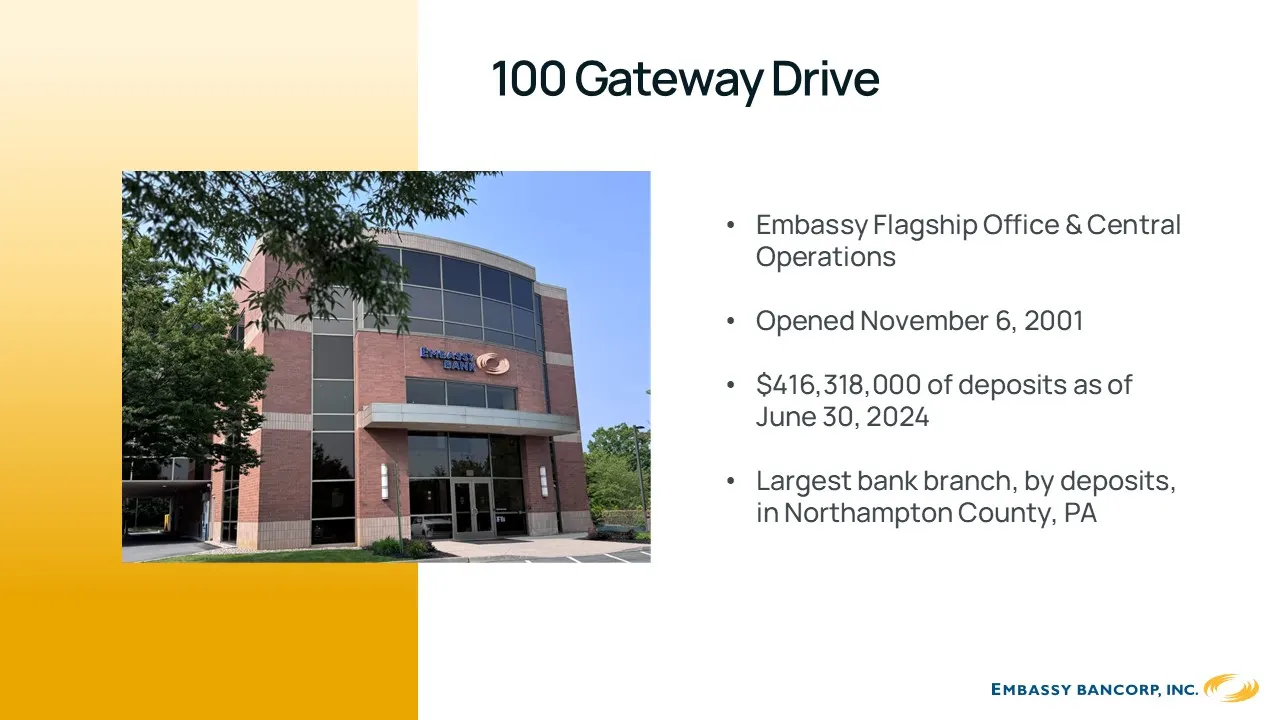
Slide 21: Embassy Flagship Office & Central Operations
Embassy Flagship Office & Central Operations • Opened November 6 , 2001 • $416,318,000 of depos its as of June 30 , 2024 • Larges t bank branch, by depos its , in Northampton County, PA 100 Gateway Drive 21
Slide 22: Deposits
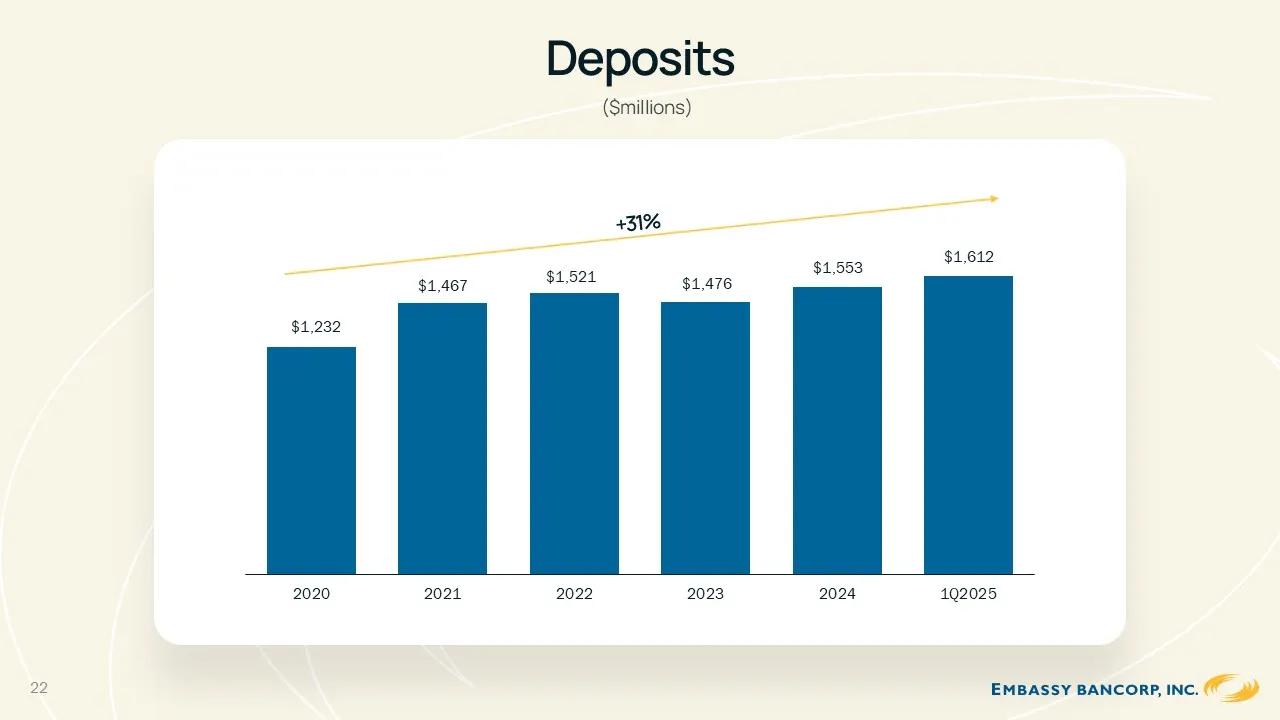
Deposits $1,232 $1,467 $1,521 $1,476 $1,553 $1,612 2020 2021 2022 2023 2024 1Q2025 ($millions) +31% 22
Slide 23: Deposits – 1Q25 Growth
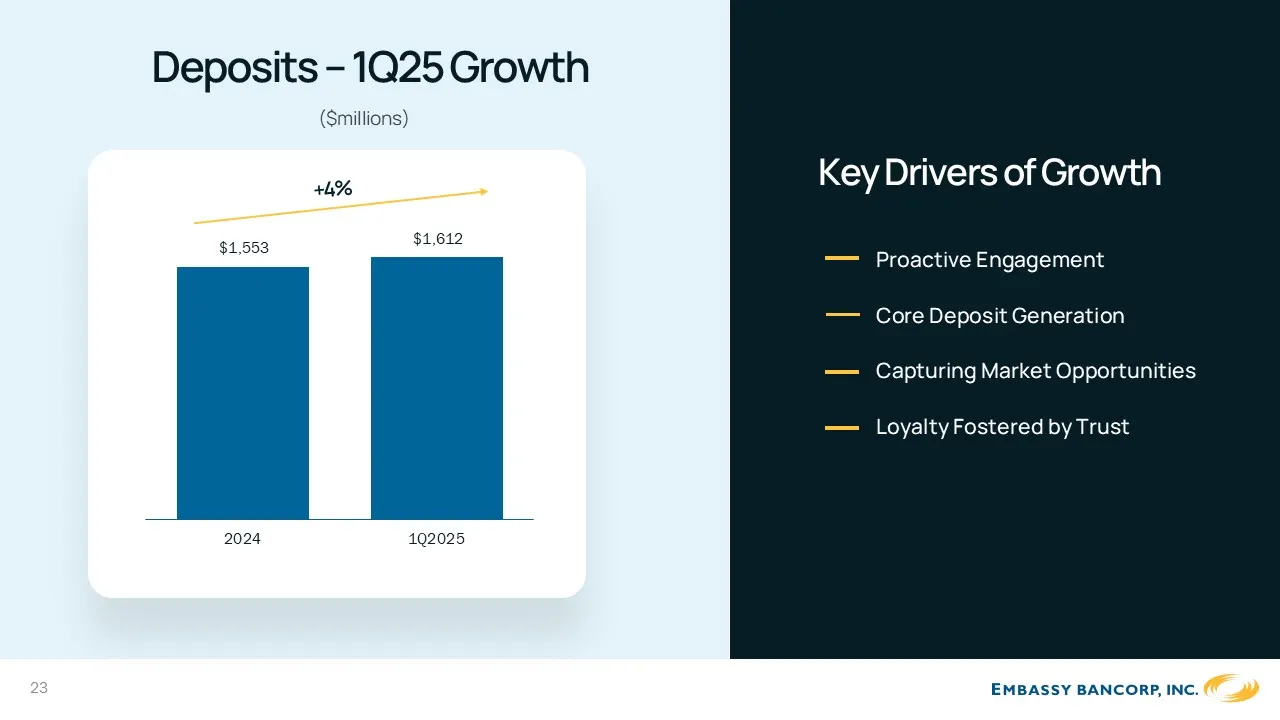
Deposits – 1Q25 Growth Core Deposit Generation Proactive Engagement Capturing Market Opportunities Loyalty Fostered by Trust Key Drivers of Growth $1,553 $1,612 2024 +4% 1Q2025
Slide 24: New Account Activity and Deposit Composition
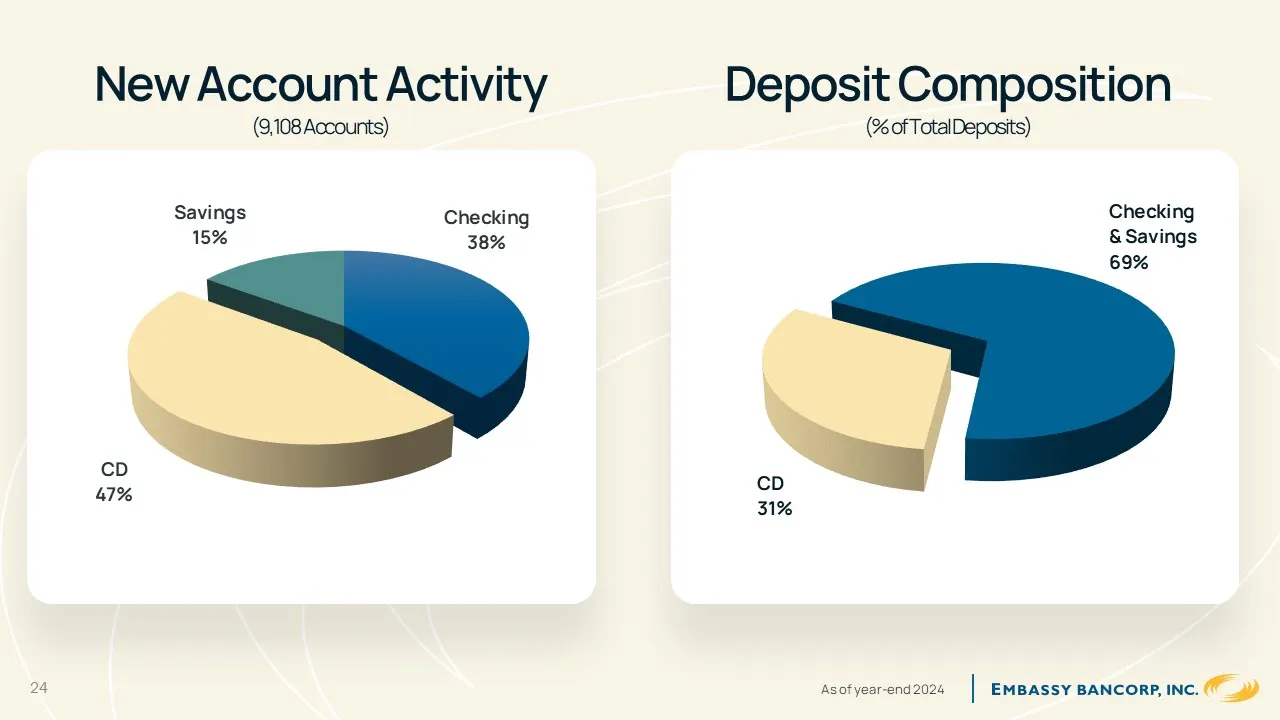
New Account Activity (9,108 Accounts) Checking & Savings 69% CD 31% Deposit Composition (% of Total Deposits) As of year-end 2024 Checking38% CD47% Savings15% 24
Slide 25: Top Commercial Banks by Deposit Market Share
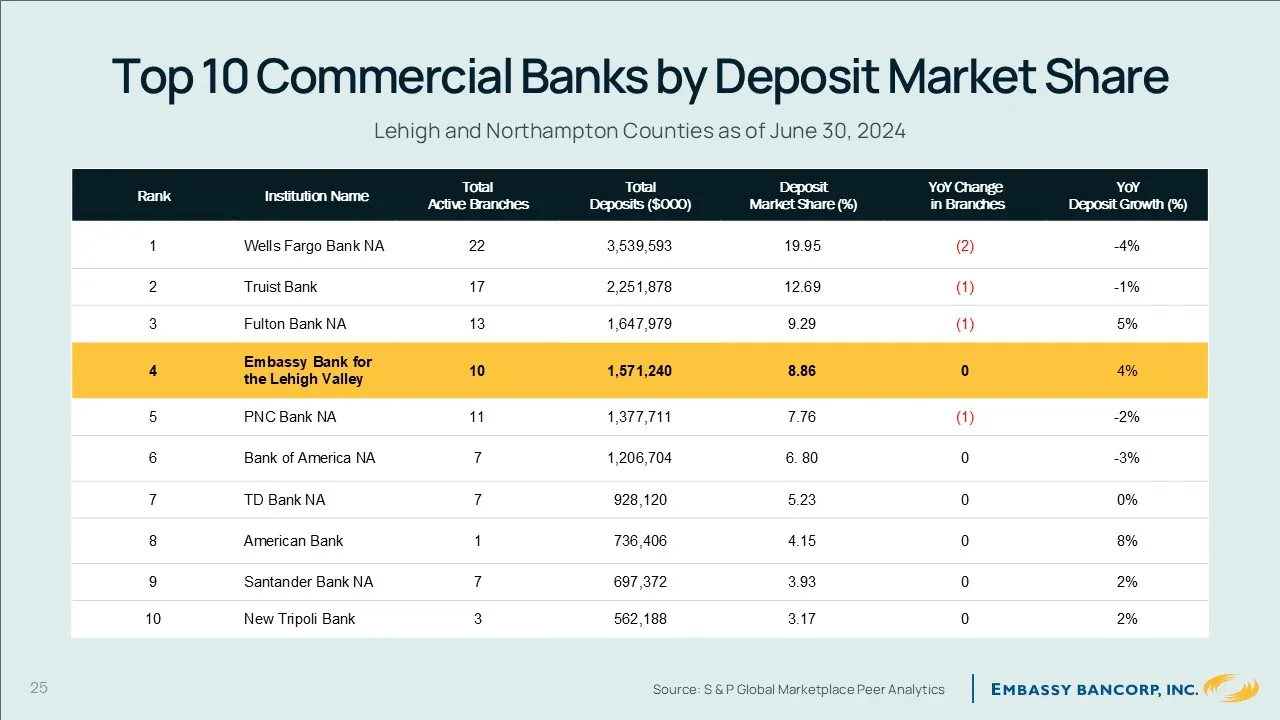
Top 10 Commercial Banks by Deposit Market Share Lehigh and Northampton Counties as of June 30, 2024 Rank Institution Name Total Active Branches Total Deposits ($000) Deposit Market Share (%) YoY Change in Branches YoY Deposit Growth (%) 1 Wells Fargo Bank NA 22 3,539,593 19.95 (2) -4% 2 Truist Bank
Slide 26: Cost of Funds
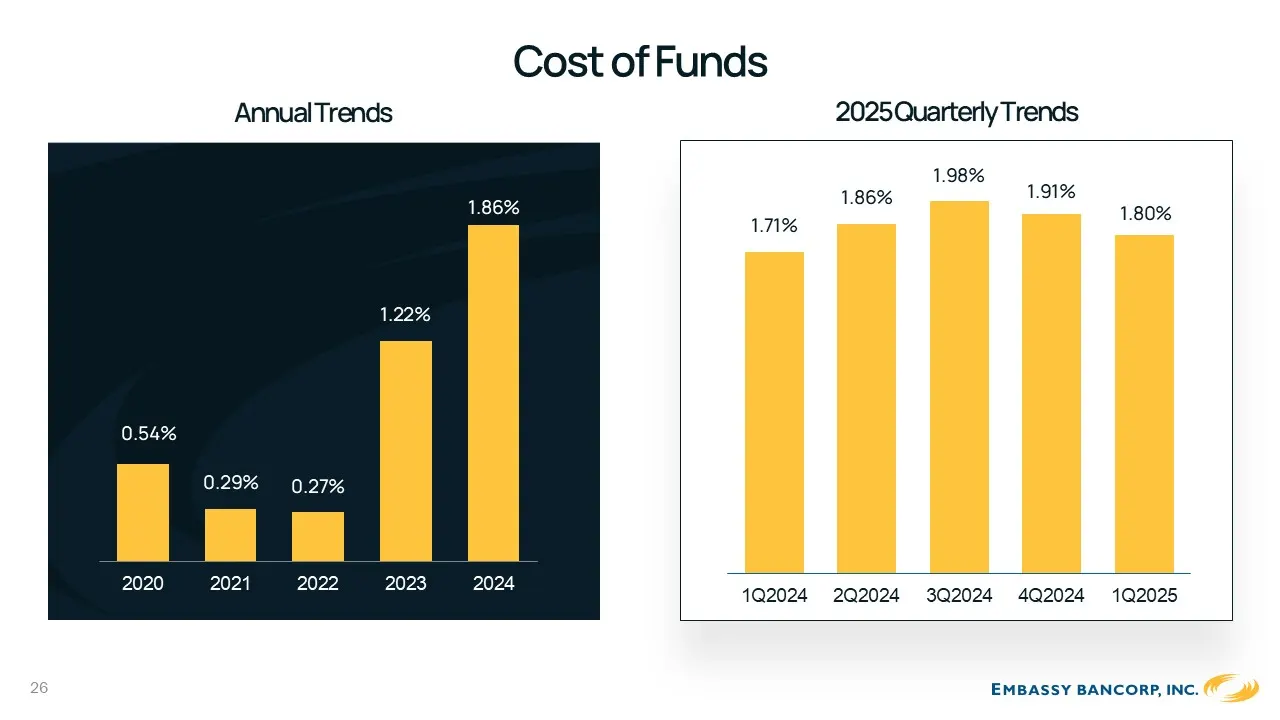
0.27% 0.54% 0.29% Cost of Funds 1.22% 1.86% 2020 2021 2022 2023 2024 Annual Trends 2025 Quarterly Trends 1.71% 1.86% 1.98% 1.91% 1.80% 1Q2024 2Q2024 3Q2024 4Q2024 1Q2025 26
Slide 27: 5-Year History Cost of Funds vs Peers
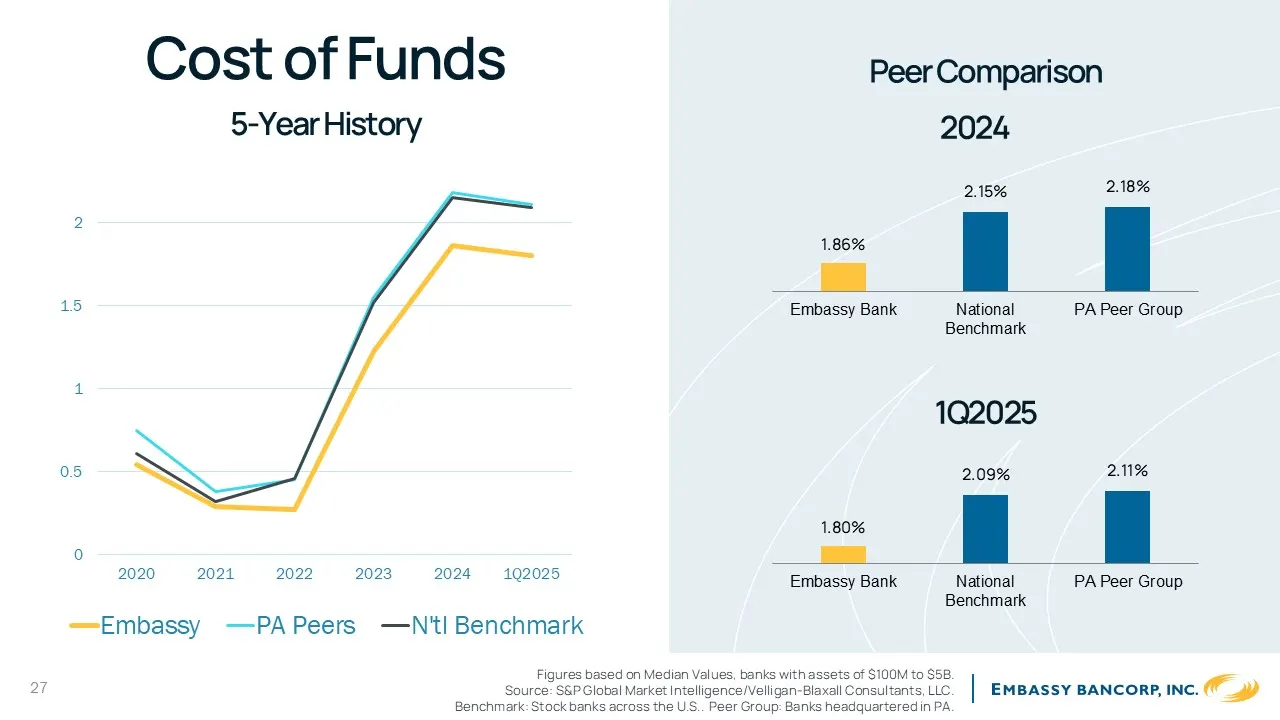
5-Year History 27 Figures based on Median Values, banks with assets of $100M to $5B. Source: S&P Global Market Intelligence/Velligan -Blaxall Consultants, LLC. Benchmark: Stock banks across the U.S.. Peer Group: Banks headquartered in PA . 0 0.5 1 1.5 2 2020 2021 2022 2023 2024 1Q2025 Embassy PA Pee
Slide 28: Net Interest Margin Asset Quality Liquidity
Net Interest Margin Asset Quality Liquidity - Judy Hunsicker 28
Slide 29: Loan Yield Trends
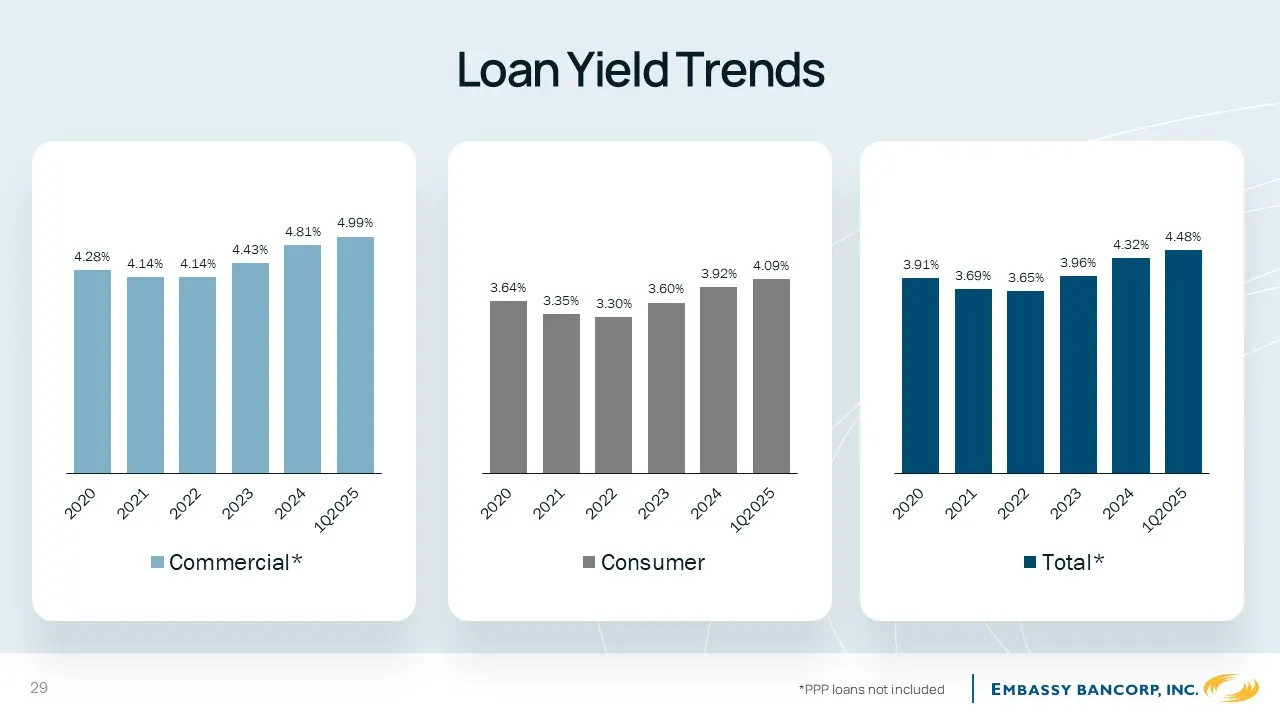
Loan Yield Trends 4.28% 4.14% 4.14% 4.43% 4.81% 4.99% Commercial* 3.64% 3.35% 3.30% 3.60% 3.92% 4.09% Consumer 3.91% 3.69% 3.65% 3.96% 4.32% 4.48% Total* 2020 2021 2022 2023 2024 2020 2021 2022 2023 2024 2020 2021 2022 2023 2024 29
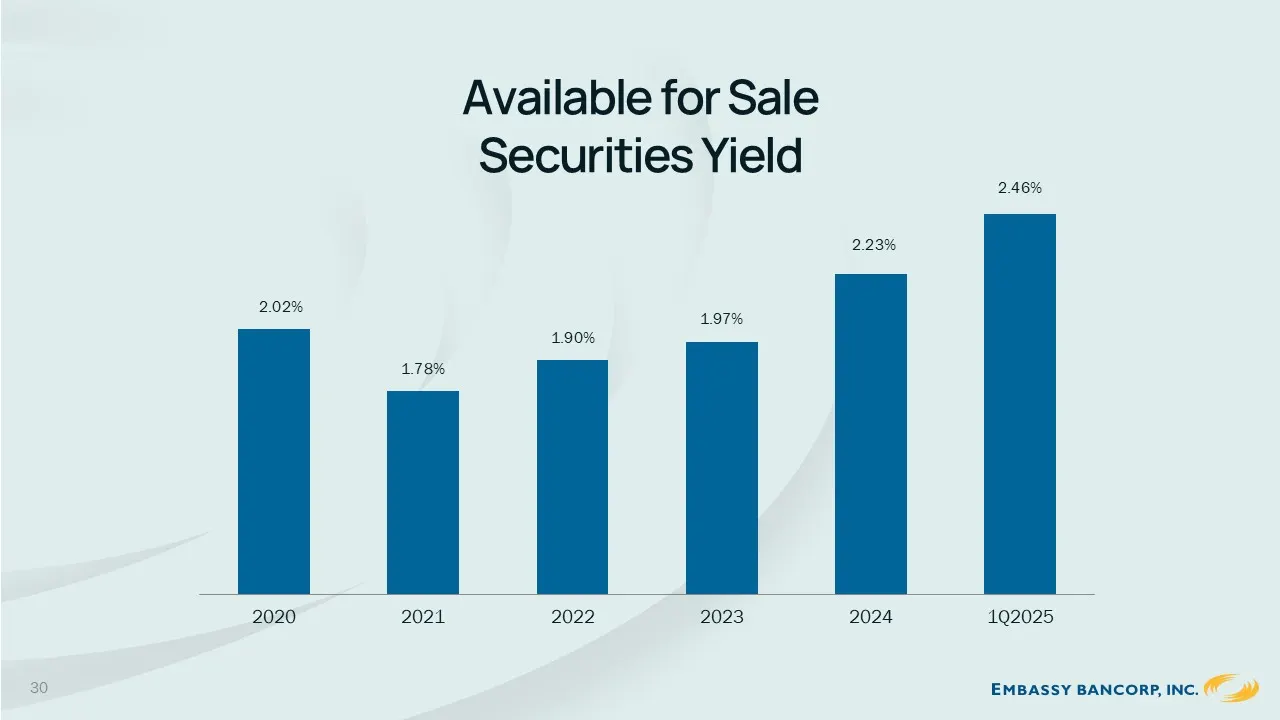
Slide 30: Available for Sale Securities Yield
Available for Sale Securities Yield 2.02% 1.78% 1.90% 1.97% 2.23% 2.46% 2020 2021 2022 2023 2024 1Q2025 30
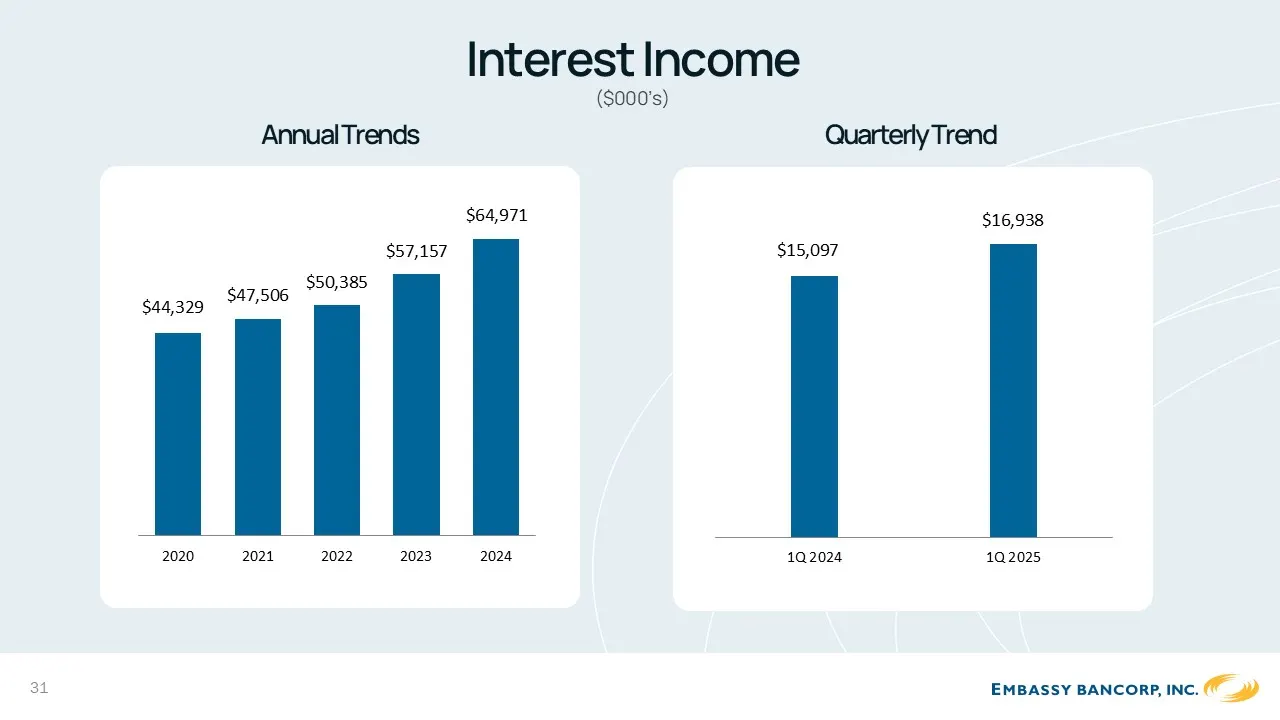
Slide 31: Interest Income
44,329 $47,506 $50,385 $57,157 $64,971 2020 2021 2022 2023 2024 ($000’s) $15,097 $16,938 1Q 2024Interest Income Annual Trends Quarterly Trend 31 1Q 2025
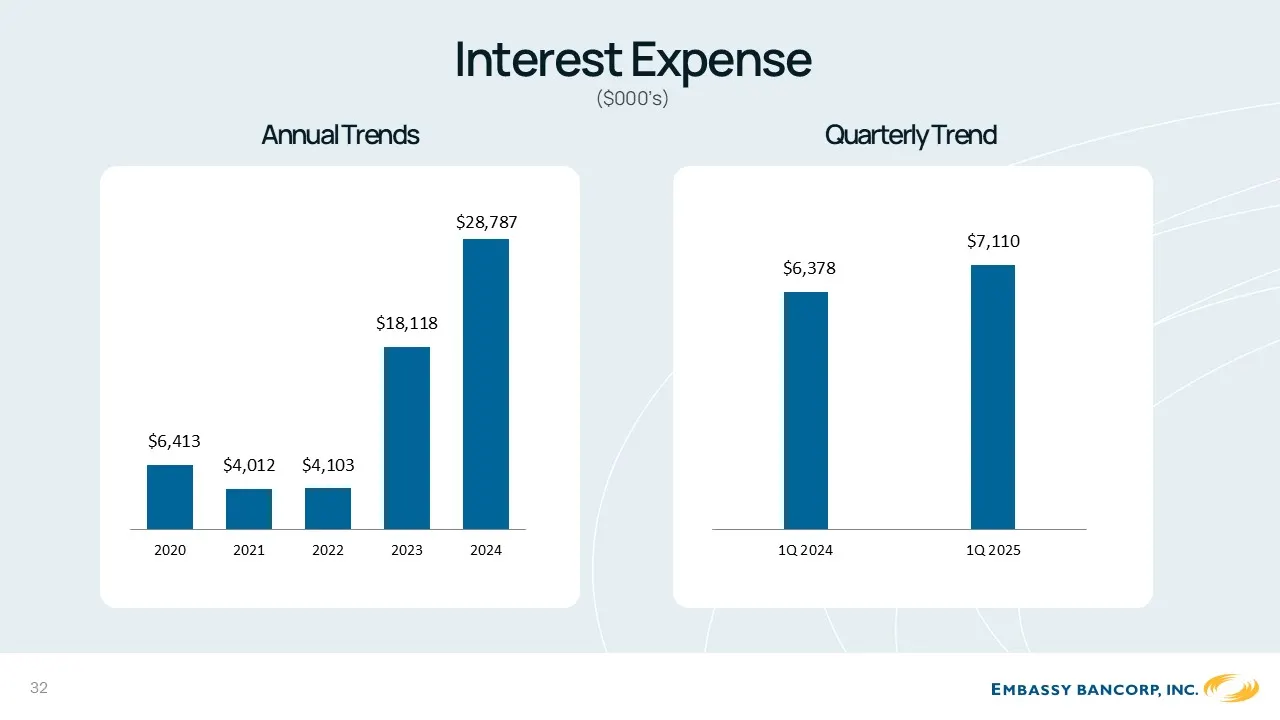
Slide 32: Interest Expense
Interest Expense $6,413 $4,012 $4,103 $18,118 $28,787 2020 2021 2022 2023 2024 $6,378 $7,110 1Q 2024 1Q 2025 Annual Trends Quarterly Trend 32
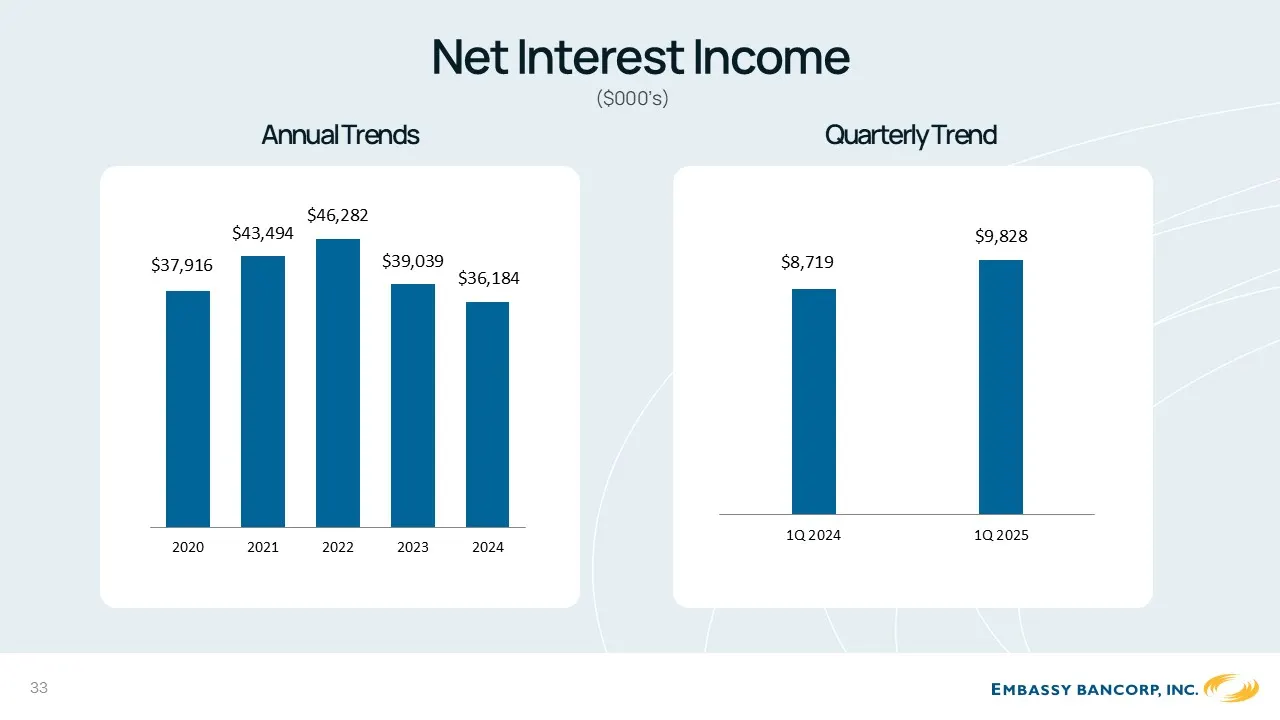
Slide 33: Net Interest Income
Net Interest Income $37,916 $43,494 $46,282 $39,039 $36,184 2020 2021 2022 2023 2024 $8,719 $9,828 1Q 2024 1Q 2025 Annual Trends Quarterly Trend 33
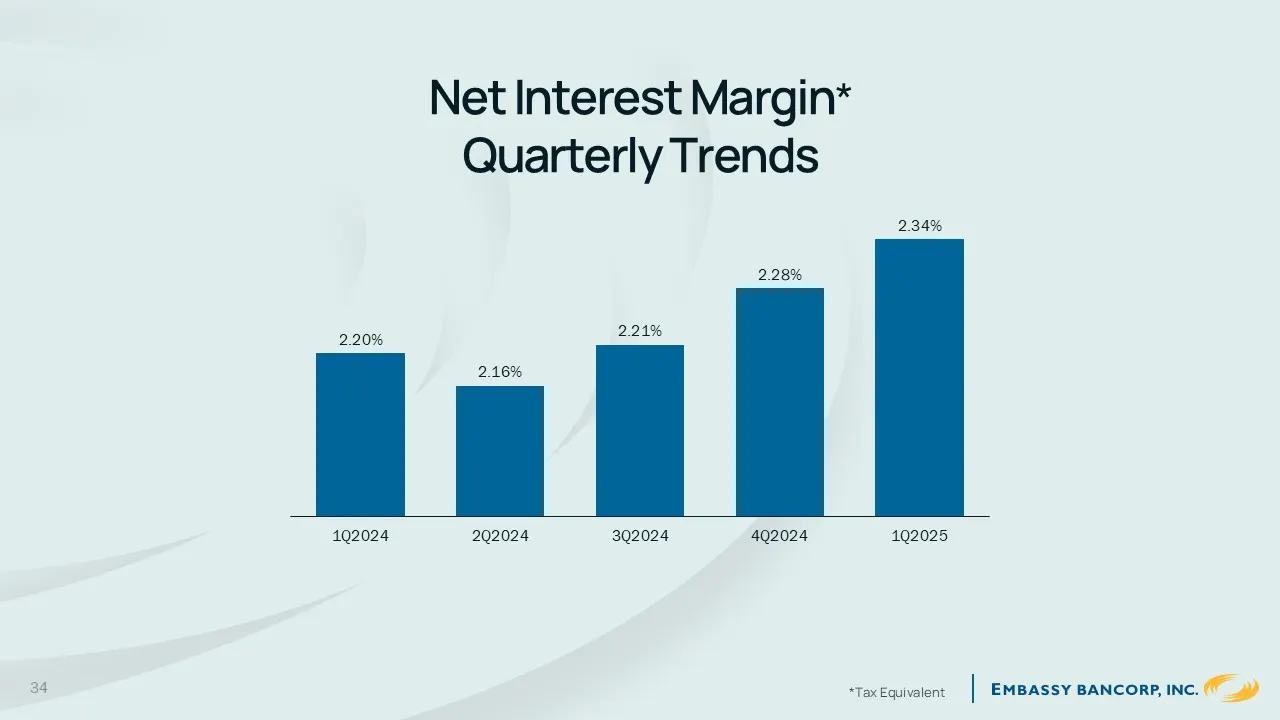
Slide 34: Net Interest Margin Quarterly Trends
Net Interest Margin* Quarterly Trends *Tax Equivalent 2.20% 2.16% 2.21% 2.28% 2.34% 1Q2024 2Q2024 3Q2024 4Q2024 1Q2025 34
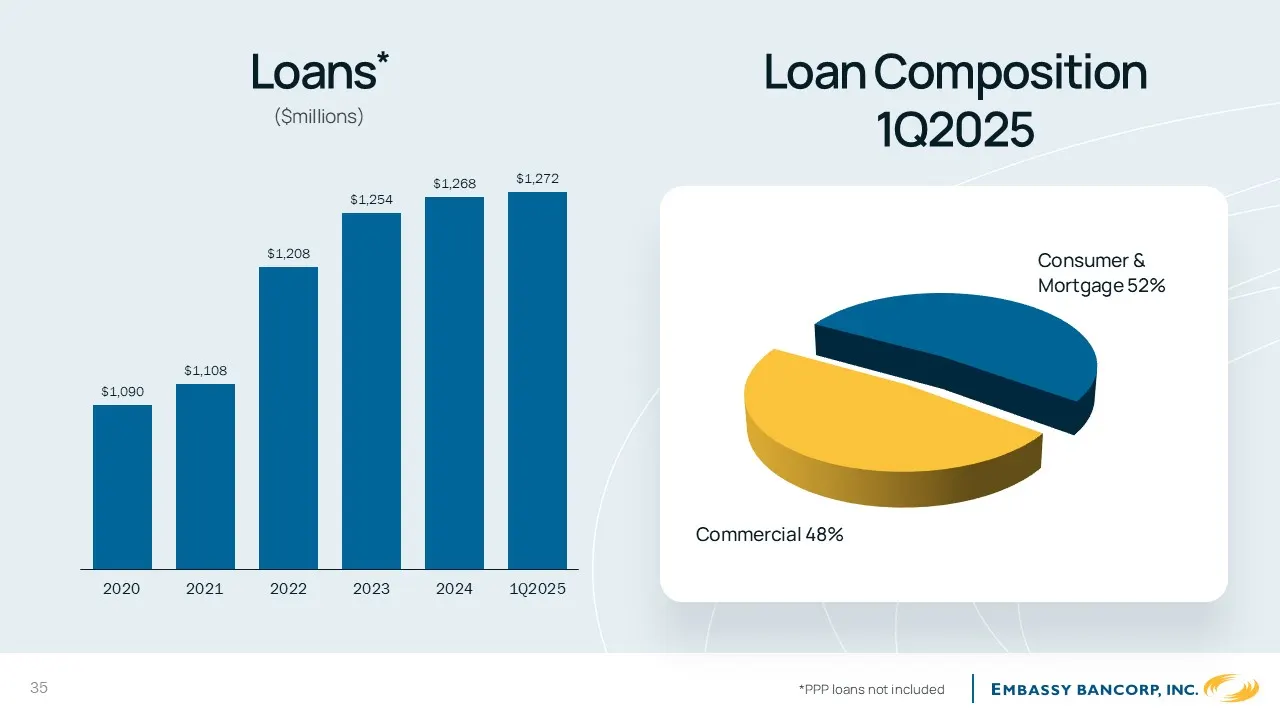
Slide 35: Loans
Loans* $1,090 $1,108 $1,208 $1,254 $1,268 $1,272 2020 2021 2022 2023 2024 1Q2025 35 *PPP loans not included Loan Composition1Q2025 Commercial 48% Consumer & Mortgage 52%
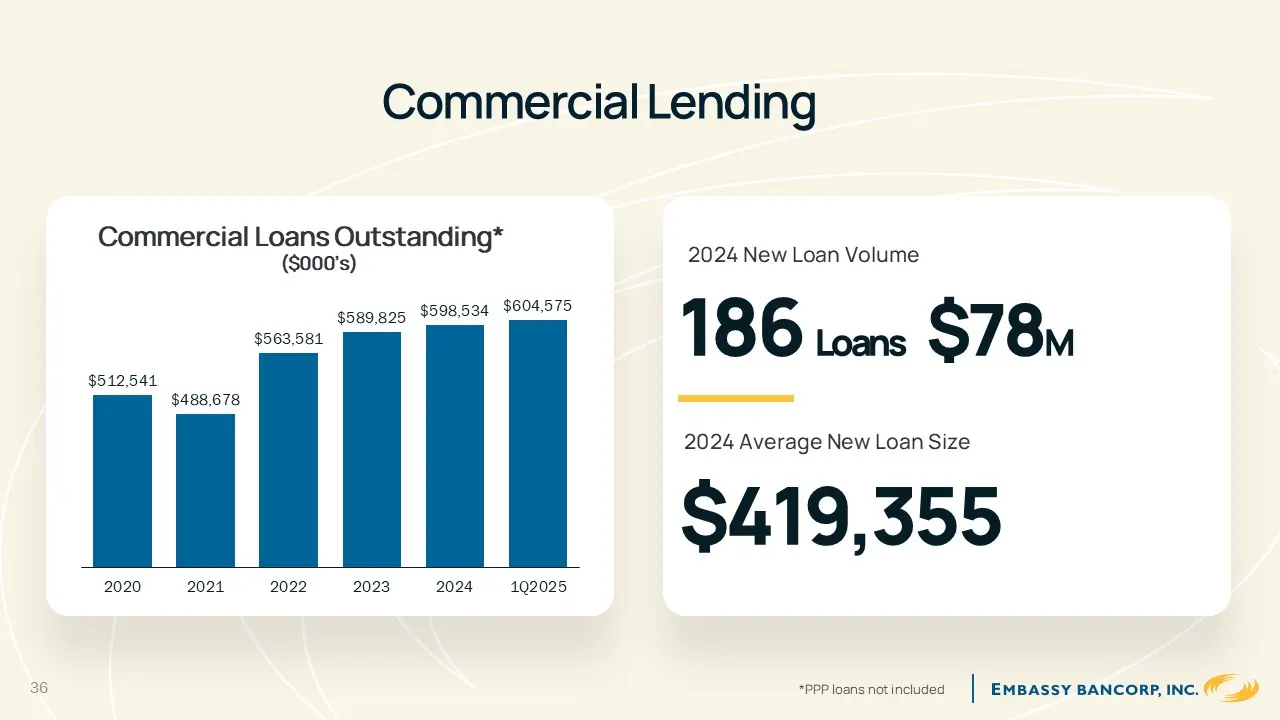
Slide 36: Commercial Lending
Commercial Lending 2024 New Loan Volume 186 Loans $78M 2024 Average New Loan Size $419,355 $512,541 $488,678 $563,581 $589,825 $598,534 $604,575 2020 2021 2022 2023 2024 1Q2025 Commercial Loans Outstanding* ($000’s) 36 *PPP loans not included
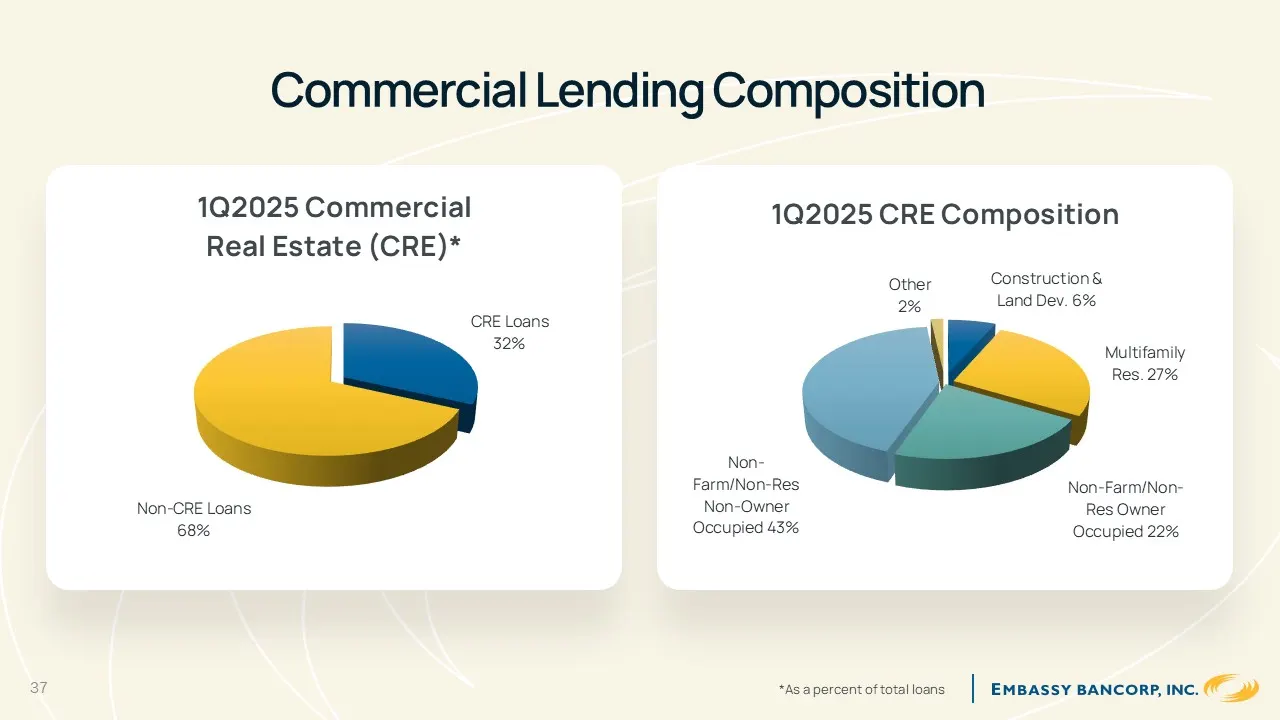
Slide 37: Commercial Lending Composition
Commercial Lending Composition CRE Loans32% Non-CRE Loans68% 1Q2025 Commercial Real Estate (CRE)* Construction & Land Dev. 6% Multifamily Res. 27% Non-Farm/Non-Res Owner Occupied 22% Non-Farm/Non-Res Non-Owner Occupied 43% 37 *As a percent of total loans
Slide 38: Consumer & Mortgage Lending
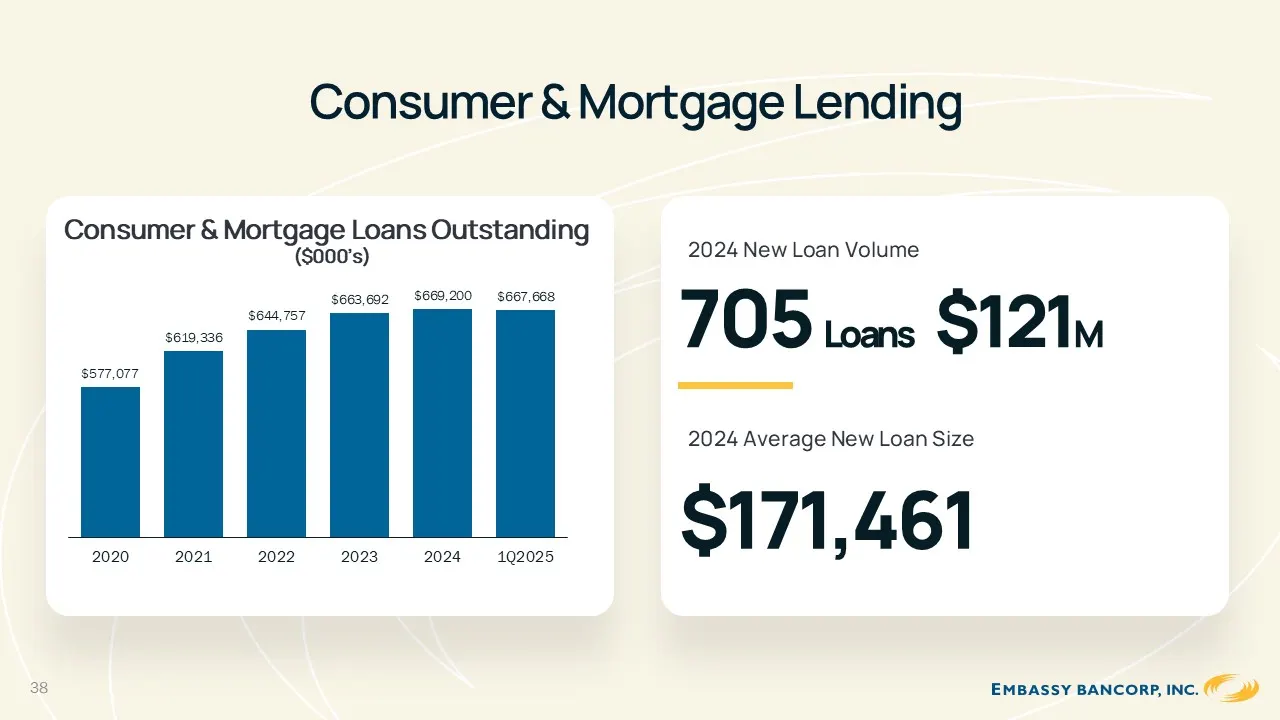
Consumer & Mortgage Lending 2024 New Loan Volume 705 Loans $121M 2024 Average New Loan Size $171,461 $577,077 $619,336 $644,757 $663,692 $669,200 $667,668 2020 2021 2022 2023 2024 1Q2025 Consumer & Mortgage Loans Outstanding ($000’s) 38
Slide 39: 2024 Residential Mortgage Loans Originated
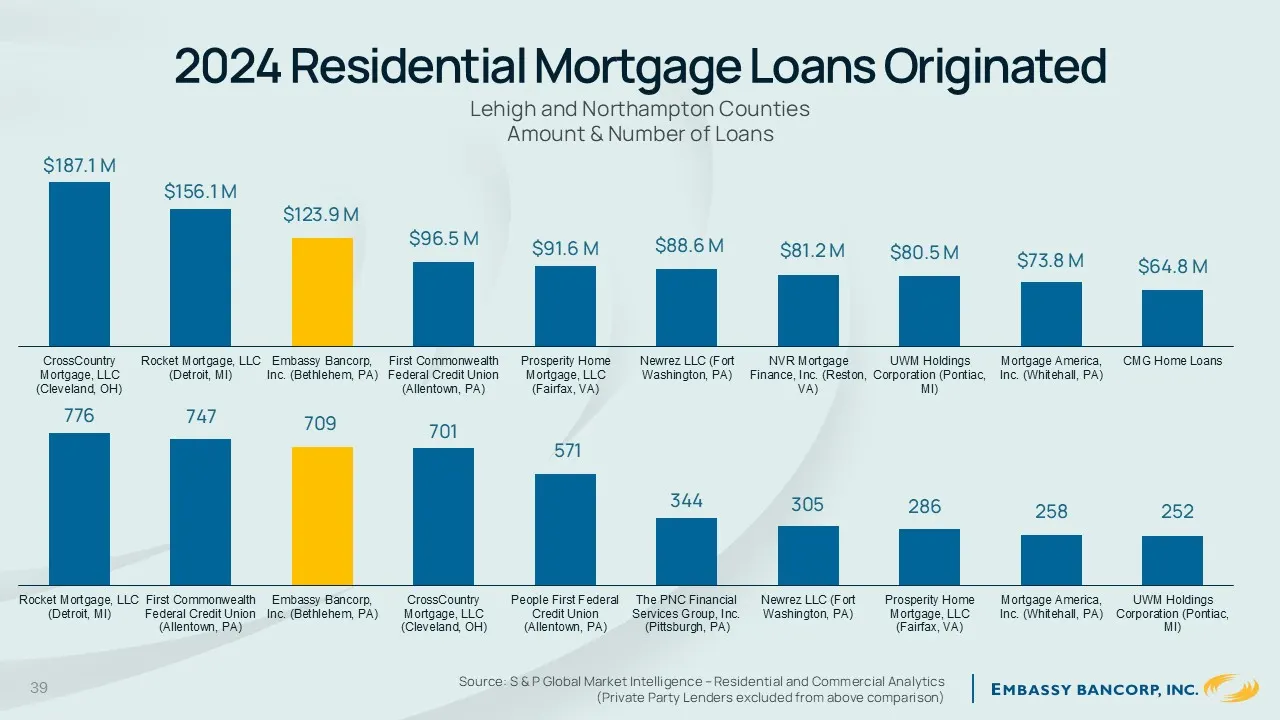
2024 Residential Mortgage Loans Originated Lehigh and Northampton Counties Amount & Number of Loans 39 Source: S & P Global Market Intelligence – Res idential and Commercial Analytic s (Private Party Lenders excluded from above comparison) $187.1 M $156.1 M $123.9 M $96.5 M $91.6 M $88.6 M $81.2 M $
Slide 40: Non-Current Loans to Total Loans Peer Comparison
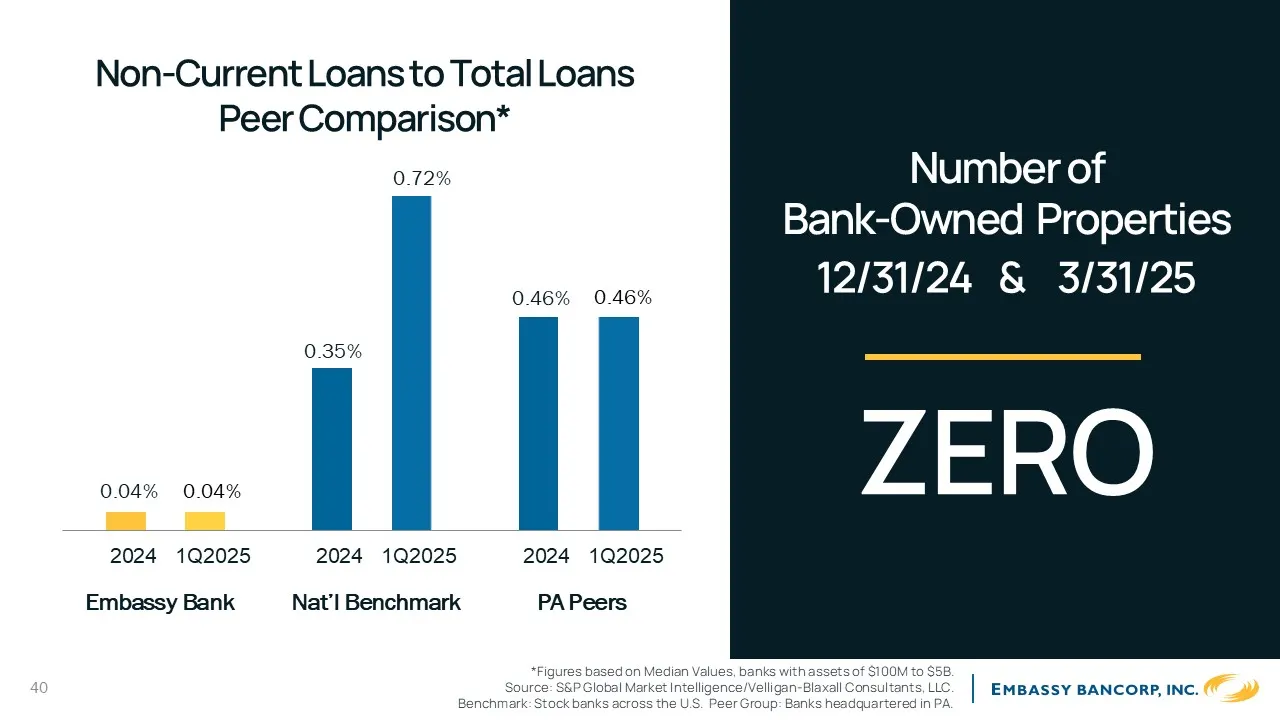
Non-Current Loans to Total Loans Peer Comparison* Number of Bank-Owned Properties 0.04% 0.35% 0.46% 2024 1Q2025 2024 1Q2025 2024 1Q2025 0.72% 0.46% 0.04% Nat’l Benchmark PA Peers 12/31/24 & 3/31/25 ZERO *Figures based on Median Values, banks with assets of $100M to $5B. Source: S&P Global Market Int
Slide 41: Securities Available for Sale
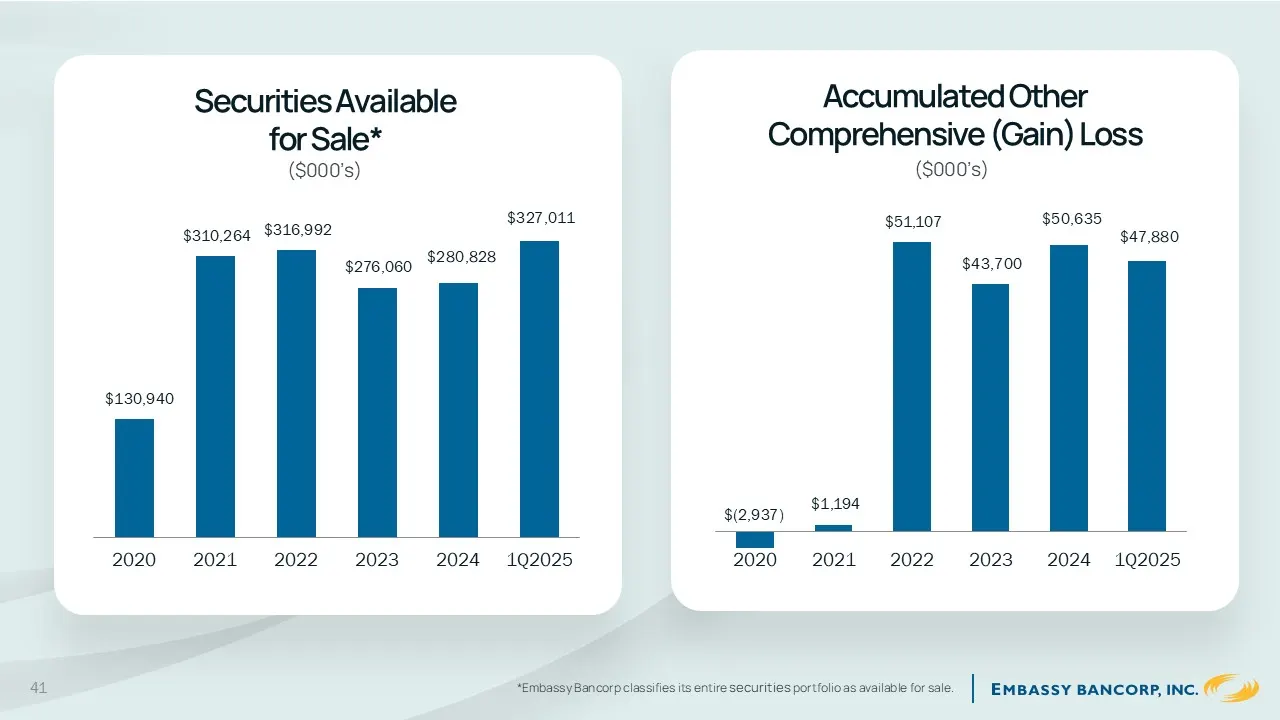
Securities Available for Sale* ($000’s) $130,940 $310,264 $316,992 $276,060 $280,828 $327,011 2020 2021 2022 2023 2024 1Q2025 *Embassy Bancorp classifies its entire securities portfolio as available for sale. $(2,937) $1,194 $51,107 $43,700 $50,635 $47,880 2020 2021 2022 2023 2024 1Q2025 Accumulated
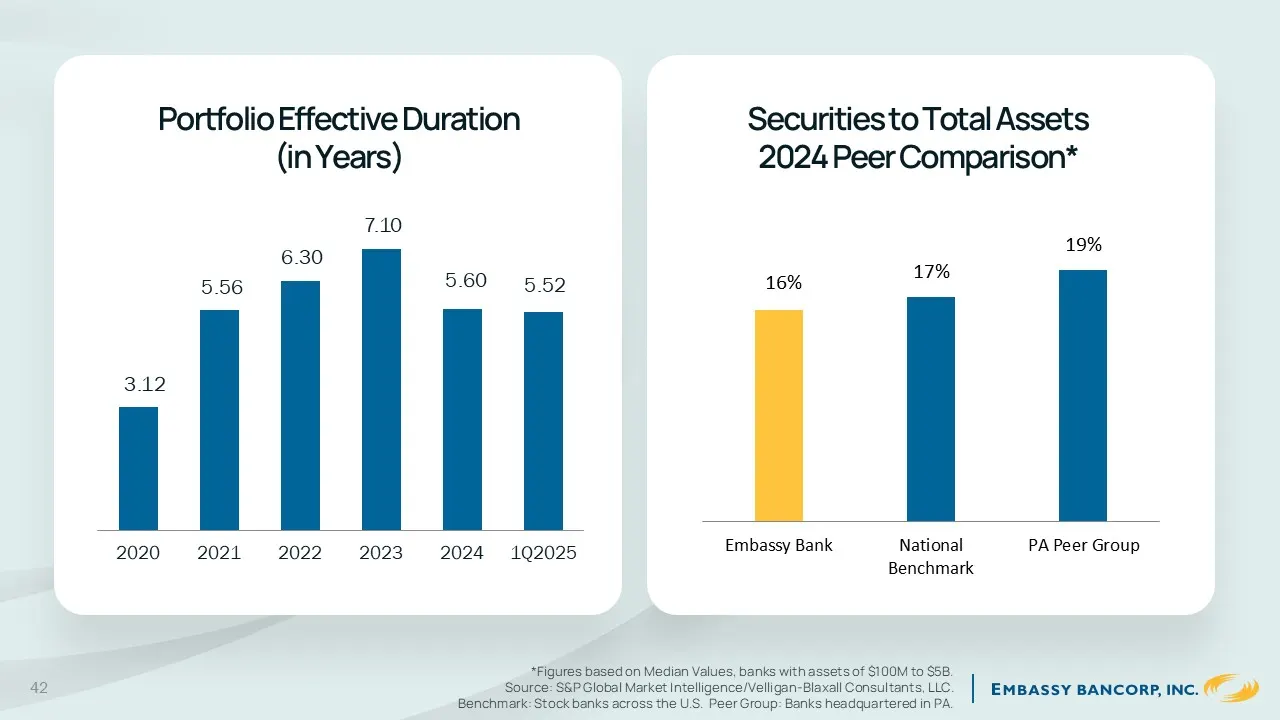
Slide 42: Portfolio Effective Duration
Portfolio Effective Duration (in Years) *Figures based on Median Values, banks with assets of $100M to $5B. Source: S&P Global Market Intelligence/Velligan-Blaxall Consultants, LLC. Benchmark: Stock banks across the U.S. Peer Group: Banks headquartered in PA. 3.12 5.56 6.30 7.10 5.60 5.52 2020 2021
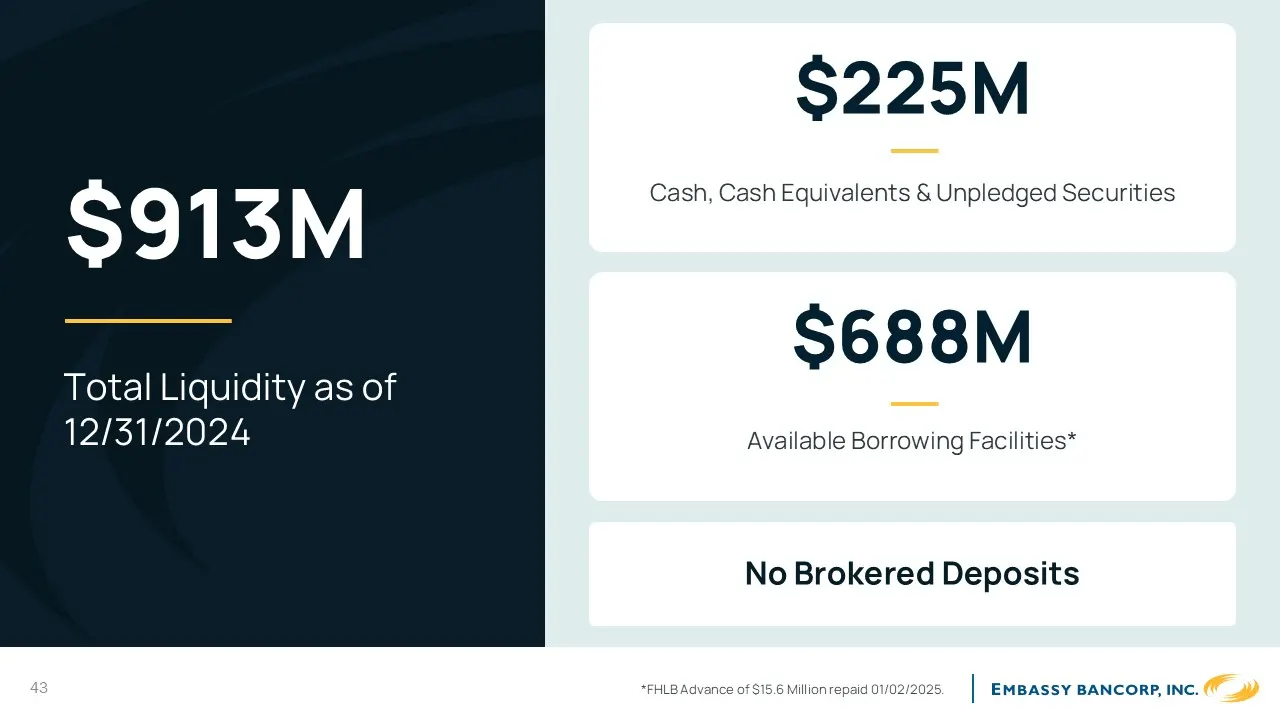
Slide 43: Liquidity
$225M Cash, Cash Equivalents & Unpledged Securities 43 *FHLB Advance of $15.6 Million repaid 01/02/2025. $913M Total Liquidity as of 12/31/2024 $688M Available Borrowing Facilities* No Brokered Deposits 43
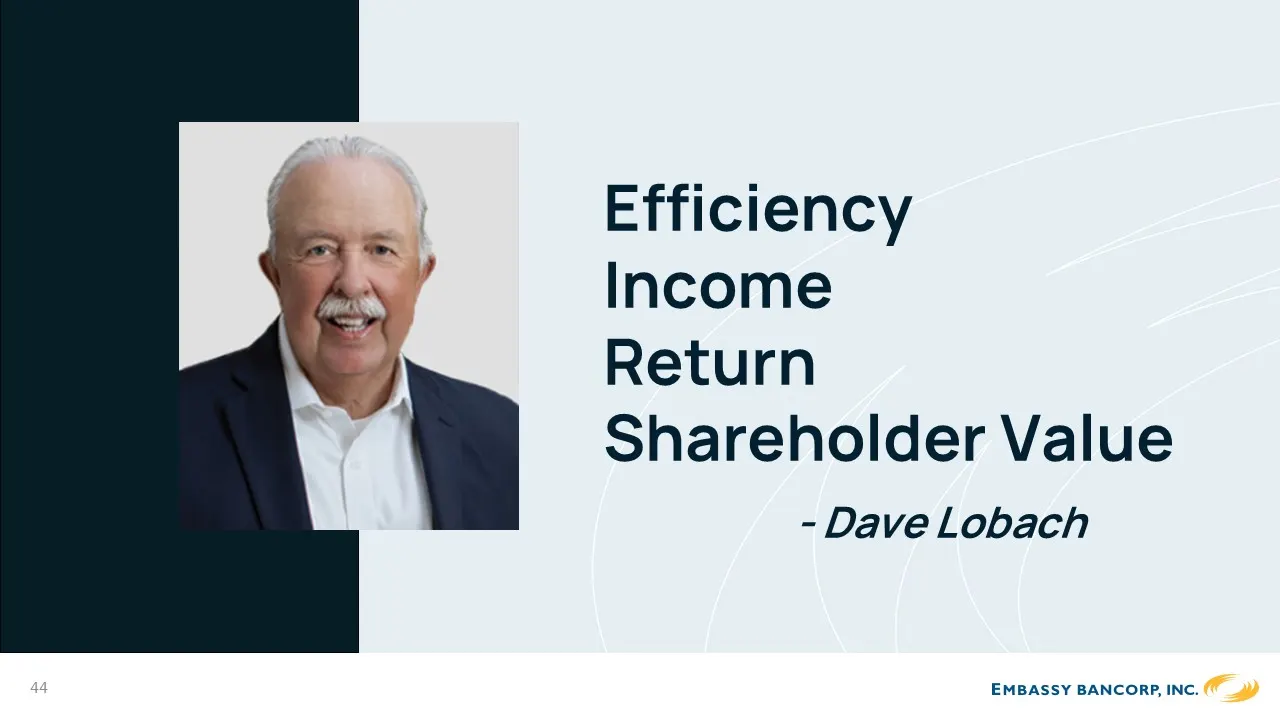
Slide 44: Efficiency Income Return Shareholder Value
Efficiency Income Return Shareholder Value - Dave Lobach 44
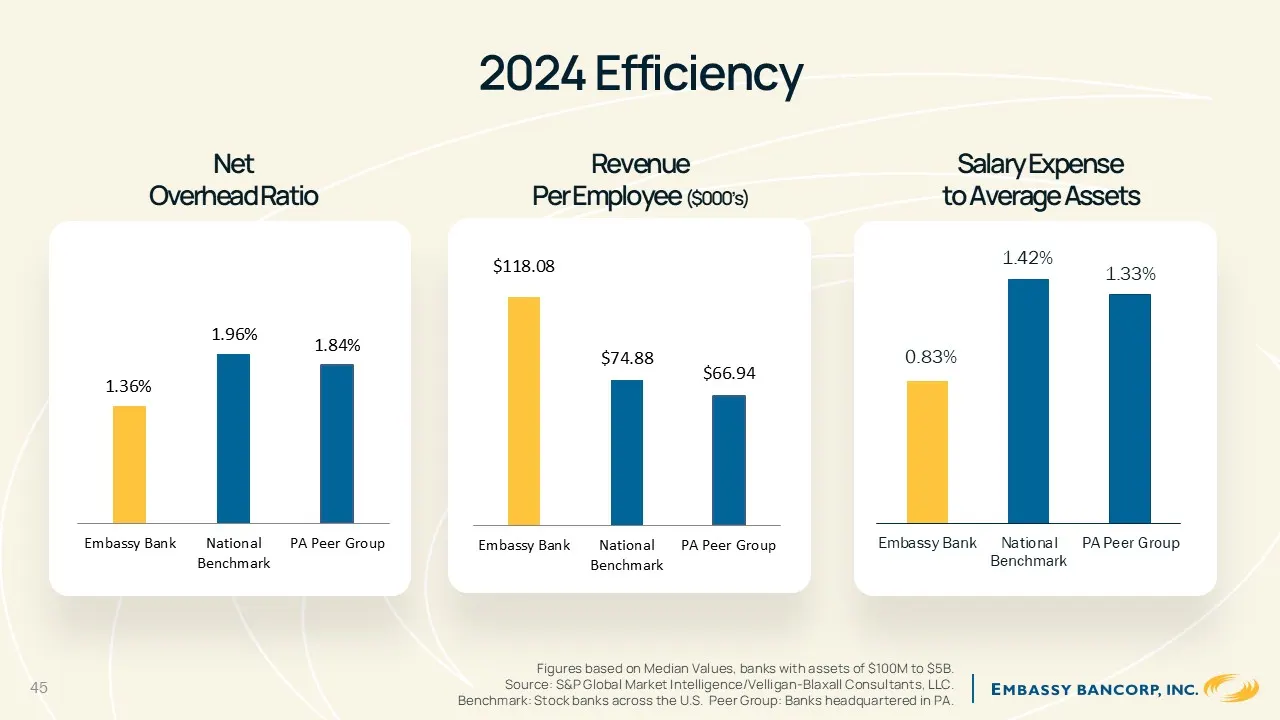
Slide 45: 2024 Efficiency
2024 Efficiency 1.36% 1.96% 1.84% Embassy Bank NationalBenchmark PA Peer Group Net Overhead Ratio Figures based on Median Values, banks with assets of $100M to $5B. Source: S&P Global Market Intelligence/Velligan -Blaxall Consultants, LLC. Benchmark: Stock banks across the U.S. Peer Group: Banks hea
Slide 46: 2024 Efficiency per Employee
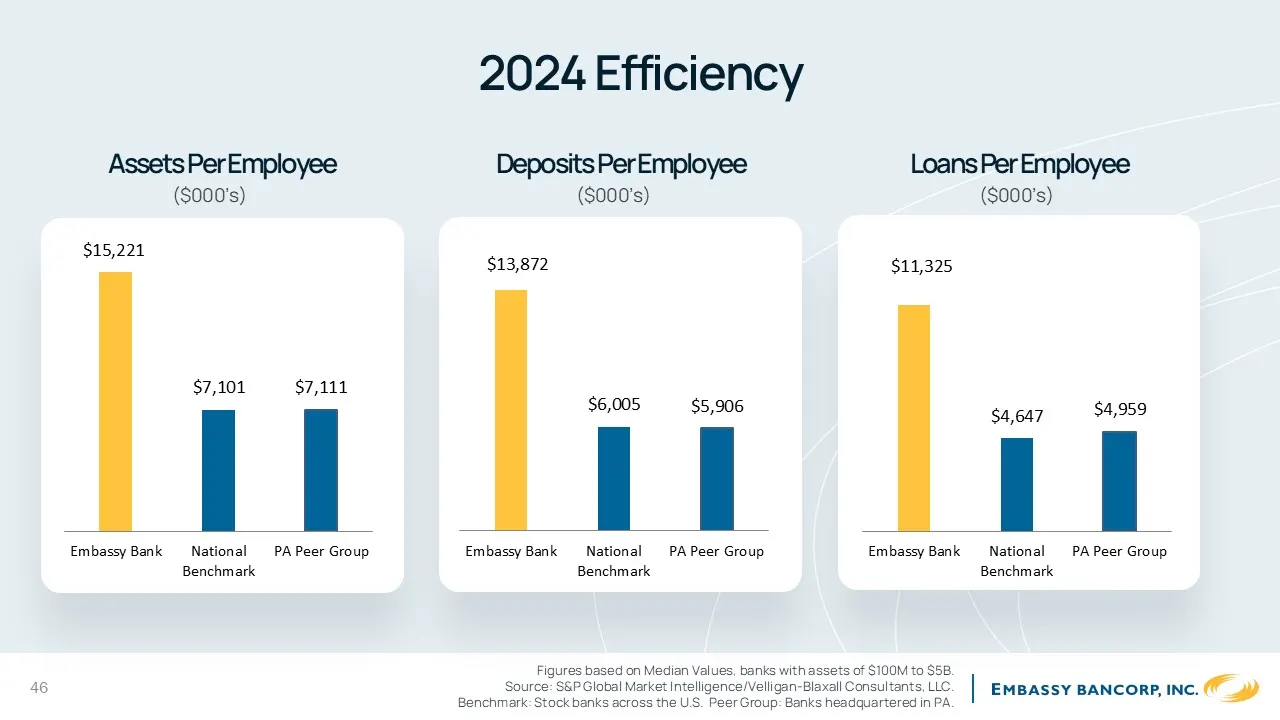
2024 Efficiency Figures based on Median Values, banks with assets of $100M to $5B. Source: S&P Global Market Intelligence/Velligan -Blaxall Consultants, LLC. Benchmark: Stock banks across the U.S. Peer Group: Banks headquartered in PA . $15,221 $7,101 $7,111 Embassy Bank NationalBenchmark PA Peer Gr
Slide 47: 2024 Performance Benchmark Data
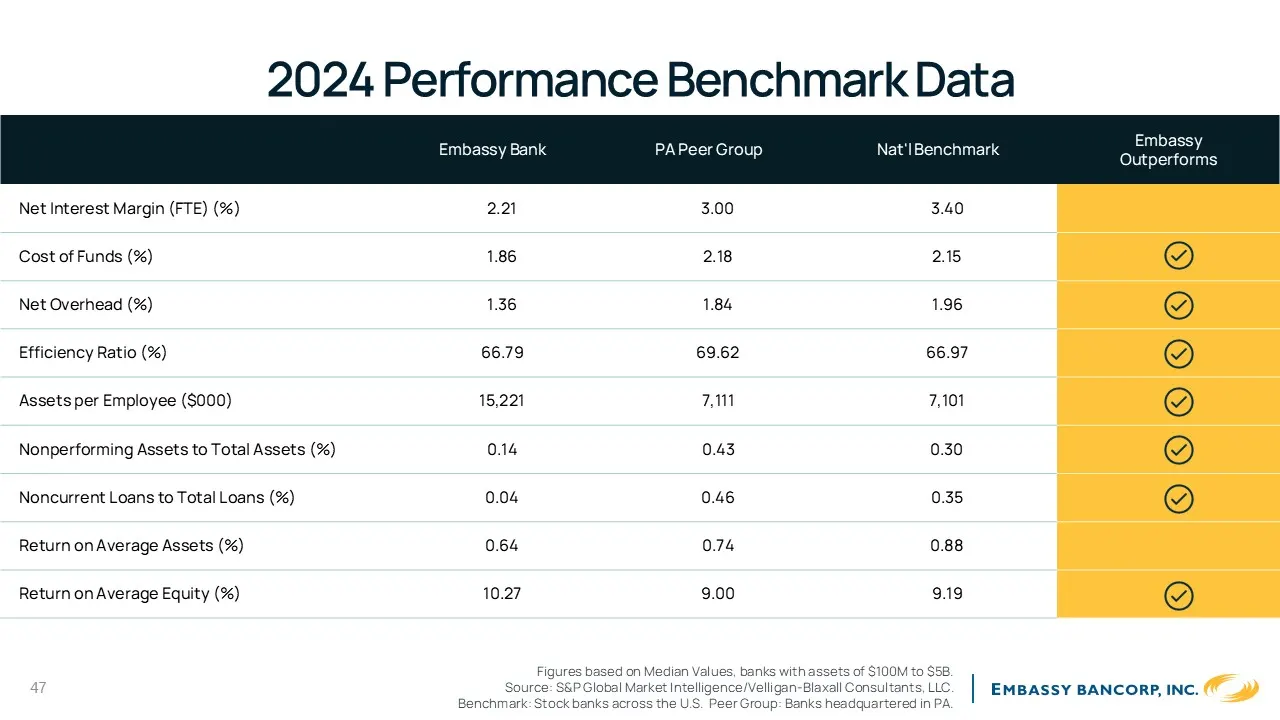
2024 Performance Benchmark Data 47 Figures based on Median Values, banks with assets of $100M to $5B. Source: S&P Global Market Intelligence/Velligan -Blaxall Consultants, LLC. Benchmark: Stock banks across the U.S. Peer Group: Banks headquartered in PA. Embassy Bank PA Peer Group Nat'l Benchmark Em
Slide 48: Non-Interest Income and Expense
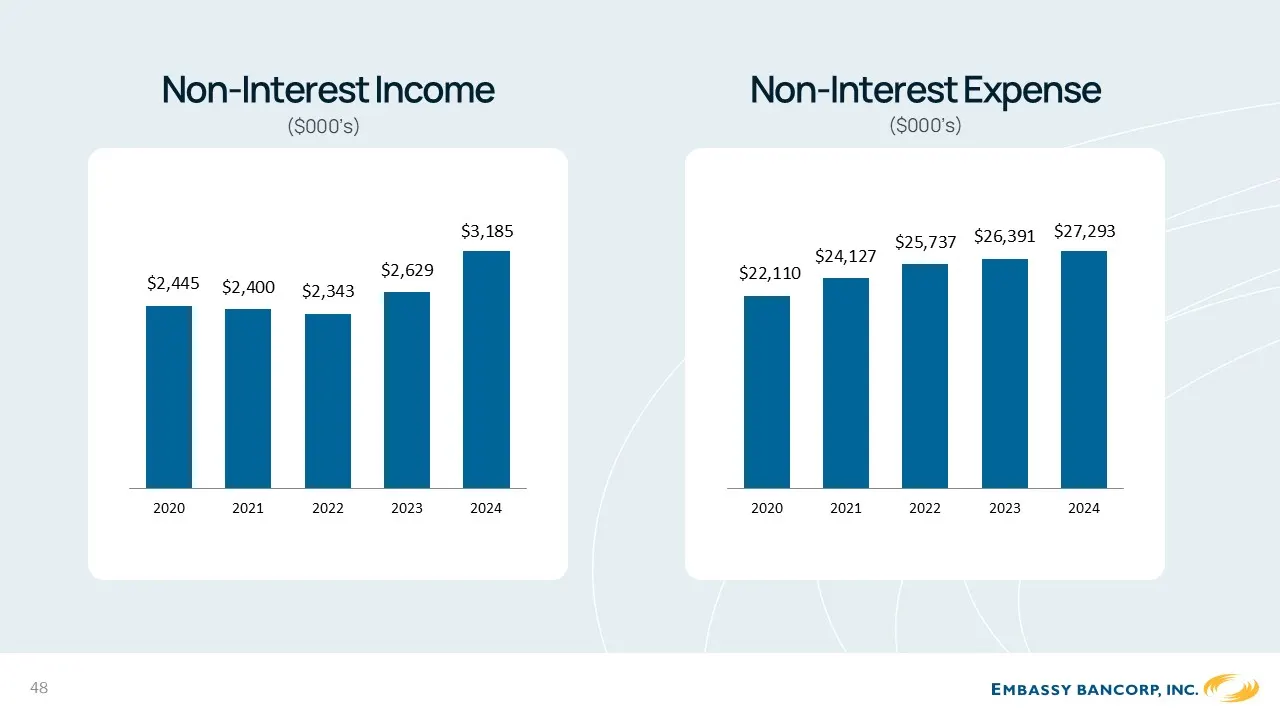
Non-Interest Income ($000’s) Non-Interest Expense $2,445 $2,400 $2,343 $2,629 $3,185 2020 2021 2022 2023 2024 $22,110 $24,127 $25,737 $26,391 $27,293 2020 2021 2022 2023 2024 48
Slide 49: Net Income Annual Trends
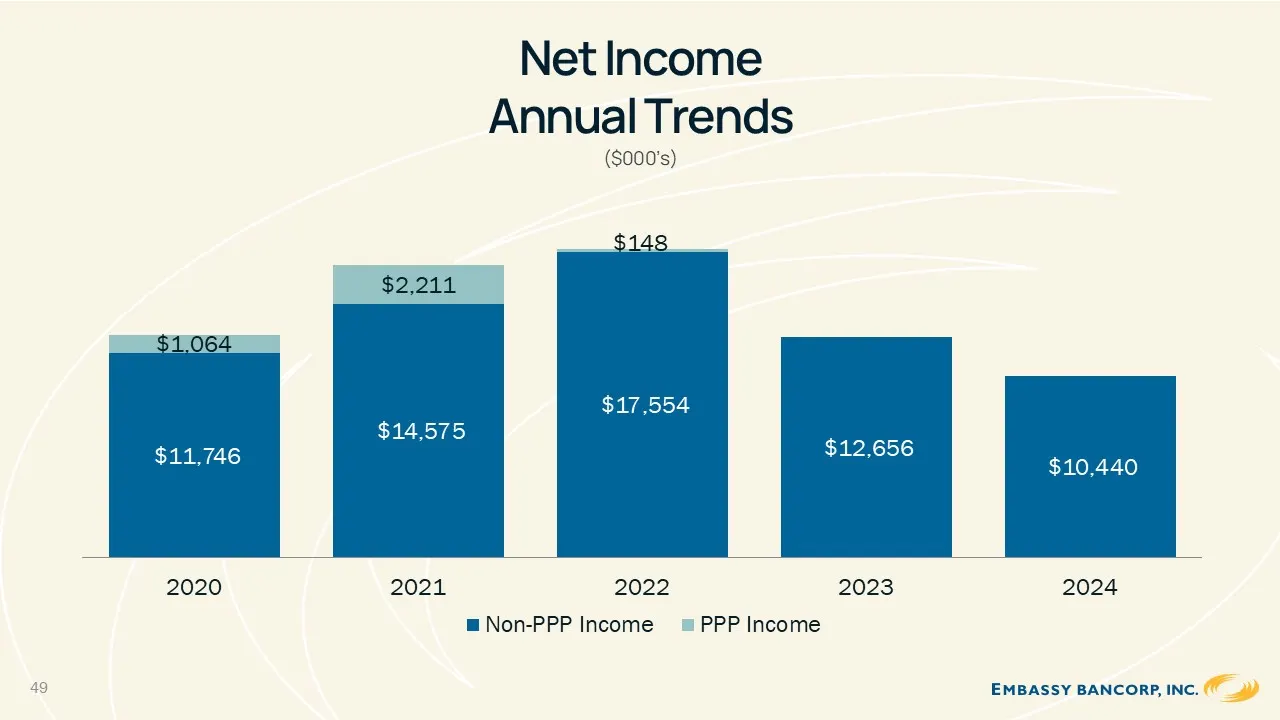
17,554 $12,656 $10,440 $1,064 $2,211 $148 2020 2021 2022 2023 2024 Non-PPP Income PPP Income 17,554 $12,656 $10,440 $1,064 $2,211 $148 2020 2021 2022 2023 2024 Non-PPP Income PPP Income Net Income Annual Trends ($000’s) 49
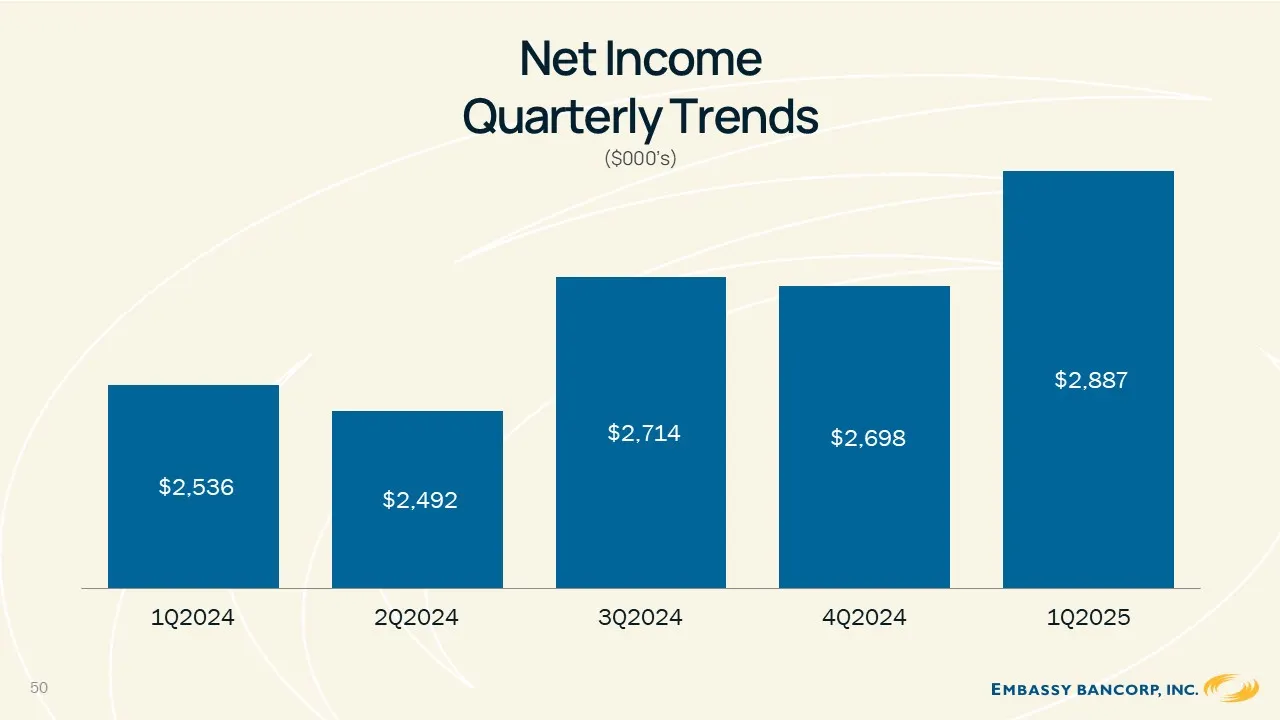
Slide 50: Net Income Quarterly Trends
Net Income Quarterly Trends ($000’s) $2,536 $2,492 $2,714 $2,698 $2,887 1Q2024 2Q2024 3Q2024 4Q2024 1Q2025 50
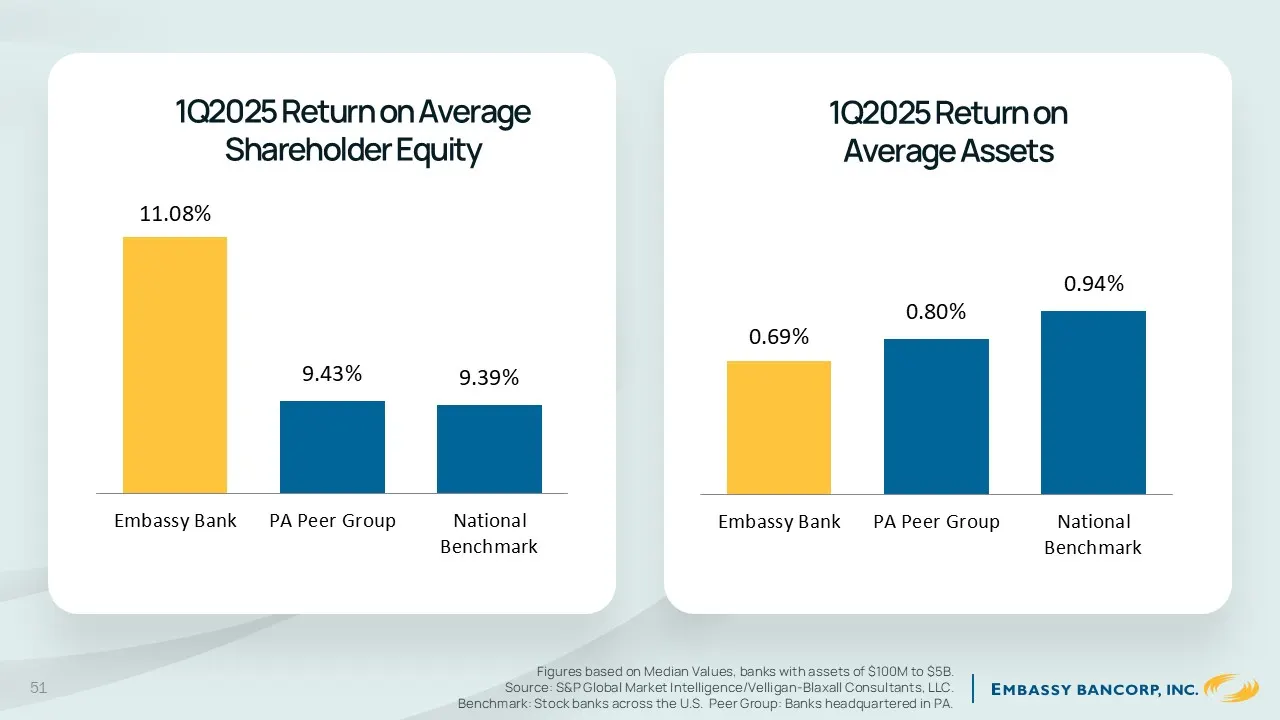
Slide 51: 1Q2025 Return on Equity and Assets
1Q2025 Return on Average Shareholder Equity 1Q2025 Return on Average Assets 0.69% 0.80% 0.94% Embassy Bank PA Peer Group NationalBenchmark 11.08% 9.43% 9.39% Embassy Bank PA Peer Group NationalBenchmark 51 Figures based on Median Values, banks with assets of $100M to $5B. Source: S&P Global Market I
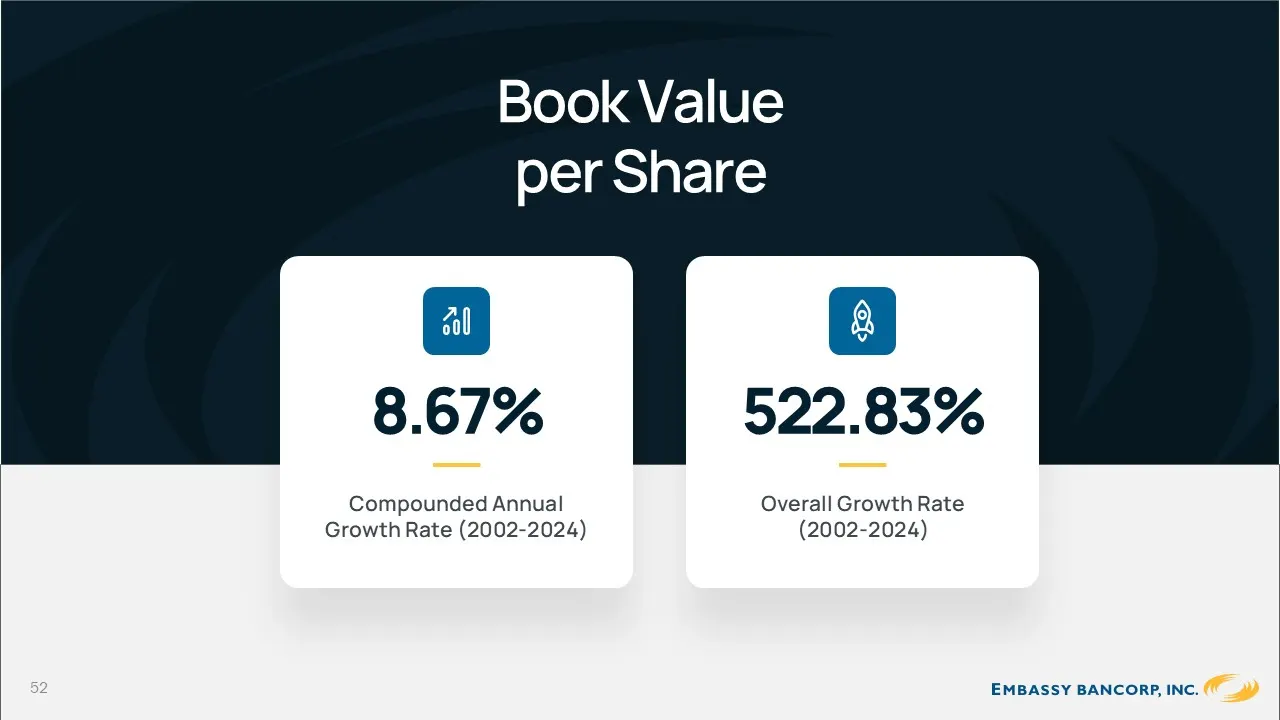
Slide 52: Book Value per Share
Book Value per Share 52 8.67% Compounded Annual Growth Rate (2002-2024) 522.83% Overall Growth Rate (2002-2024)
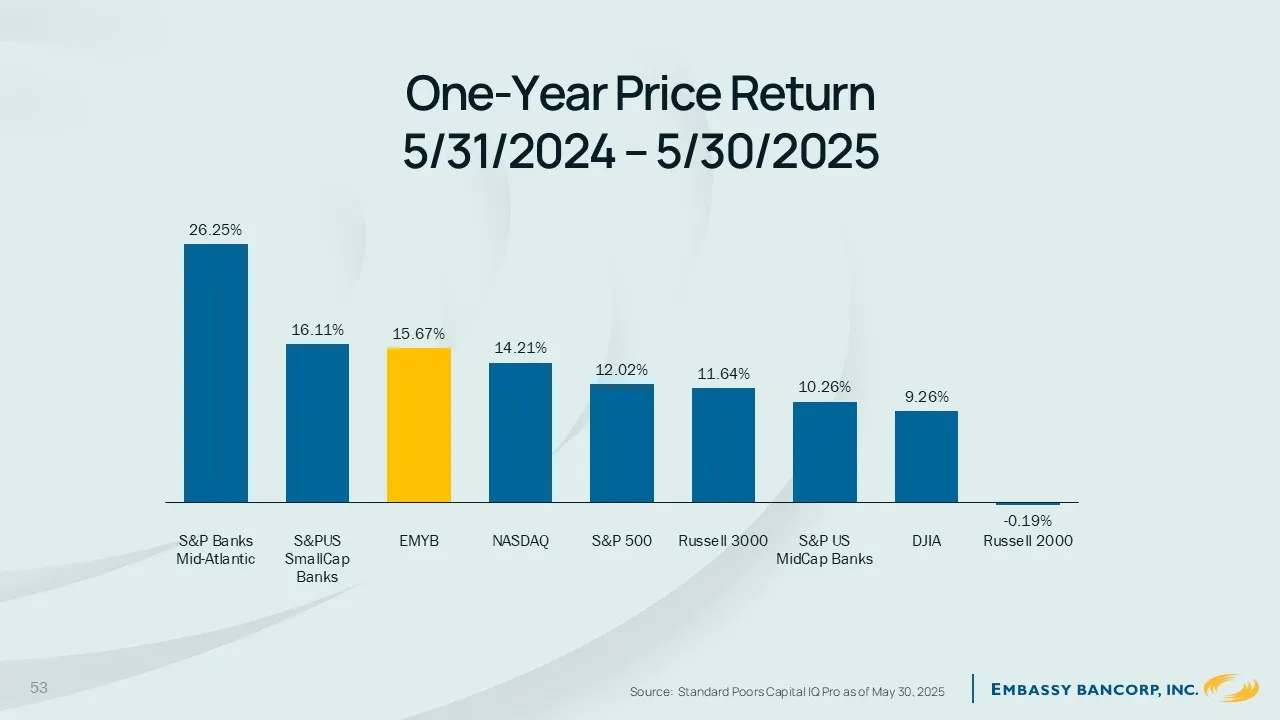
Slide 53: One-Year Price Return
One-Year Price Return 5/31/2024 – 5/30/2025 Source: Standard Poors Capital IQ Pro as of May 30, 2025 26.25% 16.11% 15.67% 14.21% 12.02% 11.64% 10.26% 9.26% -0.19% S&P BanksMid-Atlantic S&PUSSmallCapBanks EMYB NASDAQ S&P 500 Russell 3000 S&P USMidCap Banks DJIA Russell 2000 53
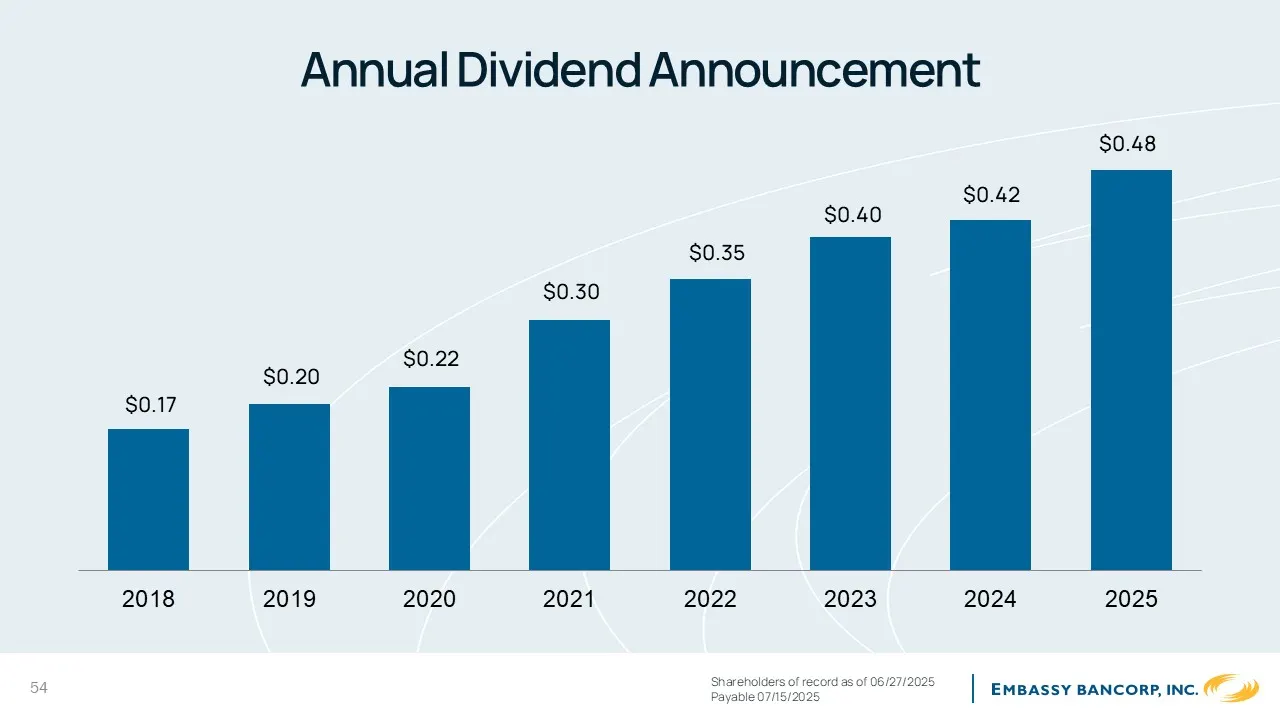
Slide 54: Annual Dividend Announcement
Annual Dividend Announcement 54 Shareholders of record as of 06/27/2025 Payable 07/15/2025 $0.17 $0.20 $0.22 $0.30 $0.35 $0.40 $0.42 $0.48 2018 2019 2020 2021 2022 2023 2024 2025
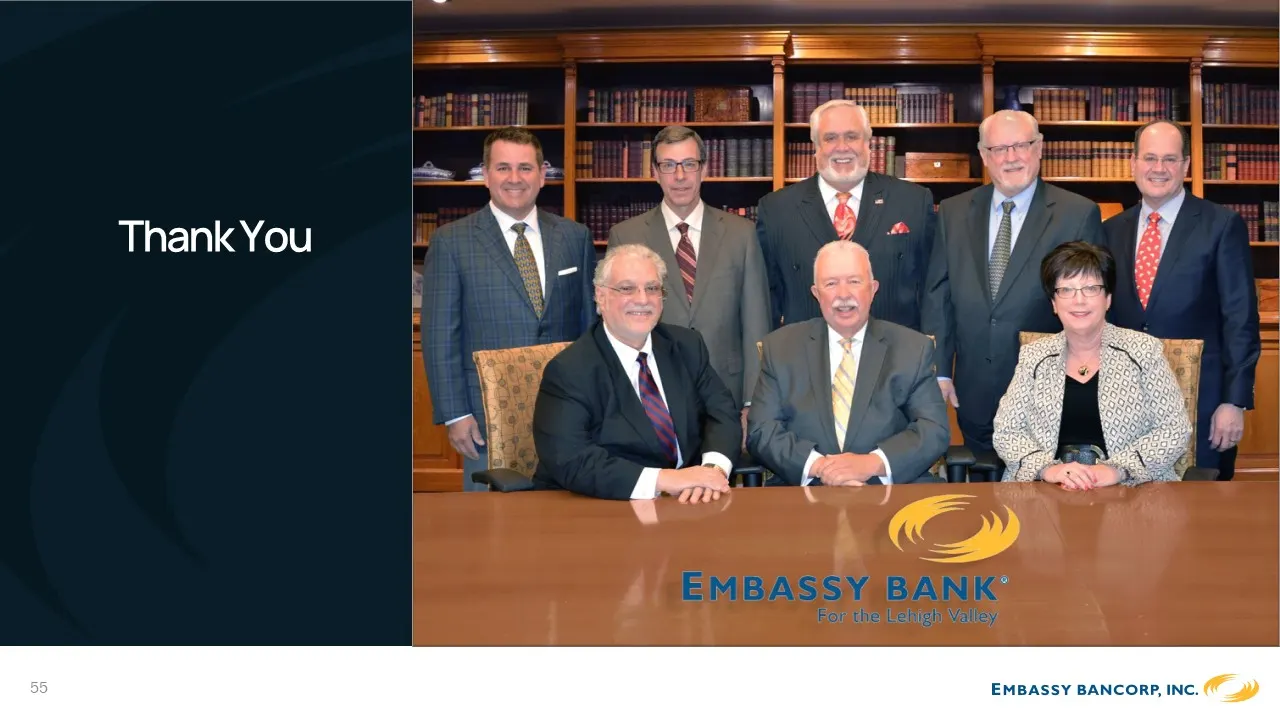
Slide 55: Thank You
Thank You EMBASSY BANCORP, INC.
Slide 56: Closing Items
Closing Items Questions & Answers Results of Voting Conclusion of Meeting 56
Source: SEC EDGAR · 8-K filed Jun 18, 2025
More decks from Embassy Bancorp, Inc.
 Shareholder Meeting (June 2026)45 slides · Jun 17, 2026
 Investor Presentation (November 2025)19 slides · Nov 6, 2025
 Shareholder Meeting (June 2024)47 slides · Jun 20, 2024
 Shareholder Meeting (June 2023)43 slides · Jun 15, 2023
 Shareholder Meeting (June 2022)77 slides · Jun 16, 2022
 Shareholder Meeting (June 2021)93 slides · Jun 17, 2021