Scatec ASA · OSL:SCATC
Scatec ASA — Scatec Solar — Q3 2019 Earnings Presentation
24 slides from Scatec ASA's earnings presentation, Oct 18, 2019
Slide 1: Third quarter 2019
Third quarter 2019 18 October 2019
Slide 2: Disclaimer
Disclaimer The following presentation is being made only to, and is only directed at, persons to whom such presentation may lawfully be communicated (’relevant persons’). Any person who is not a relevant person should not rely, act or make assessment on the basis of this presentation or anything inc
Slide 3: Agenda
Agenda • Highlights and project update Raymond Carlsen, CEO • Financial review Mikkel Tørud, CFO • Summary and outlook Raymond Carlsen, CEO 3
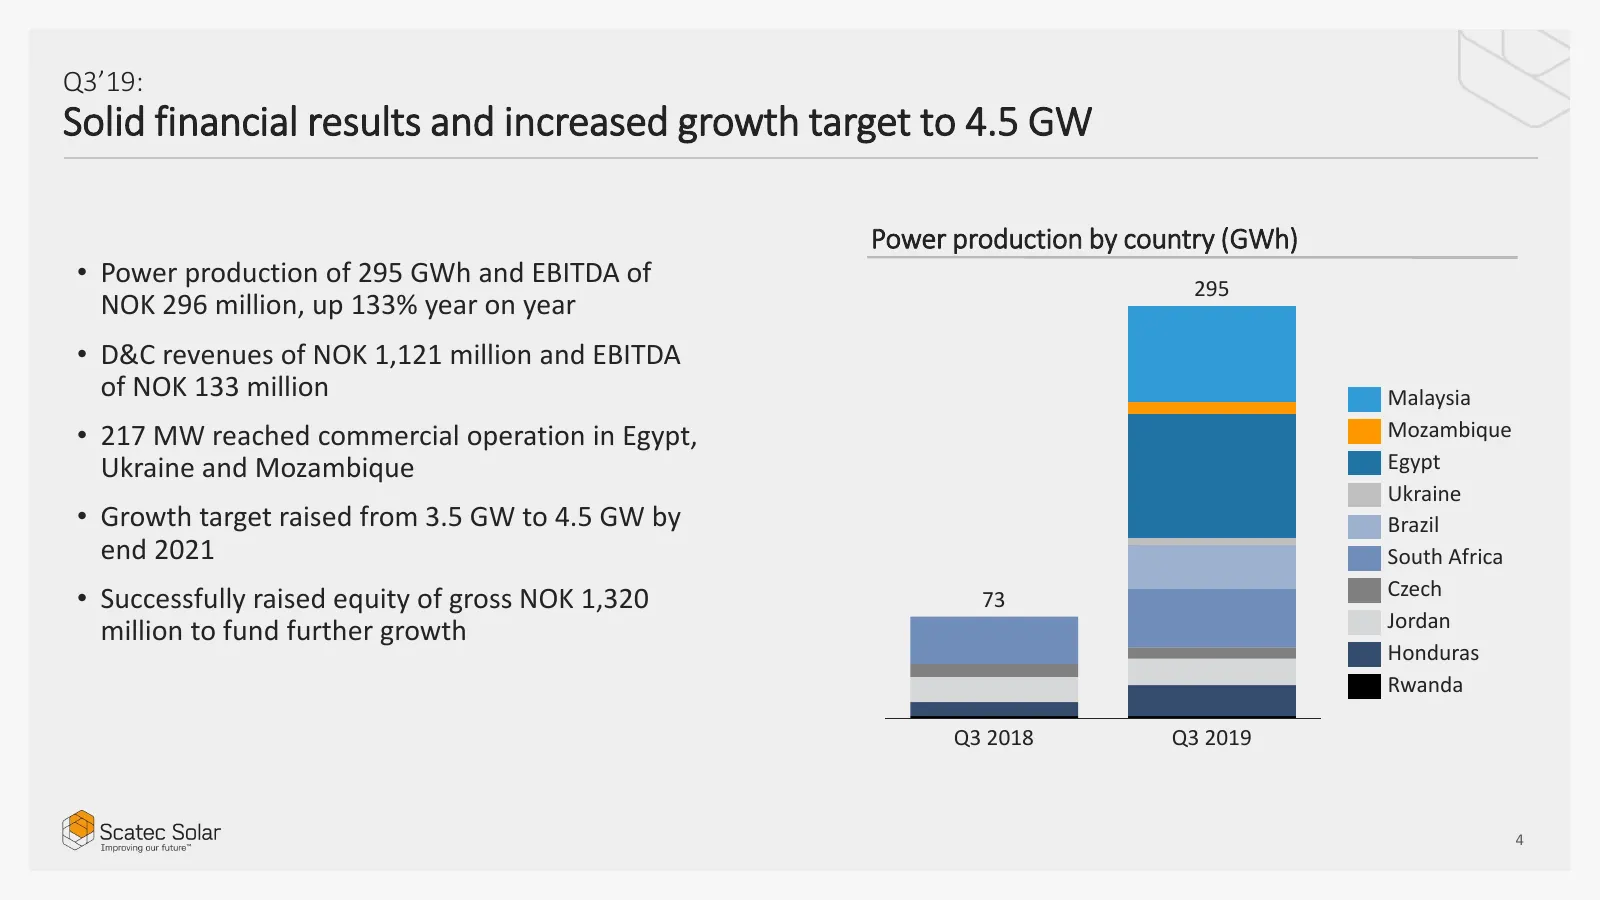
Slide 4: Solid financial results and increased growth target to 4.5 GW
Q3’19: Solid financial results and increased growth target to 4.5 GW Power production by country (GWh) • Power production of 295 GWh and EBITDA of 295 NOK 296 million, up 133% year on year • D&C revenues of NOK 1,121 million and EBITDA of NOK 133 million Malaysia • 217 MW reached commercial operatio
Slide 5: Scatec Solar's largest project completed in 16 months
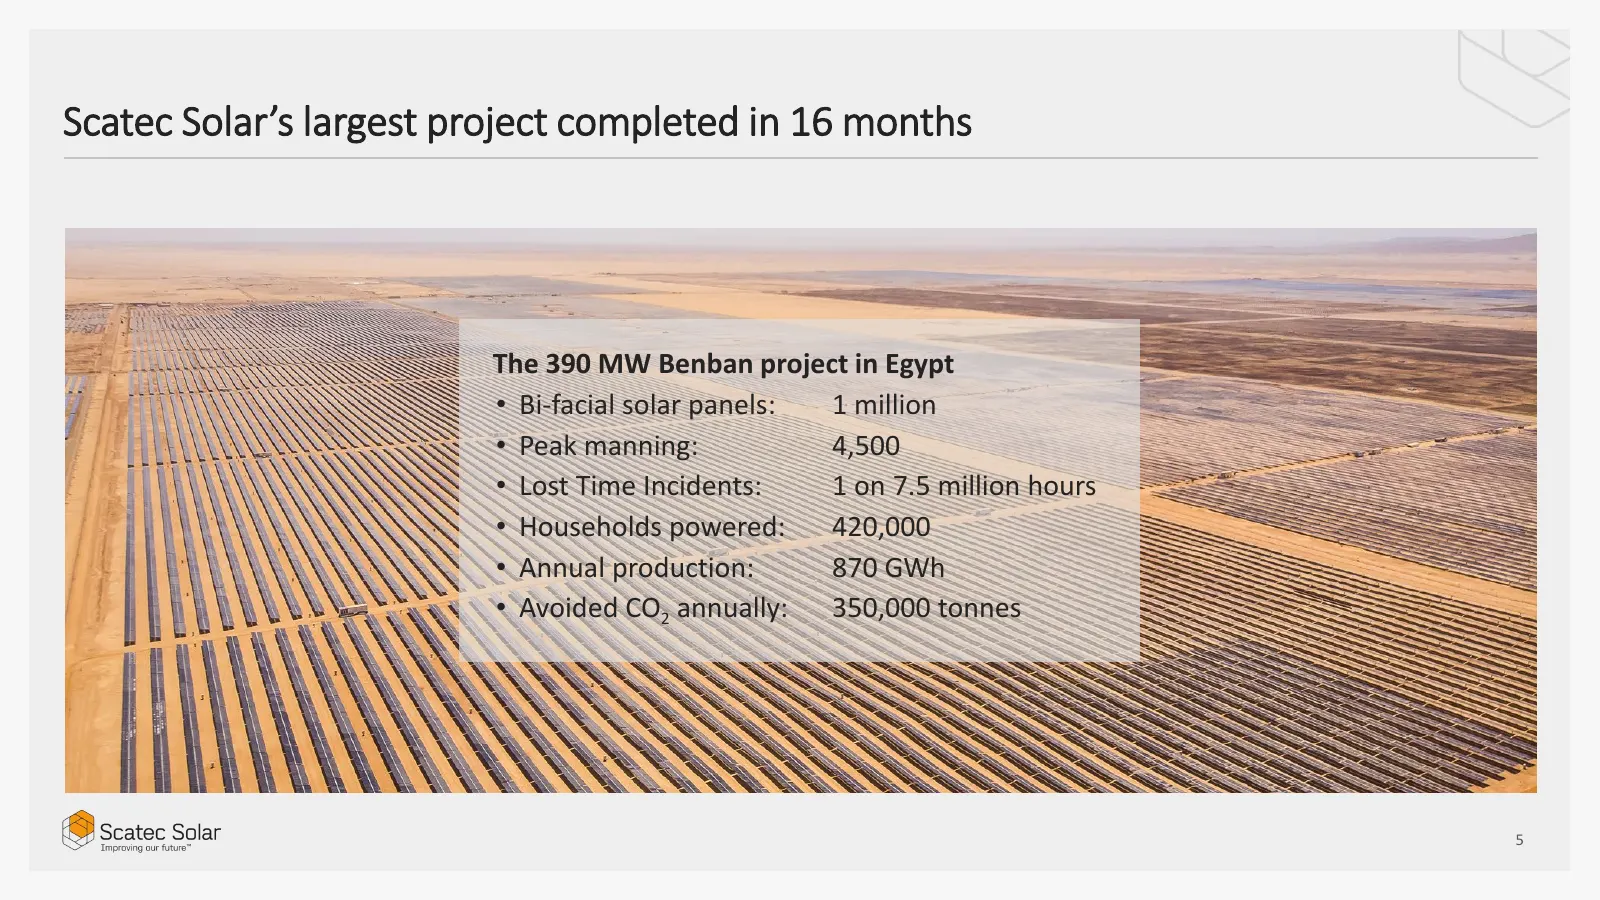
Scatec Solar’s largest project completed in 16 months The 390 MW Benban project in Egypt • Bi-facial solar panels: 1 million • Peak manning: 4,500 • Lost Time Incidents: 1 on 7.5 million hours • Households powered: 420,000 • Annual production: 870 GWh • Avoided CO2 annually: 350,000 tonnes 5
Slide 6: A robust asset portfolio of 1.2 GW in operation
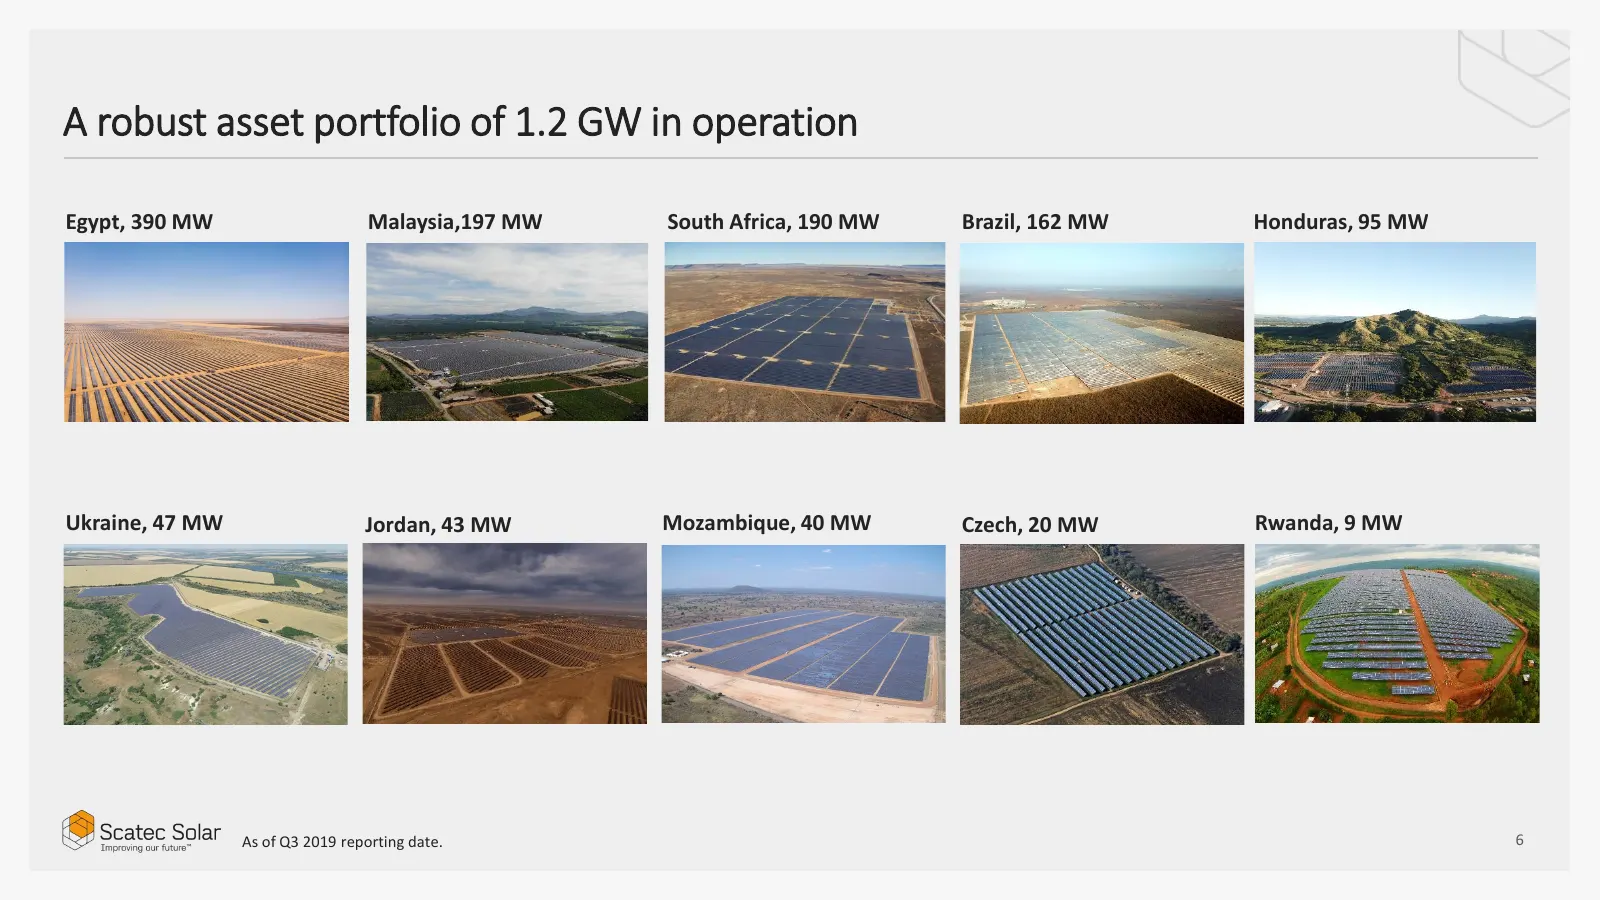
A robust asset portfolio of 1.2 GW in operation Egypt, 390 MW Malaysia,197 MW South Africa, 190 MW Brazil, 162 MW Honduras, 95 MW Ukraine, 47 MW Jordan, 43 MW Mozambique, 40 MW Czech, 20 MW Rwanda, 9 MW As of Q3 2019 reporting date. 6
Slide 7: 711 MW under construction on four continents
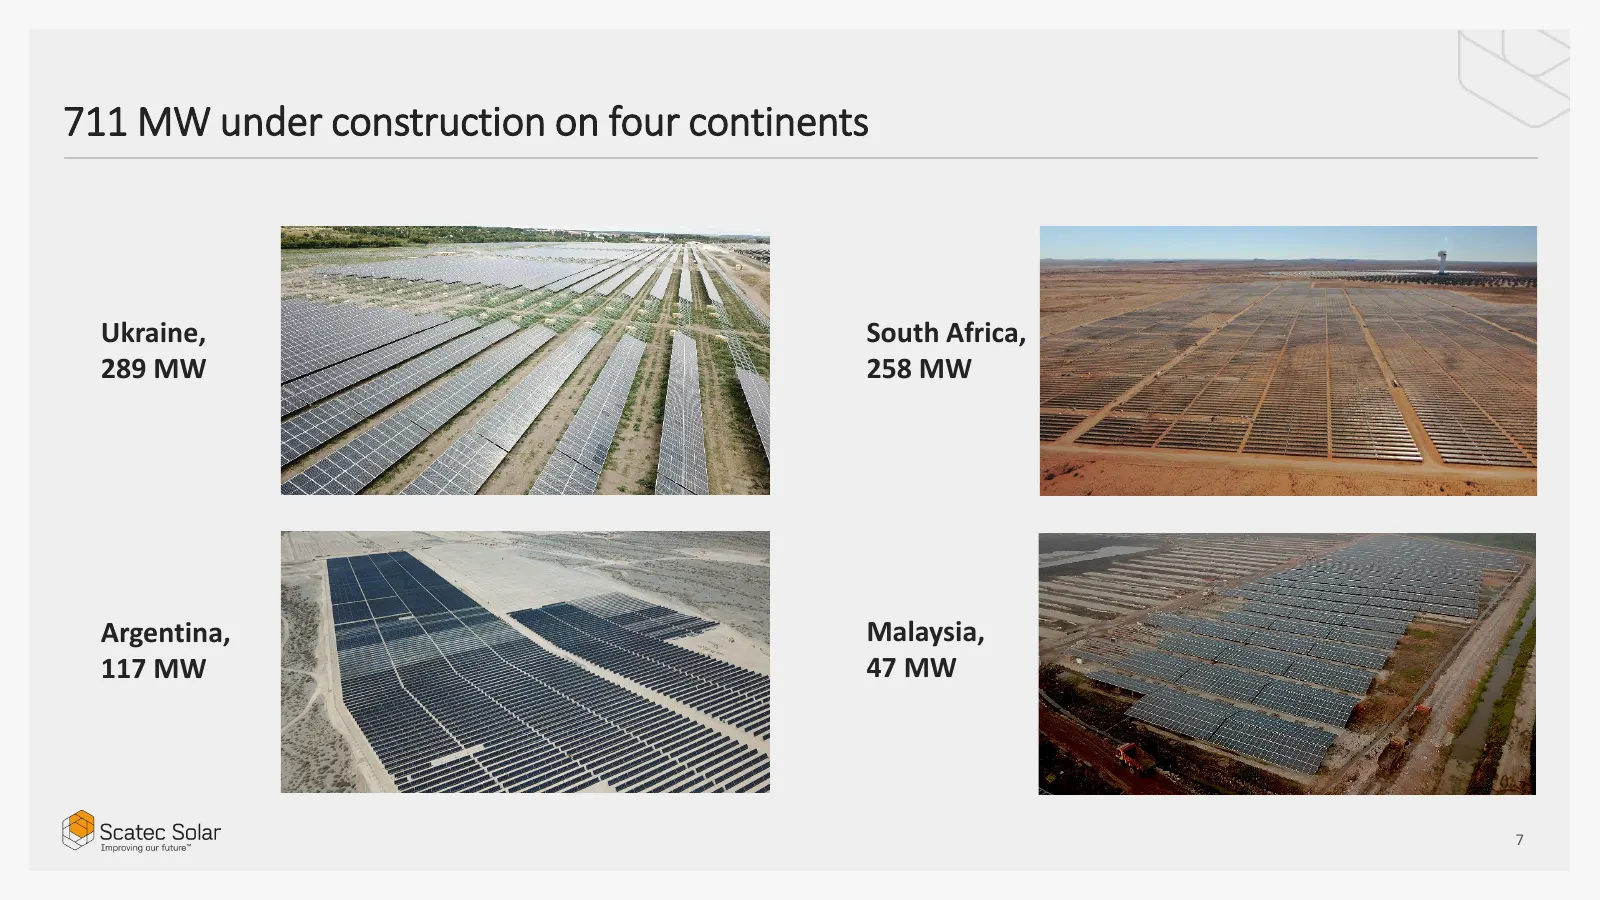
711 MW under construction on four continents Ukraine, South Africa, 289 MW 258 MW Argentina, Malaysia, 117 MW 47 MW 7
Slide 8: Financial review
Financial review Mikkel Tørud, CFO 8
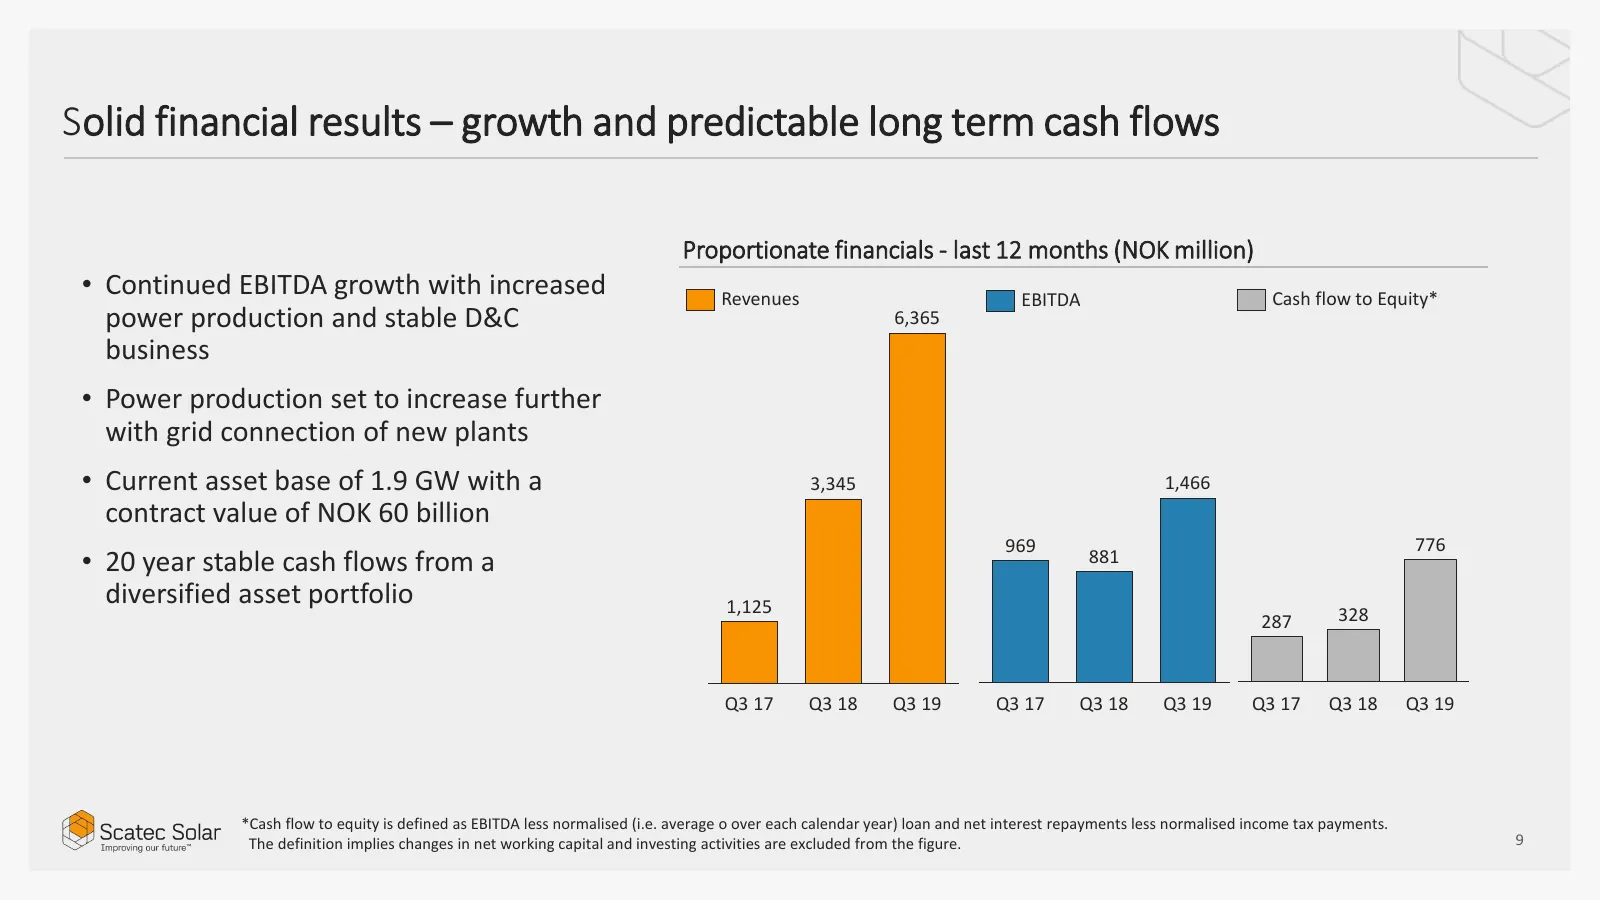
Slide 9: Solid financial results – growth and predictable long term cash flows
Solid financial results – growth and predictable long term cash flows Proportionate financials - last 12 months (NOK million) • Continued EBITDA growth with increased Revenues EBITDA Cash flow to Equity* power production and stable D&C 6,365 business • Power production set to increase further with g
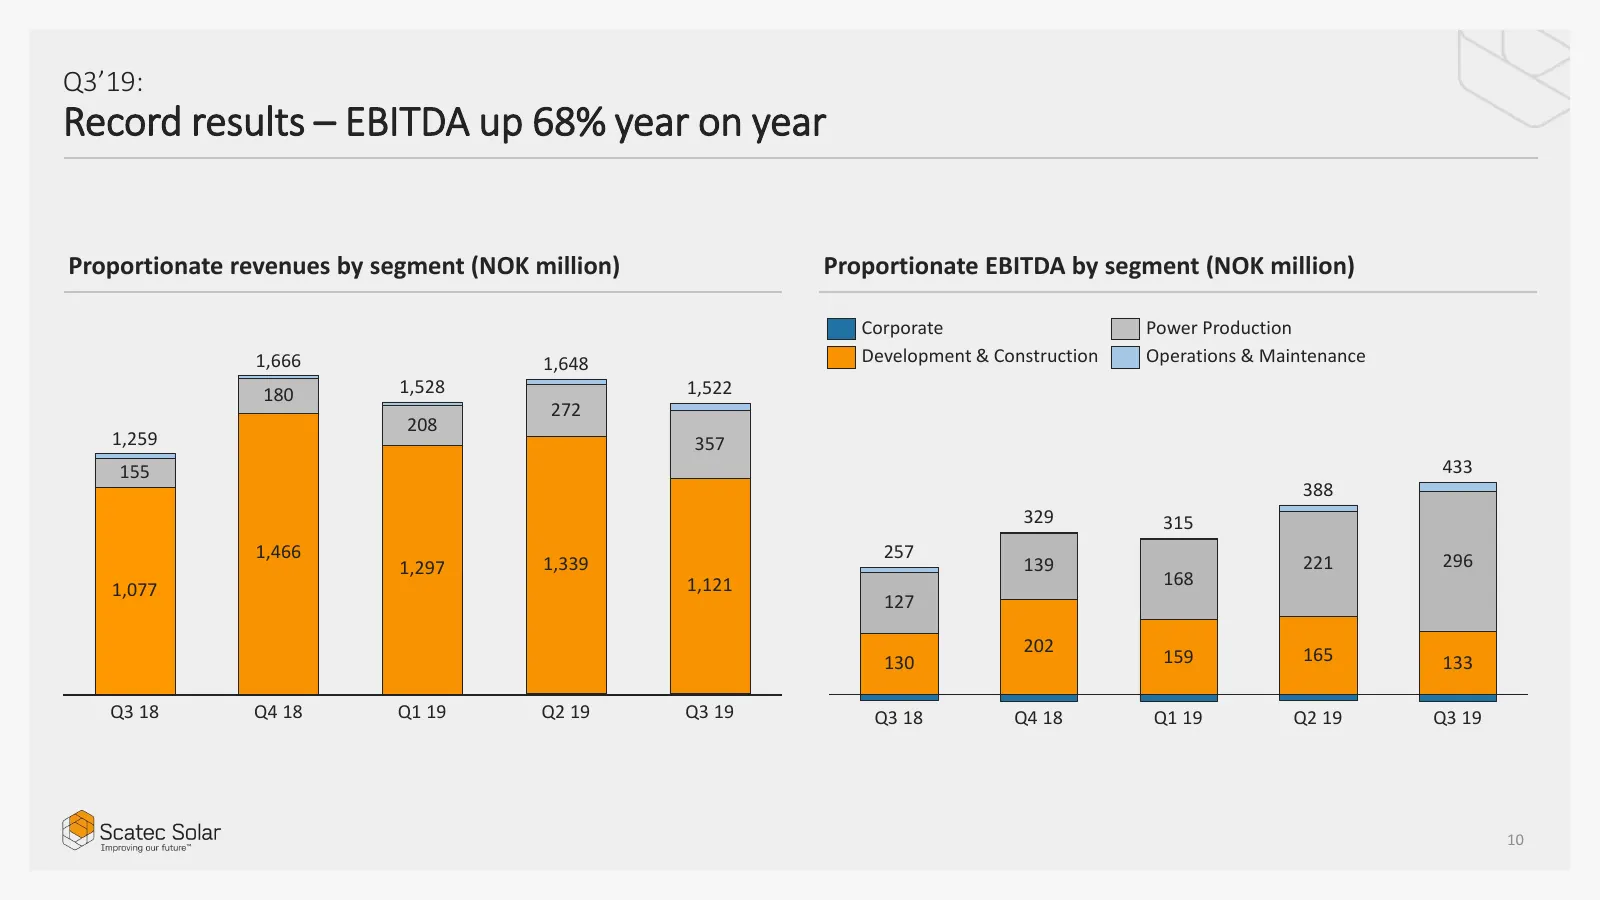
Slide 10: Record results – EBITDA up 68% year on year
Q3’19: Record results – EBITDA up 68% year on year Proportionate revenues by segment (NOK million) Proportionate EBITDA by segment (NOK million) Corporate Power Production 1,666 1,648 Development & Construction Operations & Maintenance 180 1,528 1,522 272 208 1,259 357 155 433 388 329 315 1,466 257
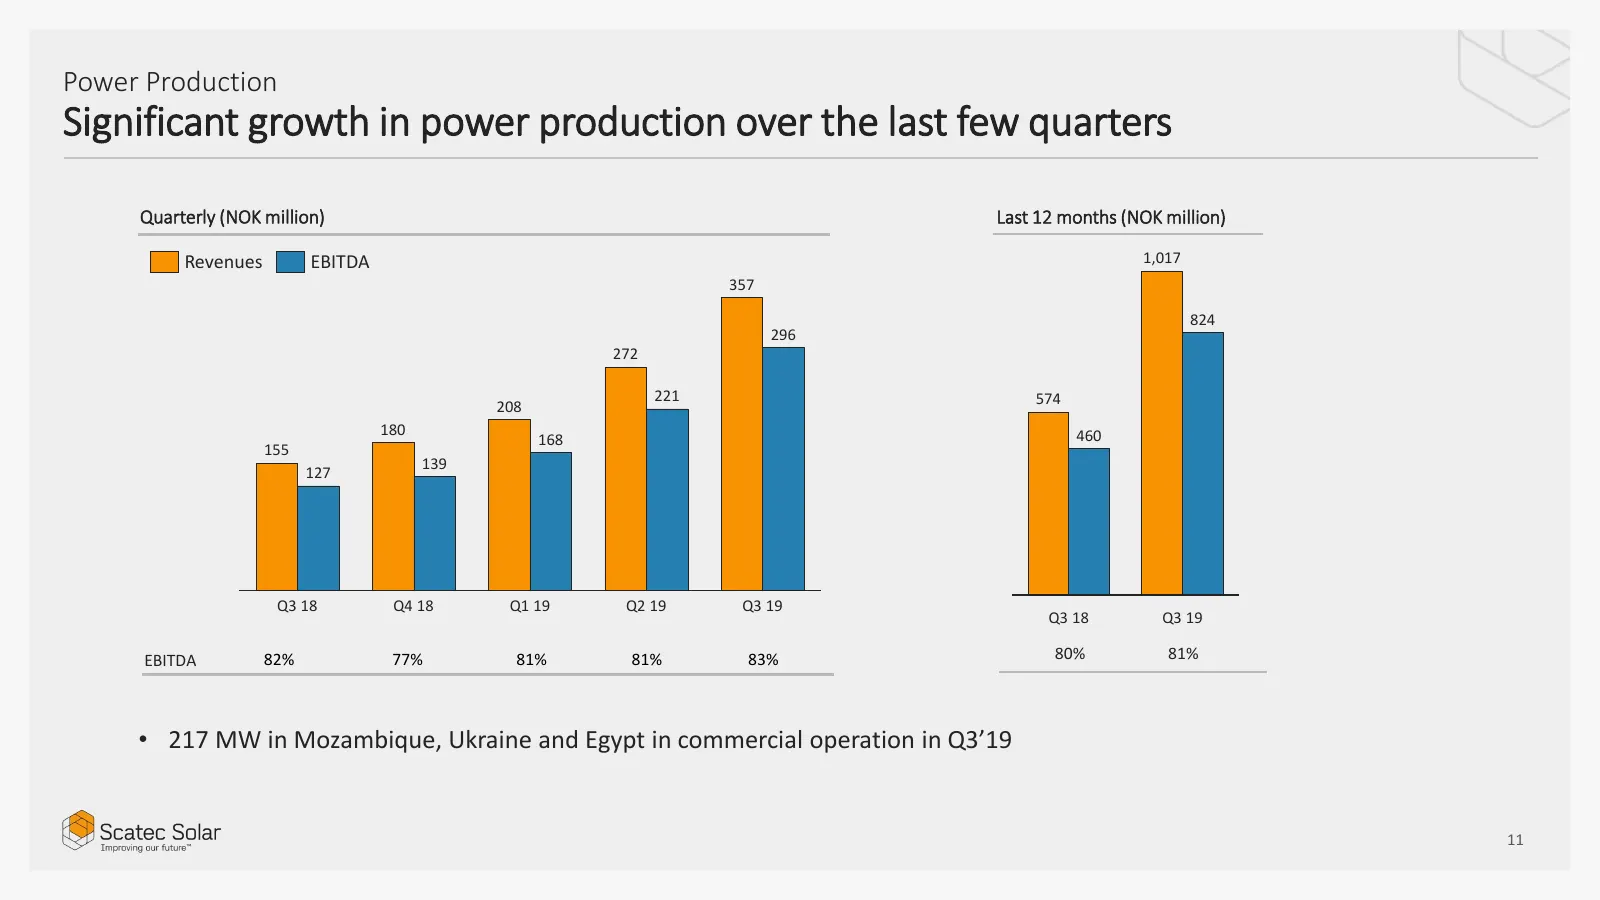
Slide 11: Significant growth in power production over the last few quarters
Power Production Significant growth in power production over the last few quarters Quarterly (NOK million) Last 12 months (NOK million) Revenues EBITDA 1,017 357 824 296 272 221 574 208 180 460 168 155 139 127 Q3 18 Q4 18 Q1 19 Q2 19 Q3 19 Q3 18 Q3 19 EBITDA 82% 77% 81% 81% 83% 80% 81% • 217 MW in M
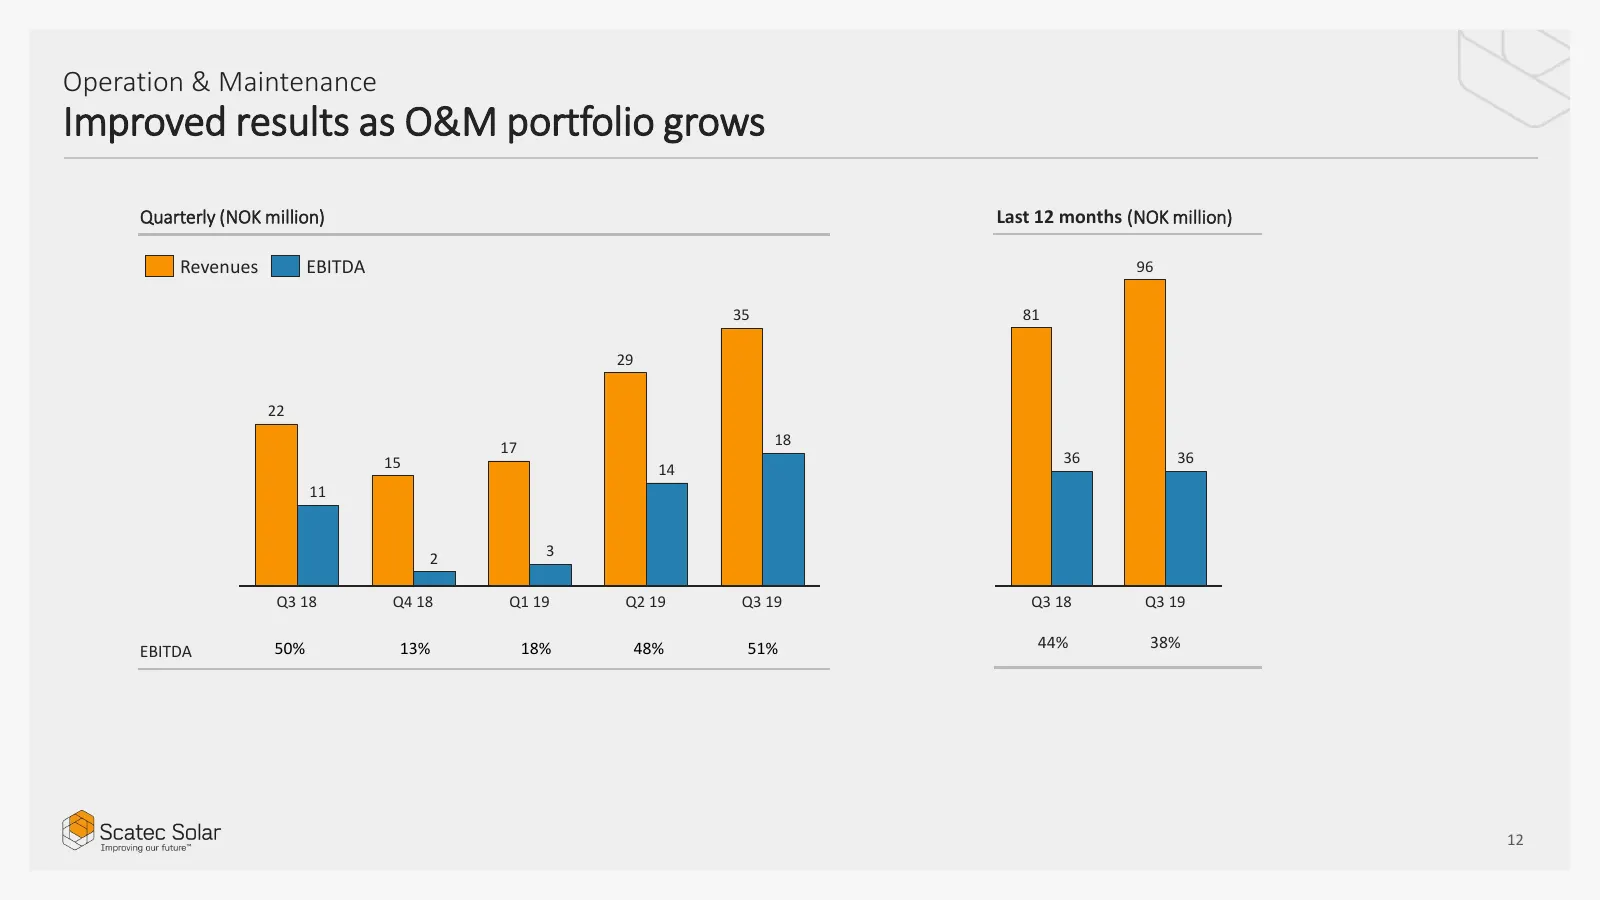
Slide 12: Improved results as O&M portfolio grows
Operation & Maintenance Improved results as O&M portfolio grows Quarterly (NOK million) Last 12 months (NOK million) Revenues EBITDA 96 35 81 29 22 17 18 15 36 36 14 11 2 3 Q3 18 Q4 18 Q1 19 Q2 19 Q3 19 Q3 18 Q3 19 50% 13% 18% 48% 51% 44% 38% EBITDA 12
Slide 13: Development and construction activities at continued high levels
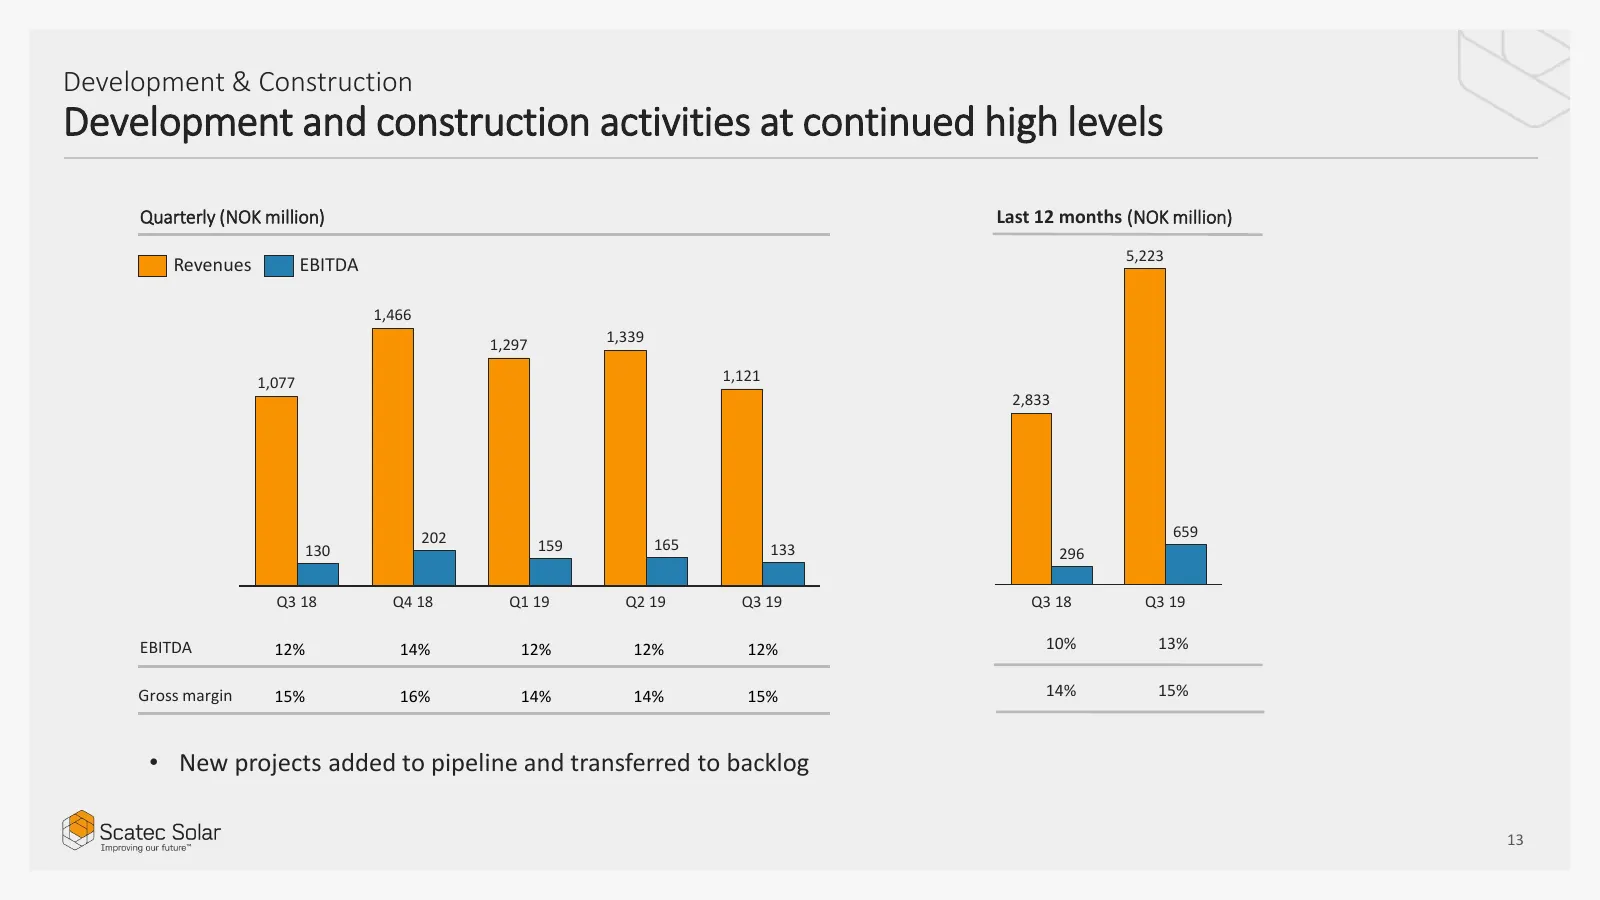
Development & Construction Development and construction activities at continued high levels Quarterly (NOK million) Last 12 months (NOK million) 5,223 Revenues EBITDA 1,466 1,297 1,339 1,077 1,121 2,833 202 659 130 159 165 133 296 Q3 18 Q4 18 Q1 19 Q2 19 Q3 19 Q3 18 Q3 19 EBITDA 12% 14% 12% 12% 12%
Slide 14: Financial position further strengthened through equity capital raise
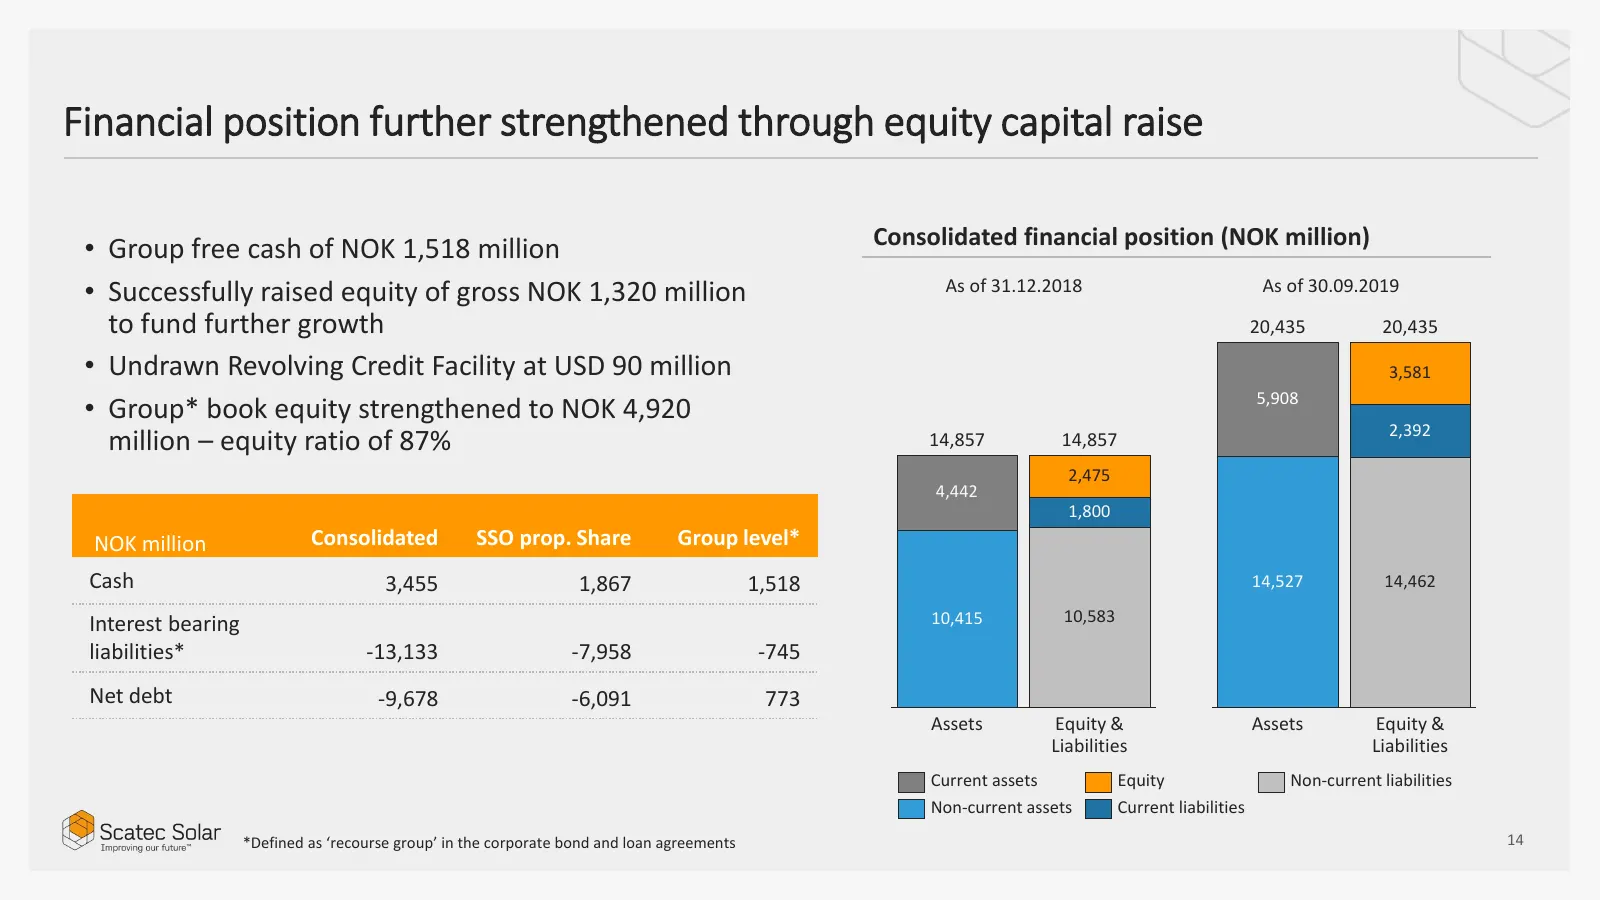
Financial position further strengthened through equity capital raise Consolidated financial position (NOK million) • Group free cash of NOK 1,518 million • Successfully raised equity of gross NOK 1,320 million As of 31.12.2018 As of 30.09.2019 to fund further growth 20,435 20,435 • Undrawn Revolving
Slide 15: Q3'19 movement of free cash at group level
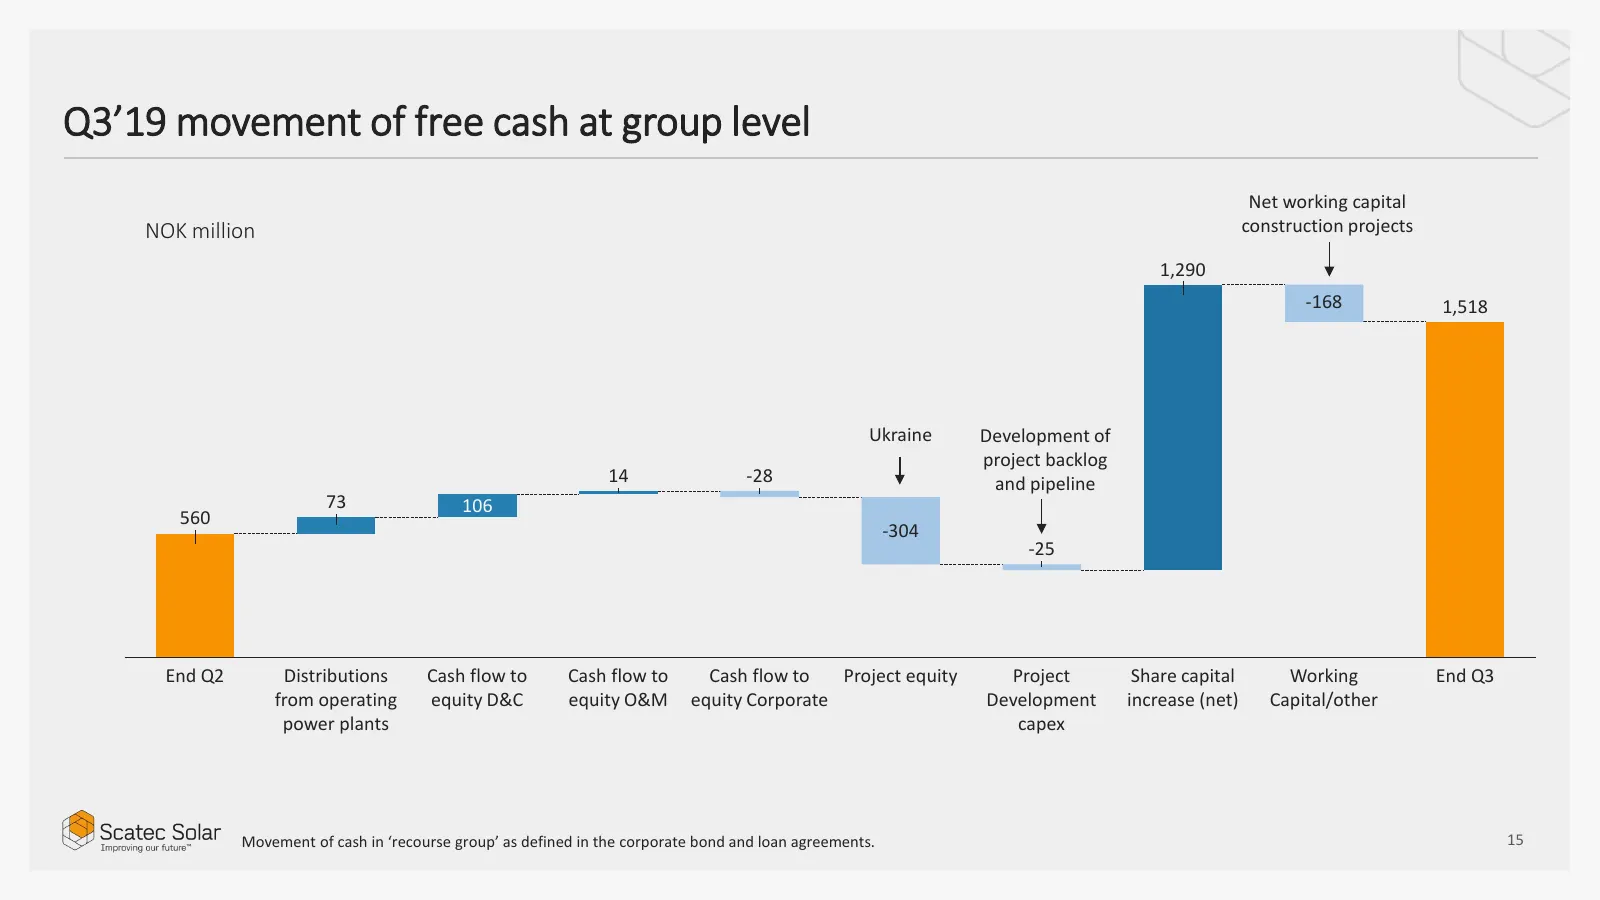
Q3’19 movement of free cash at group level Net working capital NOK million construction projects 1,290 -168 1,518 Ukraine Development of project backlog 14 -28 and pipeline 73 106 560 -304 -25 End Q2 Distributions Cash flow to Cash flow to Cash flow to Project equity Project Share capital Working En
Slide 16: Short term guidance
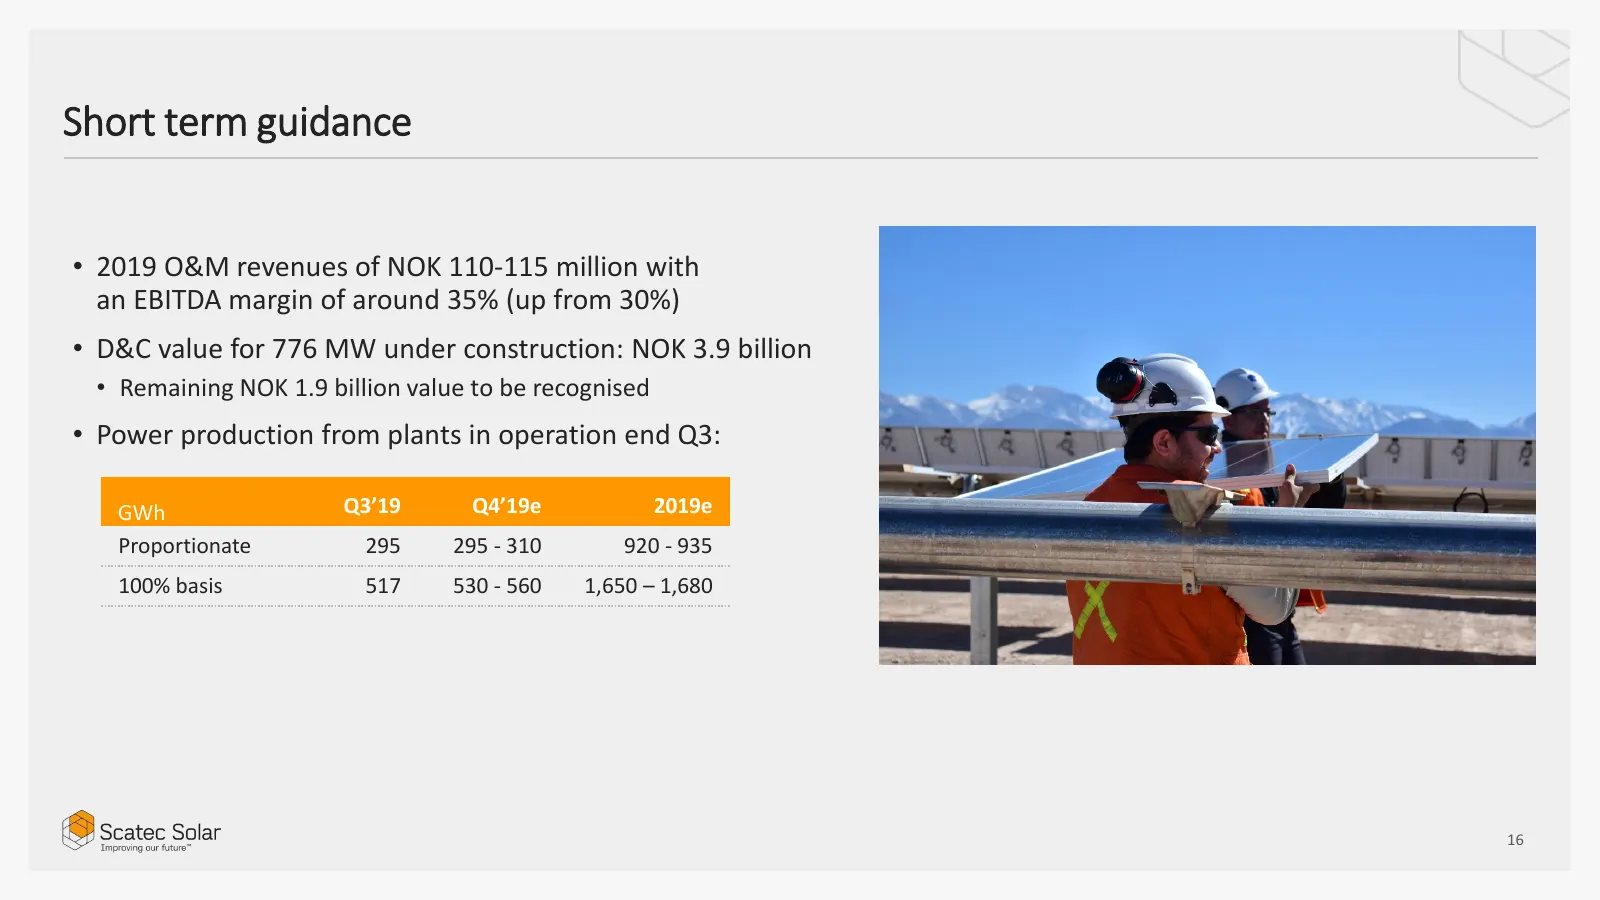
Short term guidance • 2019 O&M revenues of NOK 110-115 million with an EBITDA margin of around 35% (up from 30%) • D&C value for 776 MW under construction: NOK 3.9 billion • Remaining NOK 1.9 billion value to be recognised • Power production from plants in operation end Q3: GWh Q3’19 Q4’19e 2019e Pr
Slide 17: A well diversified portfolio with a PPA contract value of more than NOK 60 billion
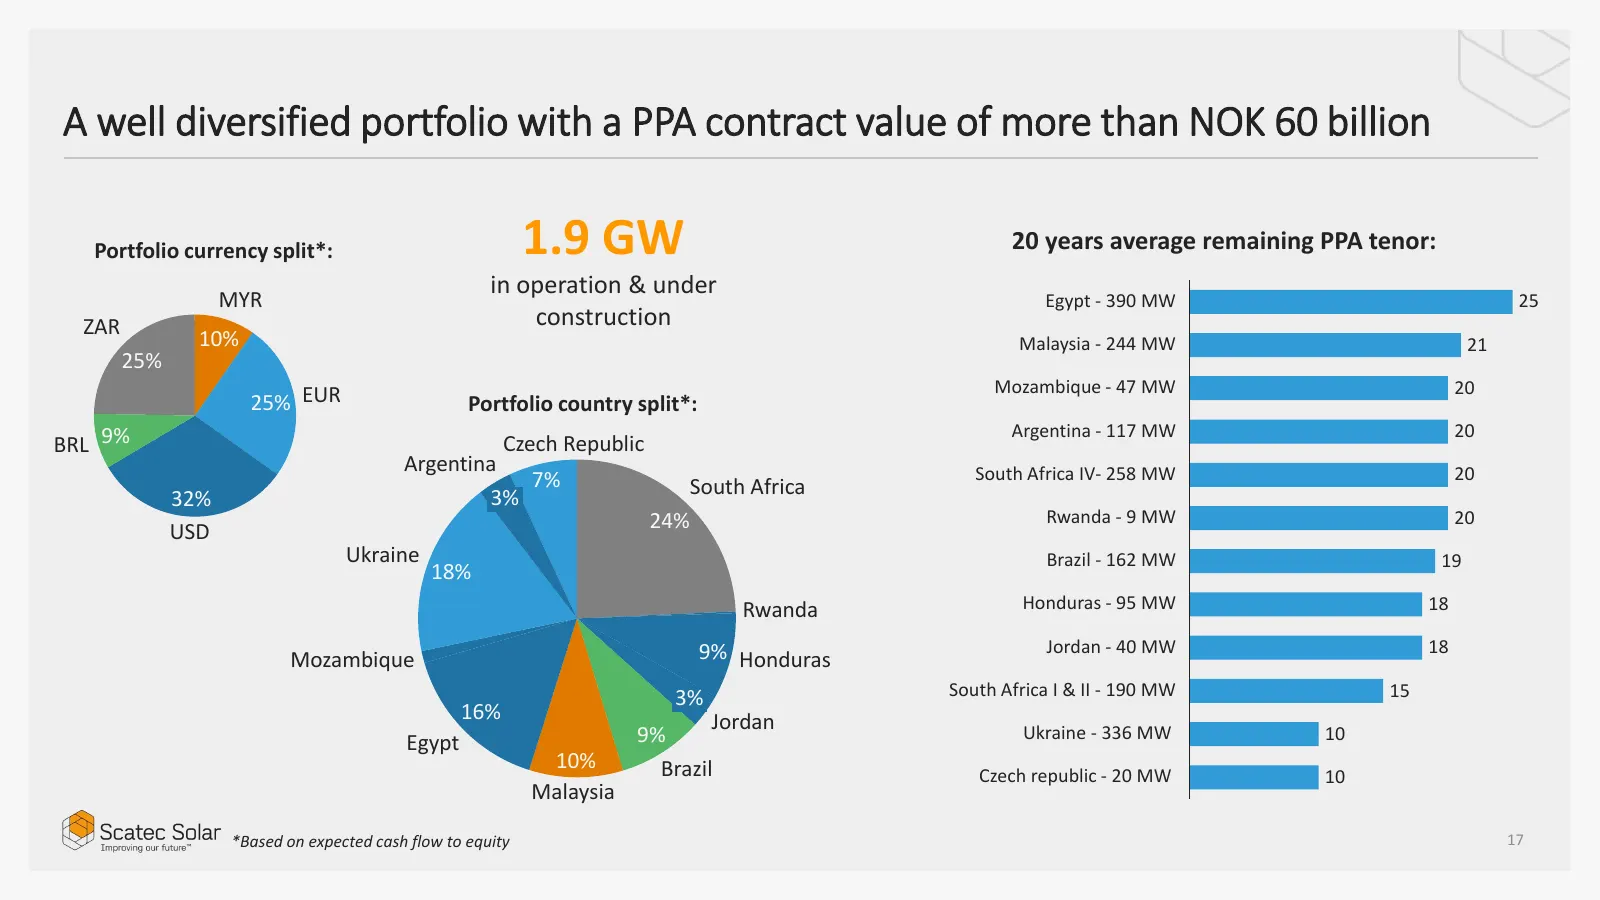
A well diversified portfolio with a PPA contract value of more than NOK 60 billion Portfolio currency split*: 1.9 GW 20 years average remaining PPA tenor: in operation & under MYR Egypt - 390 MW 25 ZAR construction 10% Malaysia - 244 MW 21 25% Mozambique - 47 MW 20 25% EUR Portfolio country split*:
Slide 18: Outlook and summary
Outlook and summary Raymond Carlsen, CEO 18
Slide 19: Solar & wind expected to provide 50% of all power globally by 2050
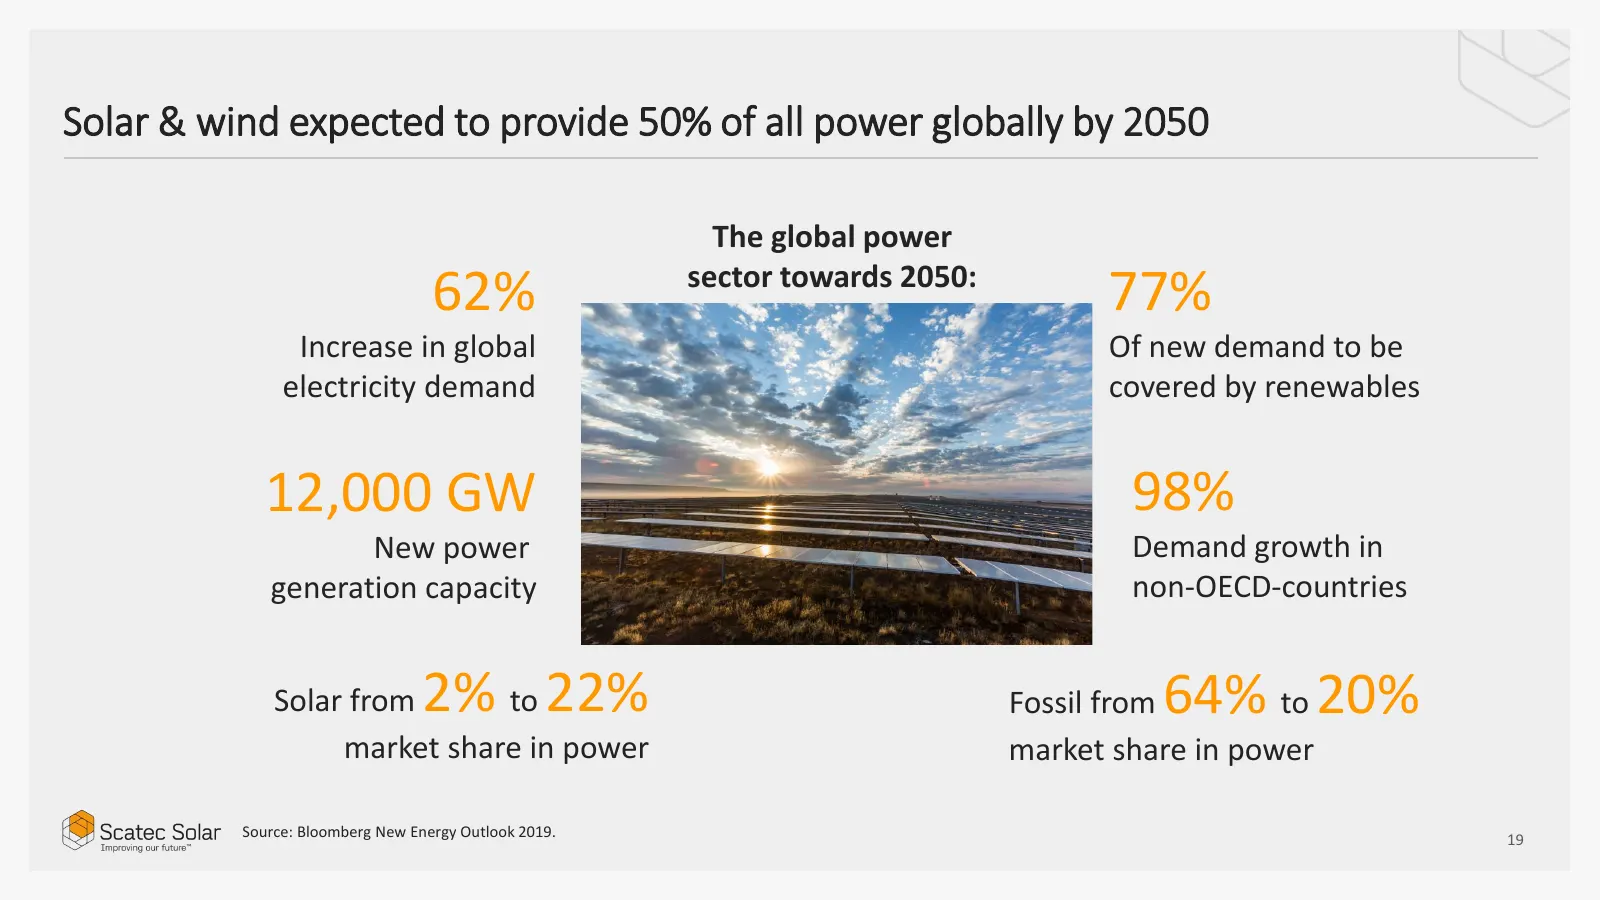
Solar & wind expected to provide 50% of all power globally by 2050 The global power 62% sector towards 2050: 77% Increase in global Of new demand to be electricity demand covered by renewables 12,000 GW 98% New power Demand growth in generation capacity non-OECD-countries Solar from to 2% 22% 64% 20
Slide 20: A solid backlog & pipeline is supporting our ambition to accelerate growth
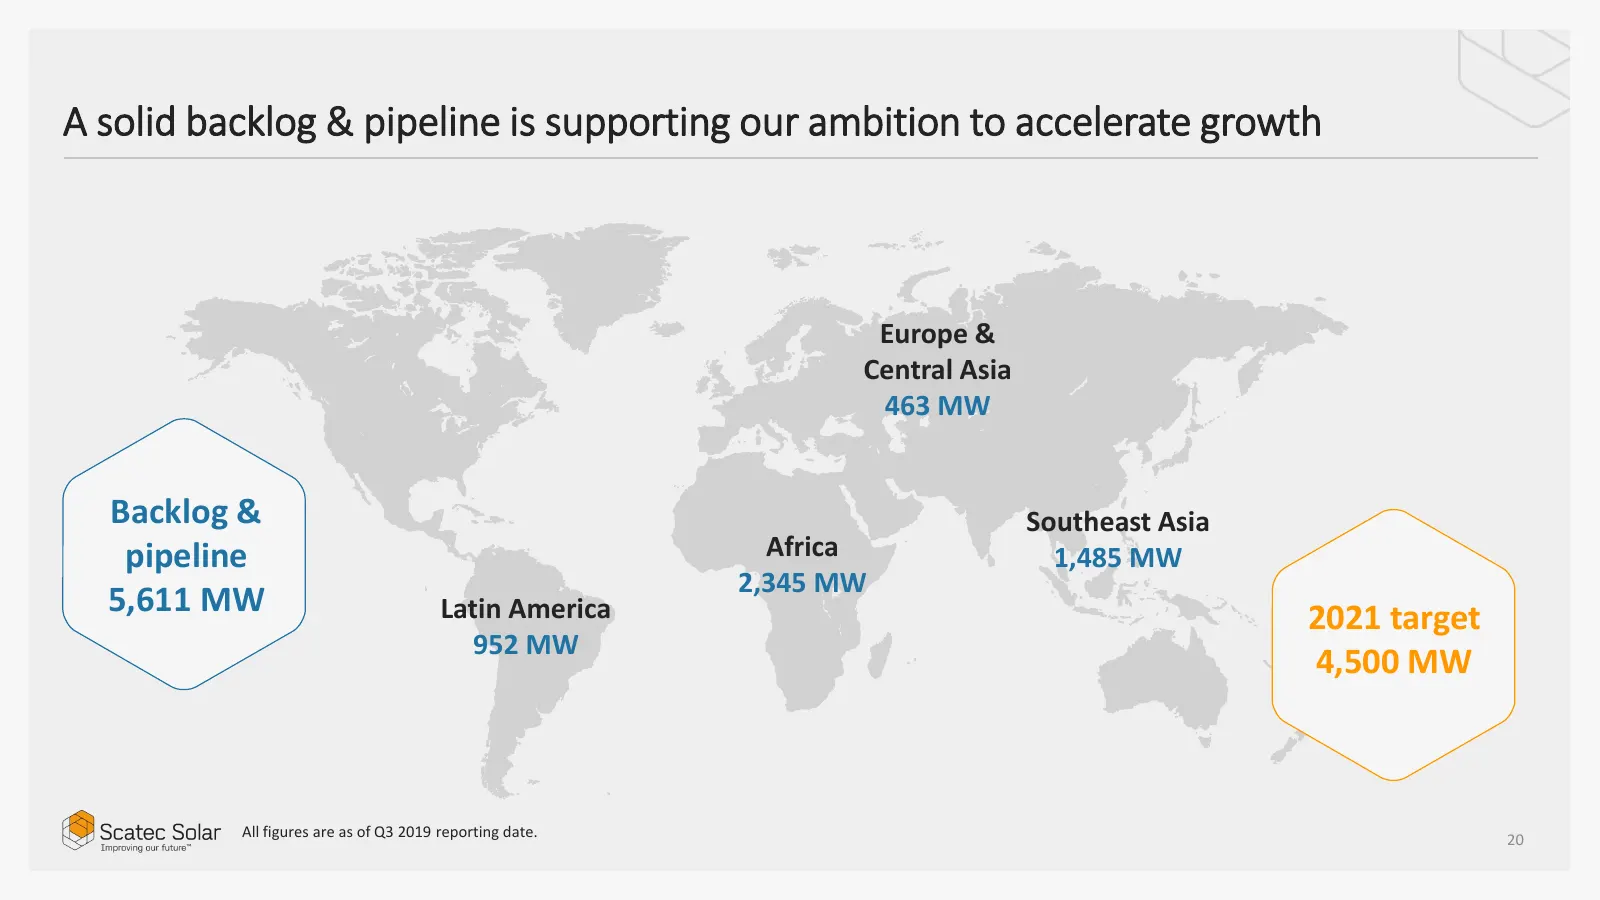
A solid backlog & pipeline is supporting our ambition to accelerate growth Europe & Central Asia 463 MW Backlog & Southeast Asia pipeline Africa 1,485 MW 2,345 MW 5,611 MW Latin America 2021 target 952 MW 4,500 MW All figures are as of Q3 2019 reporting date. 20
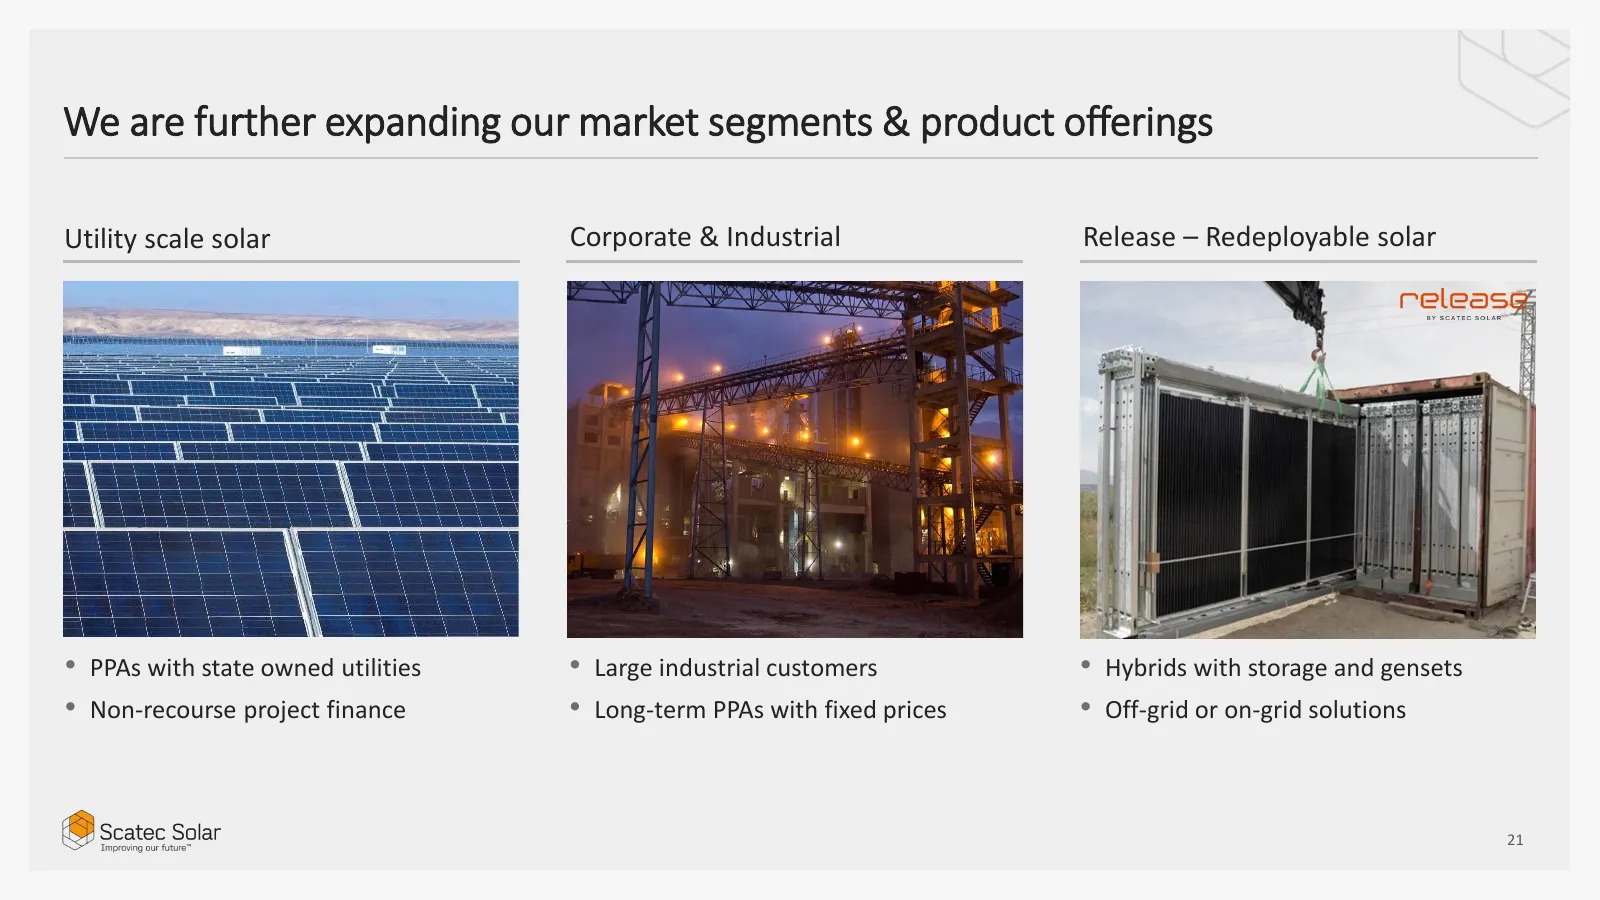
Slide 21: We are further expanding our market segments & product offerings
We are further expanding our market segments & product offerings Utility scale solar Corporate & Industrial Release – Redeployable solar • PPAs with state owned utilities • Large industrial customers • Hybrids with storage and gensets • Non-recourse project finance • Long-term PPAs with fixed prices
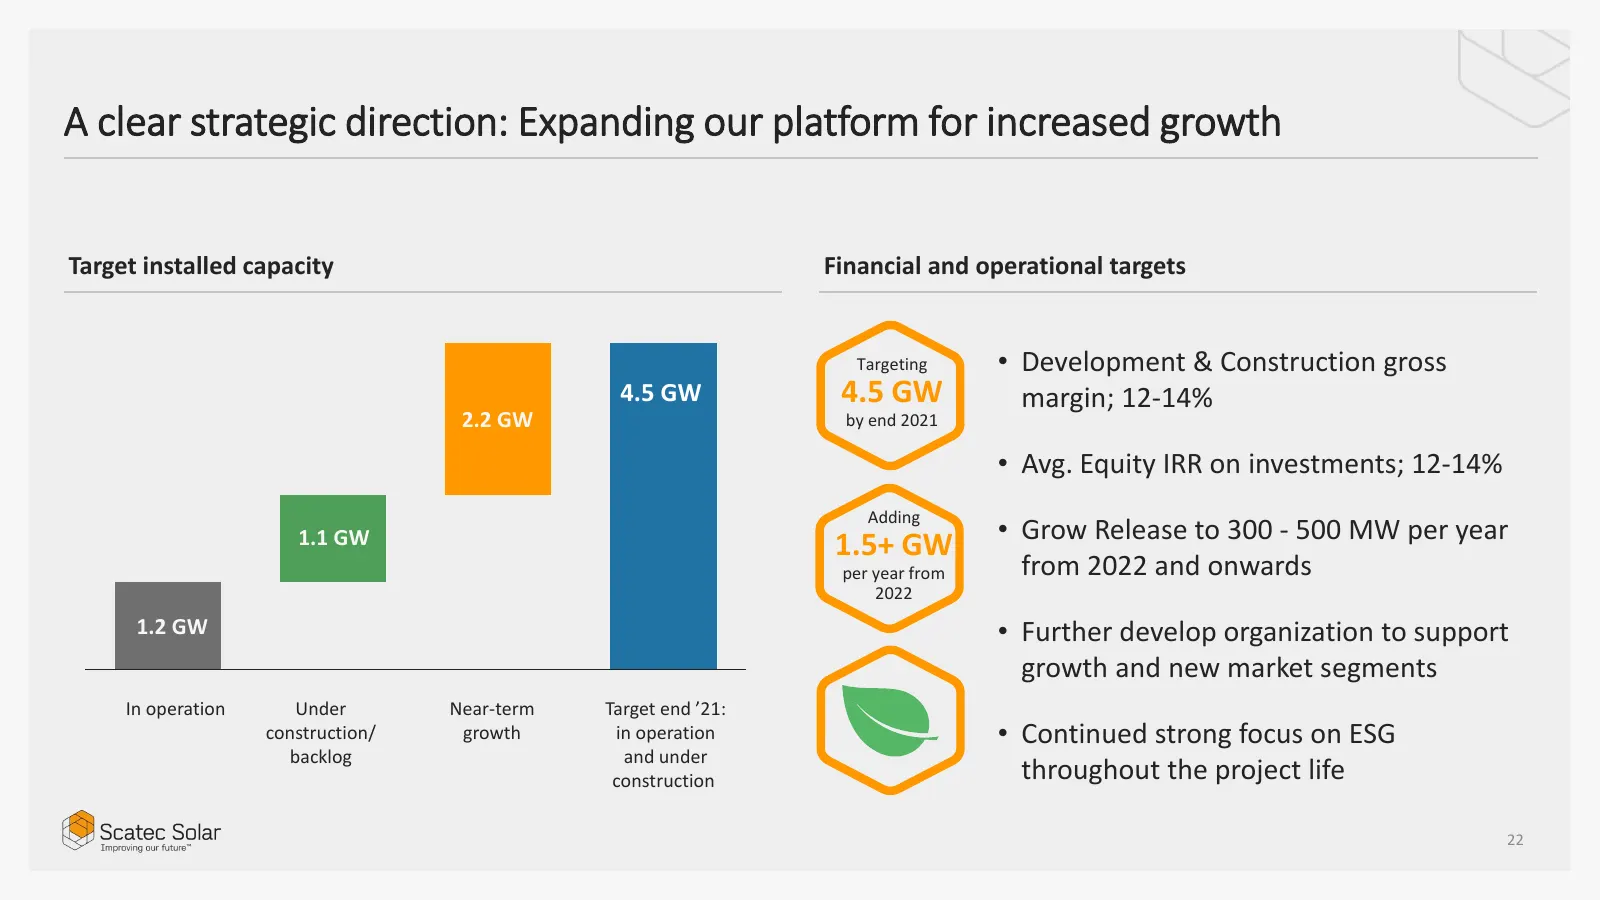
Slide 22: A clear strategic direction: Expanding our platform for increased growth
A clear strategic direction: Expanding our platform for increased growth Target installed capacity Financial and operational targets Targeting • Development & Construction gross 4.5 GW 4.5 GW margin; 12-14% 2.2 GW by end 2021 • Avg. Equity IRR on investments; 12-14% Adding • Grow Release to 300 - 50
Slide 23: Thank you!
Thank you! oe Scatec Solar Improving our future™
Slide 24: Scatec Solar
Scatec Solar Improving our future™
Source: Internet Archive copy of scatec.com
More decks from Scatec ASA
 Q3 2026 Earnings Presentation32 slides · Oct 30, 2026
 Q2 2026 Earnings Presentation23 slides · Aug 21, 2026
 Investor Presentation (August 2026)22 slides · August 2026
 Q1 2026 Earnings Presentation23 slides · May 6, 2026
 Investor Presentation (March 2026)22 slides · March 2026
 Q4 2025 Earnings Presentation24 slides · Jan 30, 2026