Dot Hill Systems — 15th Annual B. Riley Investor Conference 2014
35 slides from Dot Hill Systems's conference presentation, May 19, 2014

Slide 1: Driving Growth
NASDAQ: HILL DRIVING GROWTH NASDAQ: HILL May 2014 15th Annual B. Riley Investor Conference
Slide 2: Safe Harbor
NASDAQ: HILL 2 May 2014 Statements contained in this presentation regarding matters that are not historical facts are “forward-looking statements” within the meaning of the Private Securities Litigation Reform Act. Because such statements are subject to risks and uncertainties, actual results may di
Slide 3: Dot Hill at a Glance
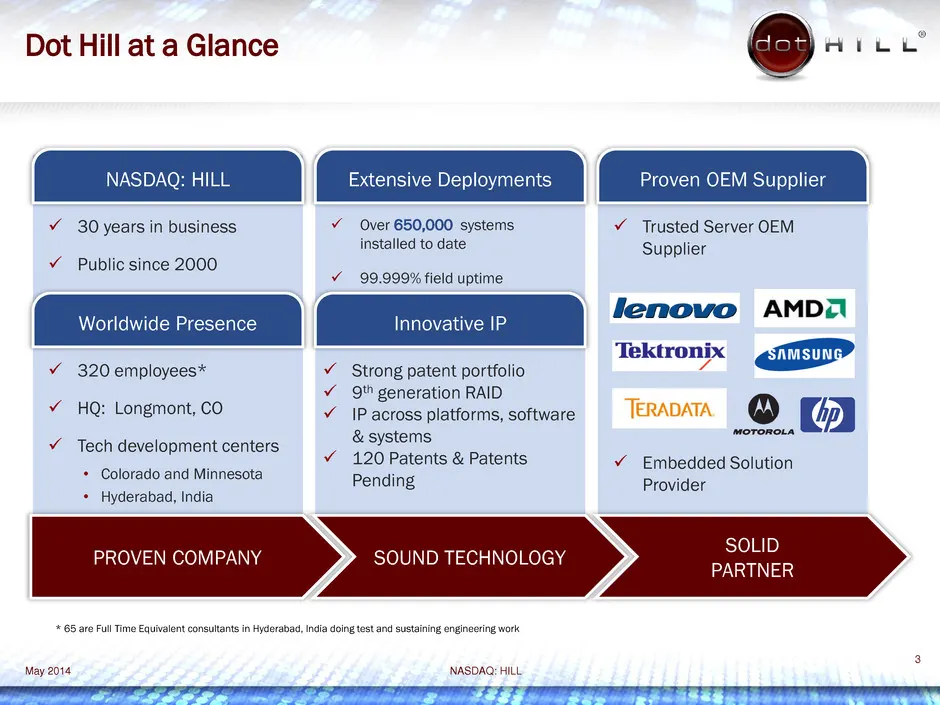
NASDAQ: HILL 3 Dot Hill at a Glance * 65 are Full Time Equivalent consultants in Hyderabad, India doing test and sustaining engineering work Extensive Deployments SOUND TECHNOLOGY Over 650,000 systems installed to date 99.999% field uptime Innovative IP Strong patent portfolio 9th generation
Slide 4: Selected Financial Information
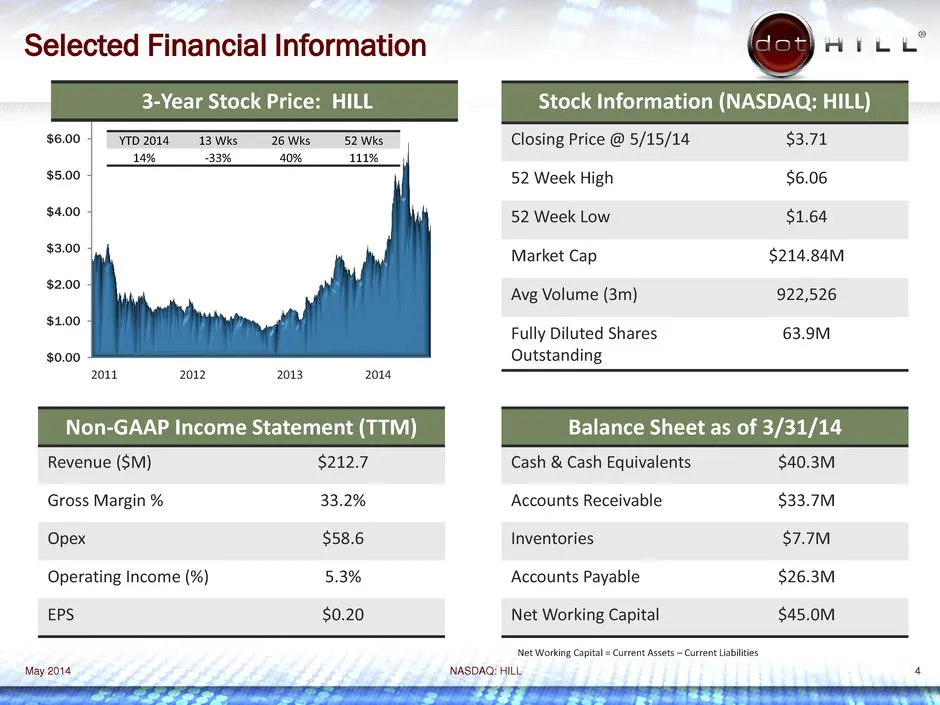
NASDAQ: HILL 4 Selected Financial Information May 2014 $0.00 $1.00 $2.00 $3.00 $4.00 $5.00 $6.00 2011 2012 2013 2014 Stock Information (NASDAQ: HILL) Closing Price @ 5/15/14 $3.71 52 Week High $6.06 52 Week Low $1.64 Market Cap $214.84M Avg Volume (3m) 922,526 Fully Diluted Shares Outstanding 63.9M
Slide 5: Key Financial Metrics (2011 – 2013)
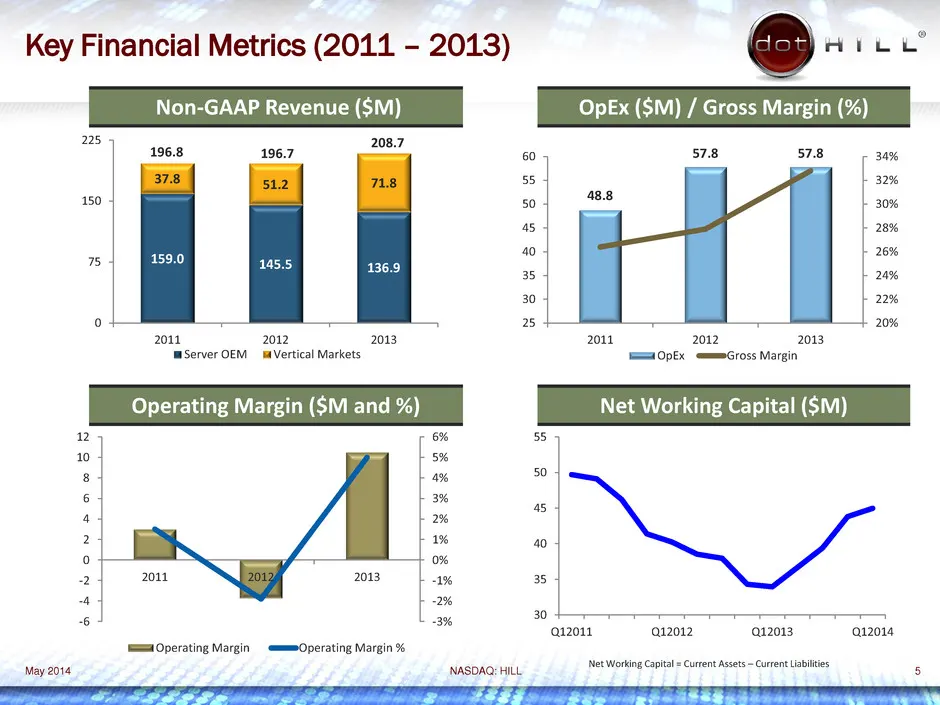
NASDAQ: HILL 5 Key Financial Metrics (2011 – 2013) May 2014 159.0 145.5 136.9 37.8 51.2 71.8 0 75 150 225 2011 2012 2013 Server OEM Vertical Markets 48.8 57.8 57.8 20% 22% 24% 26% 28% 30% 32% 34% 25 30 35 40 45 50 55 60 2011 2012 2013 OpEx Gross Margin -3% -2% -1% 0% 1% 2% 3% 4% 5% 6% -6 -4 -2 0 2 4
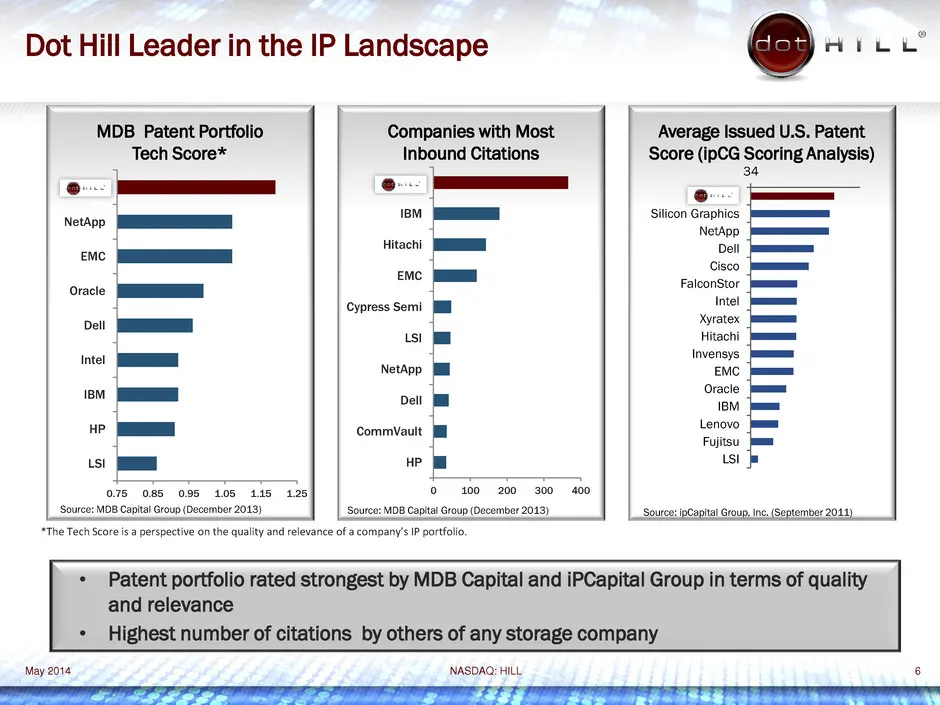
Slide 6: Dot Hill Leader in the IP Landscape
NASDAQ: HILL 6 Dot Hill Leader in the IP Landscape • Patent portfolio rated strongest by MDB Capital and iPCapital Group in terms of quality and relevance • Highest number of citations by others of any storage company MDB Patent Portfolio Tech Score* Companies with Most Inbound Citations Average Iss
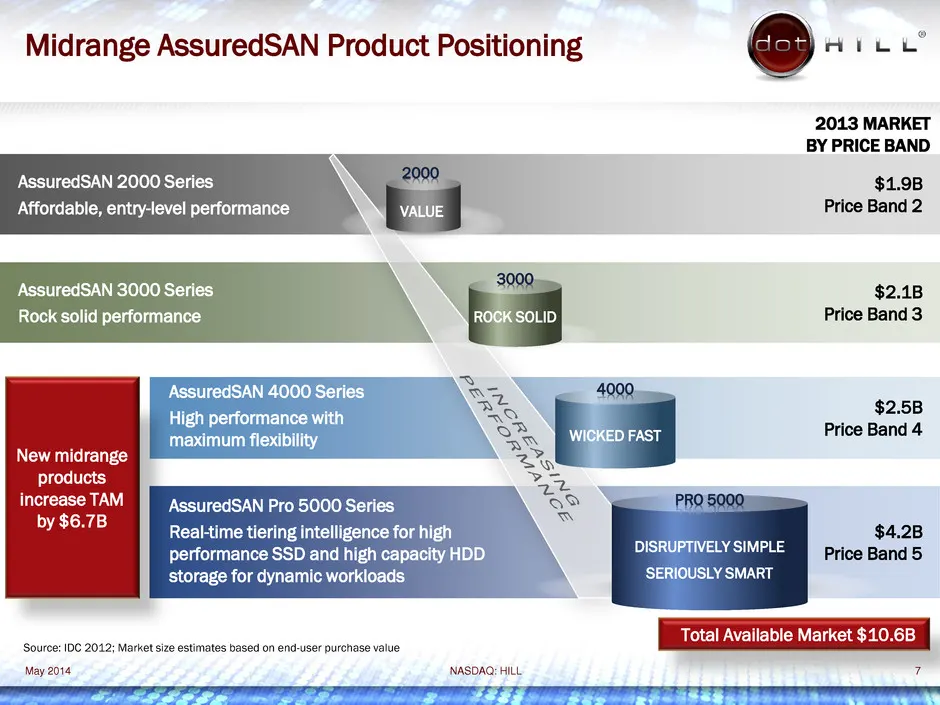
Slide 7: Midrange AssuredSAN Product Positioning
NASDAQ: HILL 7 Midrange AssuredSAN Product Positioning AssuredSAN Pro 5000 Series Real-time tiering intelligence for high performance SSD and high capacity HDD storage for dynamic workloads $4.2B Price Band 5 AssuredSAN 4000 Series High performance with maximum flexibility $2.5B Price Band 4 Assured
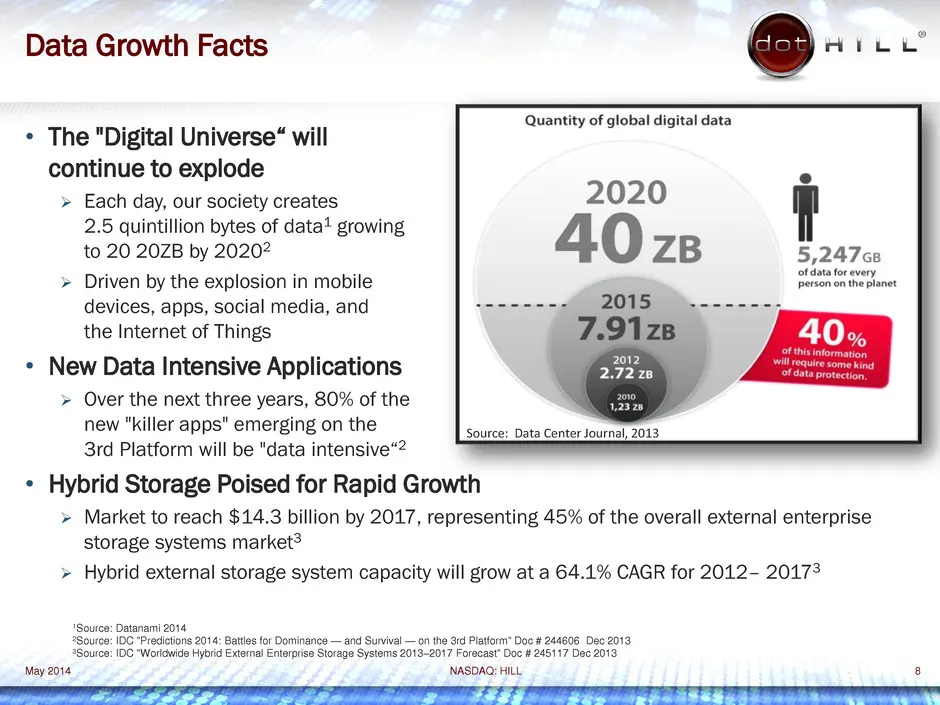
Slide 8: Data Growth Facts
NASDAQ: HILL 8 Data Growth Facts • The "Digital Universe“ will continue to explode Each day, our society creates 2.5 quintillion bytes of data1 growing to 20 20ZB by 20202 Driven by the explosion in mobile devices, apps, social media, and the Internet of Things • New Data Intensive Applications
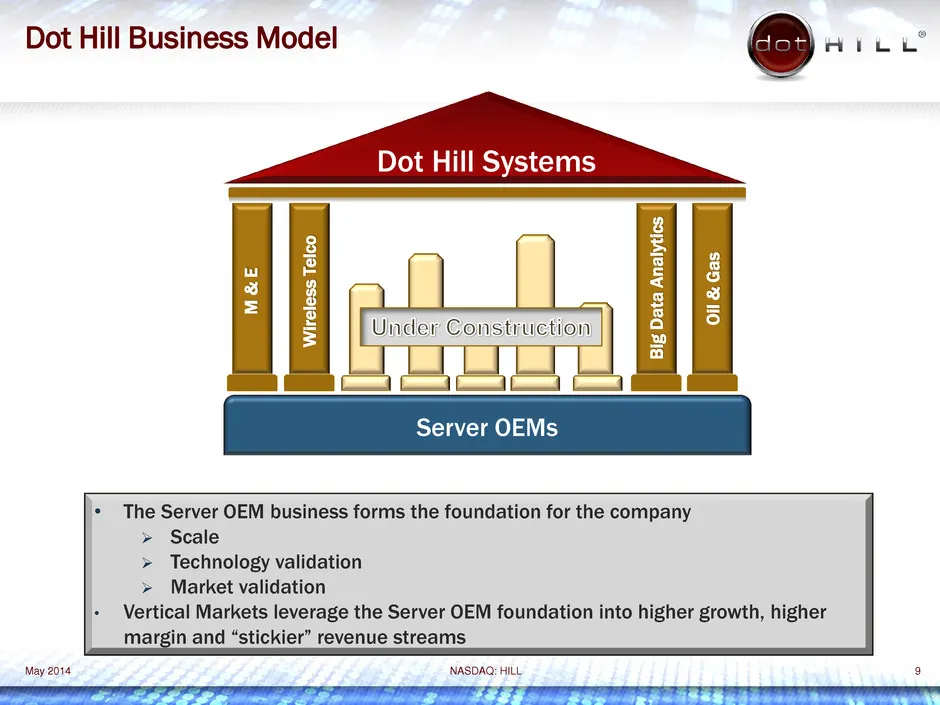
Slide 9: Dot Hill Business Model
NASDAQ: HILL Server OEMs Dot Hill Systems M & E W ir e le ss T e lc o B ig D a ta A n a ly ti cs O il & G a s 9 May 2014 Dot Hill Business Model • The Server OEM business forms the foundation for the company Scale Technology validation Market validation • Vertical Markets leverage the Server O
Slide 10: Comparison: Server OEM vs. Vertical Markets
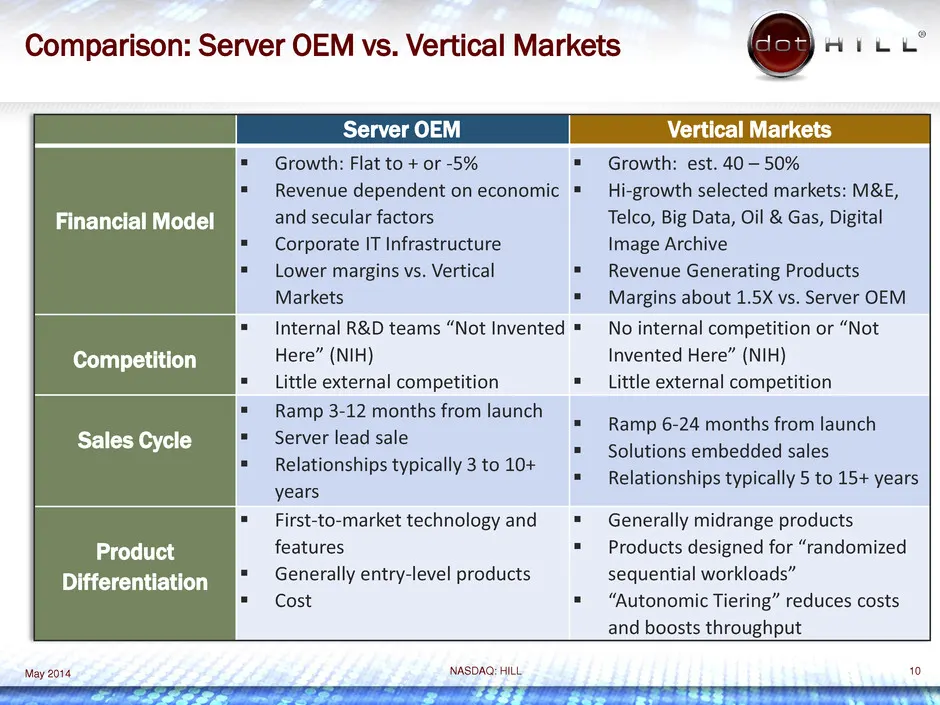
NASDAQ: HILL 10 Comparison: Server OEM vs. Vertical Markets May 2014 Server OEM Vertical Markets Financial Model Growth: Flat to + or -5% Revenue dependent on economic and secular factors Corporate IT Infrastructure Lower margins vs. Vertical Markets Growth: est. 40 – 50% Hi-growth selec
Slide 11: Server OEM Segment
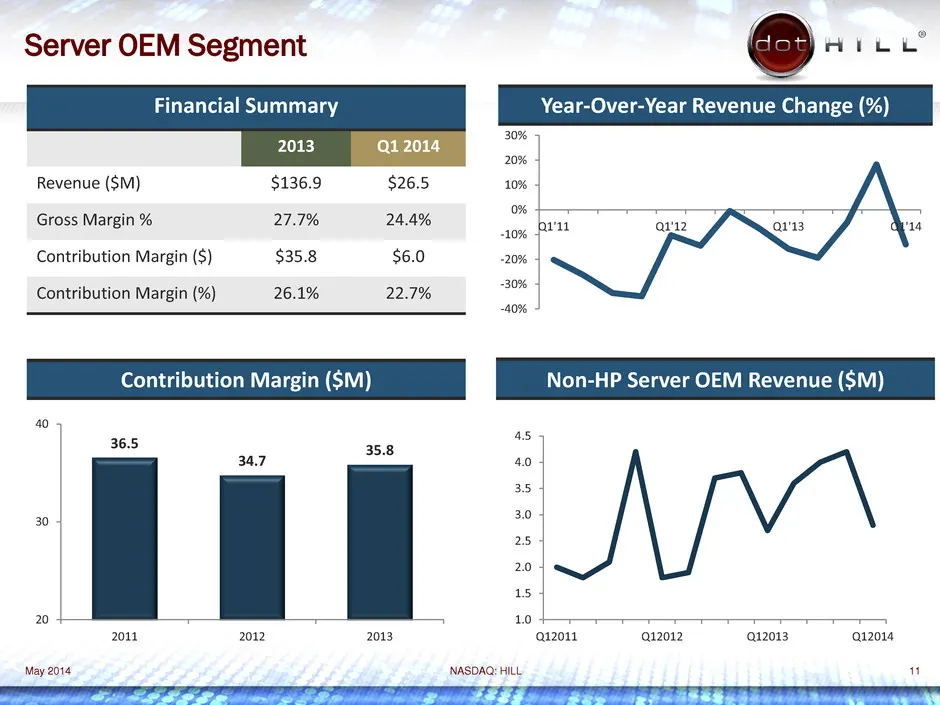
NASDAQ: HILL 11 Server OEM Segment May 2014 1.0 1.5 2.0 2.5 3.0 3.5 4.0 4.5 Q12011 Q12012 Q12013 Q12014 -40% -30% -20% -10% 0% 10% 20% 30% Q1'11 Q1'12 Q1'13 Q1'14 Financial Summary 2013 Q1 2014 Revenue ($M) $136.9 $26.5 Gross Margin % 27.7% 24.4% Contribution Margin ($) $35.8 $6.0 Contribution Margi
Slide 12: Server OEM Segment: Hewlett Packard
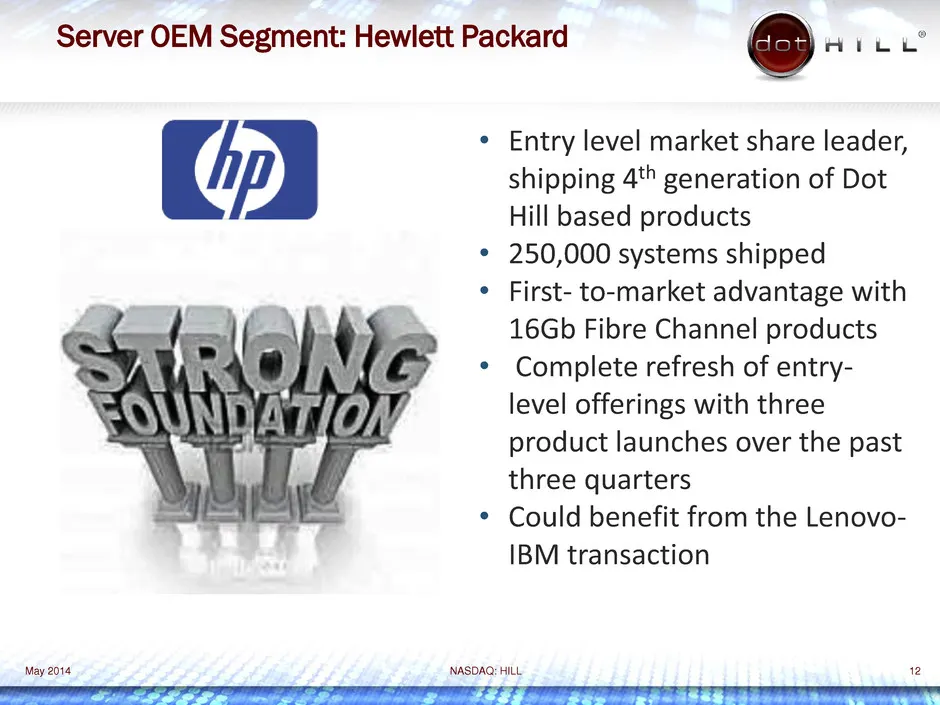
NASDAQ: HILL 12 Server OEM Segment: Hewlett Packard May 2014 • Entry level market share leader, shipping 4th generation of Dot Hill based products • 250,000 systems shipped • First- to-market advantage with 16Gb Fibre Channel products • Complete refresh of entry- level offerings with three product l
Slide 13: Vertical Markets Segment
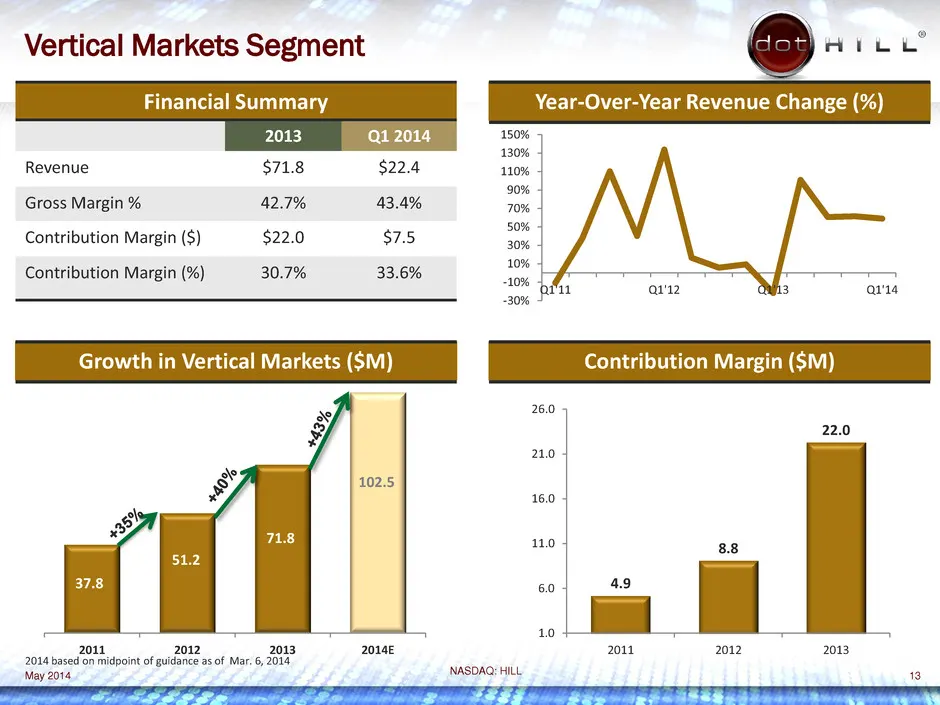
NASDAQ: HILL 13 Vertical Markets Segment May 2014 4.9 8.8 22.0 1.0 6.0 11.0 16.0 21.0 26.0 2011 2012 2013 Financial Summary 2013 Q1 2014 Revenue $71.8 $22.4 Gross Margin % 42.7% 43.4% Contribution Margin ($) $22.0 $7.5 Contribution Margin (%) 30.7% 33.6% -30% -10% 10% 30% 50% 70% 90% 110% 130% 150%
Slide 14: Vertical Market Profile: Telco
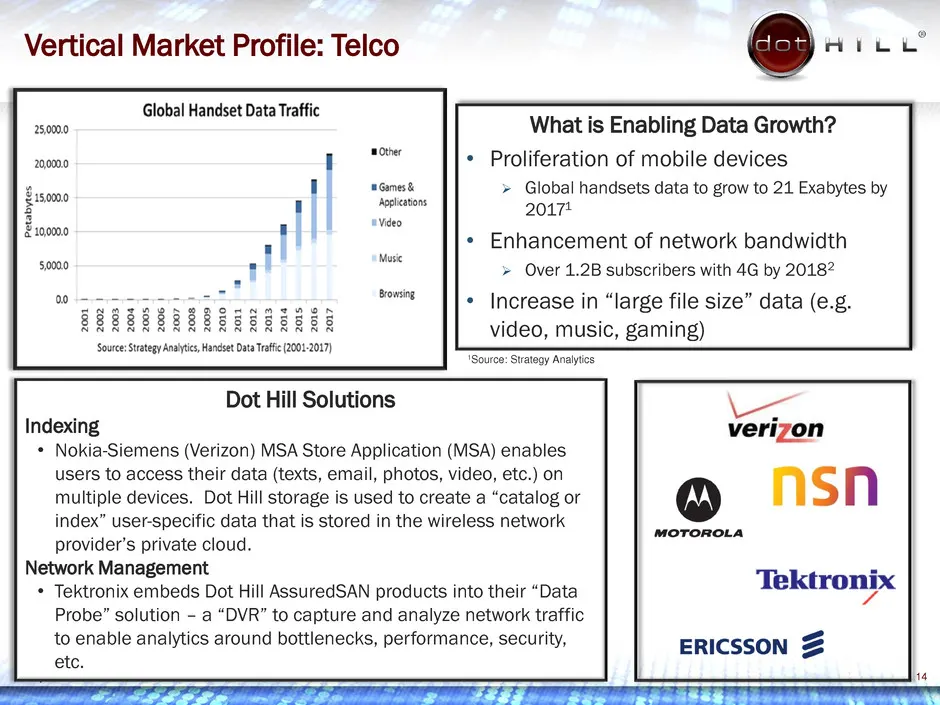
NASDAQ: HILL 14 Vertical Market Profile: Telco May 2014 1Source: Strategy Analytics What is Enabling Data Growth? • Proliferation of mobile devices Global handsets data to grow to 21 Exabytes by 20171 • Enhancement of network bandwidth Over 1.2B subscribers with 4G by 20182 • Increase in “large
Slide 15: Vertical Market Profile: Big Data Analytics
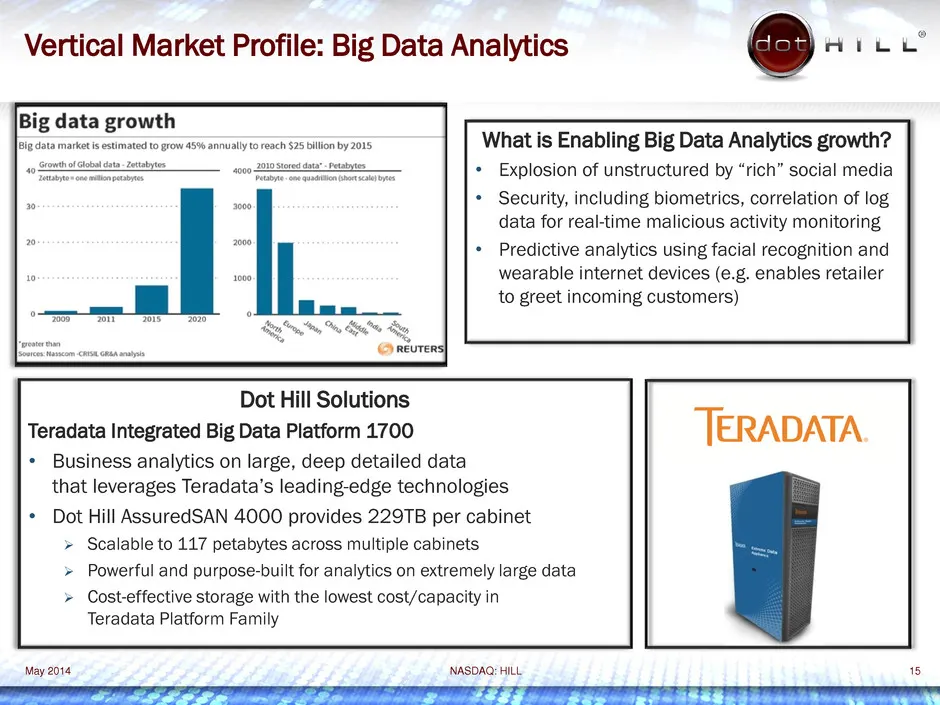
NASDAQ: HILL 15 Vertical Market Profile: Big Data Analytics May 2014 What is Enabling Big Data Analytics growth? • Explosion of unstructured by “rich” social media • Security, including biometrics, correlation of log data for real-time malicious activity monitoring • Predictive analytics using facia
Slide 16: Vertical Market Profile: Media & Entertainment
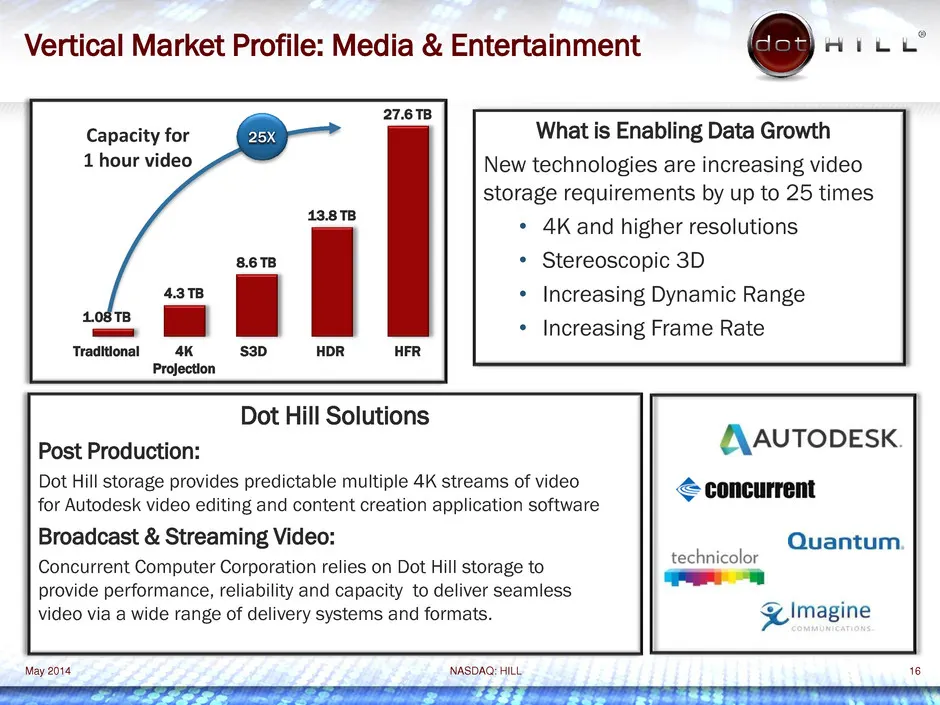
NASDAQ: HILL 16 Vertical Market Profile: Media & Entertainment What is Enabling Data Growth New technologies are increasing video storage requirements by up to 25 times • 4K and higher resolutions • Stereoscopic 3D • Increasing Dynamic Range • Increasing Frame Rate May 2014 1.08 TB Traditional 4.3 T
Slide 17: Expansion to Other Growth Markets
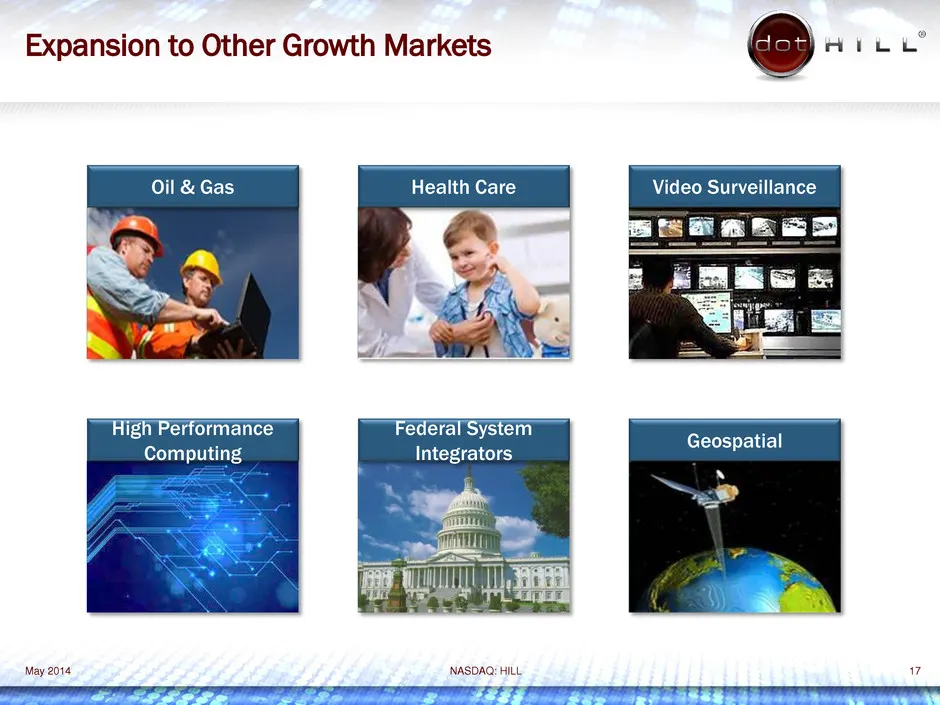
NASDAQ: HILL 17 Expansion to Other Growth Markets May 2014 Health Care Video Surveillance Oil & Gas Geospatial High Performance Computing Federal System Integrators
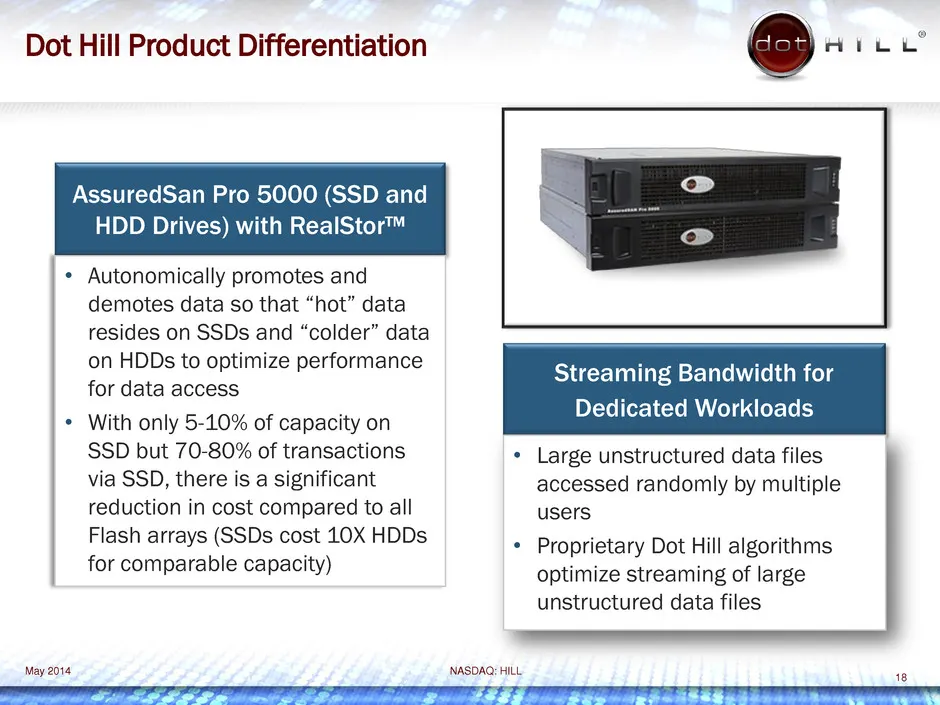
Slide 18: Dot Hill Product Differentiation
NASDAQ: HILL 18 Dot Hill Product Differentiation May 2014 AssuredSan Pro 5000 (SSD and HDD Drives) with RealStor™ Streaming Bandwidth for Dedicated Workloads • Autonomically promotes and demotes data so that “hot” data resides on SSDs and “colder” data on HDDs to optimize performance for data access

Slide 19: Financials and Business Model
NASDAQ: HILL DRIVING GROWTH NASDAQ: HILL Financials and Business Model
Slide 20: About Non-GAAP Financial Measures and Segment Reporting
NASDAQ: HILL 20 About Non-GAAP Financial Measures and Segment Reporting May 2014 Non-GAAP Financial Measures The Company’s non-GAAP financial measures exclude the impact of stock-based compensation expense, legal settlements and associated expenses, intangible asset amortization, restructuring and s
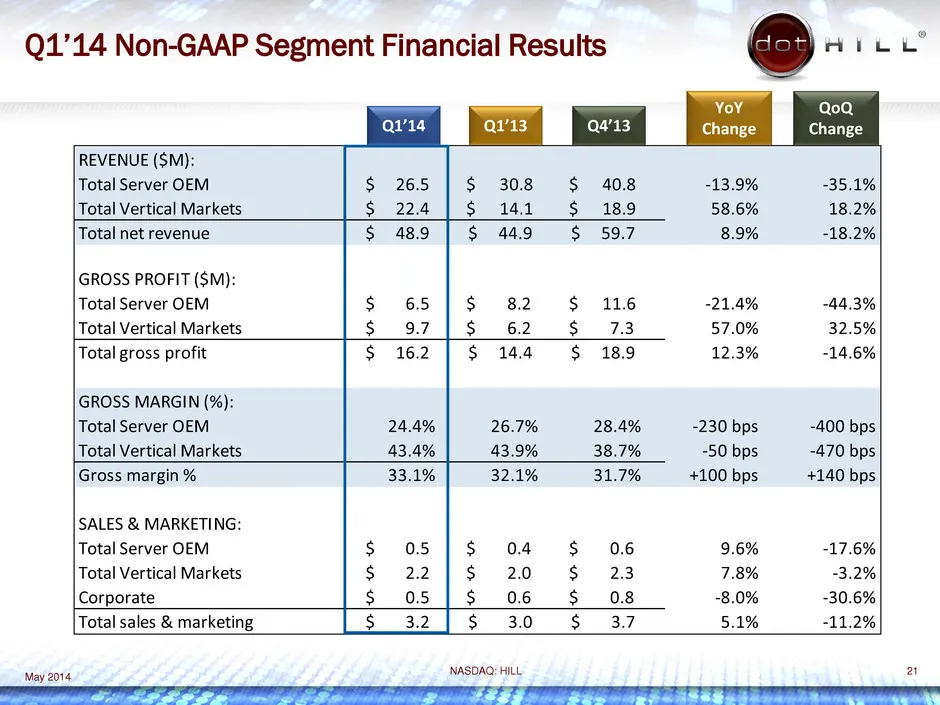
Slide 21: Q1’14 Non-GAAP Segment Financial Results
NASDAQ: HILL 21 Q1’14 Non-GAAP Segment Financial Results May 2014 REVENUE ($M): Total Server OEM 26.5$ $ 30.8 $ 40.8 -13.9% -35.1% Total Vertical Markets 22.4$ $ 14.1 $ 18.9 58.6% 18.2% Total net revenue 48.9$ 44.9$ 59.7$ 8.9% -18.2% GROSS PROFIT ($M): Total Server OEM 6.5$ $ 8.2 $ 11.6 -21.4% -44.3
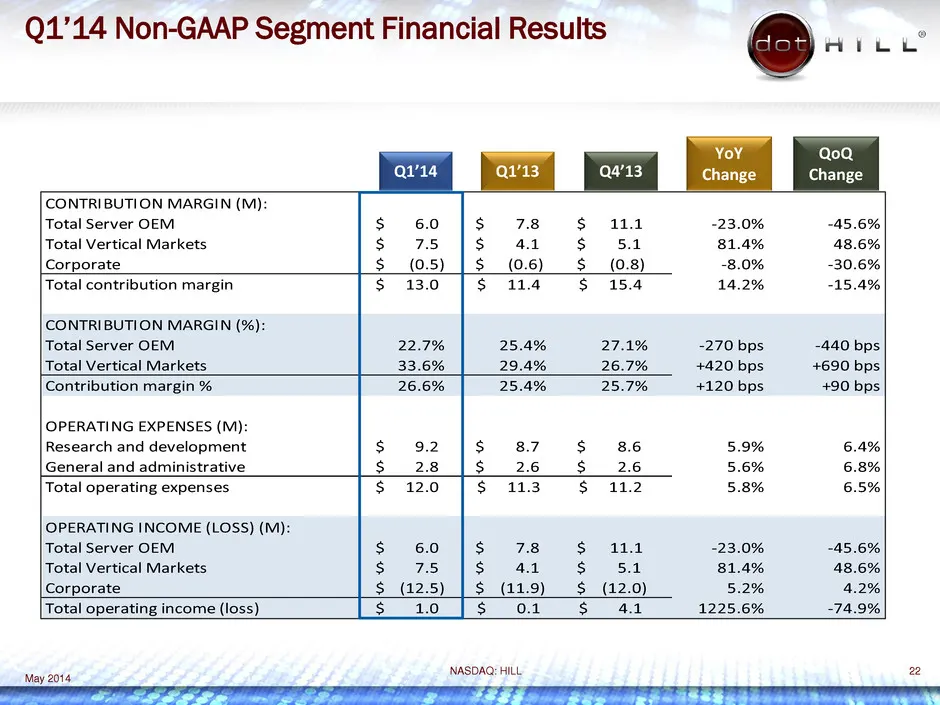
Slide 22: Q1’14 Non-GAAP Segment Financial Results
NASDAQ: HILL 22 Q1’14 Non-GAAP Segment Financial Results May 2014 CONTRIBUTION MARGIN (M): Total Server OEM 6.0$ $ 7.8 $ 11.1 -23.0% -45.6% Total Vertical Markets 7.5$ $ 4.1 $ 5.1 81.4% 48.6% Corporate (0.5)$ $ (0.6) $ (0.8) -8.0% -30.6% Total contribution margin 13.0$ 11.4$ 15.4$ 14.2% -15.4% CONTR
Slide 23: Q2’14 and Full Year 2014 Guidance
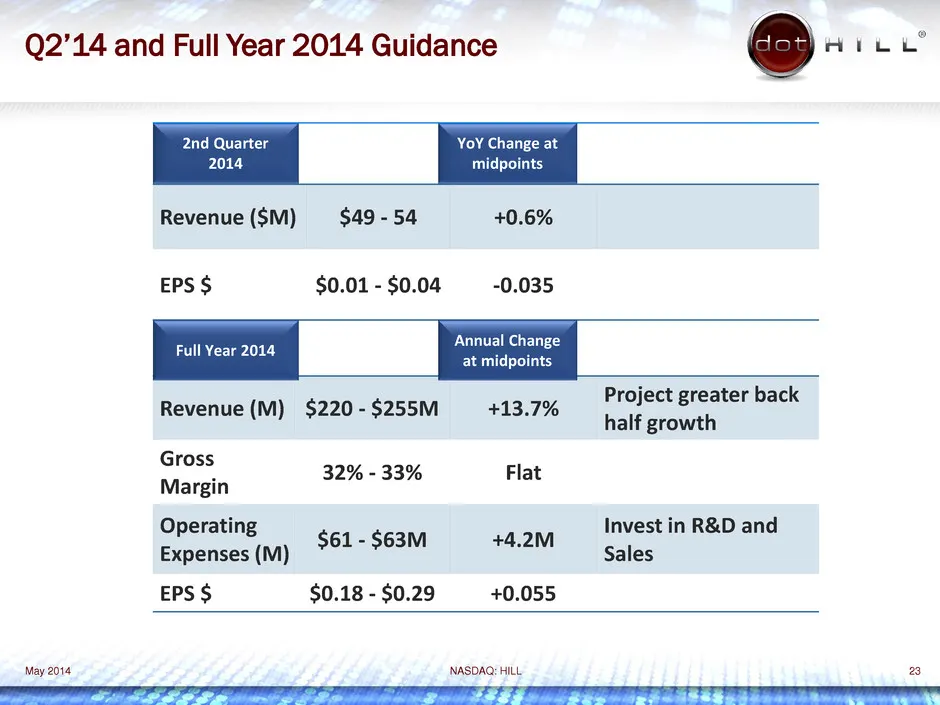
NASDAQ: HILL 23 Q2’14 and Full Year 2014 Guidance Revenue ($M) $49 - 54 +0.6% EPS $ $0.01 - $0.04 -0.035 2nd Quarter 2014 YoY Change at midpoints Revenue (M) $220 - $255M +13.7% Project greater back half growth Gross Margin 32% - 33% Flat Operating Expenses (M) $61 - $63M +4.2M Invest in R&D and Sal
Slide 24: Medium Term Business Goals
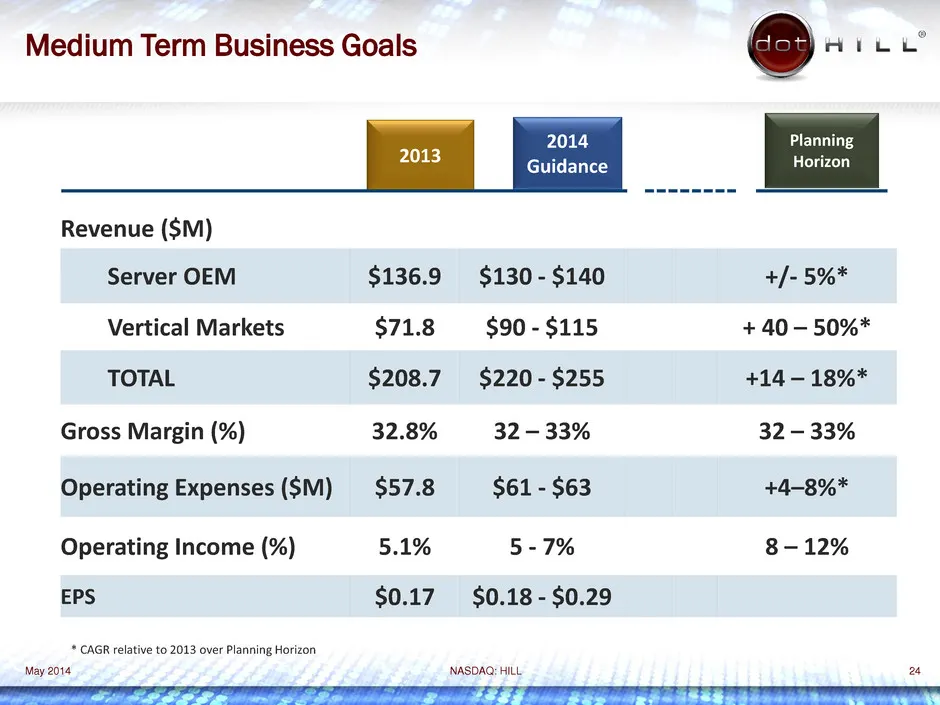
NASDAQ: HILL 24 Medium Term Business Goals Revenue ($M) Server OEM $136.9 $130 - $140 +/- 5%* Vertical Markets $71.8 $90 - $115 + 40 – 50%* TOTAL $208.7 $220 - $255 +14 – 18%* Gross Margin (%) 32.8% 32 – 33% 32 – 33% Operating Expenses ($M) $57.8 $61 - $63 +4–8%* Operating Income (%) 5.1% 5 - 7% 8 –

Slide 25: Appendix I: Reconciliation of GAAP to Non-GAAP Financial Measures
NASDAQ: HILL DRIVING GROWTH NASDAQ: HILL Appendix I: Reconciliation of GAAP to Non-GAAP Financial Measures
Slide 26: Q1’14 GAAP to Non-GAAP Revenue Reconciliation
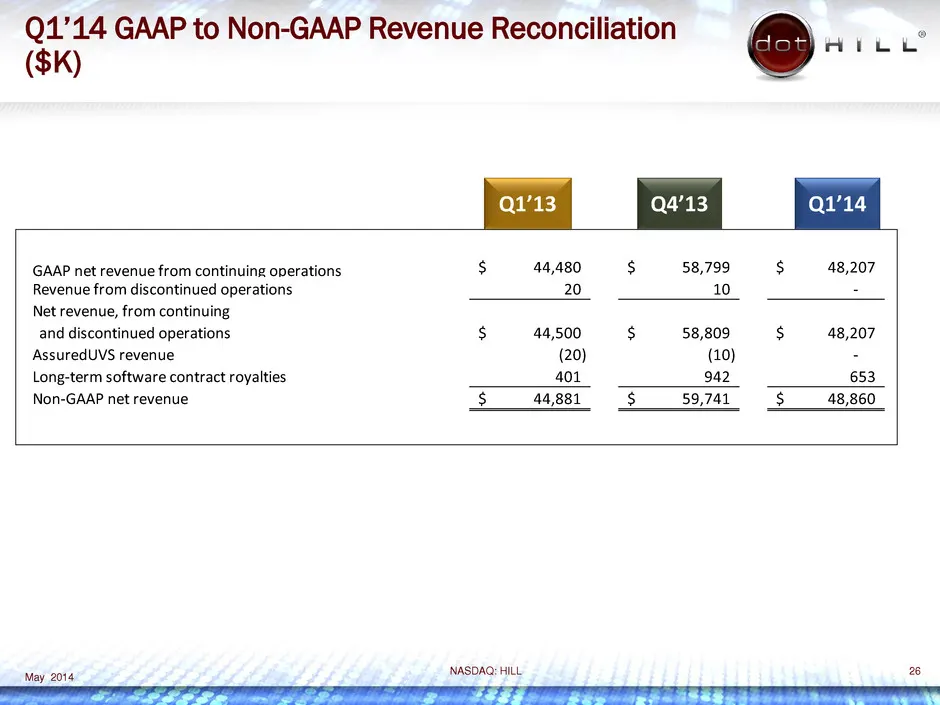
NASDAQ: HILL 26 Q1’14 GAAP to Non-GAAP Revenue Reconciliation ($K) Q1’13 Q4’13 Q1’14 May 2014 GAAP net revenue from continuing operations 44,480$ 58,799$ 48,207$ Revenue from discontinued operations 20 10 - Net revenue, from continuing and discontinued operations 44,500$ 58,809$ 48,207$ AssuredUVS r
Slide 27: Q1’14 GAAP to Non-GAAP Gross Profit Reconciliation
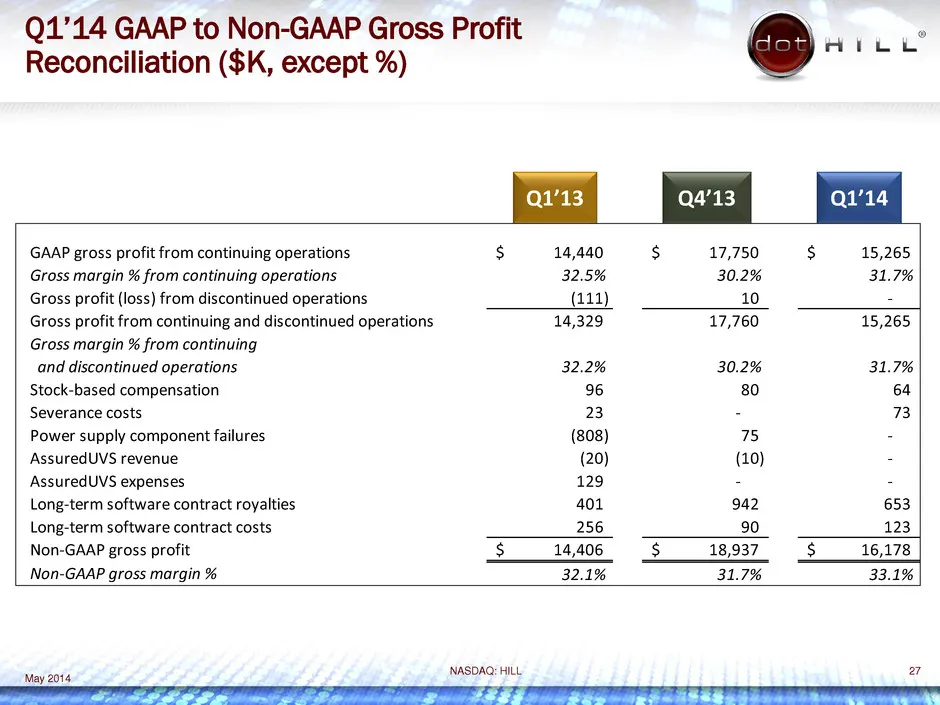
NASDAQ: HILL 27 Q1’14 GAAP to Non-GAAP Gross Profit Reconciliation ($K, except %) Q1’13 Q4’13 Q1’14 May 2014 GAAP gross profit from continuing operations 14,440$ 17,750$ 15,265$ Gross margin % from continuing operations 32.5% 30.2% 31.7% Gross profit (loss) from discontinued operations (111) 10 - Gr
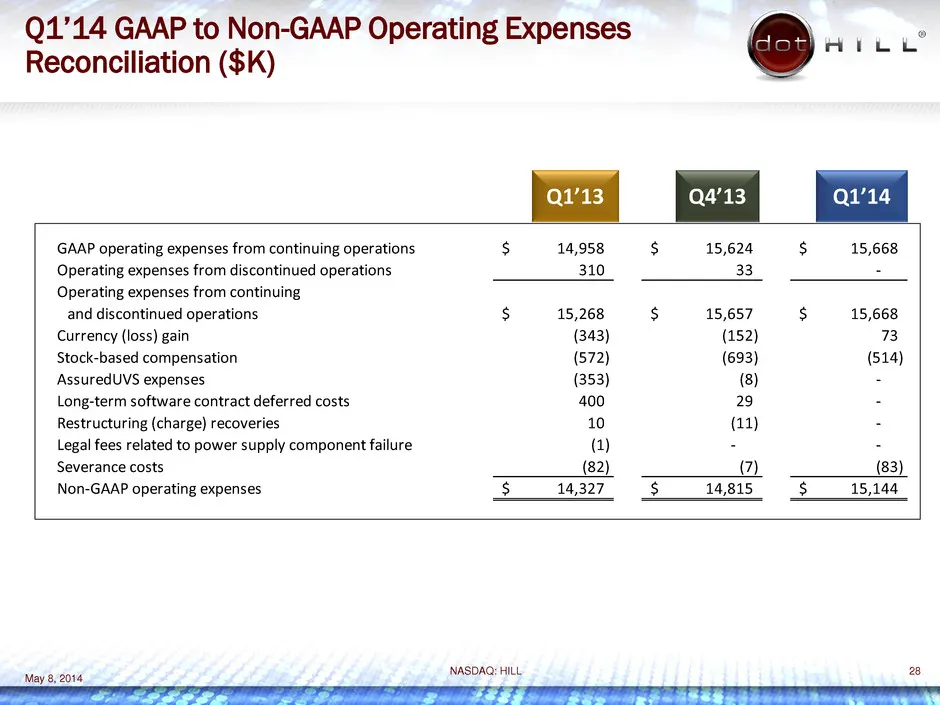
Slide 28: Q1’14 GAAP to Non-GAAP Operating Expenses Reconciliation
NASDAQ: HILL 28 Q1’14 GAAP to Non-GAAP Operating Expenses Reconciliation ($K) Q1’13 Q4’13 Q1’14 May 8, 2014 GAAP operating expenses from continuing operations 14,958$ 15,624$ 15,668$ Operating expenses from discontinued operations 310 33 - Operating expenses from continuing and discontinued operatio
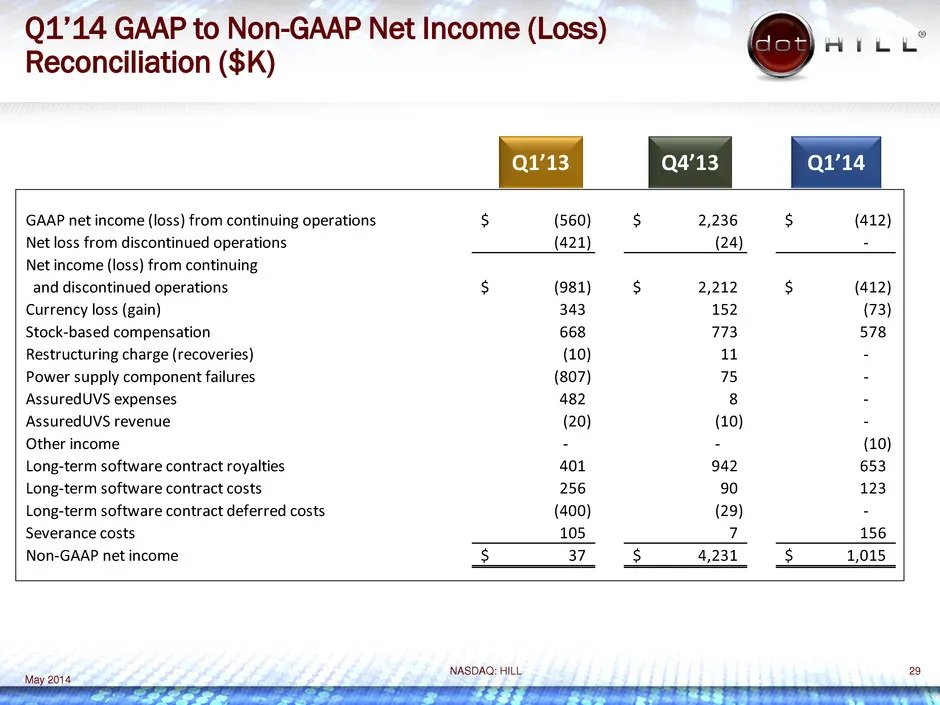
Slide 29: Q1’14 GAAP to Non-GAAP Net Income (Loss) Reconciliation
NASDAQ: HILL 29 Q1’14 GAAP to Non-GAAP Net Income (Loss) Reconciliation ($K) Q1’13 Q4’13 Q1’14 May 2014 GAAP net income (loss) from continuing operations (560)$ 2,236$ (412)$ Net loss from discontinued operations (421) (24) - Net income (loss) from continuing and discontinued operations (981)$ 2,212
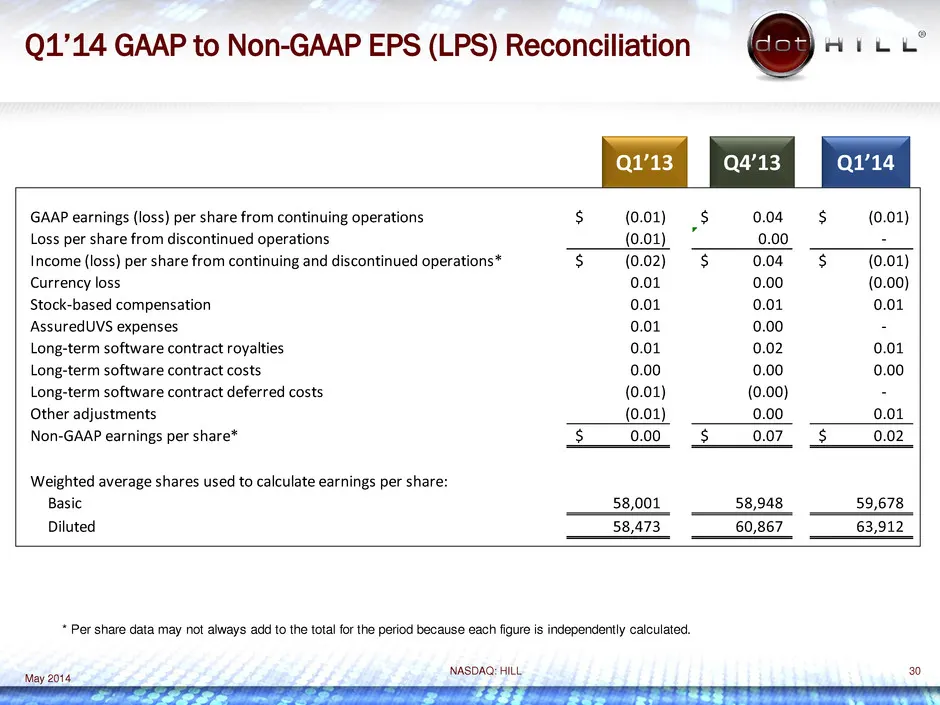
Slide 30: Q1’14 GAAP to Non-GAAP EPS (LPS) Reconciliation
NASDAQ: HILL 30 Q1’14 GAAP to Non-GAAP EPS (LPS) Reconciliation Q1’13 Q4’13 Q1’14 * Per share data may not always add to the total for the period because each figure is independently calculated. May 2014 GAAP earnings (loss) per share from continuing operations (0.01)$ 0.04$ (0.01)$ Loss per share f
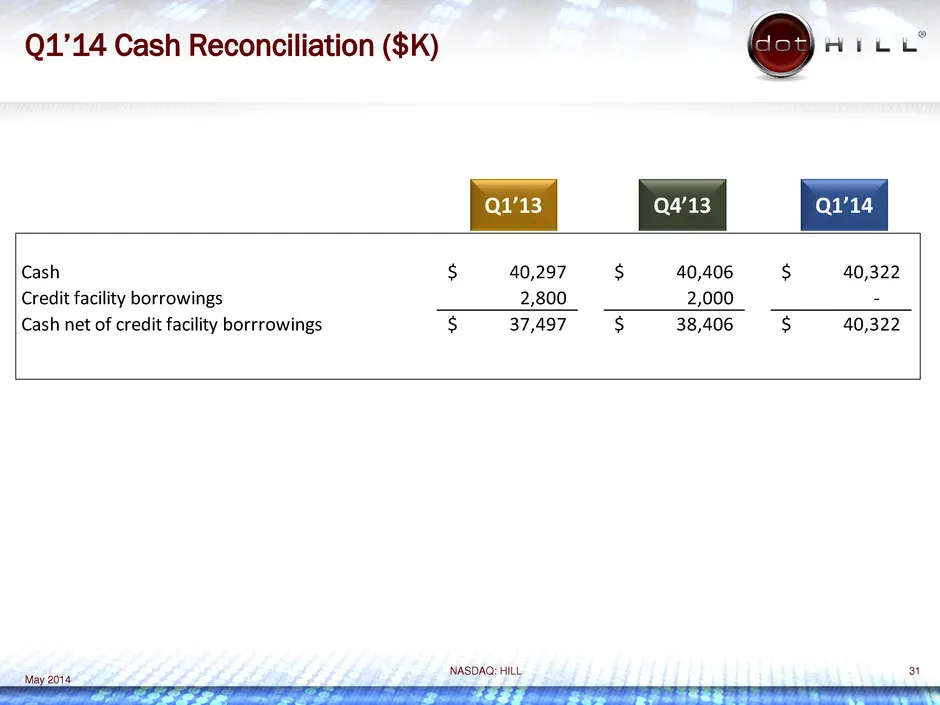
Slide 31: Q1’14 Cash Reconciliation
NASDAQ: HILL 31 Q1’14 Cash Reconciliation ($K) Q1’13 Q4’13 Q1’14 Cash 40,297$ 40,406$ 40,322$ redit facility borrowings 2,800 2,0 0 - Cash net of credit facility borrrowings 37,497$ 38,406$ 40,322$ May 2014
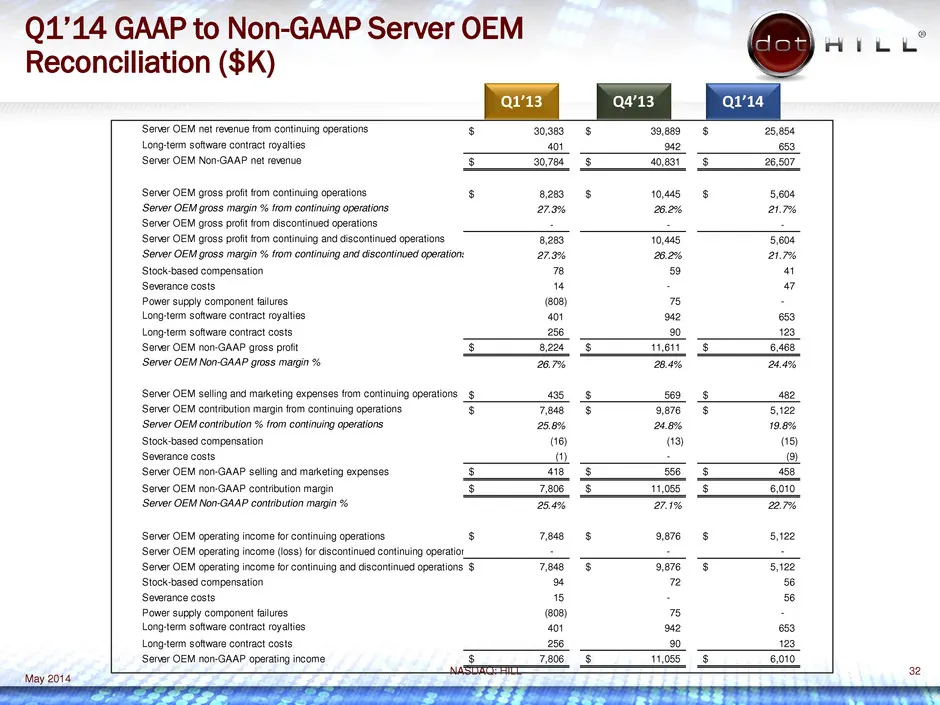
Slide 32: Q1’14 GAAP to Non-GAAP Server OEM Reconciliation
NASDAQ: HILL 32 Q1’14 GAAP to Non-GAAP Server OEM Reconciliation ($K) Q1’13 May 2014 Q4’13 Q1’14 Server OEM net revenue from continuing operations 30,383$ 39,889$ 25,854$ Long-term software contract royalties 401 942 653 Server OEM Non-GAAP net revenue 30,784$ 40,831$ 26,507$ Server OEM gross profit
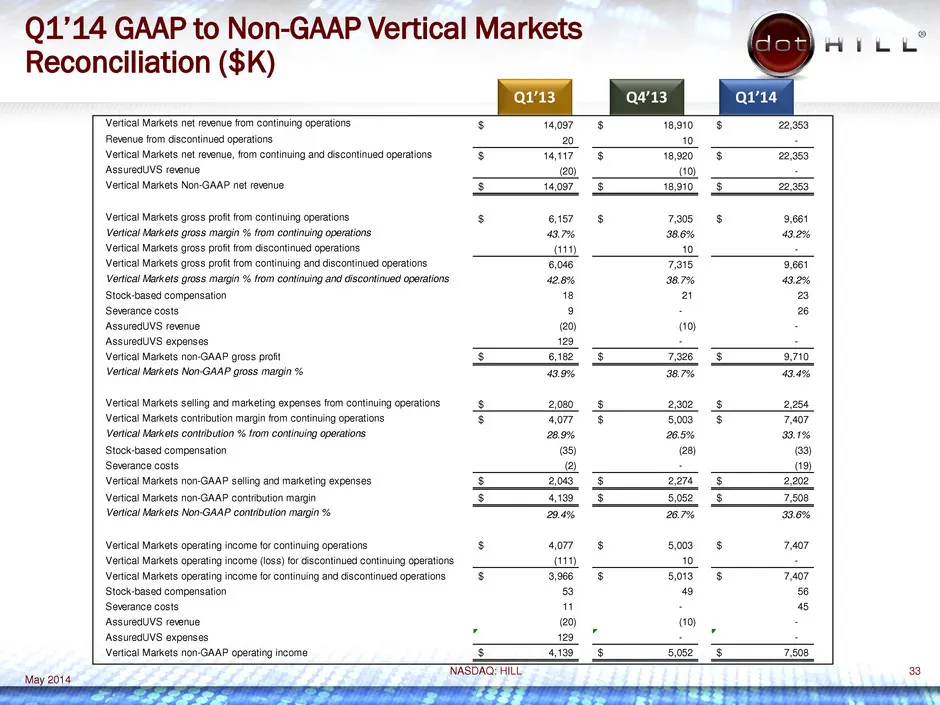
Slide 33: Q1’14 GAAP to Non-GAAP Vertical Markets Reconciliation
NASDAQ: HILL 33 Q1’14 GAAP to Non-GAAP Vertical Markets Reconciliation ($K) Q1’13 May 2014 Q4’13 Q1’14 Vertical Markets net revenue from continuing operations 14,097$ 18,910$ 22,353$ Revenue from discontinued operations 20 10 - Vertical Markets net revenue, from continuing and discontinued operation
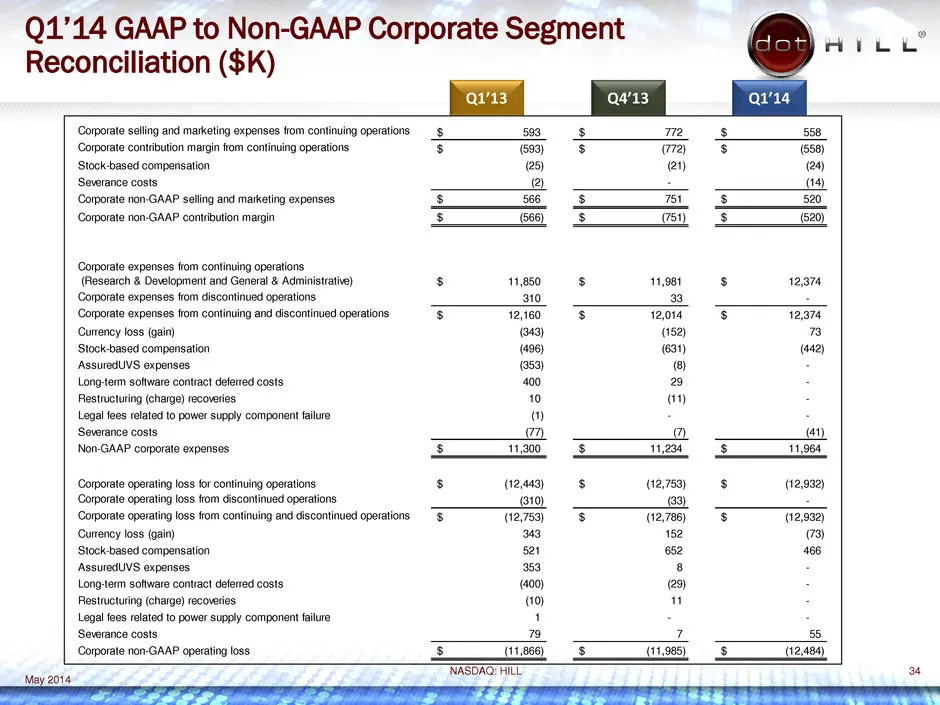
Slide 34: Q1’14 GAAP to Non-GAAP Corporate Segment Reconciliation
NASDAQ: HILL 34 Q1’14 GAAP to Non-GAAP Corporate Segment Reconciliation ($K) Q1’13 May 2014 Q4’13 Q1’14 Corporate selling and marketing expenses from continuing operations 593$ 772$ 558$ Corporate contribution margin from continuing operations (593)$ (772)$ (558)$ Stock-based compensation (25) (21)
Slide 35: March 2014
NASDAQ: HILL 35 March 2014
Source: SEC EDGAR · 8-K filed May 19, 2014
More decks from Dot Hill Systems Corp
 Q2 2015 Earnings Presentation27 slides · Aug 6, 2015
 Investor Presentation (May 2015)58 slides · May 12, 2015
 Q1 2015 Earnings Presentation13 slides · May 7, 2015
 Investor Presentation (March 2015)15 slides · Mar 5, 2015
 Investor Presentation (January 2015)49 slides · Jan 12, 2015
 Investor Presentation (November 2014)47 slides · Nov 10, 2014