American Railcar Industries Inc
American Railcar Industries — Investor Presentation (February 2017)
24 slides from American Railcar Industries's investor presentation, Feb 8, 2017
Slide 1
Slide 2: Forward Looking Disclaimer
Forward Looking Disclaimer ‘Safe Harbor Statement Oe ee a en en ne are ss cate is sat Icahn, our pine dick ‘repurchase program o / and the ownershi Pu piincpal Bor neficial stockholder through IELP, Me. Ca eahn; Pea cat Gai te CTA een erence and aie ata ‘heeds of and production Capebies ‘environment
Slide 3: ARI — Successful and Diversified Business Model
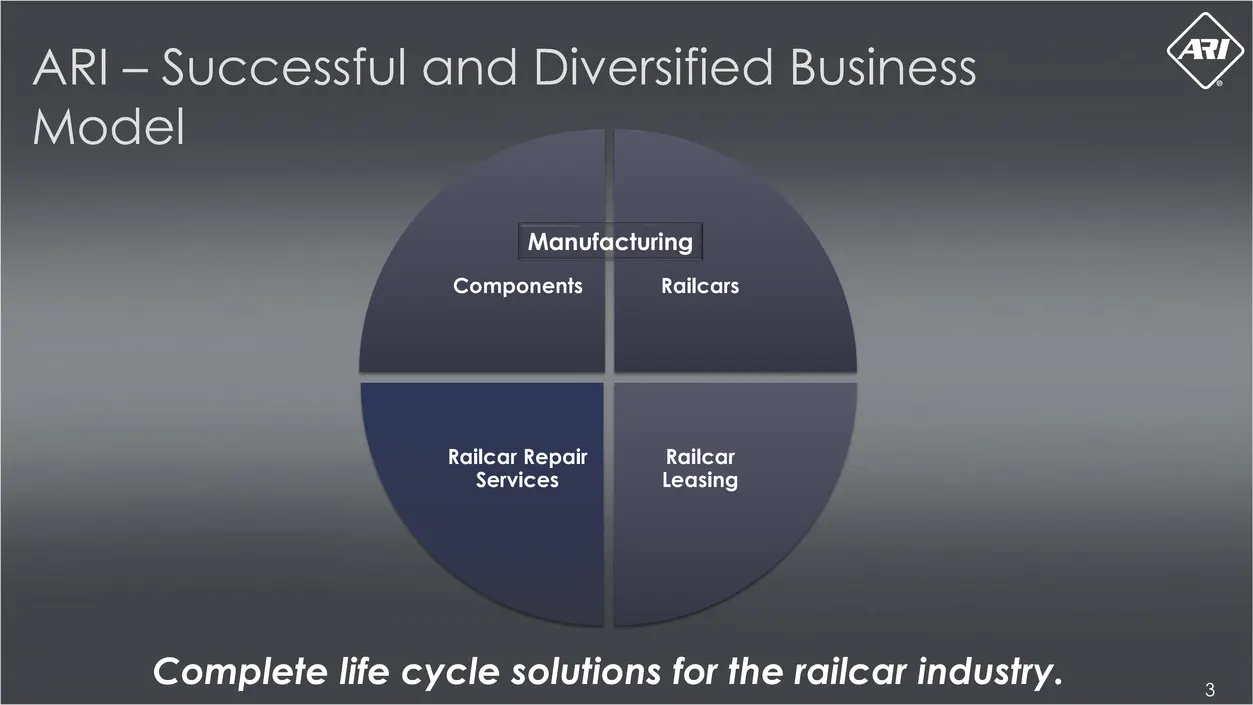
ARI — Successful and Diversified Business Model Manufacturing Components Railcars Railcar Repair Railcar ervices Leasing Complete life cycle solutions for the railcar industry.
Slide 4: ARI Locations
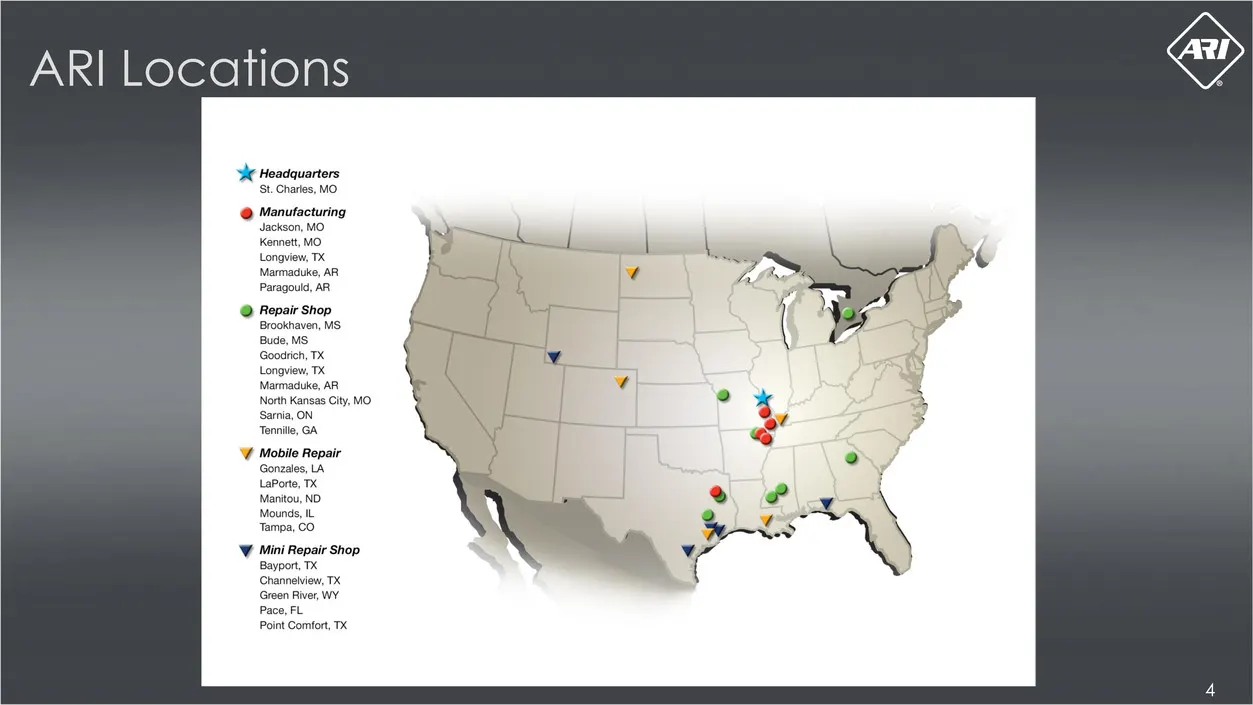
ARI Locations We Headquarters pagsohale @ Menutocturing ‘acaon tcnat a Conon Narmacuke AA Pago A Longview, ‘Marmaduke, AR ‘North Kansas City, MO ‘Sarnia, ON Pace, FL. Point Comfort, TX
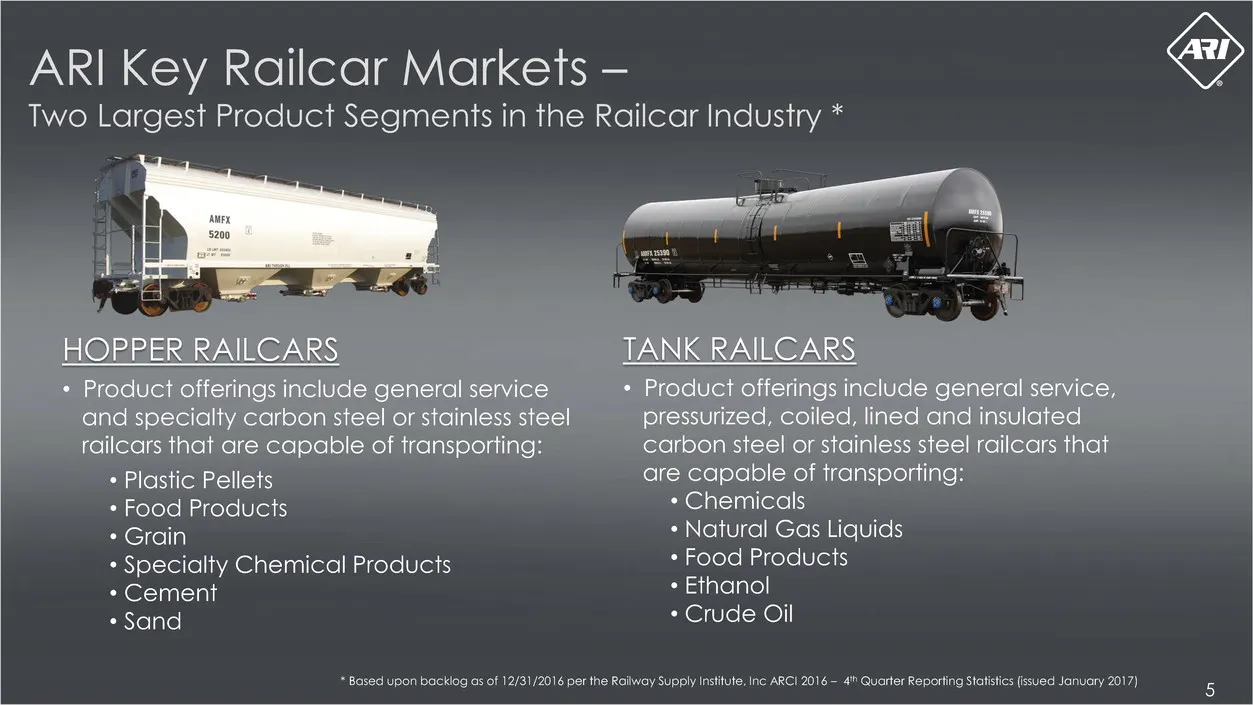
Slide 5: ARI Key Railcar Markets — Two Largest Product Segments
ARI Key Railcar Markets — Two Largest Product Segments in the Railcar Industry * HOPPER RAILCARS TANK RAILCARS * Product offerings include general service * Product offerings include general service, and specialty carbon steel or stainless steel pressurized, coiled, lined and insulated railcars that
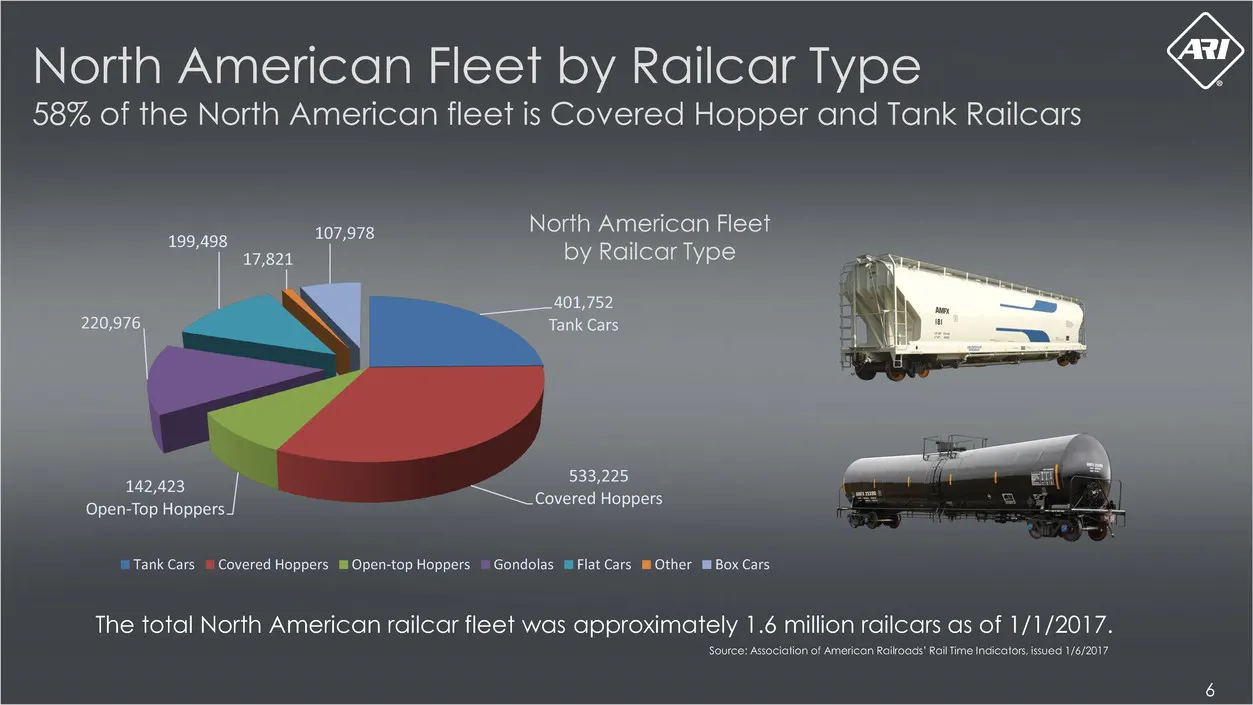
Slide 6: North American Fleet by Railcar Type
North American Fleet by Railcar Type > 58% of the North American fleet is Covered Hopper and Tank Railcars 142,423 Open-Top Hoppers. j= Tank Cars “Covered Hoppers ™Open-top Hoppers Gondolas mFlat Cars mOther m Box Cars The total North American railcar fleet was approximately 1.6 million railcars as
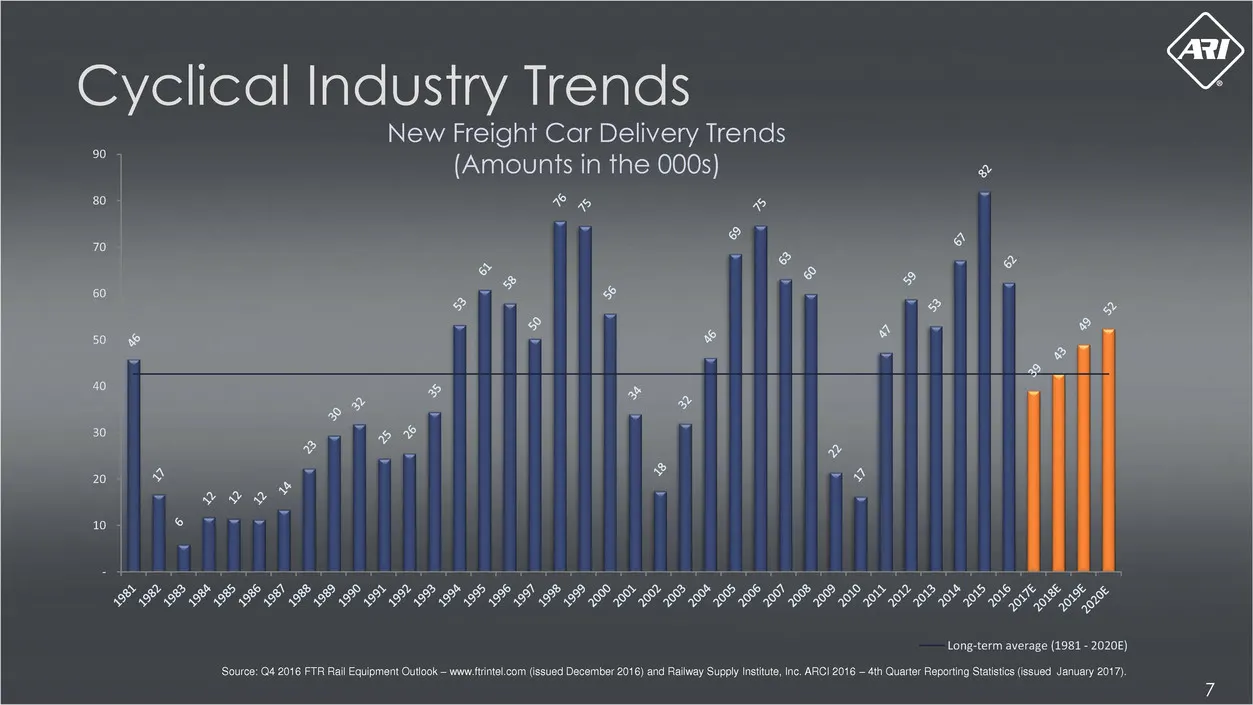
Slide 7: Cyclical Industry Trends
Cyclical Industry Trends New Freight Car Delivery Trends es (Amounts in the 000s) FILLIES ILI SILI EIS IPE SS PSF LFS FPP PP PP PP MM TS Long-term average (1981 - 2020) January 2017),
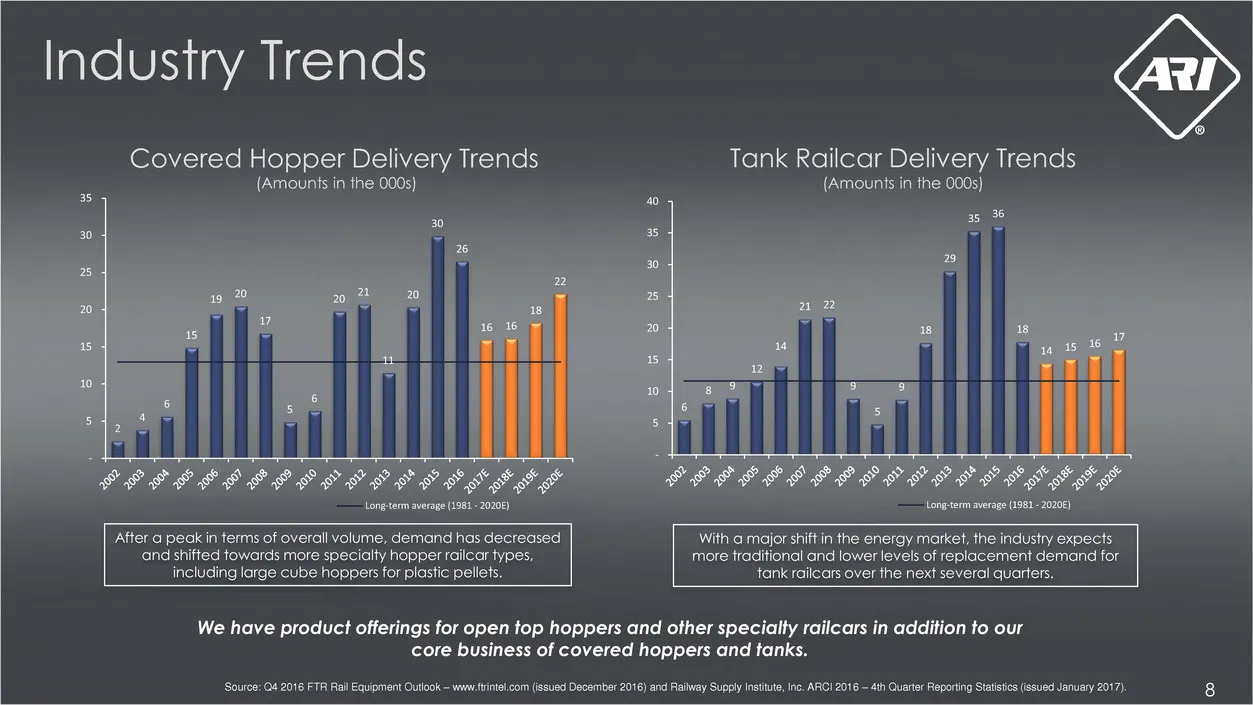
Slide 8: Industry Trends
Industry Trends Covered Hopper Delivery Trends Tank Railcar Delivery Trends (Amounts in the 000s) (Amounts in the 000s) Long-term average (1981 - 20208) After a peak in terms of overall volume, demand has decreased With a major shift in the energy market, the industry aged and shifted i per railcar
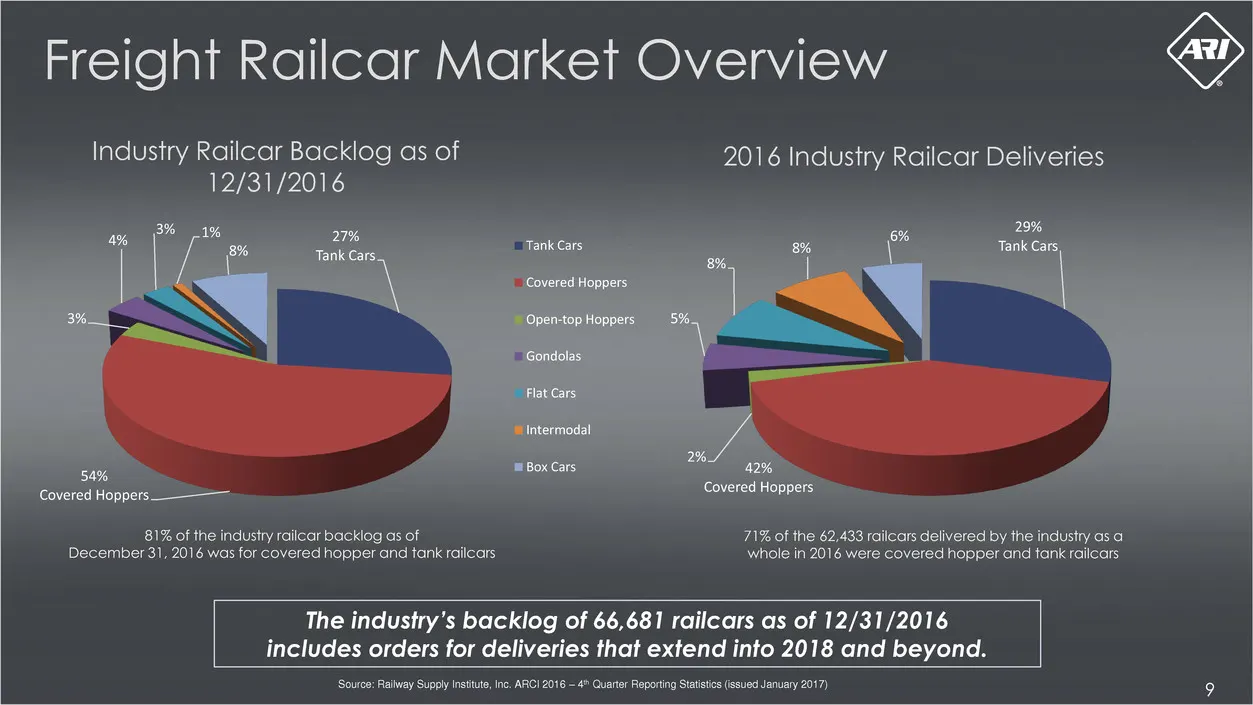
Slide 9: Freight Railcar Market Overview
Freight Railcar Market Overview Industry Railcar Backlog as of 2016 Industry Railcar Deliveries 12/31/2016 ppers____—— 81% of the industry railcar backlog as of 71% of the 62, December 31, 2016 was for covered hopper and tank railcars whole in 2016 were covered hopper and tank railcars The industry'
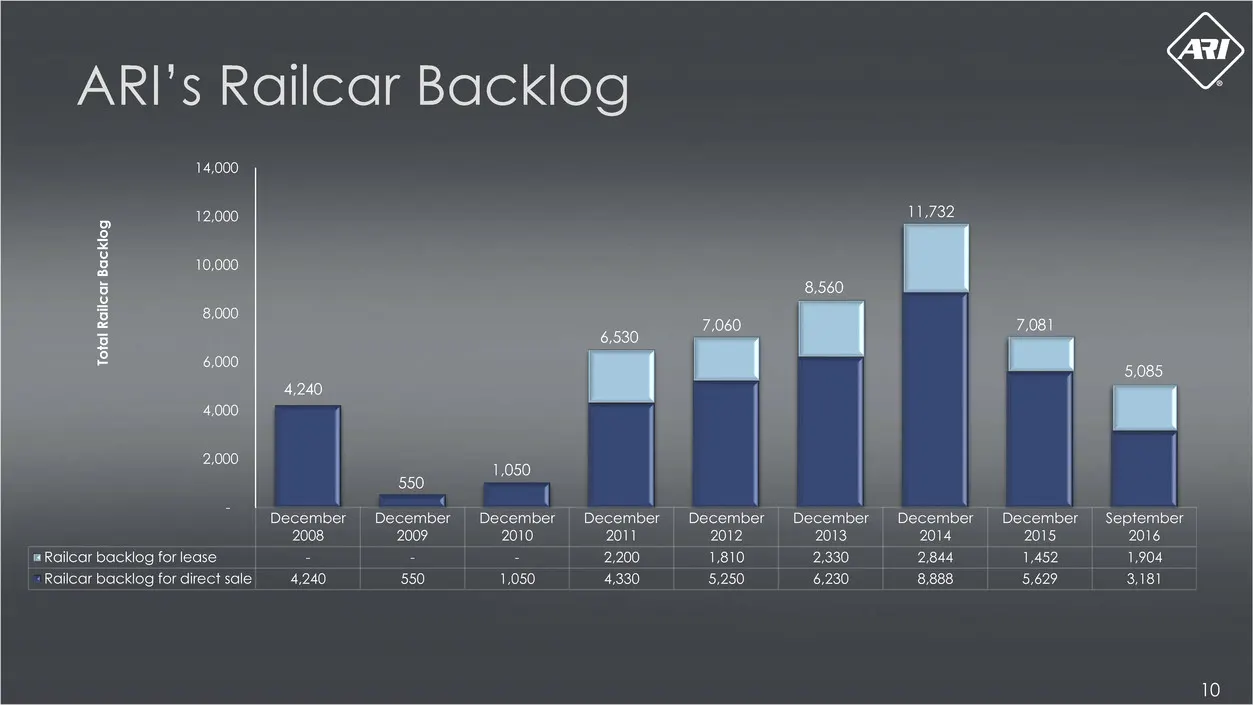
Slide 10: ARI’s Railcar Backlog
ARI’s Railcar Backlog 14,000 . = a a = December | December | December | December | December | December | December | December | September 2008 2009 2010 2011 2012 2013 2014 2015 2016 | - | : 2,200 1810 2.330 | 284d. | __ 4.330 5,250 |mRailcar backlog for lease - _ + Railcar backlog for direct sale 4,
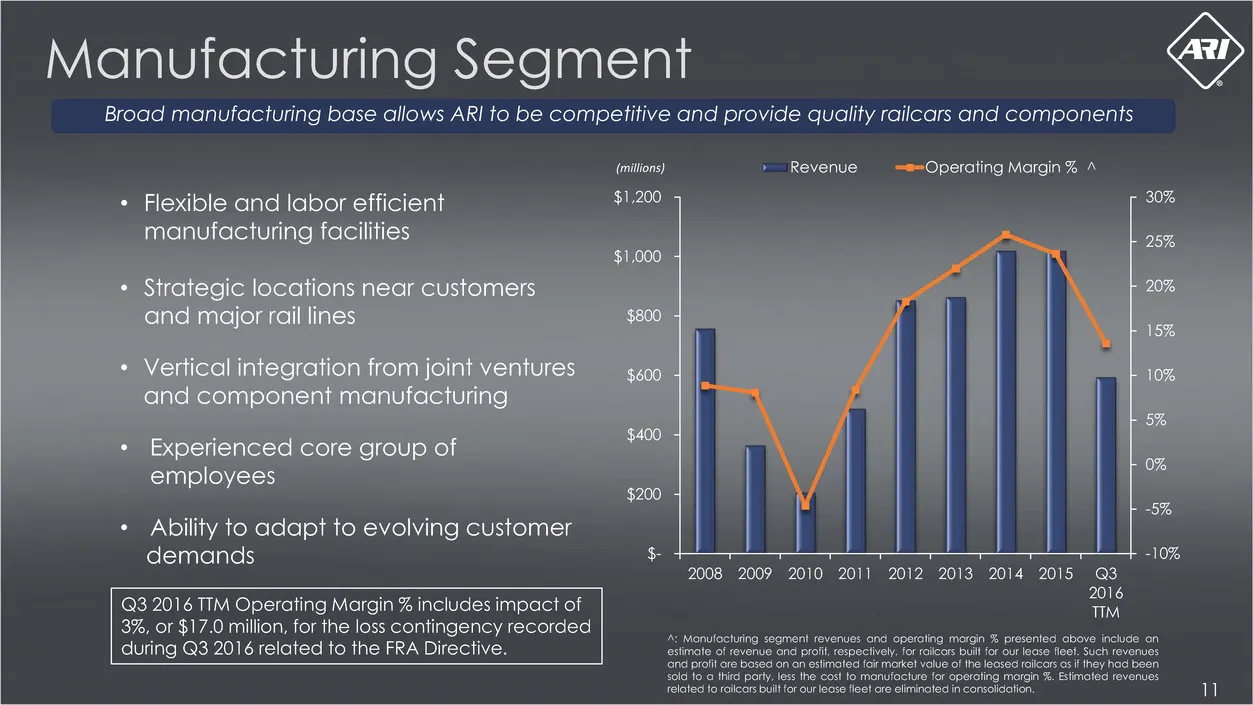
Slide 11: Manufacturing Segment
Manufacturing Segment Broad manufacturing base allows ARI to be competitive and provide quality railcars and components (milions) » Revenue ="=Operating Margin % . flexible and labor efficient ee + Ability to adapt to evolving customer demands 2008 2009 2010 2011 2012 2013 2014 2015 @3 2016 Q3 2016
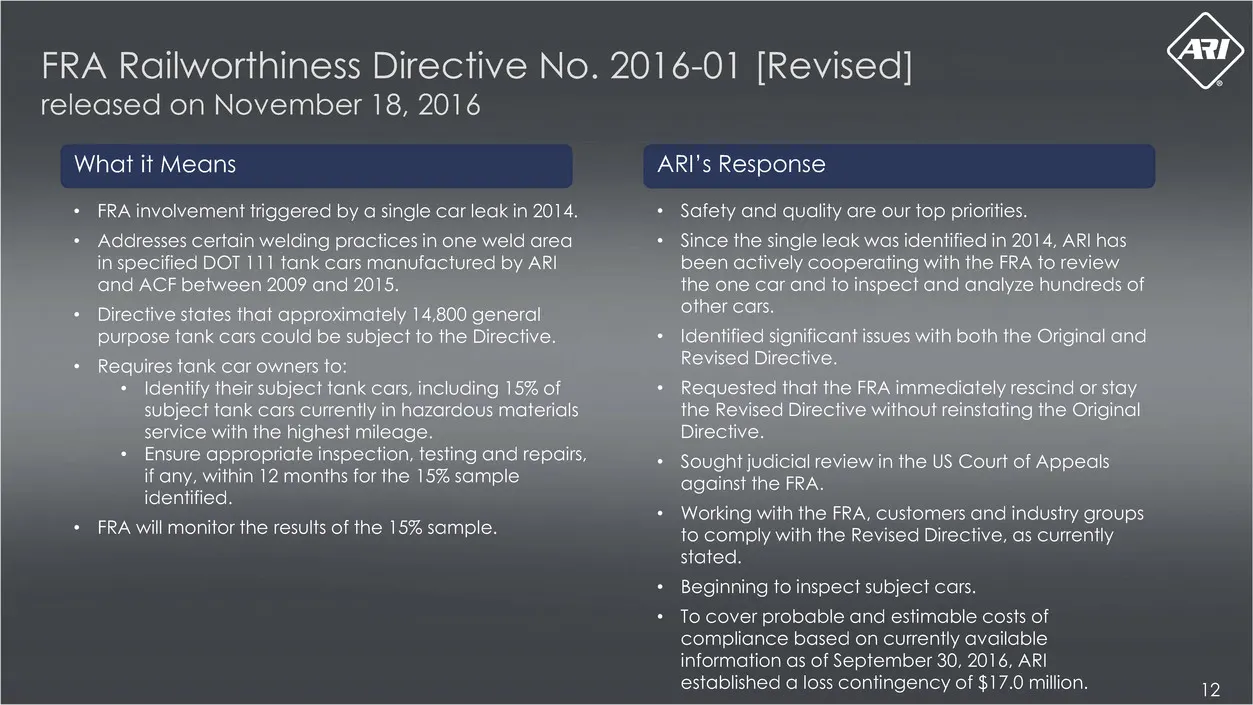
Slide 12: FRA Railworthiness Directive No. 2016-01 [Revised]
FRA Railworthiness Directive No. 2016-01 [Revised] released on November 18, 2016 What it Means + FRA involvement triggered by a single car leak in 2014. iny, within 1: identified. + FRA will monitor the results of the 15% sample. ARI's Response + Safety and qualita are our io priorities. wercing wit
Slide 13: Railcar Leasing Segment
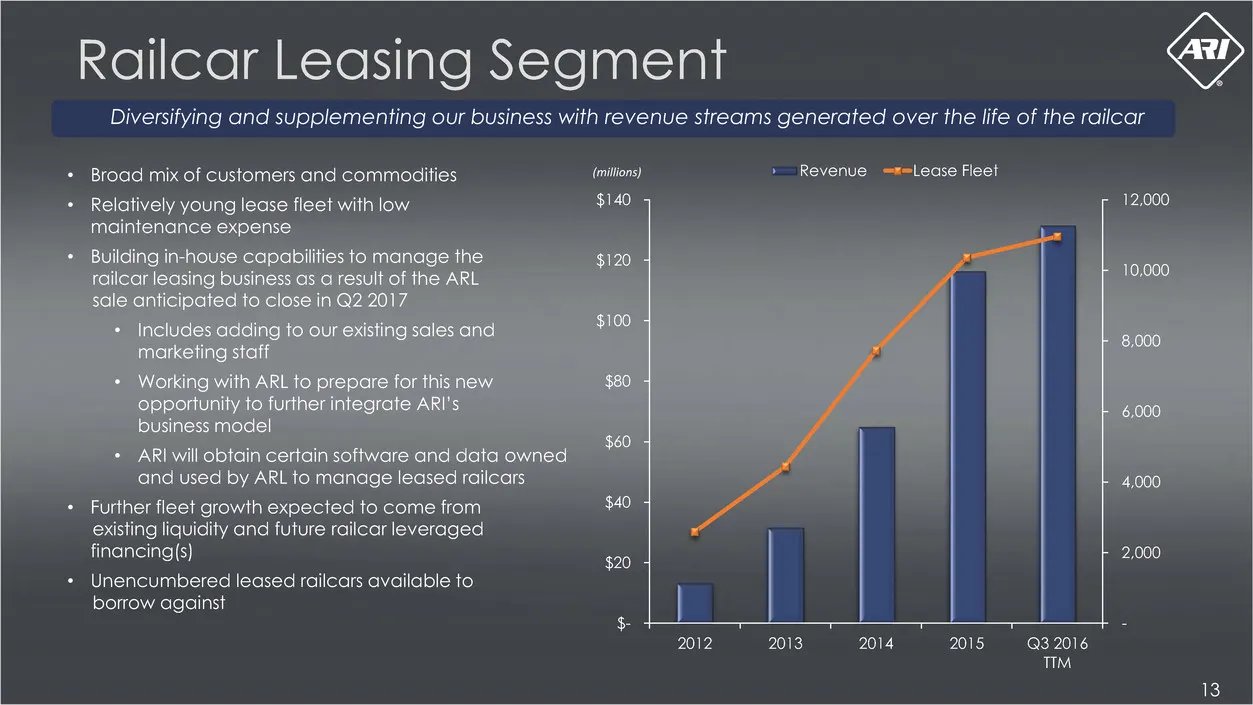
Railcar Leasing Segment Diversifying and supplementing our business with revenue streams generated over the life of the railcar : ish mix of customers and commodities (millions) » Revenue =*=Lease Fleet lease fleet with low 3140) + Further fleet growth expected to come from existing liquidity and fu
Slide 14: Railcar Services Segment
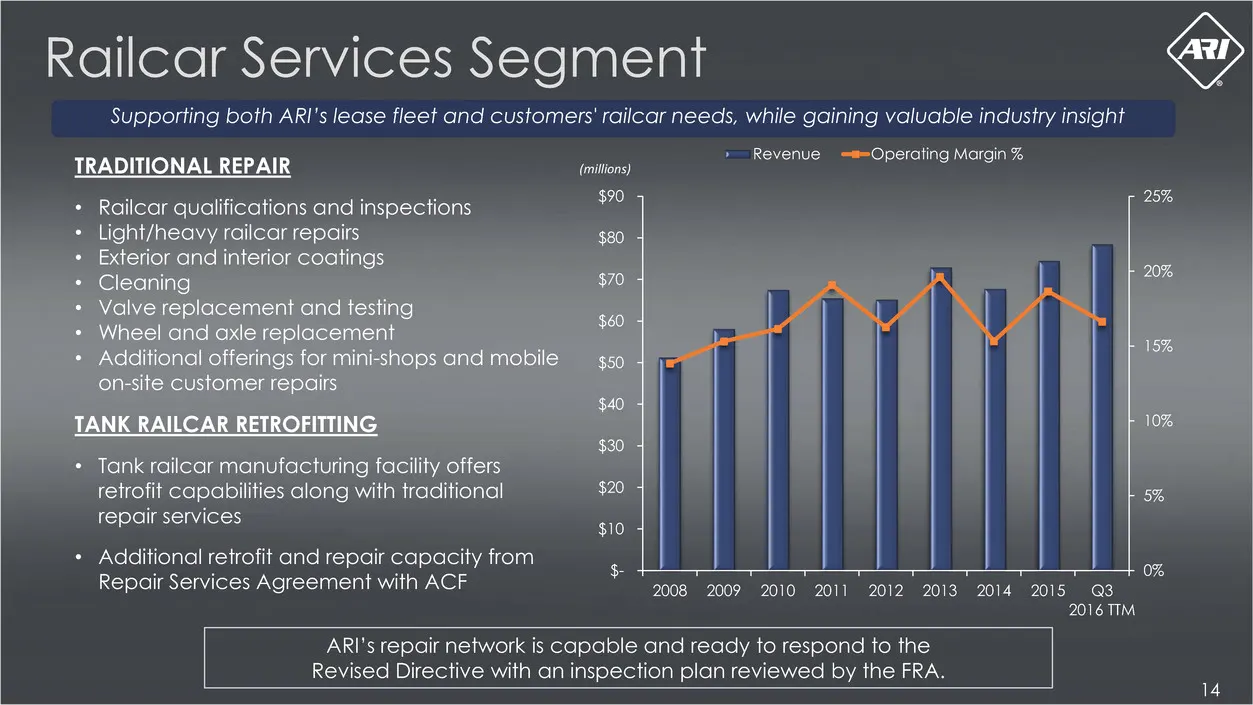
Railcar Services Segment Supporting both ARI's lease fleet and customers’ railcar needs, while gaining valuable industry insight > Re Oj ting Margin % TRADITIONAL REPAIR (mitions So Railcar qualifications and inspections S20 repair services Additional retrofit and repair capacity from Repair Service
Slide 15: Growth and Cost Reduction Initiatives
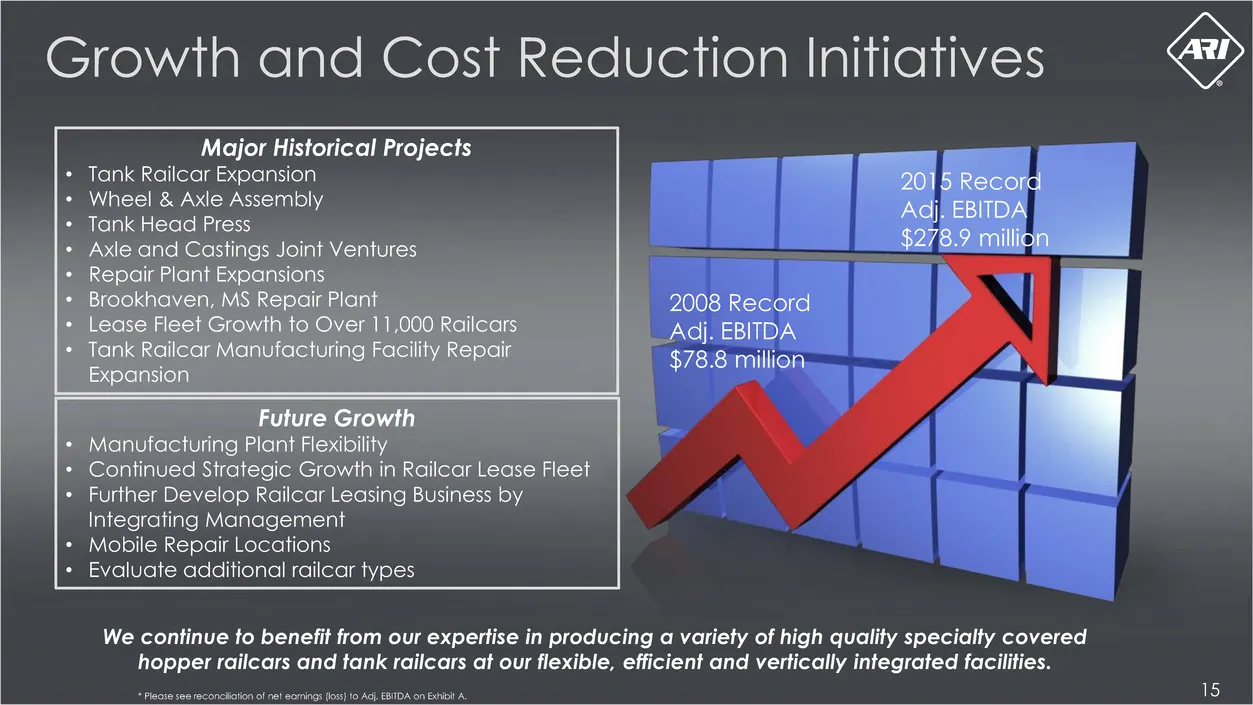
Growth and Cost Reduction Initiatives & Major Historical Projects Tank Railcar Expansion Wheel & Axle Assembly Tank Head Press Axle and Castings Joint Ventures Repair Plant Expansions Brookhaven, MS Repair Plant Lease Fleet Growth to Over 11,000 Railcars Tank Railcar Manufacturing Facility Repair Ex
Slide 16: Objectives and Long-Term Strategies
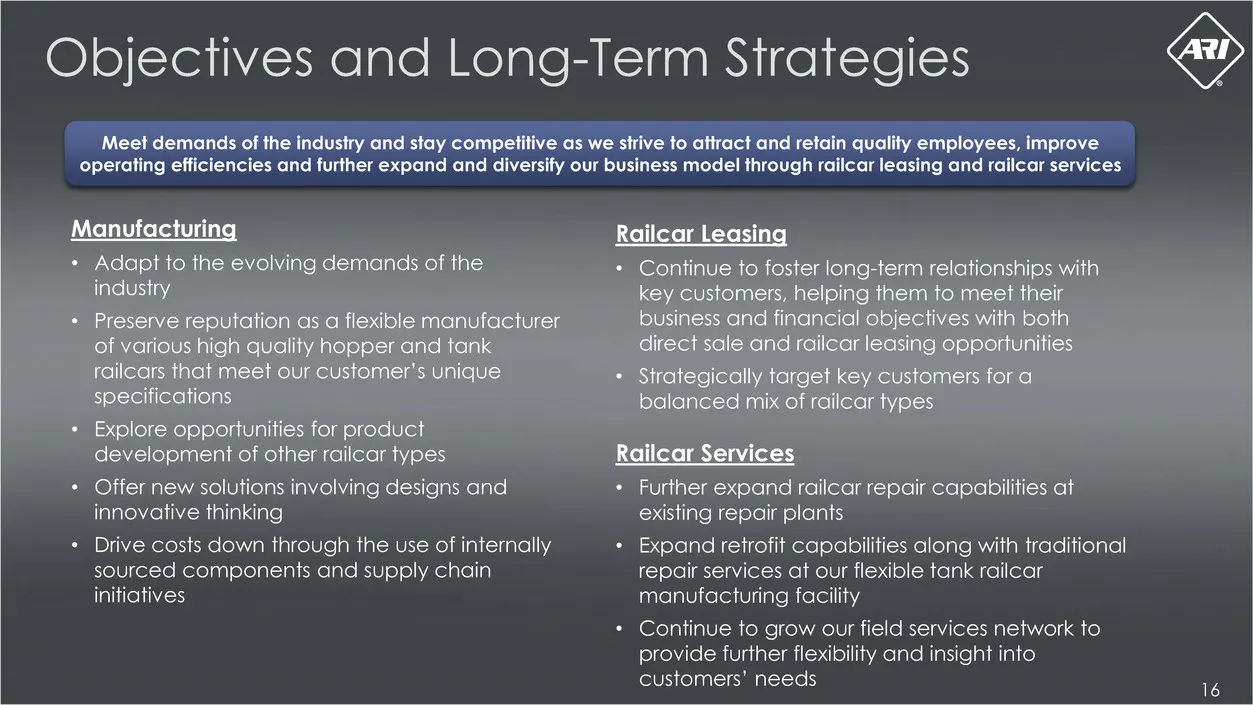
Objectives and Long-Term Strategies & Meet demands of the industry and stay competitive as we strive to attract and retain quality employees, improve operating efficiencies and further expand and diversify our business model through railcar leasing and railcar services Manufacturing Railcar Leasing
Slide 17: Strong Financial Profile
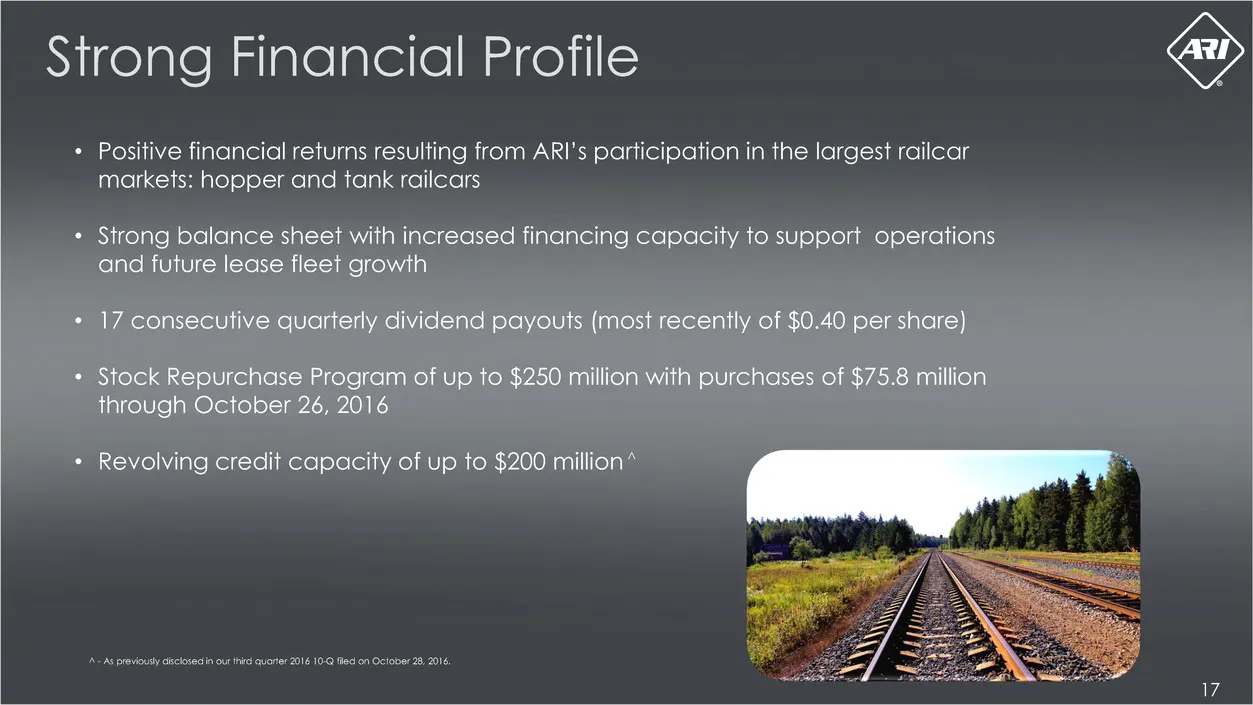
Strong Financial Profile + Positive financial returns resulting from ARI's participation in the largest railcar markets: hopper and tank railcars
Slide 18: Our Financial History
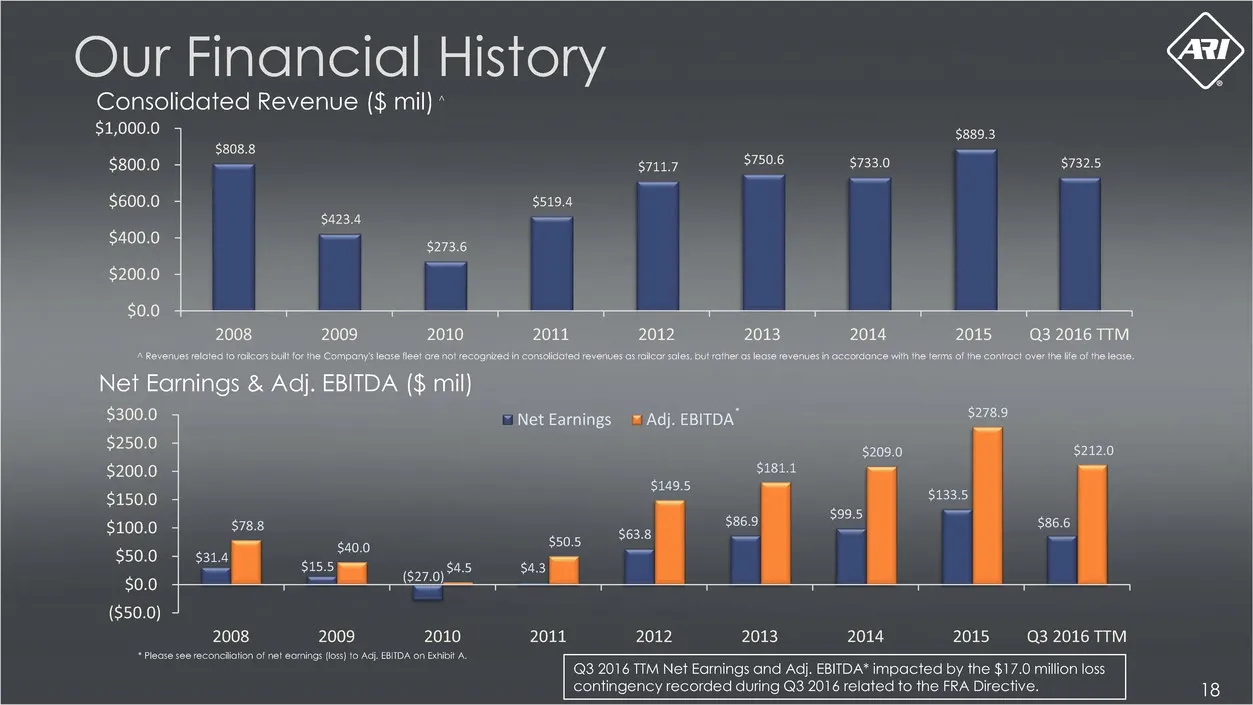
Our Financial History Consolidated Revenue ($ mil) * $1,000.0 $800.0 — l . $733.0 $600.0 2011 2012 2013 2014 2015 Q3 2016 TIM 3 2016 TIM Net Eamings and Ad}, EBITDA" impacted by the al a a milion loss the FRA Dire
Slide 19: Our Financial History (continued)
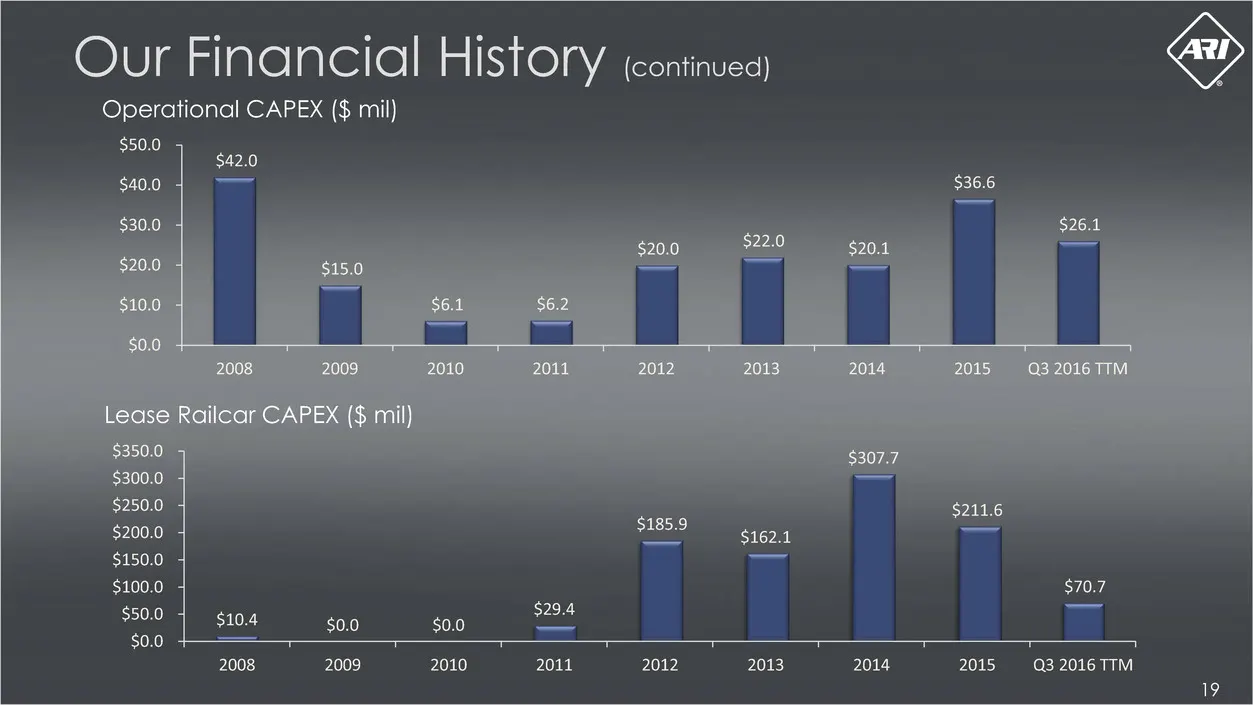
Our Financial History (continued) Operational CAPEX ($ mil) $50.0 $40.0 $70.7 2014 2015 Q3 2016 TIM
Slide 20: Quarterly Financial Comparison
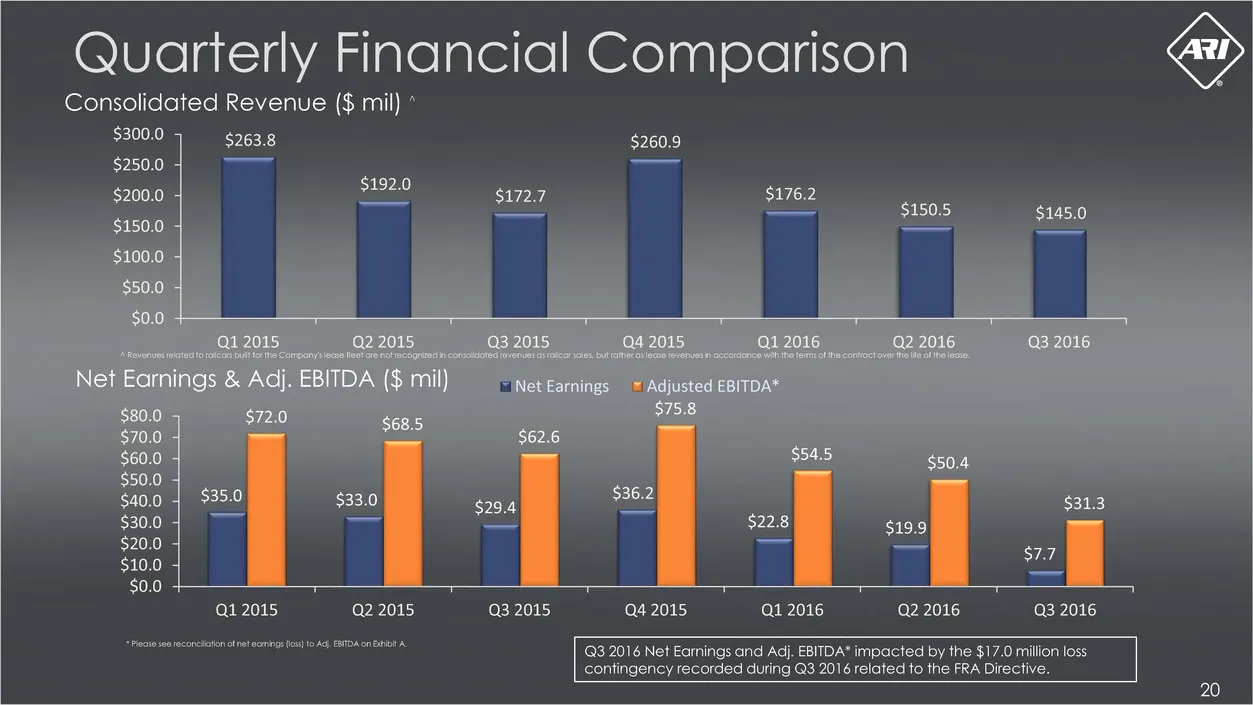
Quarterly Financial Comparison Consolidated Revenue ($ mil) $300.0 $250.0 $200.0 $150.0 $100.0 $50.0 $0.0 $263.8 $192.0 $172.7 $260.9 $176.2 $150.5 $145.0 Qi 2015 Q2 2015 Q3 2015 Net Earni Ings & Adj. EBITDA ($ mil) $72.0 $68.5 $35.0 $33.0 a4 2015 Qi 2016 Q2 2016 Net Earnings = ees EBITDA* $62.6 $29
Slide 21: Quarterly Financial Comparison (continued)
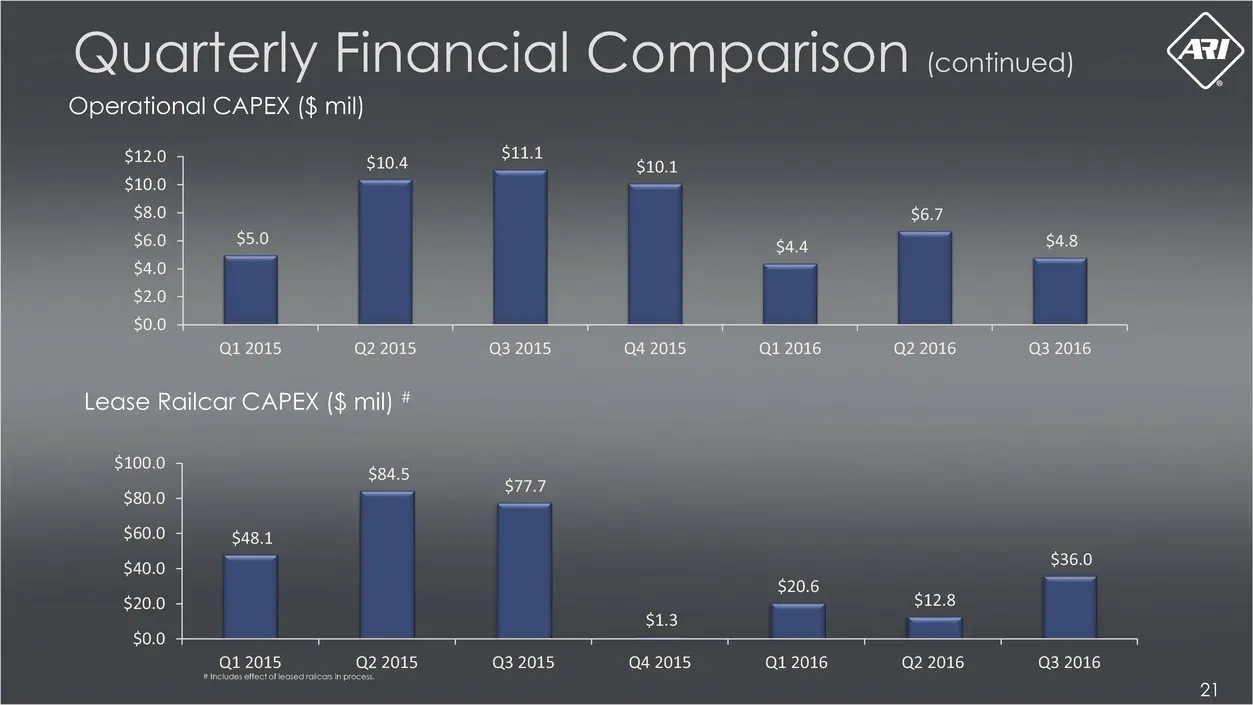
Quarterly Financial COMpaTrison (continued) ey Operational CAPEX ($ mil) $10.4 i $48.1 ae s128 $1.3 —, Qi 2015 Q2 2015 Q3 2015 Q4 2015 Qi 2016 Q2 2016 + incites oct cteciearotcan in proces
Slide 22: Exhibit A — Adj. EBITDA Reconciliation
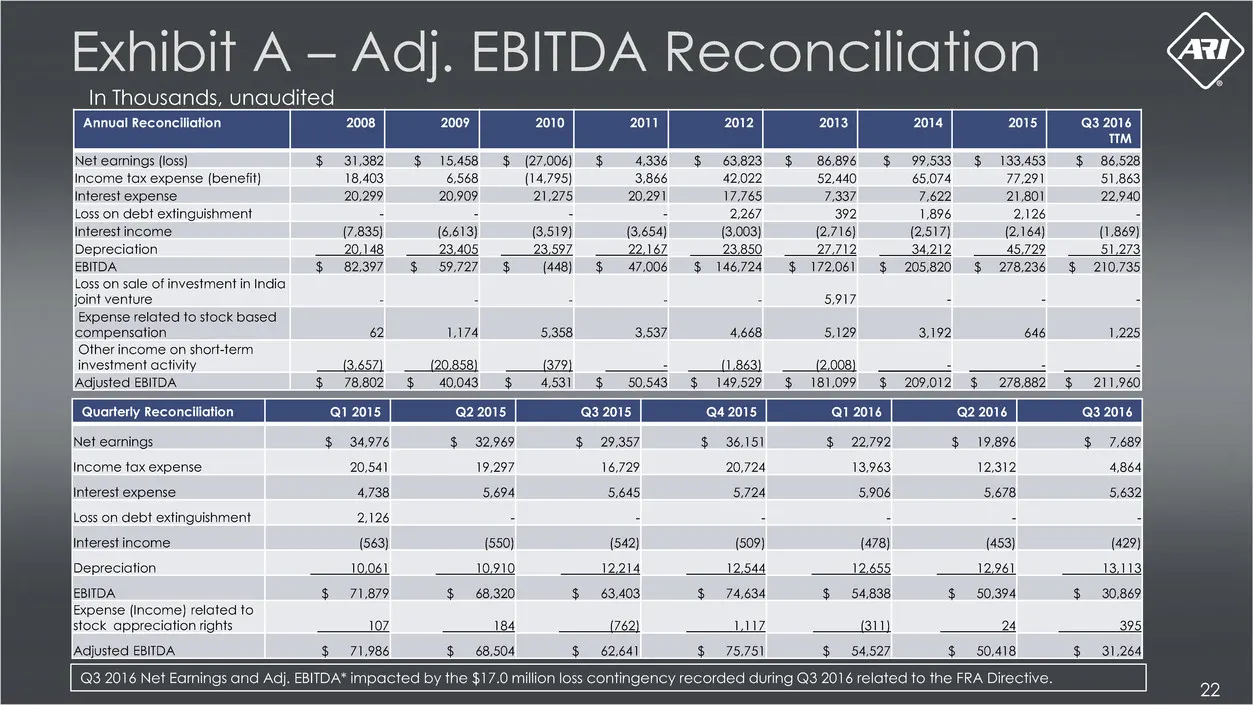
Exhibit A — Adj. EBITDA Reconciliation In Thousands, unaudited Annual Reconciliation 2009 2011 = ‘eamings (loss) $ 31382 $ 15.458 $ (27,008) $ 4,336 $63,823 z B $133,453 ome tax ex; tani (benefit) 0: 6,568 (14.795) 3,866 7.291 ema ¥ 20,909 21,275 20.291 Loss pac SreRIngiinment - - - - Interest incom
Slide 23: Exhibit A — Adj. EBITDA Reconciliation
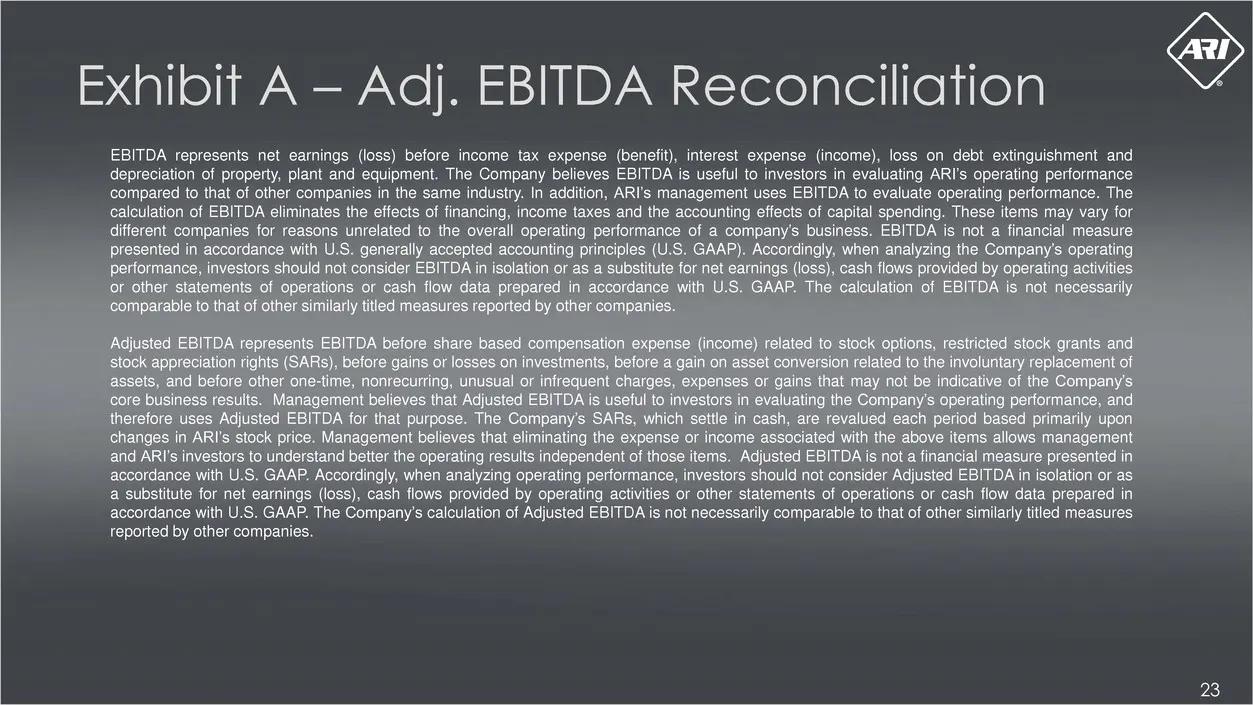
Exhibit A — Adj. EBITDA Reconciliation EBITDA represents net eamings (loss) sain Income tax expense (benef), interest expense (Income), loss on debt CIEE and depreciation of property, plant and equipment. The Company believes EBITDA is useful to investors in evaluating ARI’s operating mance that of
Slide 24: A Tradition of Industry Leadership
A Tradition of Industry Leadership
Source: SEC EDGAR · 8-K filed Feb 8, 2017
More decks from American Railcar Industries Inc
 Q3 2018 Earnings Presentation19 slides · Oct 30, 2018
 Investor Presentation (August 2018)26 slides · Aug 24, 2018
 Q2 2018 Earnings Presentation19 slides · Aug 1, 2018
 Q1 2018 Earnings Presentation18 slides · May 1, 2018
 Q4 2017 Earnings Presentation19 slides · Feb 23, 2018
 Cowen conference 201824 slides · Feb 6, 2018