Arvind SmartSpaces Ltd. · NSE:ARVSMART
Arvind SmartSpaces — Investor Presentation (November 2026)
41 slides from Arvind SmartSpaces's investor presentation, November 2026

Slide 1: Institutionalising Growth. Delivering Value.
ALVIAD SMARTSPACES INSTITUTIONALISING GROWTH. DELIVERING VALUE. CORPORATE PRESENTATION NOVEMBER 2026 www.arvindsmartspaces.com
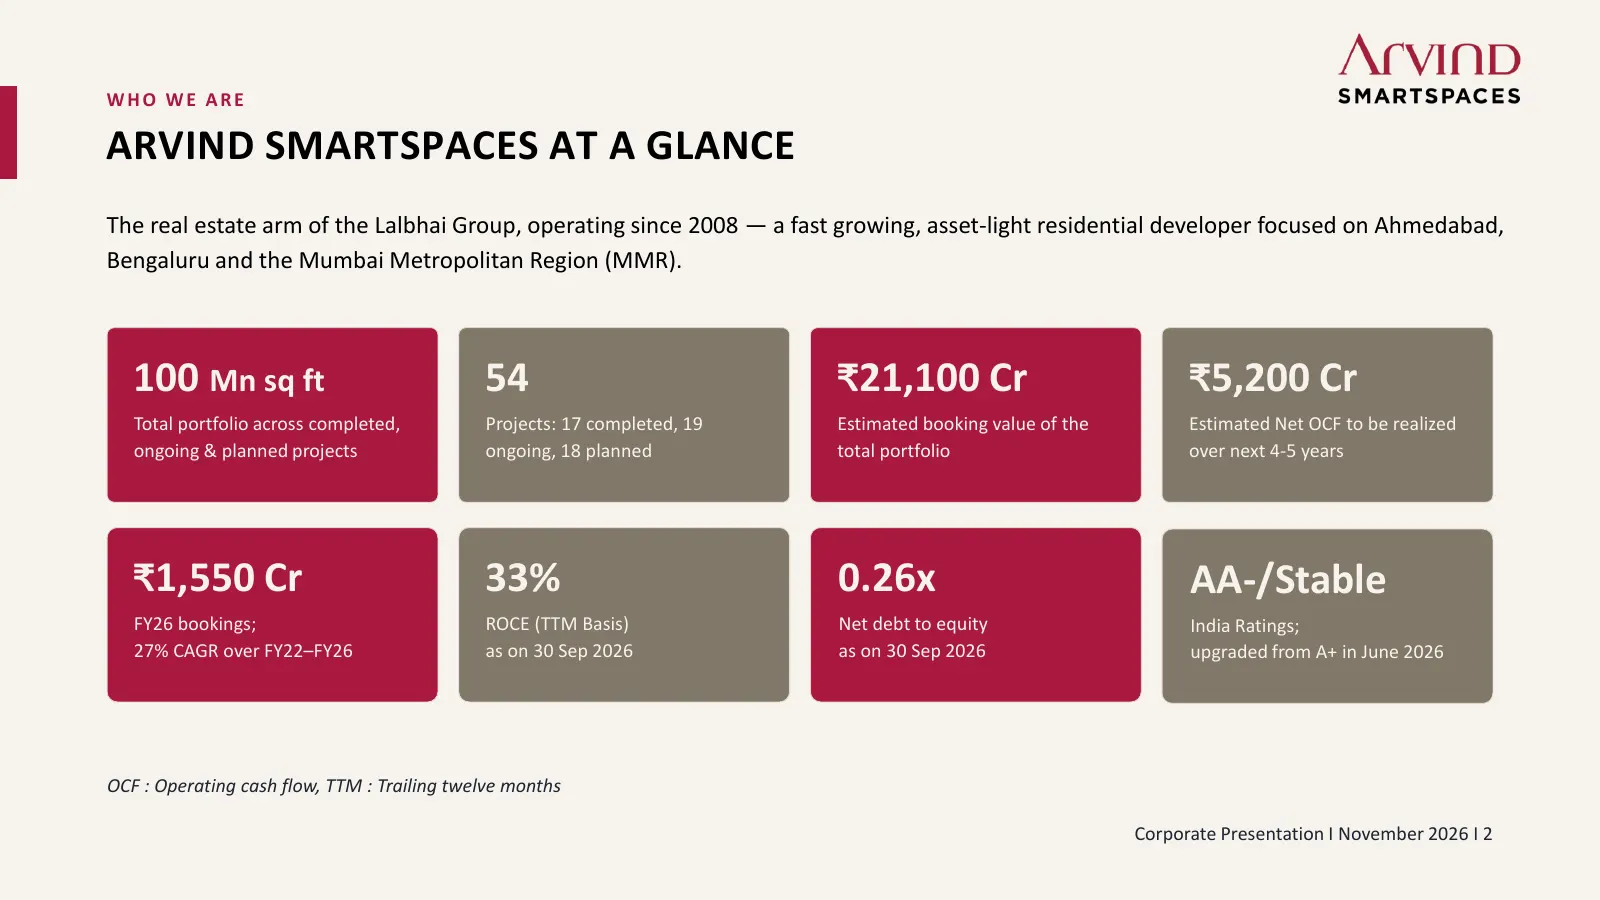
Slide 2: Arvind SmartSpaces at a Glance
WHO WE ARE ARVIND SMARTSPACES AT A GLANCE The real estate arm of the Lalbhai Group, operating since 2008 — a fast growing, asset-light residential developer focused on Ahmedabad, Bengaluru and the Mumbai Metropolitan Region (MMR). 100 Mn sq ft 54 ₹21,100 Cr ₹5,200 Cr Total portfolio across completed
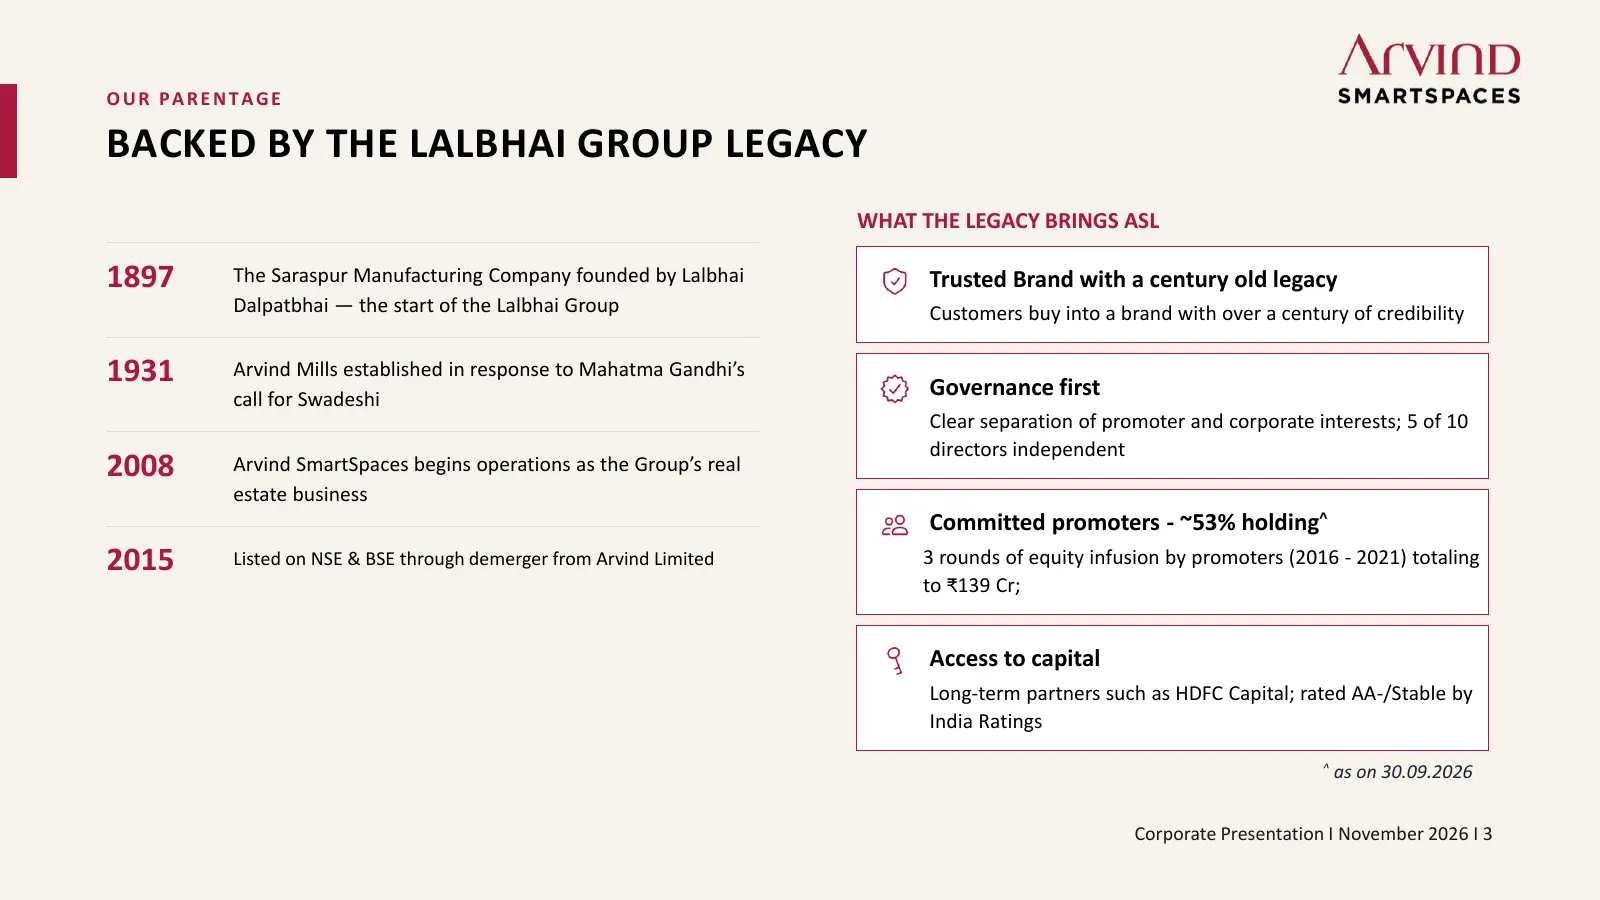
Slide 3: Backed by the Lalbhai Group Legacy
OUR PARENTAGE BACKED BY THE LALBHAI GROUP LEGACY WHAT THE LEGACY BRINGS ASL 1897 The Saraspur Manufacturing Company founded by Lalbhai Trusted Brand with a century old legacy Dalpatbhai — the start of the Lalbhai Group Customers buy into a brand with over a century of credibility 1931 Arvind Mills e
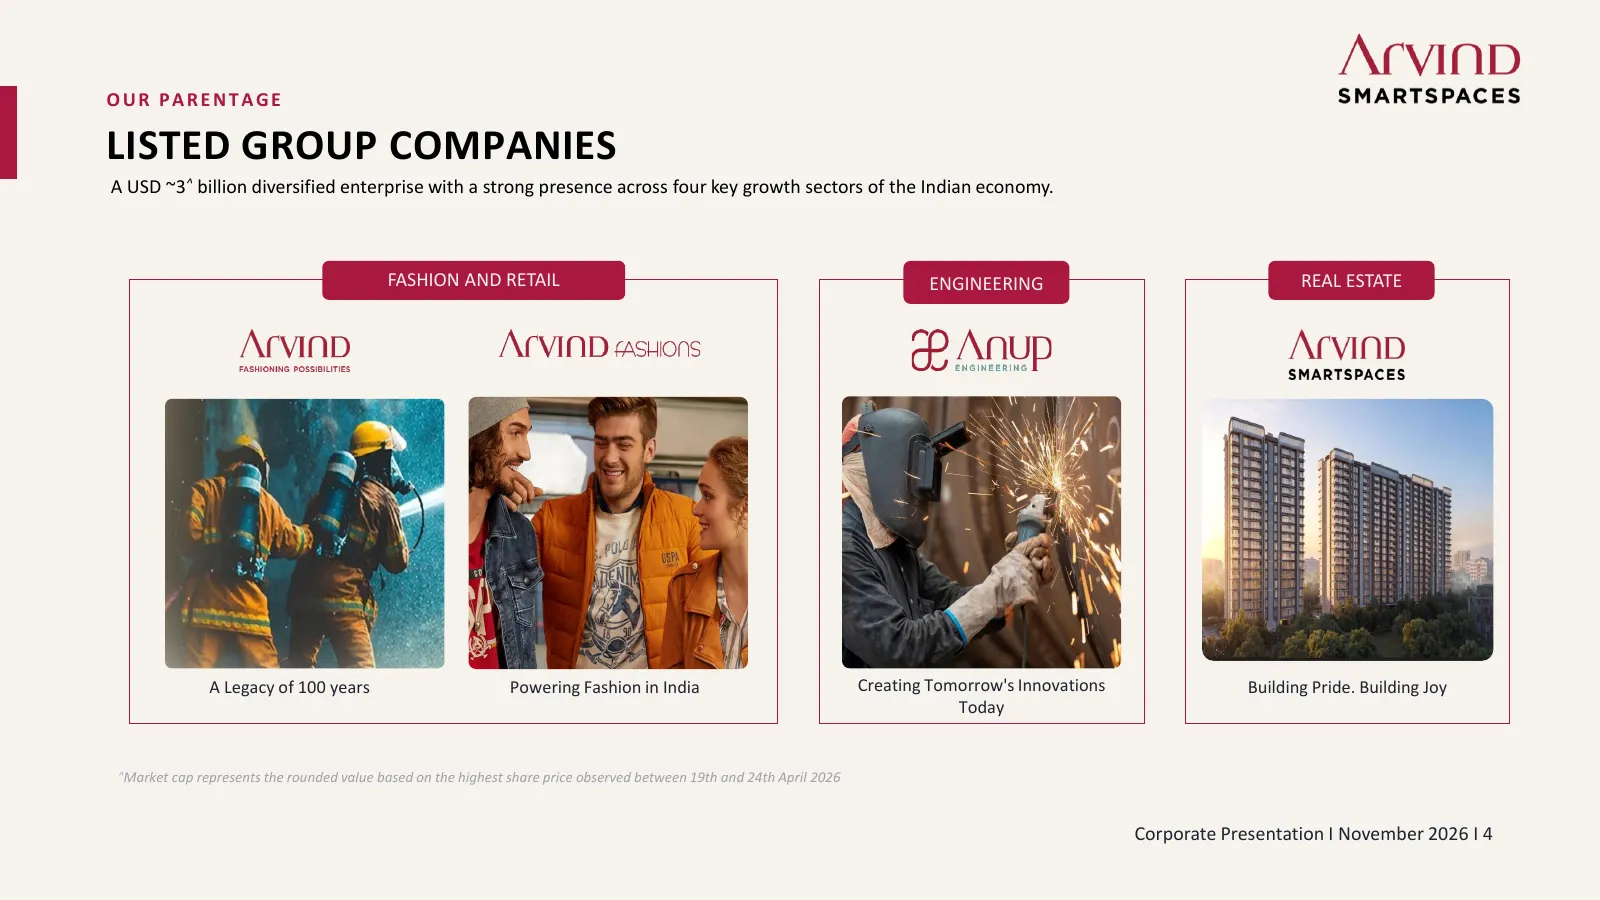
Slide 4: Listed Group Companies
OUR PARENTAGE LISTED GROUP COMPANIES A USD ~3^ billion diversified enterprise with a strong presence across four key growth sectors of the Indian economy. FASHION AND RETAIL ENGINEERING REAL ESTATE A Legacy of 100 years Powering Fashion in India Creating Tomorrow's Innovations Building Pride. Buildi
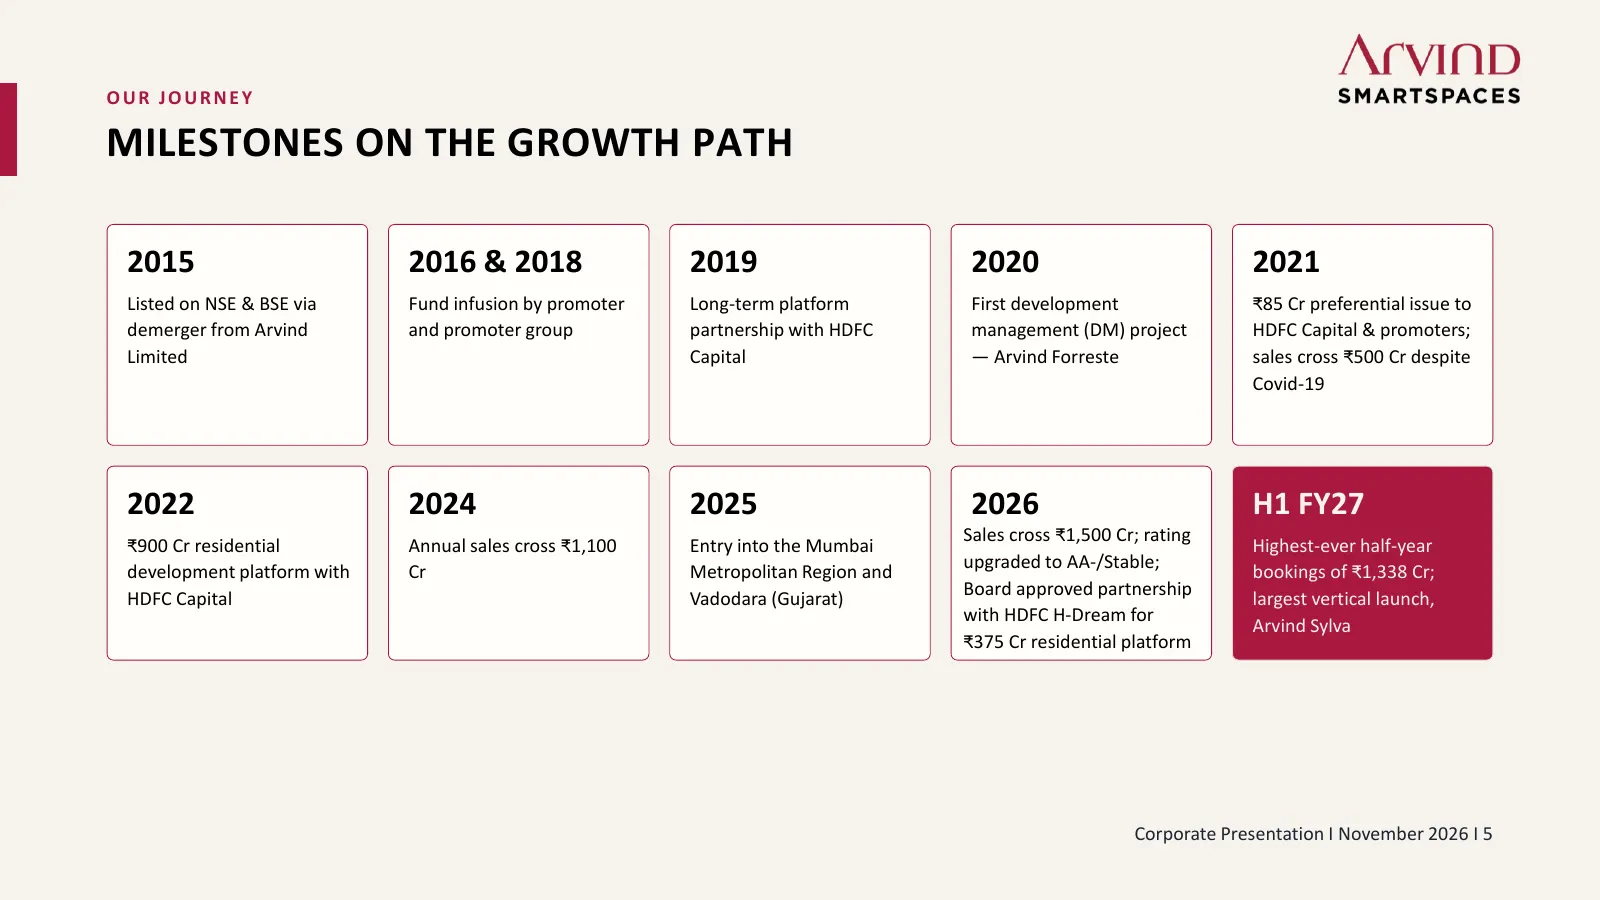
Slide 5: Milestones on the Growth Path
OUR JOURNEY MILESTONES ON THE GROWTH PATH 2015 2016 & 2018 2019 2020 2021 Listed on NSE & BSE via Fund infusion by promoter Long-term platform First development ₹85 Cr preferential issue to demerger from Arvind and promoter group partnership with HDFC management (DM) project HDFC Capital & promoters
Slide 6: Scale, Cashflow & Growth Visibility
OPERATING MODEL SCALE, CASHFLOW & GROWTH Scaling to the Next Orbit VISIBILITY Corporate Presentation I November 2026 I 6
Slide 7: A Scalable, Asset-Light Residential Model
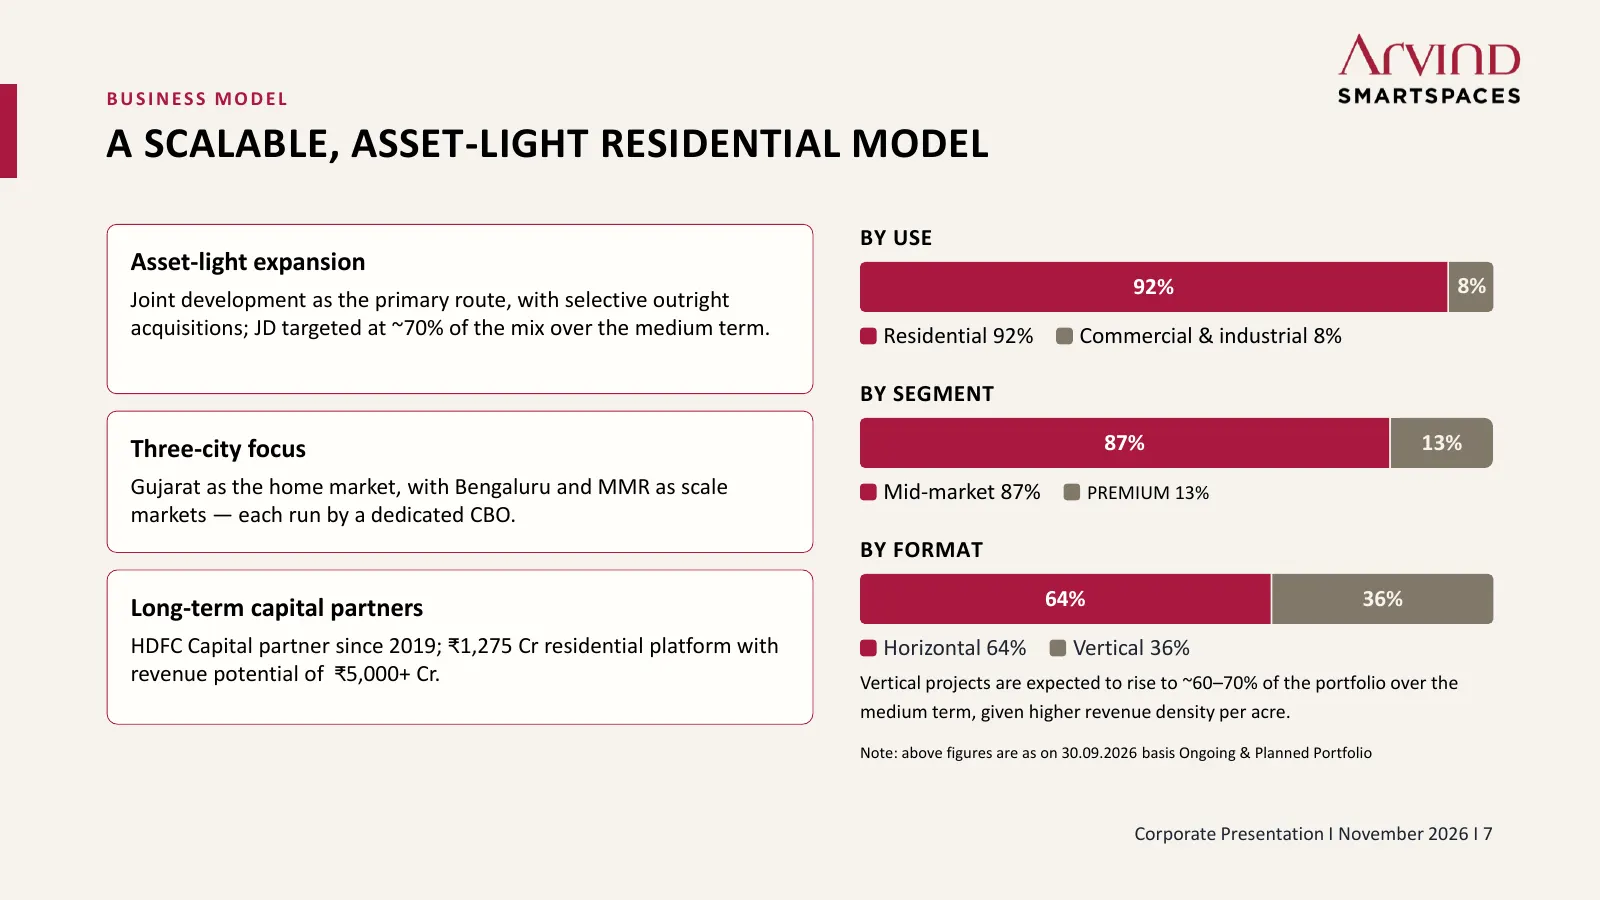
BUSINESS MODEL A SCALABLE, ASSET-LIGHT RESIDENTIAL MODEL BY USE Asset-light expansion 92% 8% Joint development as the primary route, with selective outright acquisitions; JD targeted at ~70% of the mix over the medium term. Residential 92% Commercial & industrial 8% BY SEGMENT Three-city focus 87% 1
Slide 8: A Focused Three-City Strategy
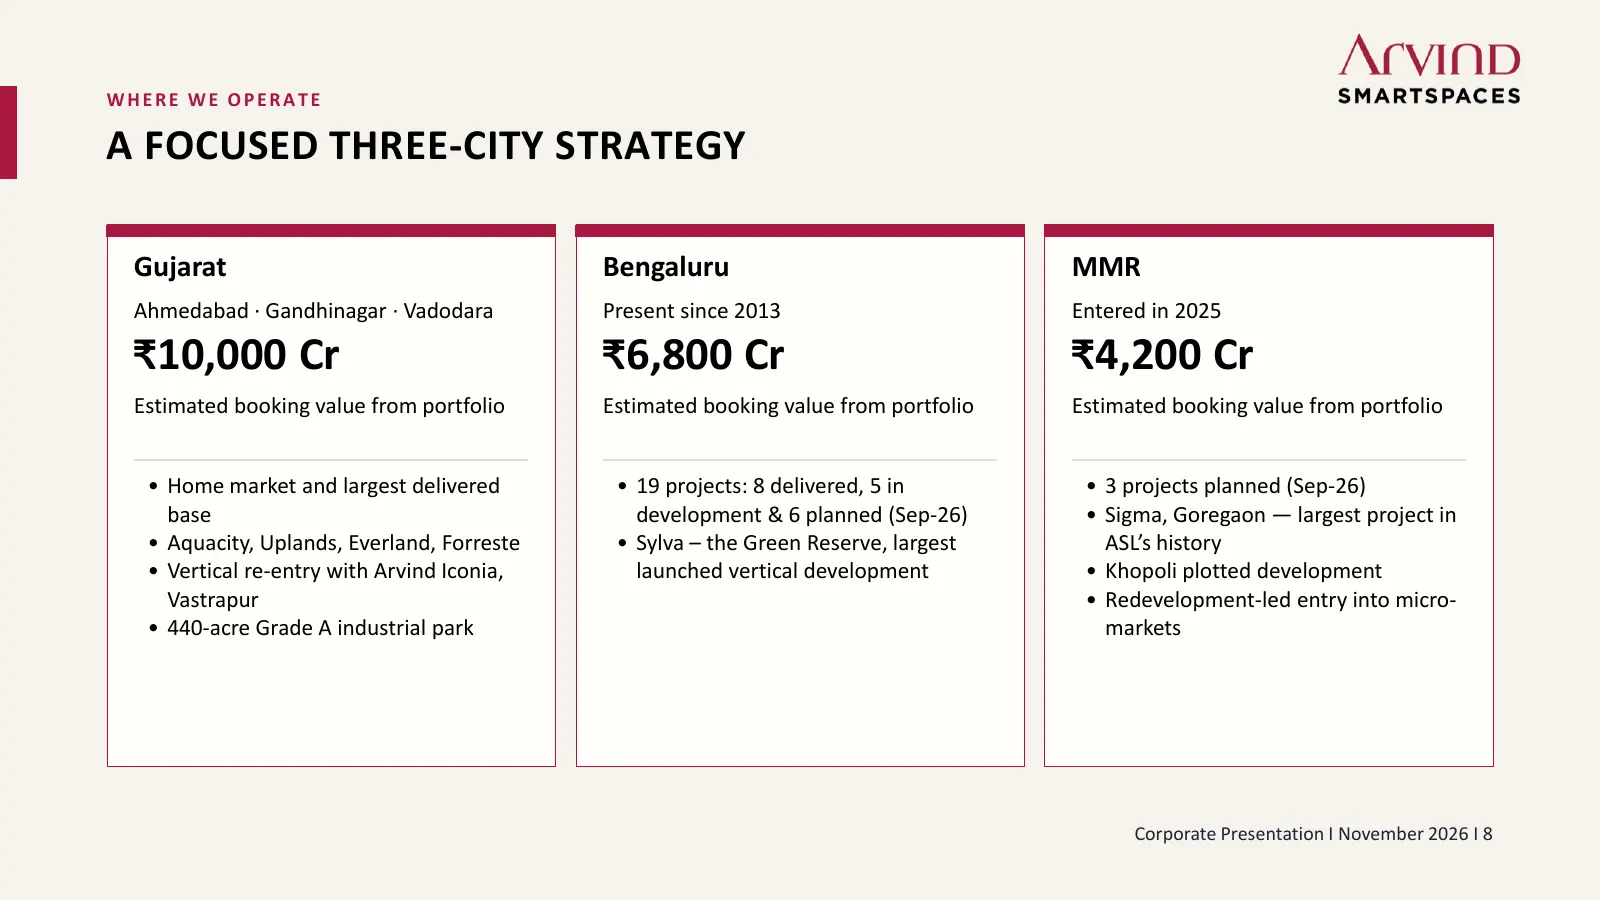
WHERE WE OPERATE A FOCUSED THREE-CITY STRATEGY Gujarat Bengaluru MMR Ahmedabad · Gandhinagar · Vadodara Present since 2013 Entered in 2025 ₹10,000 Cr ₹6,800 Cr ₹4,200 Cr Estimated booking value from portfolio Estimated booking value from portfolio Estimated booking value from portfolio • Home market
Slide 9: An Asset-Light Entry into Mumbai
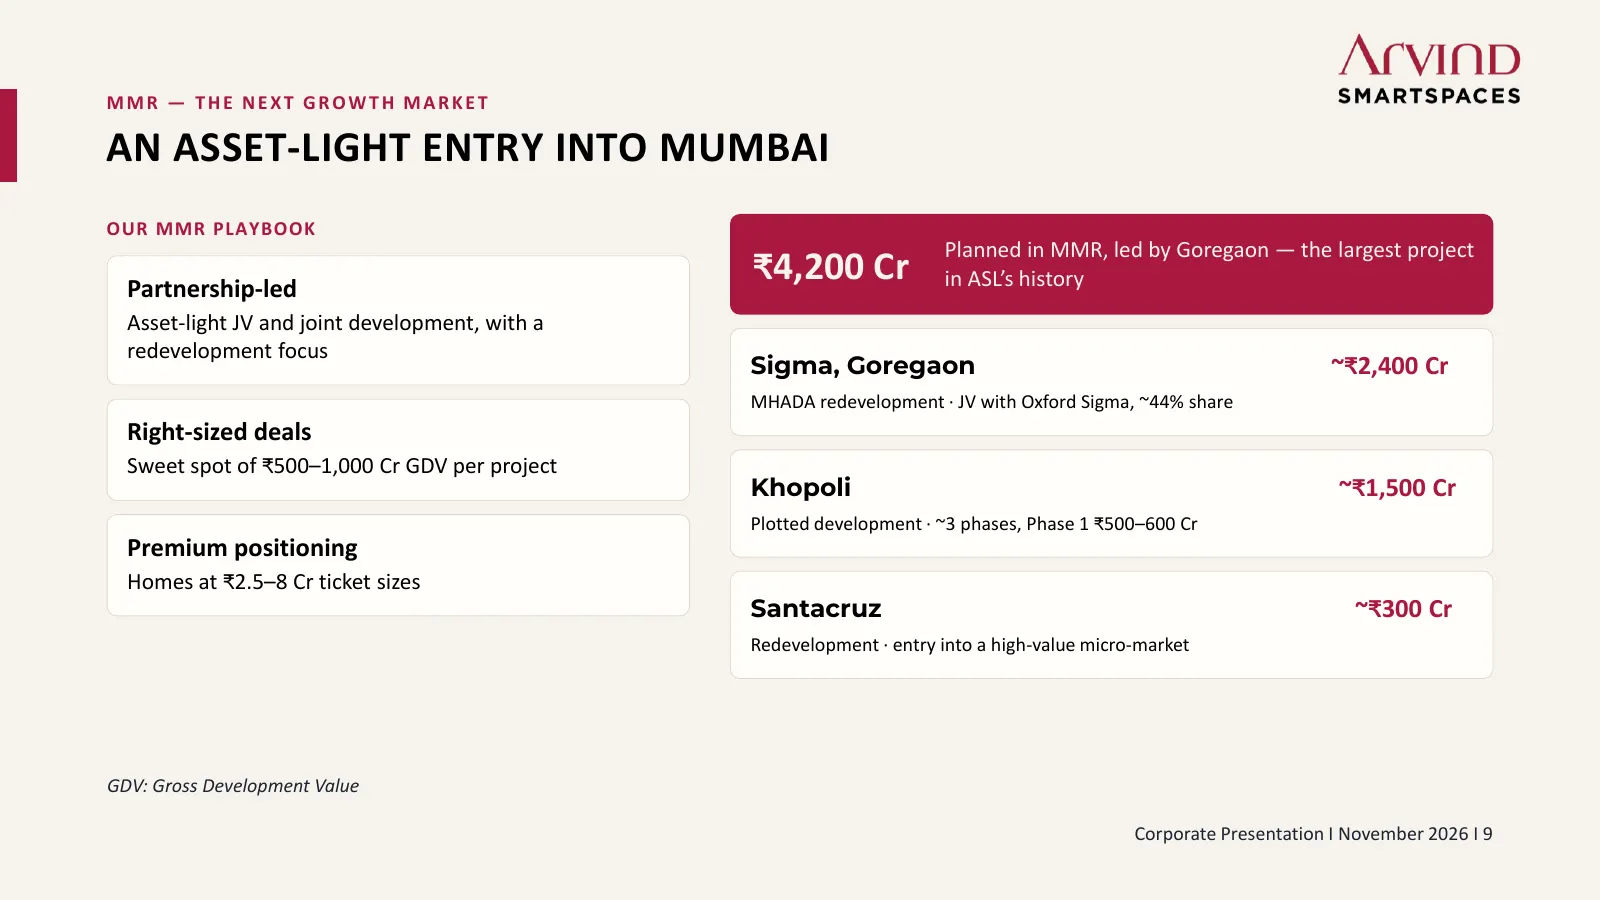
MMR — THE NEXT GROWTH MARKET AN ASSET-LIGHT ENTRY INTO MUMBAI OUR MMR PLAYBOOK Planned in MMR, led by Goregaon — the largest project Partnership-led ₹4,200 Cr in ASL’s history Asset-light JV and joint development, with a redevelopment focus Sigma, Goregaon ~₹2,400 Cr MHADA redevelopment · JV with Ox
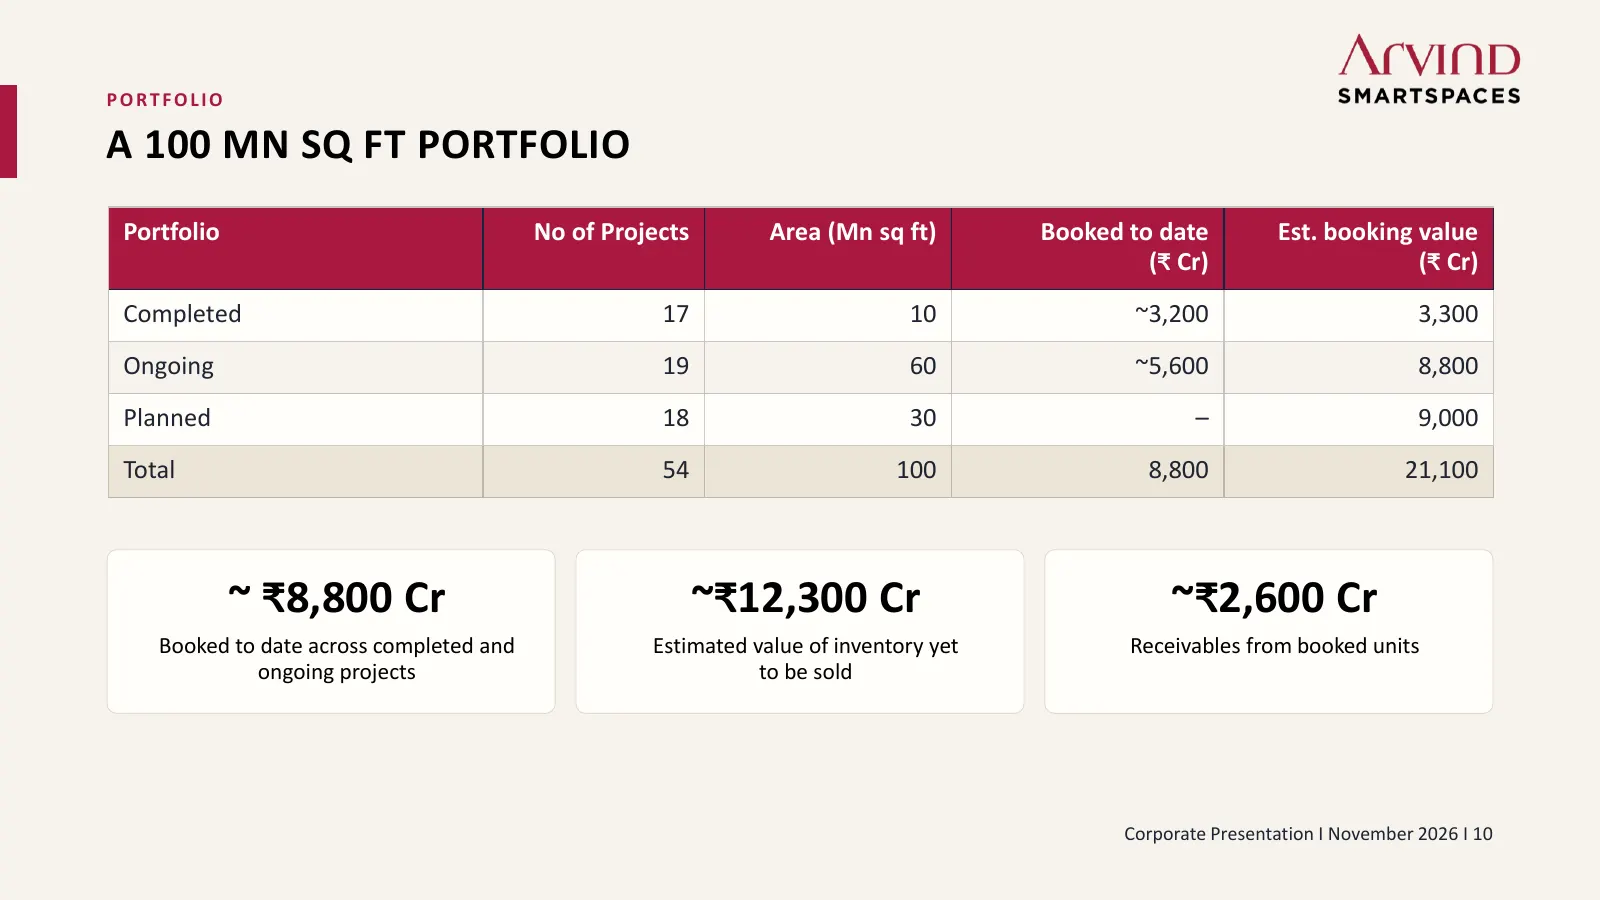
Slide 10: A 100 Mn Sq Ft Portfolio
PORTFOLIO A 100 MN SQ FT PORTFOLIO Portfolio No of Projects Area (Mn sq ft) Booked to date Est. booking value (₹ Cr) (₹ Cr) Completed 17 10 ~3,200 3,300 Ongoing 19 60 ~5,600 8,800 Planned 18 30 – 9,000 Total 54 100 8,800 21,100 ~ ₹8,800 Cr ~₹12,300 Cr ~₹2,600 Cr Booked to date across completed and E
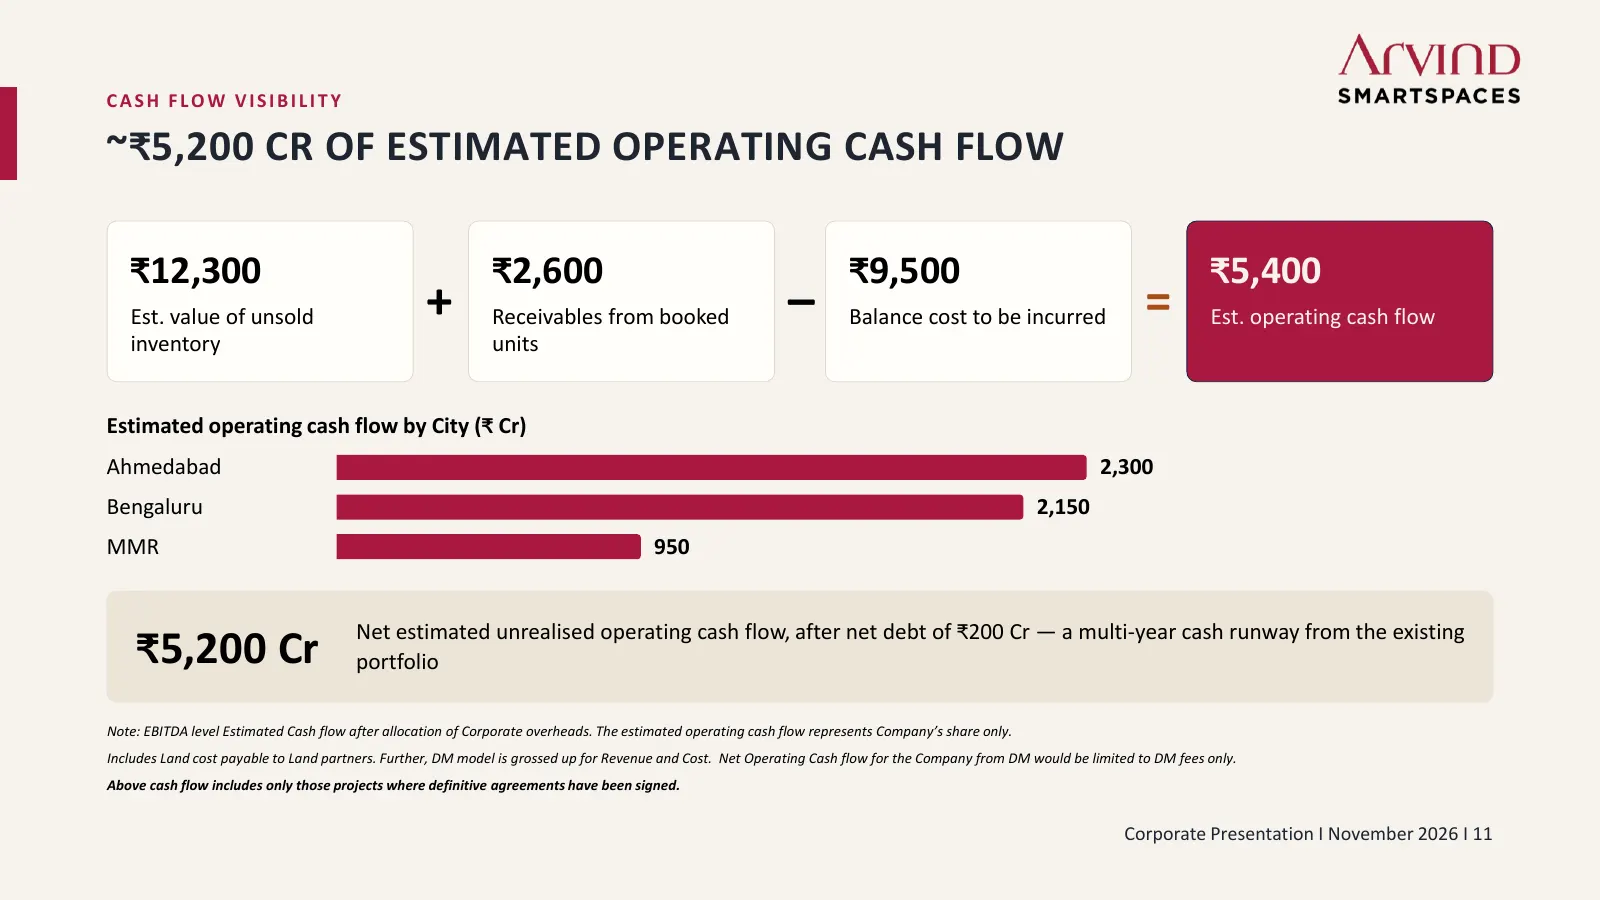
Slide 11: Cash Flow Visibility: ~₹5,200 Cr Estimated Operating Cash Flow
CASH FLOW VISIBILITY ~₹5,200 CR OF ESTIMATED OPERATING CASH FLOW ₹12,300 ₹2,600 ₹9,500 ₹5,400 Est. value of unsold + Receivables from booked – Balance cost to be incurred = Est. operating cash flow inventory units Estimated operating cash flow by City (₹ Cr) Ahmedabad 2,300 Bengaluru 2,150 MMR 950 N
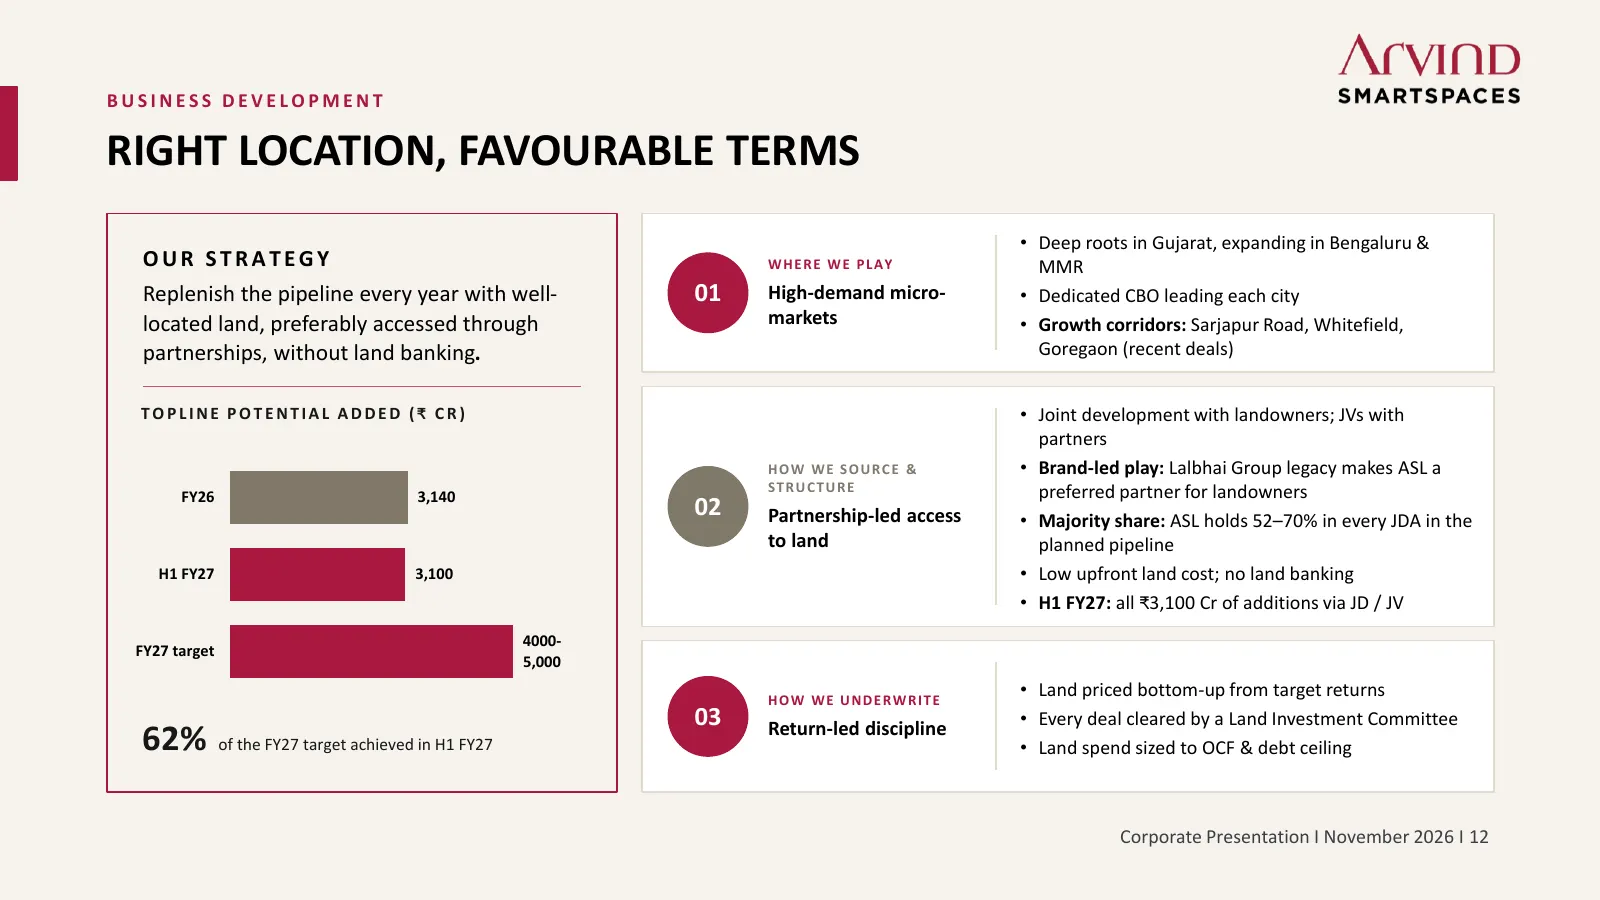
Slide 12: Right Location, Favourable Terms
BUSINESS DEVELOPMENT RIGHT LOCATION, FAVOURABLE TERMS • Deep roots in Gujarat, expanding in Bengaluru & OUR STRATEGY W H E R E W E P L AY MMR Replenish the pipeline every year with well- 01 High-demand micro- • Dedicated CBO leading each city located land, preferably accessed through markets • Growt
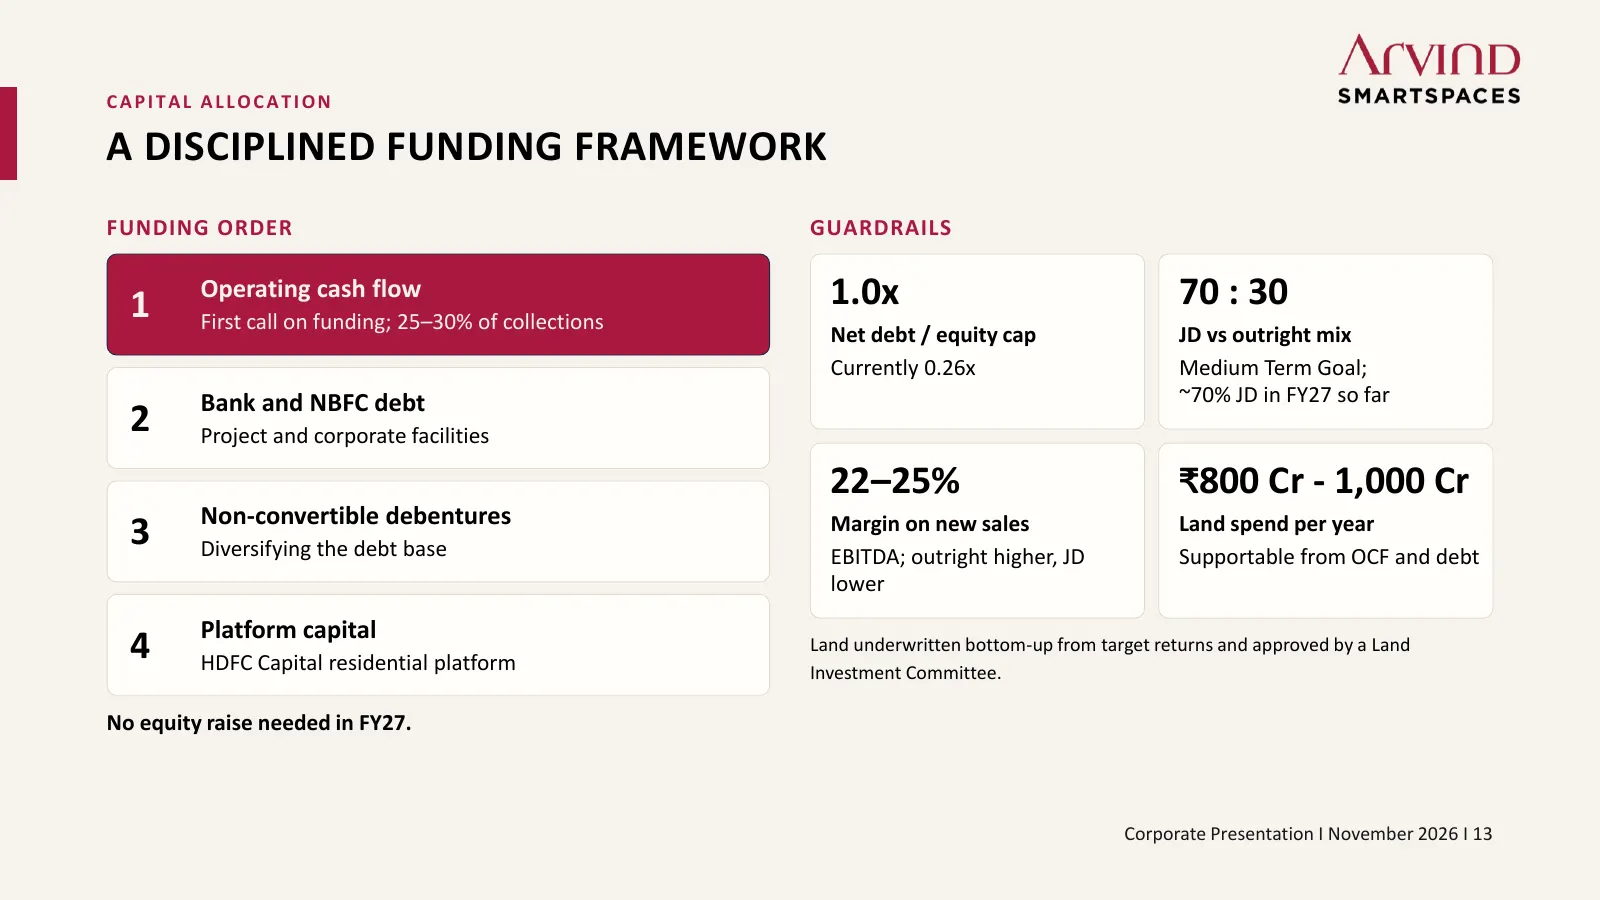
Slide 13: A Disciplined Funding Framework
CAPITAL ALLOCATION A DISCIPLINED FUNDING FRAMEWORK FUNDING ORDER GUARDRAILS 1 Operating cash flow 1.0x 70 : 30 First call on funding; 25–30% of collections Net debt / equity cap JD vs outright mix Currently 0.26x Medium Term Goal; Bank and NBFC debt ~70% JD in FY27 so far 2 Project and corporate fac
Slide 14: Measured Leverage, Strong Credit Profile
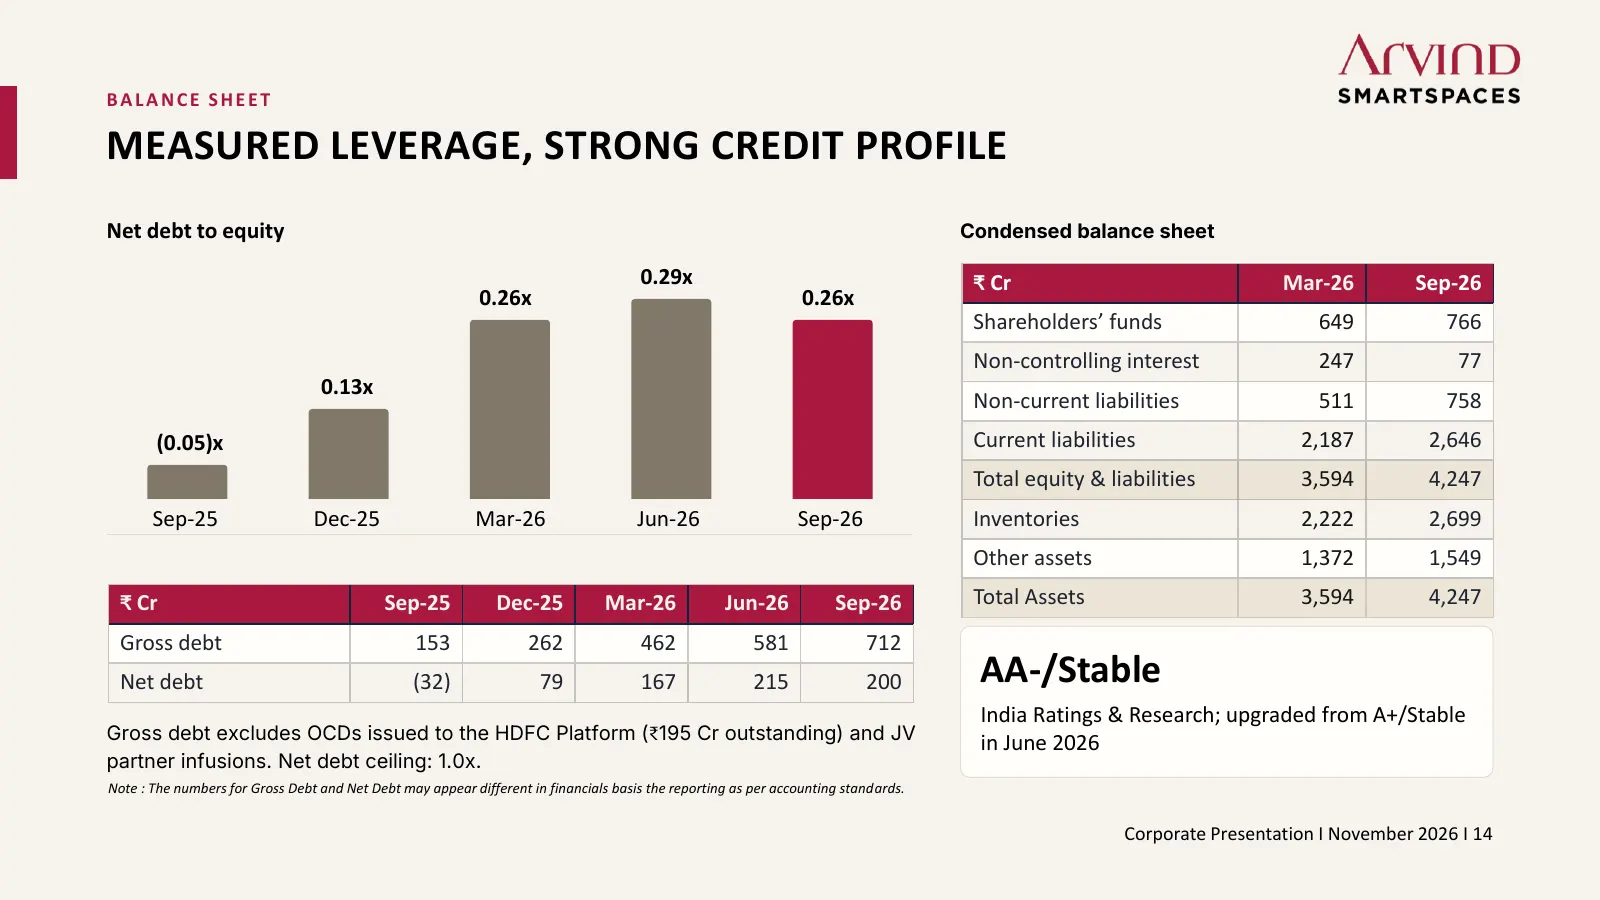
BALANCE SHEET MEASURED LEVERAGE, STRONG CREDIT PROFILE Net debt to equity Condensed balance sheet 0.29x ₹ Cr Mar-26 Sep-26 0.26x 0.26x Shareholders’ funds 649 766 Non-controlling interest 247 77 0.13x Non-current liabilities 511 758 (0.05)x Current liabilities 2,187 2,646 Total equity & liabilities
Slide 15: Consistent Growth Over Five Years
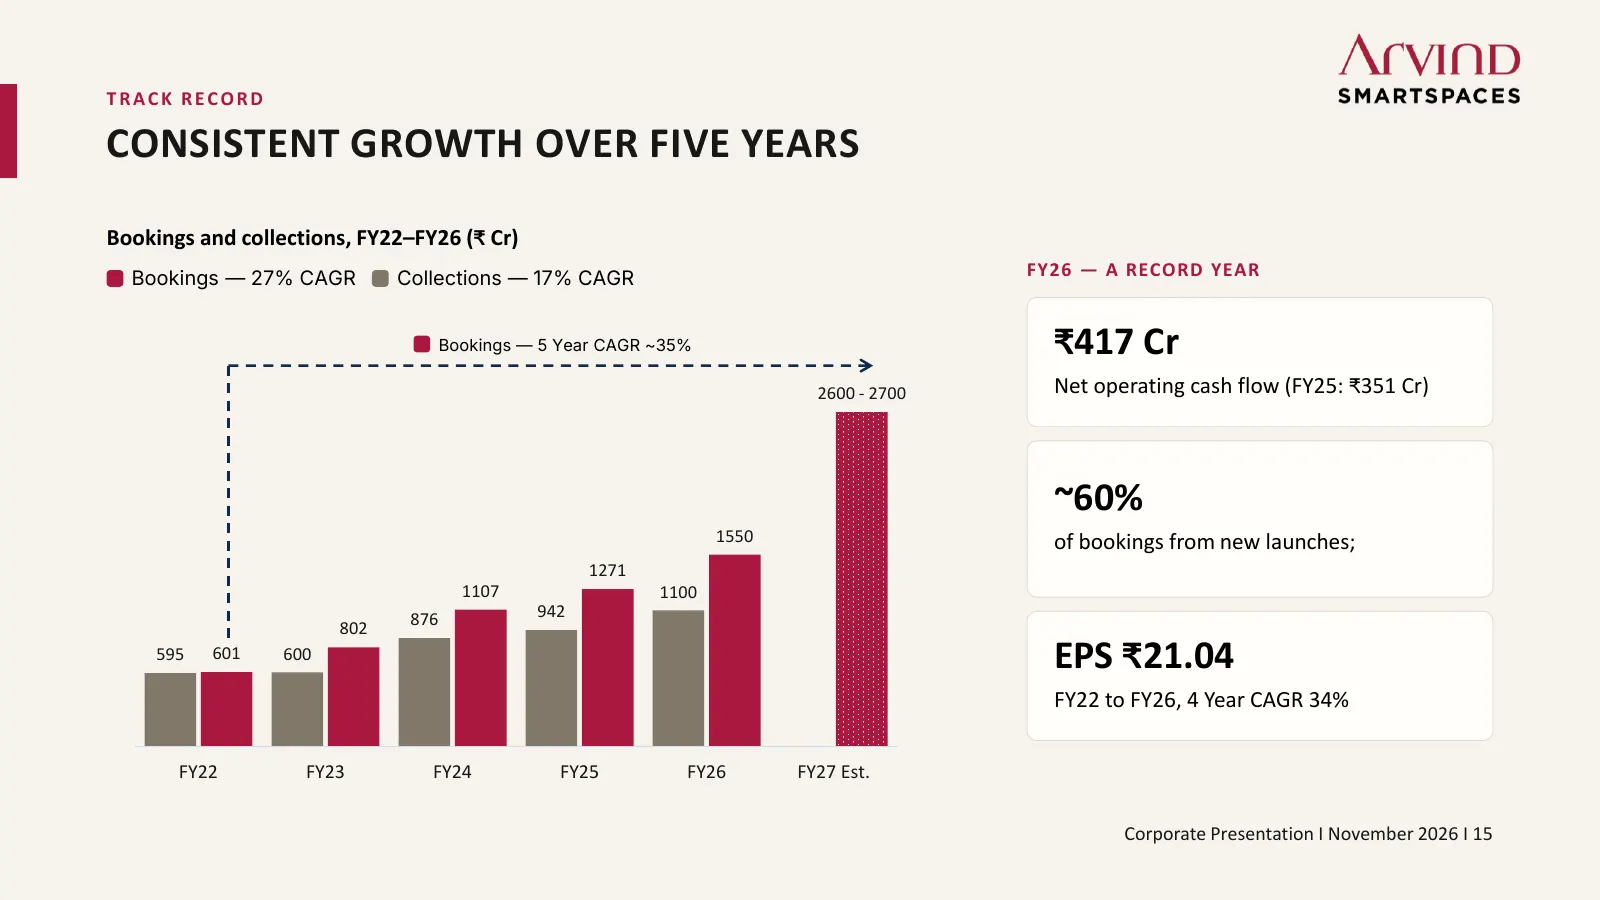
TRACK RECORD CONSISTENT GROWTH OVER FIVE YEARS Bookings and collections, FY22–FY26 (₹ Cr) Bookings — 27% CAGR Collections — 17% CAGR FY26 — A RECORD YEAR Bookings — 5 Year CAGR ~35% ₹417 Cr 2600 - 2700 Net operating cash flow (FY25: ₹351 Cr) ~60% 1550 of bookings from new launches; 1271 1107 1100 87
Slide 16: Next Orbit Aspirations
INSTITUTIONALISING GROWTH NEXT ORBIT Scaling to the Next Orbit ASPIRATIONS Corporate Presentation I November 2026 I 16
Slide 17: Medium Term Outlook
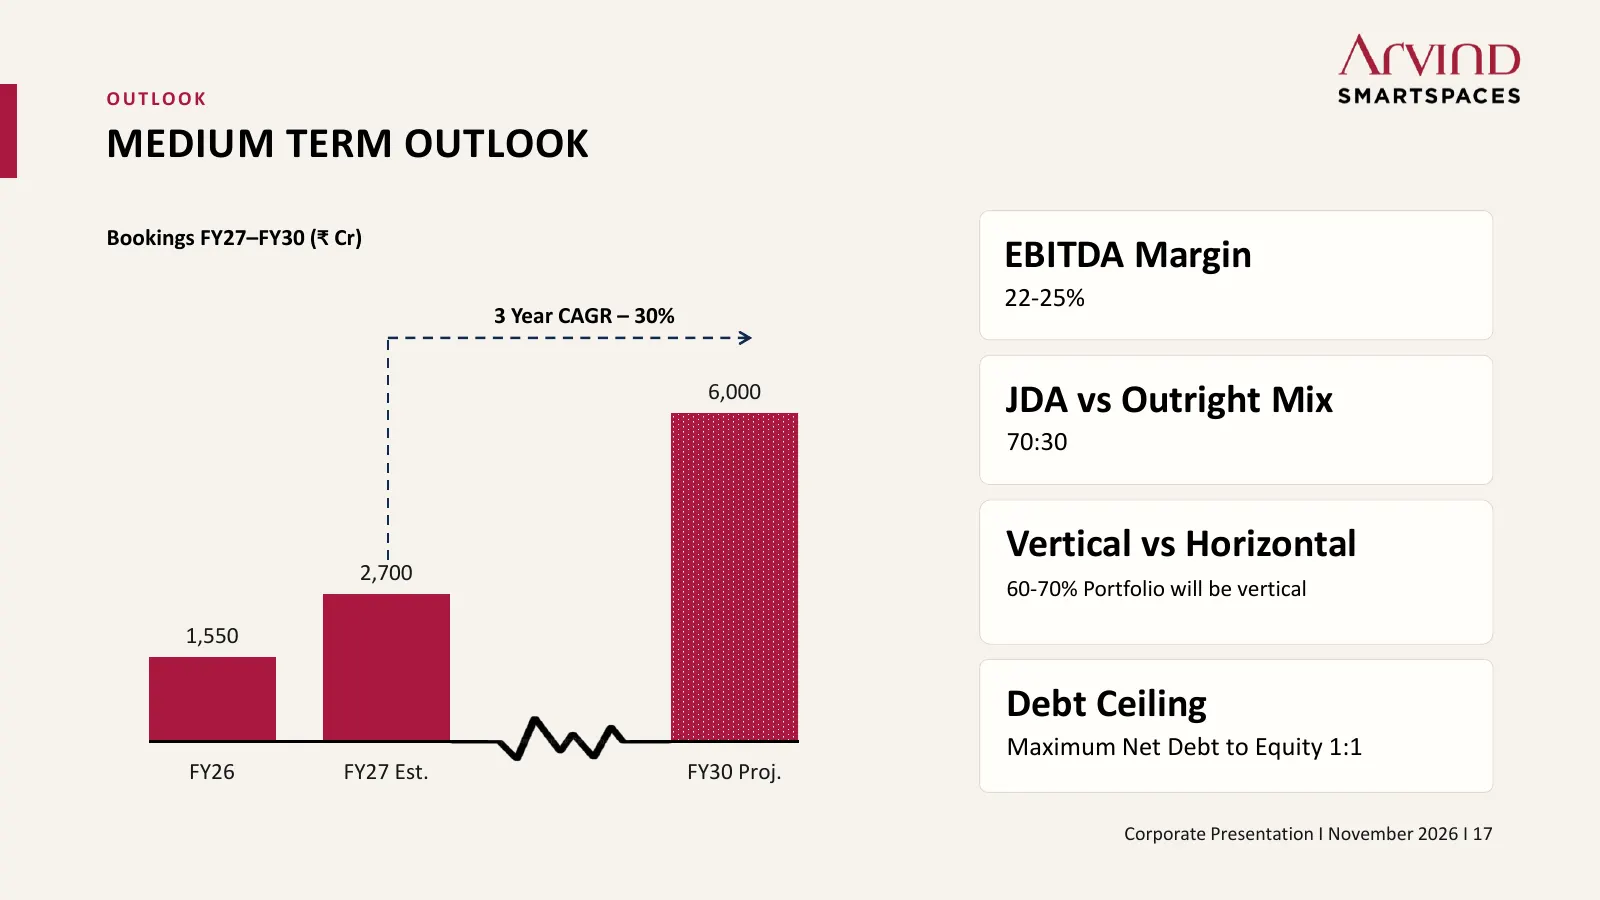
OUTLOOK MEDIUM TERM OUTLOOK Bookings FY27–FY30 (₹ Cr) EBITDA Margin 22-25% 3 Year CAGR – 30% 6,000 JDA vs Outright Mix 70:30 Vertical vs Horizontal 2,700 60-70% Portfolio will be vertical 1,550 Debt Ceiling Maximum Net Debt to Equity 1:1 FY26 FY27 Est. FY30 Proj. Corporate Presentation I November 20
Slide 18: Why Arvind SmartSpaces
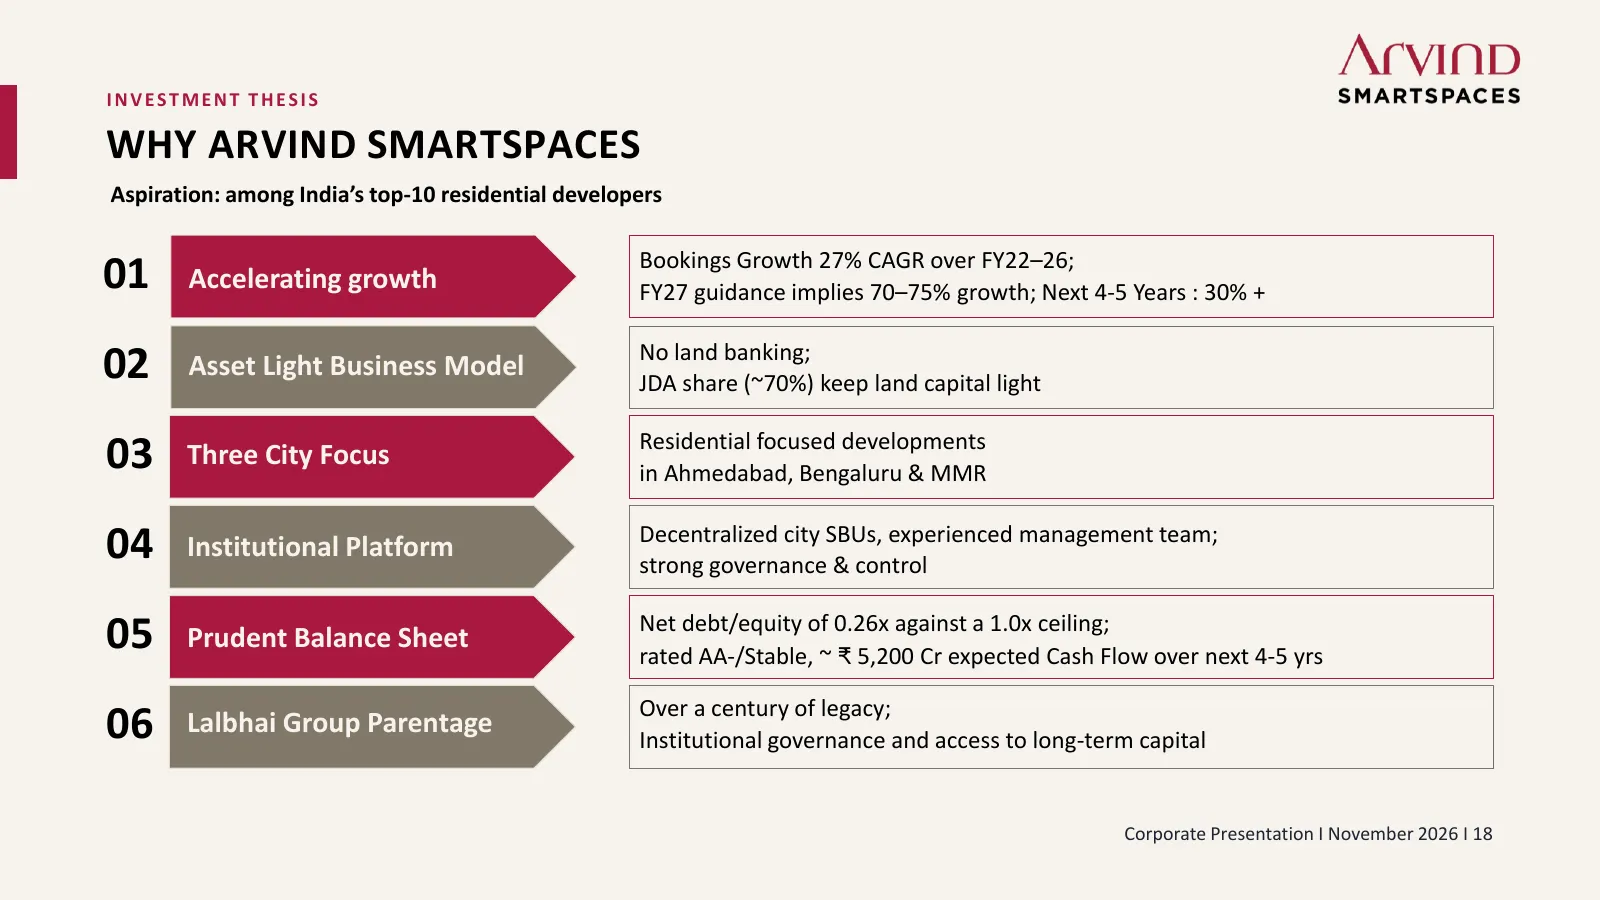
INVESTMENT THESIS WHY ARVIND SMARTSPACES Aspiration: among India’s top-10 residential developers Bookings Growth 27% CAGR over FY22–26; 01 Accelerating growth FY27 guidance implies 70–75% growth; Next 4-5 Years : 30% + No land banking; 02 Asset Light Business Model JDA share (~70%) keep land capital

Slide 19: Key Project Views
SMARTSPACES KEY PROJECT VIEWS
Slide 20: Iconia
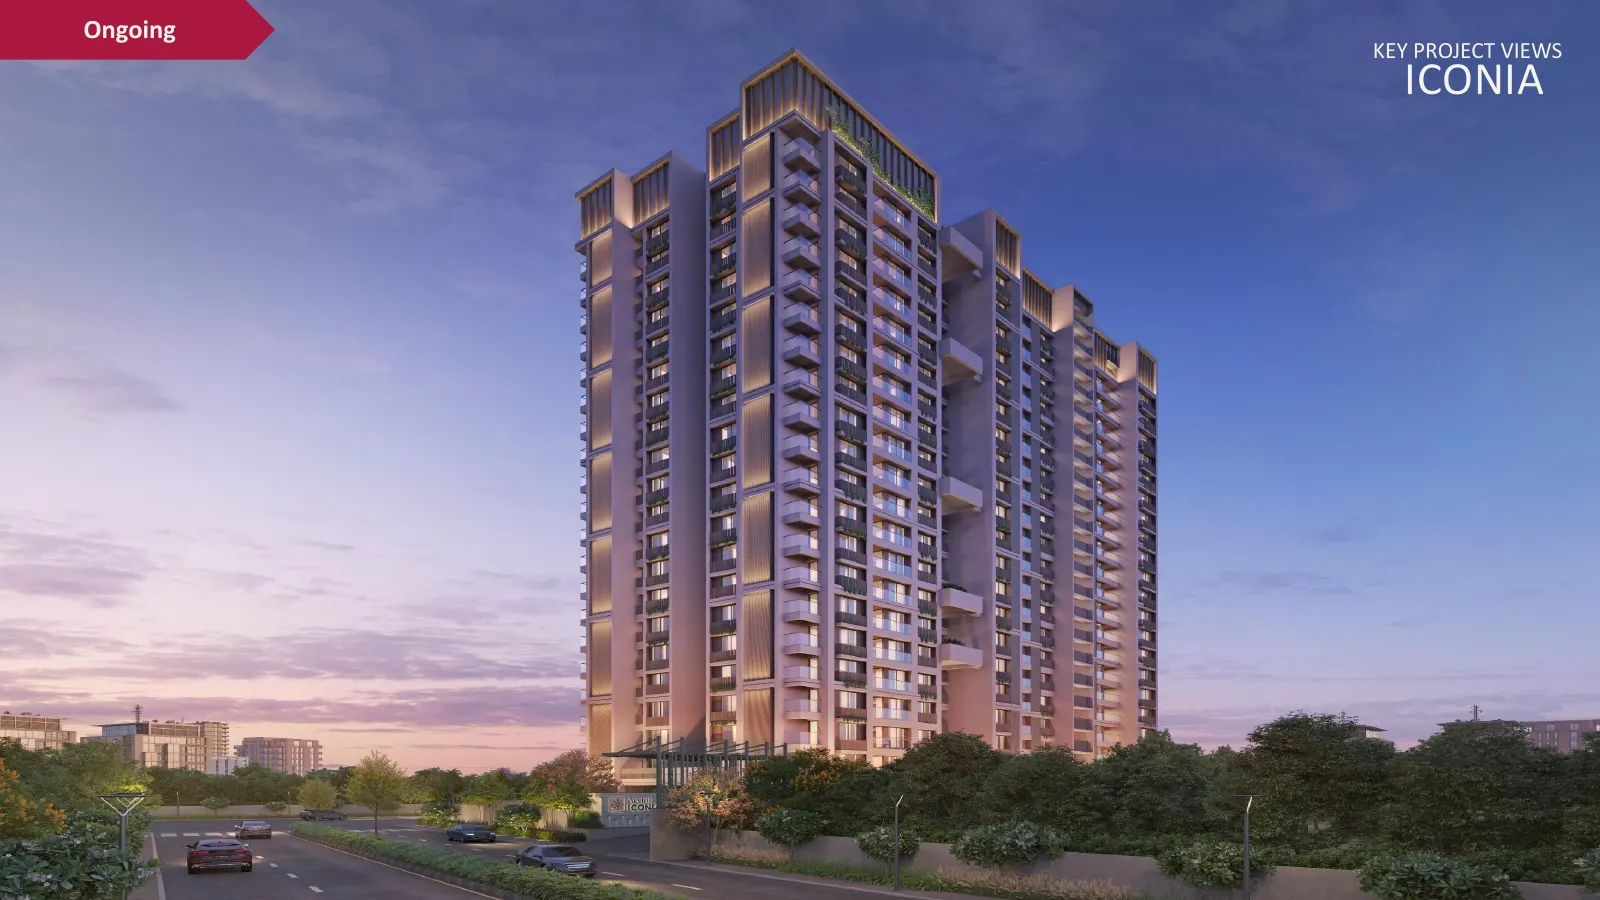
Ongoing KEY PROJECT VIEWS ICONIA
Slide 21: Sylva
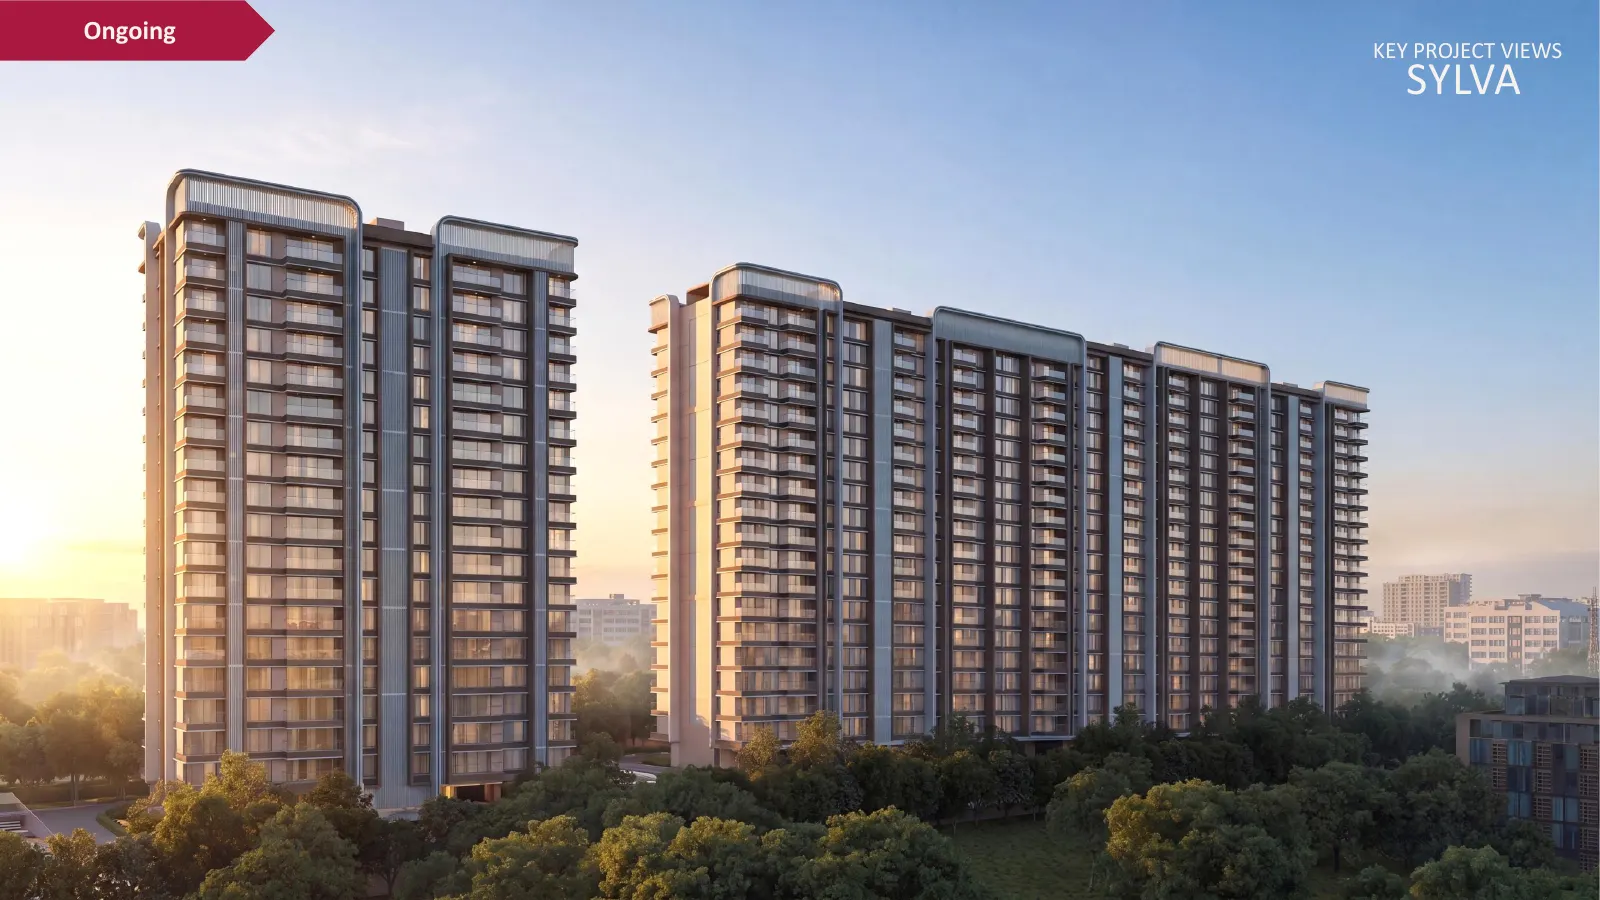
Ongoing KEY PROJECT VIEWS SYLVA
Slide 22: Aquacity
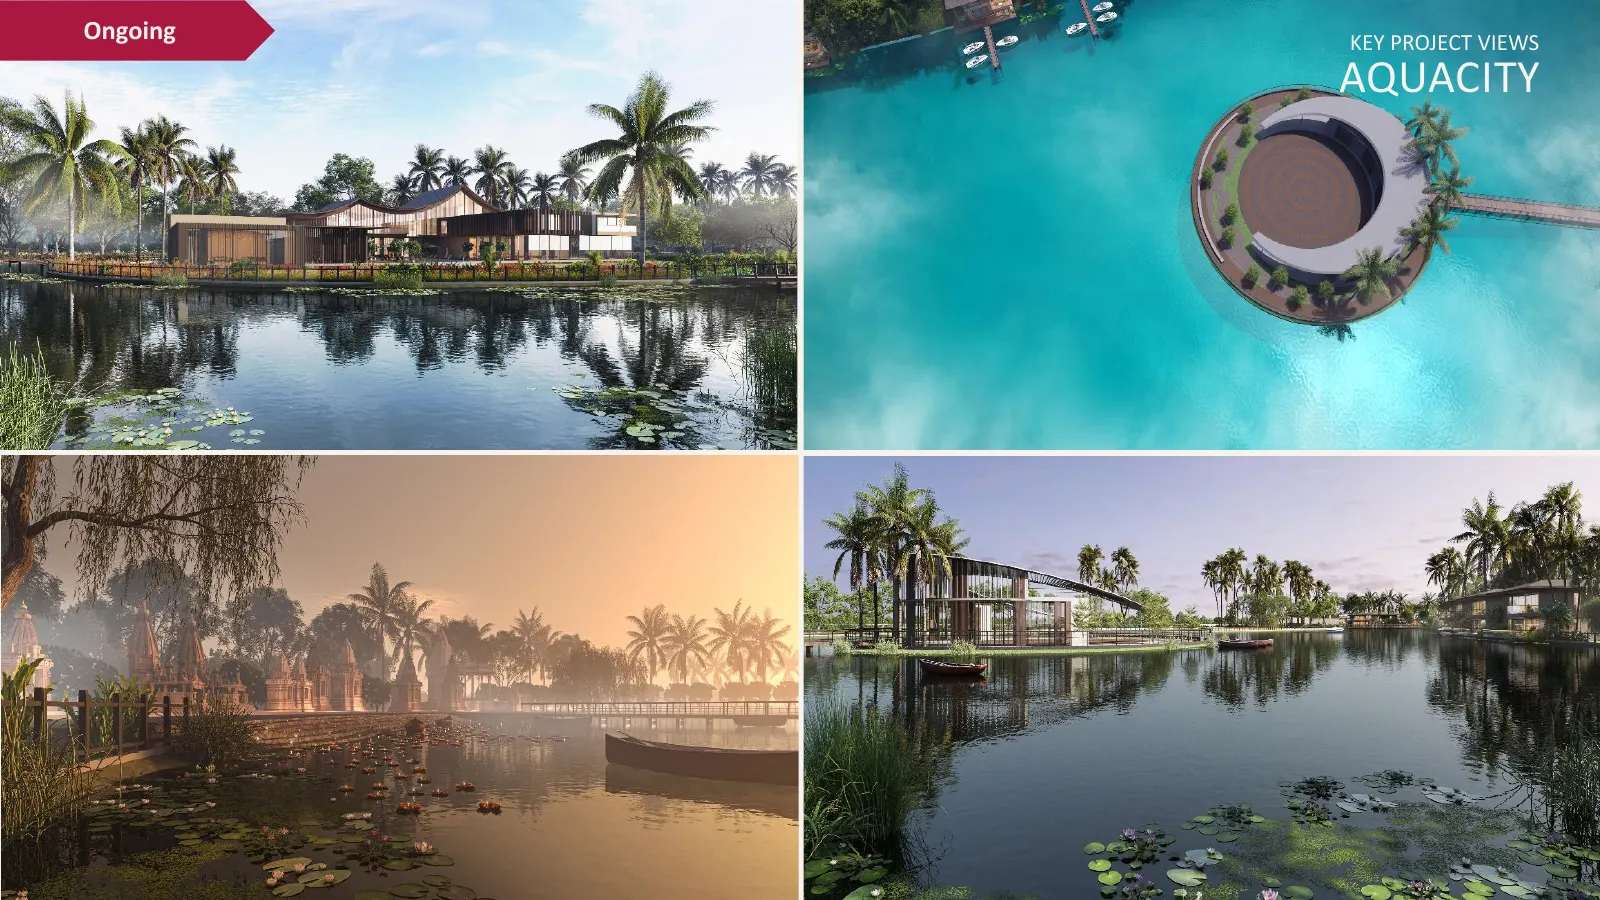
Ongoing KEY PROJECT VIEWS AQUACITY
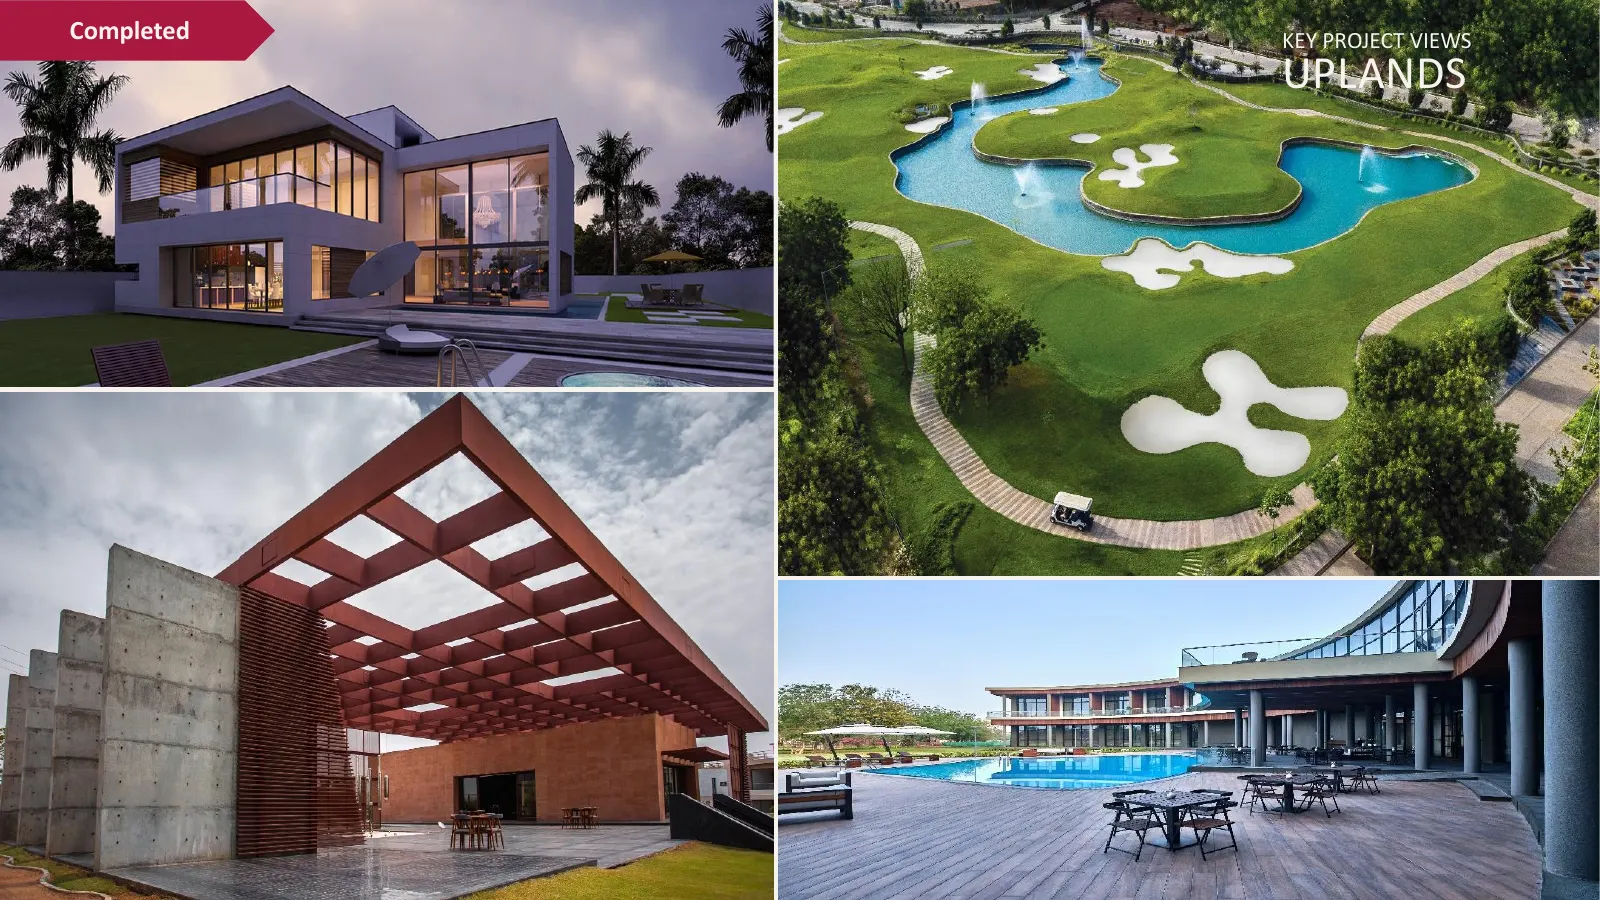
Slide 23: Uplands
Completed KEY PROJECT VIEWS UPLANDS

Slide 24: Appendix
SMARTSPACES APPENDIX
Slide 25: Q2 & H1 FY27 Performance Update
PERFORMANCE UPDATE Q2 & H1 FY27 Scaling to the Next Orbit Quarter and half year ended 30 September 2026 Corporate Presentation I November 2026 I 25
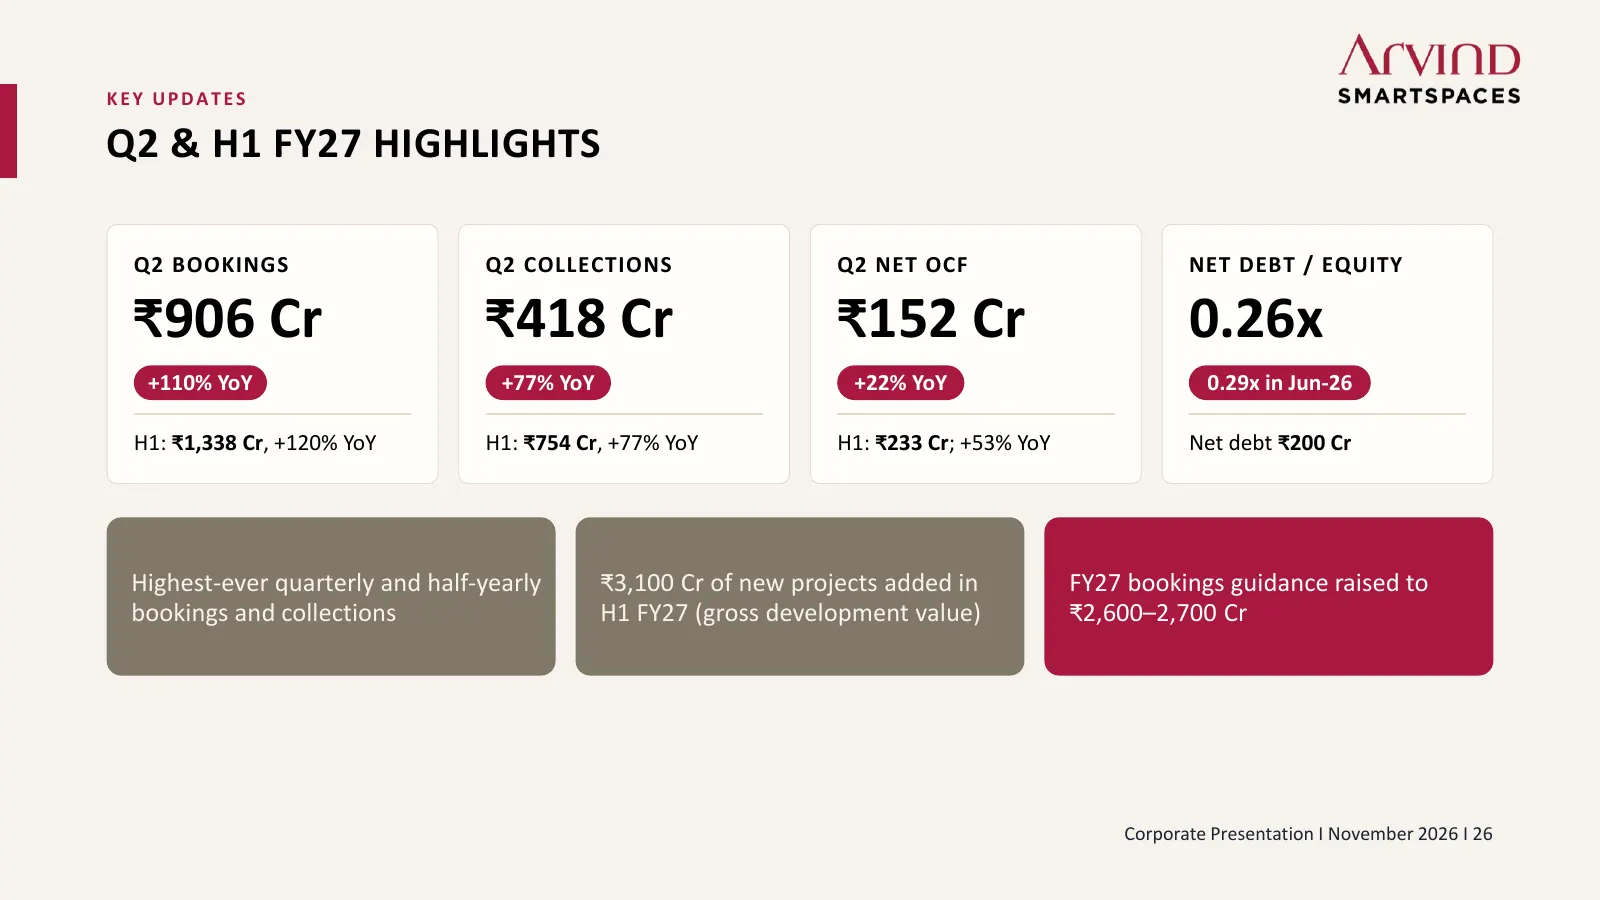
Slide 26: Q2 & H1 FY27 Highlights
KEY UPDATES Q2 & H1 FY27 HIGHLIGHTS Q2 BOOKINGS Q2 COLLECTIONS Q2 NET OCF NET DEBT / EQUITY ₹906 Cr ₹418 Cr ₹152 Cr 0.26x +110% YoY +77% YoY +22% YoY 0.29x in Jun-26 H1: ₹1,338 Cr, +120% YoY H1: ₹754 Cr, +77% YoY H1: ₹233 Cr; +53% YoY Net debt ₹200 Cr Highest-ever quarterly and half-yearly ₹3,100 Cr
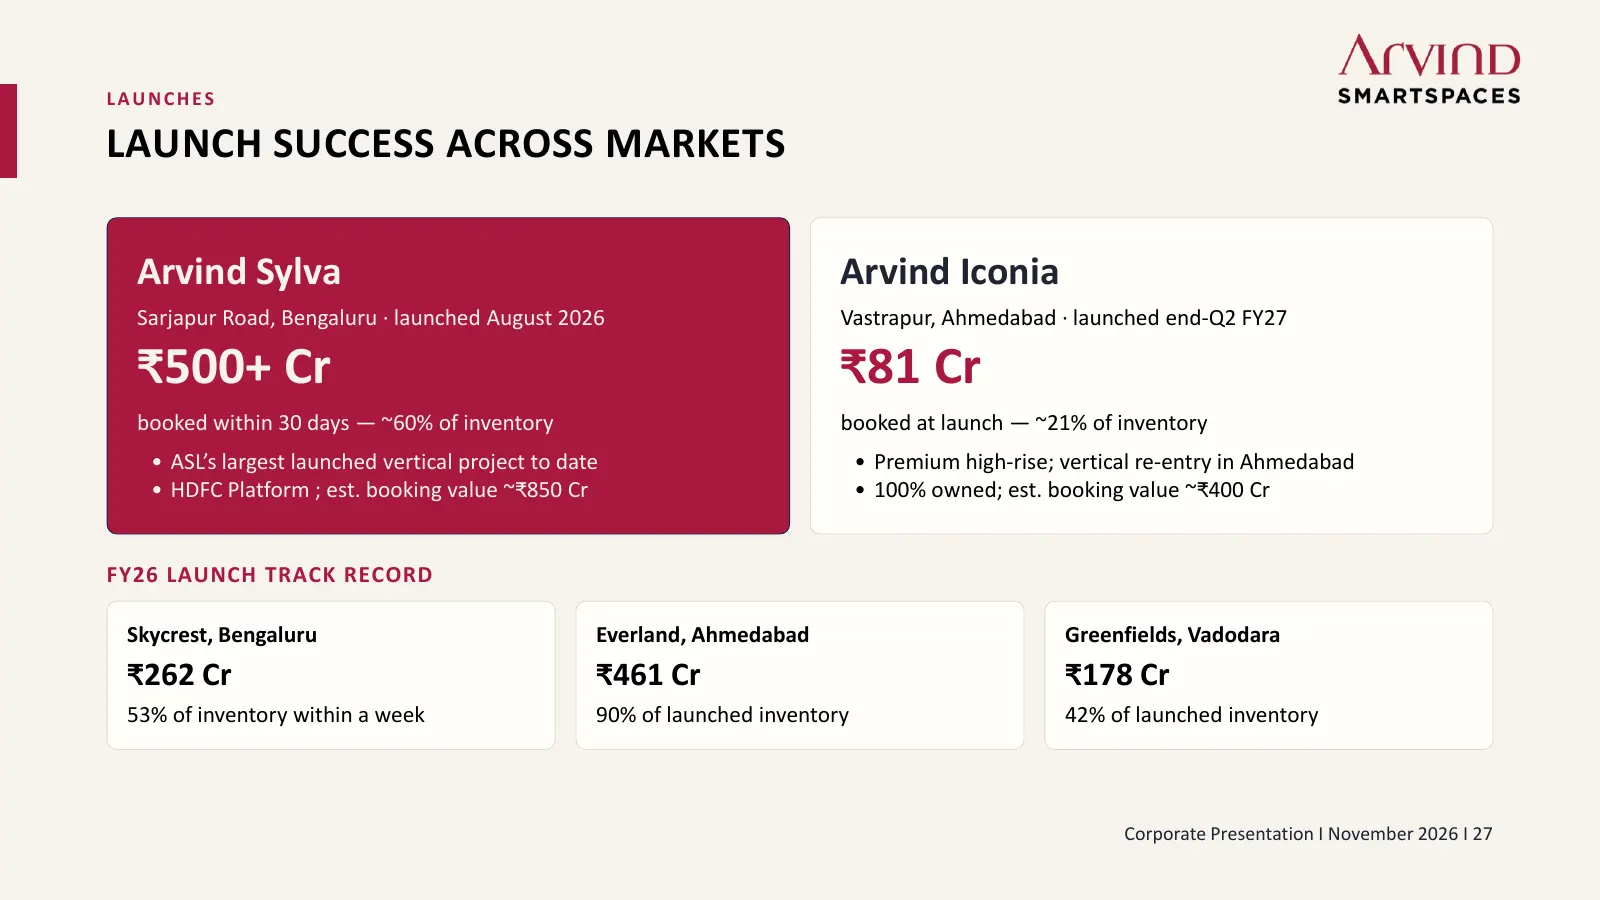
Slide 27: Launch Success Across Markets
LAUNCHES LAUNCH SUCCESS ACROSS MARKETS Arvind Sylva Arvind Iconia Sarjapur Road, Bengaluru · launched August 2026 Vastrapur, Ahmedabad · launched end-Q2 FY27 ₹500+ Cr ₹81 Cr booked within 30 days — ~60% of inventory booked at launch — ~21% of inventory • ASL’s largest launched vertical project to da
Slide 28: Record Bookings and Collections in Q2 FY27
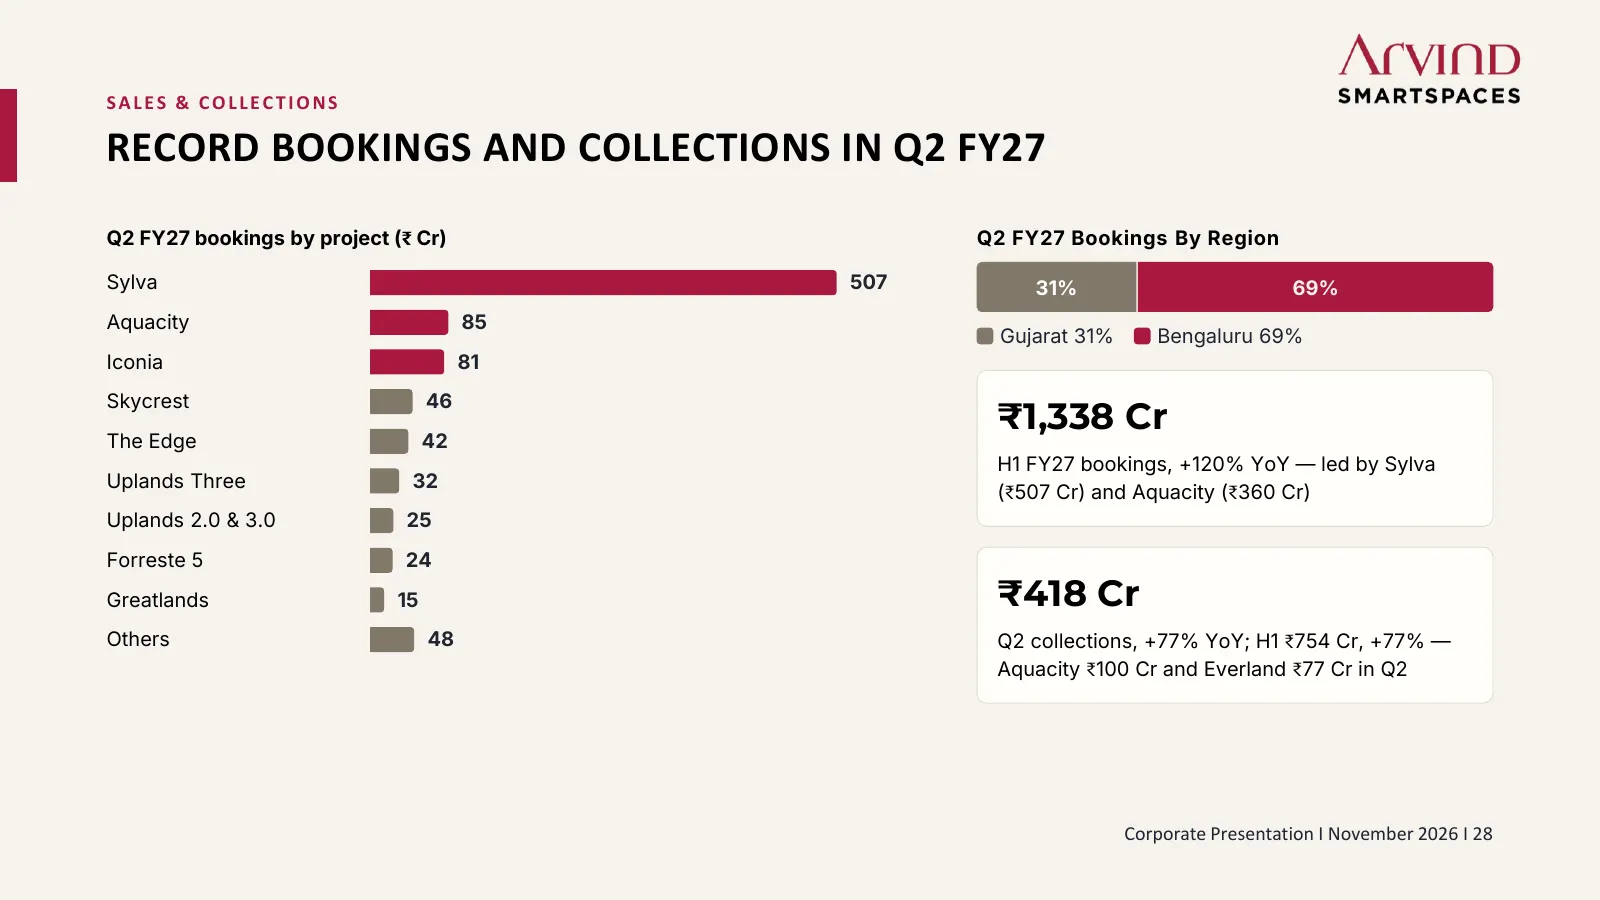
SALES & COLLECTIONS RECORD BOOKINGS AND COLLECTIONS IN Q2 FY27 Q2 FY27 bookings by project (₹ Cr) Q2 FY27 Bookings By Region Sylva 507 31% 69% Aquacity 85 Gujarat 31% Bengaluru 69% Iconia 81 Skycrest 46 ₹1,338 Cr The Edge 42 H1 FY27 bookings, +120% YoY — led by Sylva Uplands Three 32 (₹507 Cr) and A
Slide 29: Operating Cash Flow Funds Growth
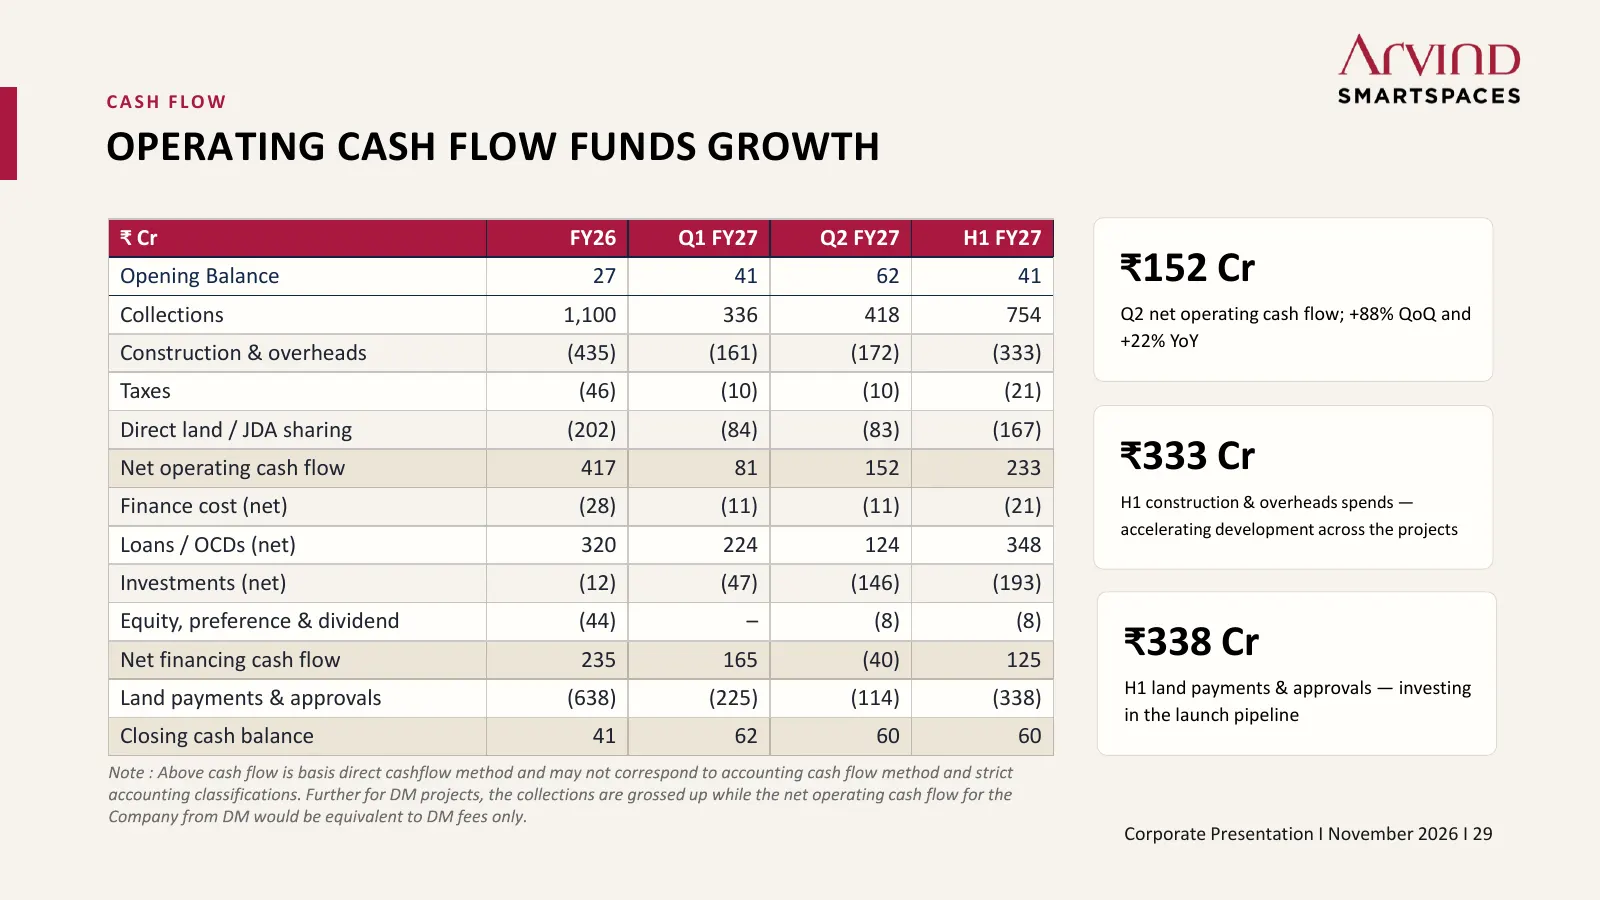
CASH FLOW OPERATING CASH FLOW FUNDS GROWTH ₹ Cr FY26 Q1 FY27 Q2 FY27 H1 FY27 Opening Balance 27 41 62 41 ₹152 Cr Collections 1,100 336 418 754 Q2 net operating cash flow; +88% QoQ and +22% YoY Construction & overheads (435) (161) (172) (333) Taxes (46) (10) (10) (21) Direct land / JDA sharing (202)
Slide 30: Profit & Loss Summary
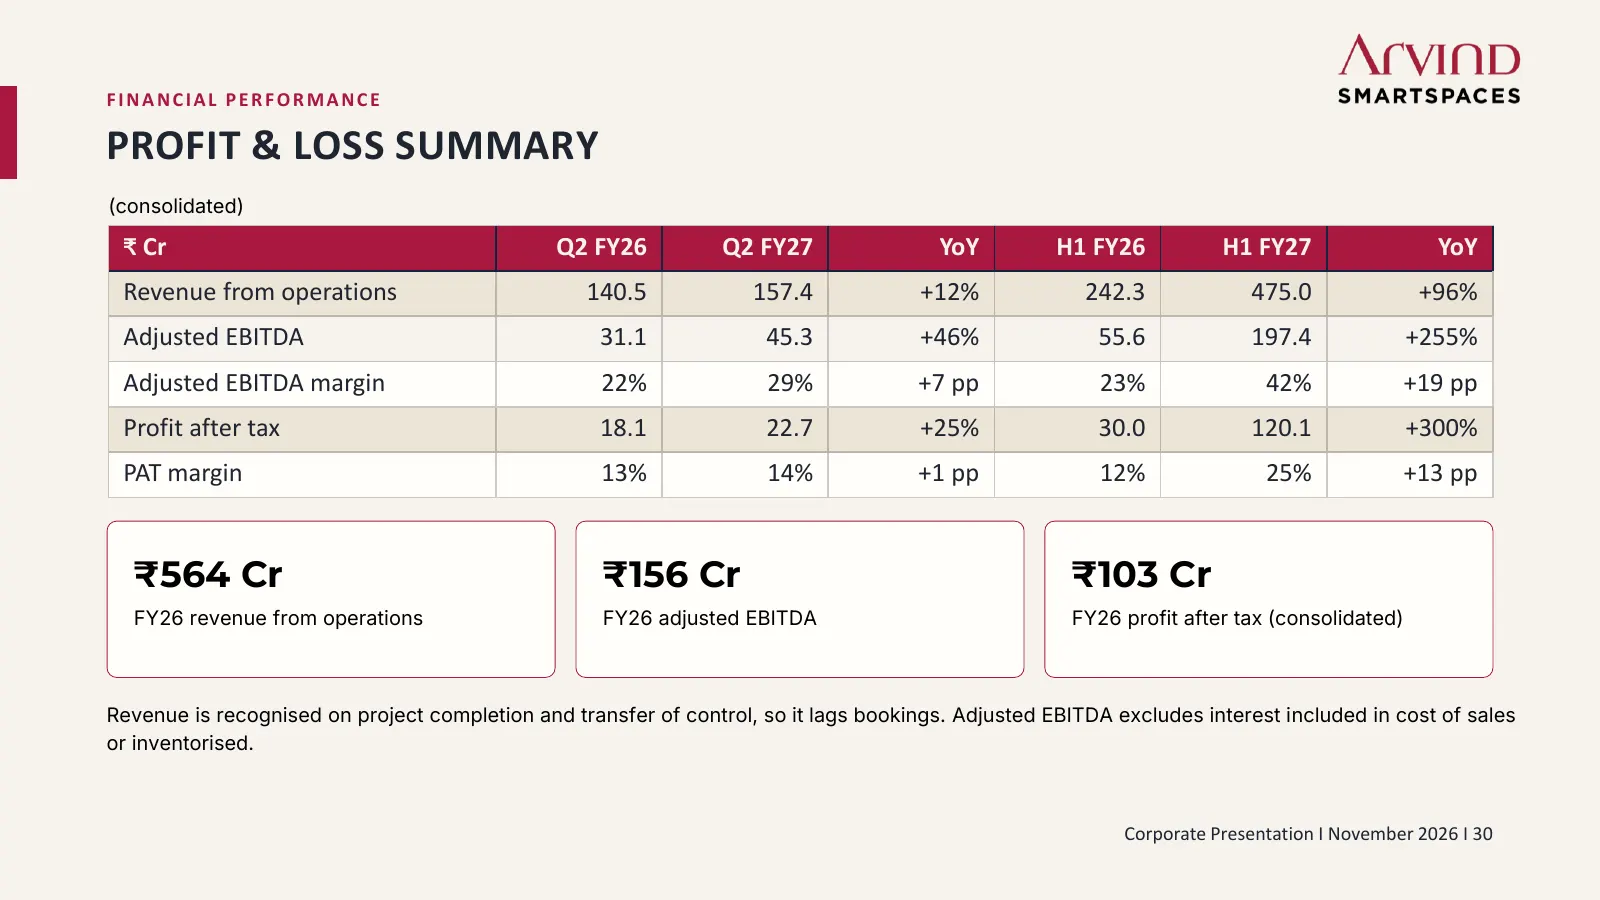
FINANCIAL PERFORMANCE PROFIT & LOSS SUMMARY (consolidated) ₹ Cr Q2 FY26 Q2 FY27 YoY H1 FY26 H1 FY27 YoY Revenue from operations 140.5 157.4 +12% 242.3 475.0 +96% Adjusted EBITDA 31.1 45.3 +46% 55.6 197.4 +255% Adjusted EBITDA margin 22% 29% +7 pp 23% 42% +19 pp Profit after tax 18.1 22.7 +25% 30.0 1
Slide 31: ₹4,550 Cr of Revenue Yet to Be Recognised
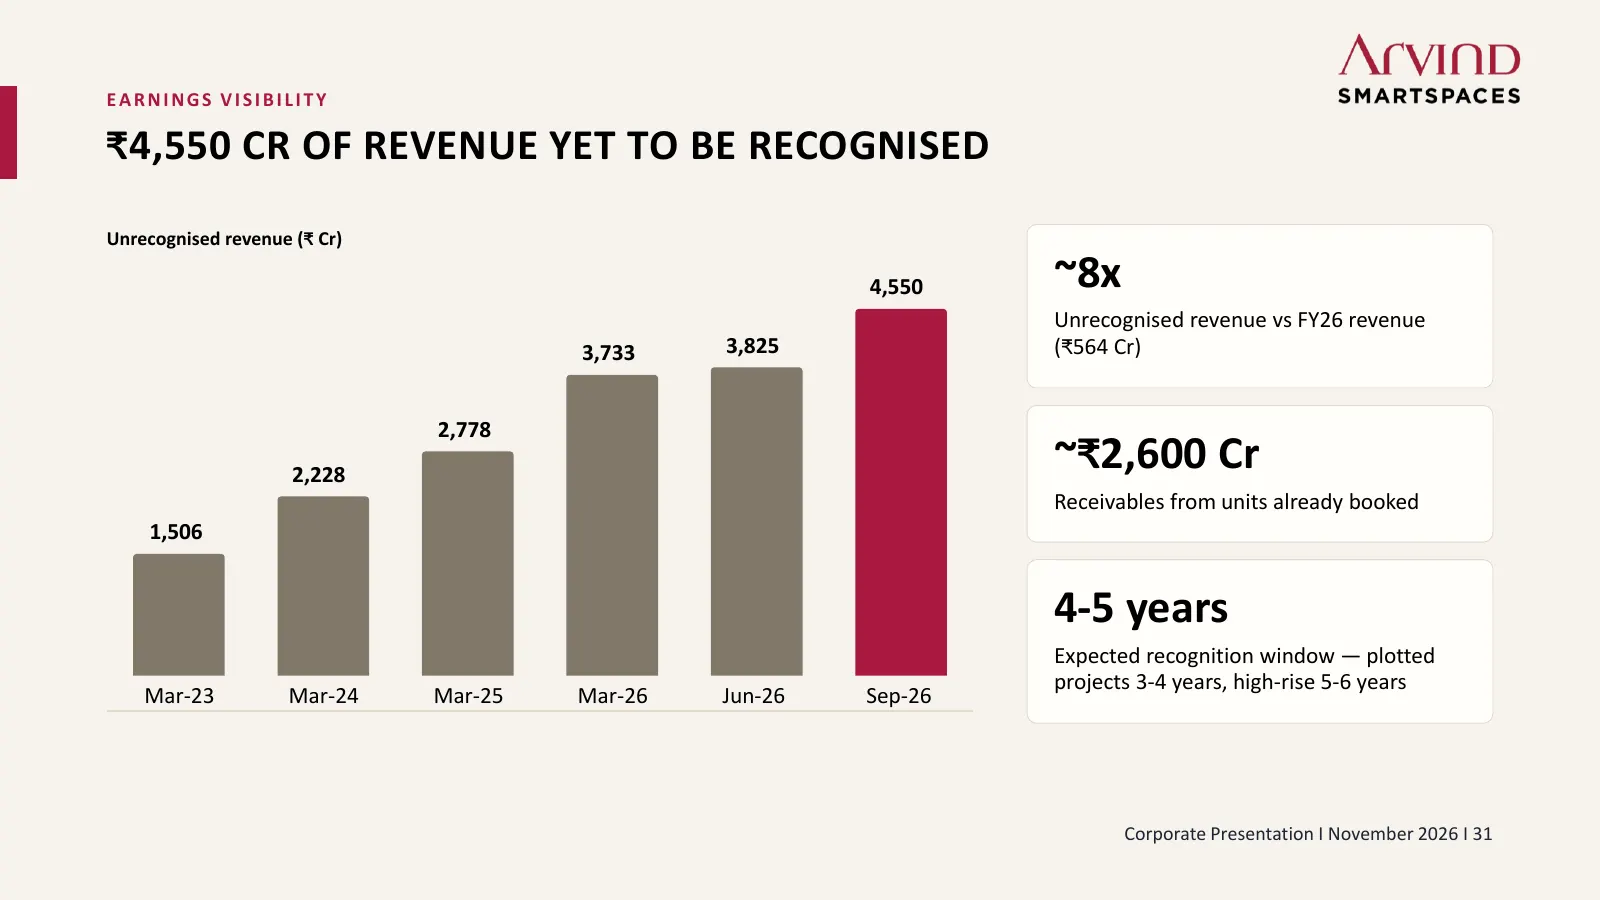
EARNINGS VISIBILITY ₹4,550 CR OF REVENUE YET TO BE RECOGNISED Unrecognised revenue (₹ Cr) 4,550 ~8x Unrecognised revenue vs FY26 revenue 3,733 3,825 (₹564 Cr) 2,778 2,228 ~₹2,600 Cr Receivables from units already booked 1,506 4-5 years Expected recognition window — plotted projects 3-4 years, high-r
Slide 32: Strong Pipeline Replenishment
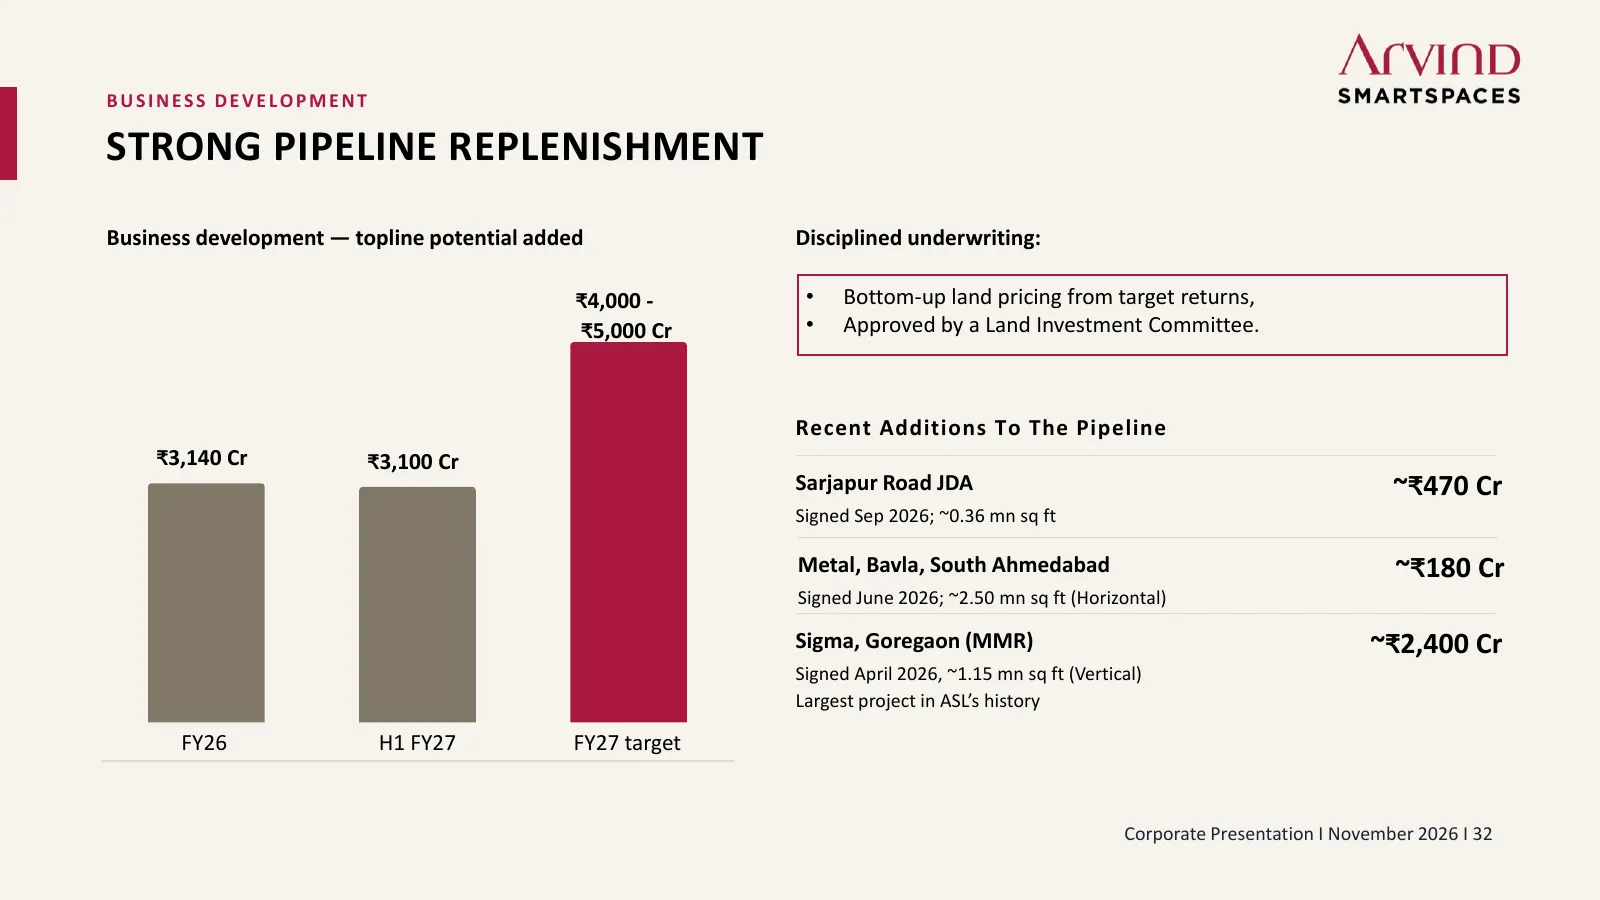
BUSINESS DEVELOPMENT STRONG PIPELINE REPLENISHMENT Business development — topline potential added Disciplined underwriting: ₹4,000 - • Bottom-up land pricing from target returns, ₹5,000 Cr • Approved by a Land Investment Committee. Recent Additions To The Pipeline ₹3,140 Cr ₹3,100 Cr Sarjapur Road J
Slide 33: Six Launches, ₹3,000–3,500 Cr of Inventory
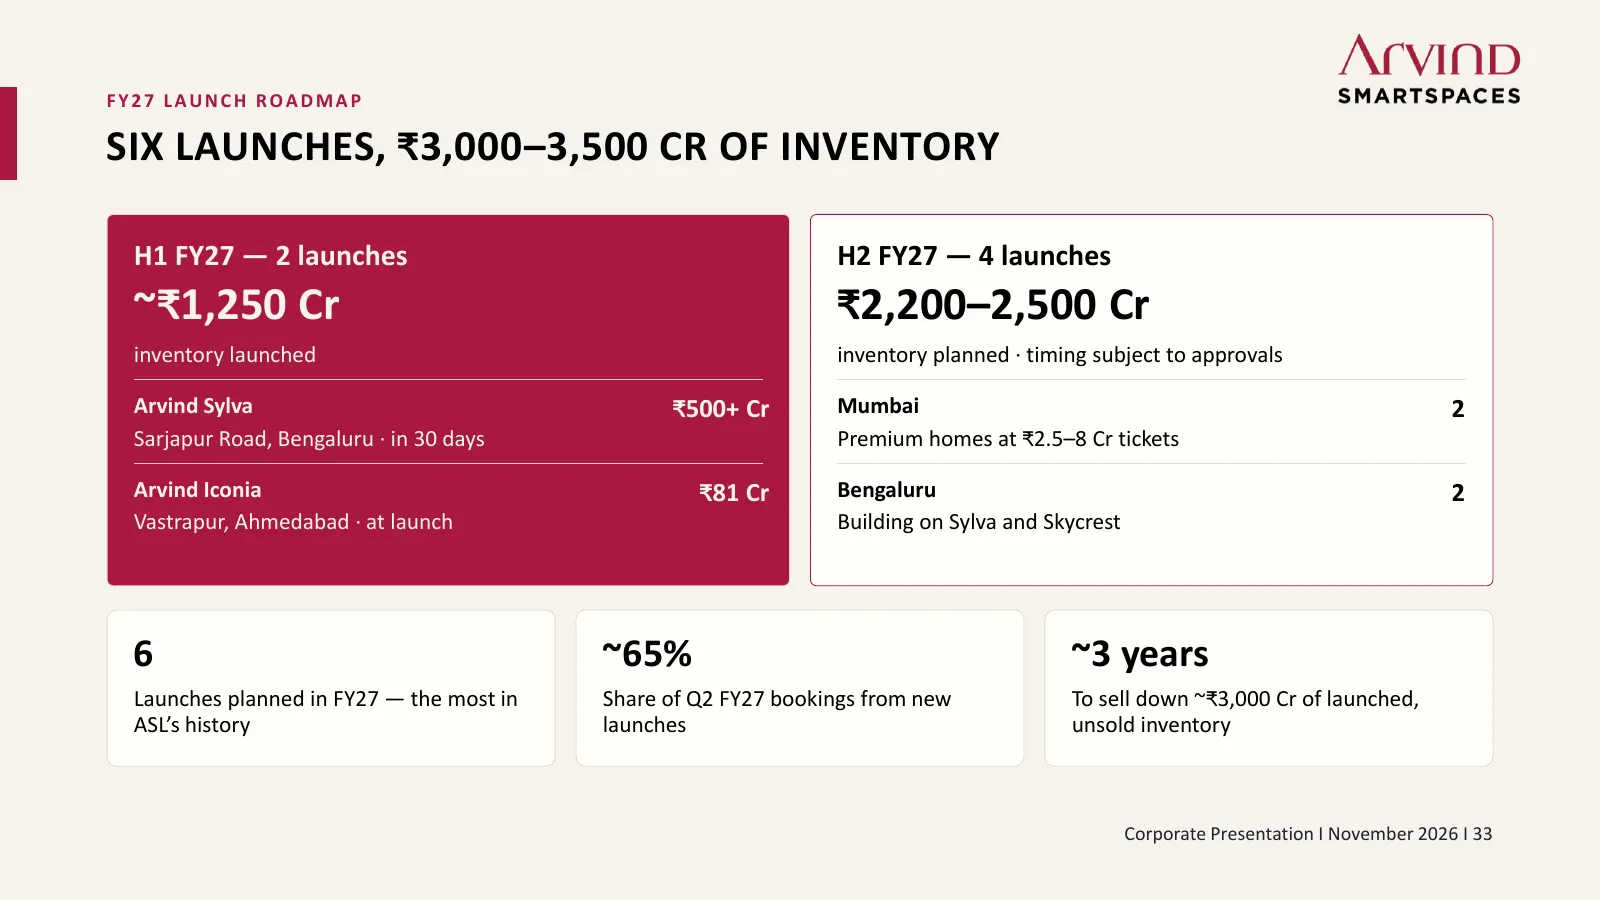
FY27 LAUNCH ROADMAP SIX LAUNCHES, ₹3,000–3,500 CR OF INVENTORY H1 FY27 — 2 launches H2 FY27 — 4 launches ~₹1,250 Cr ₹2,200–2,500 Cr inventory launched inventory planned · timing subject to approvals Arvind Sylva ₹500+ Cr Mumbai 2 Sarjapur Road, Bengaluru · in 30 days Premium homes at ₹2.5–8 Cr ticke
Slide 34: Project Overview
PROJECT DETAILS PROJECT OVERVIEW Scaling to the Next Orbit AS ON 30 September 2026 Corporate Presentation I November 2026 I 34
Slide 35: 19 Projects Under Execution
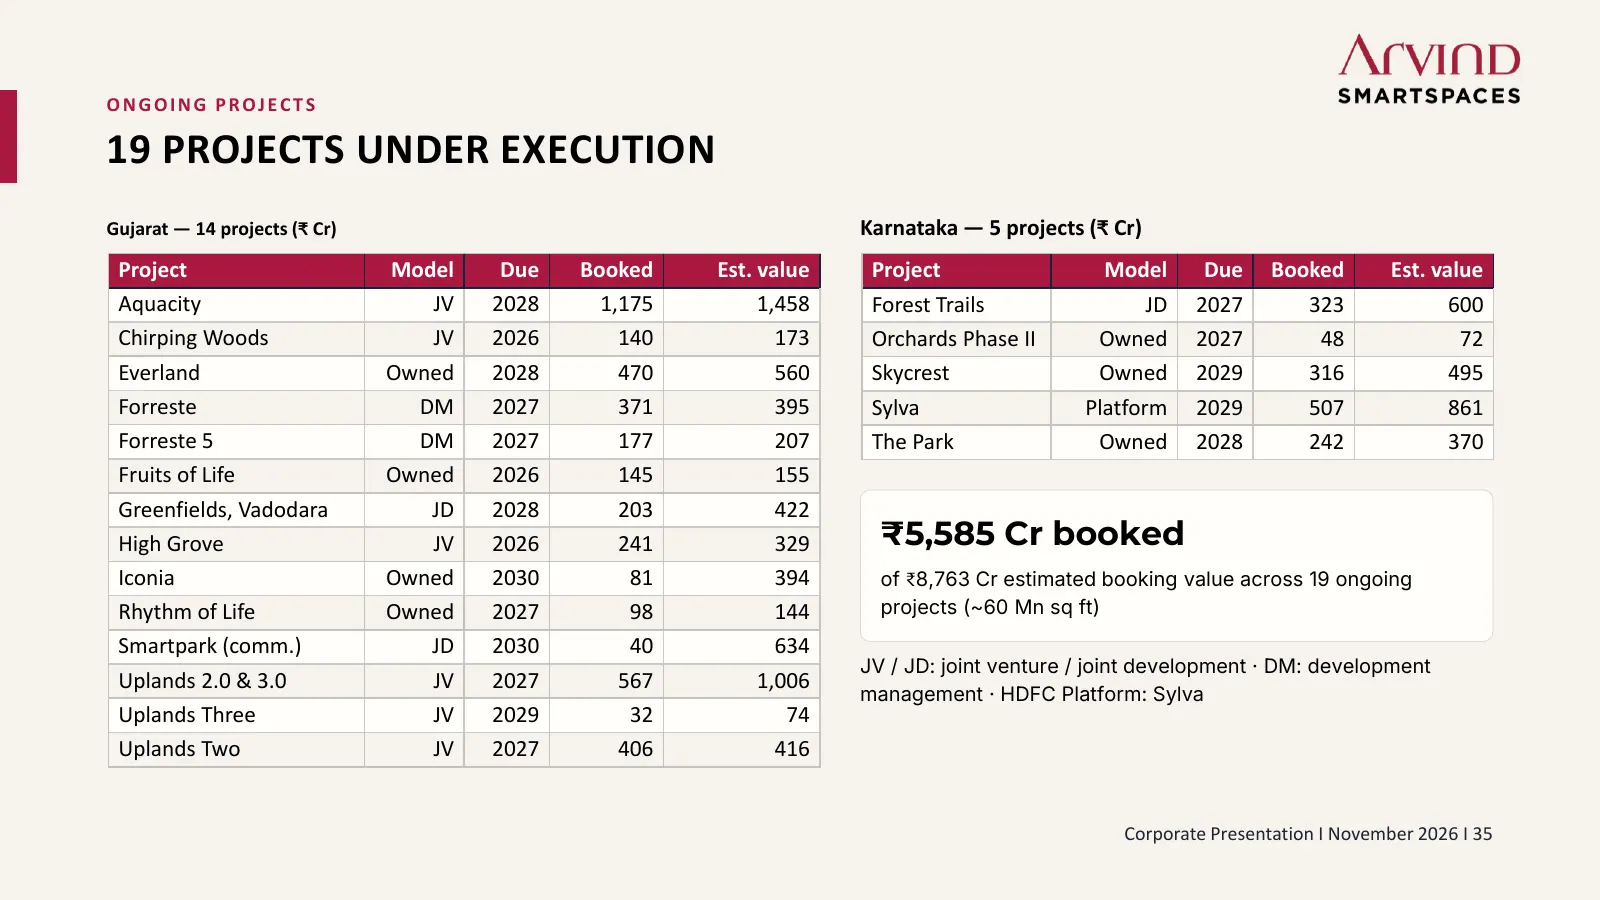
ONGOING PROJECTS 19 PROJECTS UNDER EXECUTION Gujarat — 14 projects (₹ Cr) Karnataka — 5 projects (₹ Cr) Project Model Due Booked Est. value Project Model Due Booked Est. value Aquacity JV 2028 1,175 1,458 Forest Trails JD 2027 323 600 Chirping Woods JV 2026 140 173 Orchards Phase II Owned 2027 48 72
Slide 36: ~₹9,000 Cr of Planned Projects
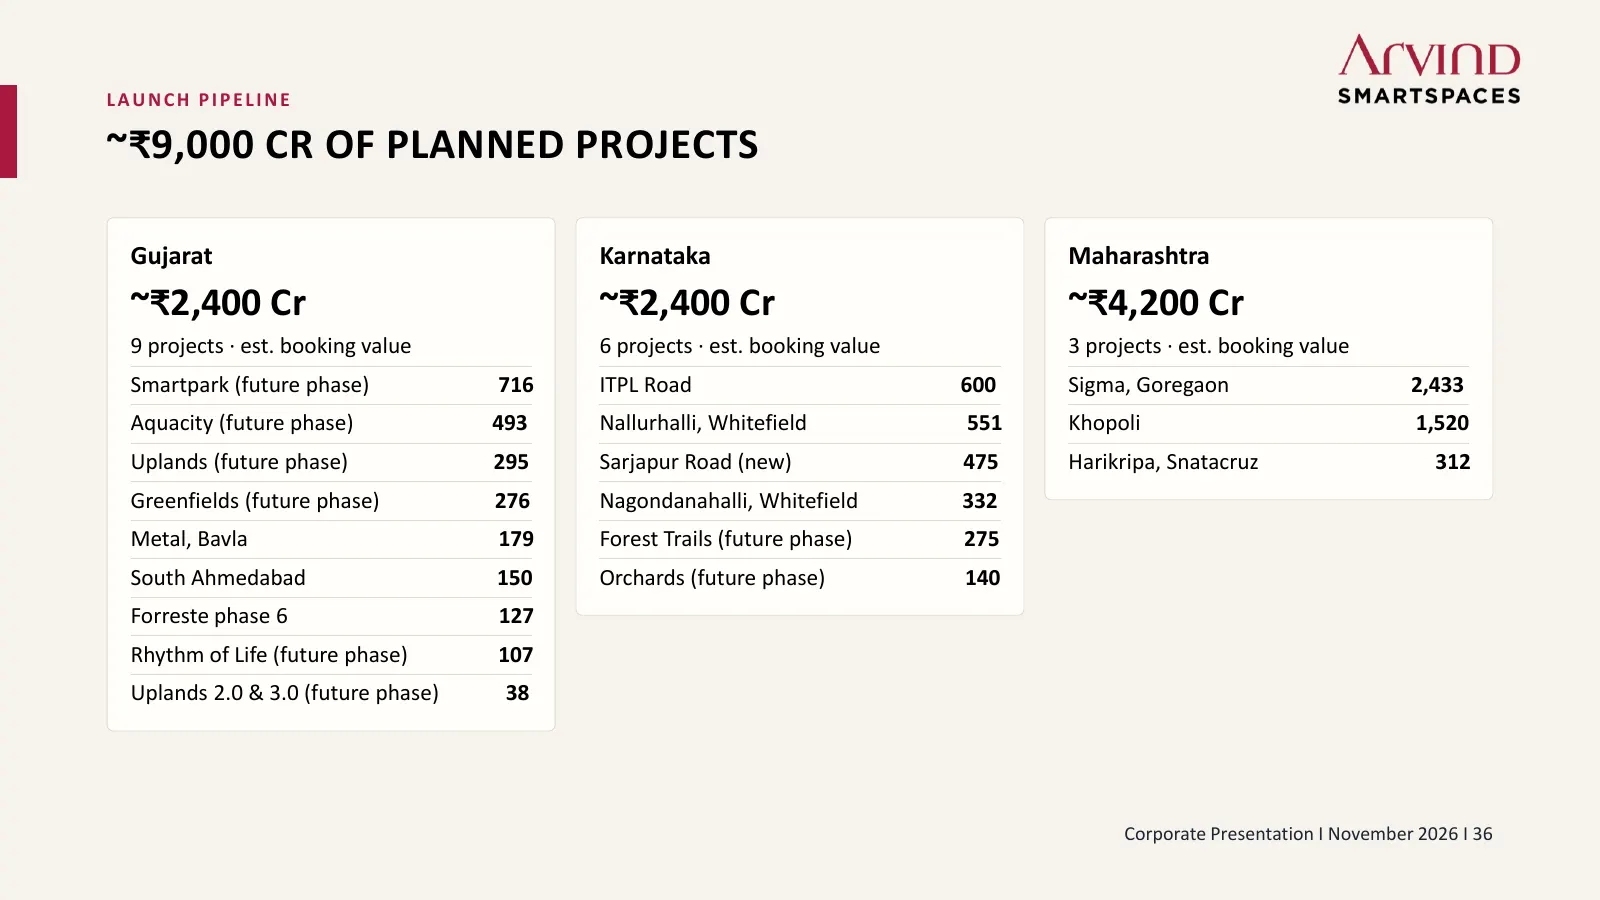
LAUNCH PIPELINE ~₹9,000 CR OF PLANNED PROJECTS Gujarat Karnataka Maharashtra ~₹2,400 Cr ~₹2,400 Cr ~₹4,200 Cr 9 projects · est. booking value 6 projects · est. booking value 3 projects · est. booking value Smartpark (future phase) 716 ITPL Road 600 Sigma, Goregaon 2,433 Aquacity (future phase) 493 N
Slide 37: Governance, Management & ESG
KEY DETAILS GOVERNANCE, Scaling to the Next Orbit MANAGEMENT & ESG Corporate Presentation I November 2026 I 37
Slide 38: Board of Directors
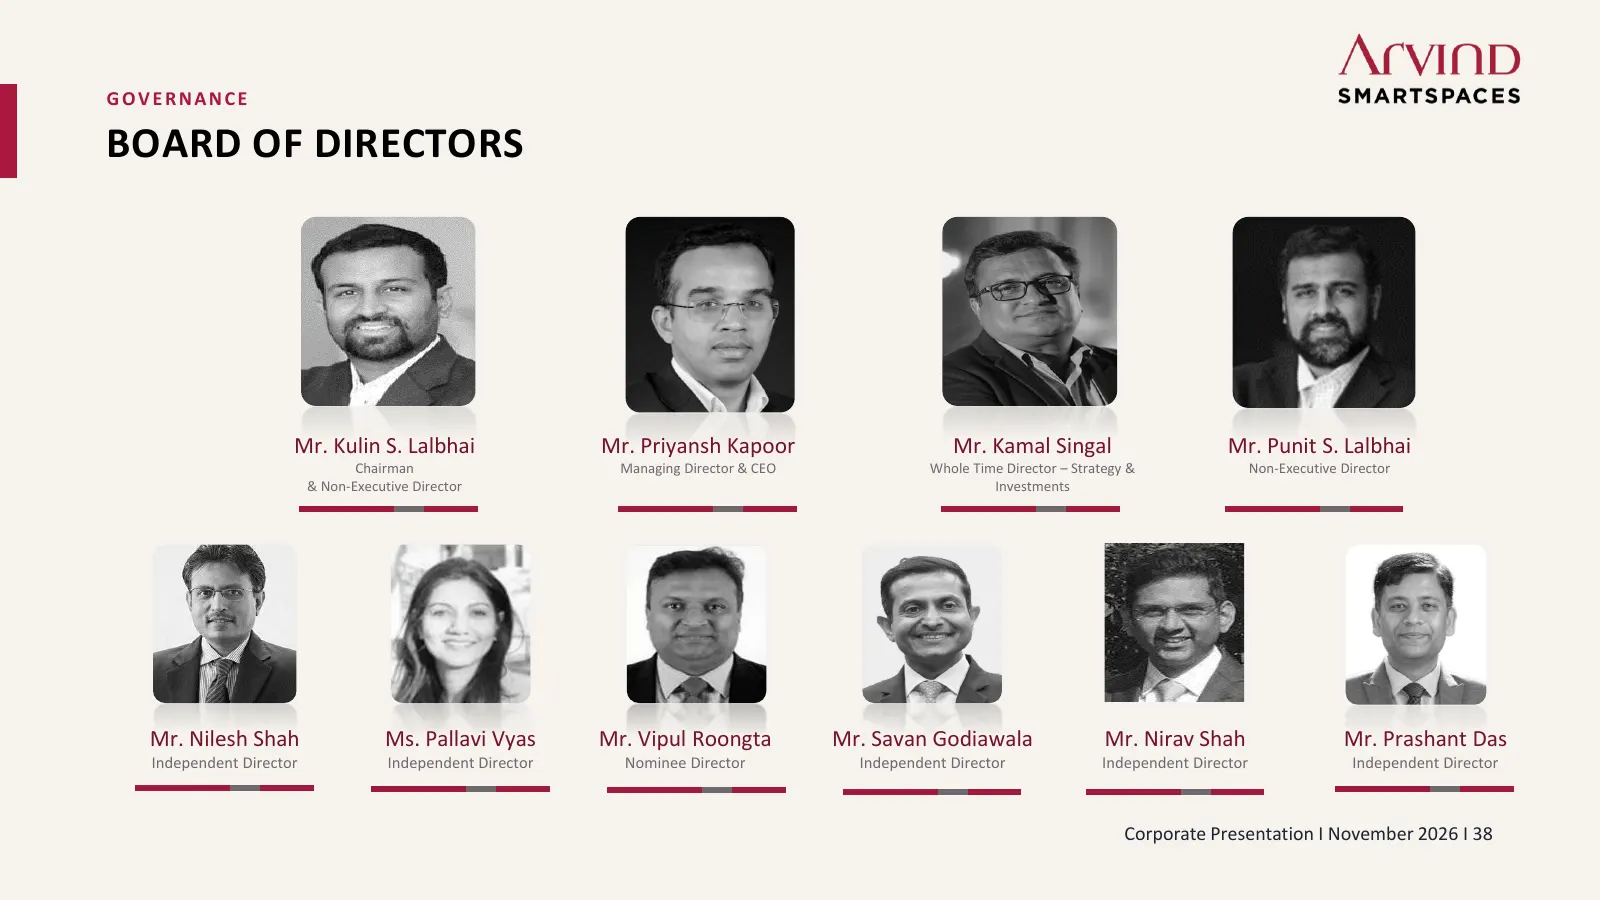
GOVERNANCE BOARD OF DIRECTORS Mr. Kulin S. Lalbhai Mr. Priyansh Kapoor Mr. Kamal Singal Mr. Punit S. Lalbhai Chairman Managing Director & CEO Whole Time Director – Strategy & Non-Executive Director & Non-Executive Director Investments Mr. Nilesh Shah Ms. Pallavi Vyas Mr. Vipul Roongta Mr. Savan Godi
Slide 39: Led by Professional Management Team
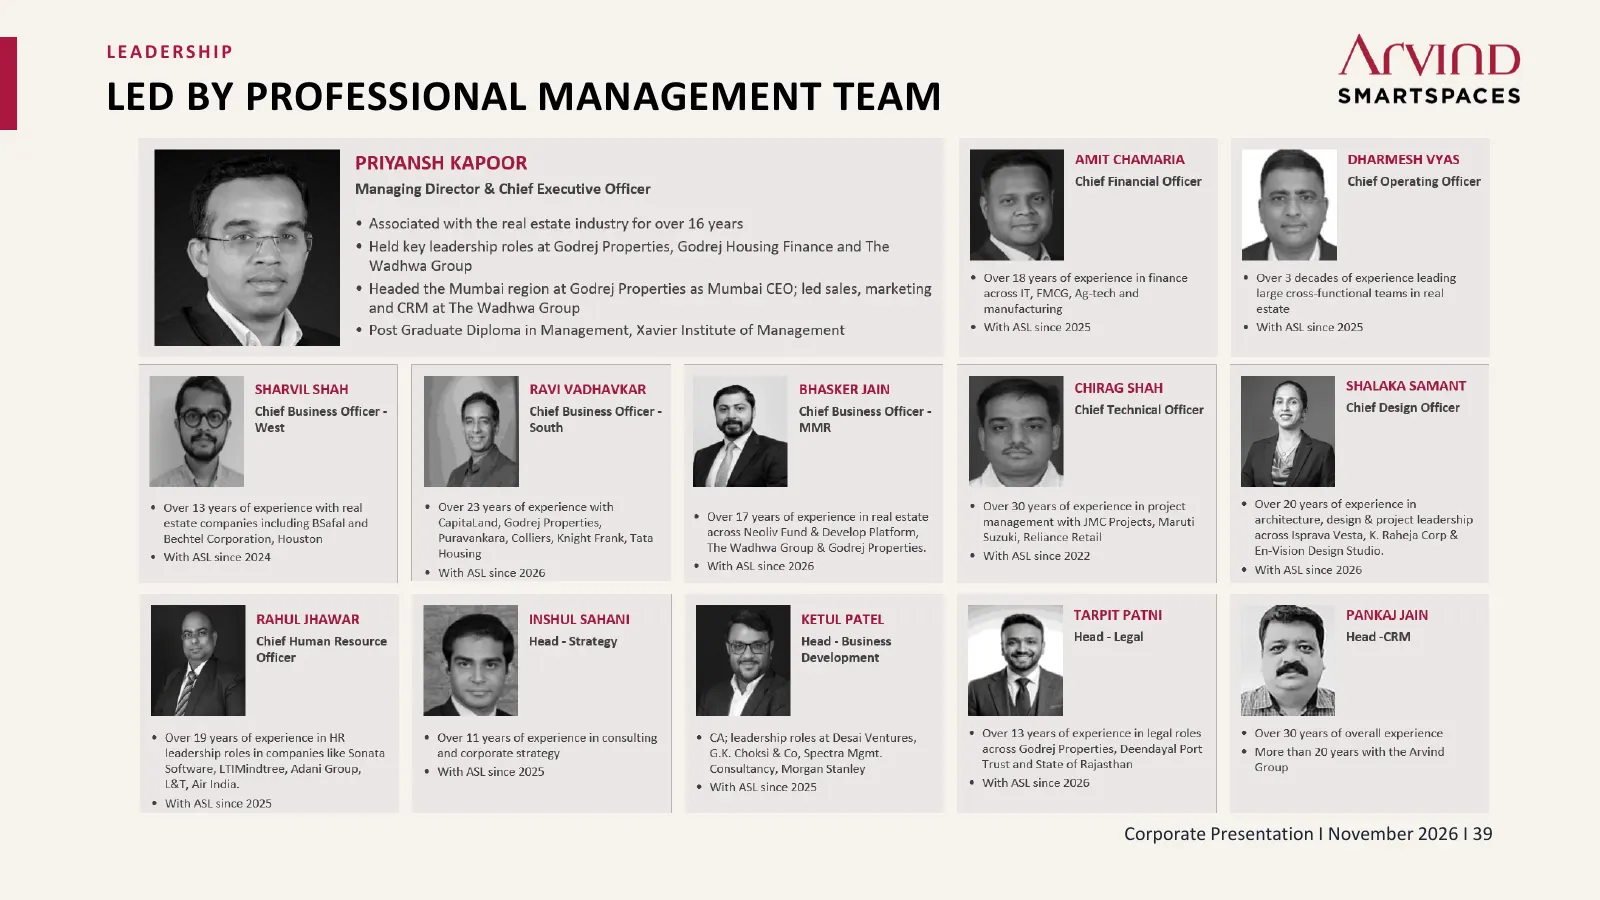
LEADERSHIP LED BY PROFESSIONAL MANAGEMENT TEAM Corporate Presentation I November 2026 I 39
Slide 40: Responsible Growth, Recognised
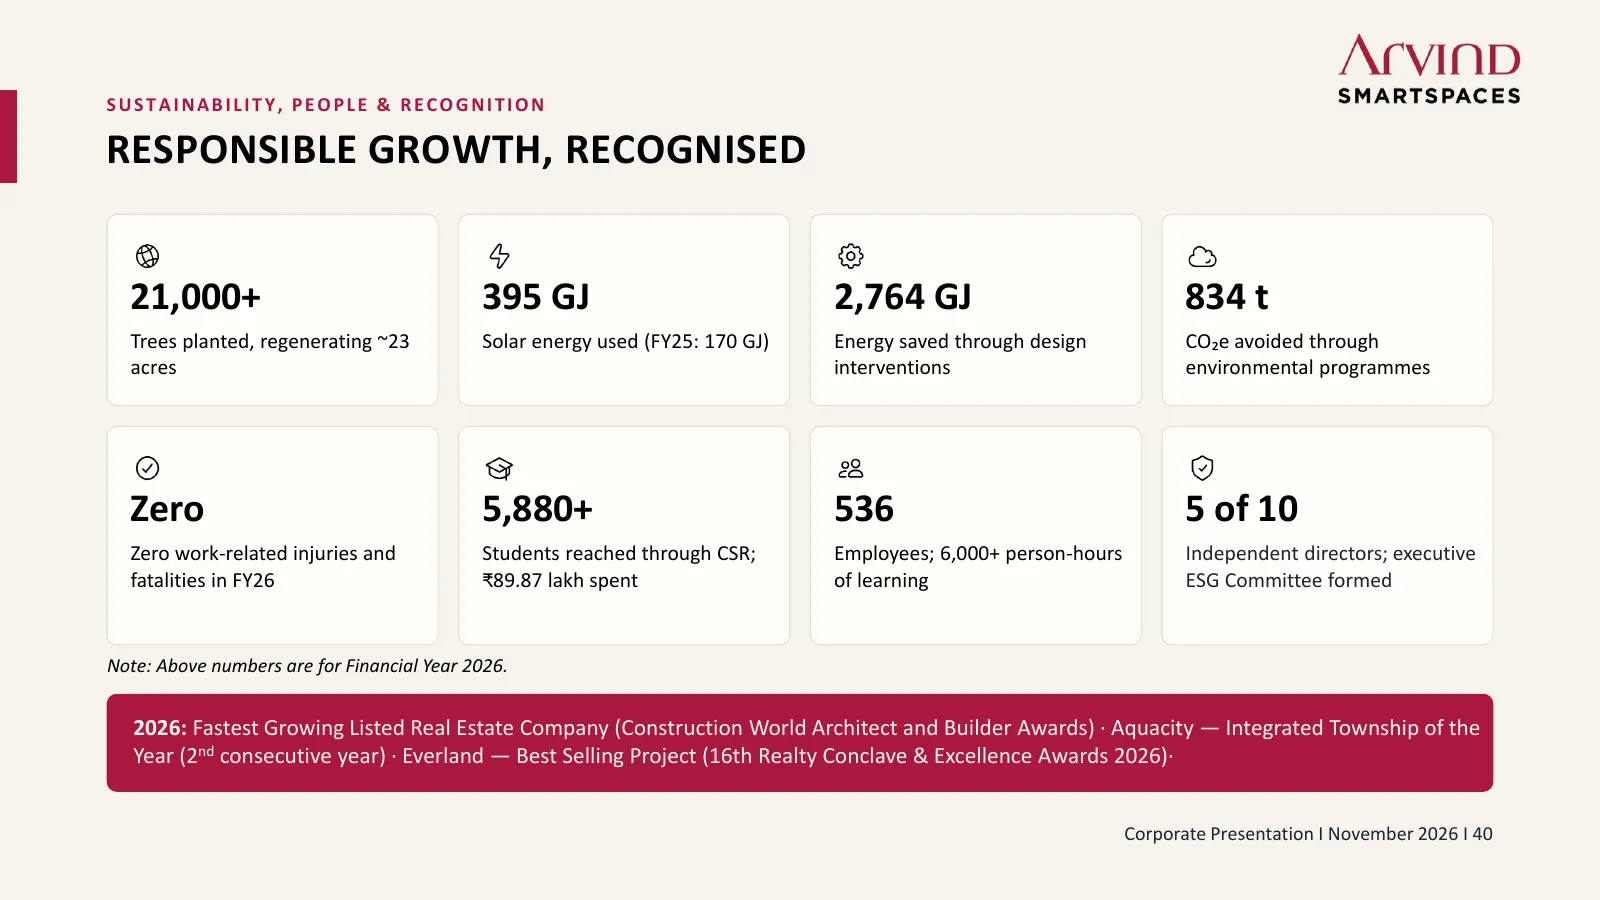
SUSTAINABILITY, PEOPLE & RECOGNITION RESPONSIBLE GROWTH, RECOGNISED 21,000+ 395 GJ 2,764 GJ 834 t Trees planted, regenerating ~23 Solar energy used (FY25: 170 GJ) Energy saved through design CO₂e avoided through acres interventions environmental programmes Zero 5,880+ 536 5 of 10 Zero work-related i
Slide 41: Thank You
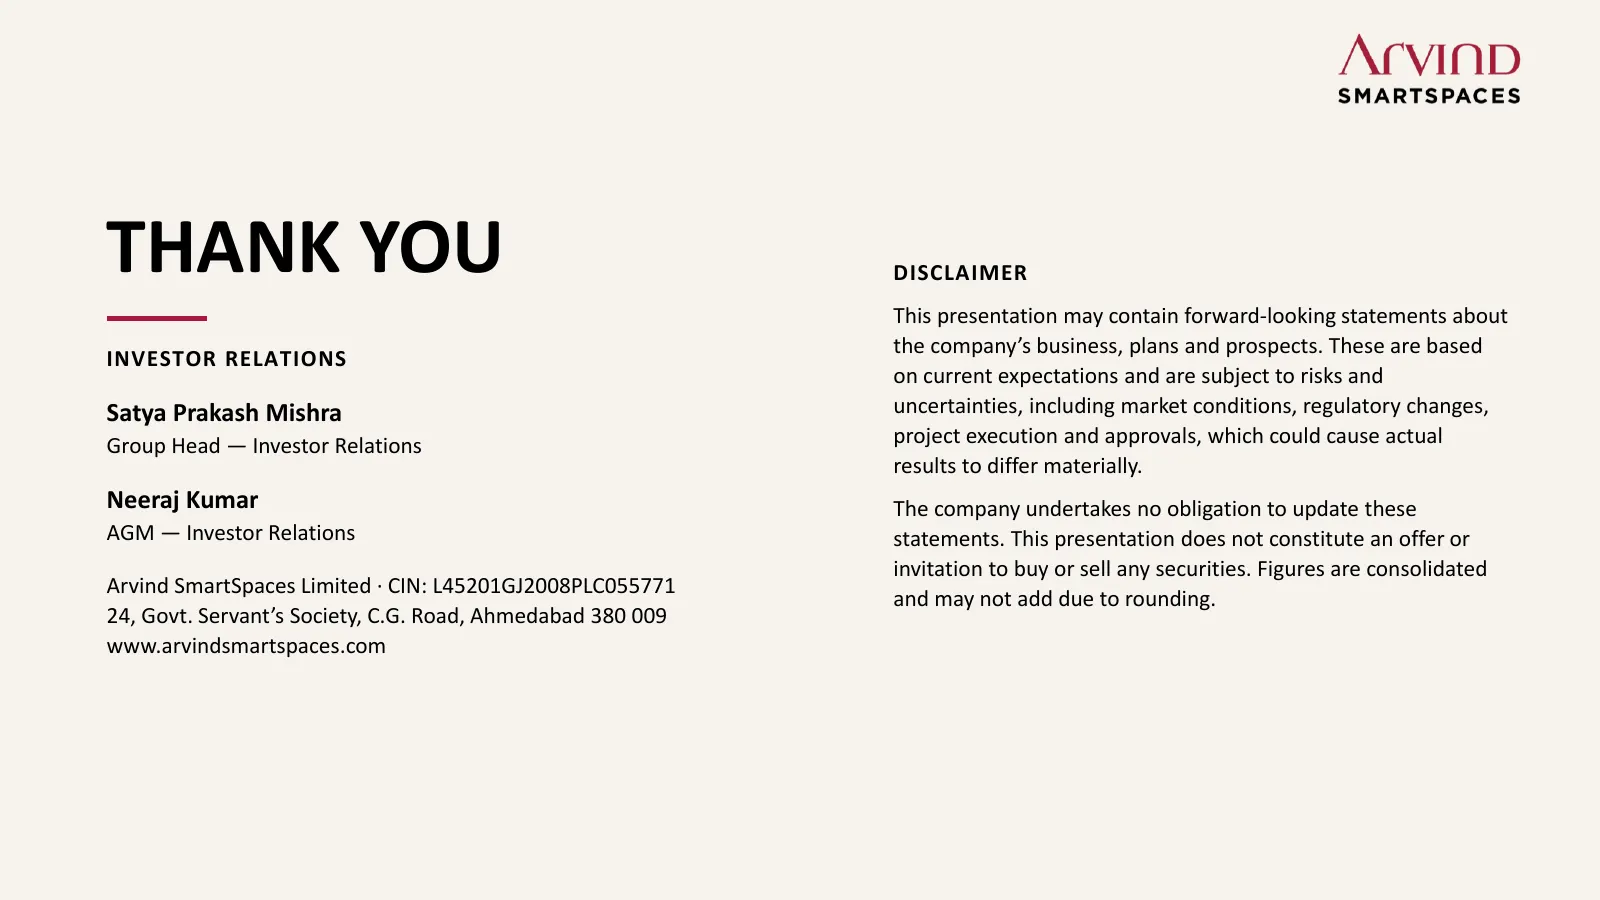
THANK YOU DISCLAIMER This presentation may contain forward-looking statements about the company’s business, plans and prospects. These are based INVESTOR RELATIONS on current expectations and are subject to risks and Satya Prakash Mishra uncertainties, including market conditions, regulatory changes
Source: company website
More decks from Arvind SmartSpaces Ltd.
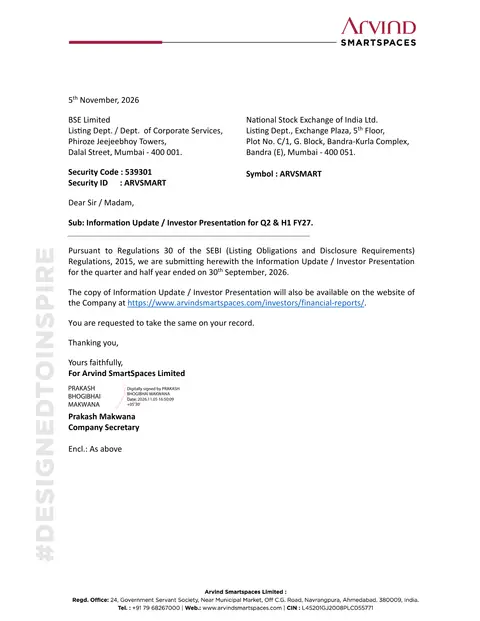 Q2 FY27 Earnings Presentation40 slides · Nov 5, 2026
 Q1 FY27 Earnings Presentation36 slides · Aug 7, 2026
 Q4 FY26 Earnings Presentation73 slides · May 20, 2026
 Q3 FY26 Earnings Presentation79 slides · Feb 10, 2026
 H1 FY26 Earnings Presentation81 slides · Nov 3, 2025
 H1 FY26 Earnings Presentation80 slides · November 2025