ATS Corporation · TSX:ATS
ATS — Investor Presentation (August 2023)
20 slides from ATS's investor presentation, August 2023
Slide 1: Investor Presentation August 2023
Investor Presentation August 2023
Slide 2: Disclaimer
Disclaimer Note to Reader: This informational meeting regarding ATS Corporation is for you to familiarize yourself with the Company. We are not making any offers of securities at this time, and cannot accept orders for any securities at this time. Accordingly, this presentation shall not constitute
Slide 3: Disclaimer: Non-IFRS and Other Financial Measures
Disclaimer Non-IFRS and Other Financial Measures: Throughout this presentation management uses certain non-IFRS measures, non-IFRS ratios and supplementary financial measures to evaluate the performance of the Company. The terms “adjusted EBITDA”, and "organic revenue", are non-IFRS measures, “adjus
Slide 4: ATS at a Glance
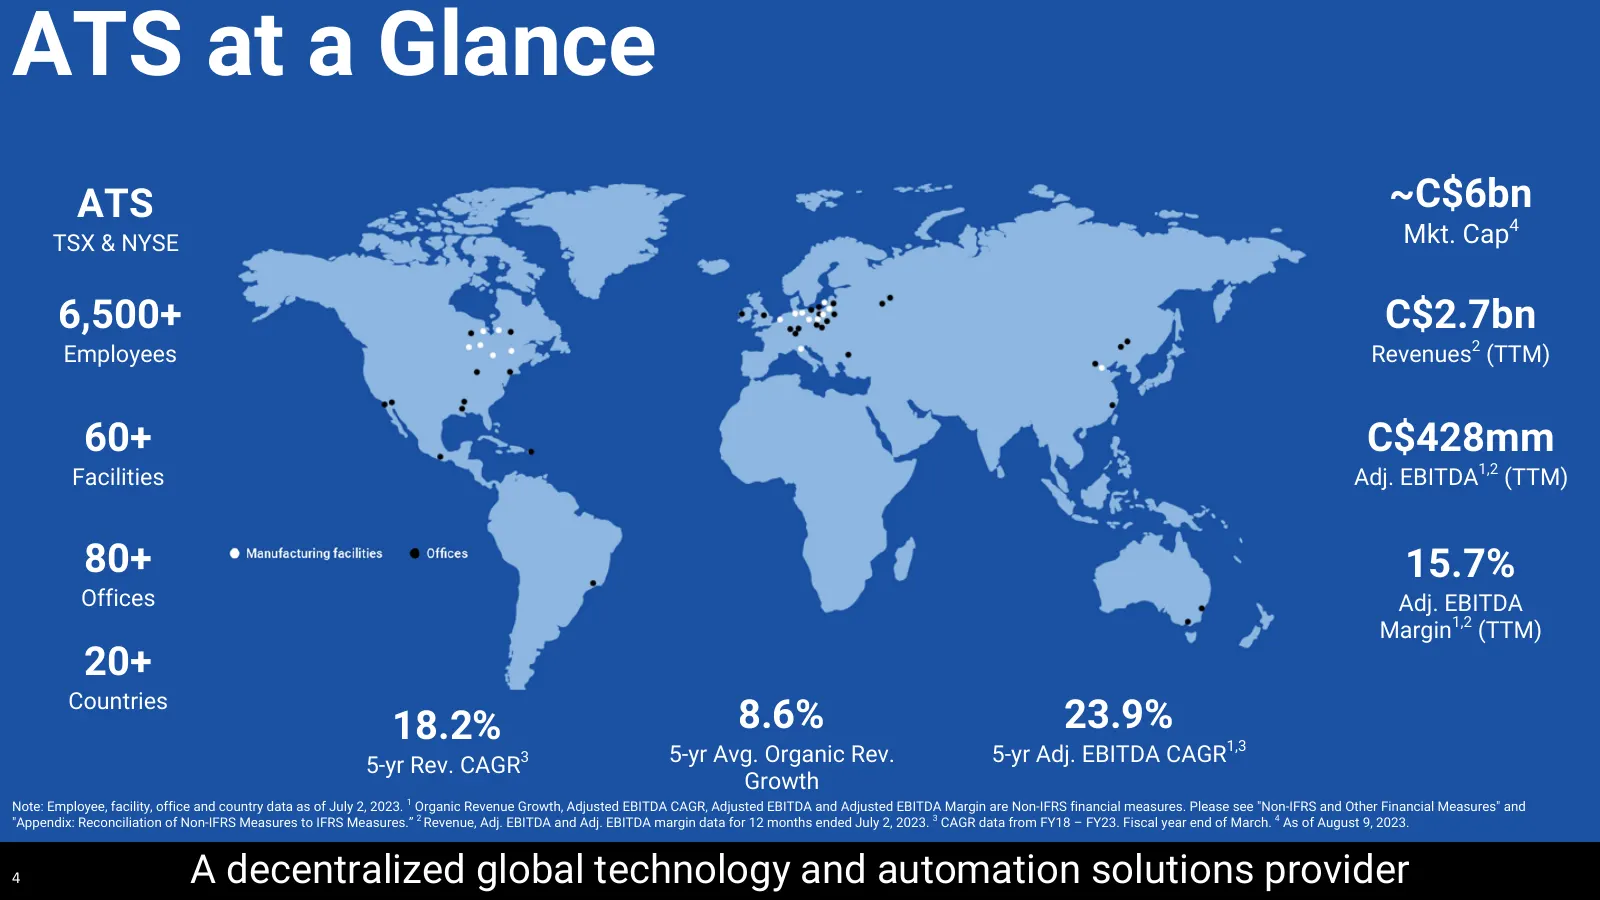
ATS at a Glance ATS ~C$6bn TSX & NYSE Mkt. Cap4 6,500+ C$2.7bn Employees Revenues2 (TTM) 60+ C$428mm Facilities Adj. EBITDA1,2 (TTM) 80+ 15.7% Offices Adj. EBITDA Margin1,2 (TTM) 20+ Countries 18.2% 8.6% 23.9% 5-yr Rev. CAGR3 5-yr Avg. Organic Rev. 5-yr Adj. EBITDA CAGR1,3 Growth Note: Employee, fac
Slide 5: What We Do
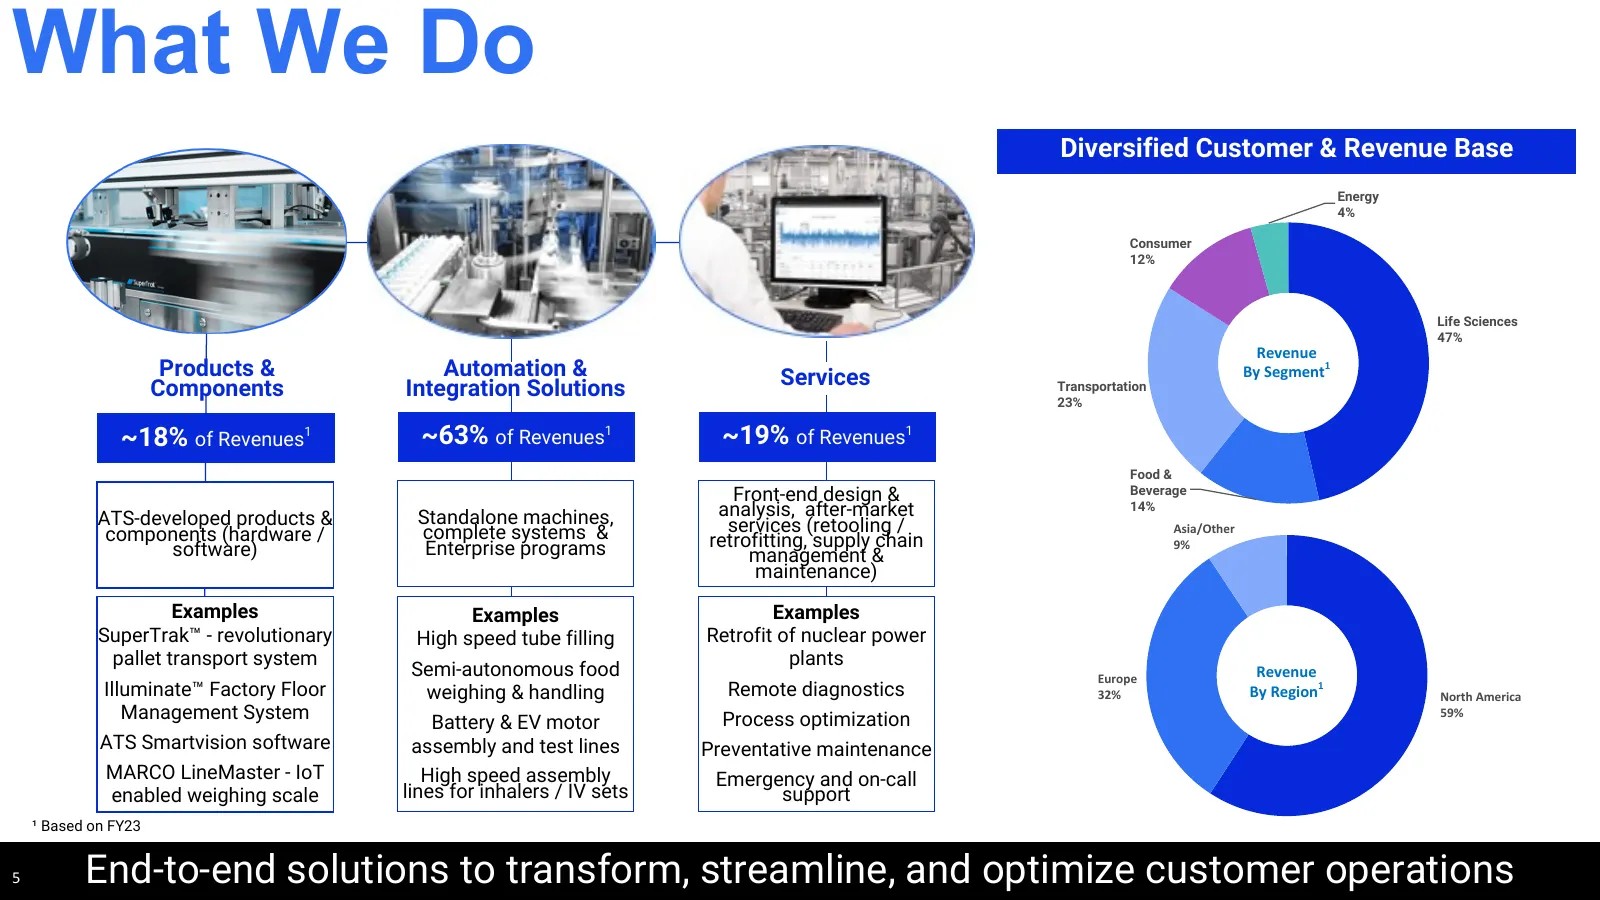
What We Do Diversified Customer & Revenue Base Energy 4% Consumer 12% Life Sciences 47% Revenue Products & Automation & Services By Segment1 Components Integration Solutions Transportation 23% ~18% of Revenues1 ~63% of Revenues1 ~19% of Revenues1 Food & Front-end design & Beverage ATS-developed prod
Slide 6: Key Investment Highlights
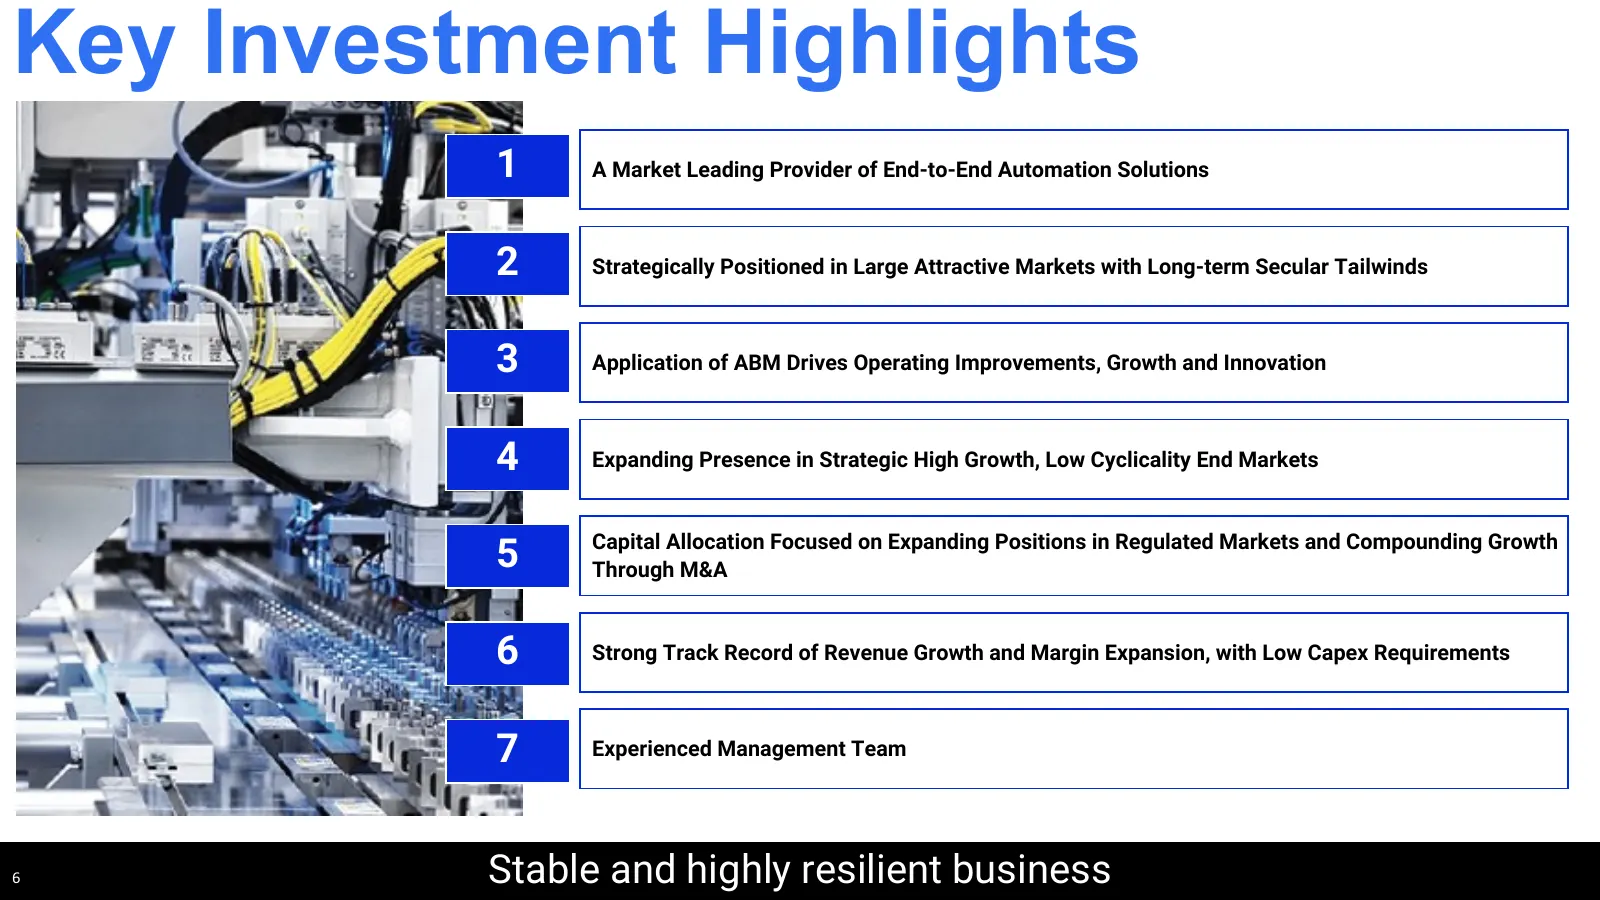
Key Investment Highlights 1 A Market Leading Provider of End-to-End Automation Solutions 2 Strategically Positioned in Large Attractive Markets with Long-term Secular Tailwinds 3 Application of ABM Drives Operating Improvements, Growth and Innovation 4 Expanding Presence in Strategic High Growth, Lo
Slide 7: Provider of End-to-End Automation Solutions
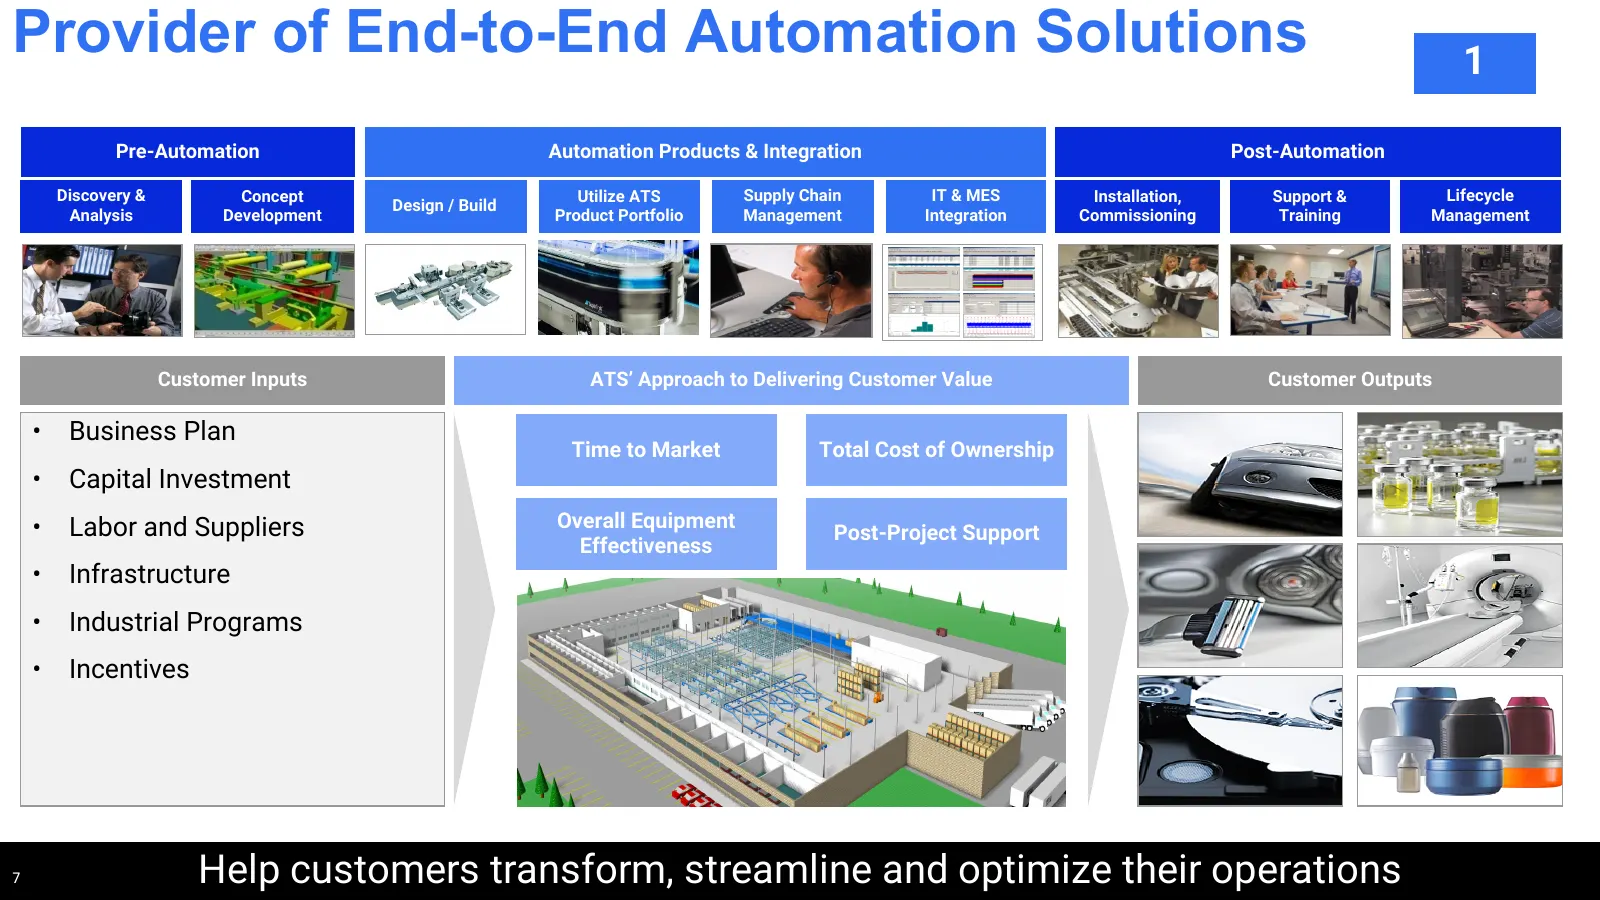
Provider of End-to-End Automation Solutions 1 Pre-Automation Automation Products & Integration Post-Automation Discovery & Concept Utilize ATS Supply Chain IT & MES Installation, Support & Lifecycle Design / Build Analysis Development Product Portfolio Management Integration Commissioning Training M
Slide 8: ATS Solution in Action
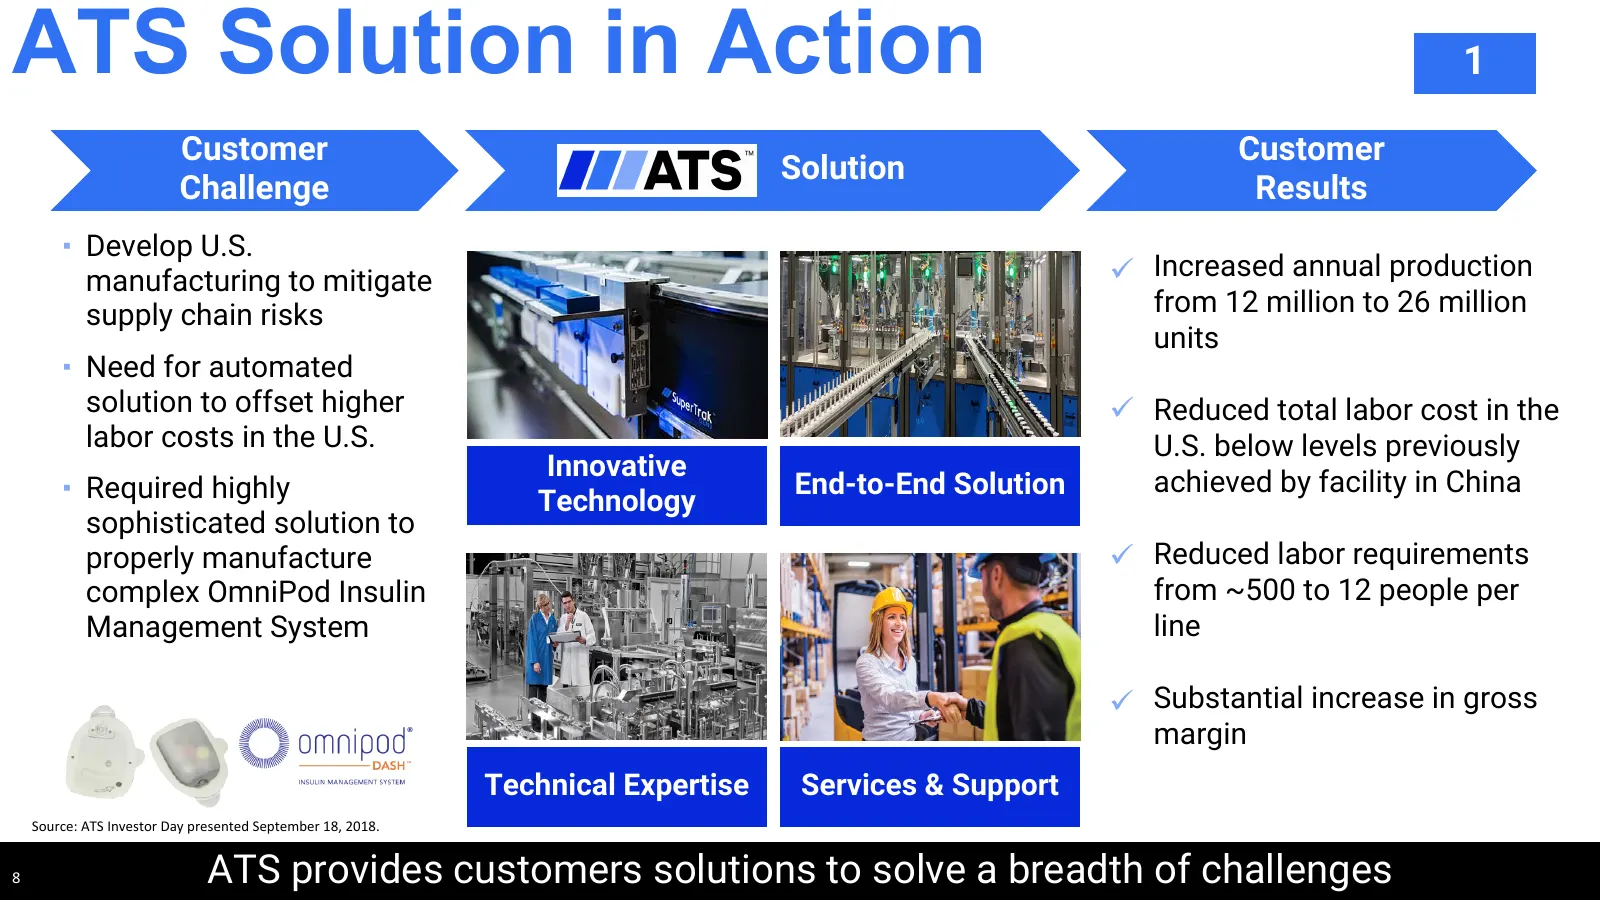
ATS Solution in Action 1 Customer Customer Solution Challenge Results ▪ Develop U.S. manufacturing to mitigate ü Increased annual production supply chain risks from 12 million to 26 million units ▪ Need for automated solution to offset higher ü Reduced total labor cost in the labor costs in the U.S.
Slide 9: Strategically Positioned in Large Attractive Markets
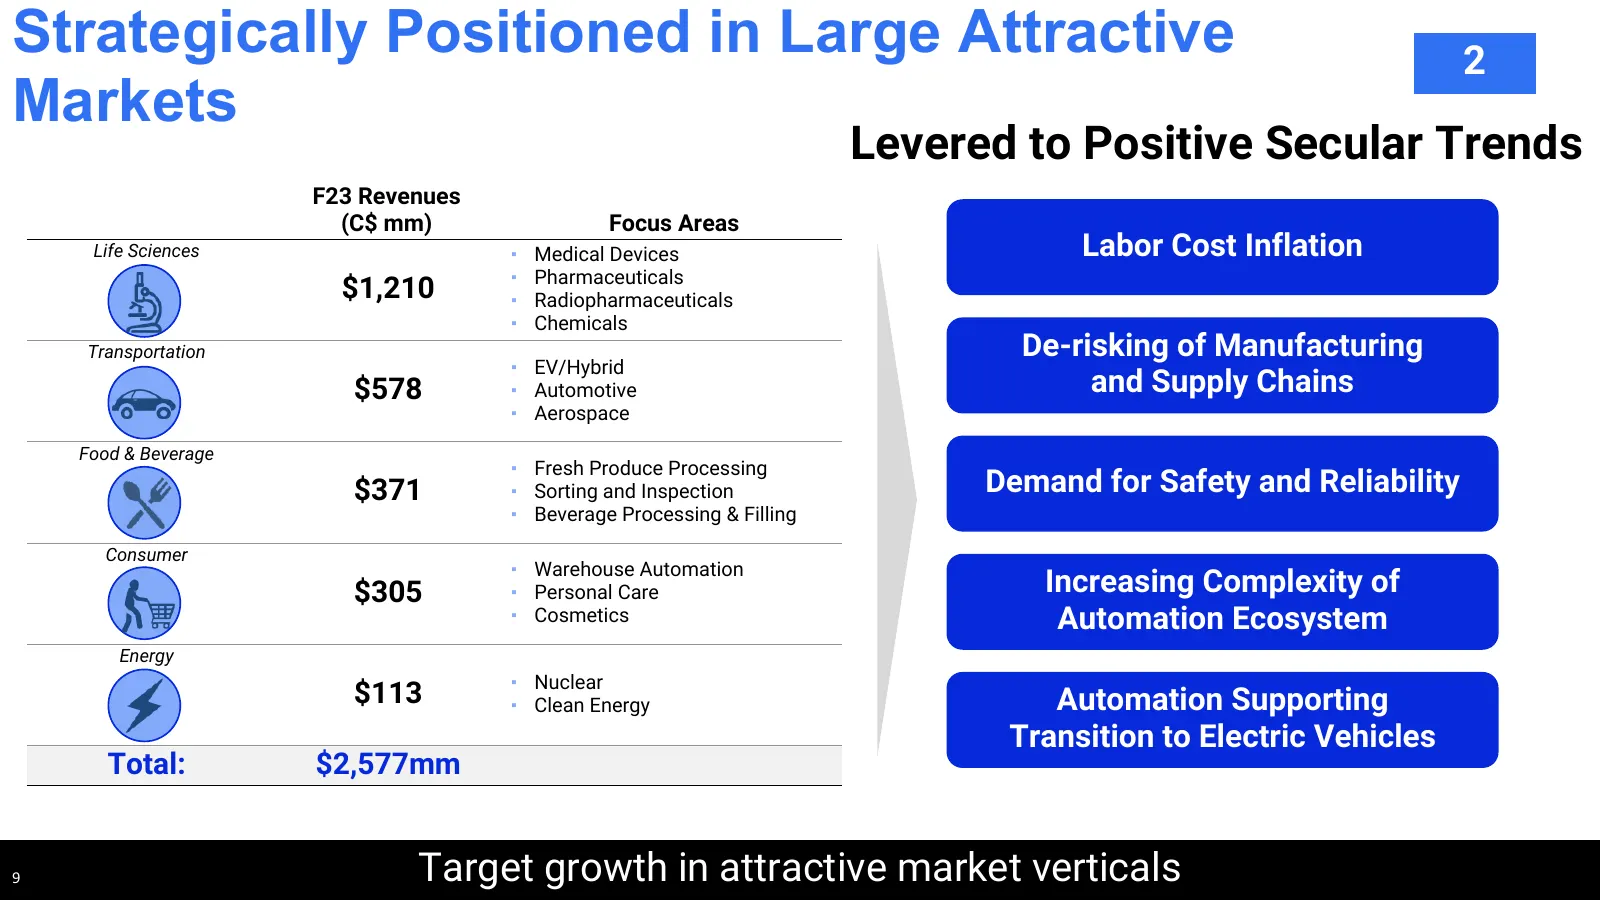
Strategically Positioned in Large Attractive 2 Markets Levered to Positive Secular Trends F23 Revenues (C$ mm) Focus Areas Life Sciences ▪ Medical Devices Labor Cost Inflation ▪ Pharmaceuticals $1,210 ▪ Radiopharmaceuticals ▪ Chemicals Transportation De-risking of Manufacturing ▪ EV/Hybrid $578 ▪ Au
Slide 10: Application of ATS Business Model (ABM) Drives Innovation and Operating Improvement
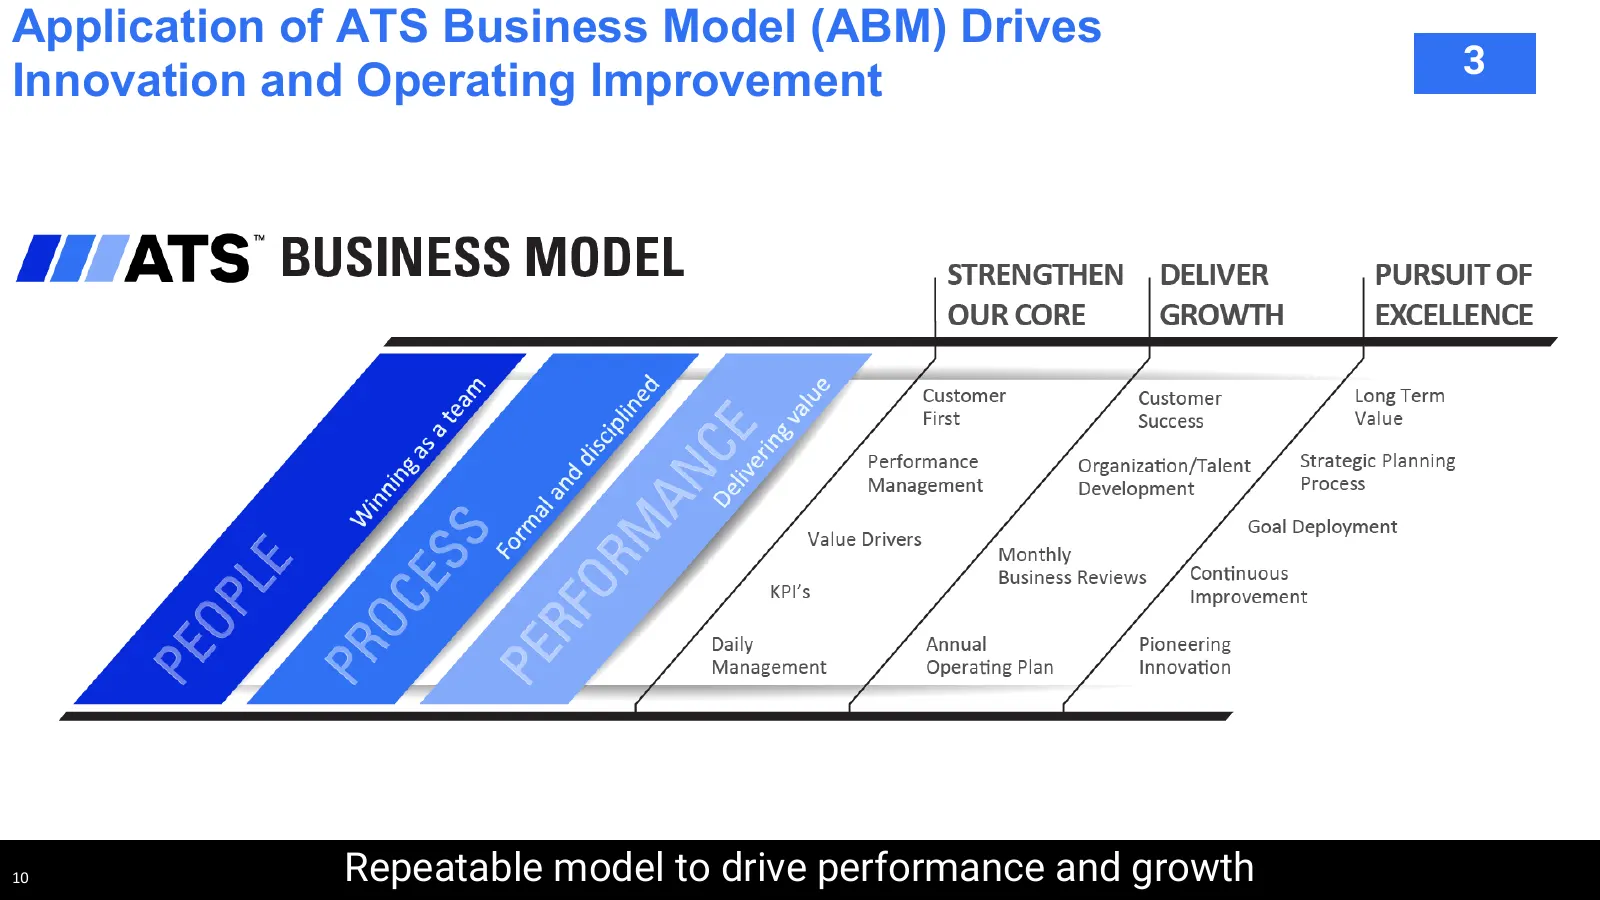
Application of ATS Business Model (ABM) Drives 3 Innovation and Operating Improvement m ea at as ing inn W 10 Repeatable model to drive performance and growth
Slide 11: The 8 Value Drivers
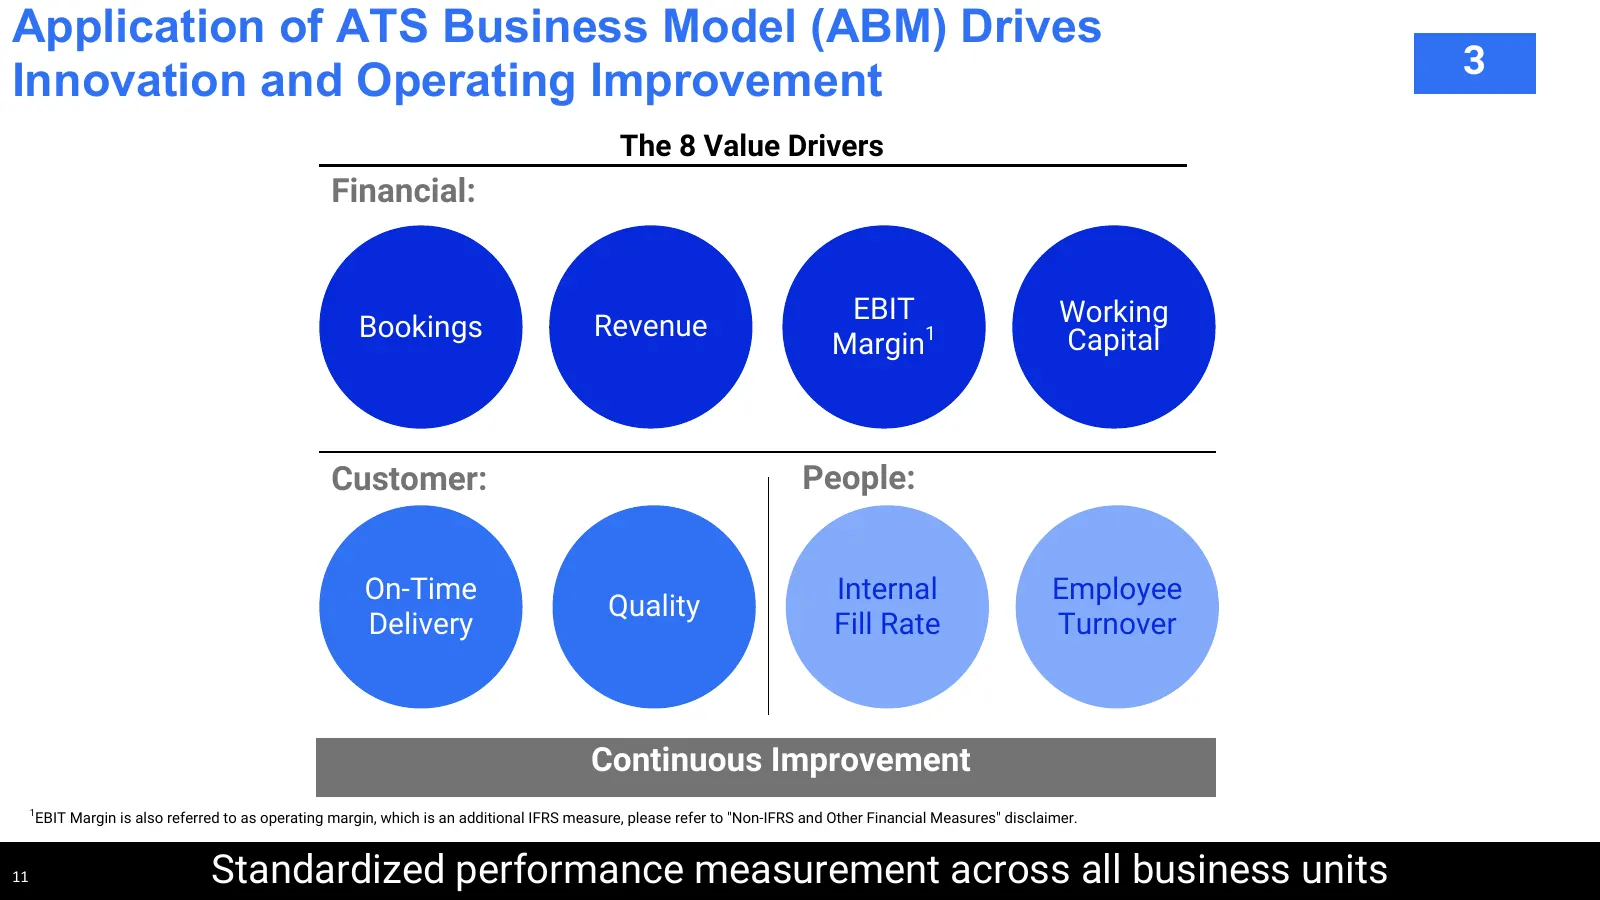
Application of ATS Business Model (ABM) Drives 3 Innovation and Operating Improvement The 8 Value Drivers Financial: EBIT Working Bookings Revenue Margin1 Capital Customer: People: On-Time Internal Employee Quality Delivery Fill Rate Turnover Continuous Improvement 1 EBIT Margin is also referred to
Slide 12: Expanding Presence in Strategic Core Markets
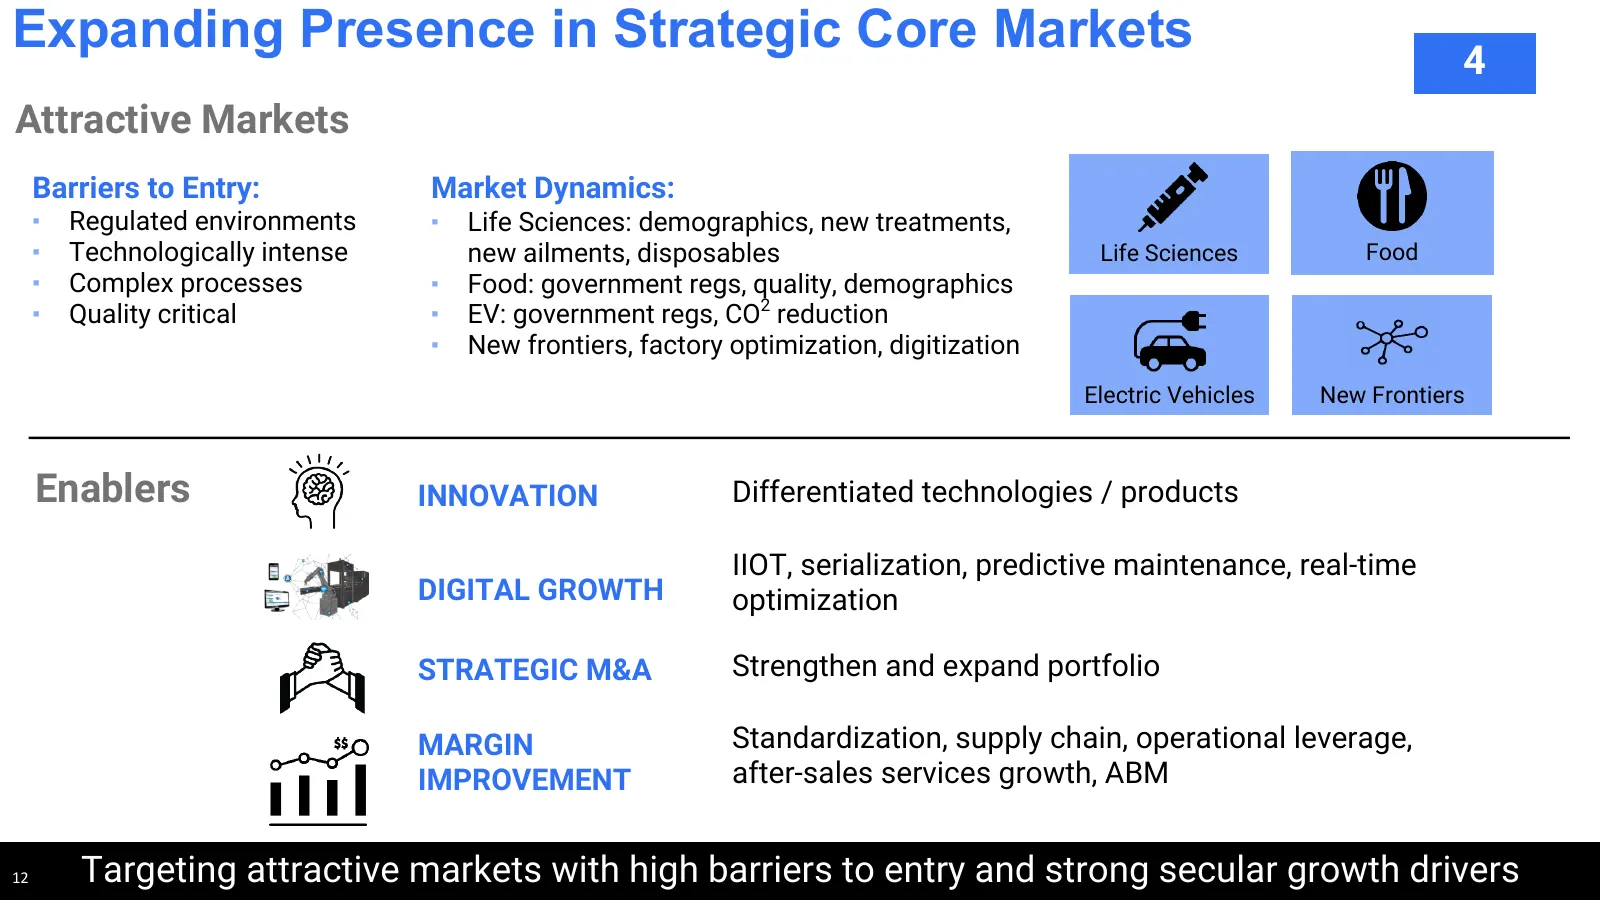
Expanding Presence in Strategic Core Markets 4 Attractive Markets Barriers to Entry: Market Dynamics: ▪ Regulated environments ▪ Life Sciences: demographics, new treatments, ▪ Technologically intense new ailments, disposables Life Sciences Food ▪ Complex processes ▪ Food: government regs, quality, d
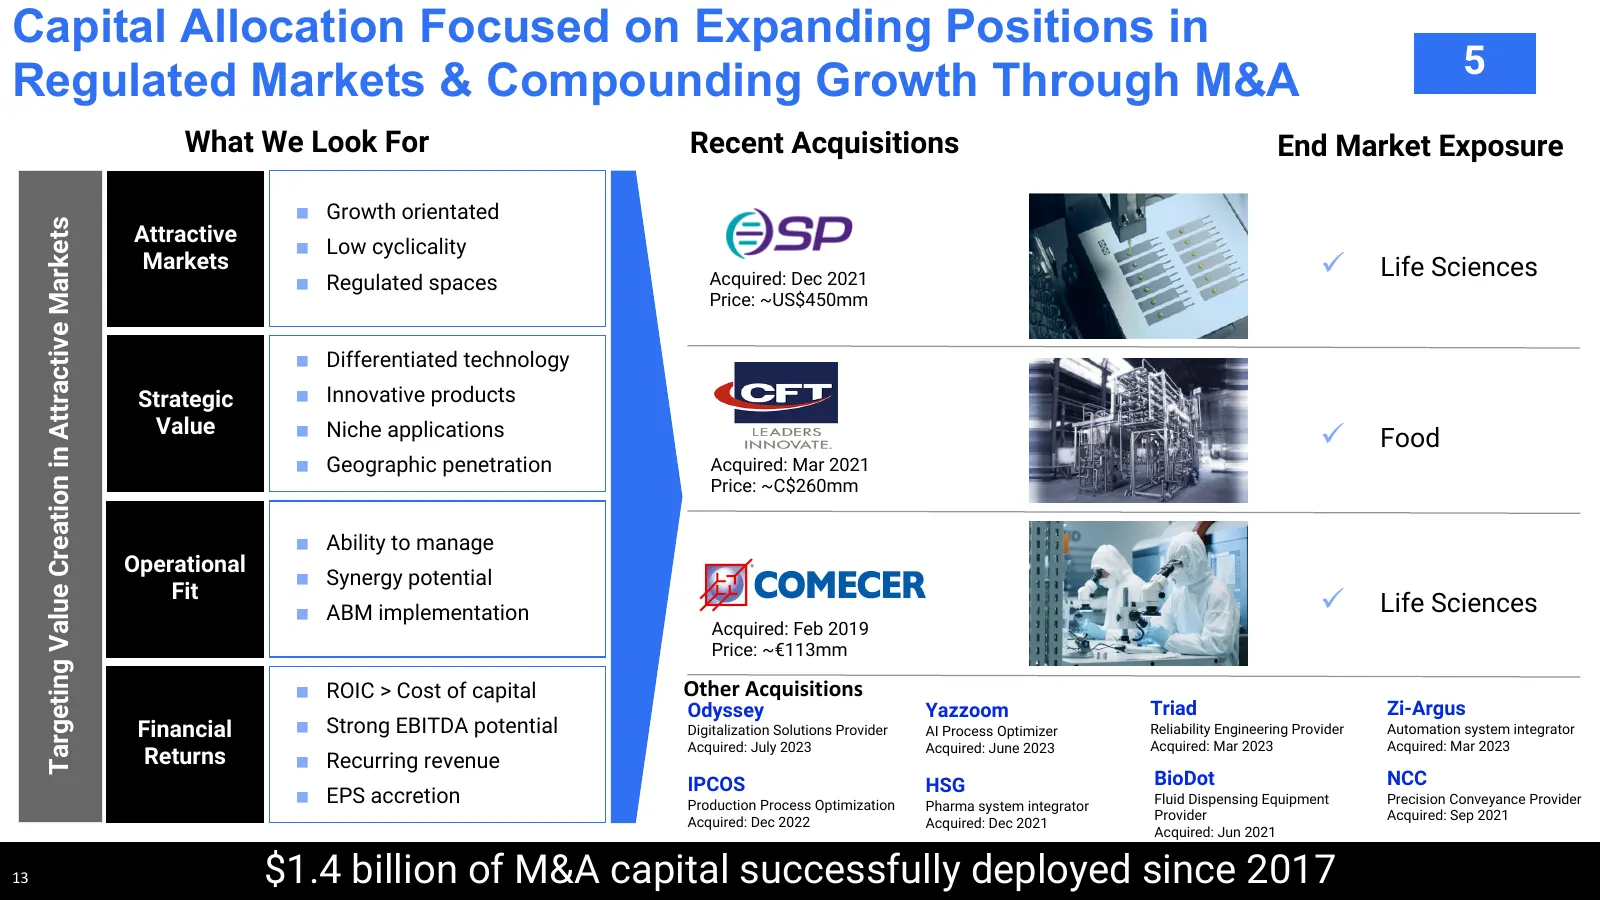
Slide 13: Capital Allocation Focused on Regulated Markets and Compounding Growth Through M&A
Capital Allocation Focused on Expanding Positions in 5 Regulated Markets & Compounding Growth Through M&A What We Look For Recent Acquisitions End Market Exposure ■ Growth orientated Targeting Value Creation in Attractive Markets Attractive ■ Low cyclicality Markets ■ Regulated spaces Acquired: Dec
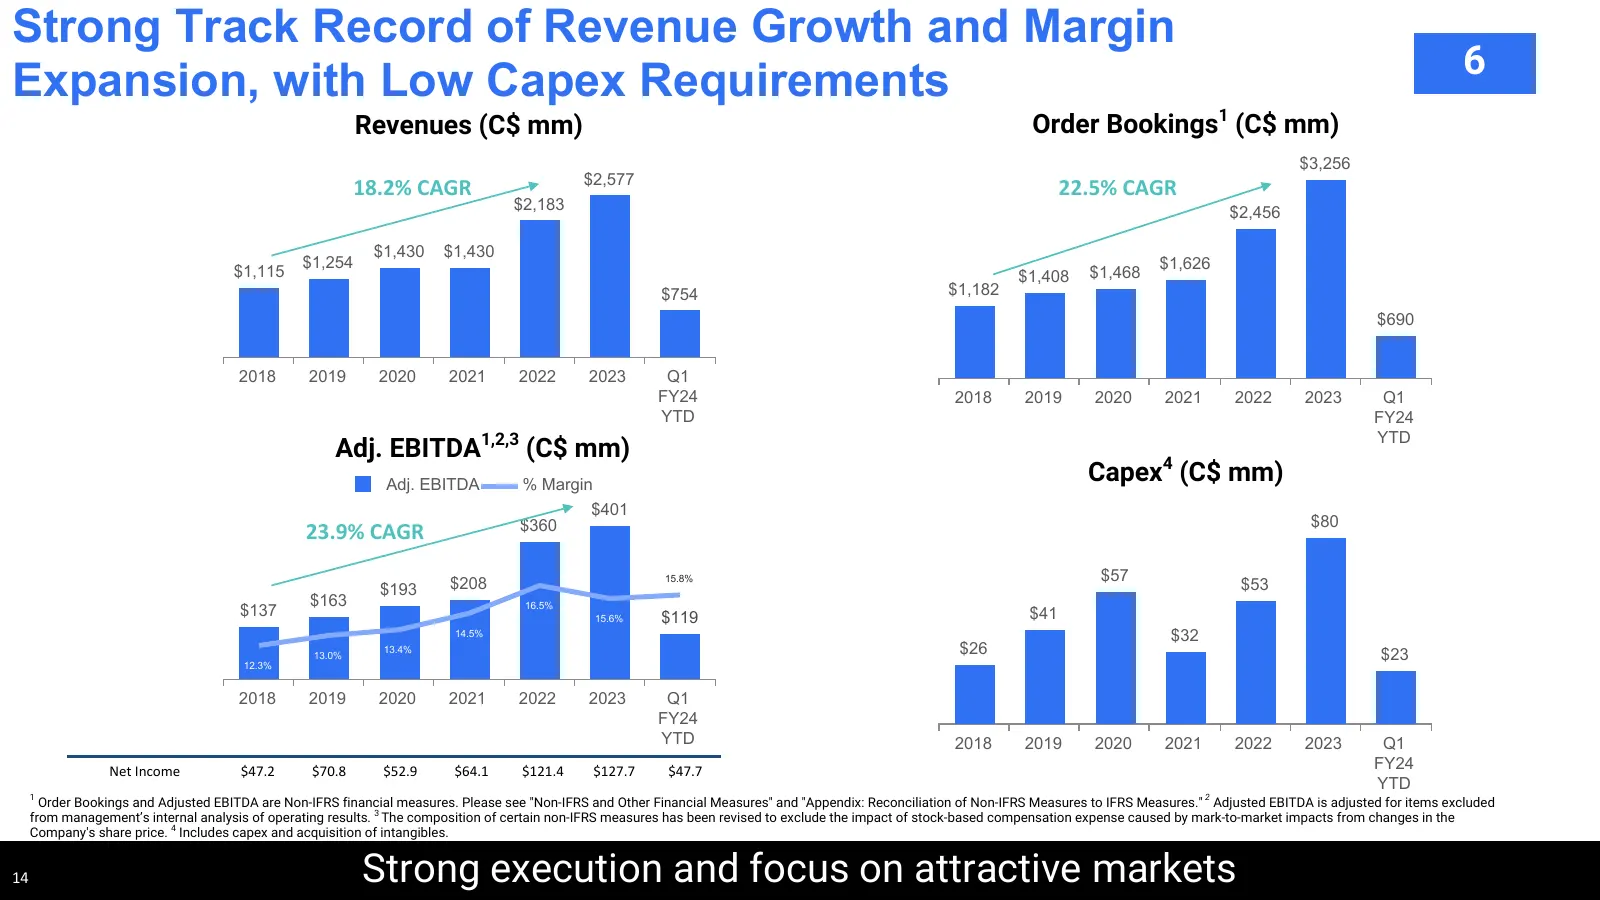
Slide 14: Strong Track Record of Revenue Growth and Margin Expansion
Strong Track Record of Revenue Growth and Margin 6 Expansion, with Low Capex Requirements Revenues (C$ mm) Order Bookings1 (C$ mm) $3,256 $2,577 18.2% CAGR 22.5% CAGR $2,183 $2,456 $1,430 $1,430 $1,254 $1,626 $1,115 $1,408 $1,468 $754 $1,182 $690 2018 2019 2020 2021 2022 2023 Q1 FY24 2018 2019 2020
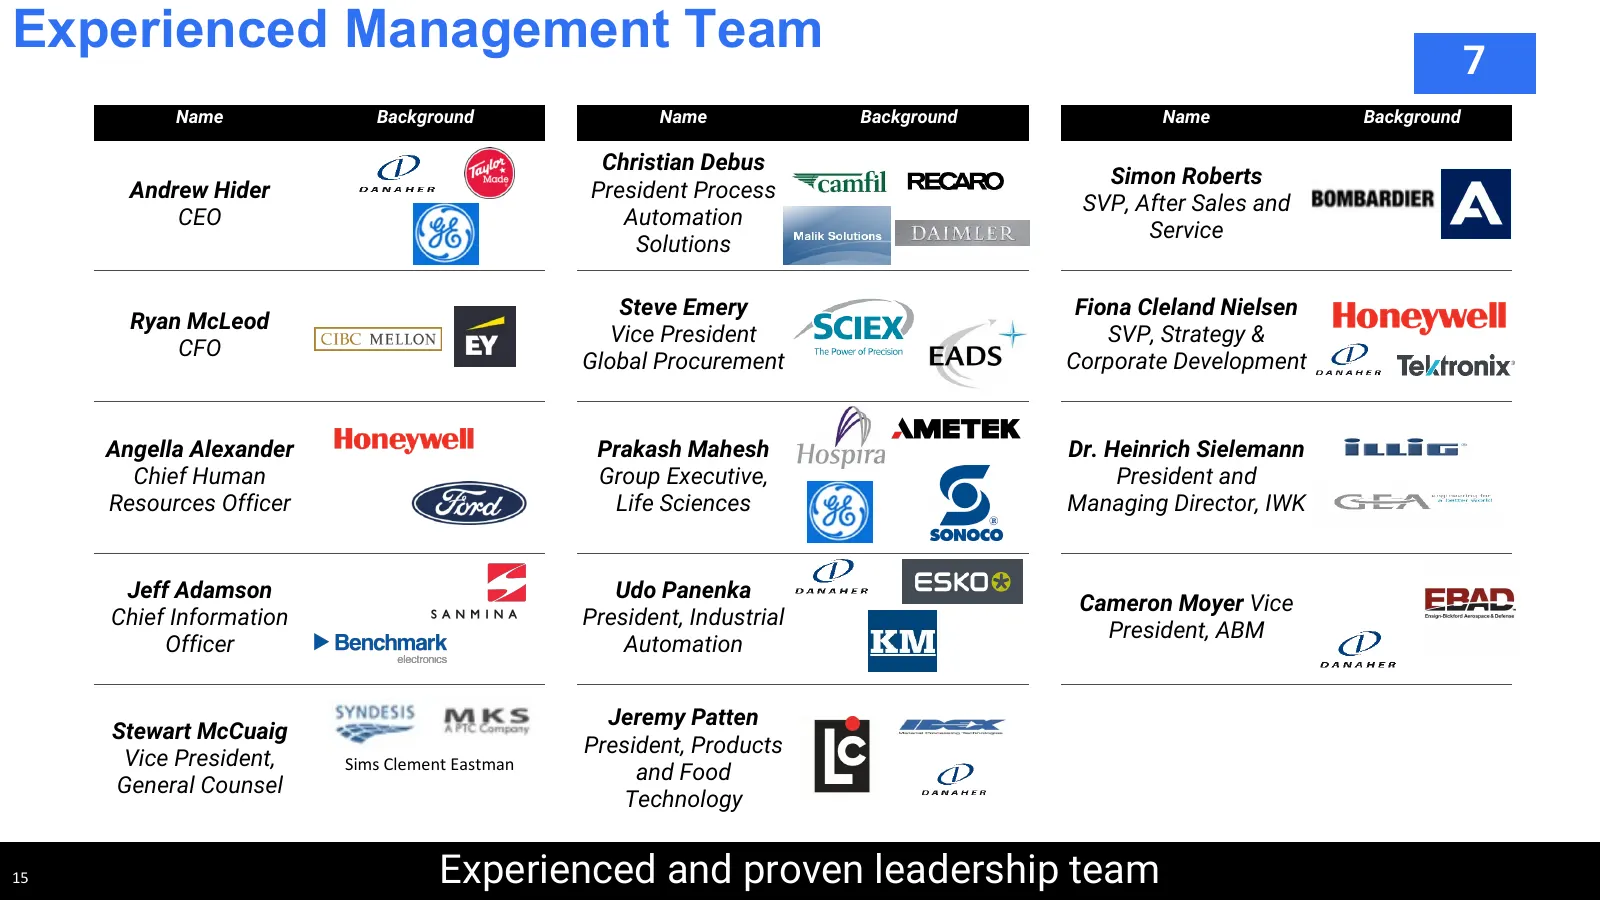
Slide 15: Experienced Management Team
Experienced Management Team 7 Name Background Name Background Name Background Christian Debus Simon Roberts Andrew Hider President Process SVP, After Sales and CEO Automation Service Solutions Steve Emery Fiona Cleland Nielsen Ryan McLeod Vice President SVP, Strategy & CFO Global Procurement Corpora
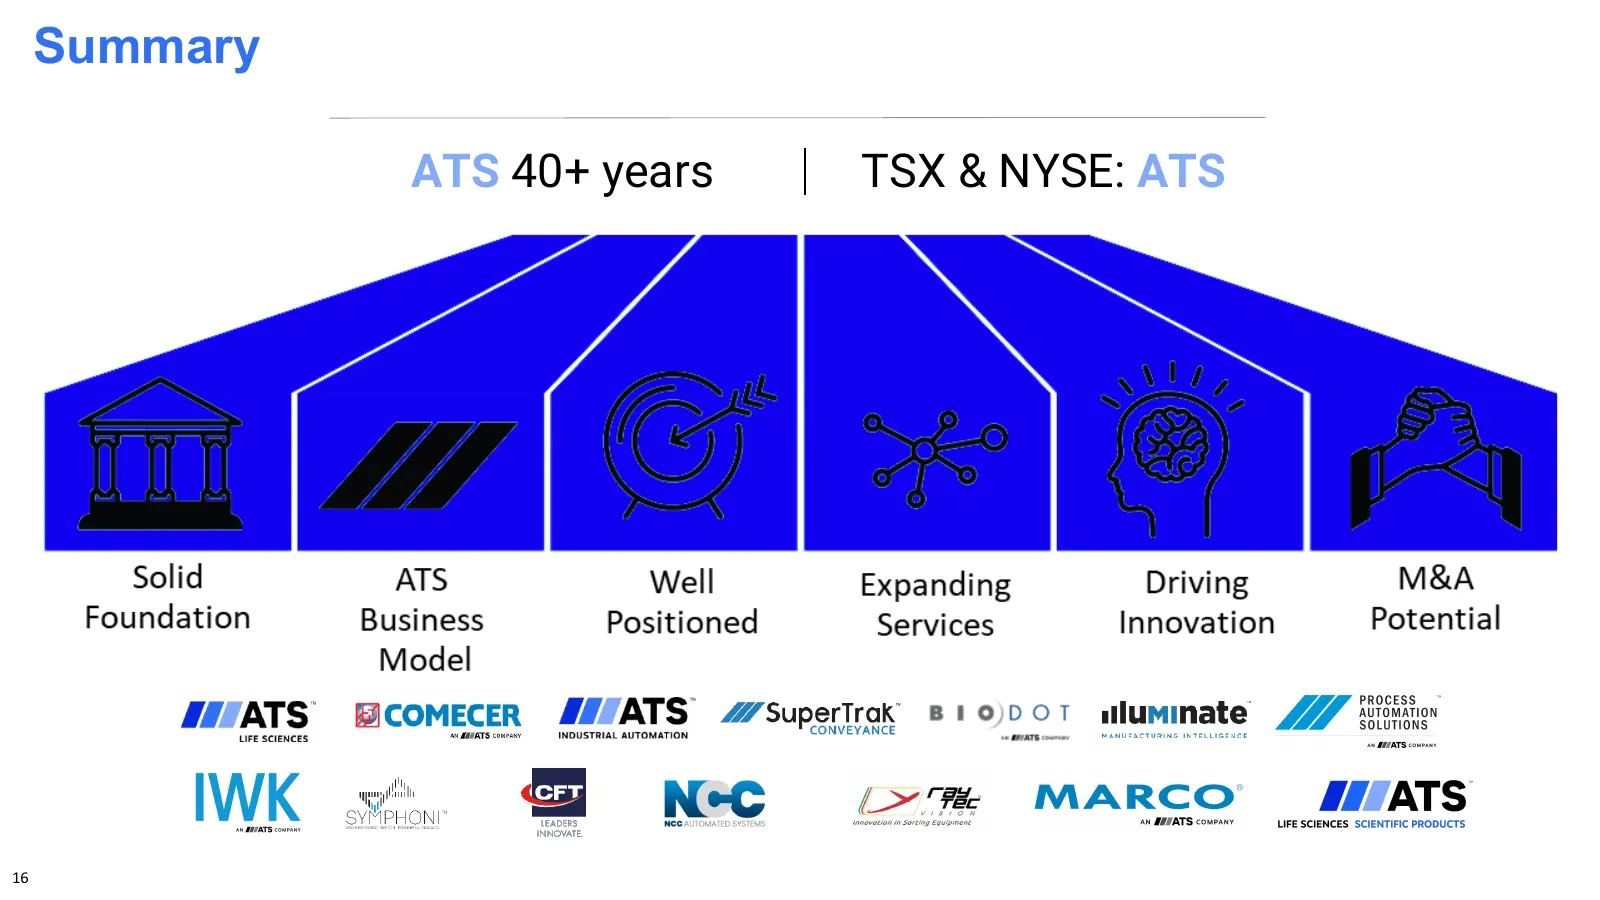
Slide 16: Summary
Summary ATS 40+ years TSX & NYSE: ATS 16
Slide 17: Appendix: Reconciliation of Non-IFRS Measures to IFRS Measures
Appendix Reconciliation of Non-IFRS Measures to IFRS Measures 17
Slide 18: Appendix: Reconciliation of Non-IFRS Measures to IFRS Measures
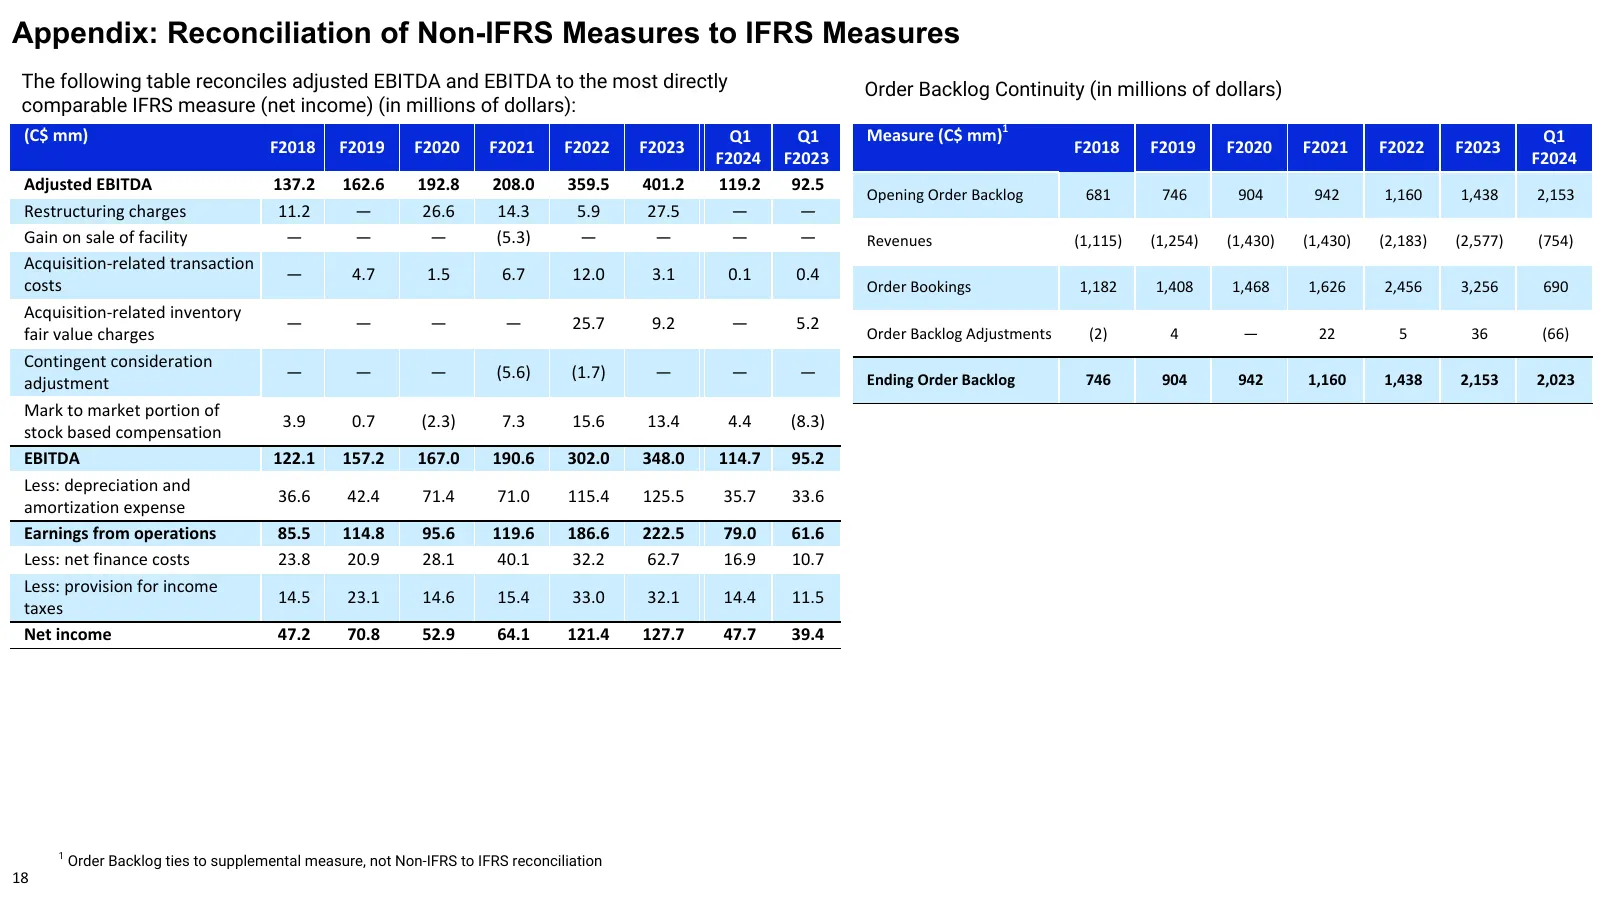
Appendix: Reconciliation of Non-IFRS Measures to IFRS Measures The following table reconciles adjusted EBITDA and EBITDA to the most directly Order Backlog Continuity (in millions of dollars) comparable IFRS measure (net income) (in millions of dollars): (C$ mm) Q1 Q1 Measure (C$ mm)1 Q1 F2018 F2019
Slide 19: Appendix: Reconciliation of Non-IFRS Measures to IFRS Measures
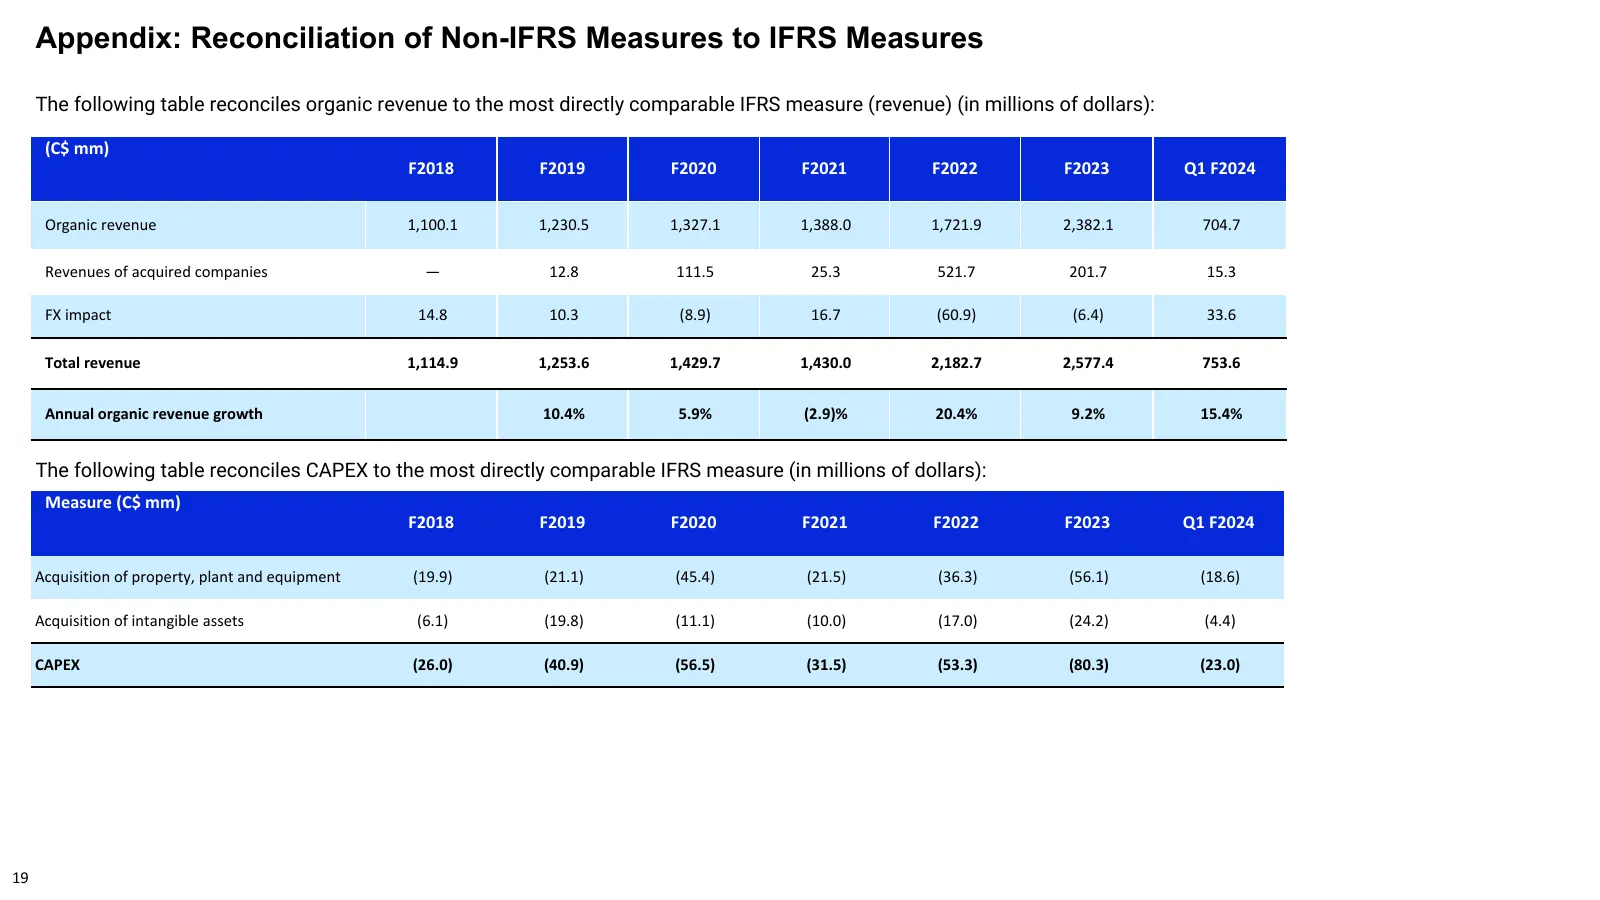
Appendix: Reconciliation of Non-IFRS Measures to IFRS Measures The following table reconciles organic revenue to the most directly comparable IFRS measure (revenue) (in millions of dollars): (C$ mm) F2018 F2019 F2020 F2021 F2022 F2023 Q1 F2024 Organic revenue 1,100.1 1,230.5 1,327.1 1,388.0 1,721.9
Slide 20: Appendix: Reconciliation of Non-IFRS Measures to IFRS Measures
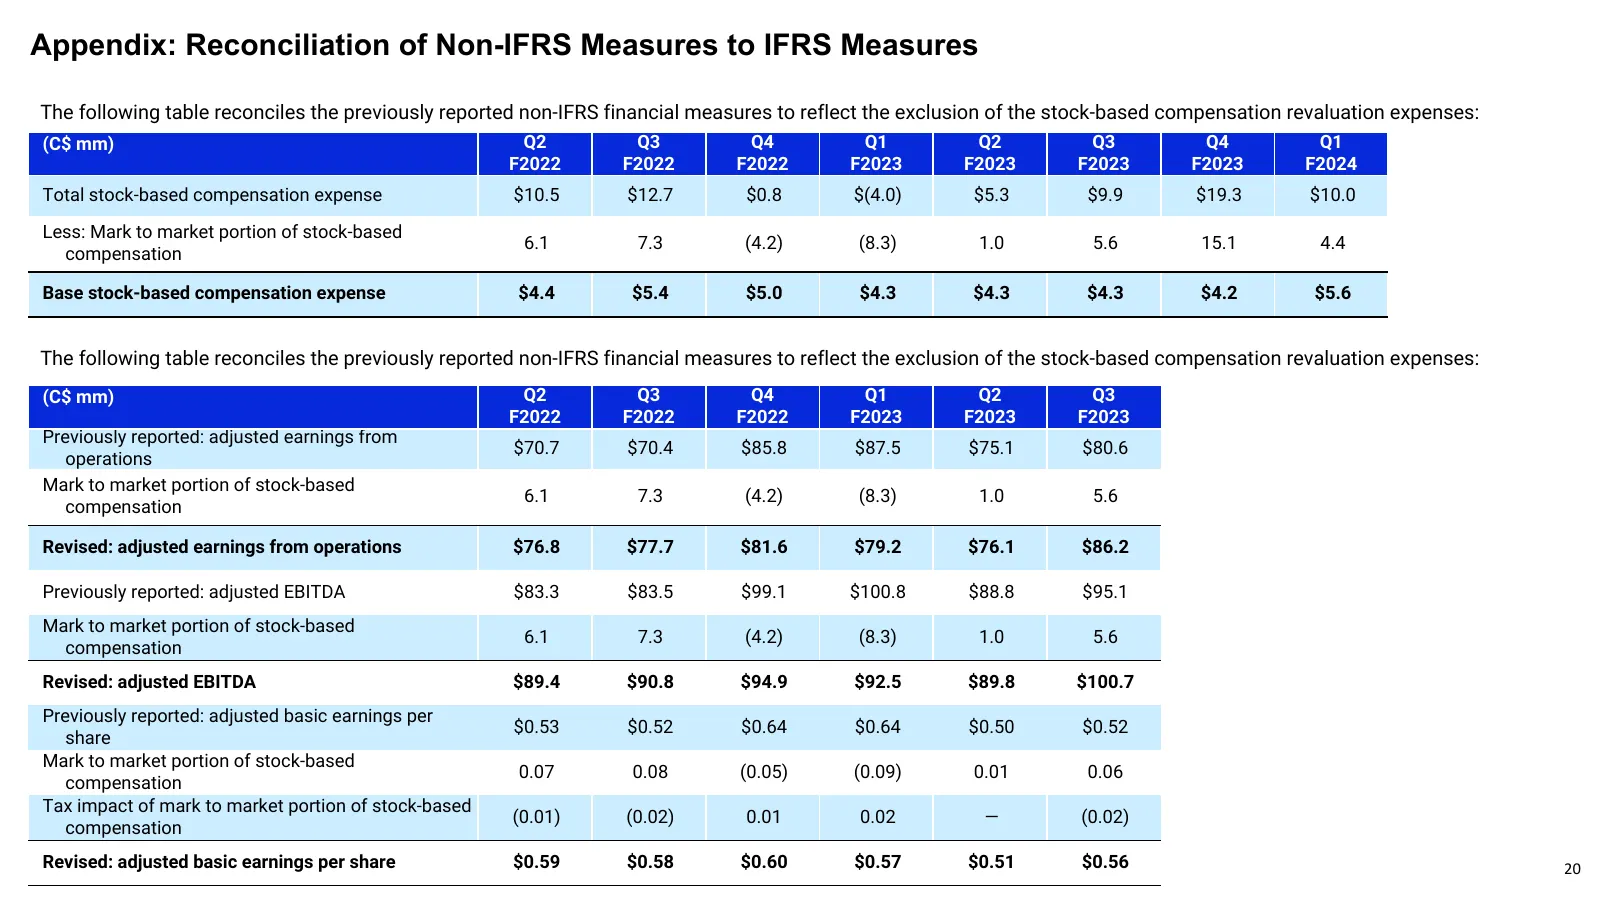
Appendix: Reconciliation of Non-IFRS Measures to IFRS Measures The following table reconciles the previously reported non-IFRS financial measures to reflect the exclusion of the stock-based compensation revaluation expenses: (C$ mm) Q2 Q3 Q4 Q1 Q2 Q3 Q4 Q1 F2022 F2022 F2022 F2023 F2023 F2023 F2023 F
Source: Internet Archive copy of s201.q4cdn.com
More decks from ATS Corporation
 Q2 2027 Earnings Presentation15 slides · Nov 4, 2026
 Q1 2027 Earnings Presentation15 slides · Aug 6, 2026
 Q4 2026 Earnings Presentation15 slides · May 28, 2026
 Q3 2026 Earnings Presentation15 slides · Feb 4, 2026
 Q2 2026 Earnings Presentation15 slides · Nov 5, 2025
 Q1 2026 Earnings Presentation15 slides · Aug 7, 2025