National Grid plc · LSE:NG.
National Grid — FY2015/16 Earnings Presentation
56 slides from National Grid's earnings presentation, May 19, 2016
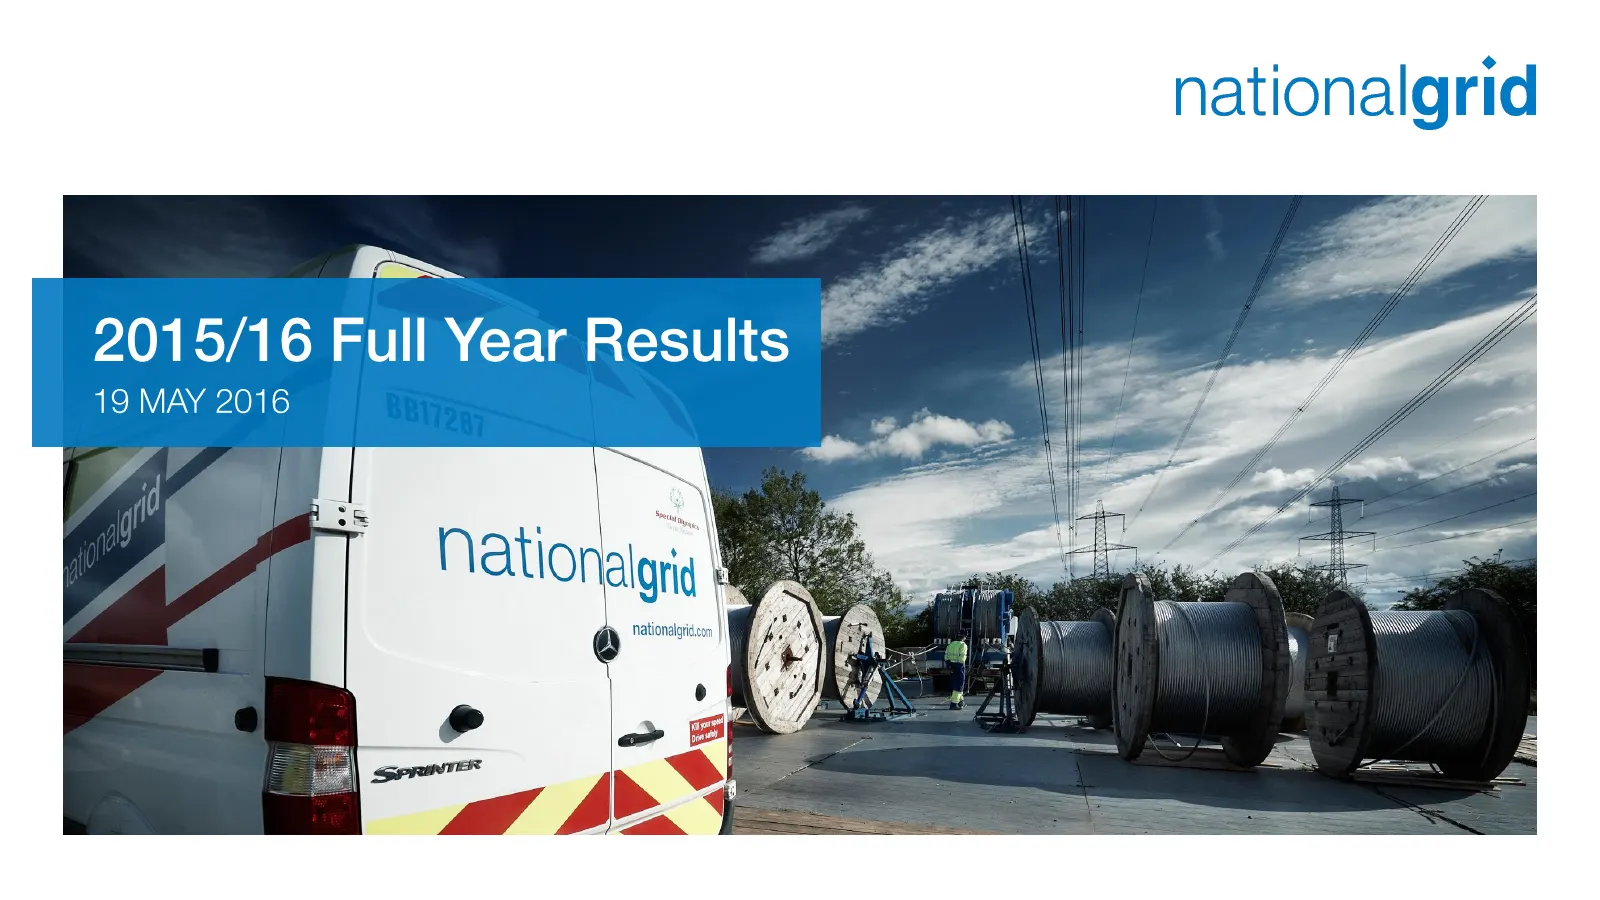
Slide 1: 2015/16 Full Year Results
Slide 2: Cautionary statement
nationalgrid Cautionary statement This announcement contains certain statements that are neither reported financial results nor other historical information. These statements are forward-looking statements within the meaning of Section 27A of the Securities Act of 1933, as amended, and Section 21E o
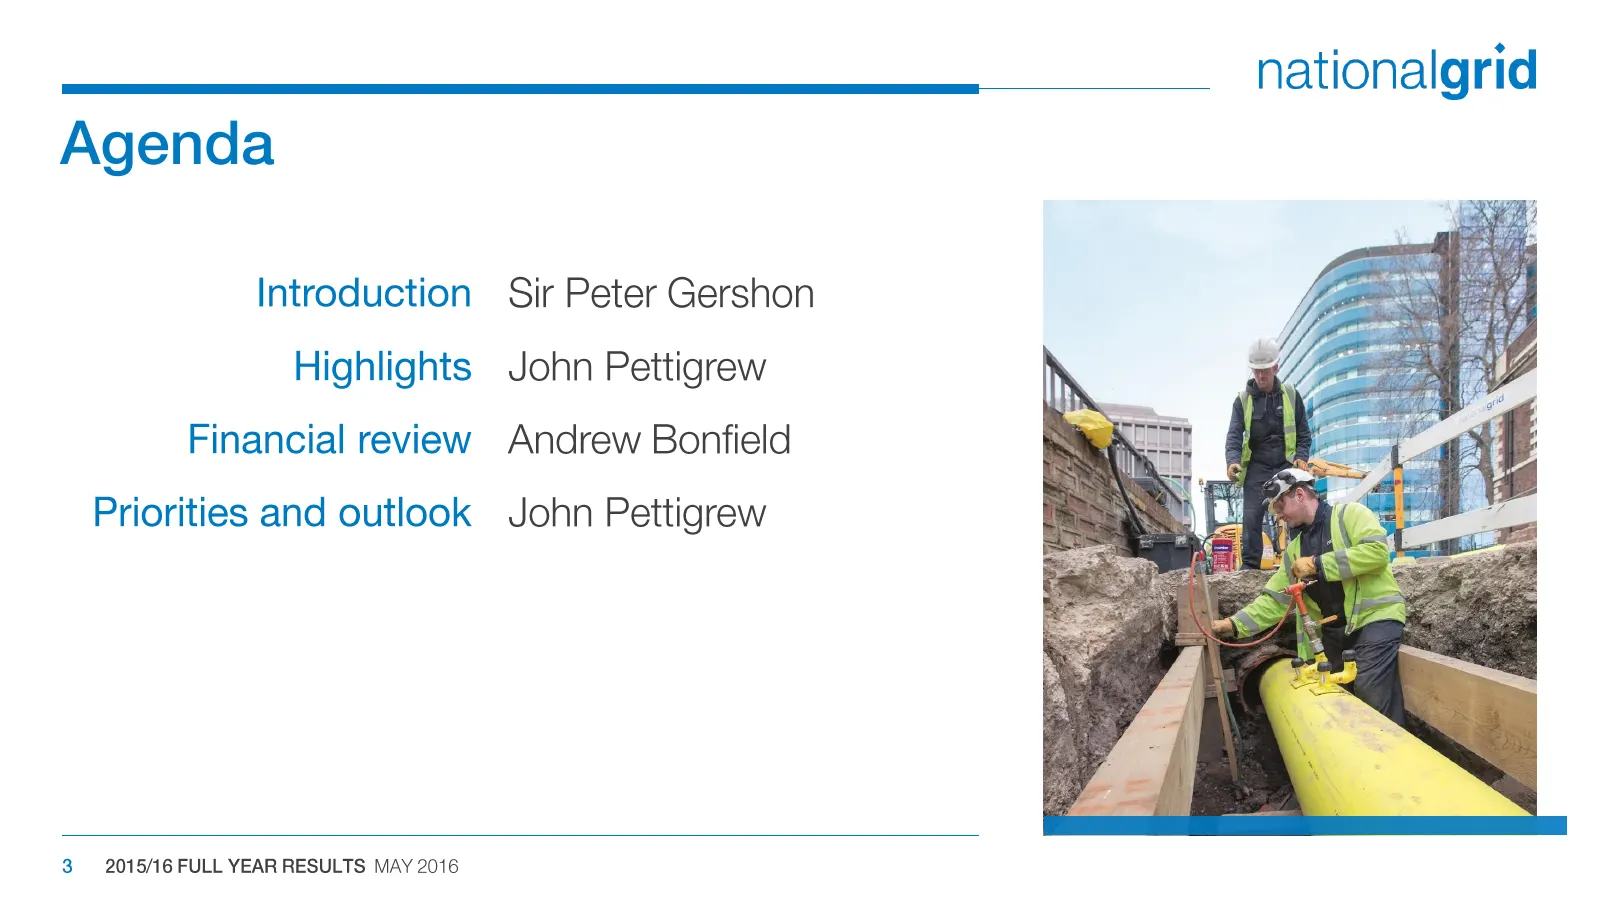
Slide 3: Agenda
Agenda Introduction Highlights Financial review Priorities and outlook Sir Peter Gershon John Pettigrew Andrew Bonfield John Pettigrew 3 2015/16 FULL YEAR RESULTS MAY 2016 nationalgrid
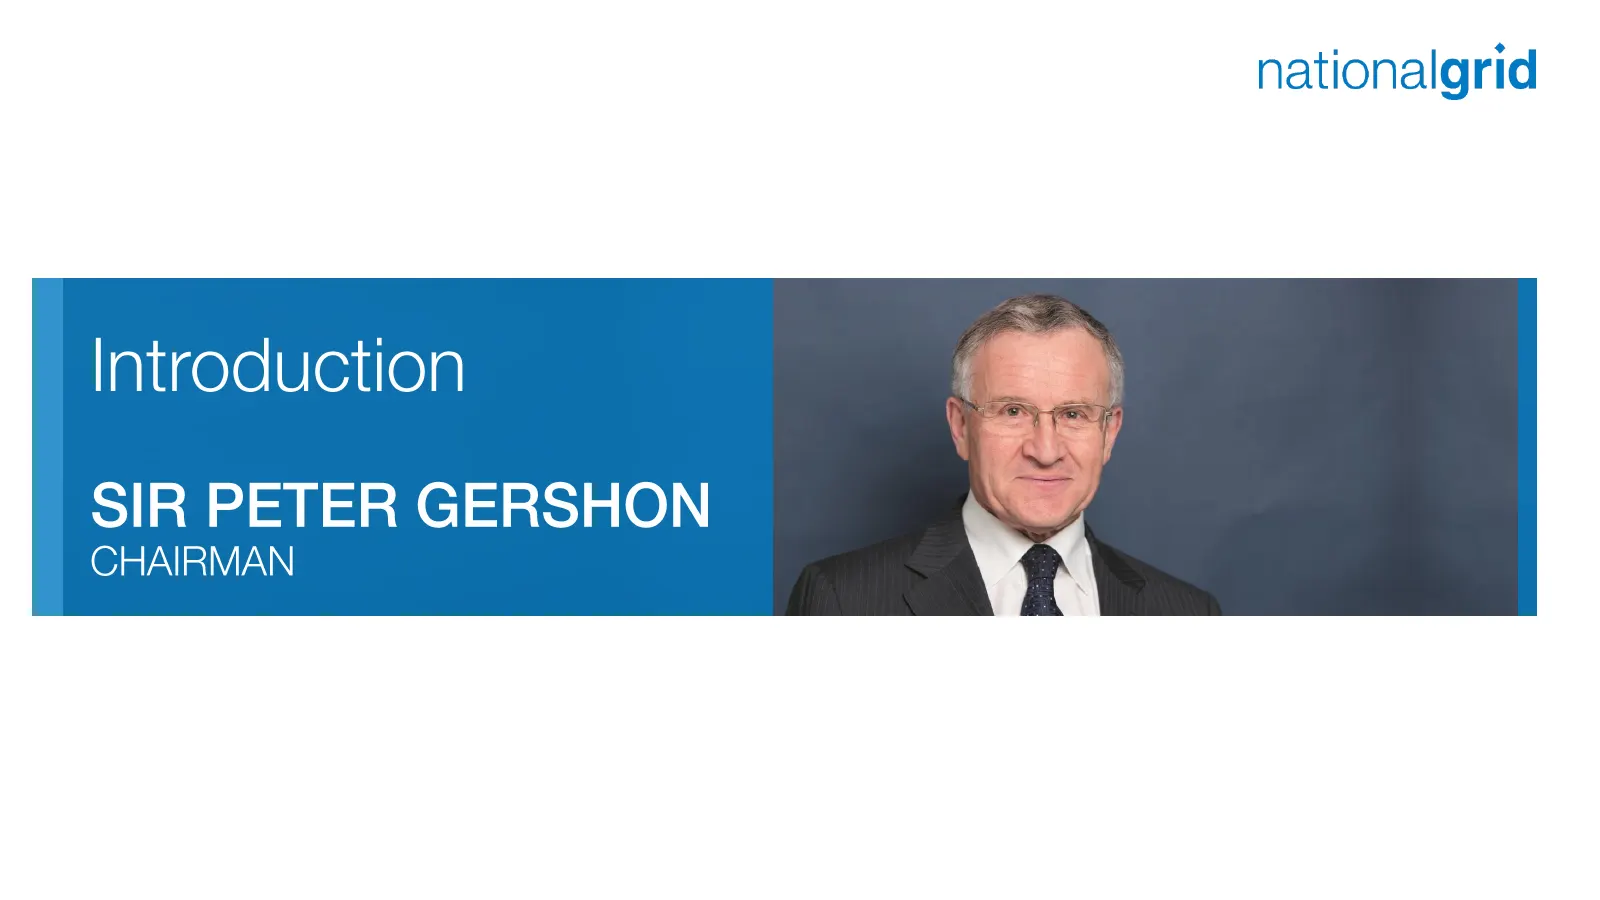
Slide 4: Introduction
nationalgrid Introduction s SIR PETER GERSHON K CHAIRMAN

Slide 5: Highlights
nationalgrid Highlights JOHN PETTIGREW CHIEF EXECUTIVE
Slide 6: 2015/16 financial performance
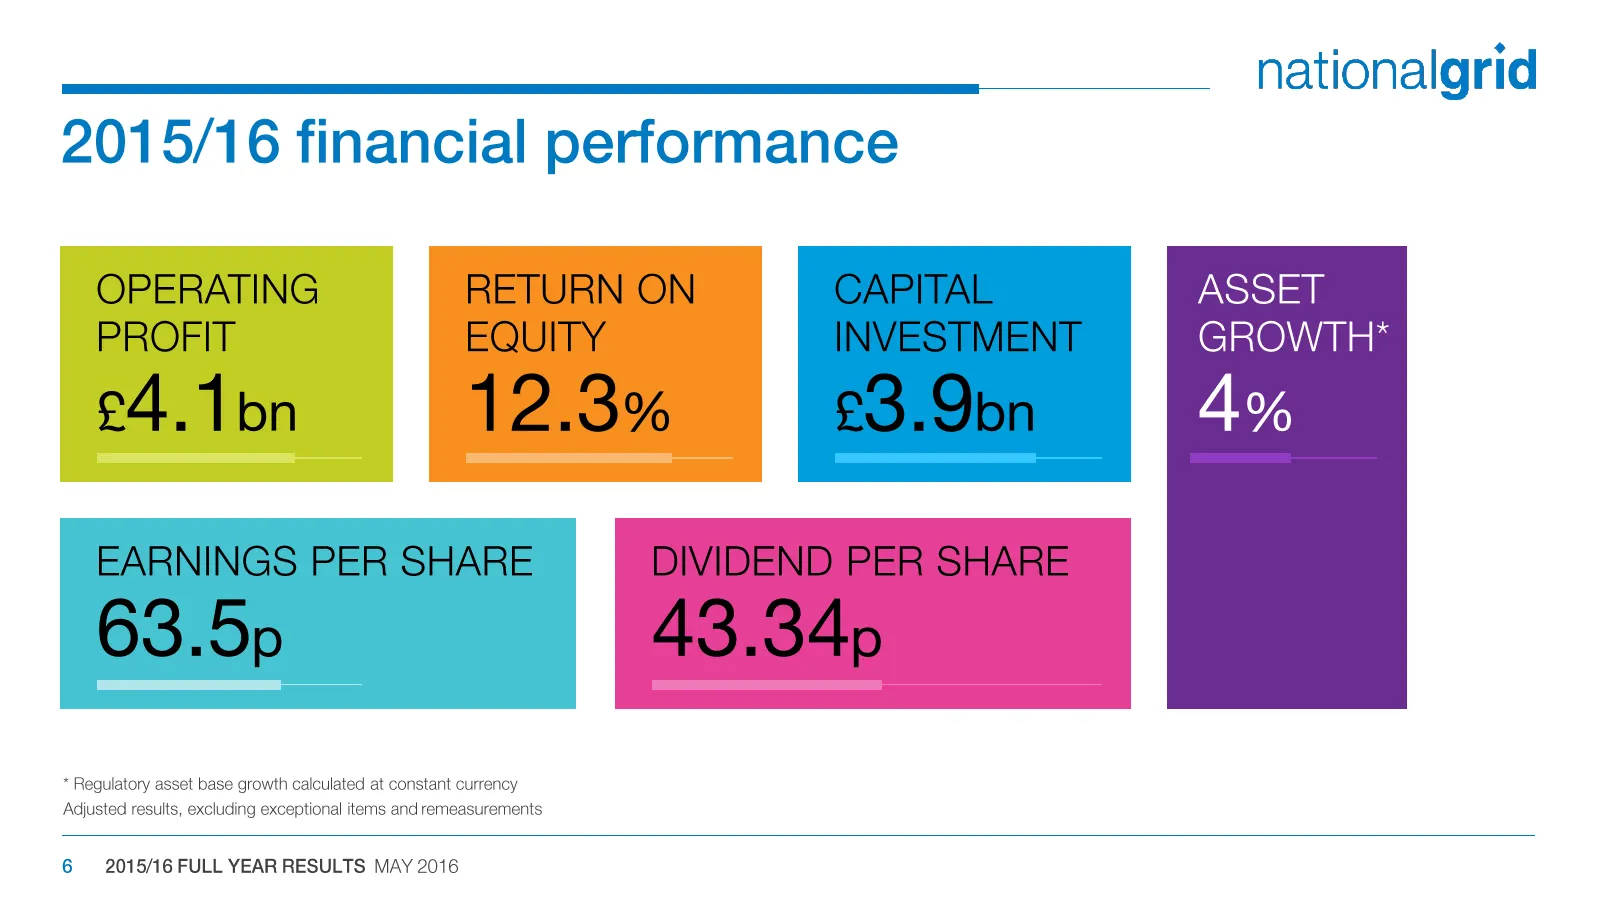
nationalgrid 2015/16 financial performance OPERATING RETURN ON PROFIT EQUITY £4.1bn 12.3% ASSET GROWTH* 4% DIVIDEND PER SHARE 43.34p 6 2015/16 FULL YEAR RESULTS MAY 2016
Slide 7: Safety and reliability
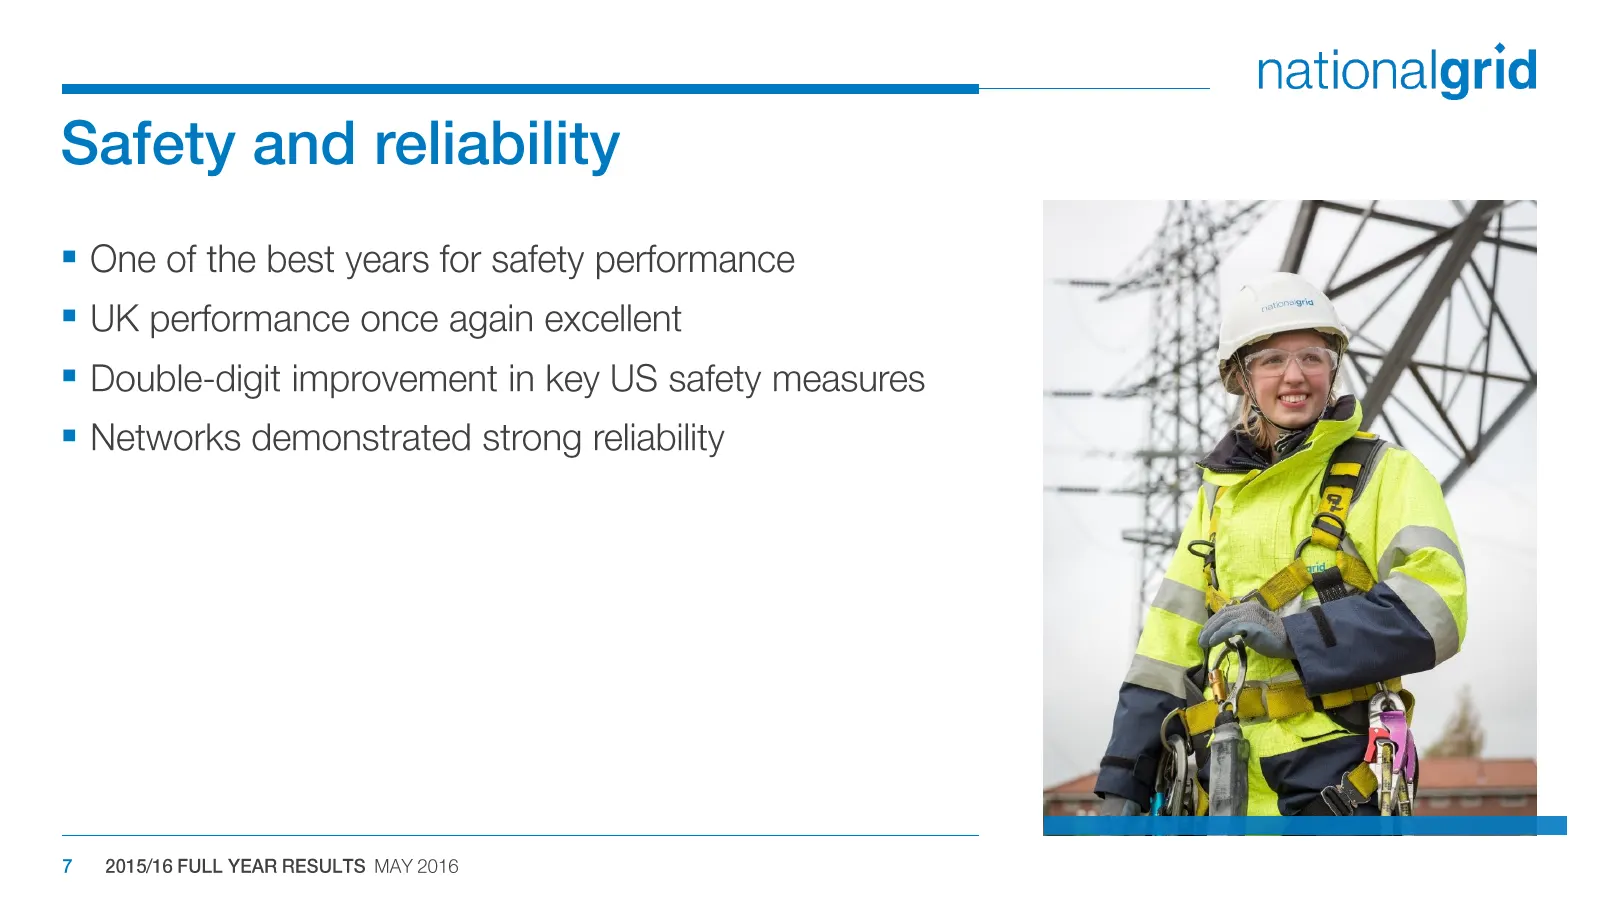
nationalgrid Safety and reliability = One of the best years for safety performance = UK performance once again excellent = Double-digit improvement in key US safety measures = Networks demonstrated strong reliability 7 2015/16 FULL YEAR RESULTS MAY 2016
Slide 8: 2015/16 UK performance review
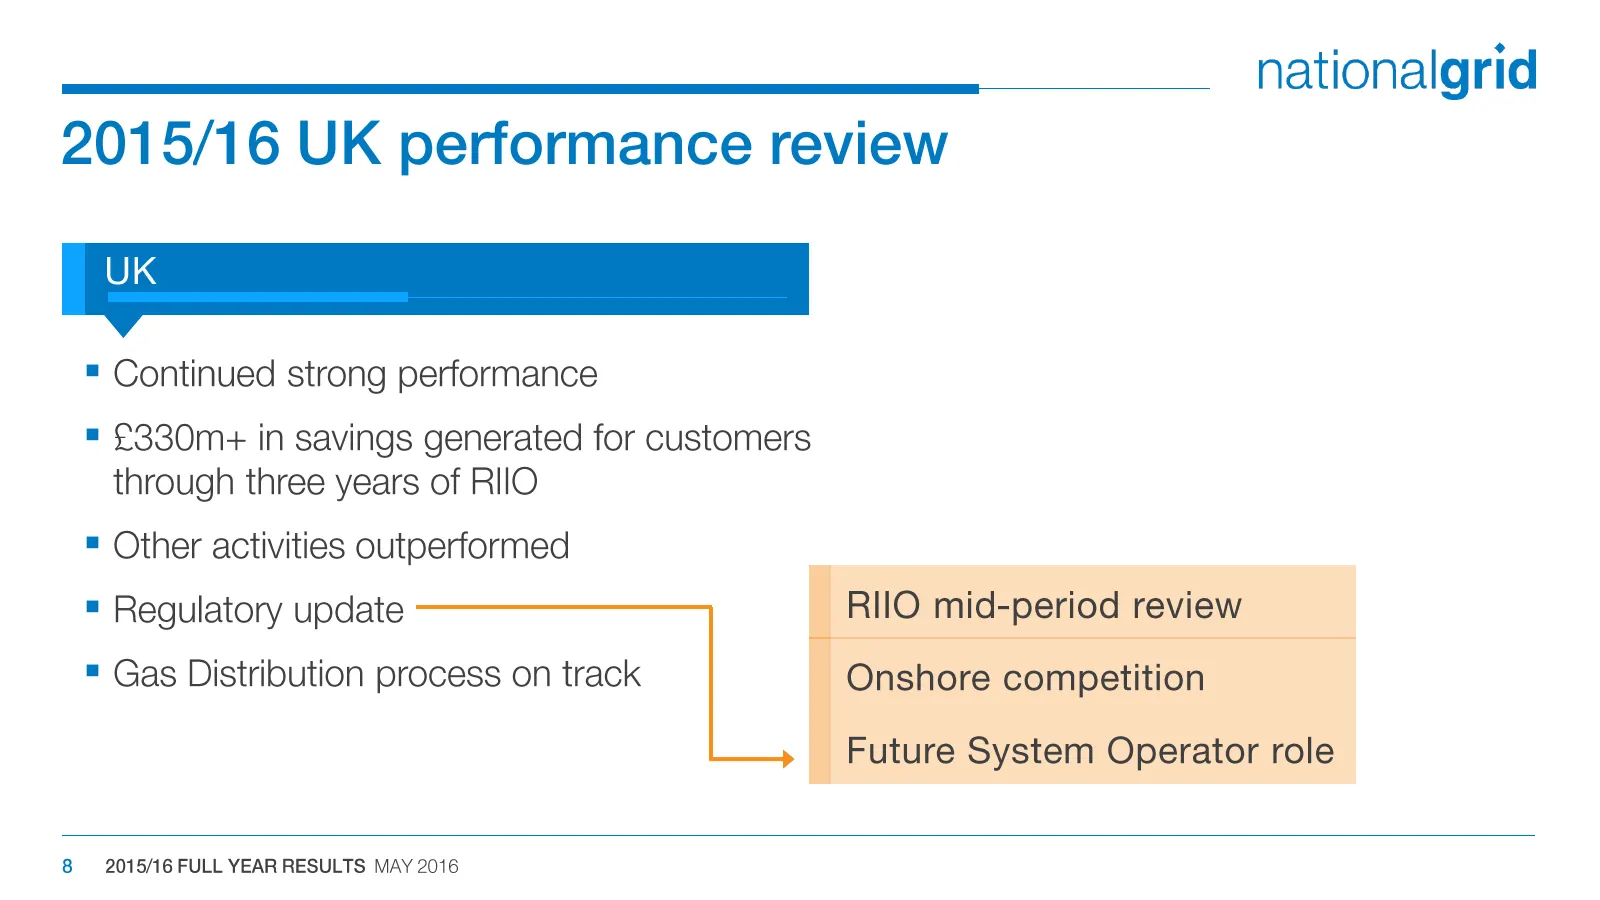
nationalgrid 2015/16 UK performance review = Continued strong performance = £330m+ in savings generated for customers through three years of RIIO = Other activities outperformed = Regulatory update = Gas Distribution process on track 8 2015/16 FULL YEAR RESULTS MAY 2016
Slide 9: 2015/16 US performance review
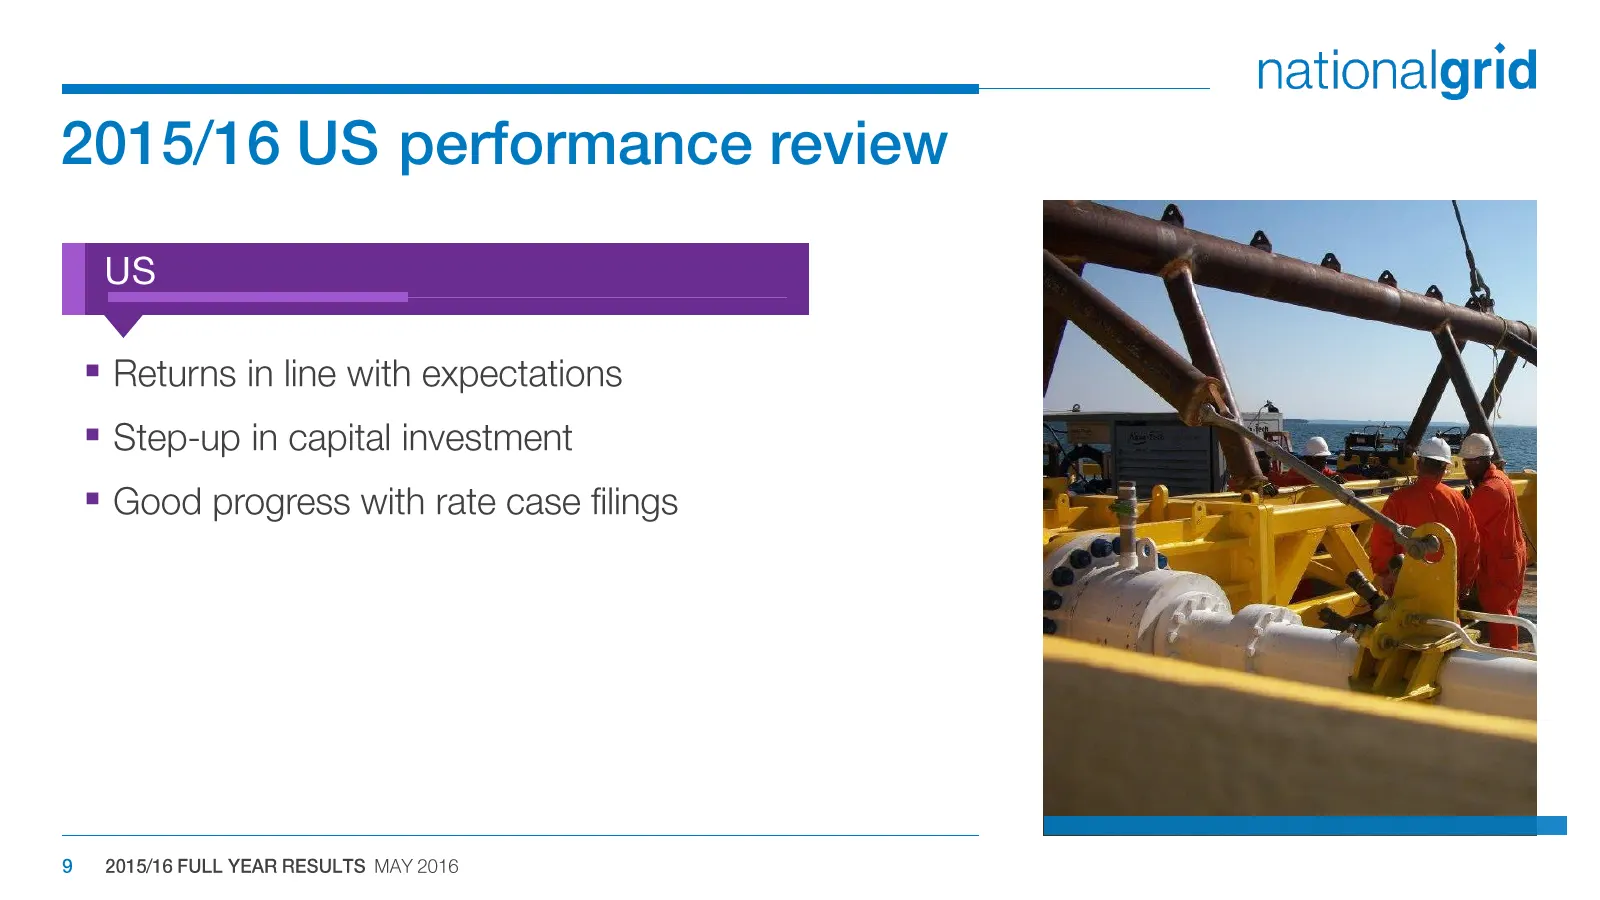
nationalgrid 2015/16 US performance review = Returns in line with expectations = Step-up in capital investment " Good progress with rate case filings 9 2015/16 FULL YEAR RESULTS MAY 2016
Slide 10: Financial performance
nationalgrid Financial performance ANDREW BONFIELD FINANCE DIRECTOR
Slide 11: Operating profit, EPS, return on equity
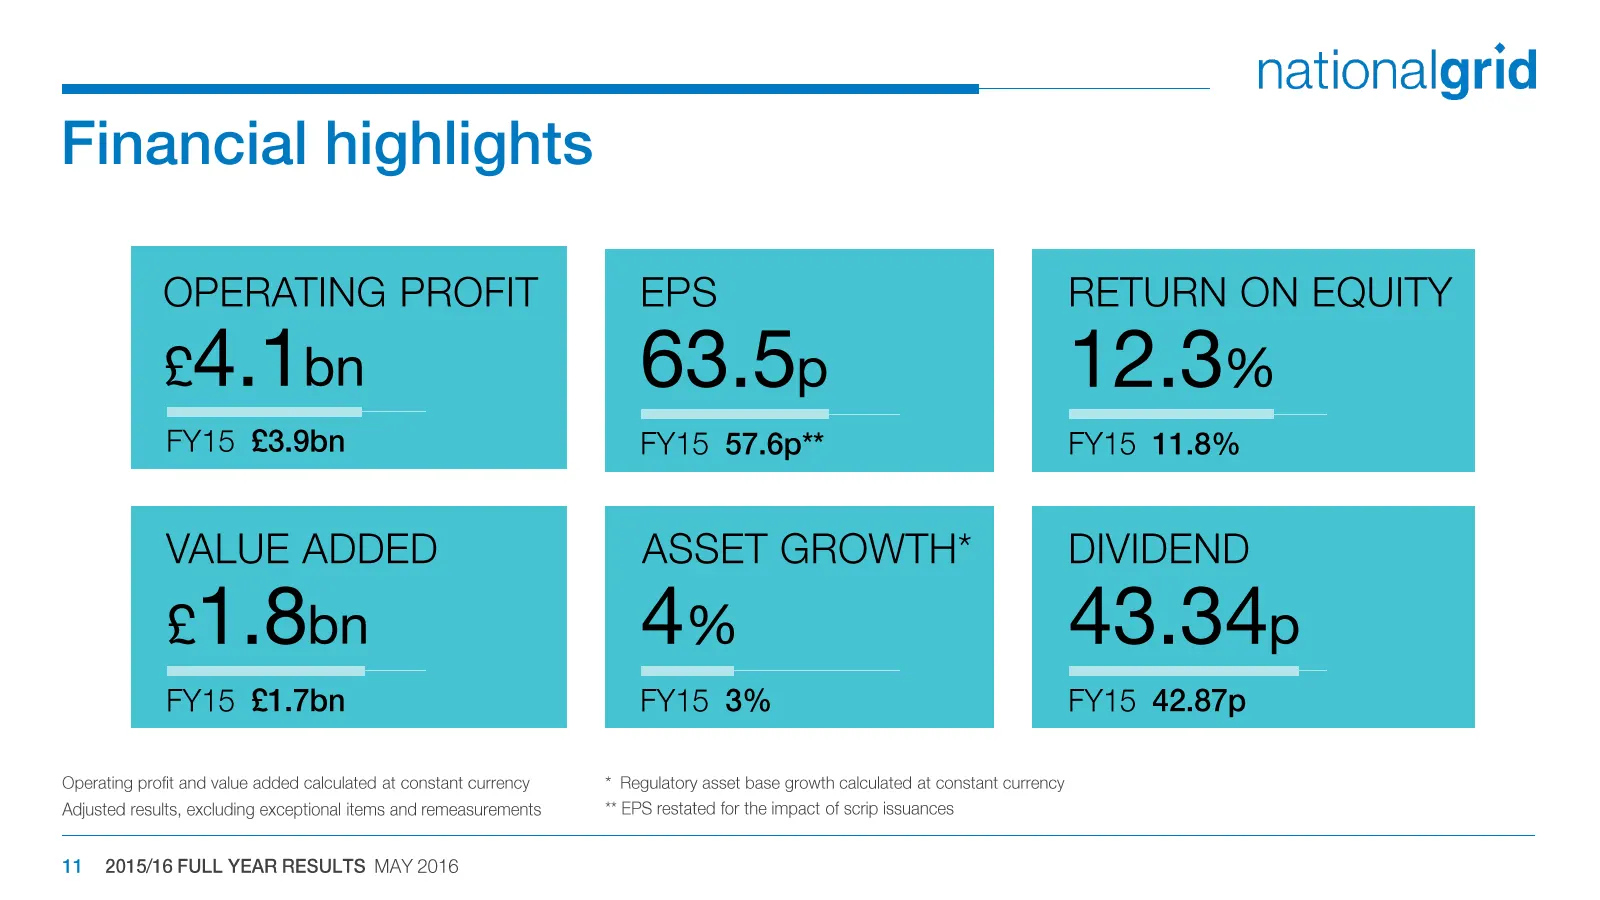
OPERATING PROFIT EPS RETURN ON EQUITY £4.1bn 63.5p 12.3% FY15 £3.9bn FY15 57.6p** FY15 11.8% VALUE ADDED ASSET GROWTH* DIVIDEND £1.8bn A% 43.34p FY15 £1.7bn FY15 3% FY15 42.87p 2015/16 FULL YEAR RESULTS MAY 2016
Slide 12: UK Electricity Transmission
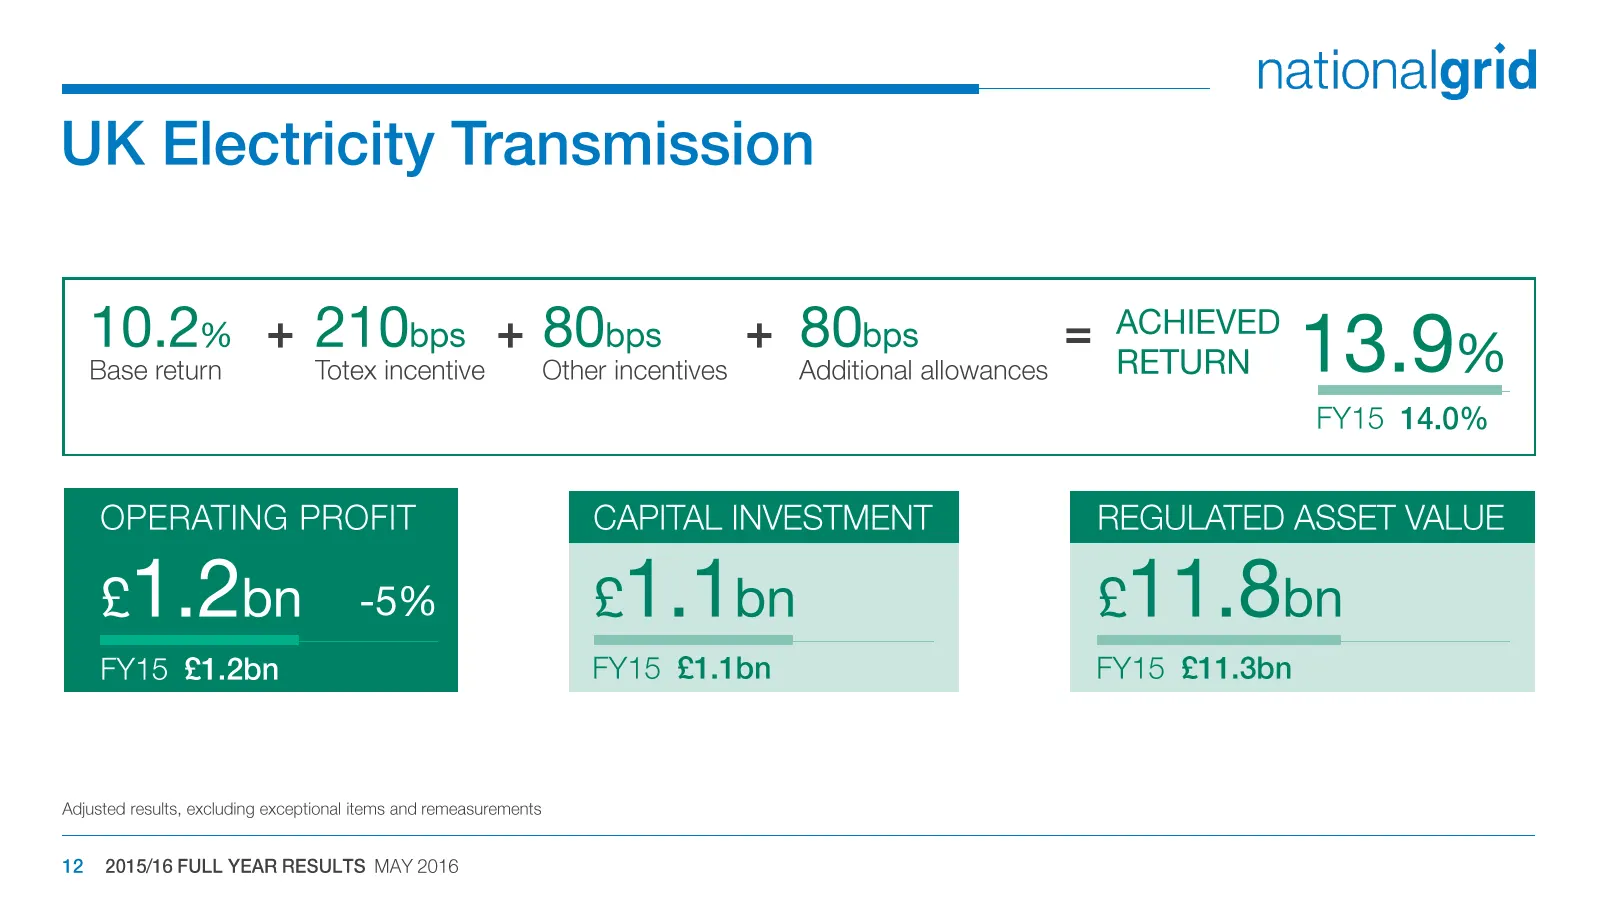
nationalgrid UK Electricity Transmission 10.2% + 2.10bps + 8Obps + 80bps = ACHIEVED 13.9% Base return Totex incentive Other incentives Additional allowances RETURN FY15 14.0% OPERATING PROFIT eT .2bn -5% eT 1 bn eT 1 Bbn FY15 £1.2bn FY15 £1.1bn FY15 £11.3bn Adjusted results, excluding exceptional it
Slide 13: UK Gas Transmission
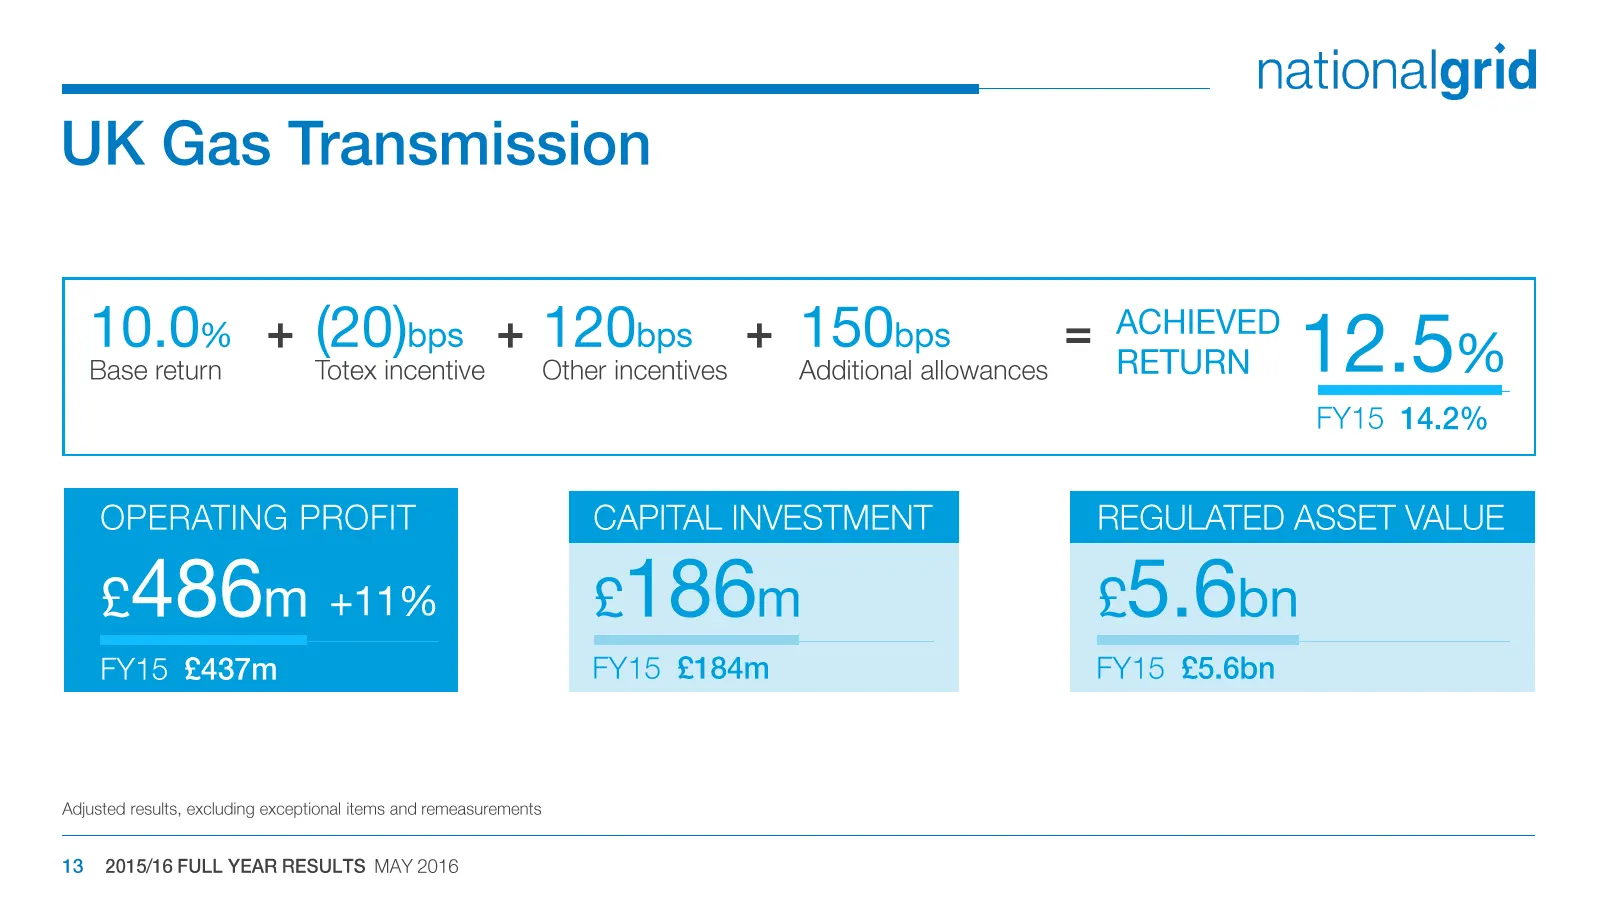
nationalgrid UK Gas Transmission 10.0% + (20)ops + 120pps_ + 150bps = ACHIEVED 4 Boy Base return Totex incentive Other incentives Additional allowances RETURN FY15 14.2% OPERATING PROFIT e486m 411% eT 86m £5.6bn FY15 £437m FY15 £184m FY15 £5.6bn Adjusted results, excluding exceptional items and reme
Slide 14: UK Gas Distribution
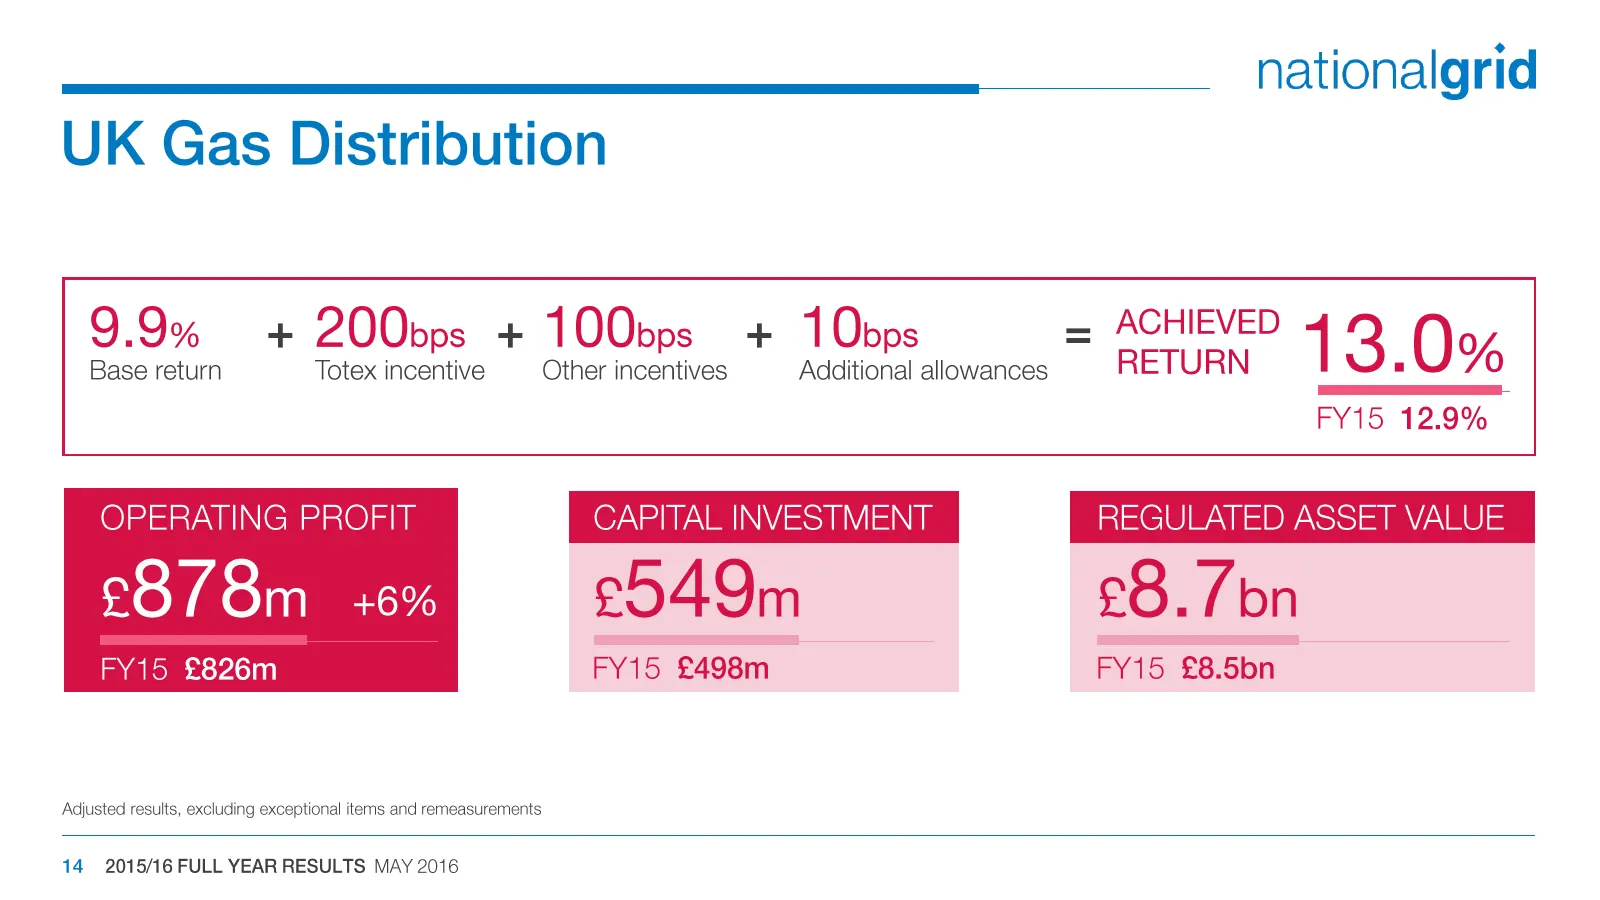
nationalgrid UK Gas Distribution 9.9% + 200bps + 100bps + 1Obps = ACHIEVED 13.0% Base return Totex incentive Other incentives Additional allowances RETURN FY15 12.9% OPERATING PROFIT £878m +6% °549m £8. 7bn FY15 £826m FY15 £498m FY15 £8.5bn Adjusted results, excluding exceptional items and remeasure
Slide 15: US Regulated
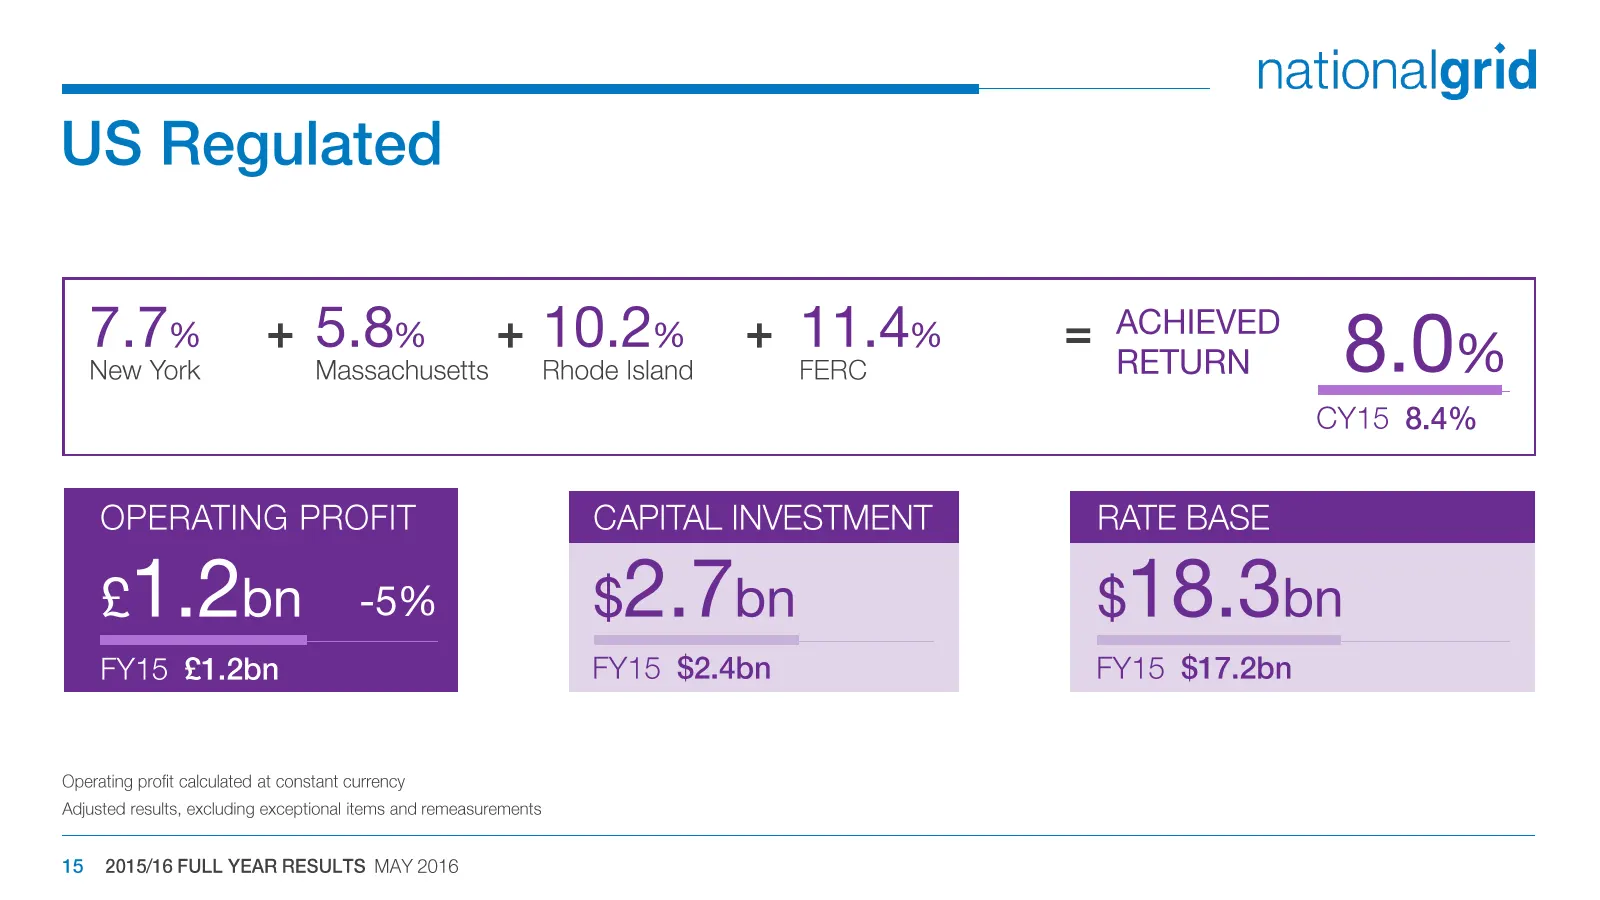
nationalgrid US Regulated 7.7% +5.8% +10.2% + 11.4% = m6 8.0% New York Massachusetts Rhode Island FERC RETURN CY15 8.4% OPERATING PROFIT €1.2bn -5% $2./bn $18.3bn FY15 £1.2bn FY15 $2.4bn FY15 $17.2bn Operating profit calculated at constant currency Adjusted results, excluding exceptional items and r
Slide 16: Other Activities & JVs
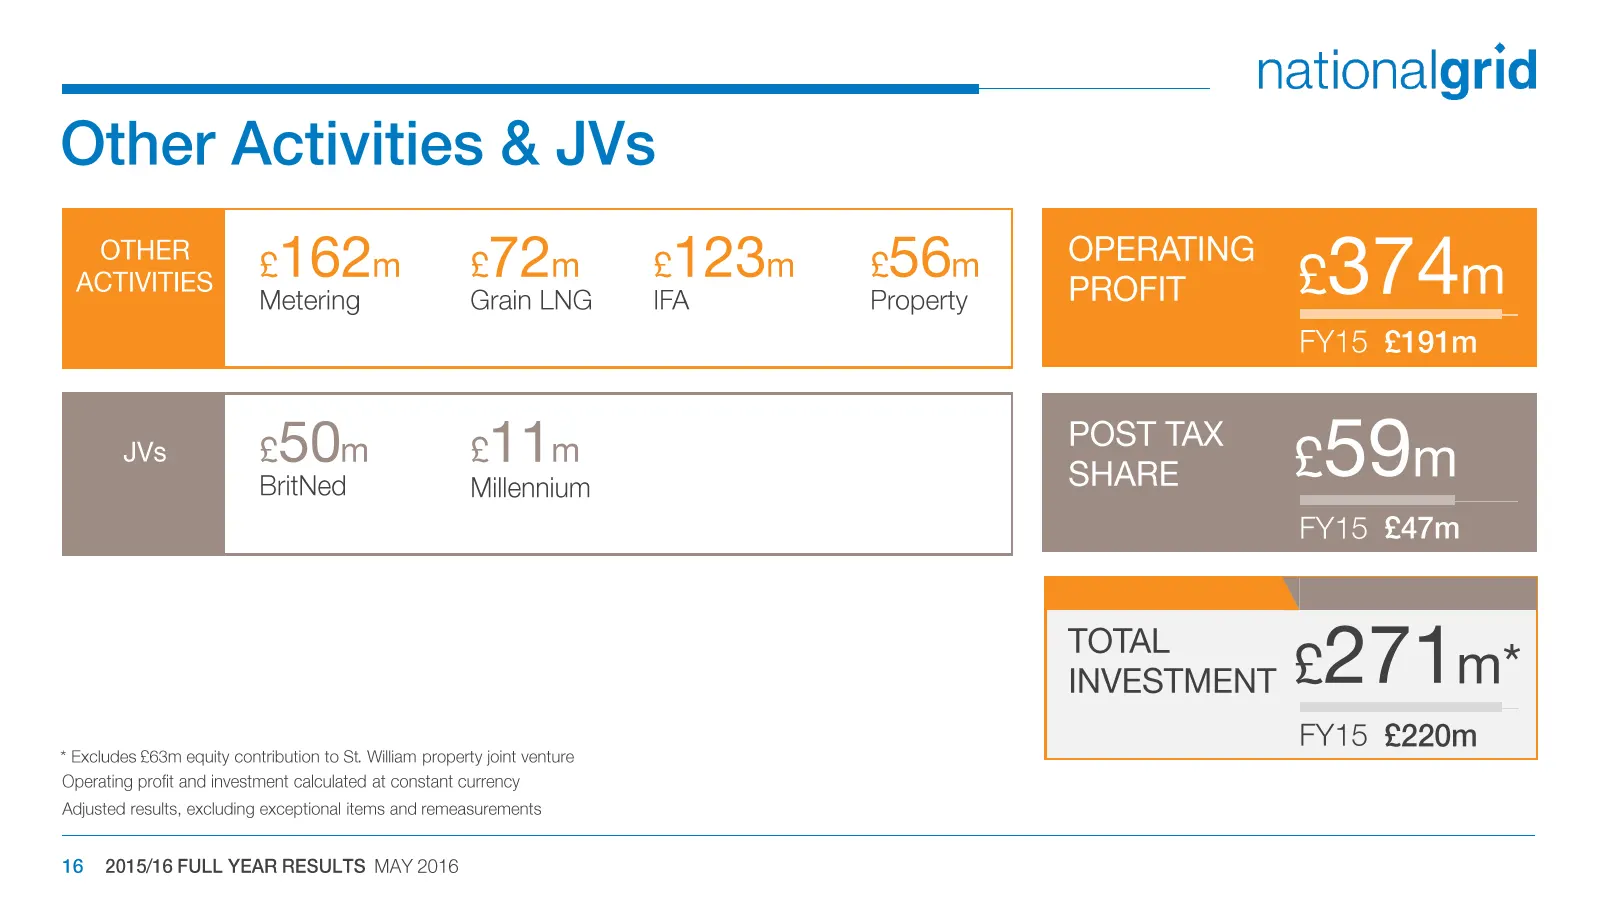
Other Activities & JVs OTHER ACTIVITIES £162m Metering e72m Grain LNG £123m IFA 256m Property JVs 50m BritNed 211m Millennium * Excludes 263m equity contribution to St. William property joint venture Operating profit and investment calculated at constant currency Adjusted results, excluding exceptio
Slide 17: Interest, tax and earnings
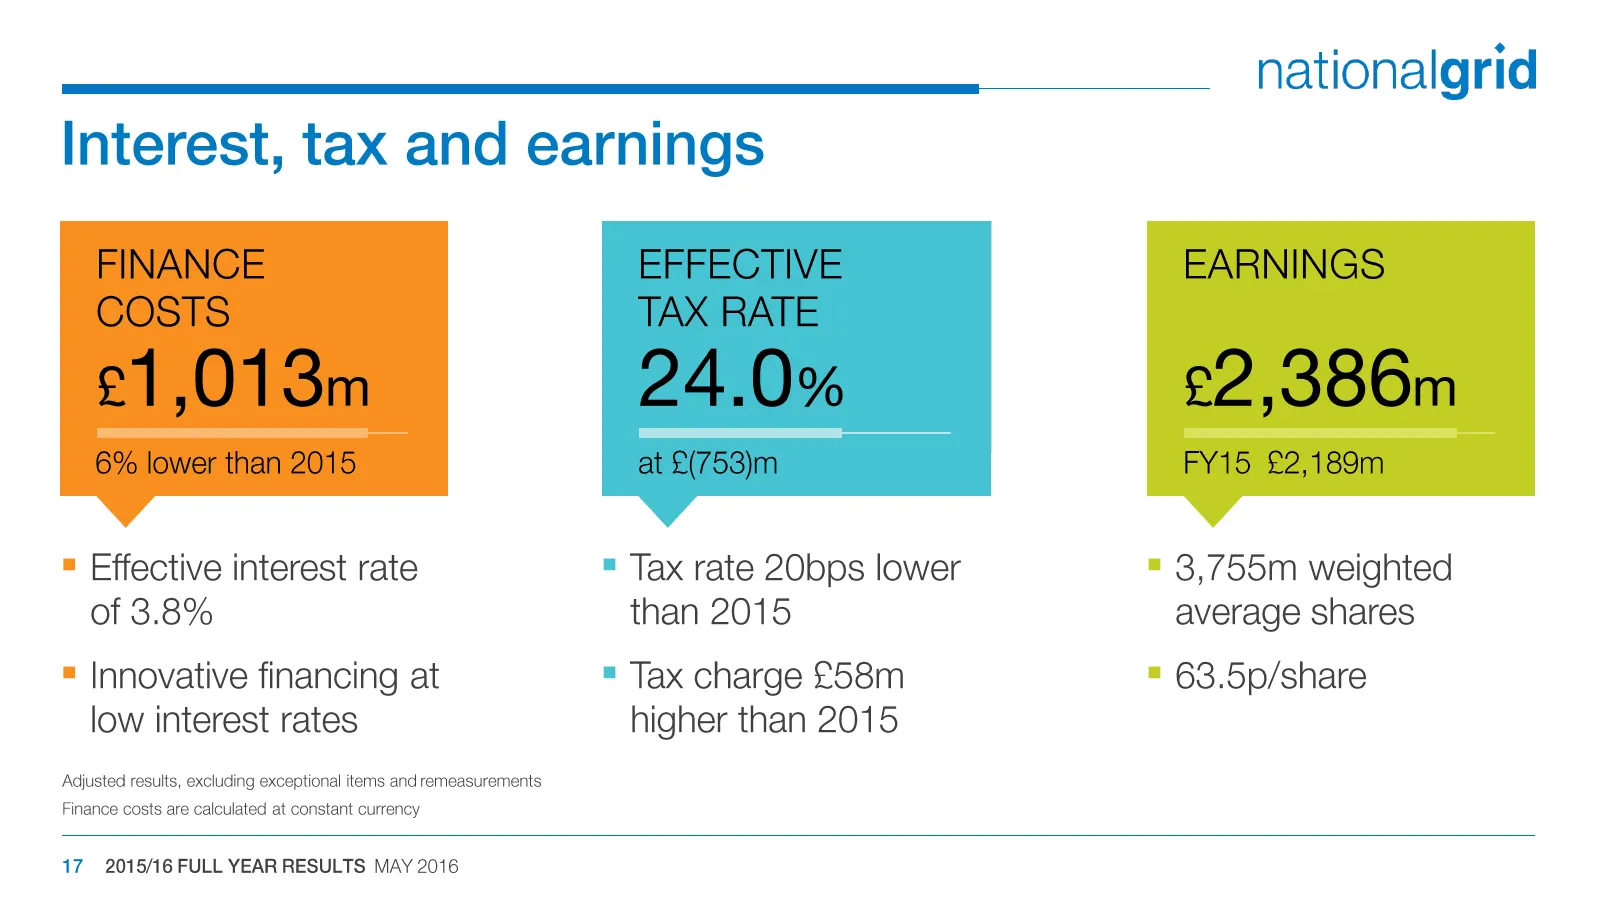
nationalgrid Interest, tax and earnings = Effective interest rate = Tax rate 20bps lower = 3,755m weighted of 3.8% than 2015 average shares = Innovative financing at = Tax charge £58m = 63.5p/share low interest rates higher than 2015 Adjusted results, excluding exceptional items and remeasurements F
Slide 18: Cash flow and net debt
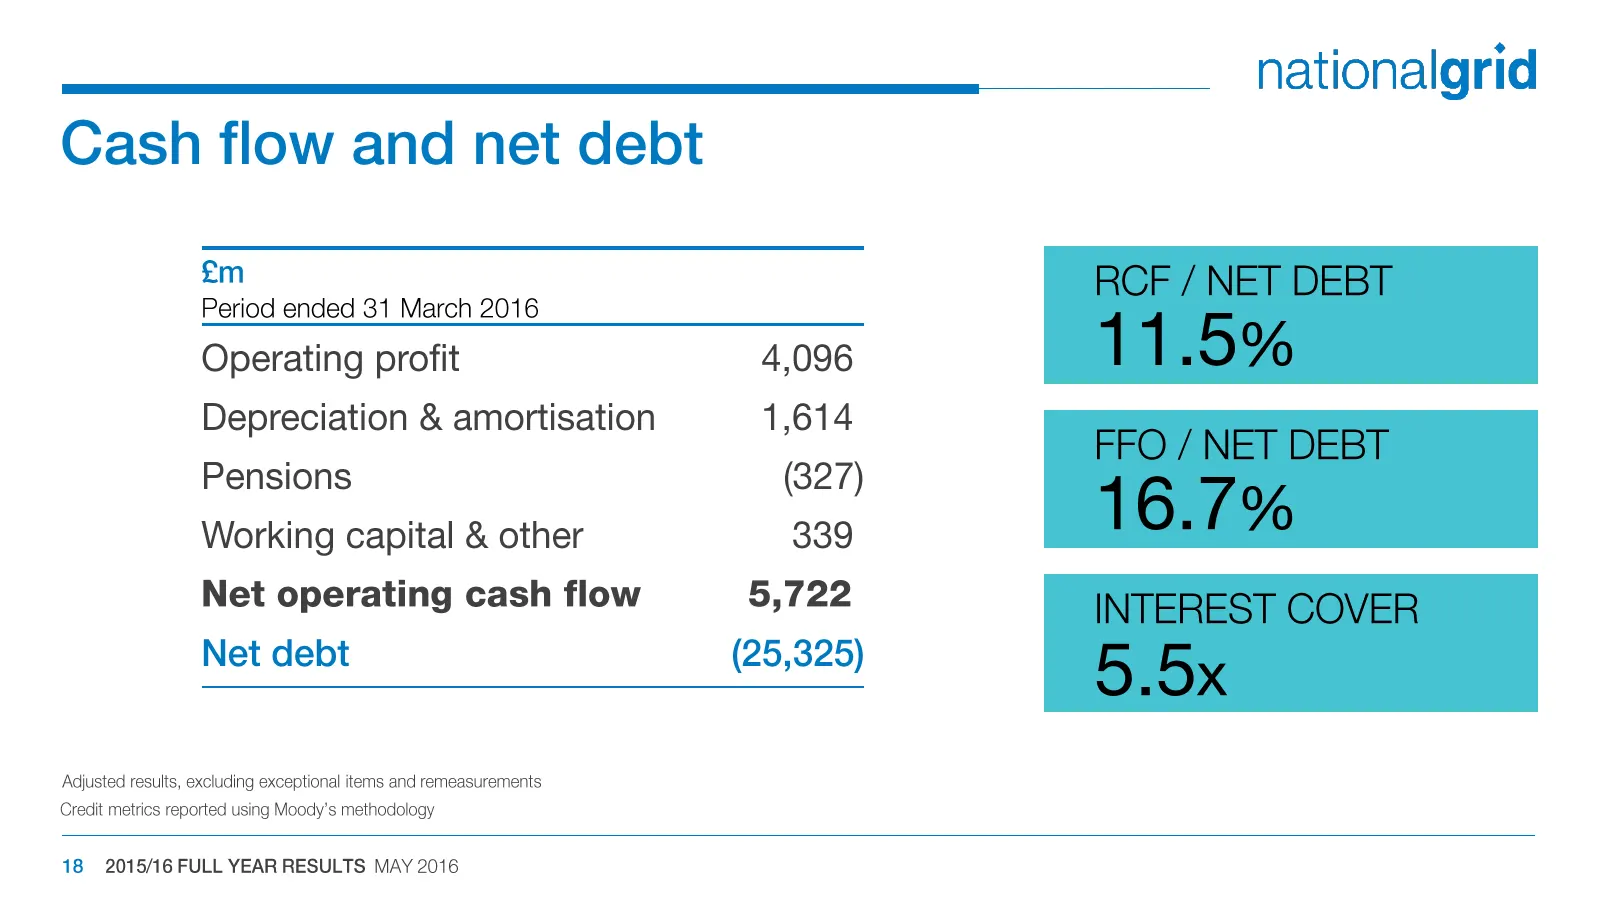
Cash flow and net debt £m Period ended 31 March 2016 Operating profit Depreciation & amortisation Pensions Working capital & other Net operating cash flow Net debt 4,096 1,614 (327) 339 5,722 (25,325) Adjusted results, excluding exceptional items and remeasurements Credit metrics reported using Mood
Slide 19: Growth through balanced investments
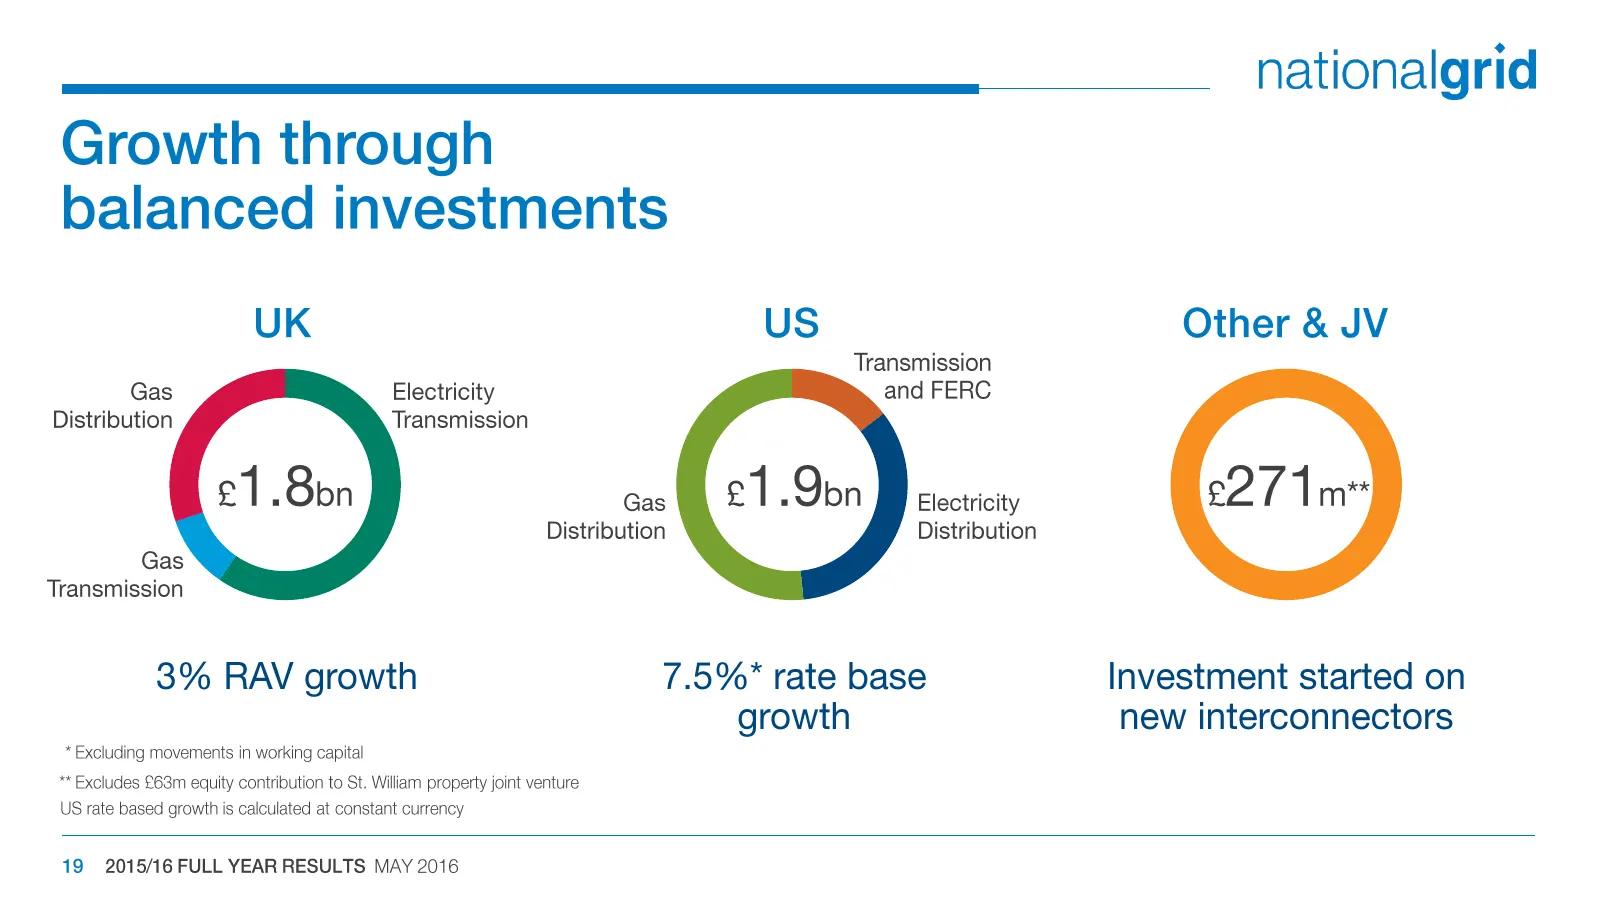
Growth through balanced investments UK US Transmission Gas Electricity and FERC Distribution Transmission Gas Electricity Distribution Distribution Gas Transmission 7.5%* rate base growth 3% RAV growth * Excluding movements in working capital * Excludes £63m equity contribution to St. Willan propert
Slide 20: Sustained investment
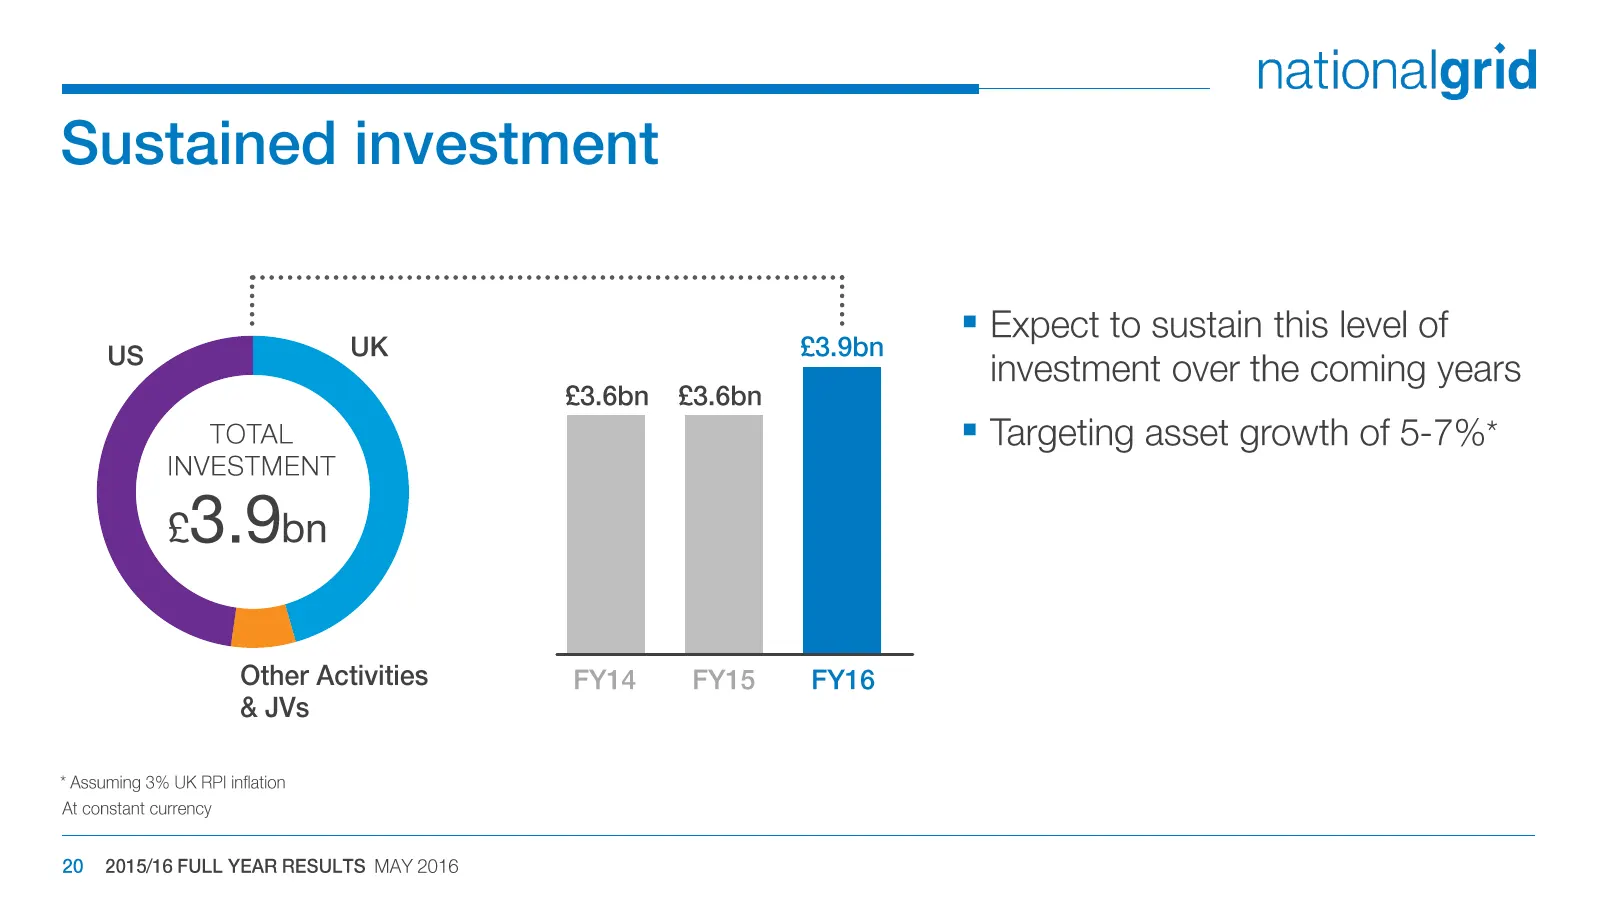
nationalgrid Sustained investment °3 bon " Expect to sustain this level of : investment over the coming years £3.6bn £3.6bn TOTAL = Targeting asset growth of 5-7%* INVESTMENT 23 Opn Other Activities FY14 FY15 FY16 & JVs * Assuming 3% UK RP! inflation At constant currency 20 2015/16 FULL YEAR RESULTS
Slide 21: Dividend and scrip
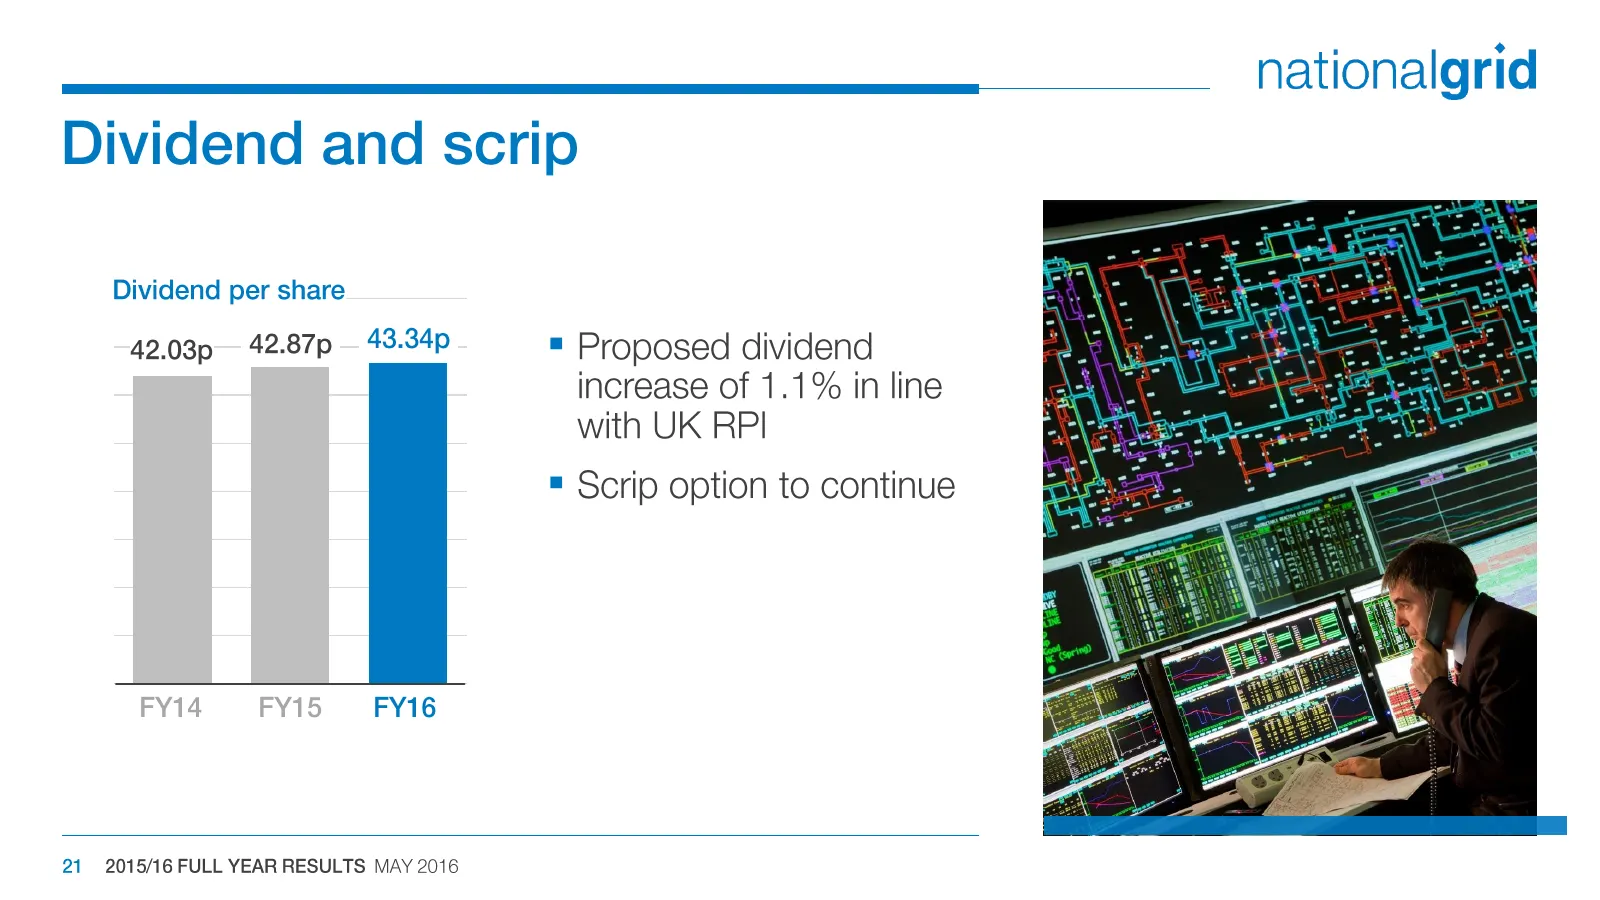
nationalgrid Dividend and scrip Dividend per share 42.03p — 42.87p — 43.34 = Proposed dividend increase of 1.1% in line with UK RPI = Scrip option to continue FY16 21 2015/16 FULL YEAR RESULTS MAY 2016
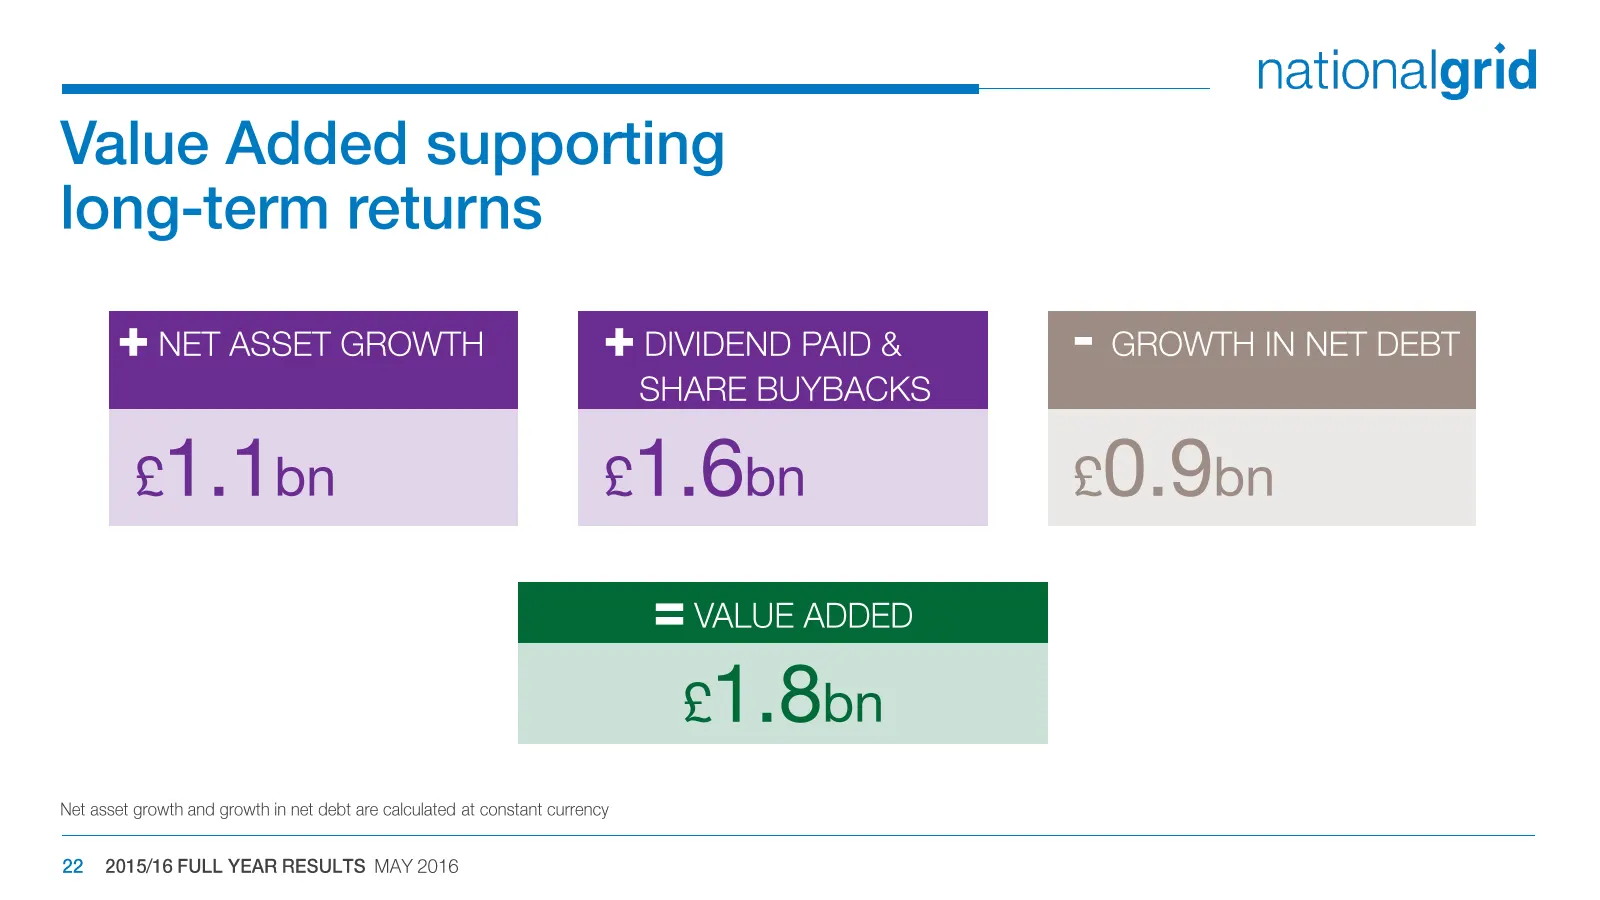
Slide 22: Value Added supporting long-term returns
nationalgrid Value Added supporting long-term returns + NET ASSET GROWTH * DIVIDEND PAID & = GROWTH IN NET DEBT SHARE BUYBACKS £1.1bn £1.6bn £0.9bn £1.8bn Net asset growth and growth in net debt are calculated at constant currency 22 2015/16 FULL YEAR RESULTS MAY 2016
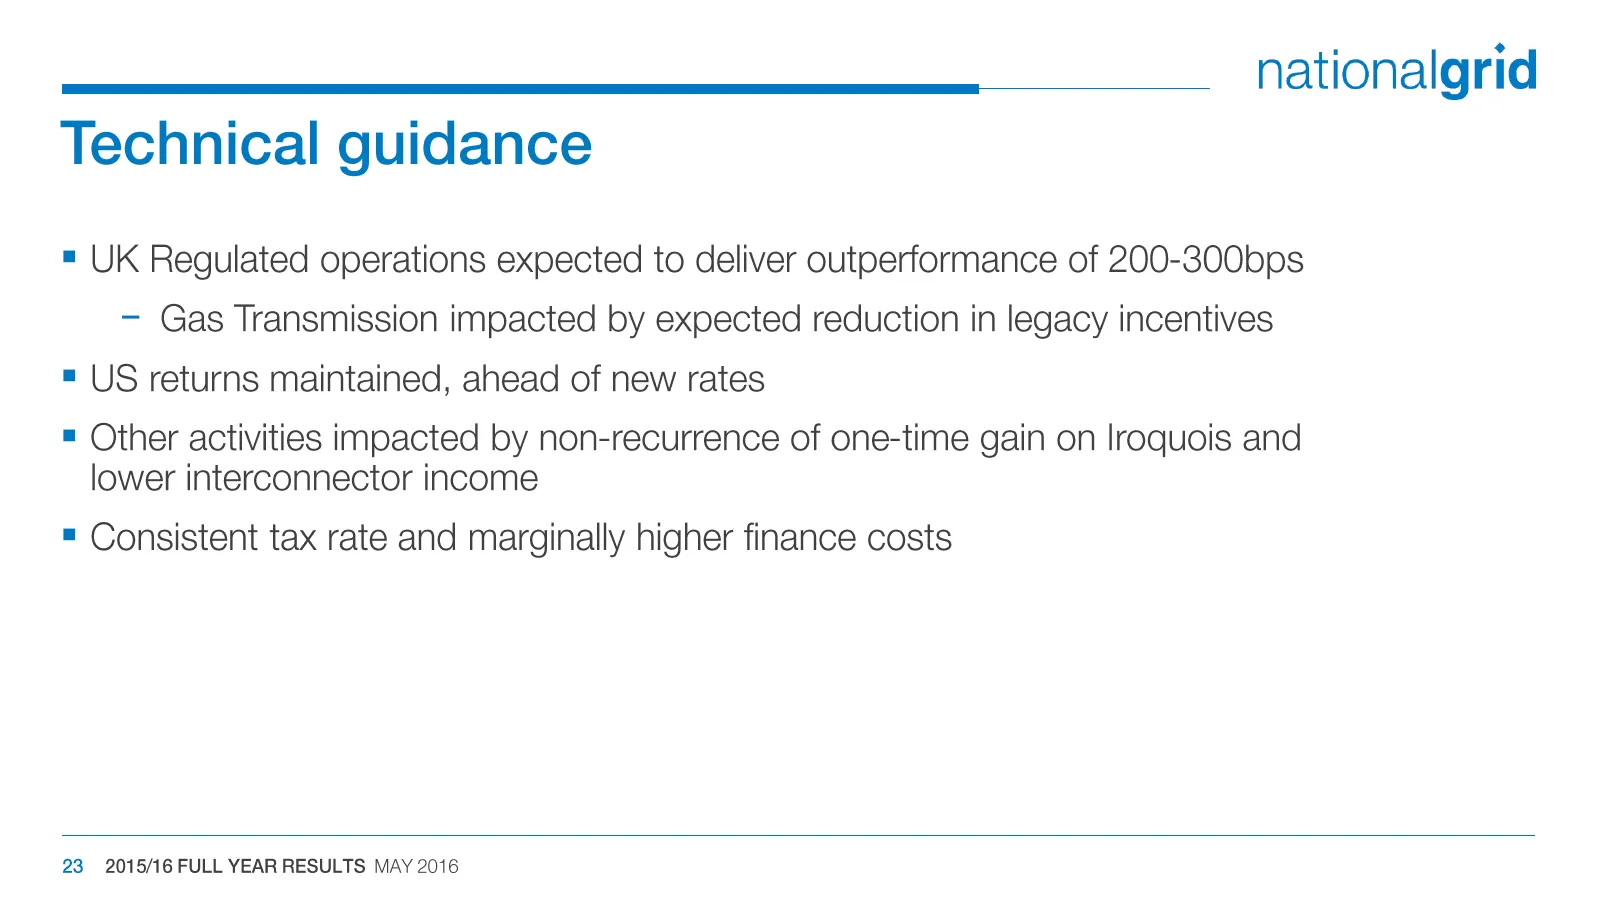
Slide 23: Technical guidance
nationalgrid Technical guidance = UK Regulated operations expected to deliver outperformance of 200-300bps — Gas Transmission impacted by expected reduction in legacy incentives = US returns maintained, ahead of new rates = Other activities impacted by non-recurrence of one-time gain on Iroquois and
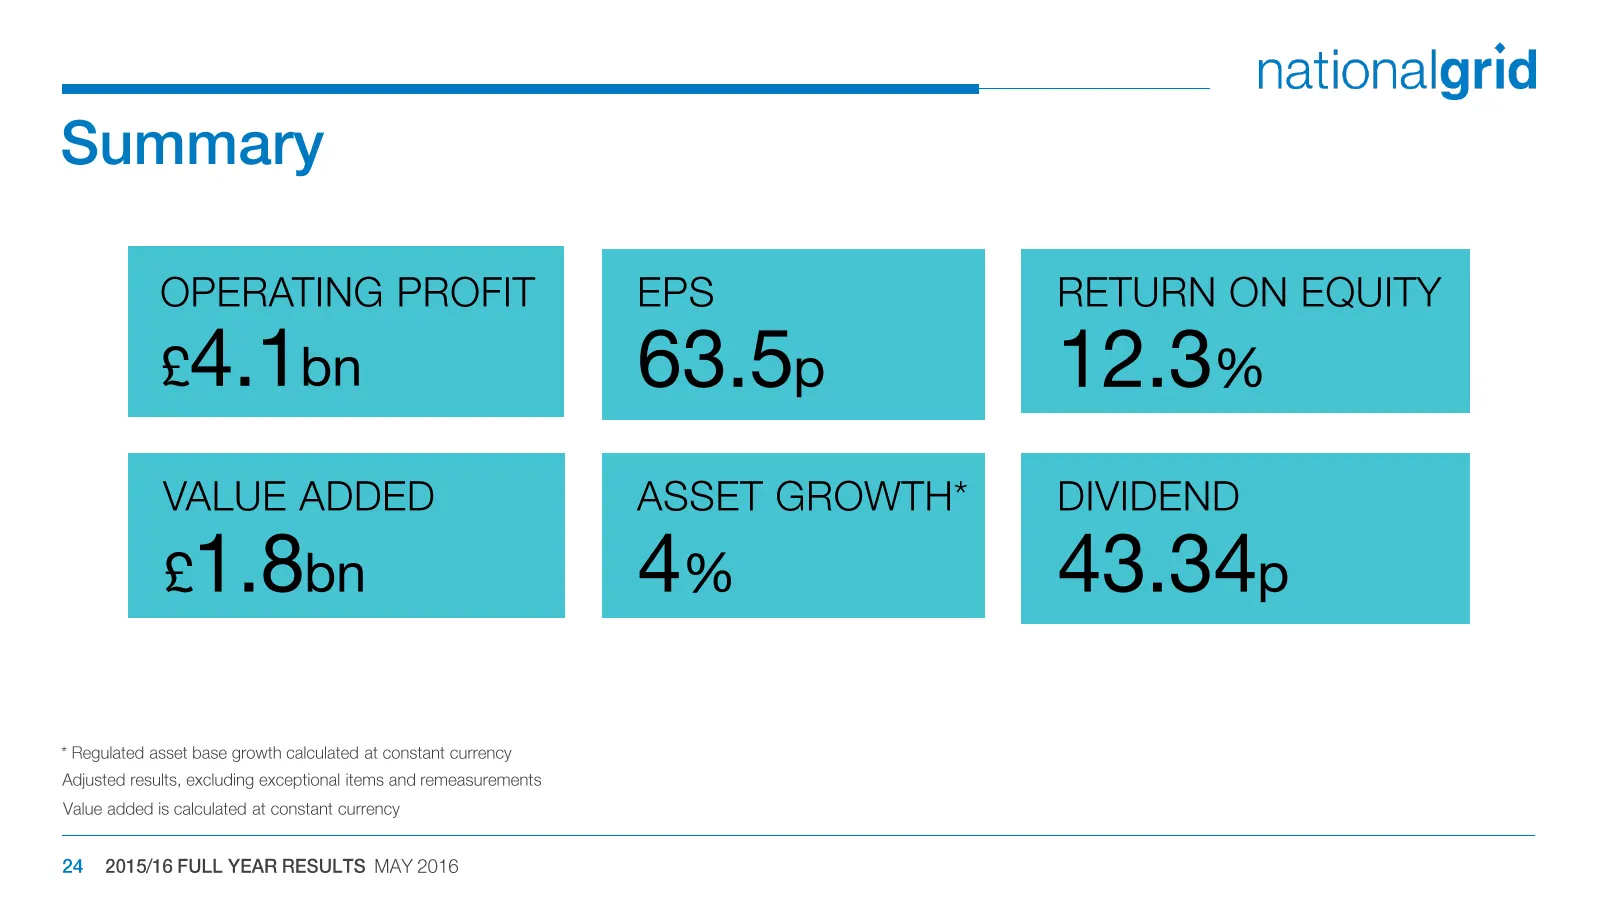
Slide 24: Operating profit, EPS, return on equity
OPERATING PROFIT EPS RETURN ON EQUITY £4.1bn 63.5p 12.3% VALUE ADDED ASSET GROWTH* DIVIDEND £1.8bn 4% 43.34p 2015/16 FULL YEAR RESULTS MAY 2016

Slide 25: Priorities & Outlook
nationalgrid Priorities & Outlook JOHN PETTIGREW | CHIEF EXECUTIVE
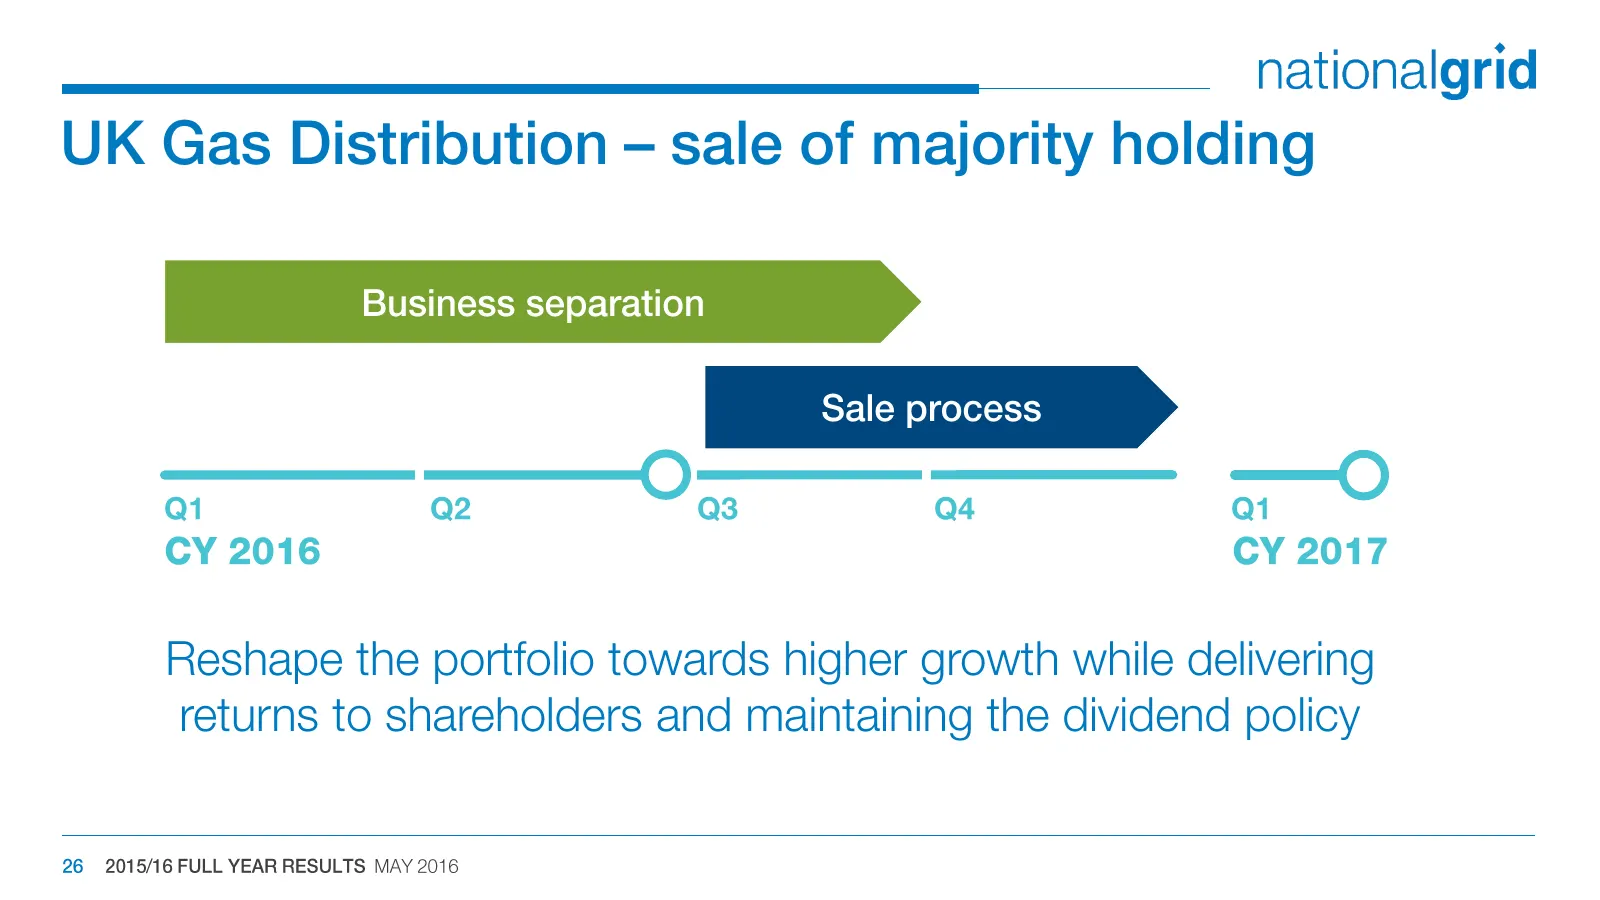
Slide 26: UK Gas Distribution — sale of majority holding
nationalgrid UK Gas Distribution — sale of majority holding Business separation Sale process Qi Q2 : Q3 Q4 Qi ° CY 2016 CY 2017 Reshape the portfolio towards higher growth while delivering returns to shareholders and maintaining the dividend policy 26 2015/16 FULL YEAR RESULTS MAY 2016
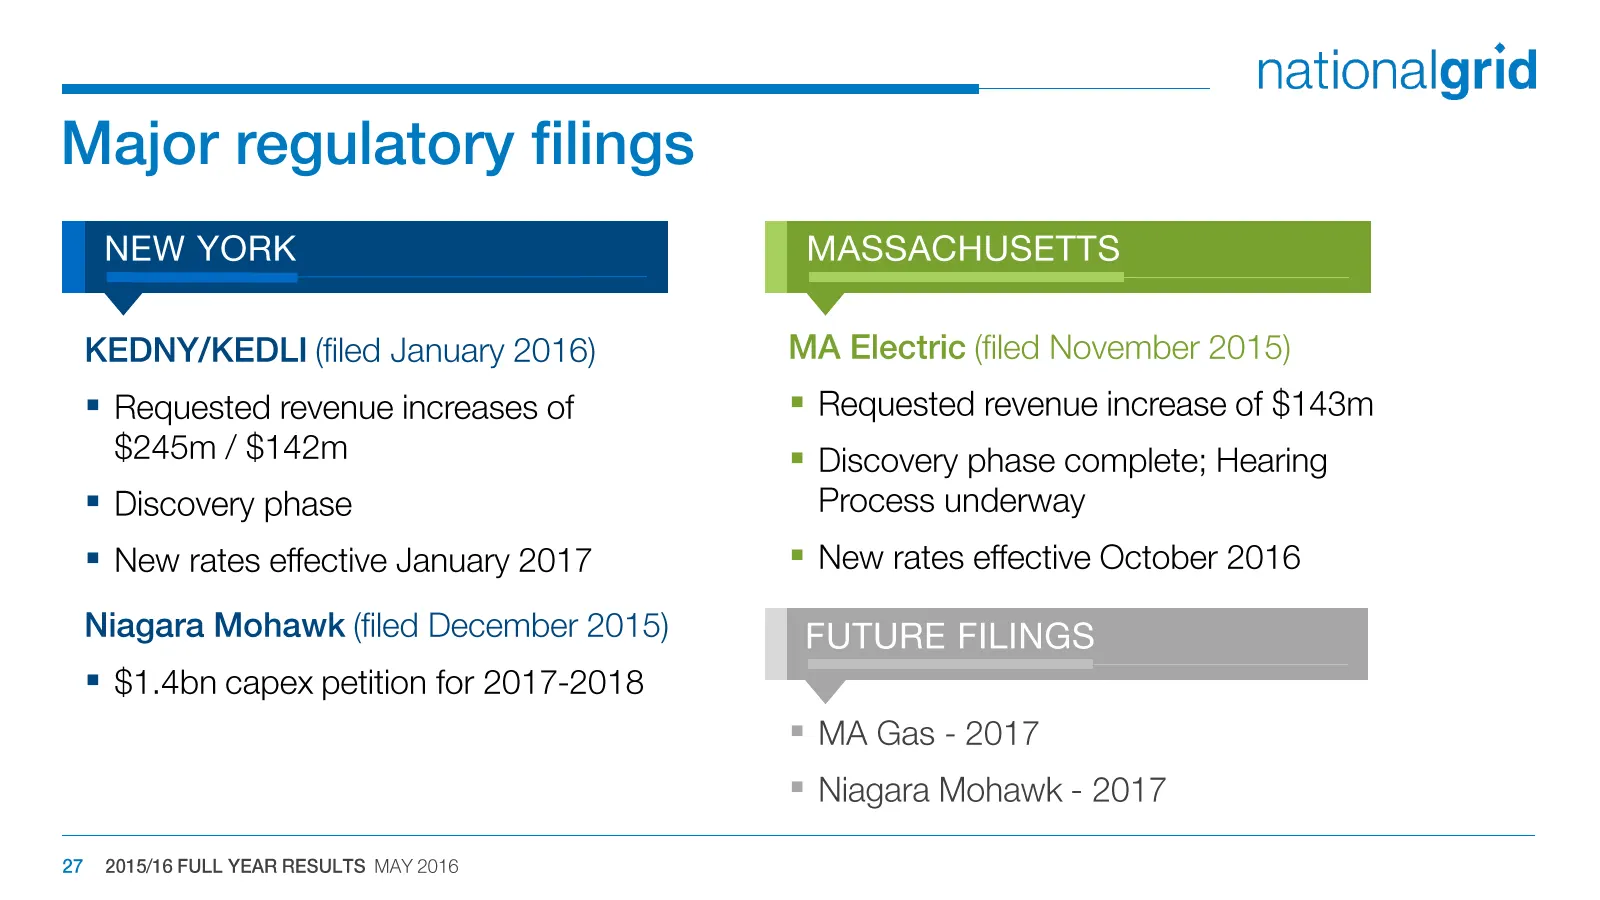
Slide 27: Major regulatory filings
nationalgrid Major regulatory filings KEDNY/KEDLI (filed January 2016) MA Electric (filed November 2015) = Requested revenue increases of = Requested revenue increase of $143m $245m / $142m = Discovery phase complete; Hearing = Discovery phase Process underway = New rates effective January 2017 = Ne

Slide 28: Drivers for long-term success: Customer First
nationalgrid Drivers for long-term success Customer First 28 2015/16 FULL YEAR RESULTS MAY 2016
Slide 29: Performance Optimisation
Performance Optimisation 2015/16 FULL YEAR RESULTS MAY 2016
Slide 30: Drivers for long-term success
nationalgrid Drivers for long-term success Customer First Performance Optimisation 30 2015/16 FULL YEAR RESULTS MAY 2016
Slide 31: Evolve for the Future
Evolve for the Future 2015/16 FULL YEAR RESULTS MAY 2016
Slide 32: Summary
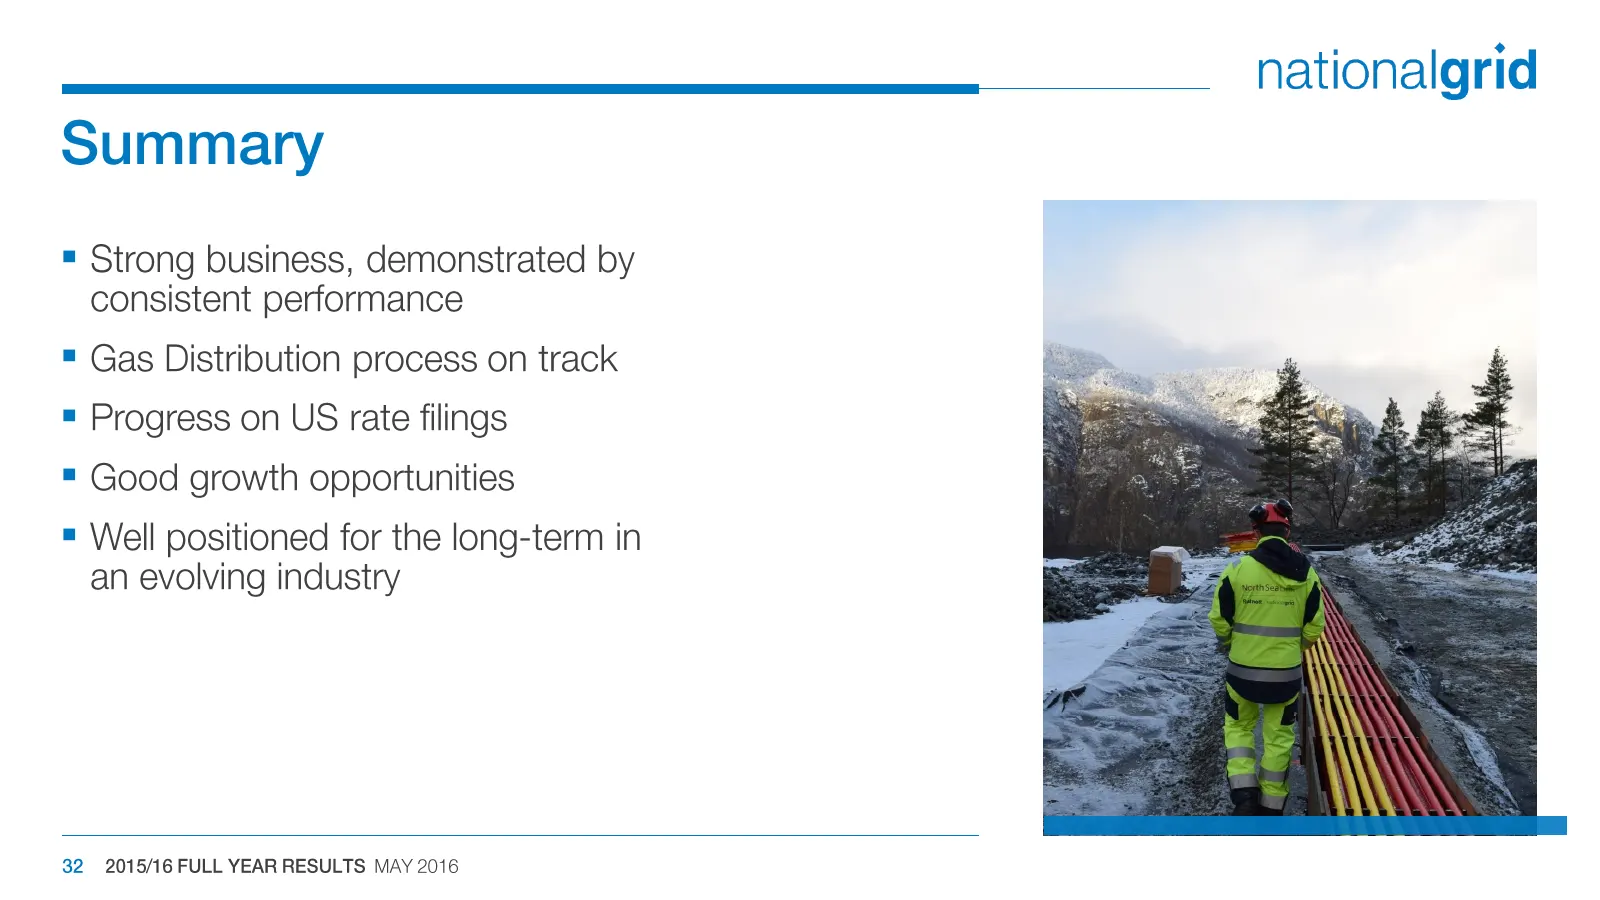
Summary = Strong business, demonstrated by consistent performance = Gas Distribution process on track = Progress on US rate filings = Good growth opportunities = Well positioned for the long-term in an evolving industry 32 2015/16 FULL YEAR RESULTS MAY 2016 nationalgrid

Slide 33: Presenters: Pettigrew, Bonfield, Seavers
JOHN PETTIGREW ANDREW BONFIELD DEAN SEAVERS CHIEF EXECUTIVE FINANCE DIRECTOR US EXECUTIVE DIRECTOR

Slide 34: Appendices
nationalgrid Appendices
Slide 35: UK Electricity Transmission
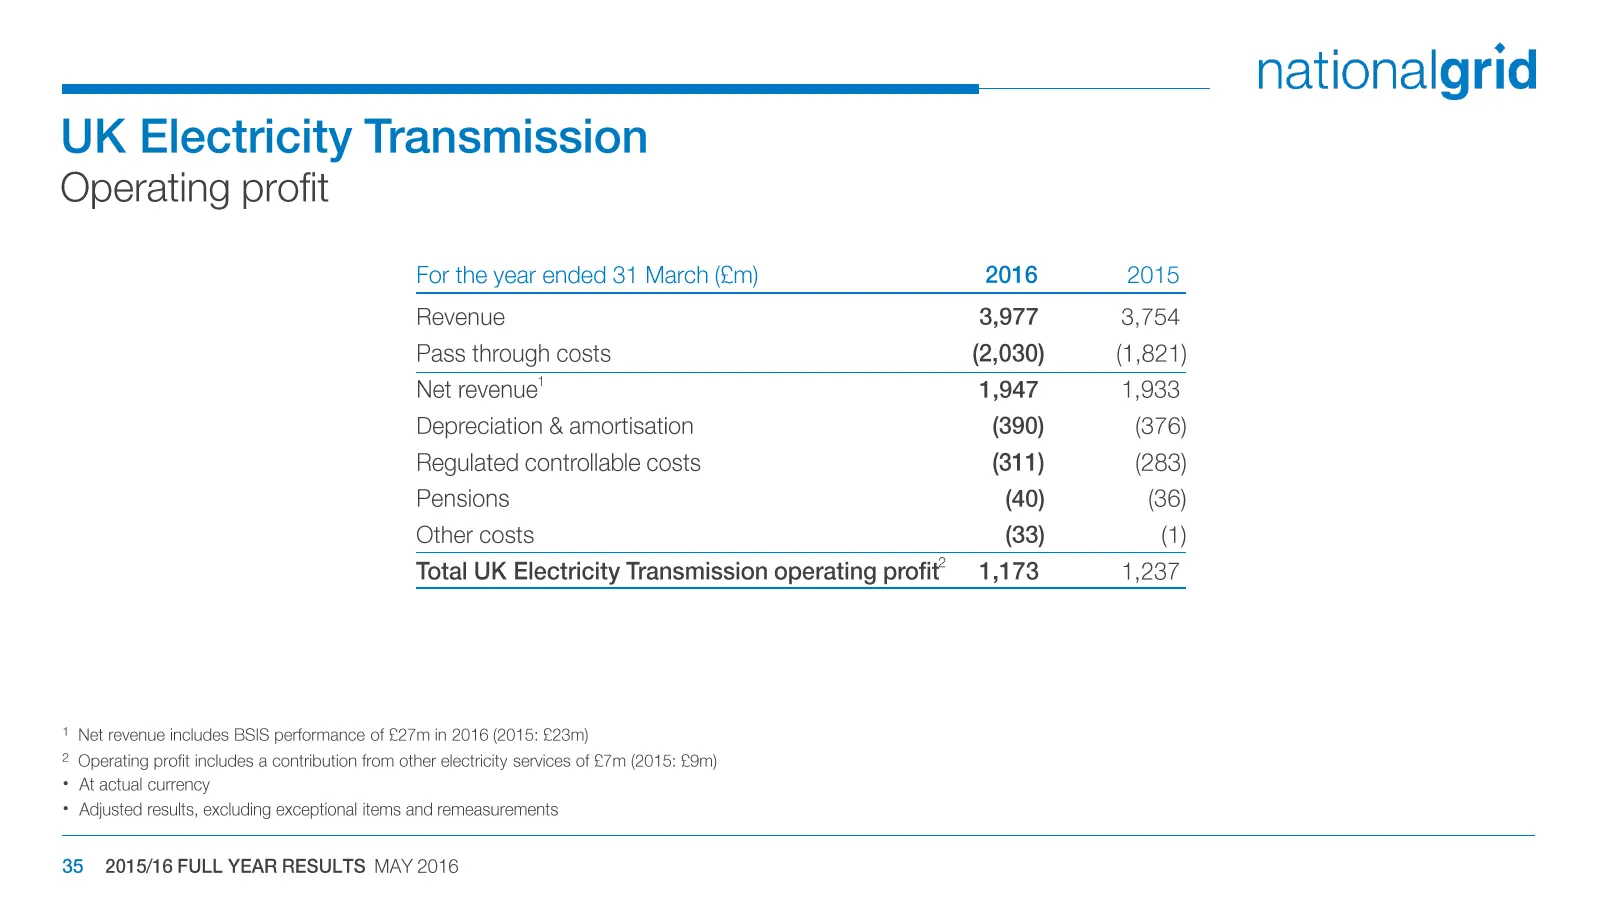
UK Electricity Transmission Operating profit For the year ended 31 March (£m) 2016 2015 Revenue 3,977 3,754 Pass through costs (2,030) (1,821) Net revenue! 1,947 1,933 Depreciation & amortisation (390) (376) Regulated controllable costs (283) Pensions (36) Other costs (1) Total UK Electricity Transm
Slide 36: UK Gas Transmission
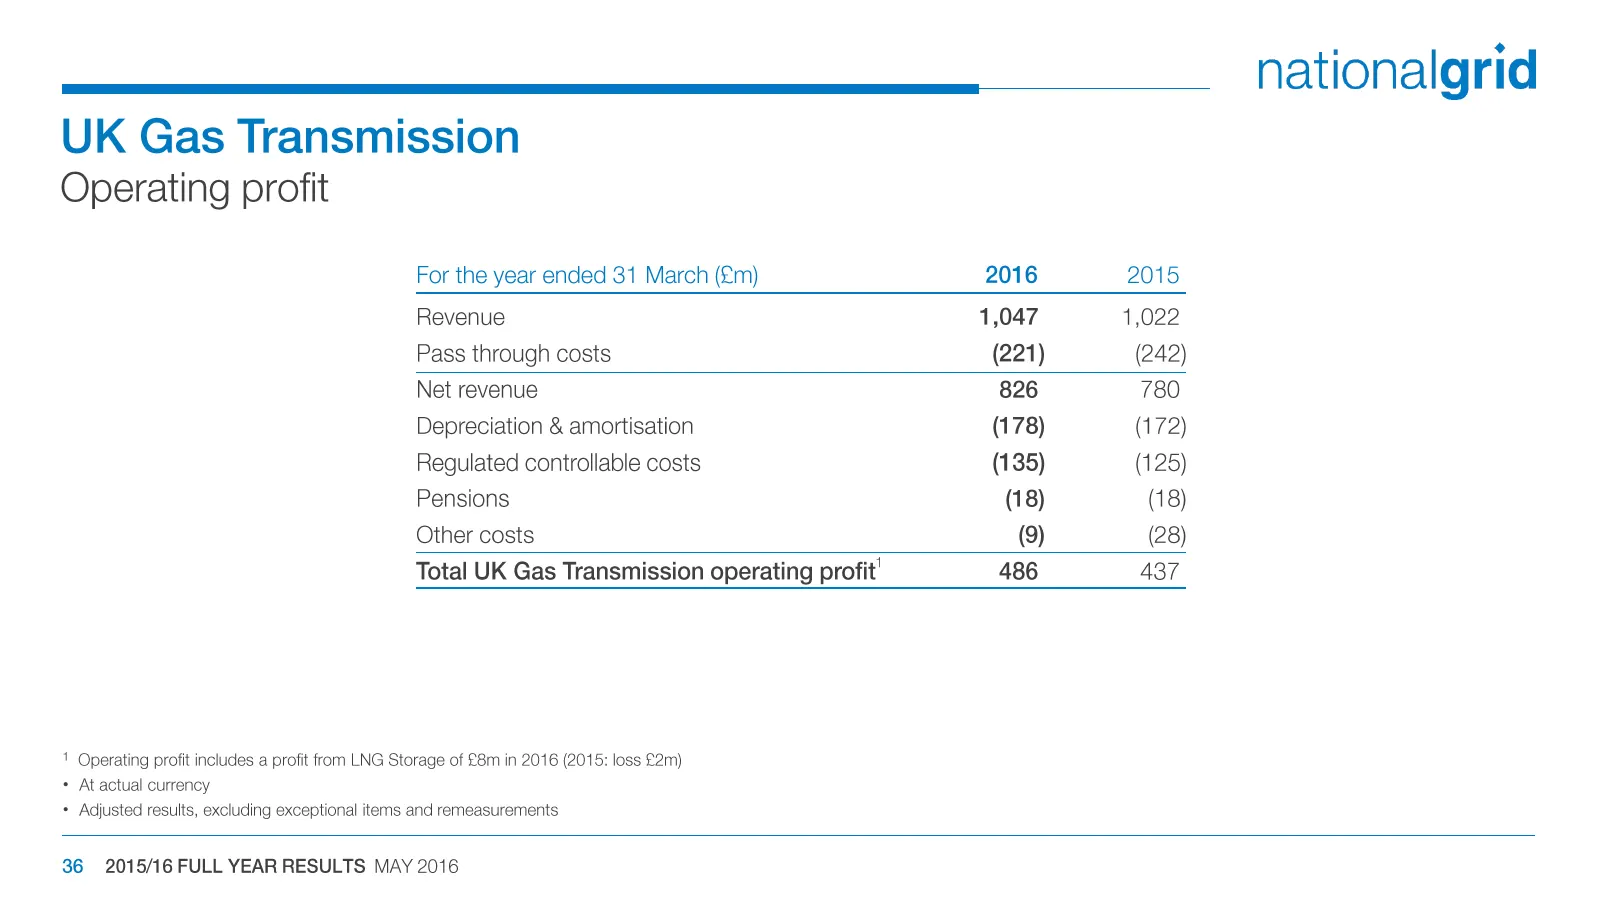
nationalgrid UK Gas Transmission Operating profit For the year ended 31 March (£m) 2016 2015 Revenue 1,047 1,022 Pass through costs (221) (242) Net revenue 826 780 Depreciation & amortisation (178) (172) Regulated controllable costs (135) (125) Pensions (18) (18) Other costs (9) (28) Total UK Gas Tr
Slide 37: UK Gas Distribution
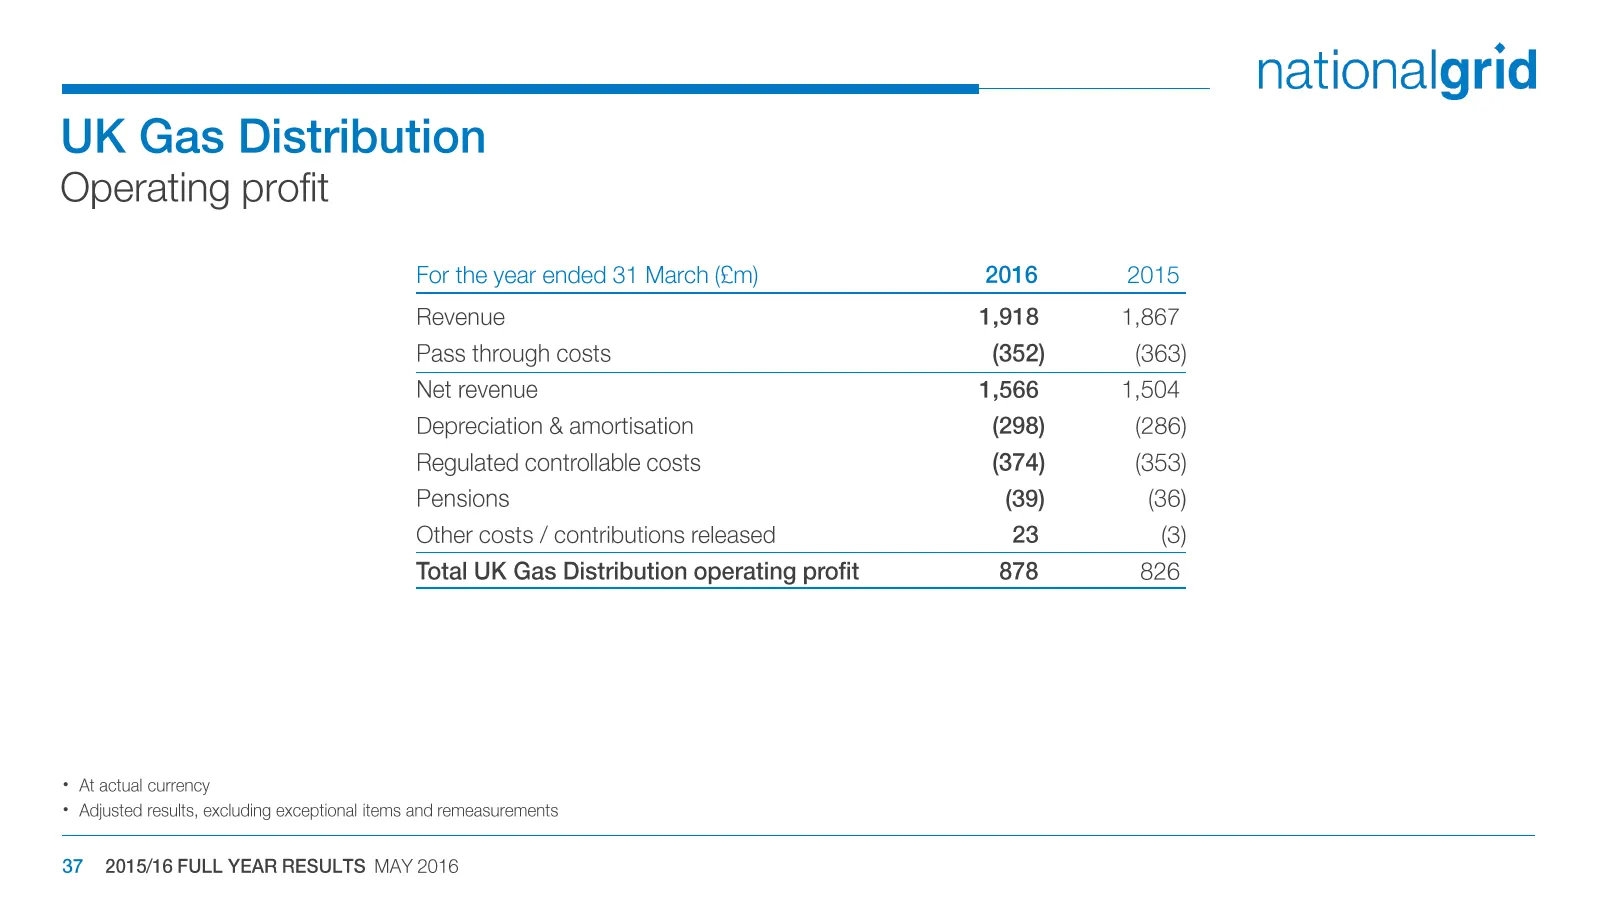
UK Gas Distribution Operating profit For the year ended 31 March (£m) 2016 2015 Revenue 1,918 1,867 Pass through costs (352) (363) Net revenue 1,566 1,504 Depreciation & amortisation (298) (286) Regulated controllable costs (374) (353) Pensions (39) (36) Other costs / contributions released 23 (3) T
Slide 38: US Regulated
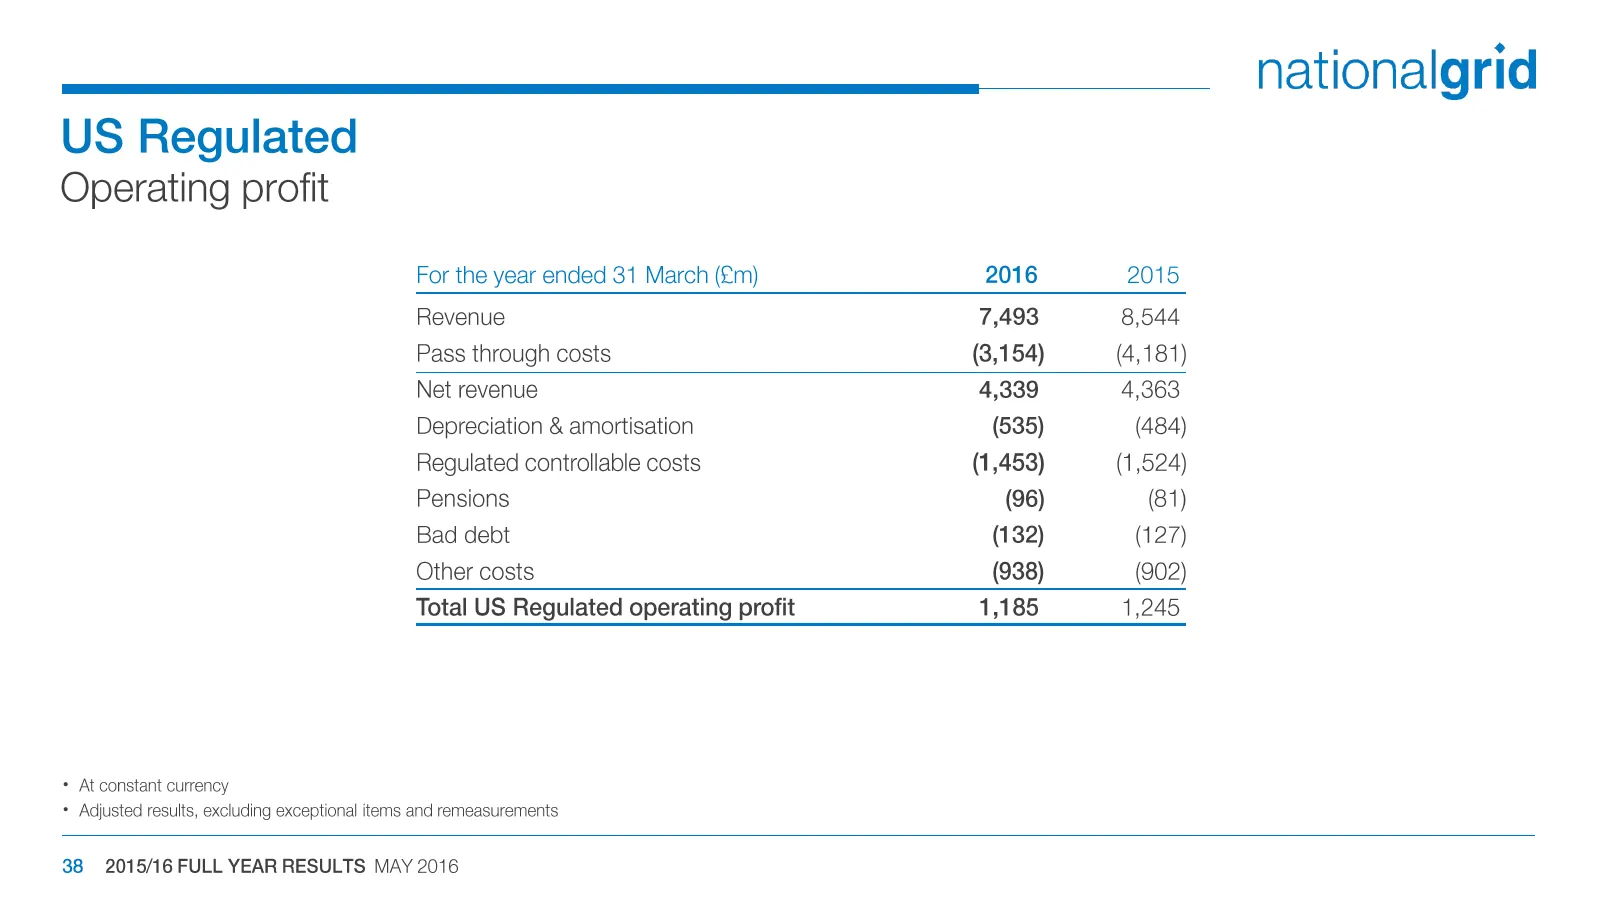
US Regulated Operating profit For the year ended 31 March (£m) 2016 2015 Revenue 7,493 8,544 Pass through costs (3,154) (4,181) Net revenue 4,339 4,363 Depreciation & amortisation (535) (484) Regulated controllable costs (1,453) (1,524) Pensions (96) (81) Bad debt (132) (127) Other costs (938) (902)
Slide 39: Metering, Grain LNG, French Interconnector and Property
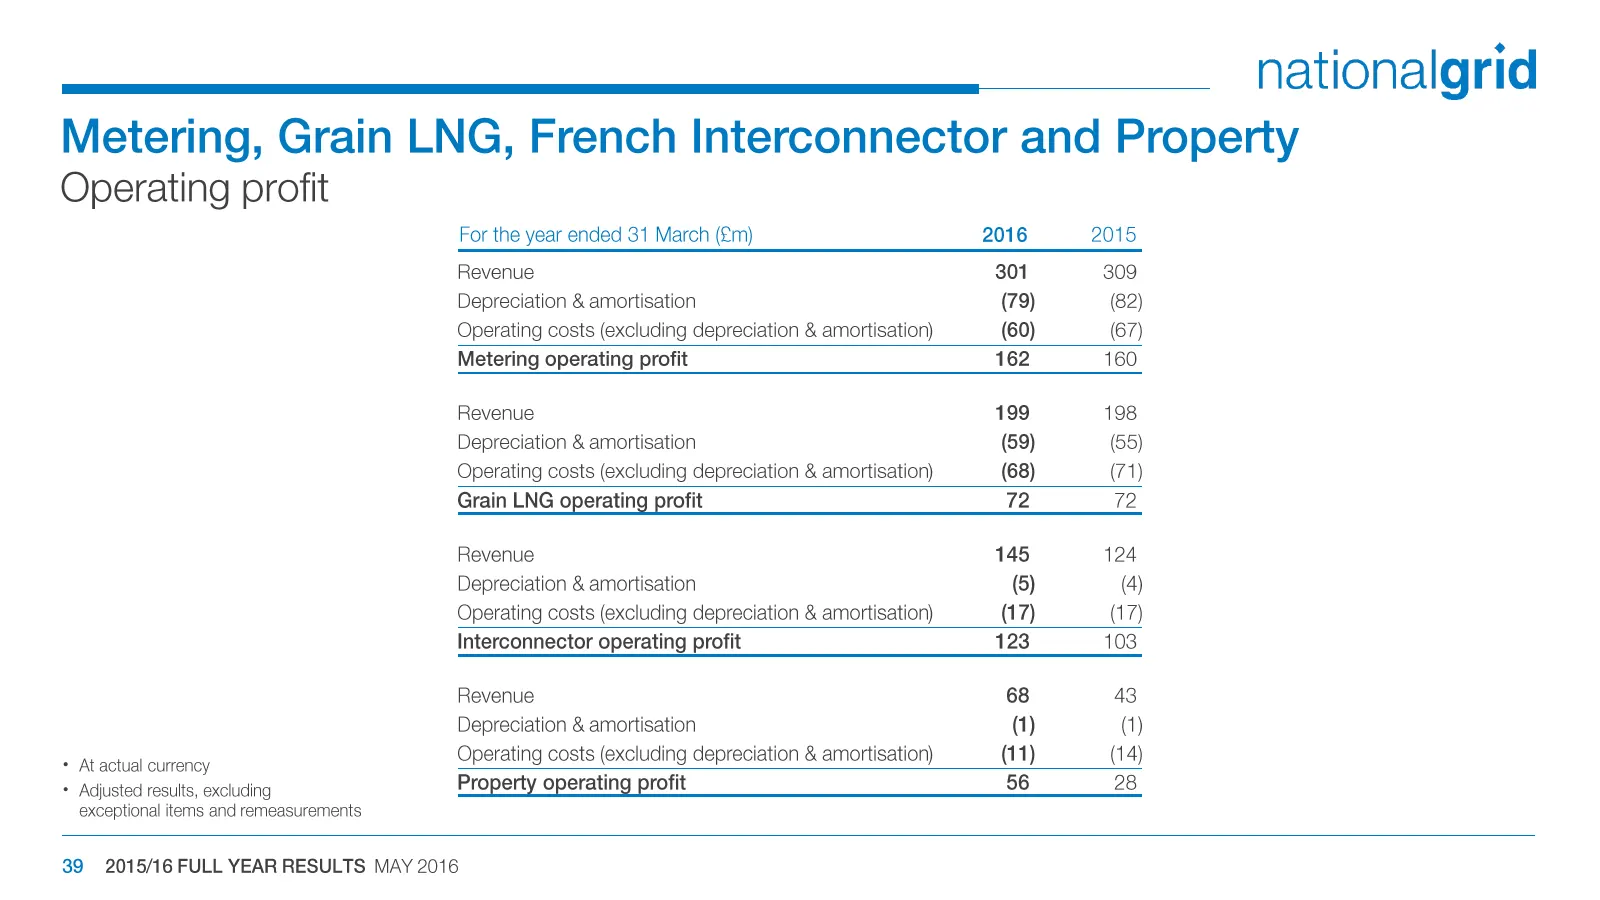
nationalgrid Metering, Grain LNG, French Interconnector and Property Operating profit * At actual currency + Adjusted results, excluding exceptional items and remeasurements For the year ended 31 March (£m) 2016 2015 Revenue 301 309 Depreciation & amortisation (79) (82) Operating costs (excluding de
Slide 40: Exchange rates
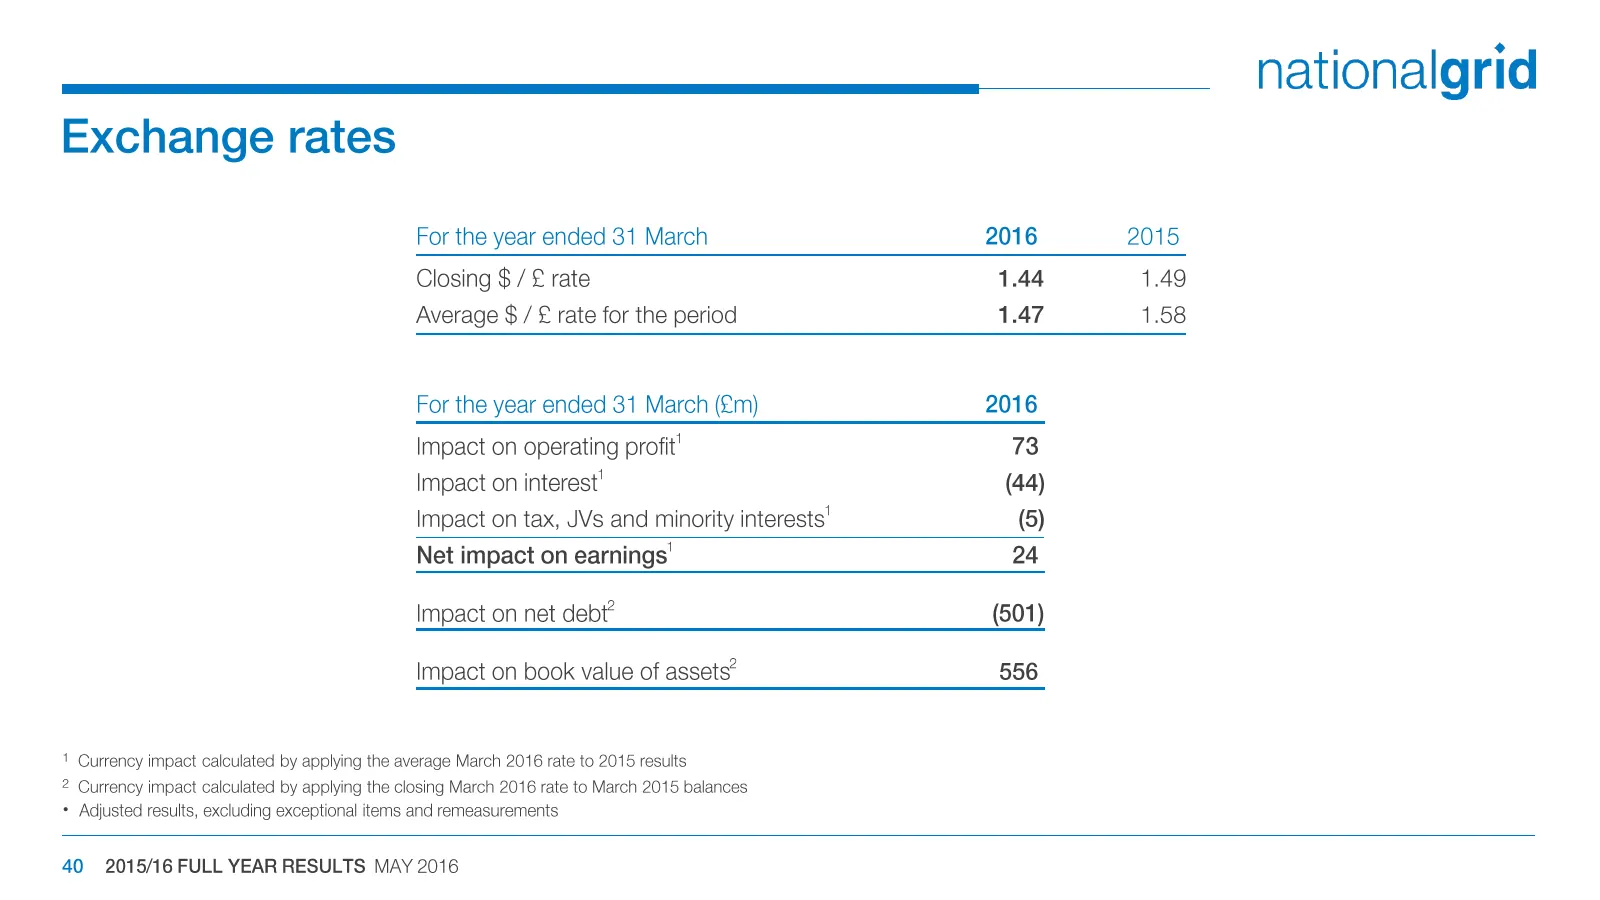
Exchange rates For the year ended 31 March 2016 2015 Closing $/£ rate 1.44 1.49 Average $ / £ rate for the period 1.47 1.58 For the year ended 31 March (£m) 2016 Impact on operating profit' 73 Impact on interest! (44) Impact on tax, JVs and minority interests’ (5) Net impact on earnings' 24 Impact o
Slide 41: Pensions & other post-retirement benefit obligations
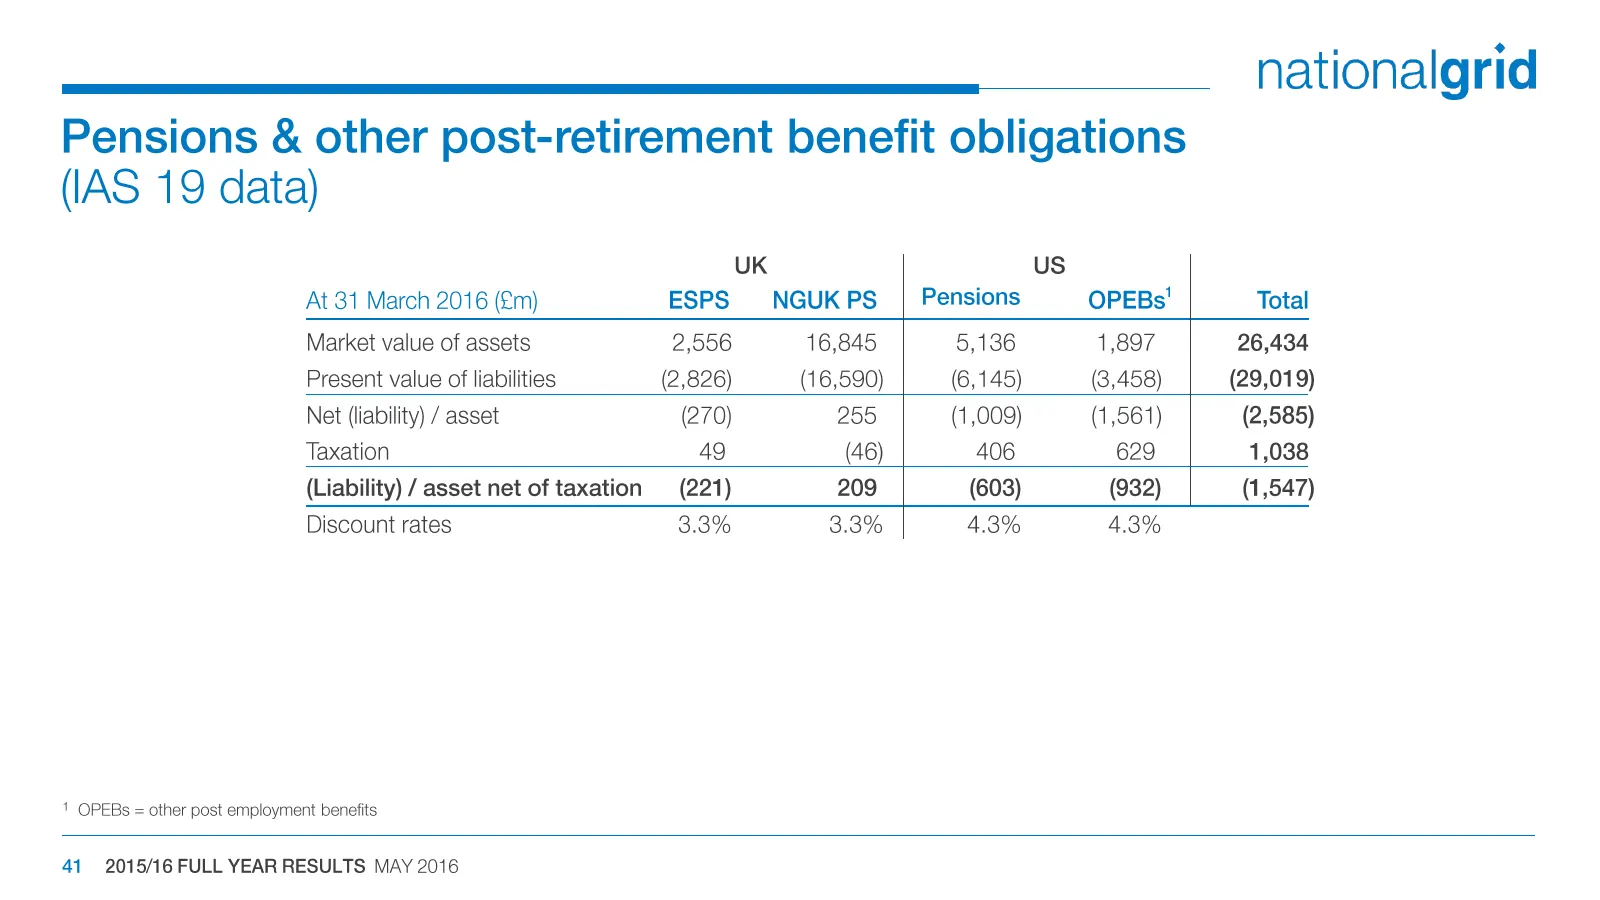
Pensions & other post-retirement benefit obligations (IAS 19 data) nationalgrid UK US At 31 March 2016 (£m) NGUK PS__| Pensions OPEBs' Total Market value of assets 16,845 5,136 1,897 26,434 Present value of liabilities (16,590) (6,145) (3,458) (29,019) Net (liability) / asset 255 (1,009) (1,561) (2,
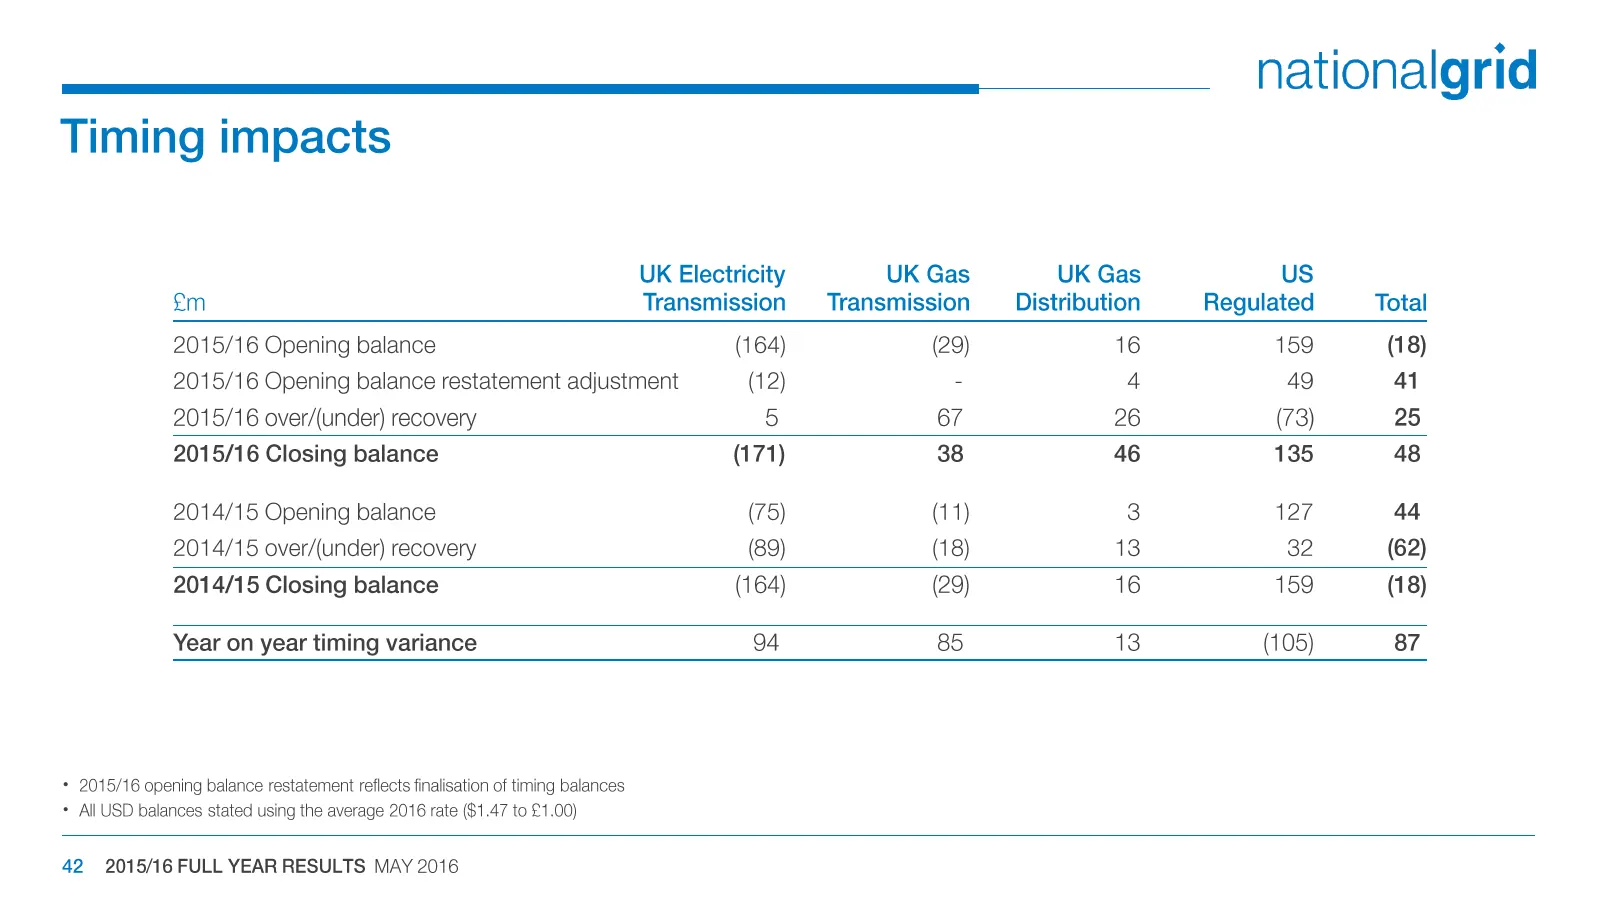
Slide 42: Timing impacts
nationalgrid Timing impacts UK Electricity UK Gas UK Gas US £m Transmission Transmission Distribution Regulated Total 2015/16 Opening balance (164) (29) 16 159 (18) 2015/16 Opening balance restatement adjustment (12) - 4 49 41 2015/16 over/(under) recovery 5 67 26 (73) 25 2015/16 Closing balance (17
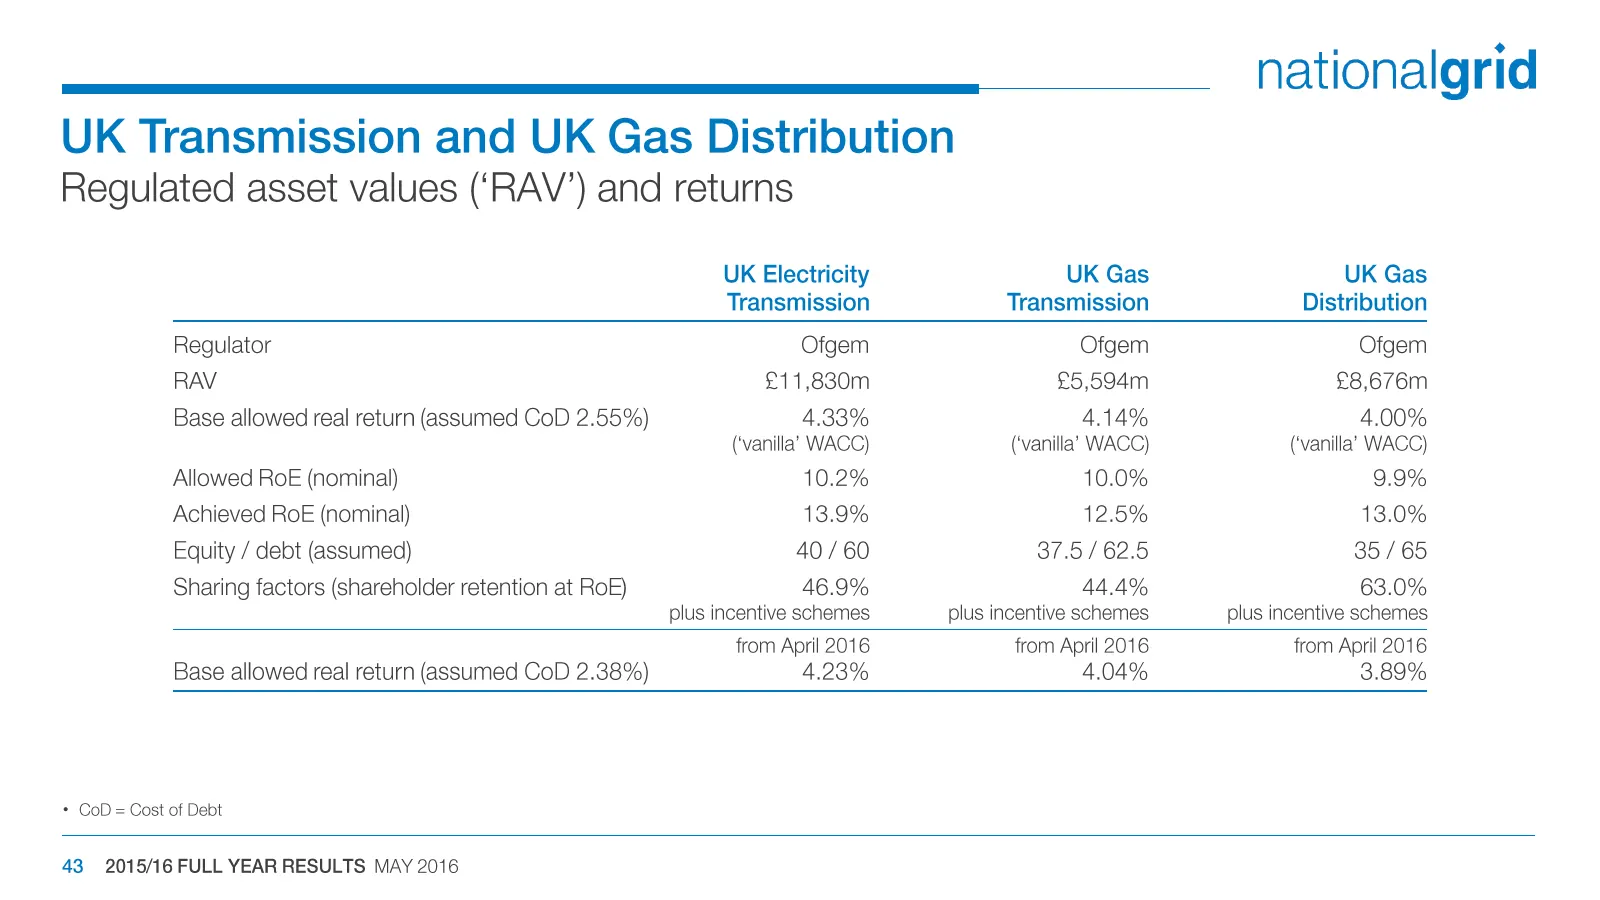
Slide 43: UK Transmission and UK Gas Distribution
nationalgrid UK Transmission and UK Gas Distribution Regulated asset values (‘RAV’) and returns UK Electricity UK Gas UK Gas Transmission Transmission Distribution Regulator Ofgem Ofgem Ofgem RAV £11,830m £5,594m £8,676m Base allowed real return (assumed CoD 2.55%) 4.33% 4.14% 4.00% (‘vanilla’ WACC)
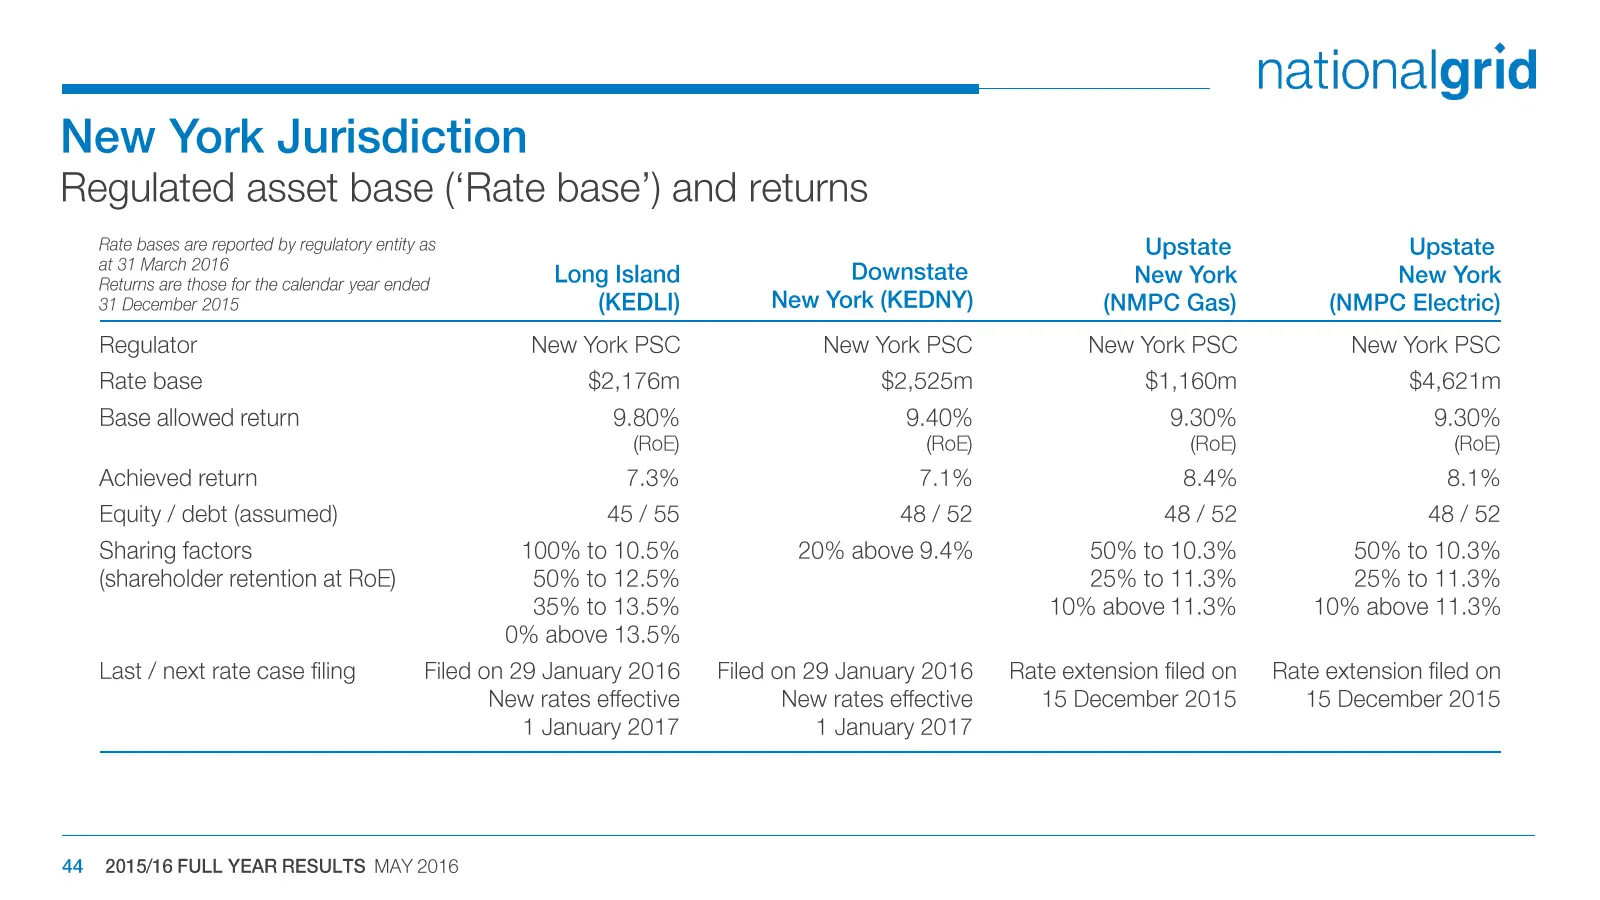
Slide 44: New York Jurisdiction
New York Jurisdiction Regulated asset base (‘Rate base’) and returns nationalgrid Rate bases are reported by regulatory entity as Upstate Upstate Fetus ae those for the calender year ended Long Island Downstate New York New York 31 December 2015 (KEDLI) New York (KEDNY) (NMPC Gas) (NMPC Electric) Re
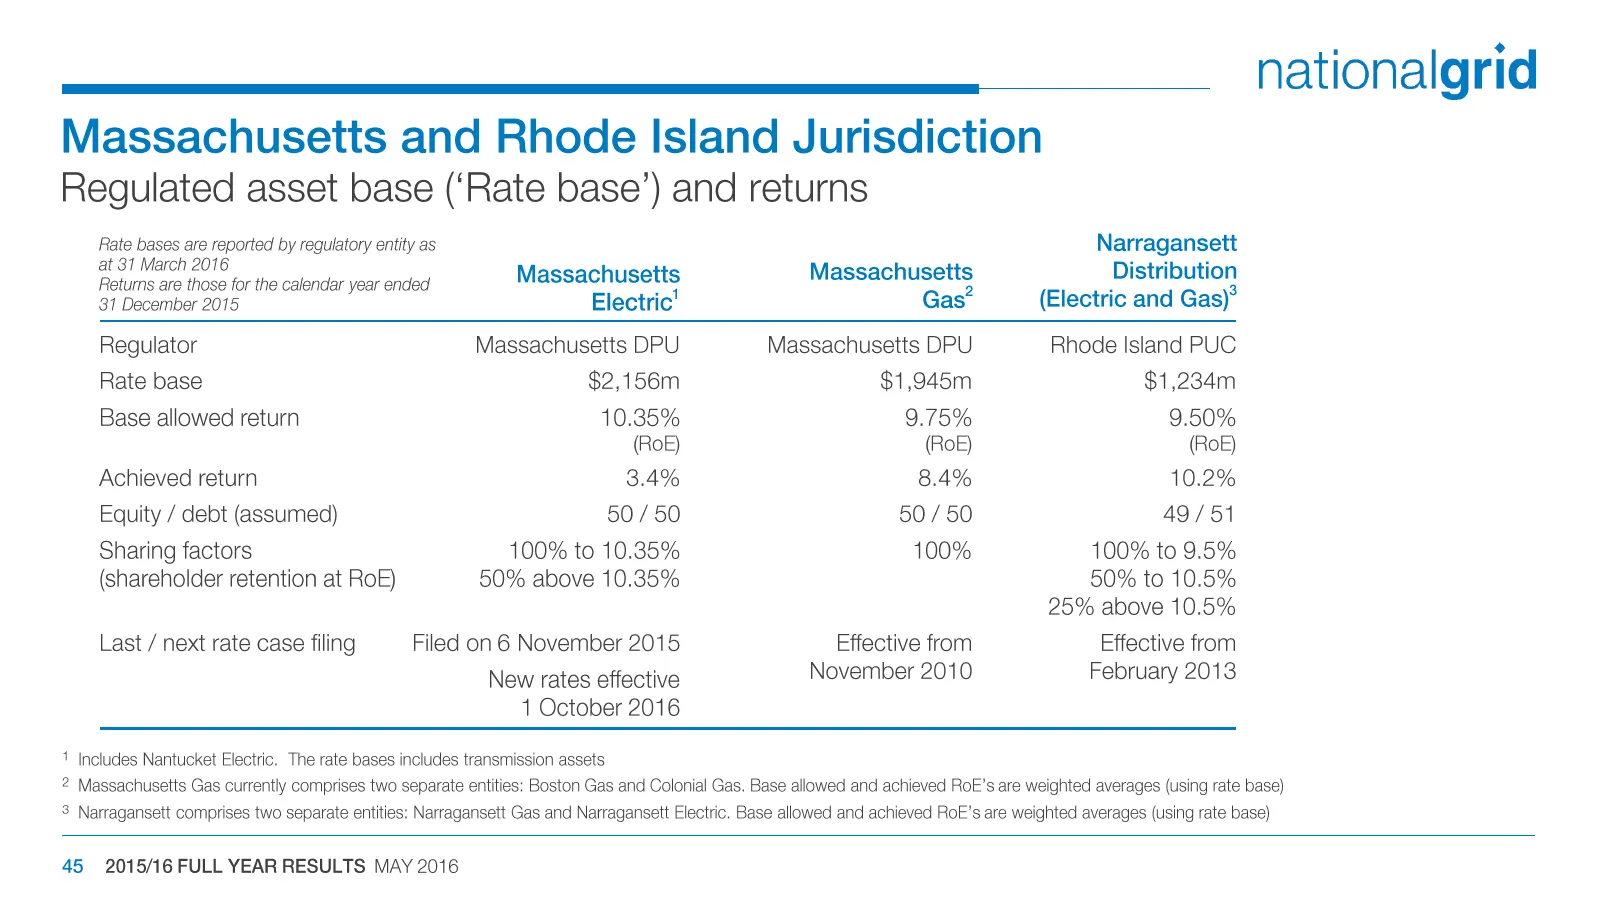
Slide 45: Massachusetts and Rhode Island Jurisdiction
Massachusetts and Rhode Island Jurisdiction Regulated asset base (‘Rate base’) and returns Rate bases are reported by regulatory entity as at 31 March 2016 Returns are those for the calendar year ended 31 December 2015 Massachusetts Electric’ Narragansett Massachusetts Distribution Gas? (Electric an
Slide 46: FERC Jurisdiction
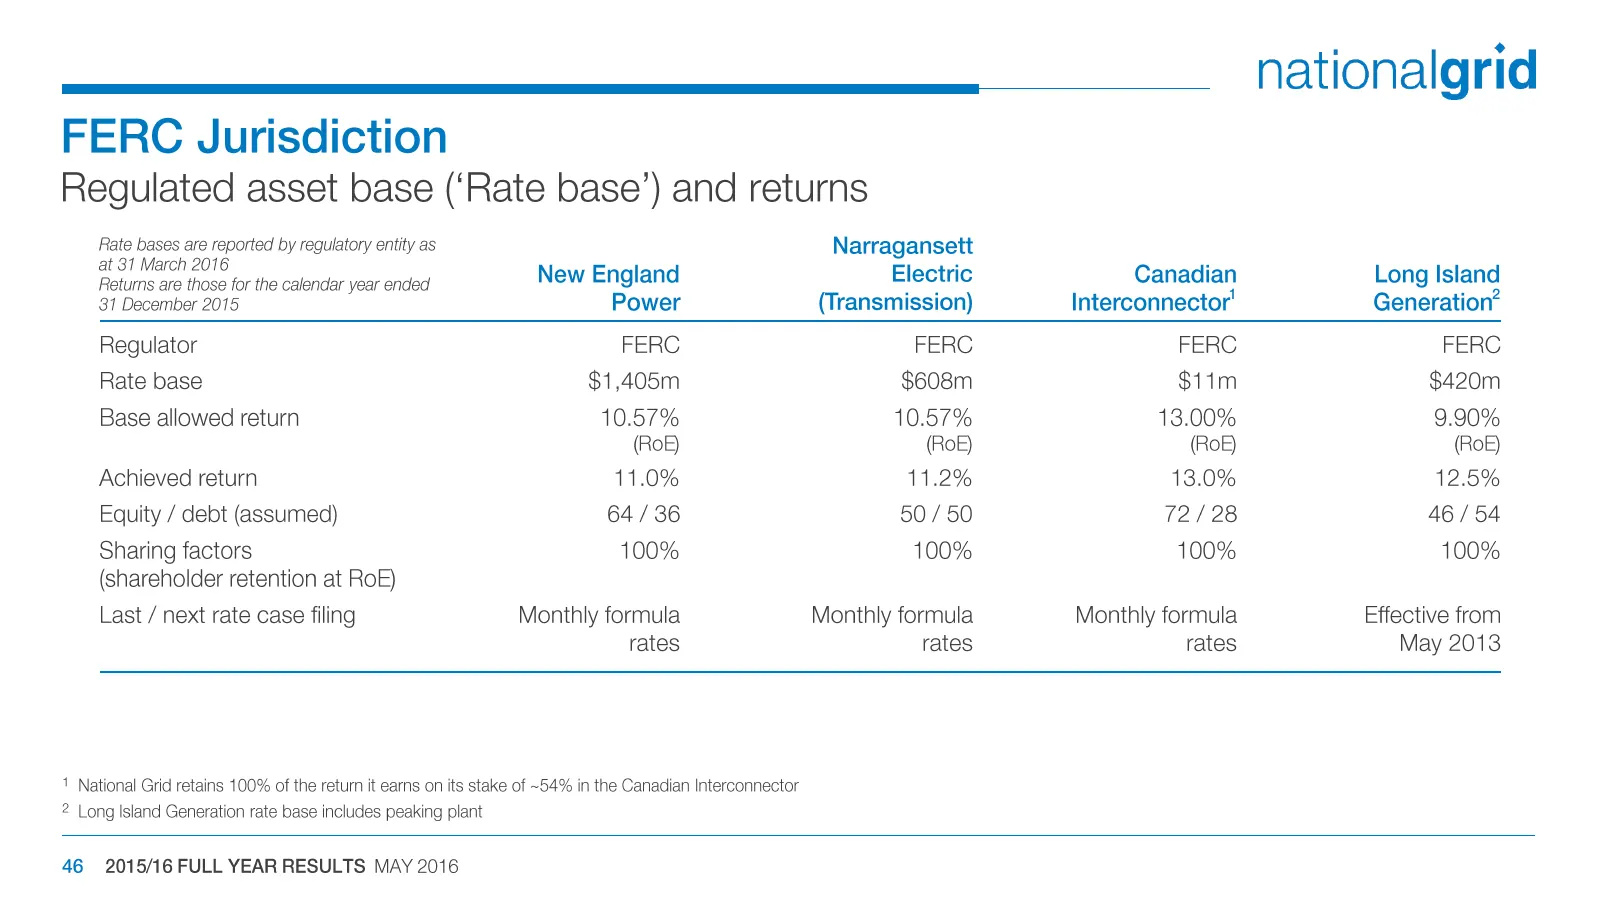
FERC Jurisdiction Regulated asset base (‘Rate base’) and returns nationalgrid Rate bases are reported by regulatory entity as Narragansett it 31 March 2016 ‘ tums are those for the calendar year ended New England Electric Canadian Long Island 31 December 2015 Power (Transmission) Interconnector Gene
Slide 47: Value Added
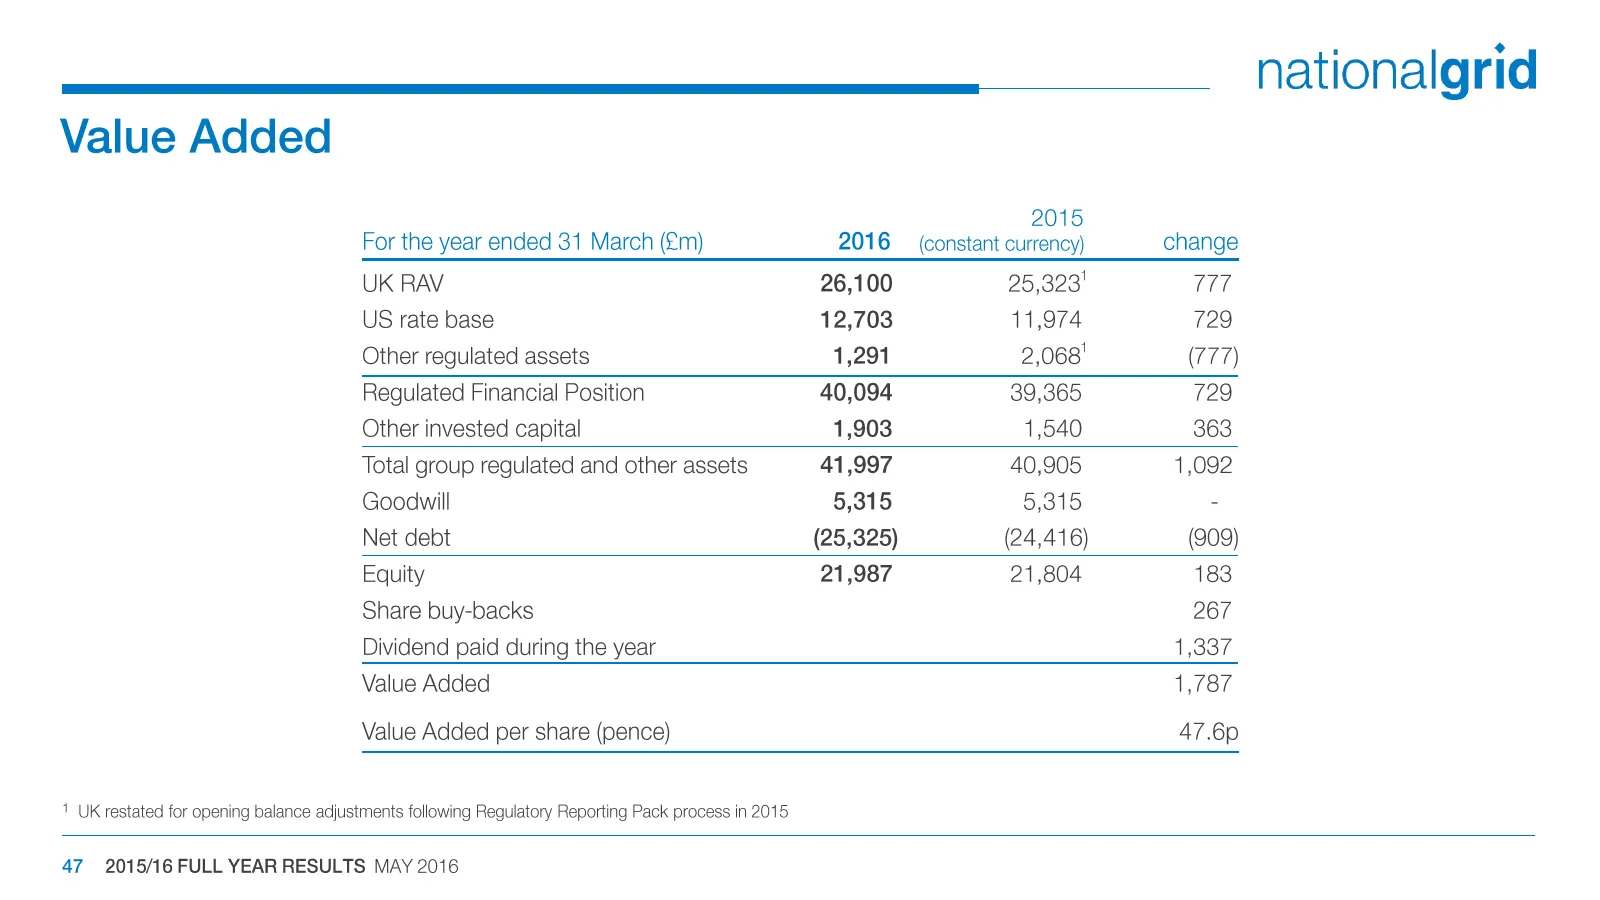
Value Added 2015 For the year ended 31 March (£m) 2016 — (constant currency) change UK RAV 26,100 25,323! 777 US rate base 12,703 11,974 729 Other regulated assets 1,291 2,068' (777) Regulated Financial Position 40,094 39,365 729 Other invested capital 1,903 1,540 363 Total group regulated and other
Slide 48: Group RoE – nominal
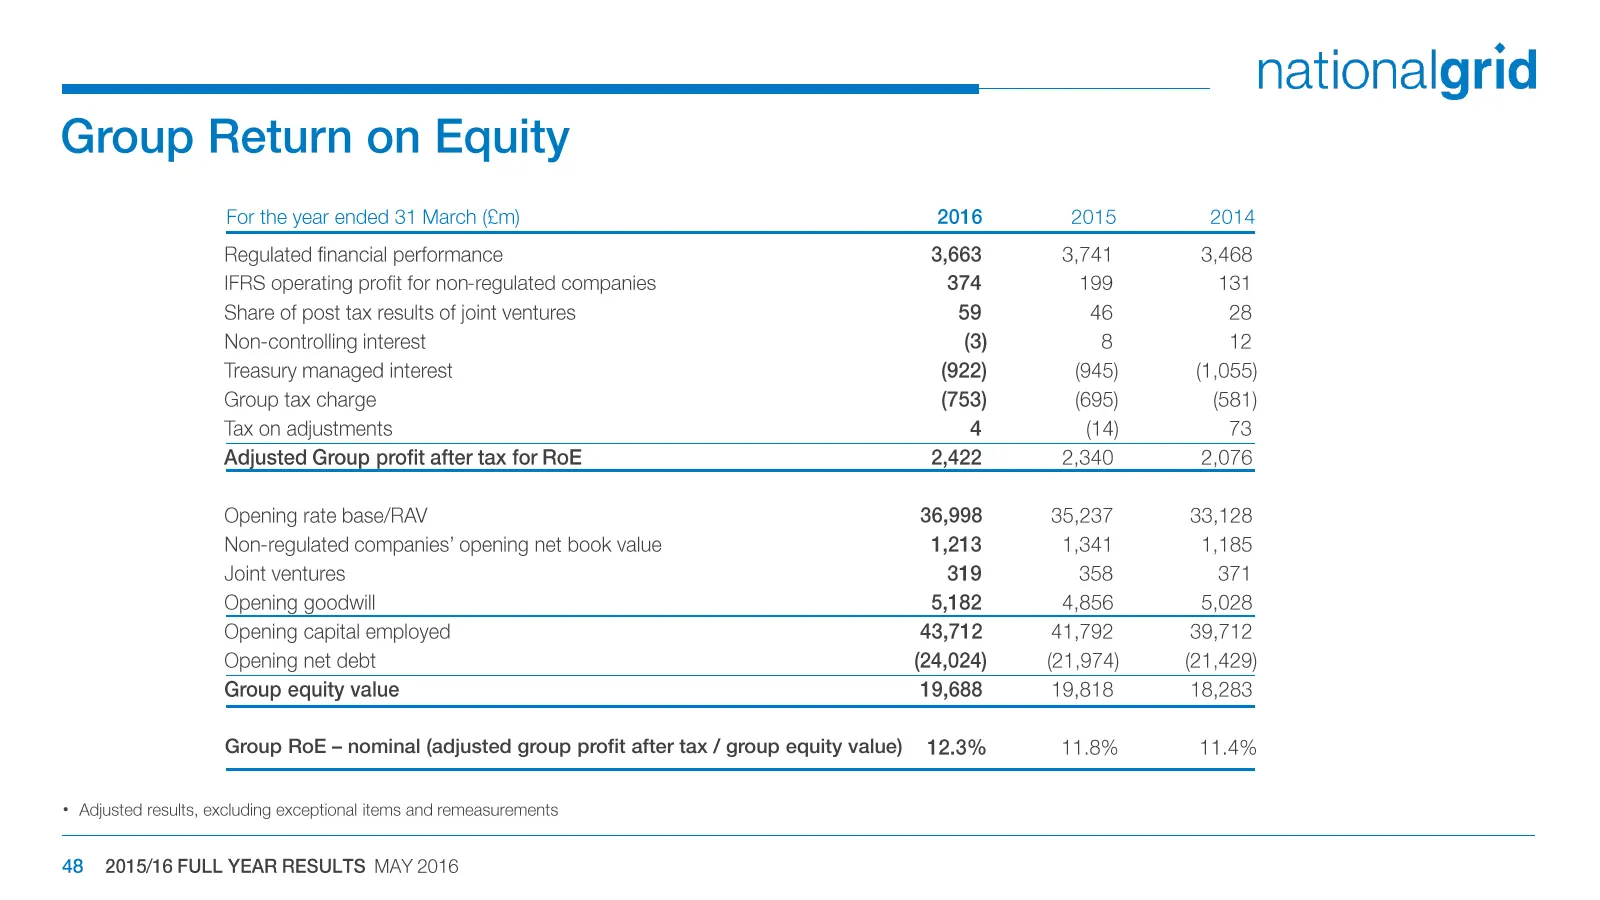
Group RoE – nominal (adjusted group profit after tax / group equity value) •
Slide 49: Weighted average number of shares
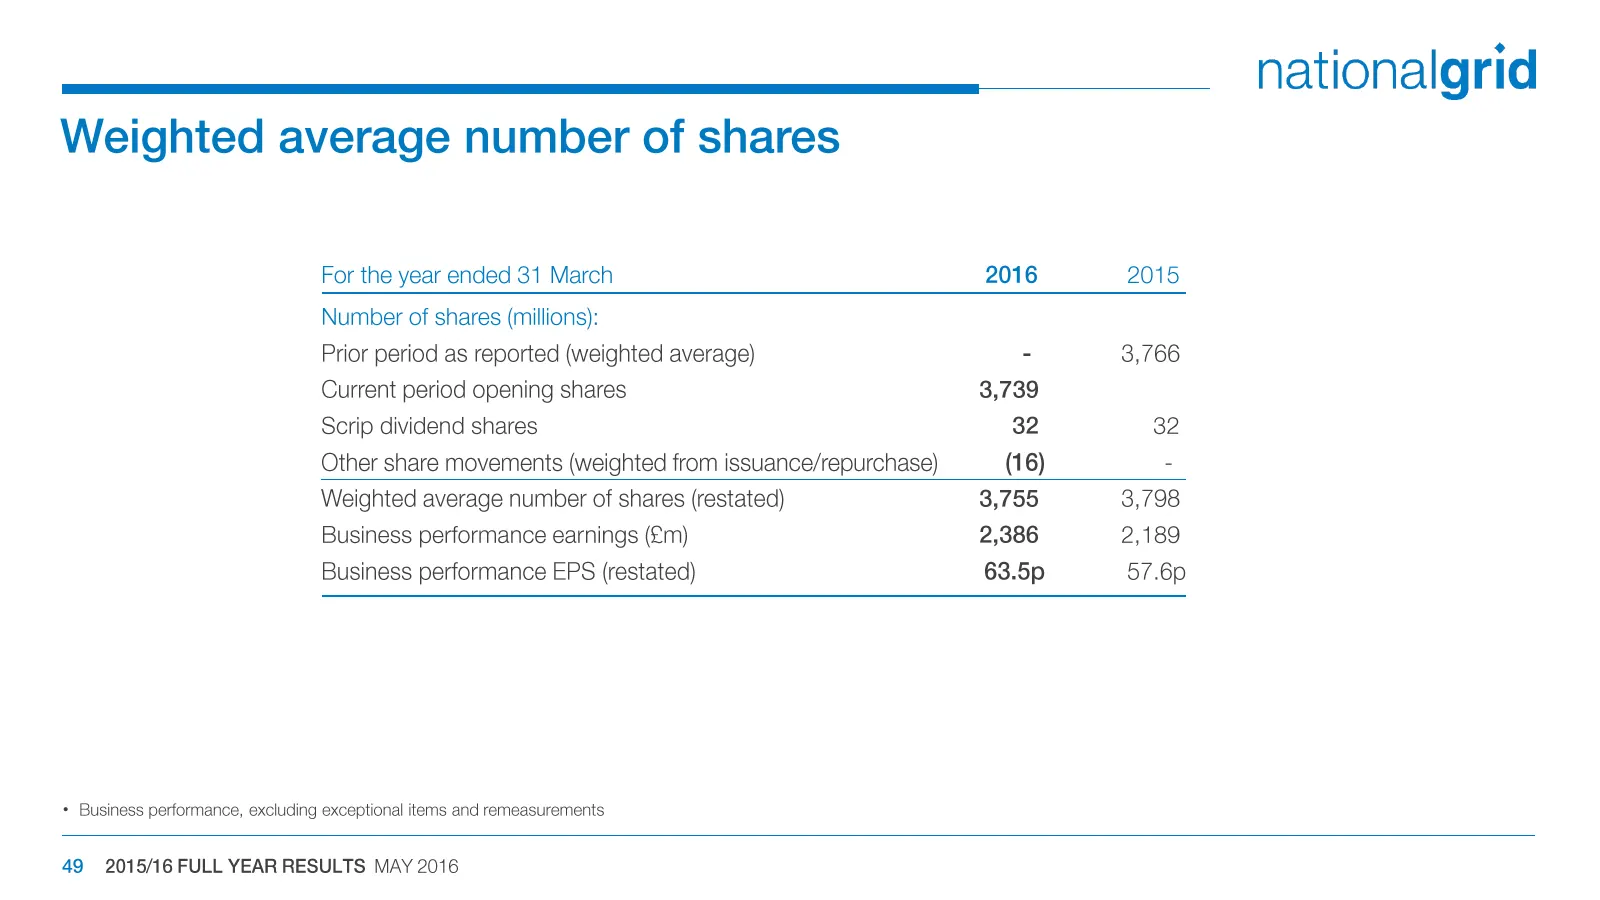
Weighted average number of shares For the year ended 31 March 2016 2015 Number of shares (millions): Prior period as reported (weighted average) - 3,766 Current period opening shares 3,739 Scrip dividend shares 32 32 Other share movements (weighted from issuance/repurchase) (16) - Weighted average n
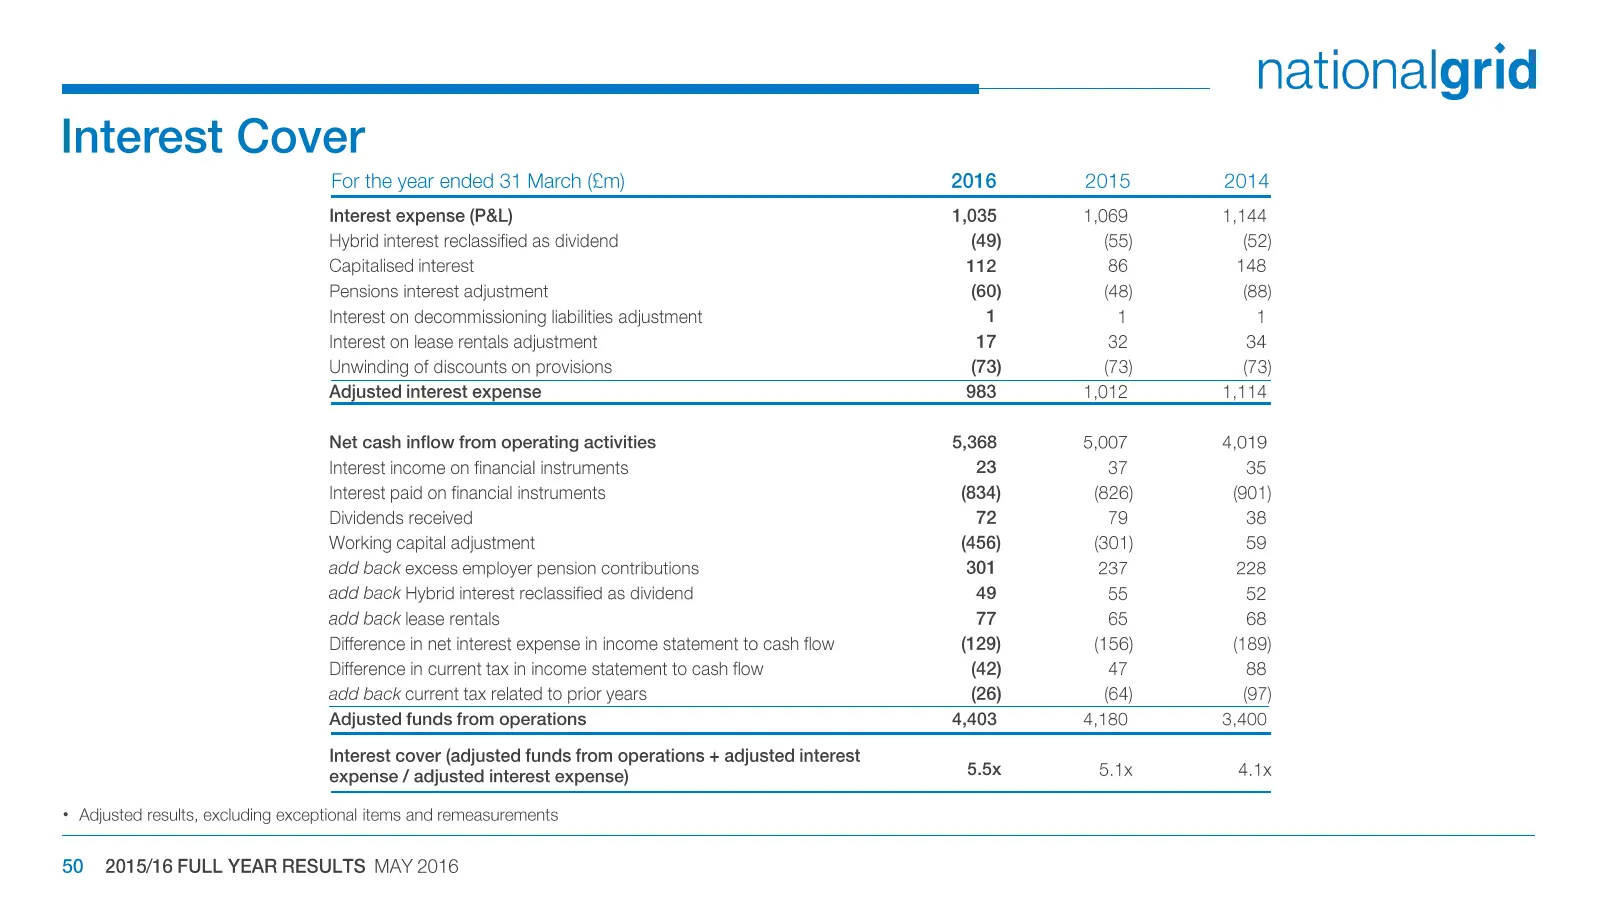
Slide 50: Interest Cover
Interest Cover nationalgrid For the year ended 31 March (£m) 2016 2015 2014 Interest expense (P&L) 1,035 1,069 1,144 Hybrid interest reclassified as dividend (49) (65) (62) Capitalised interest 112 86 148 Pensions interest adjustment (60) (48) (88) Interest on decommissioning liabilities adjustment
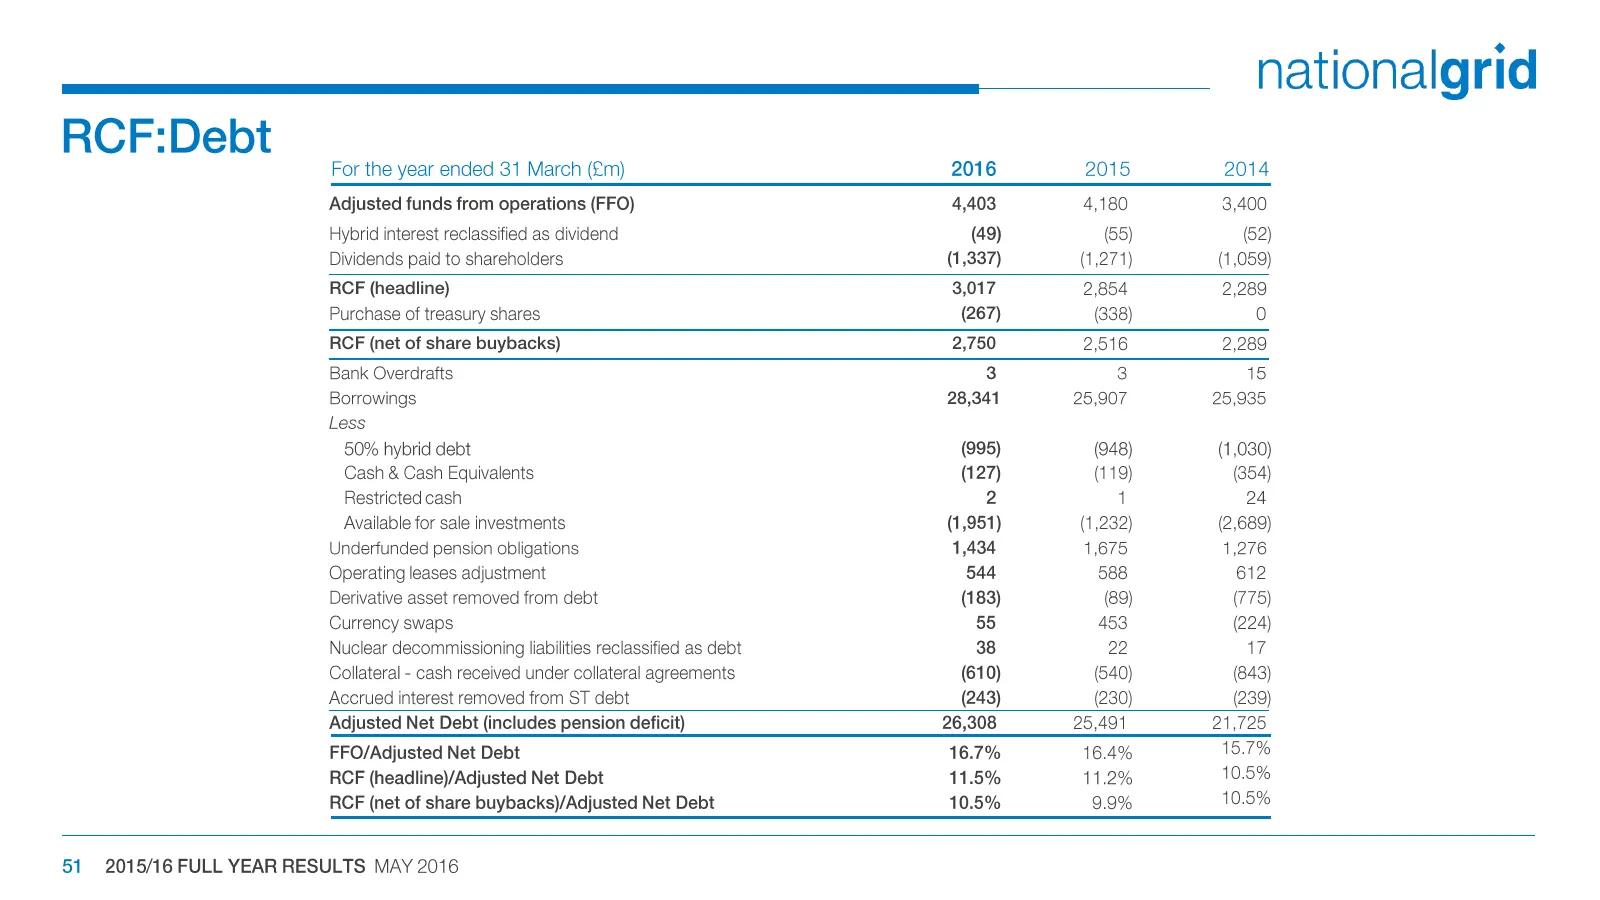
Slide 51: RCF:Debt
RCF:Debt nationalgrid For the year ended 31 March (£m) 2016 2015 2014 Adjusted funds from operations (FFO) 4,403 4,180 3,400 Hybrid interest reclassified as dividend (49) (65) (62) Dividends paid to shareholders (1,337) (1,271) (1,059) RCF (headline) 3,017 2,854 2,289 Purchase of treasury shares (26
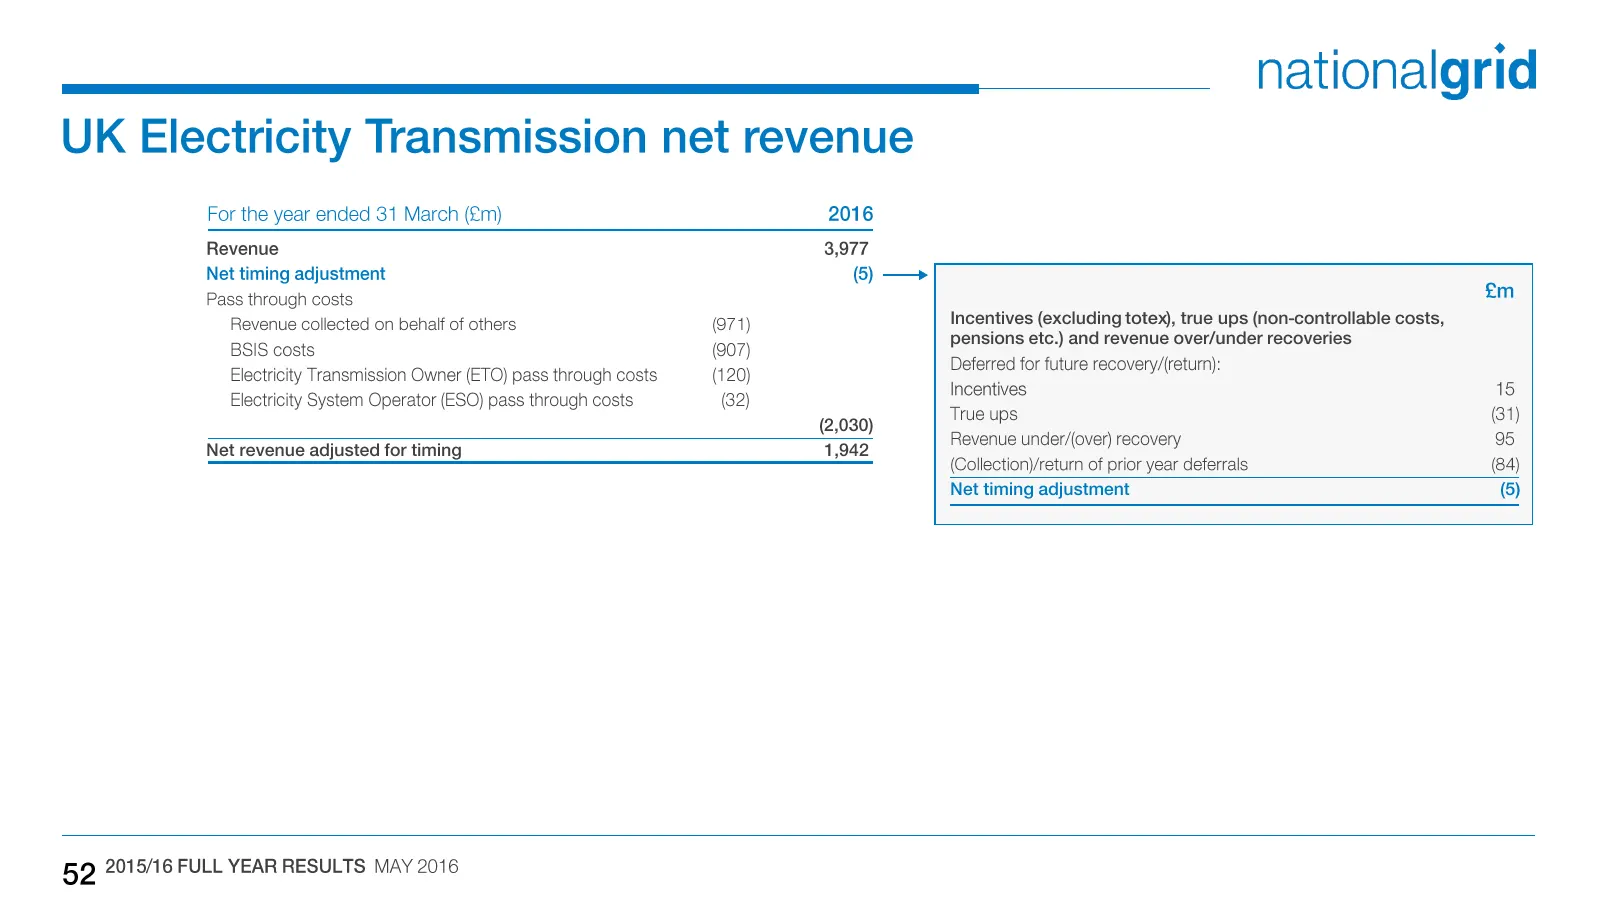
Slide 52: UK Electricity Transmission net revenue
nationalgrid UK Electricity Transmission net revenue For the year ended 31 March (£m) 2016 Revenue 3,977 Net timing adjustment (5) ——> Pass through costs ain Revenue collected on behalf of others (971) Incentives (excluding totex), true ups (non-controllable costs, BSIS costs (07) pensions etc.) and
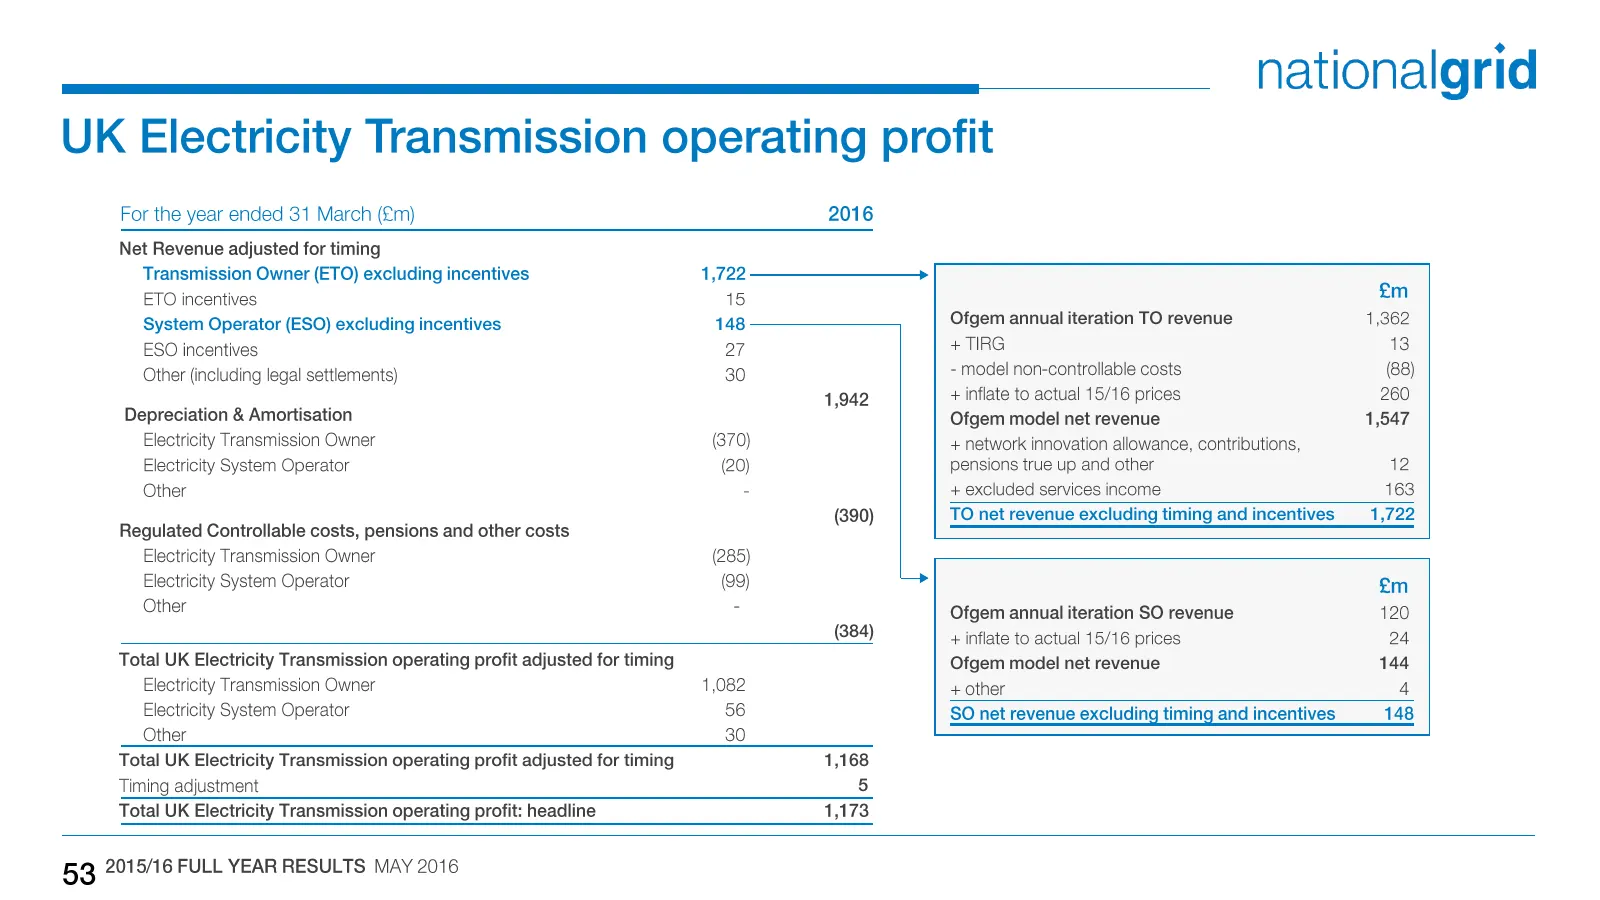
Slide 53: UK Electricity Transmission operating profit
UK Electricity Transmission operating profit For the year ended 31 March (£m) 2016 Net Revenue adjusted for timing Transmission Owner (ETO) excluding incentives 1,722 ———_______» ETO incentives 15 System Operator (ESO) excluding incentives 148 ESO incentives 27 Other (including legal settlements) 30
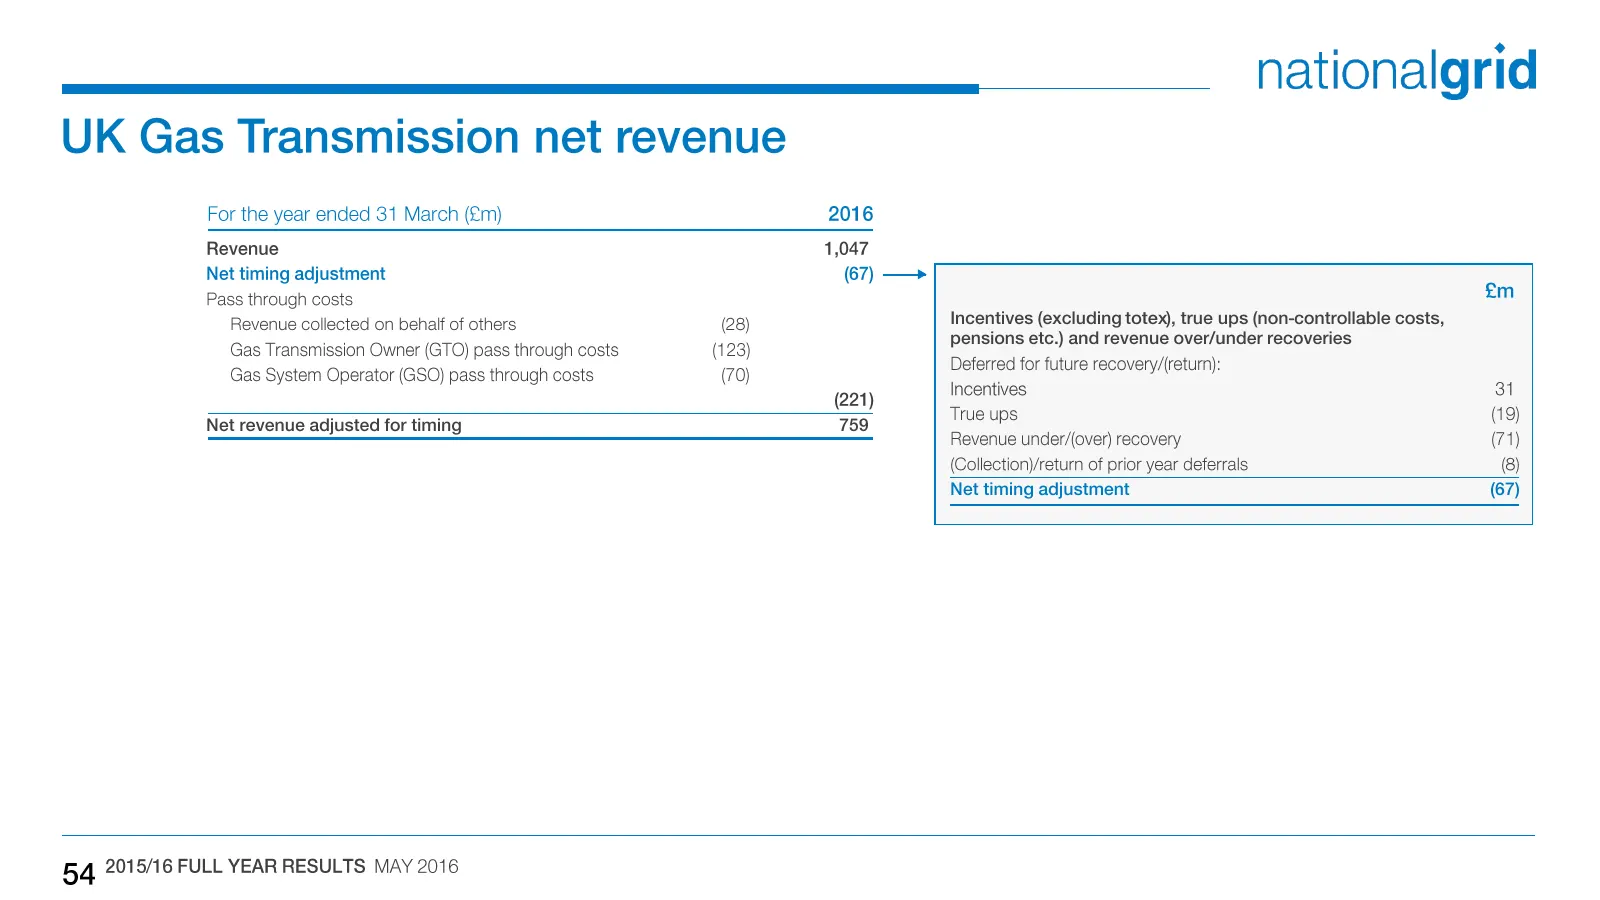
Slide 54: UK Gas Transmission net revenue
nationalgrid UK Gas Transmission net revenue For the year ended 31 March (£m) 2016 Revenue 1,047 Net timing adjustment (67) —> Pass through costs ain Revenue collected on behalf of others (28) Incentives (excluding totex), true ups (non-controllable costs, Gas Transmission Owner (GTO) pass through c
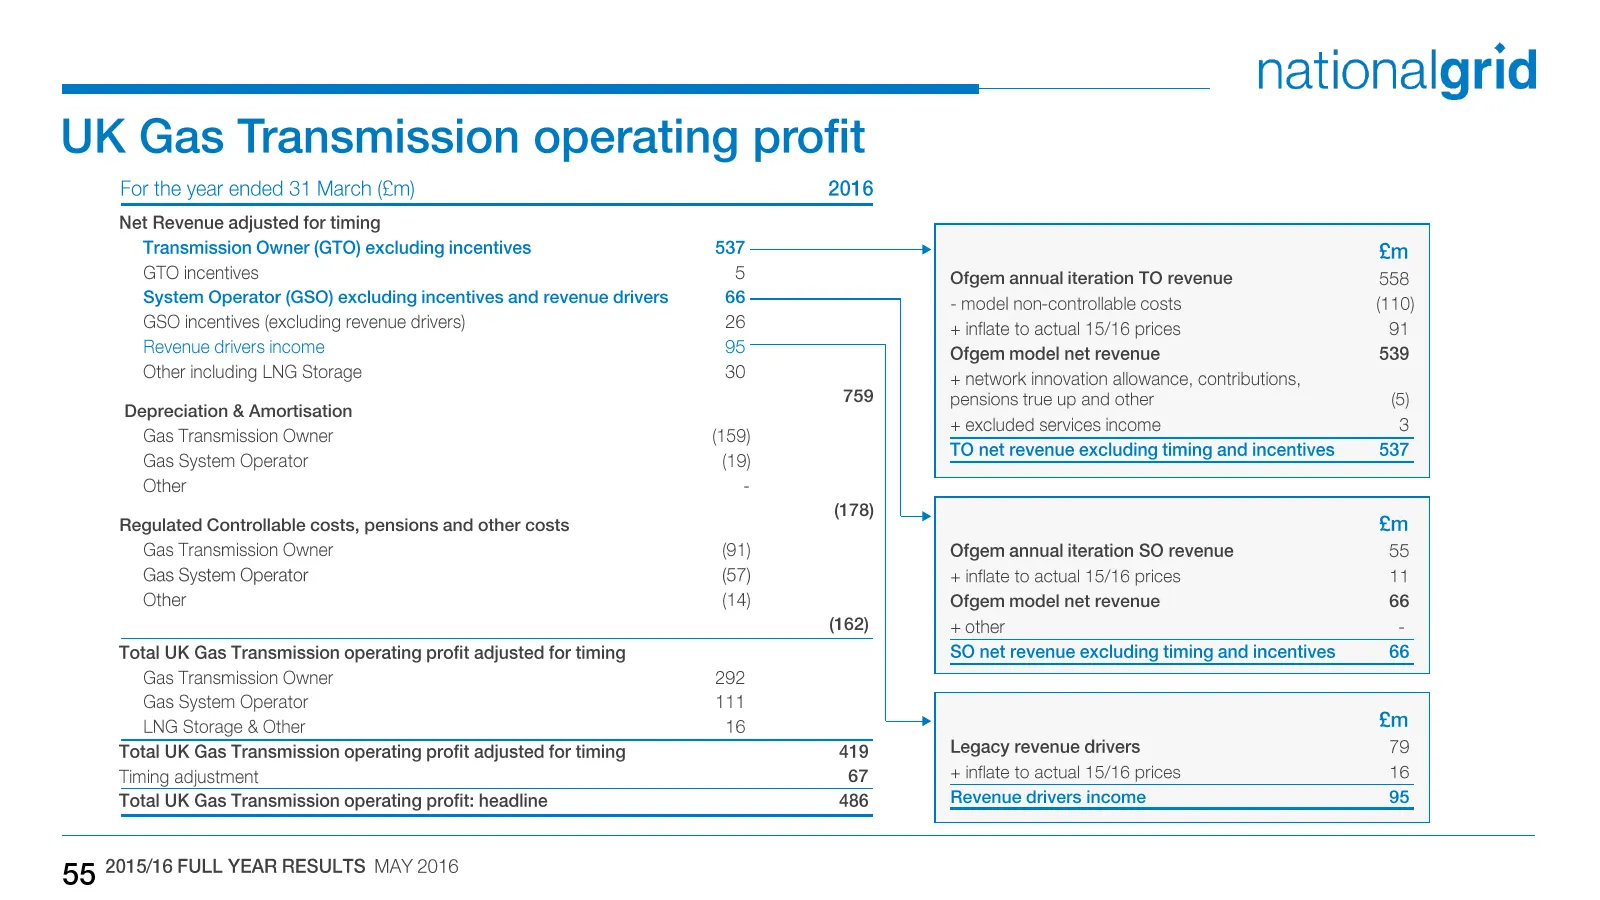
Slide 55: UK Gas Transmission operating profit
UK Gas Transmission operating profit nationalgrid For the year ended 31 March (£m) 2016 Net Revenue adjusted for timing Transmission Owner (GTO) excluding incentives 537 £m GTO incentives 5 Ofgem annual iteration TO revenue 558 System Operator (GSO) excluding incentives and revenue drivers 66 ~ mode
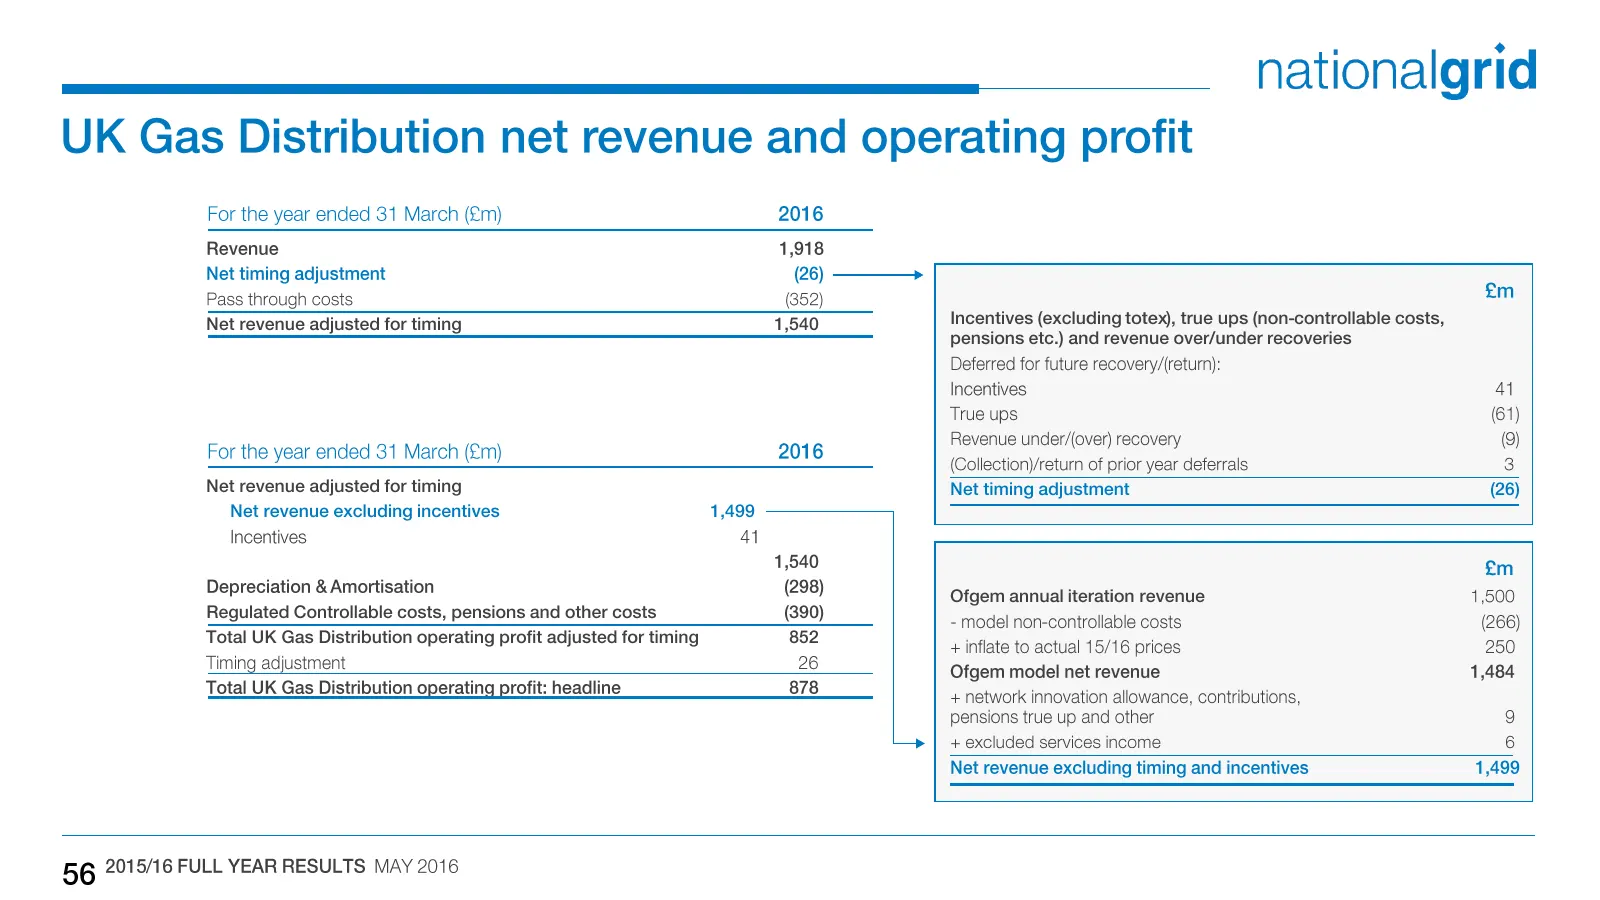
Slide 56: UK Gas Distribution net revenue and operating profit
nationalgrid UK Gas Distribution net revenue and operating profit For the year ended 31 March (£m) 2016 Revenue 1,918 Net timing adjustment (26) ————> Pass through costs (862) ain Net revenue adjusted for timing 1,540 Incentives (excluding totex), true ups (non-controllable costs, pensions etc.) and
Source: Internet Archive copy of investors.nationalgrid.com
More decks from National Grid plc
 H1 2026/27 Earnings Presentation35 slides · Nov 5, 2026
 FY2026 Earnings Presentation52 slides · May 14, 2026
 Debt Investor Presentation (November 2025)21 slides · Nov 6, 2025
 Q2 2026 Earnings Presentation34 slides · Nov 6, 2025
 Technical Presentation (August 2025)20 slides · Aug 8, 2025
 Debt Investor Presentation (May 2025)22 slides · May 16, 2025