NAPCO Security Technologies, Inc. · NASDAQ:NSSC
NAPCO Security Technologies — Investor Presentation (May 2013)
27 slides from NAPCO Security Technologies's investor presentation, May 2013
Slide 1: NAPCO Security Technologies Investor Presentation May 2013
NAPCO Security Technologies, Inc. NasdaqGS (Global Select): NSSC Security. Technology. Opportunity. INVESTOR PRESENTATION May 2013
Slide 2: Safe Harbor Statement
Safe Harbor Statement This presentation may contain forward-looking statements that involve numerous risks and uncertainties. Actual results, performance or achievements could differ materially from those anticipated in such forward-looking statements as a result of certain factors, including those
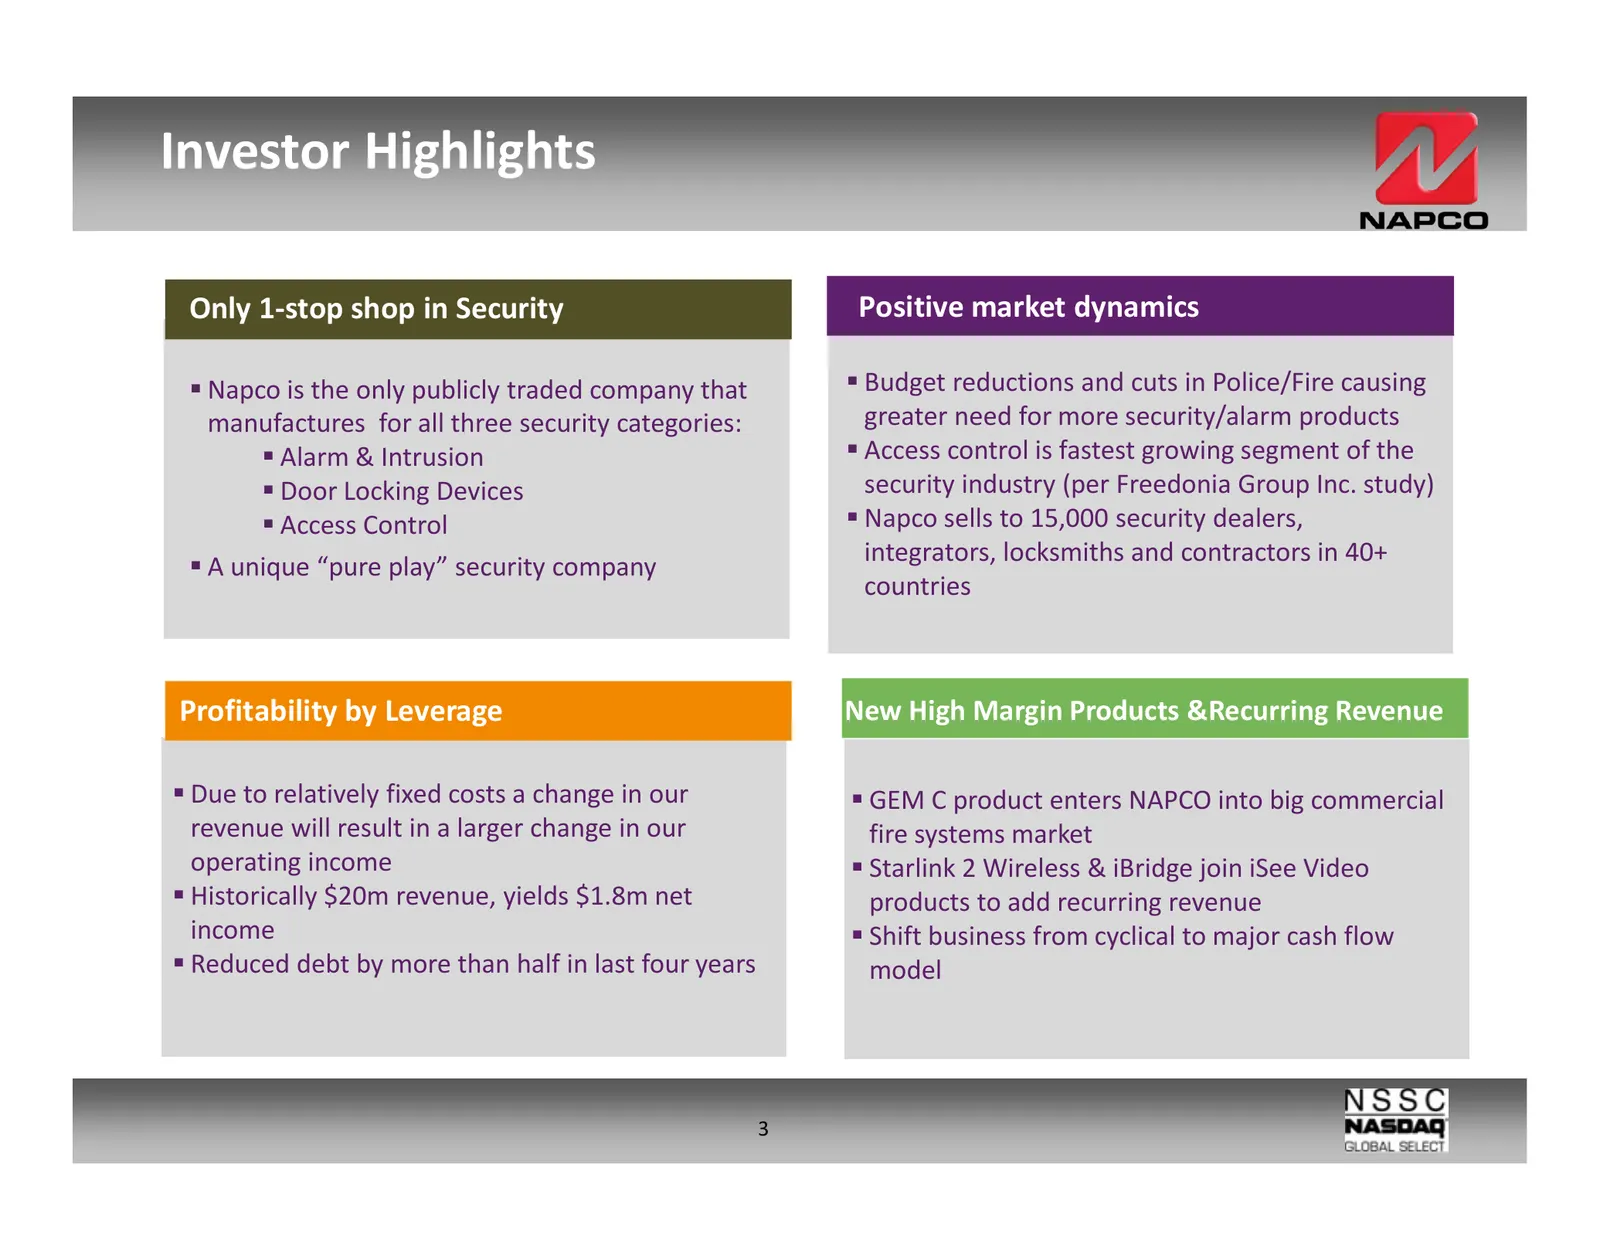
Slide 3: Investor Highlights
Investor Highlights Only 1-stop shop in Security Positive market dynamics Napco is the only publicly traded company that Budget reductions and cuts in Police/Fire causing manufactures for all three security categories: greater need for more security/alarm products Alarm & Intrusion Access control is
Slide 4: Intrusion and Fire are Big Businesses
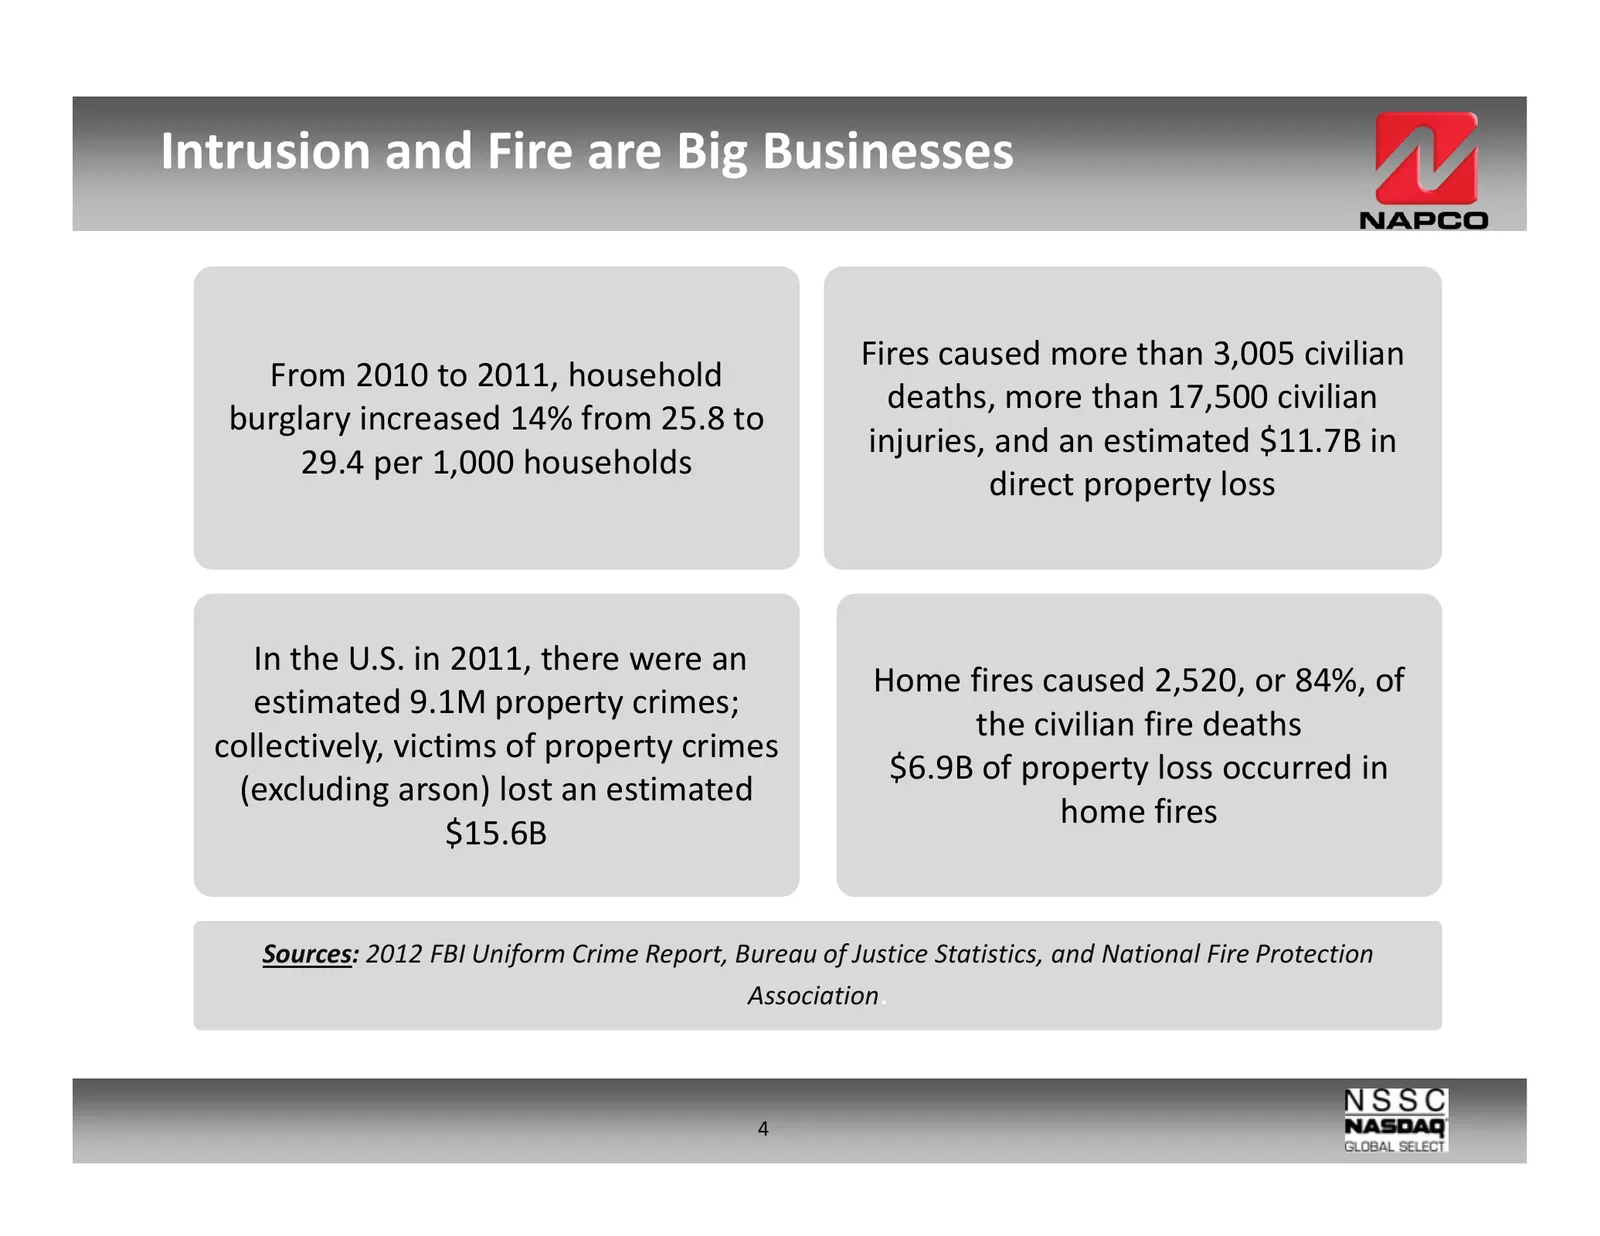
Intrusion and Fire are Big Businesses Fires caused more than 3,005 civilian From 2010 to 2011, household deaths, more than 17,500 civilian burglary increased 14% from 25.8 to injuries, and an estimated $11.7B in 29.4 per 1,000 households direct property loss In the U.S. in 2011, there were an Home f
Slide 5: Large & Growing Commercial Security Market
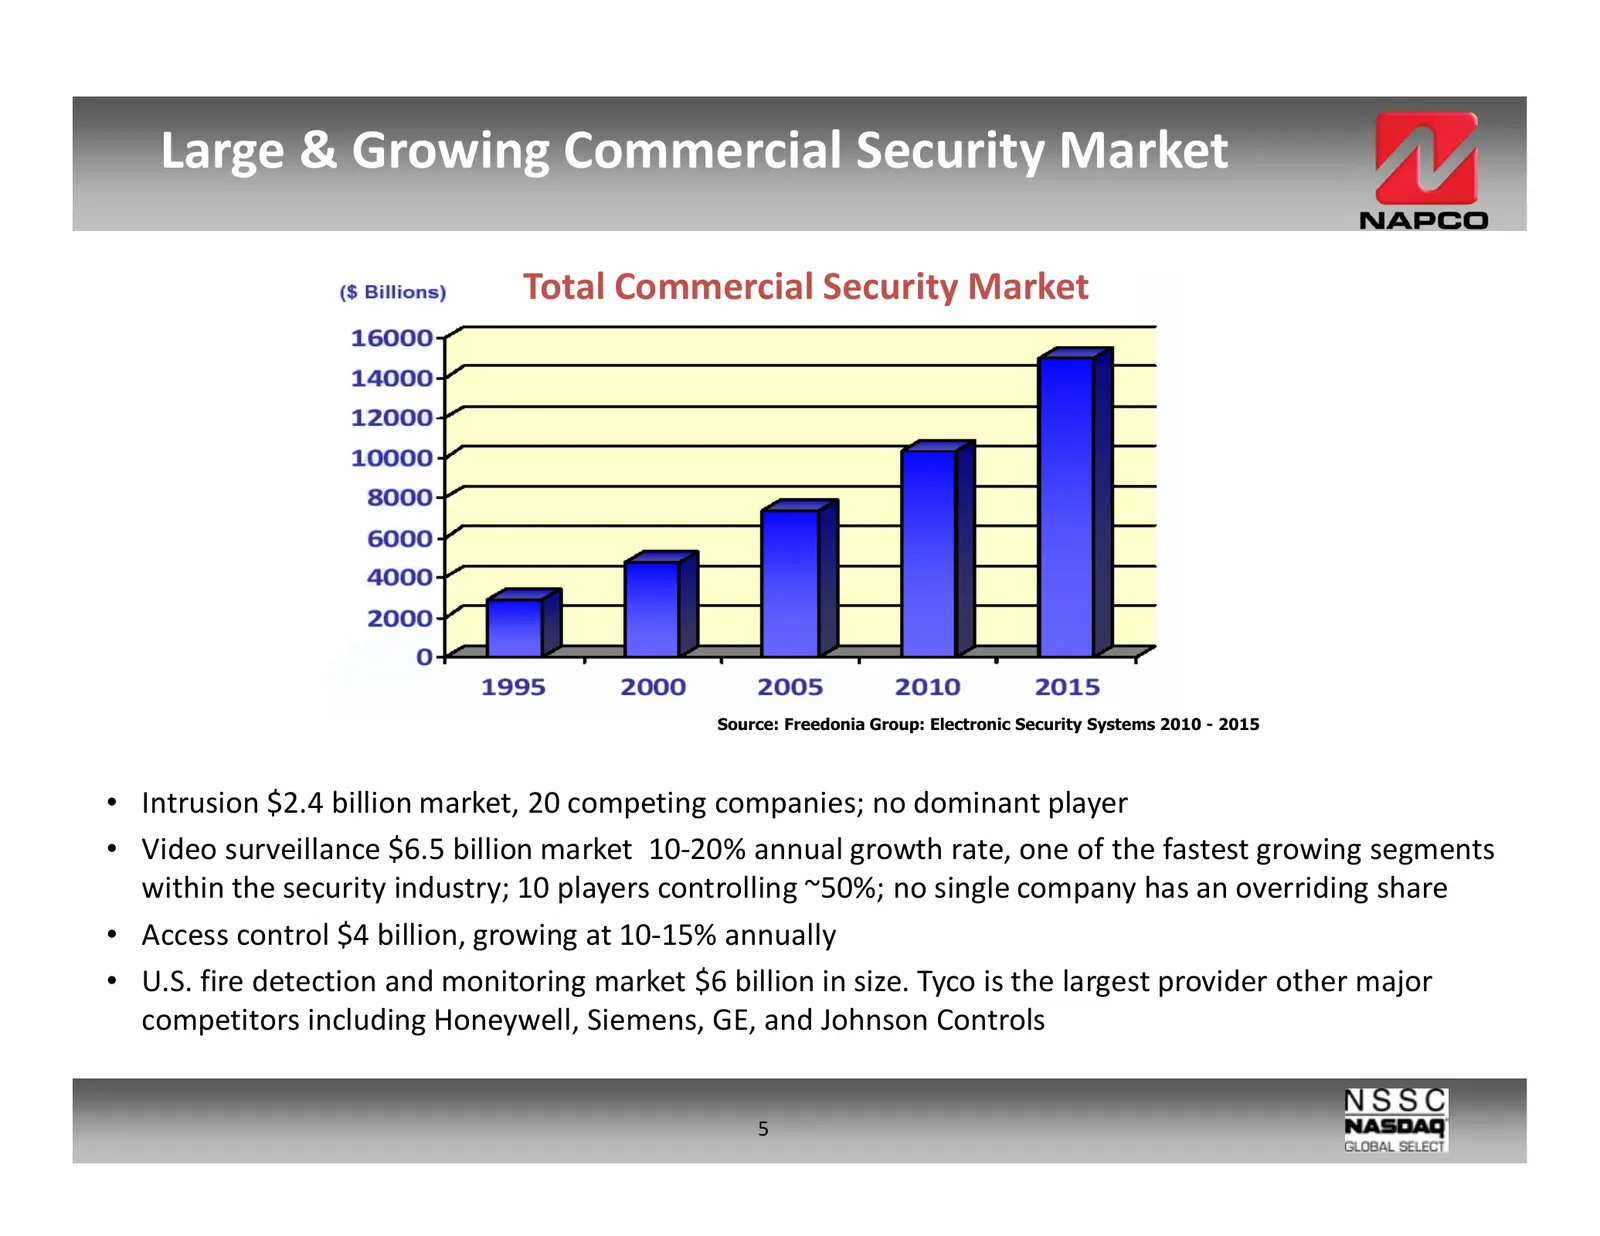
Large & Growing Commercial Security Market Total Commercial Security Market Source: Freedonia Group: Electronic Security Systems 2010 - 2015 • Intrusion $2.4 billion market, 20 competing companies; no dominant player • Video surveillance $6.5 billion market 10-20% annual growth rate, one of the fast
Slide 6: Fully Integrated Security Solutions
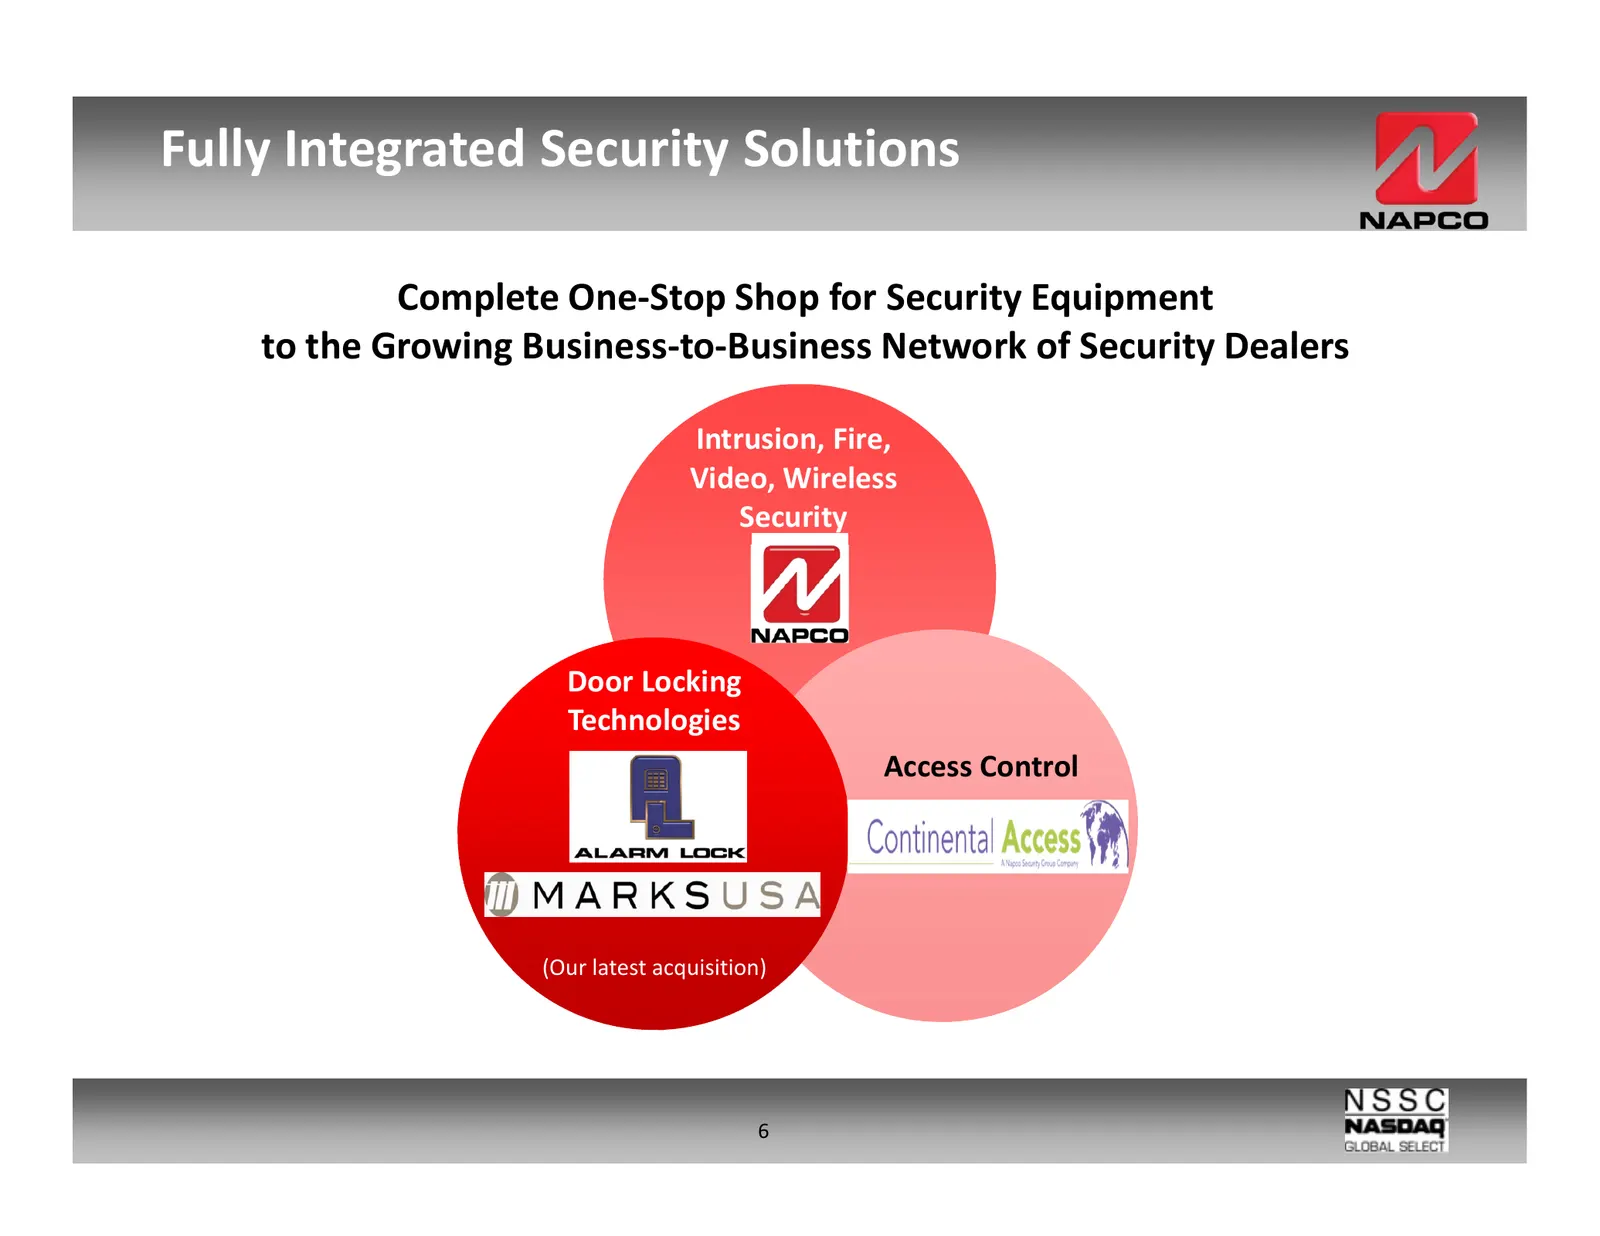
Fully Integrated Security Solutions Complete One-Stop Shop for Security Equipment to the Growing Business-to-Business Network of Security Dealers Intrusion, Fire, Video, Wireless Security Door Locking Technologies Access Control (Our latest acquisition) 6
Slide 7: Business Sales Mix
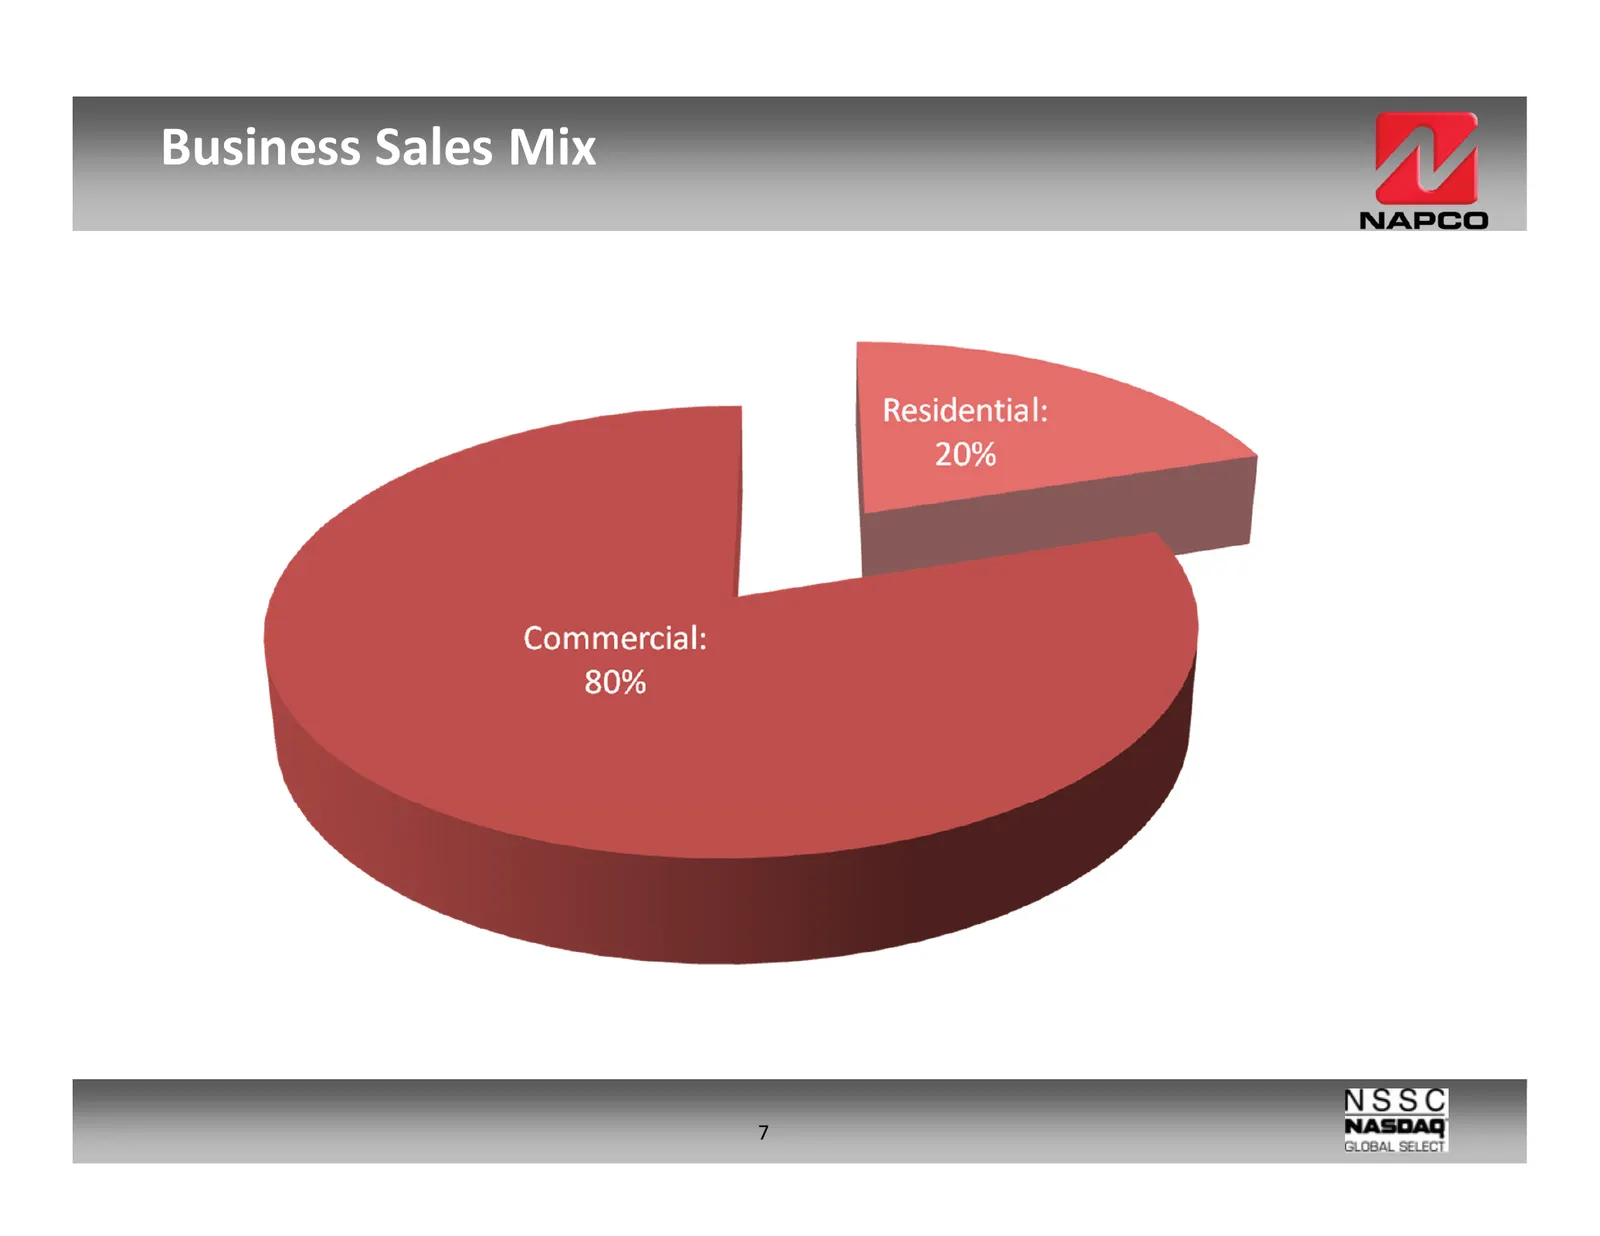
Business Sales Mix Residential: 20% Commercial: 80% GLOBAL SELECT
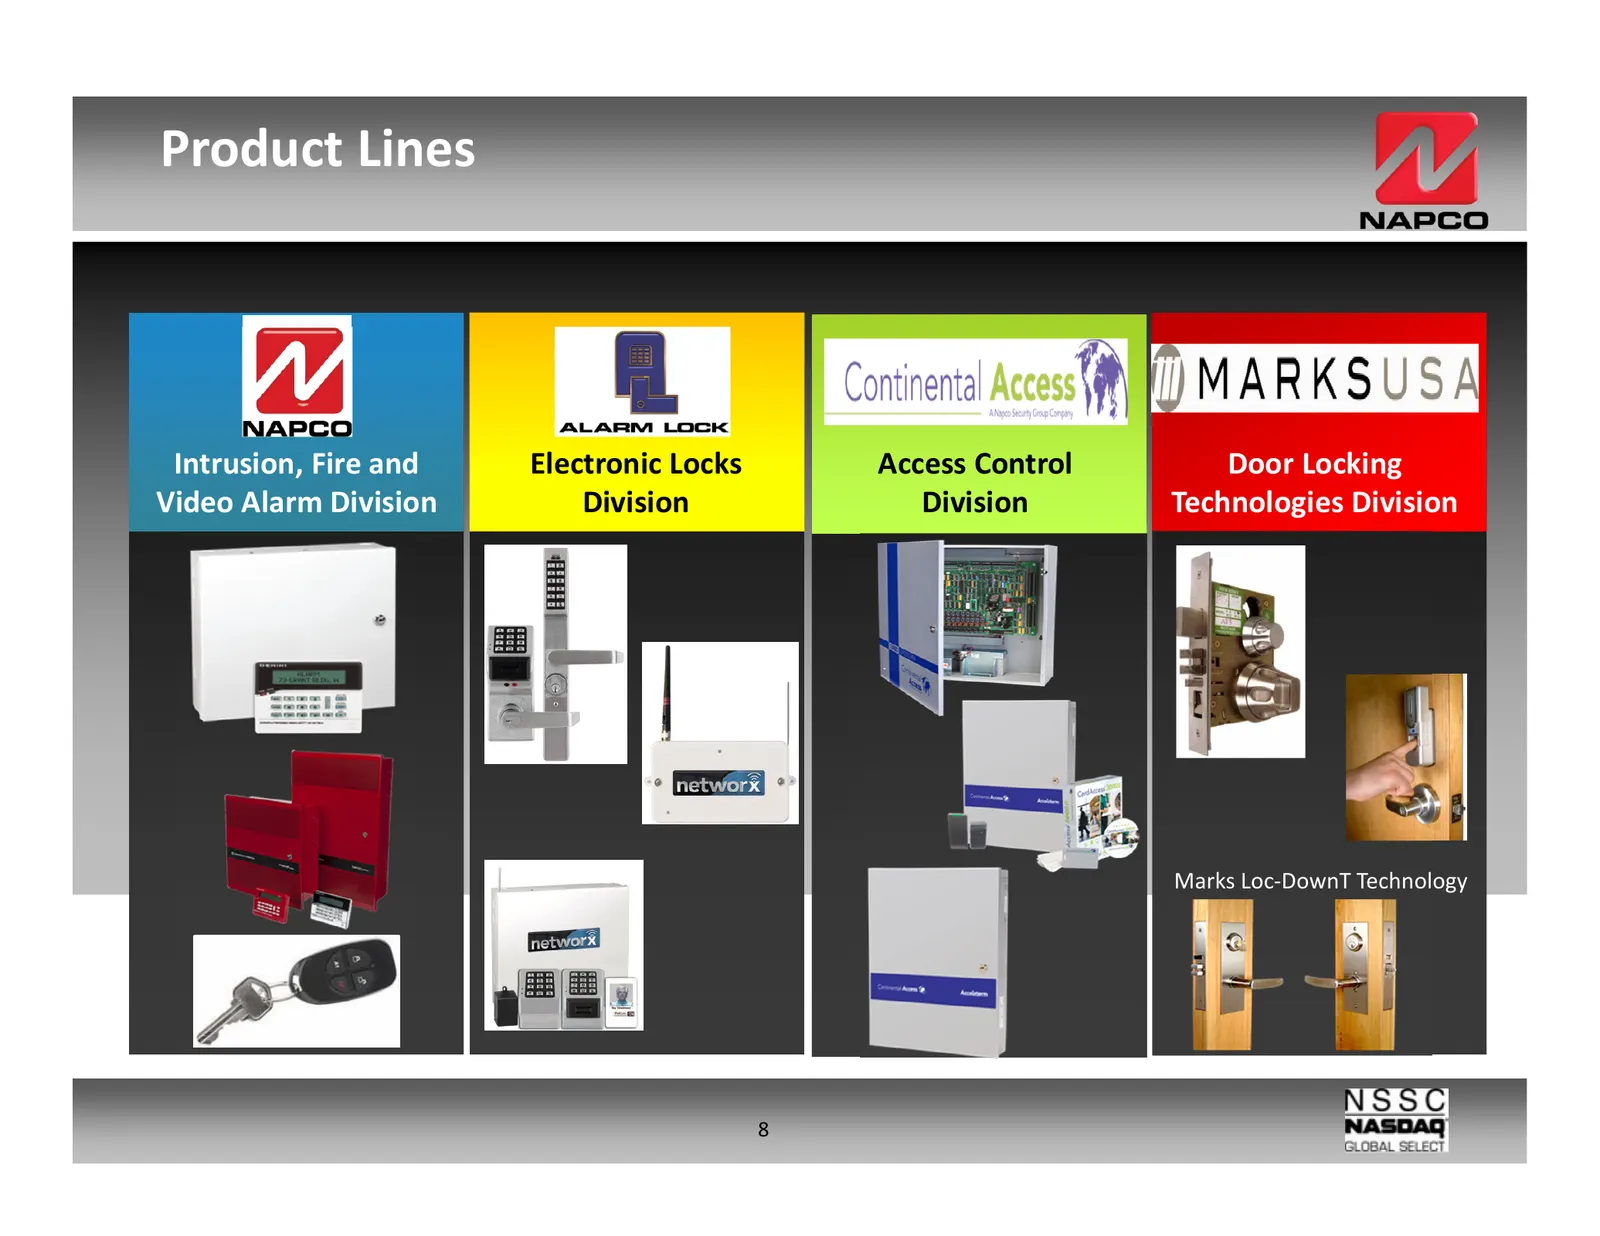
Slide 8: Product Lines
Product Lines Intrusion, Fire and Electronic Locks Access Control Door Locking Video Alarm Division Division Division Technologies Division Marks Loc-DownT Technology 8
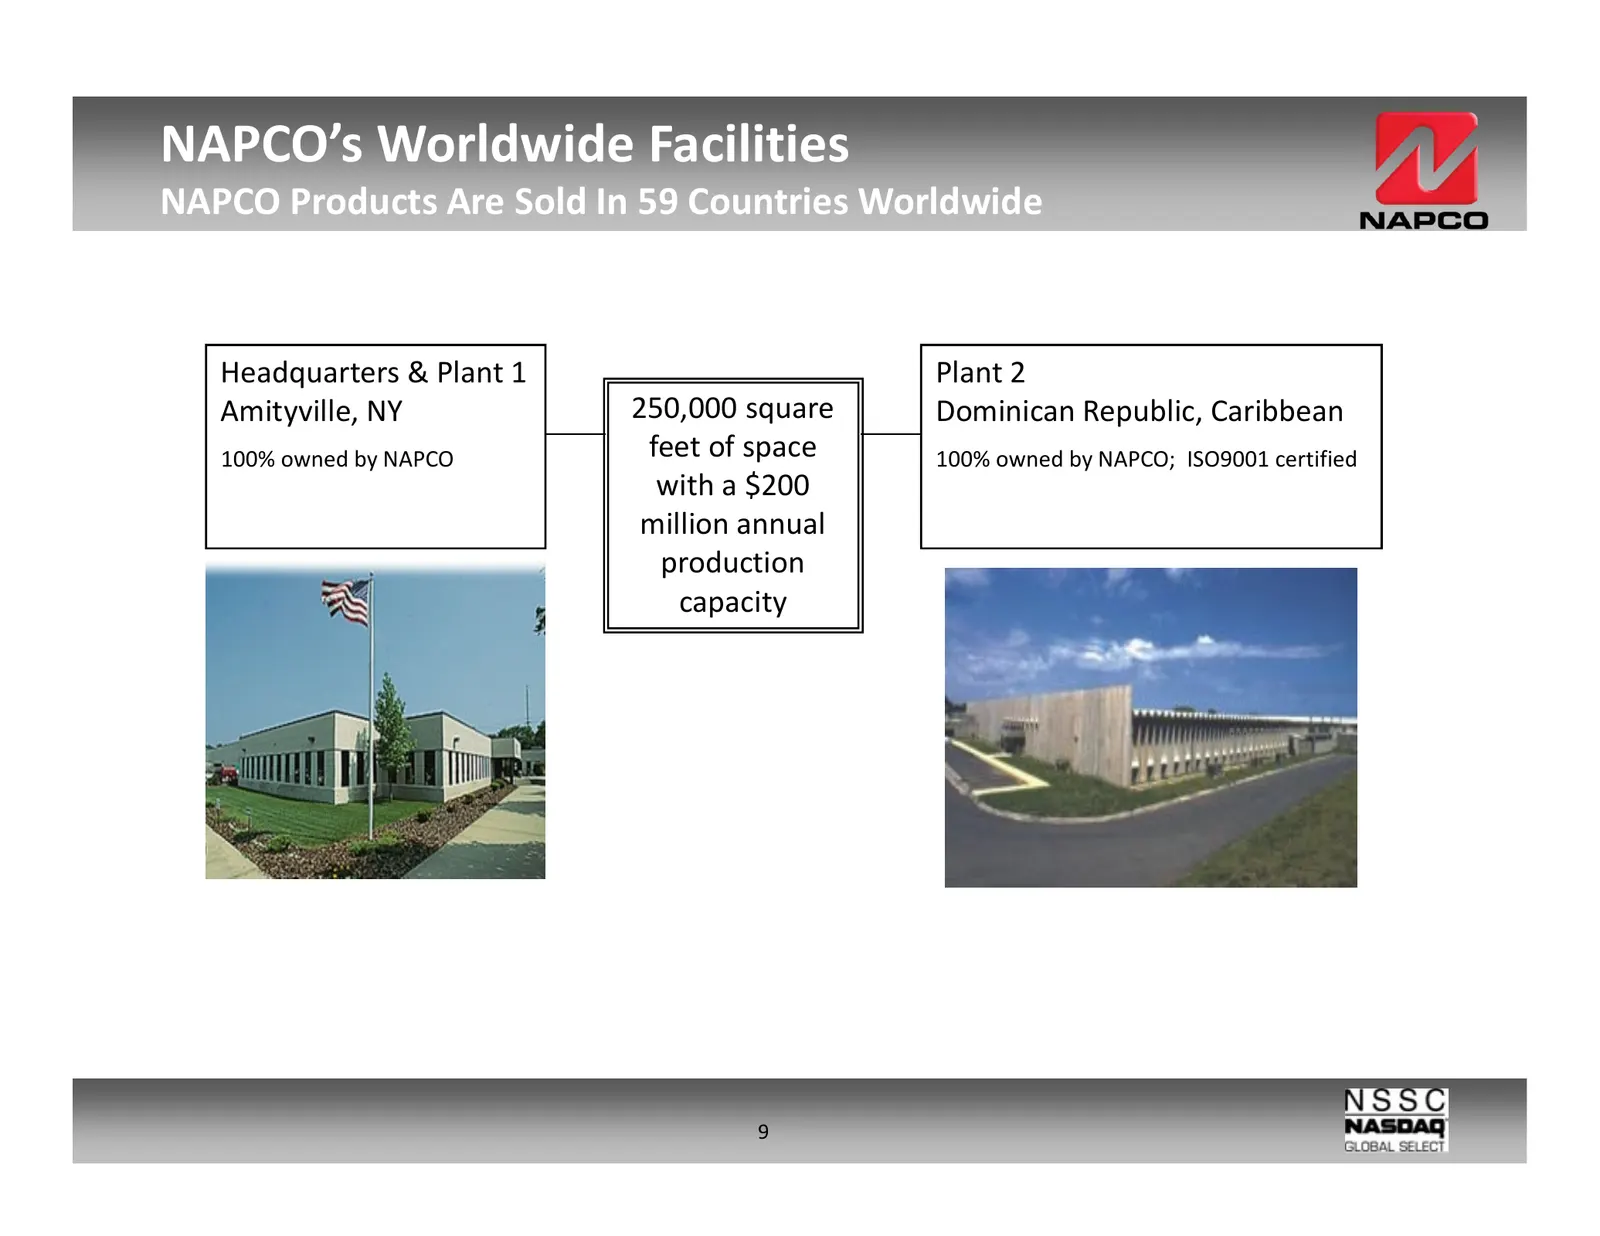
Slide 9: NAPCO's Worldwide Facilities
NAPCO’s Worldwide Facilities NAPCO Products Are Sold In 59 Countries Worldwide Headquarters & Plant 1 Plant 2 Amityville, NY 250,000 square Dominican Republic, Caribbean 100% owned by NAPCO feet of space 100% owned by NAPCO; ISO9001 certified with a $200 million annual production capacity 9
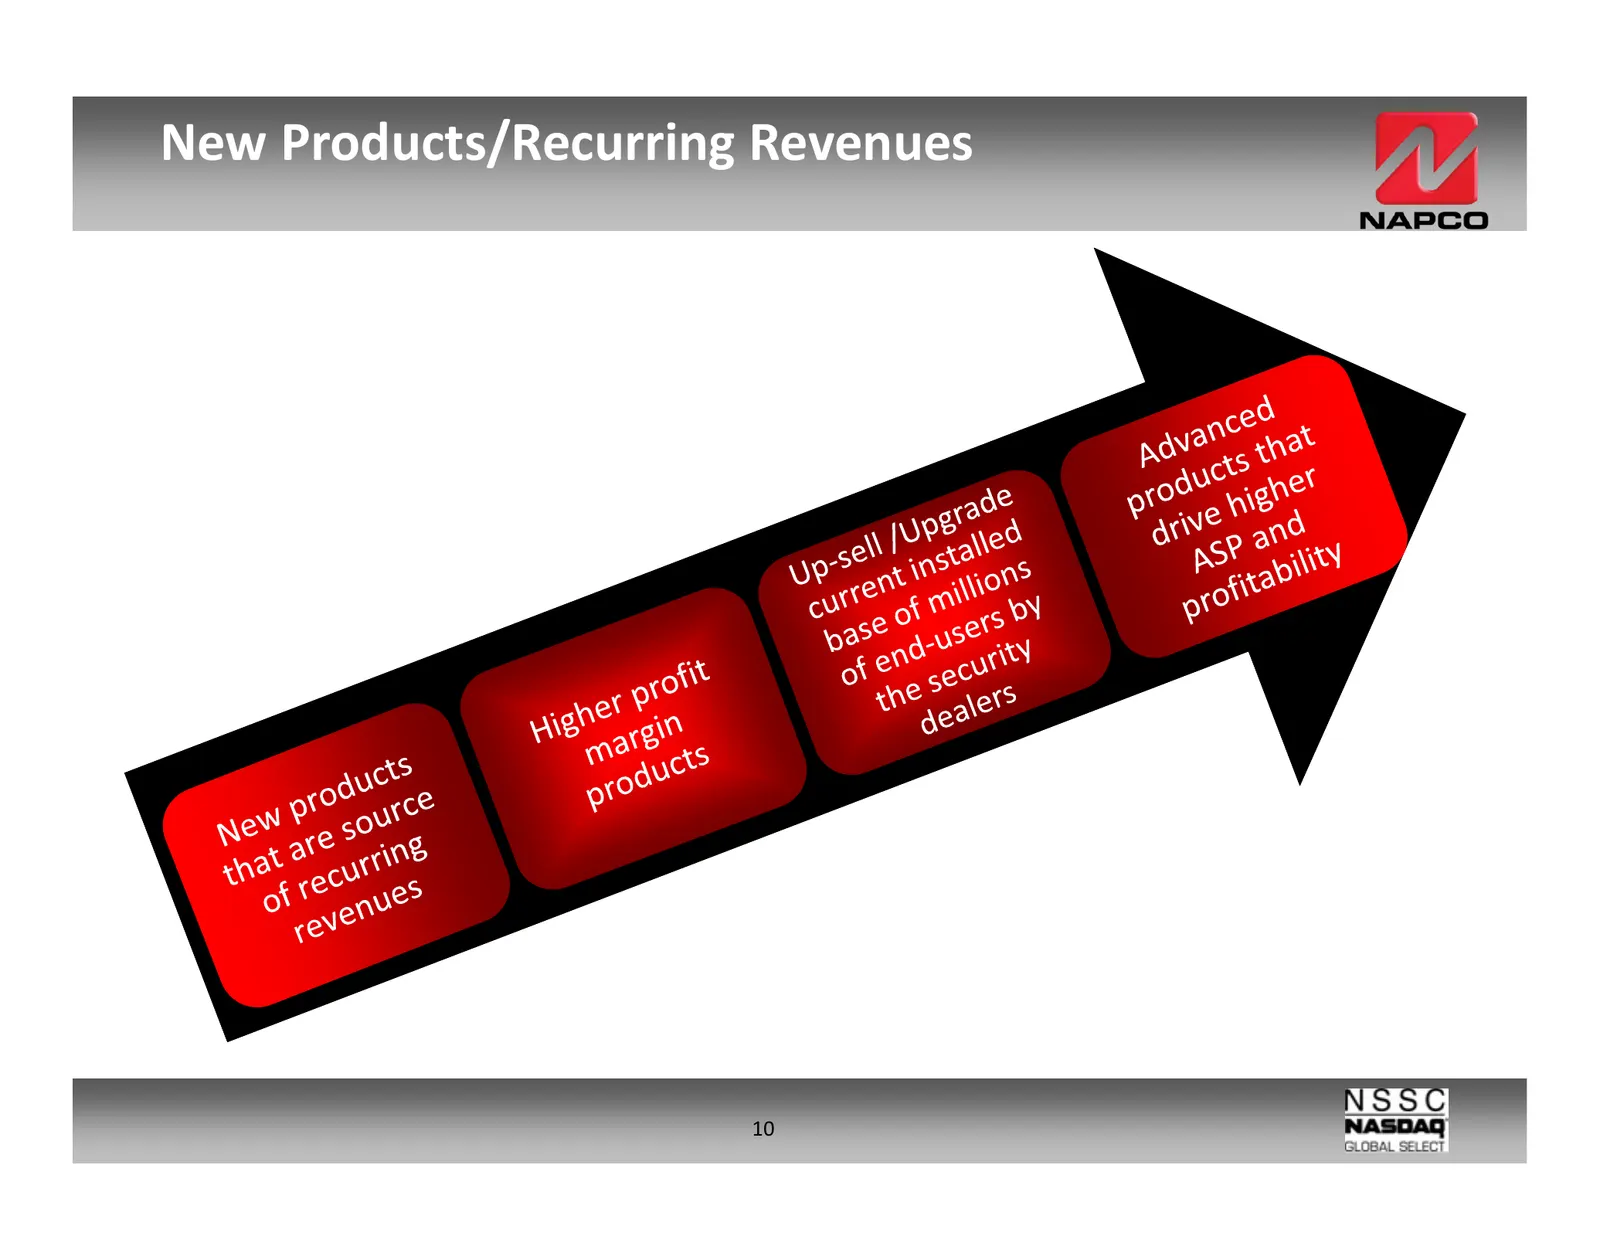
Slide 10: New Products/Recurring Revenues
New Products/Recurring Revenues 10
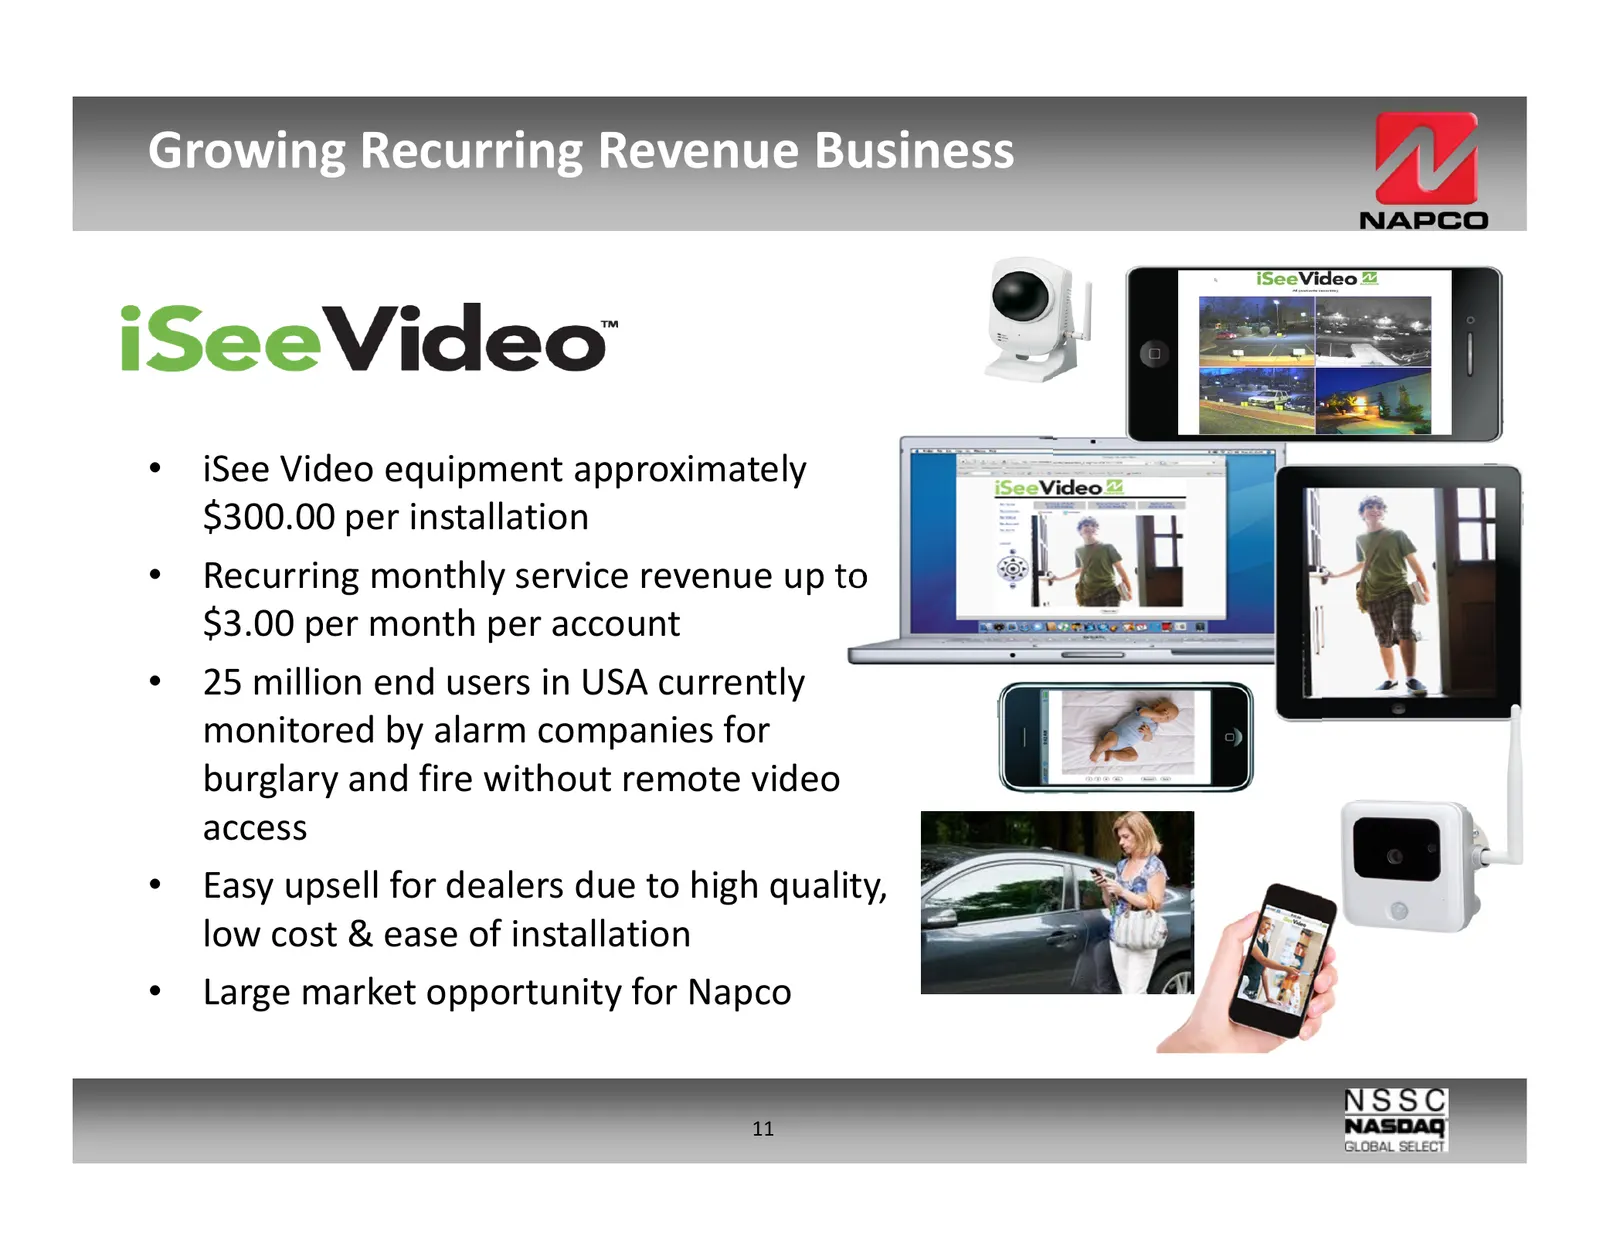
Slide 11: Growing Recurring Revenue Business
Growing Recurring Revenue Business • iSee Video equipment approximately $300.00 per installation • Recurring monthly service revenue up to $3.00 per month per account • 25 million end users in USA currently monitored by alarm companies for burglary and fire without remote video access • Easy upsell
Slide 12: New Product Introductions Targeted Toward Delivering Additional Recurring Revenue Streams
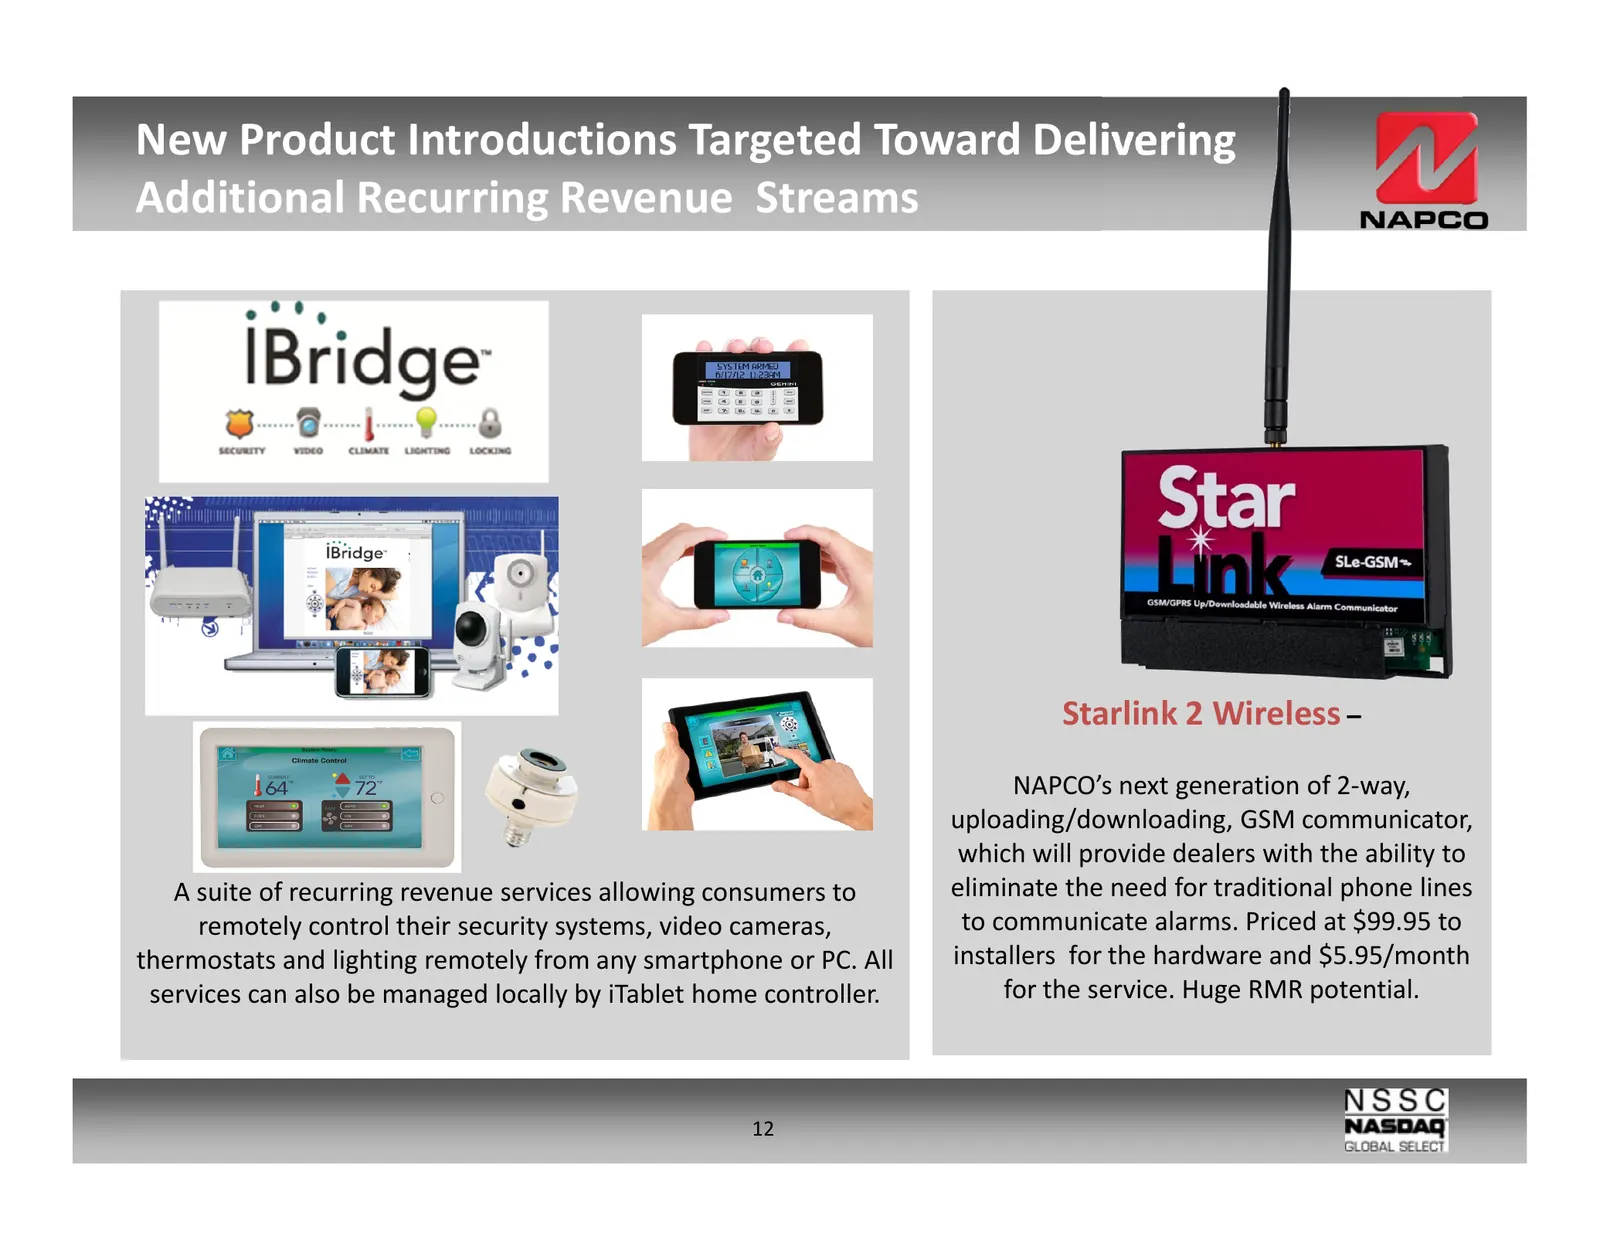
New Product Introductions Targeted Toward Delivering Additional Recurring Revenue Streams Starlink 2 Wireless – NAPCO’s next generation of 2-way, uploading/downloading, GSM communicator, which will provide dealers with the ability to A suite of recurring revenue services allowing consumers to elimin
Slide 13: Additional New Product Growth Drivers
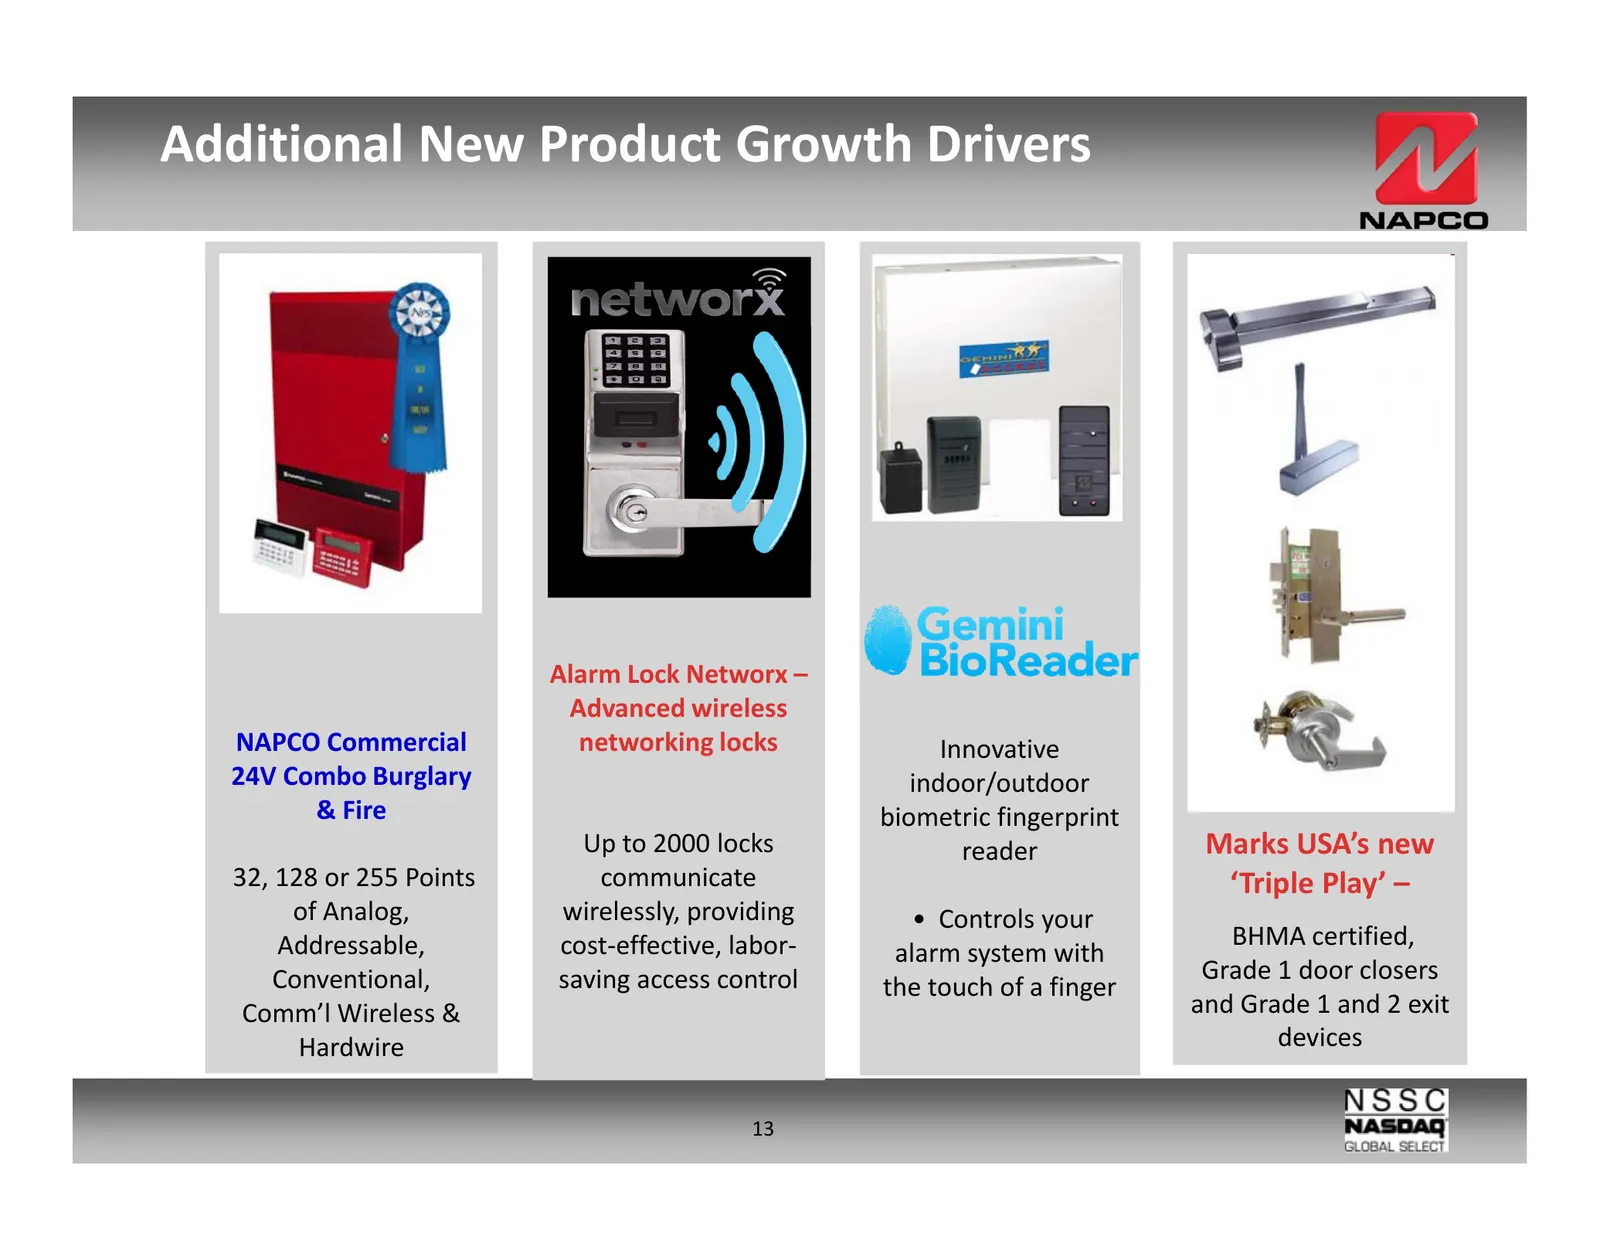
Additional New Product Growth Drivers Alarm Lock Networx – Advanced wireless NAPCO Commercial networking locks Innovative 24V Combo Burglary indoor/outdoor & Fire biometric fingerprint Up to 2000 locks reader Marks USA’s new 32, 128 or 255 Points communicate ‘Triple Play’ – of Analog, wirelessly, pr
Slide 14: Unique, Integrated Commercial Solution
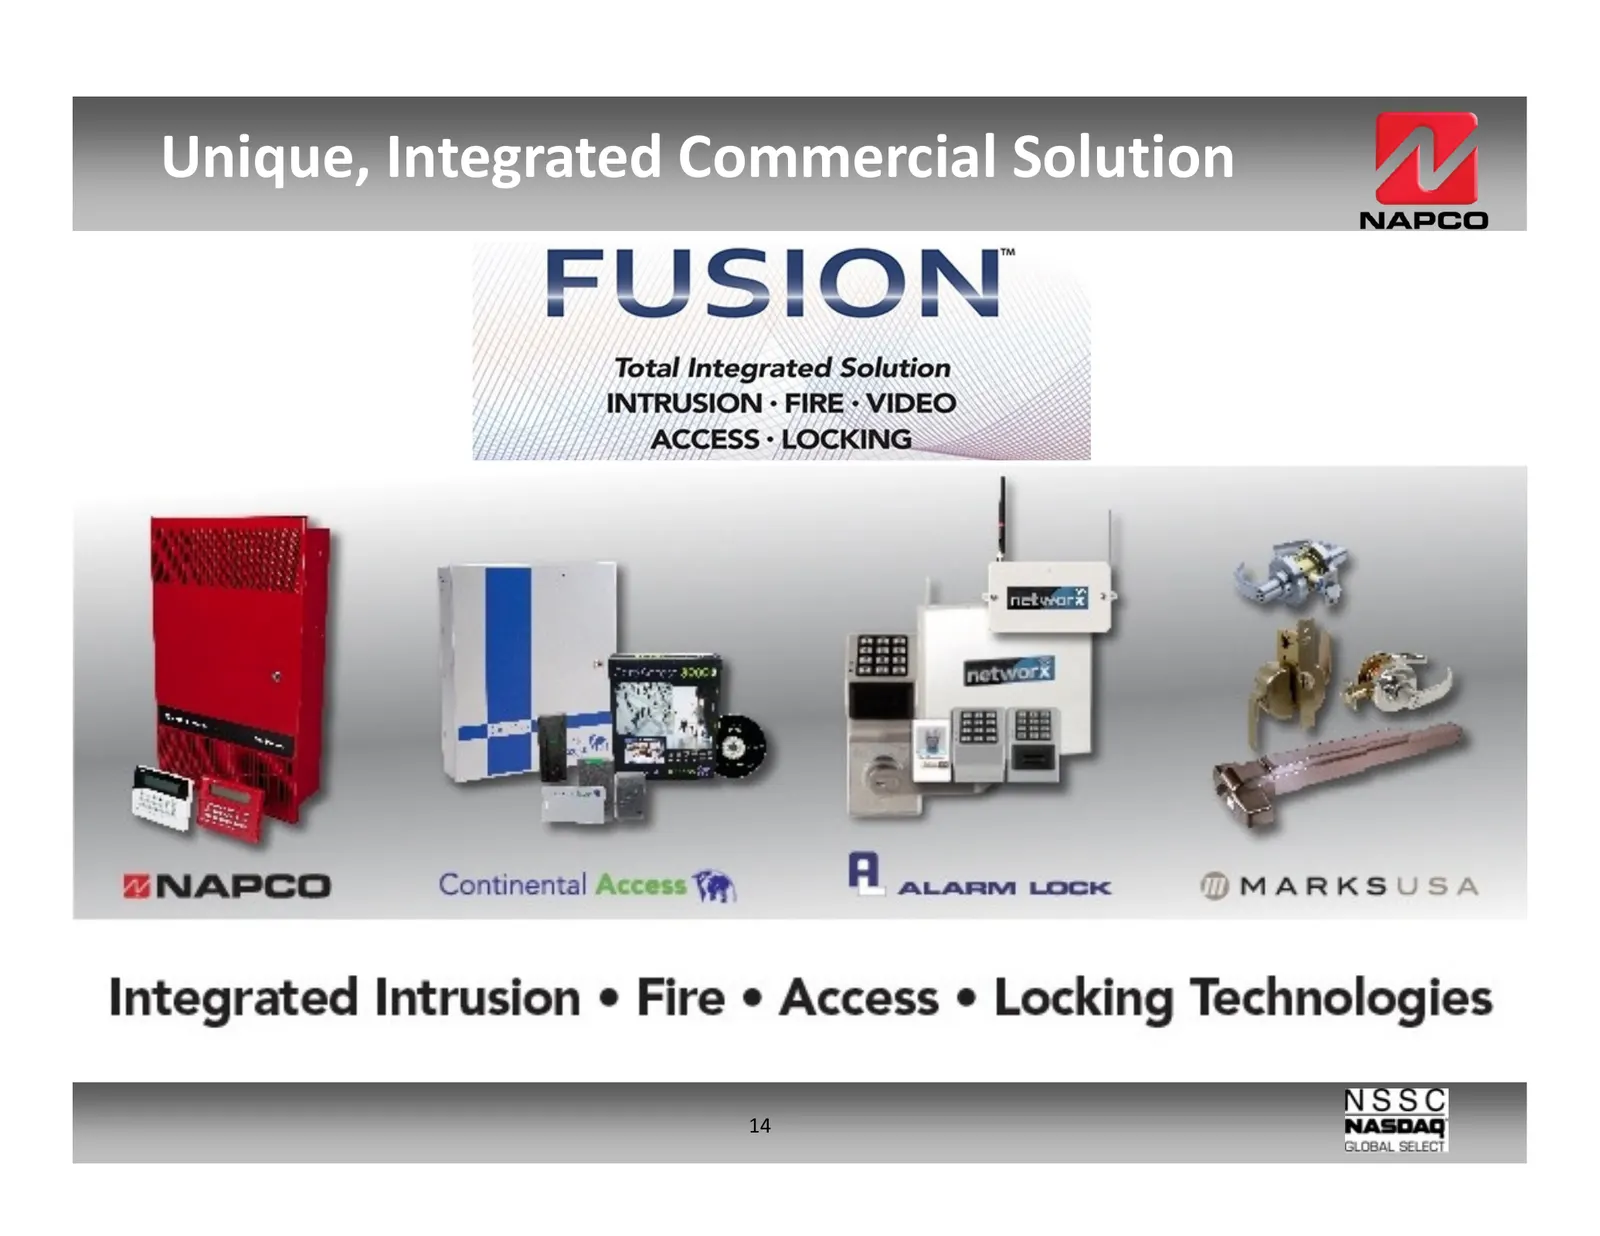
Unique, Integrated Commercial Solution 14
Slide 15: Historical Financial Data
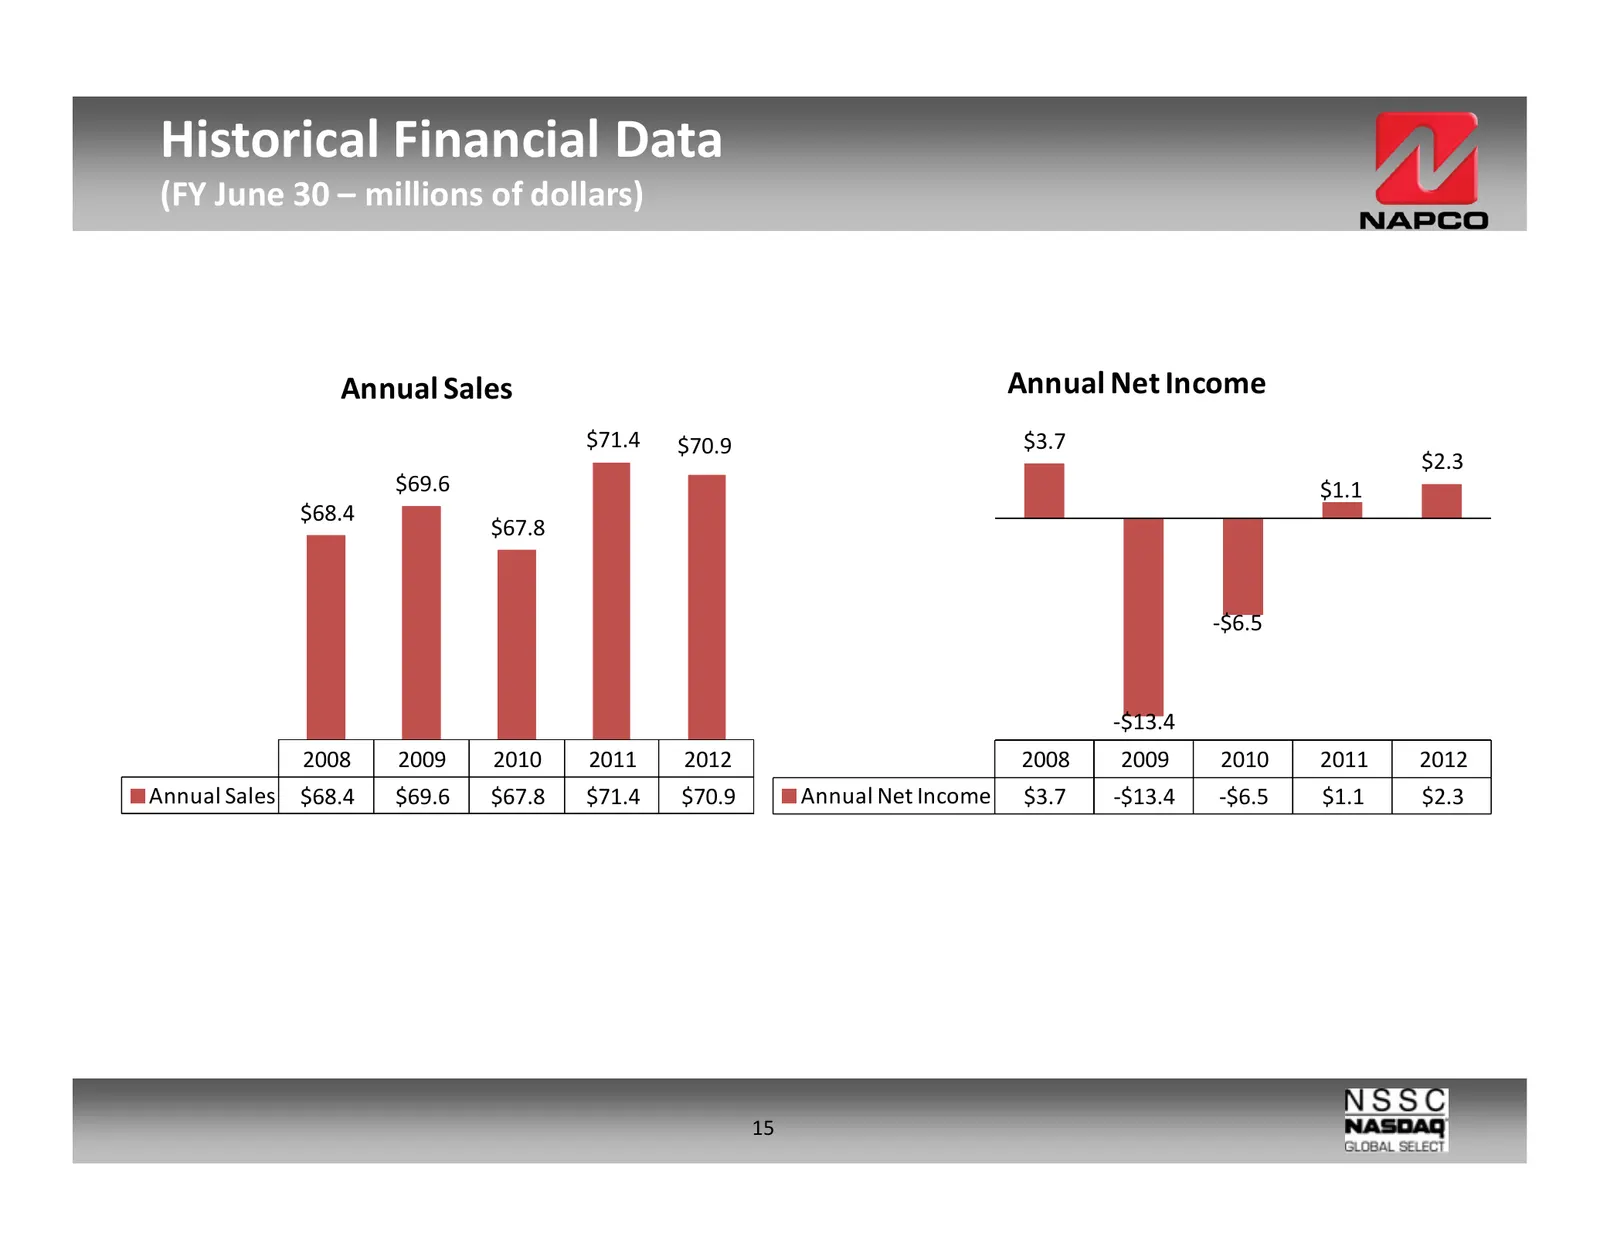
Historical Financial Data (FY June 30 – millions of dollars) Annual Sales Annual Net Income $71.4 $70.9 $3.7 $2.3 $69.6 $1.1 $68.4 $67.8 -$6.5 -$13.4 2008 2009 2010 2011 2012 2008 2009 2010 2011 2012 Annual Sales $68.4 $69.6 $67.8 $71.4 $70.9 Annual Net Income $3.7 -$13.4 -$6.5 $1.1 $2.3 15
Slide 16: Year-End Financial Highlights
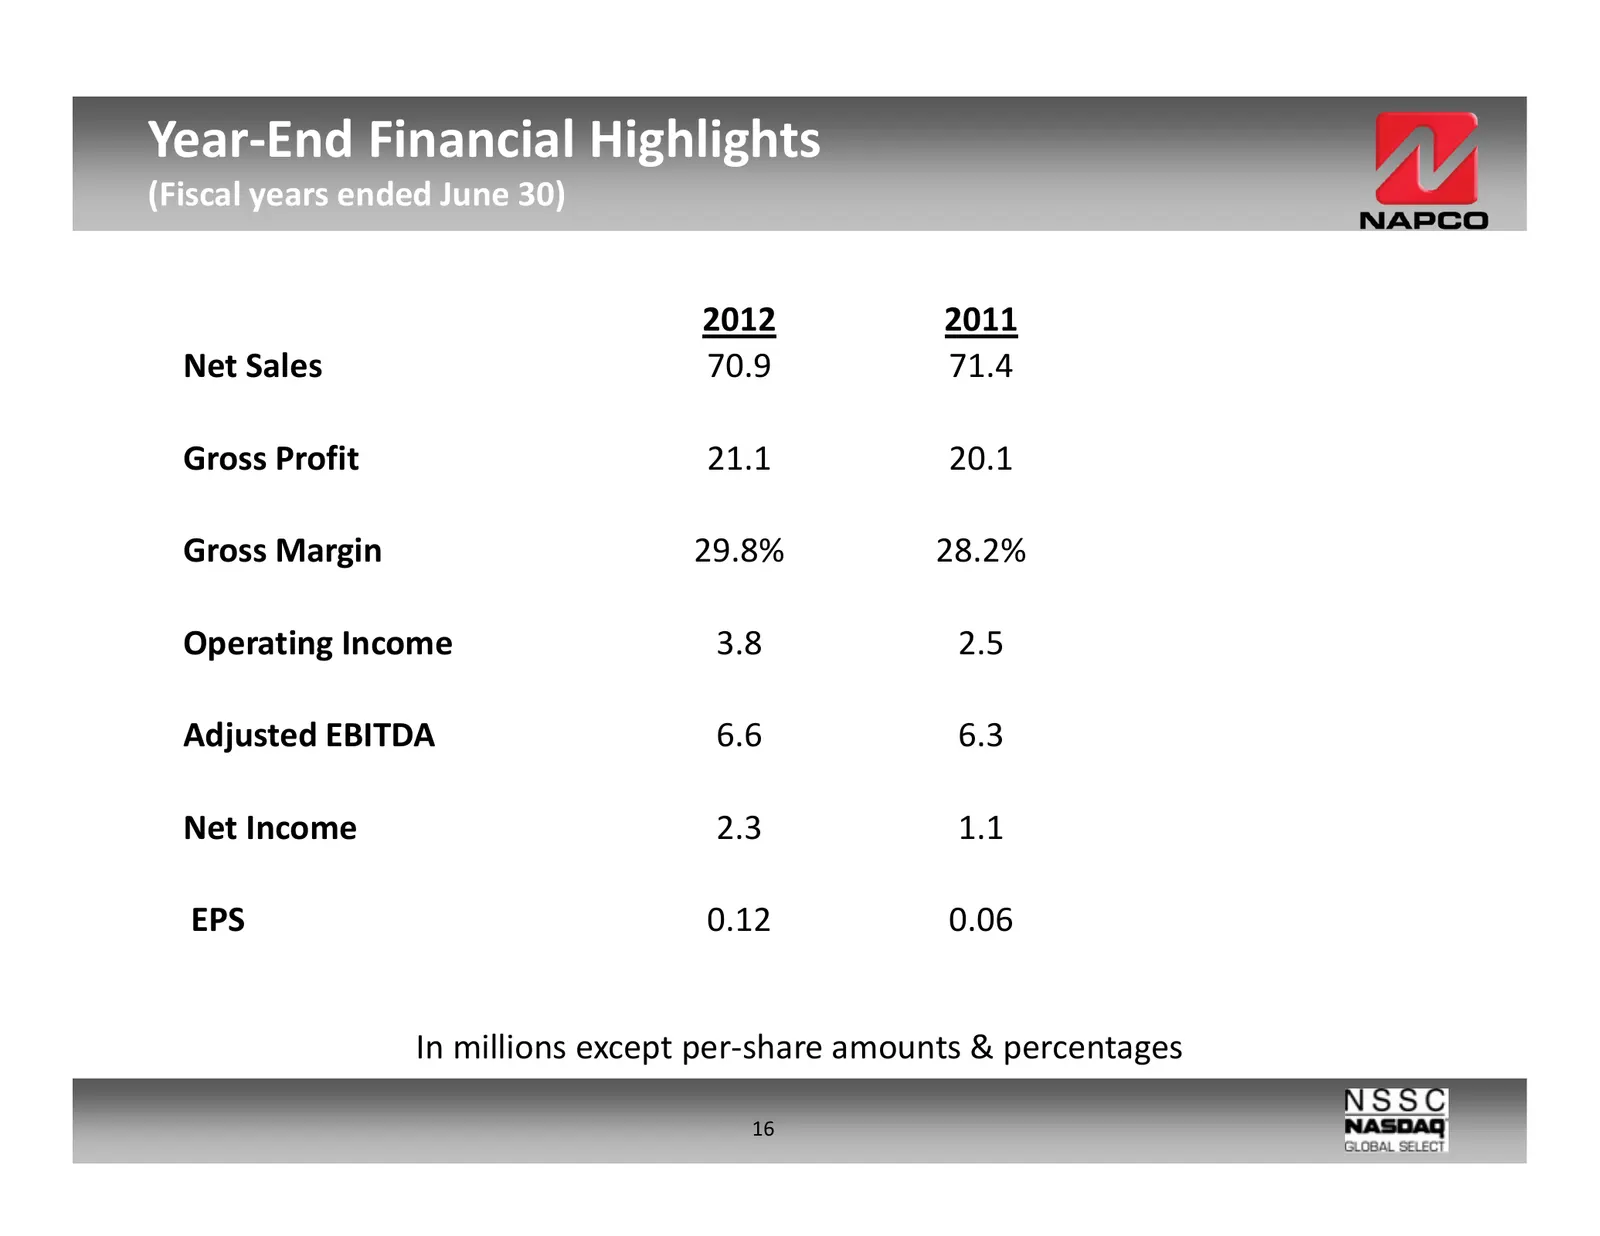
Year-End Financial Highlights (Fiscal years ended June 30) 2012 2011 Net Sales 70.9 71.4 Gross Profit 21.1 20.1 Gross Margin 29.8% 28.2% Operating Income 3.8 2.5 Adjusted EBITDA 6.6 6.3 Net Income 2.3 1.1 EPS 0.12 0.06 In millions except per-share amounts & percentages 16
Slide 17: Q3:13 Financial Highlights
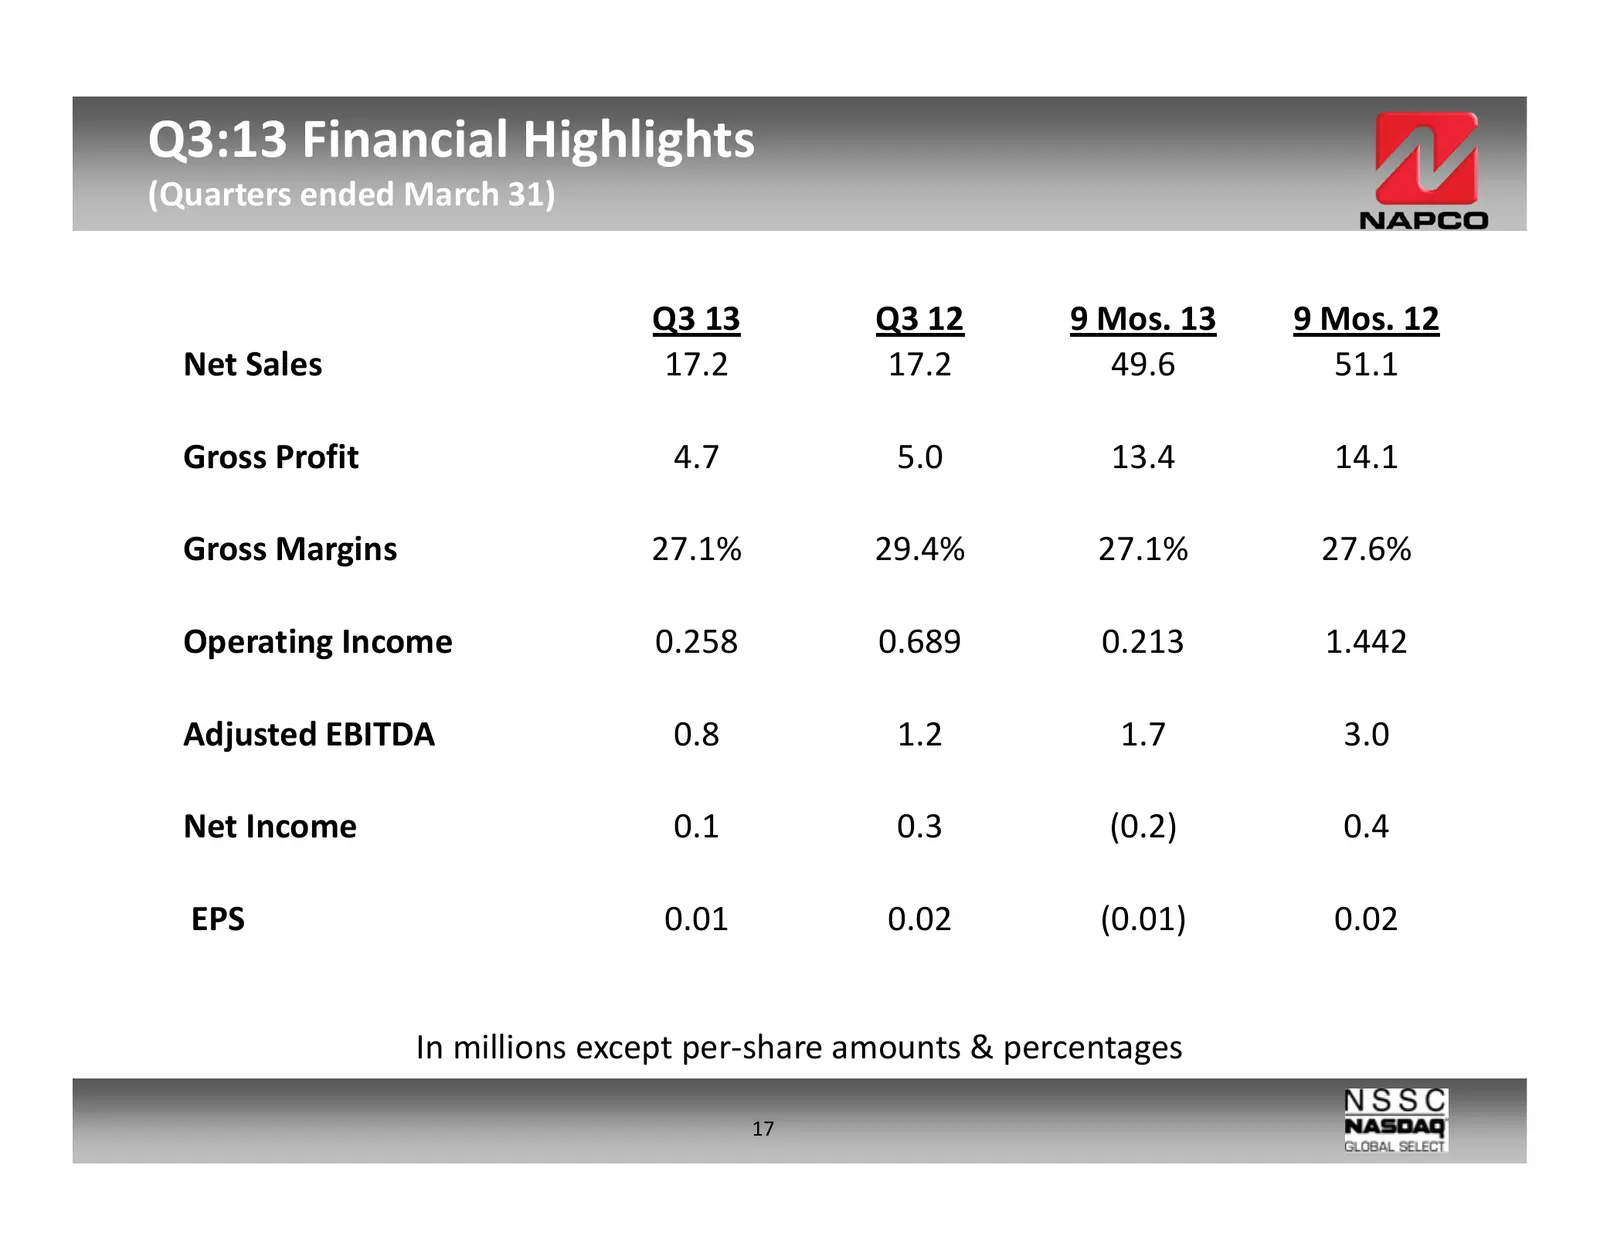
Q3:13 Financial Highlights (Quarters ended March 31) Q3 13 Q3 12 9 Mos. 13 9 Mos. 12 Net Sales 17.2 17.2 49.6 51.1 Gross Profit 4.7 5.0 13.4 14.1 Gross Margins 27.1% 29.4% 27.1% 27.6% Operating Income 0.258 0.689 0.213 1.442 Adjusted EBITDA 0.8 1.2 1.7 3.0 Net Income 0.1 0.3 (0.2) 0.4 EPS 0.01 0.02
Slide 18: Q3:13 and Subsequent Financial Highlights cont'd
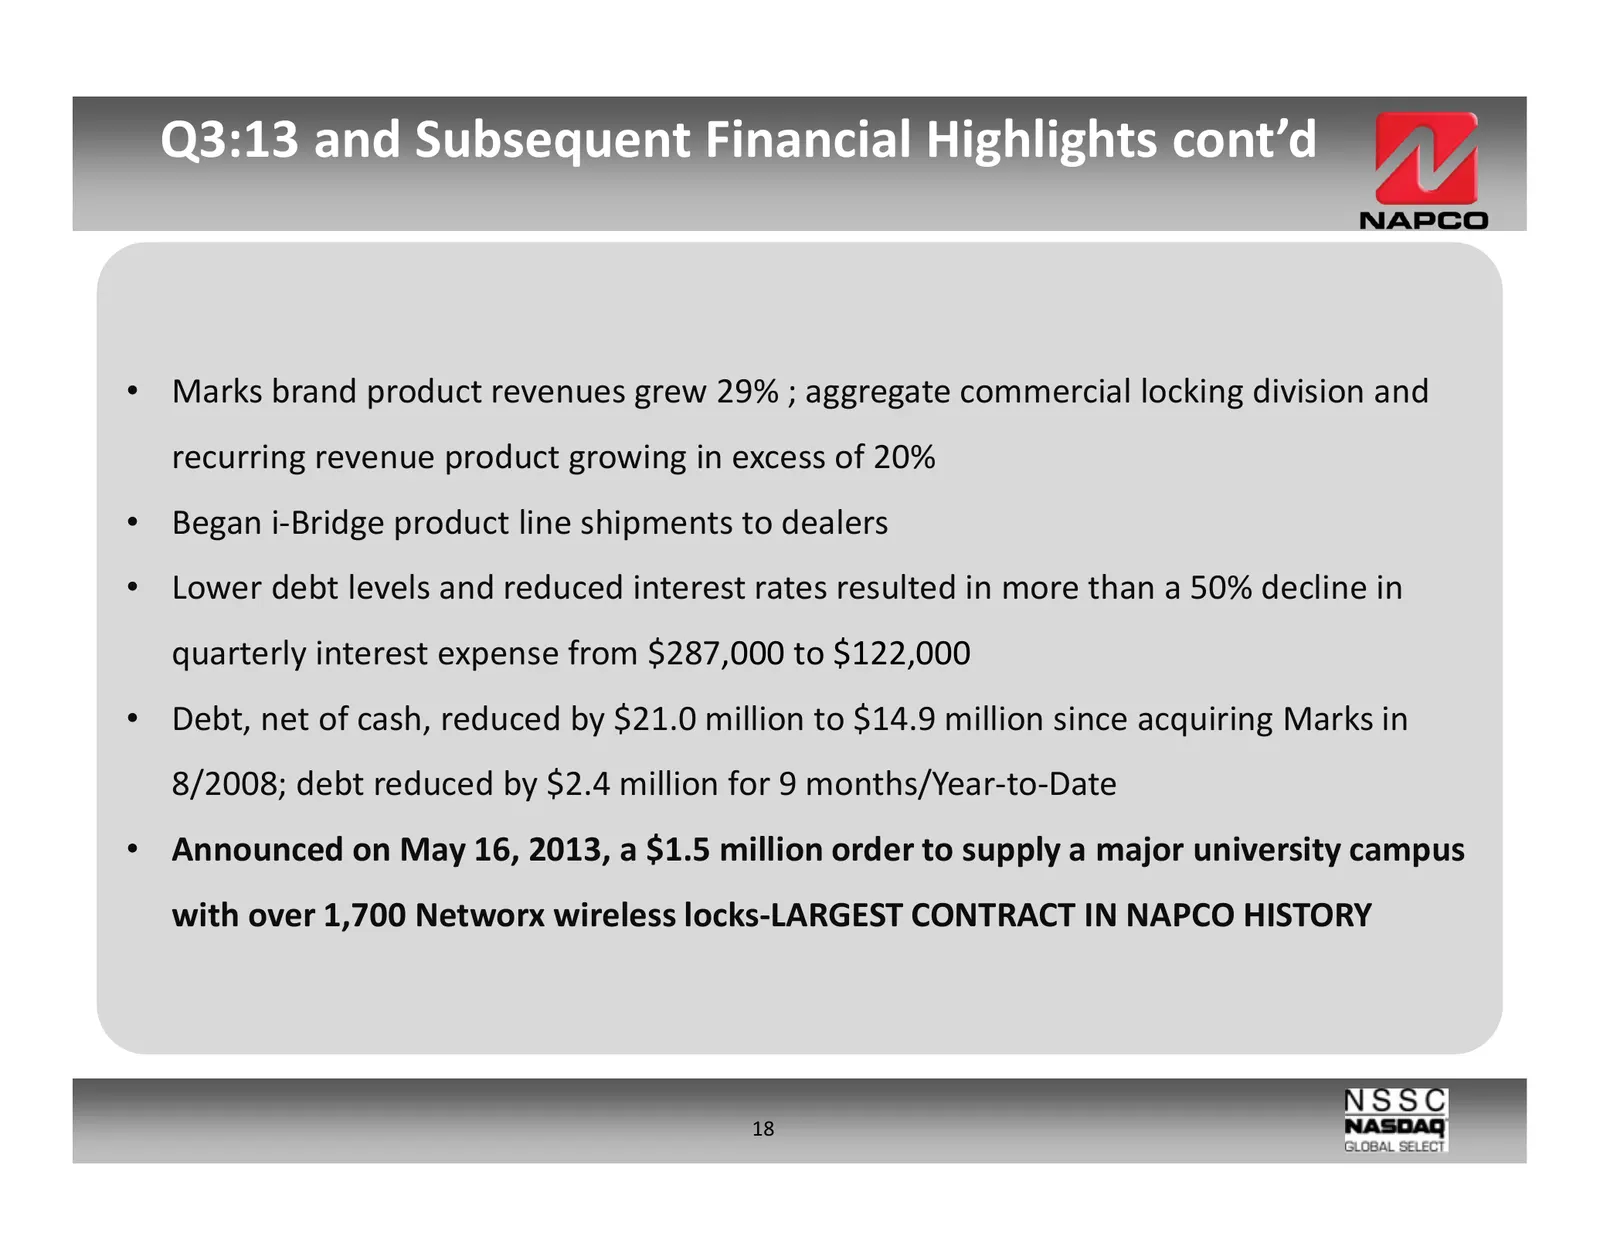
Q3:13 and Subsequent Financial Highlights cont’d • Marks brand product revenues grew 29% ; aggregate commercial locking division and recurring revenue product growing in excess of 20% • Began i-Bridge product line shipments to dealers • Lower debt levels and reduced interest rates resulted in more t
Slide 19: Latest News-$1.5 Million Networx Contract
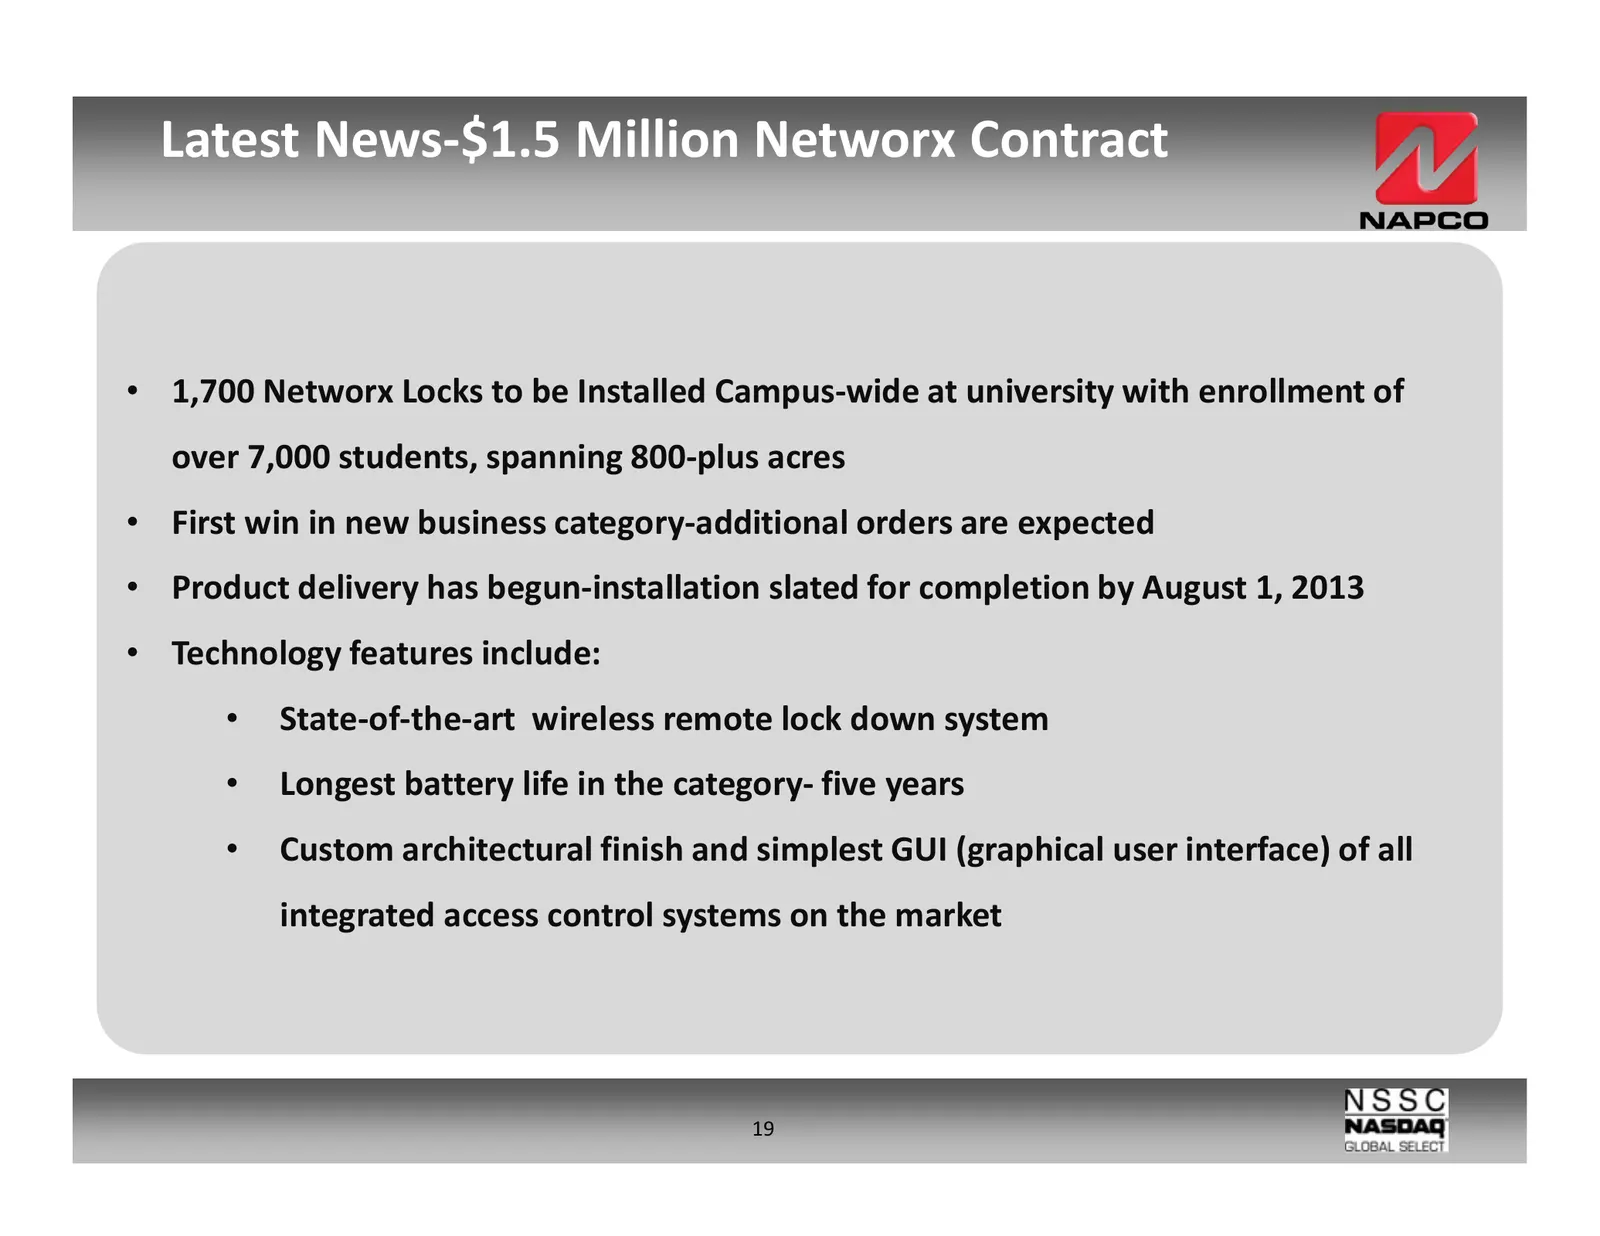
Latest News-$1.5 Million Networx Contract • 1,700 Networx Locks to be Installed Campus-wide at university with enrollment of over 7,000 students, spanning 800-plus acres • First win in new business category-additional orders are expected • Product delivery has begun-installation slated for completio
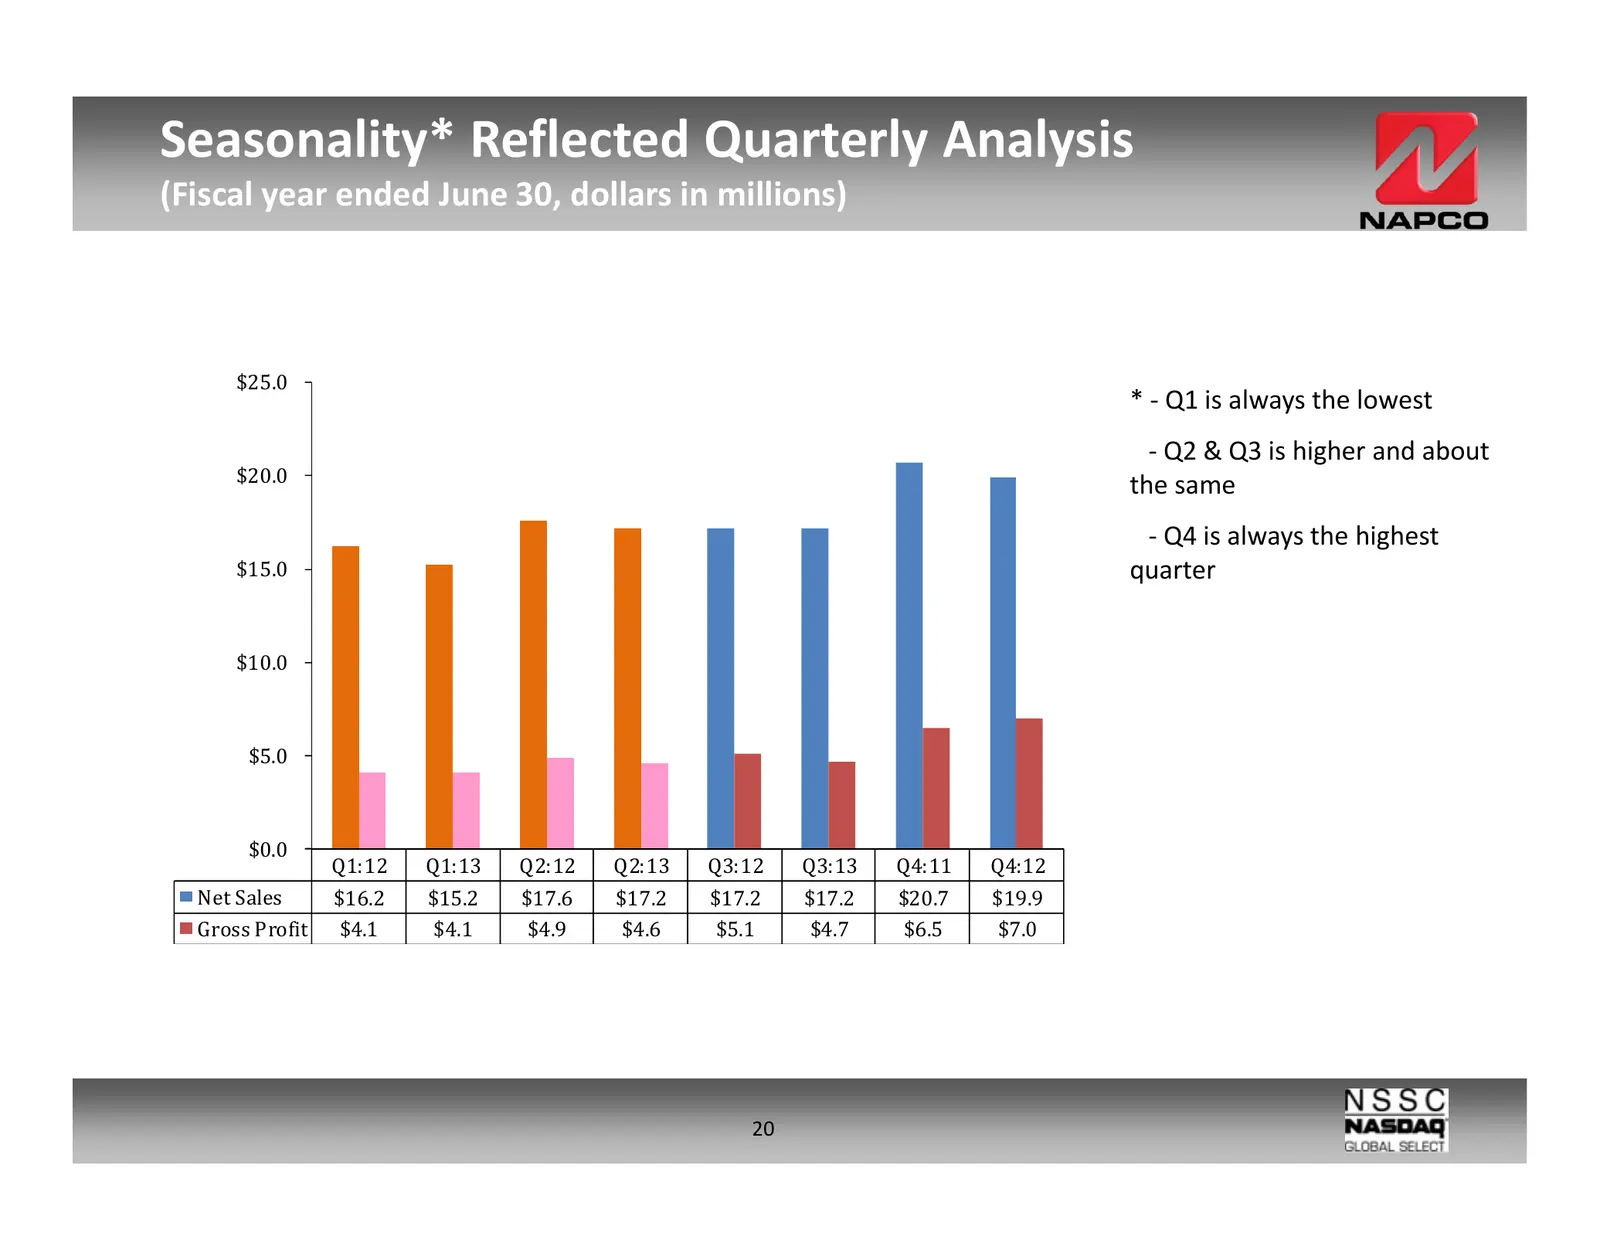
Slide 20: Seasonality Reflected Quarterly Analysis
Seasonality* Reflected Quarterly Analysis (Fiscal year ended June 30, dollars in millions) $25.0 * - Q1 is always the lowest - Q2 & Q3 is higher and about $20.0 the same - Q4 is always the highest $15.0 quarter $10.0 $5.0 $0.0 Q1:12 Q1:13 Q2:12 Q2:13 Q3:12 Q3:13 Q4:11 Q4:12 Net Sales $16.2 $15.2 $17
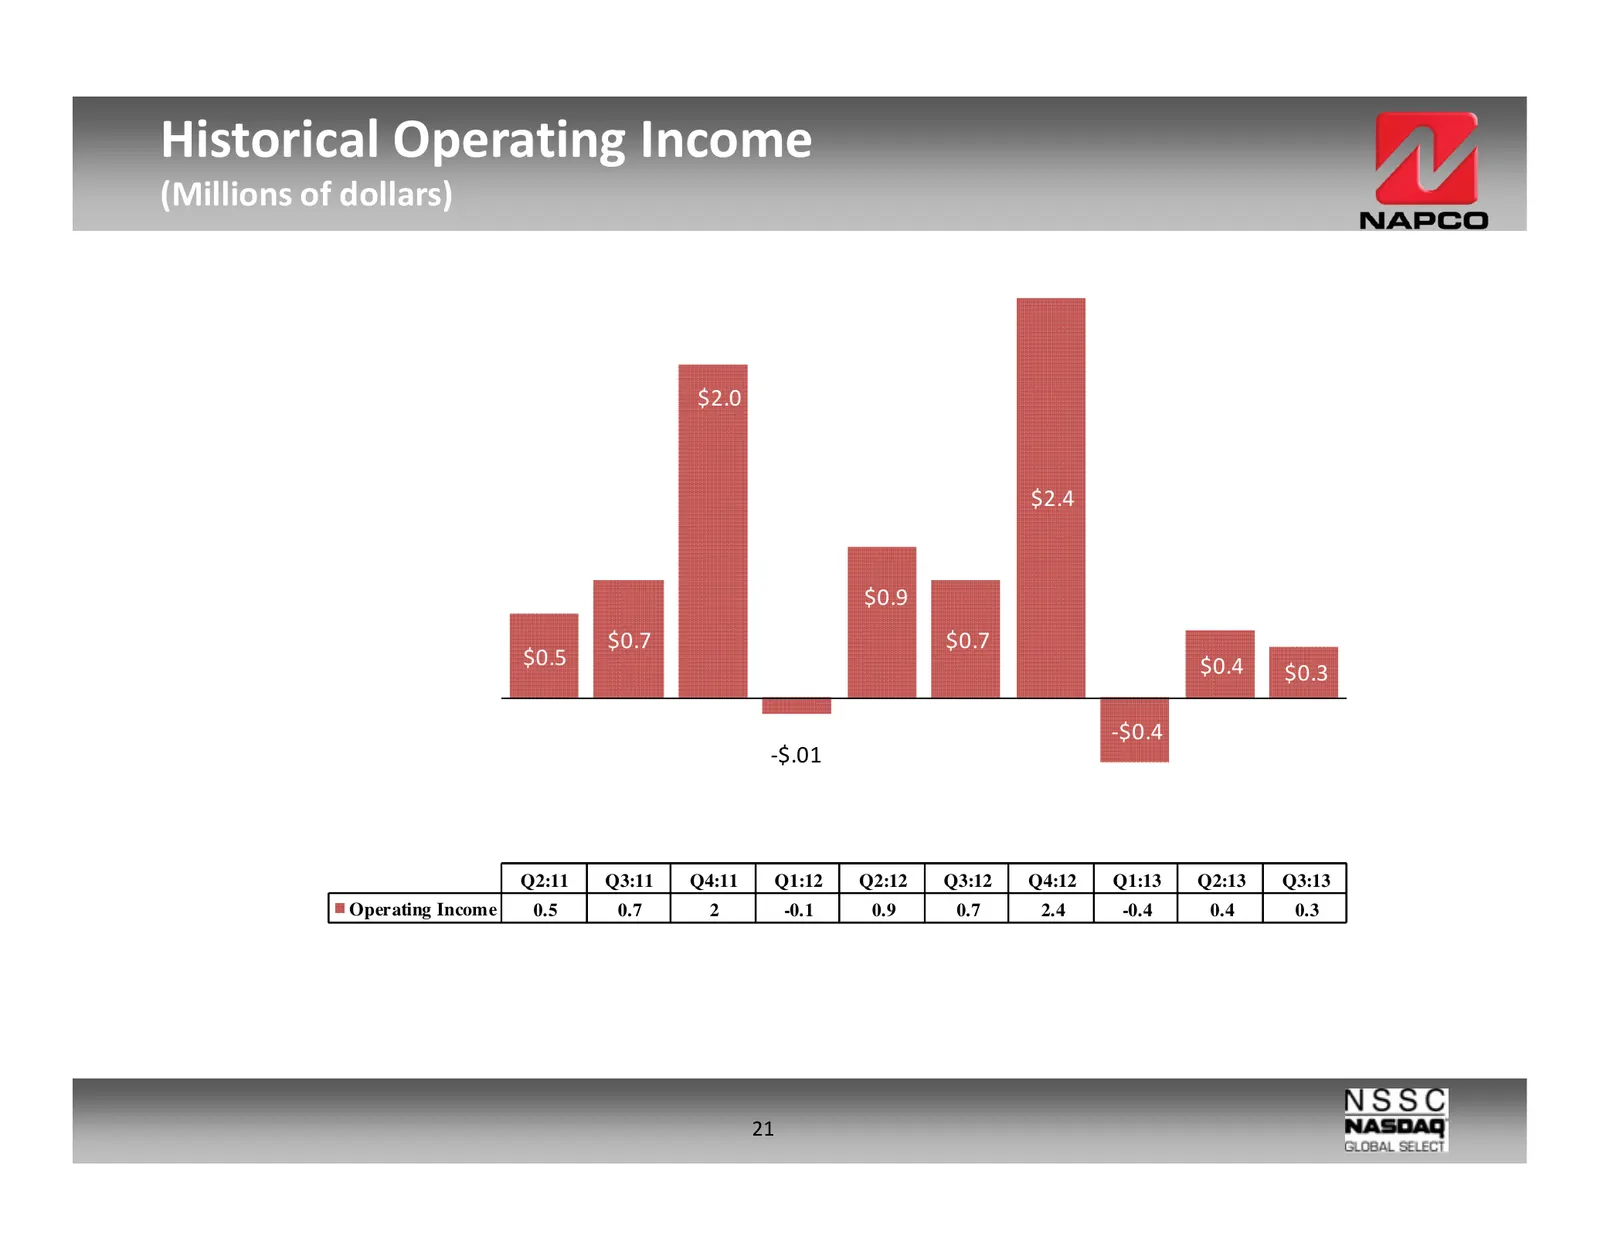
Slide 21: Historical Operating Income
Historical Operating Income (Millions of dollars) $2.0 $2.4 $0.9 $0.7 $0.7 $0.5 $0.4 $0.3 -$0.4 -$.01 Q2:11 Q3:11 Q4:11 Q1:12 Q2:12 Q3:12 Q4:12 Q1:13 Q2:13 Q3:13 Operating Income 0.5 0.7 2 -0.1 0.9 0.7 2.4 -0.4 0.4 0.3 21
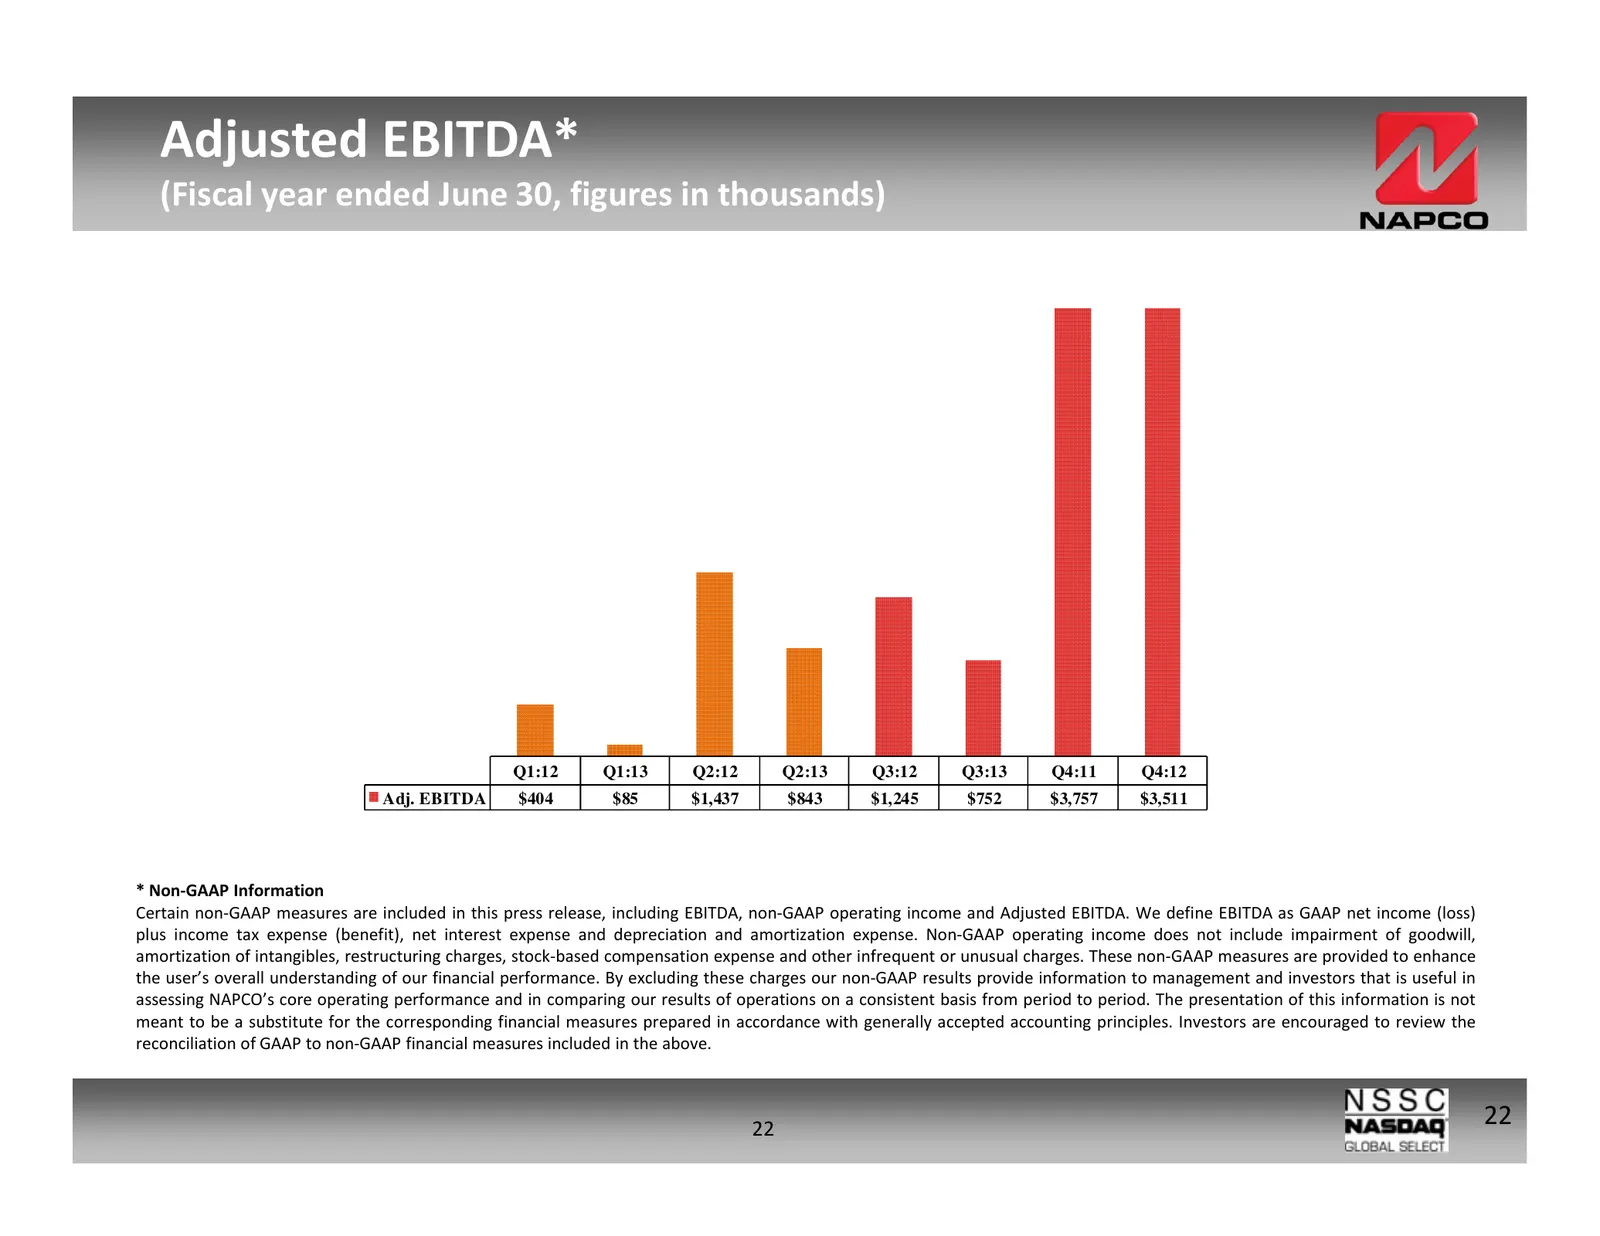
Slide 22: Adjusted EBITDA
Adjusted EBITDA* (Fiscal year ended June 30, figures in thousands) Q1:12 Q1:13 Q2:12 Q2:13 Q3:12 Q3:13 Q4:11 Q4:12 Adj. EBITDA $404 $85 $1,437 $843 $1,245 $752 $3,757 $3,511 * Non-GAAP Information Certain non-GAAP measures are included in this press release, including EBITDA, non-GAAP operating inco
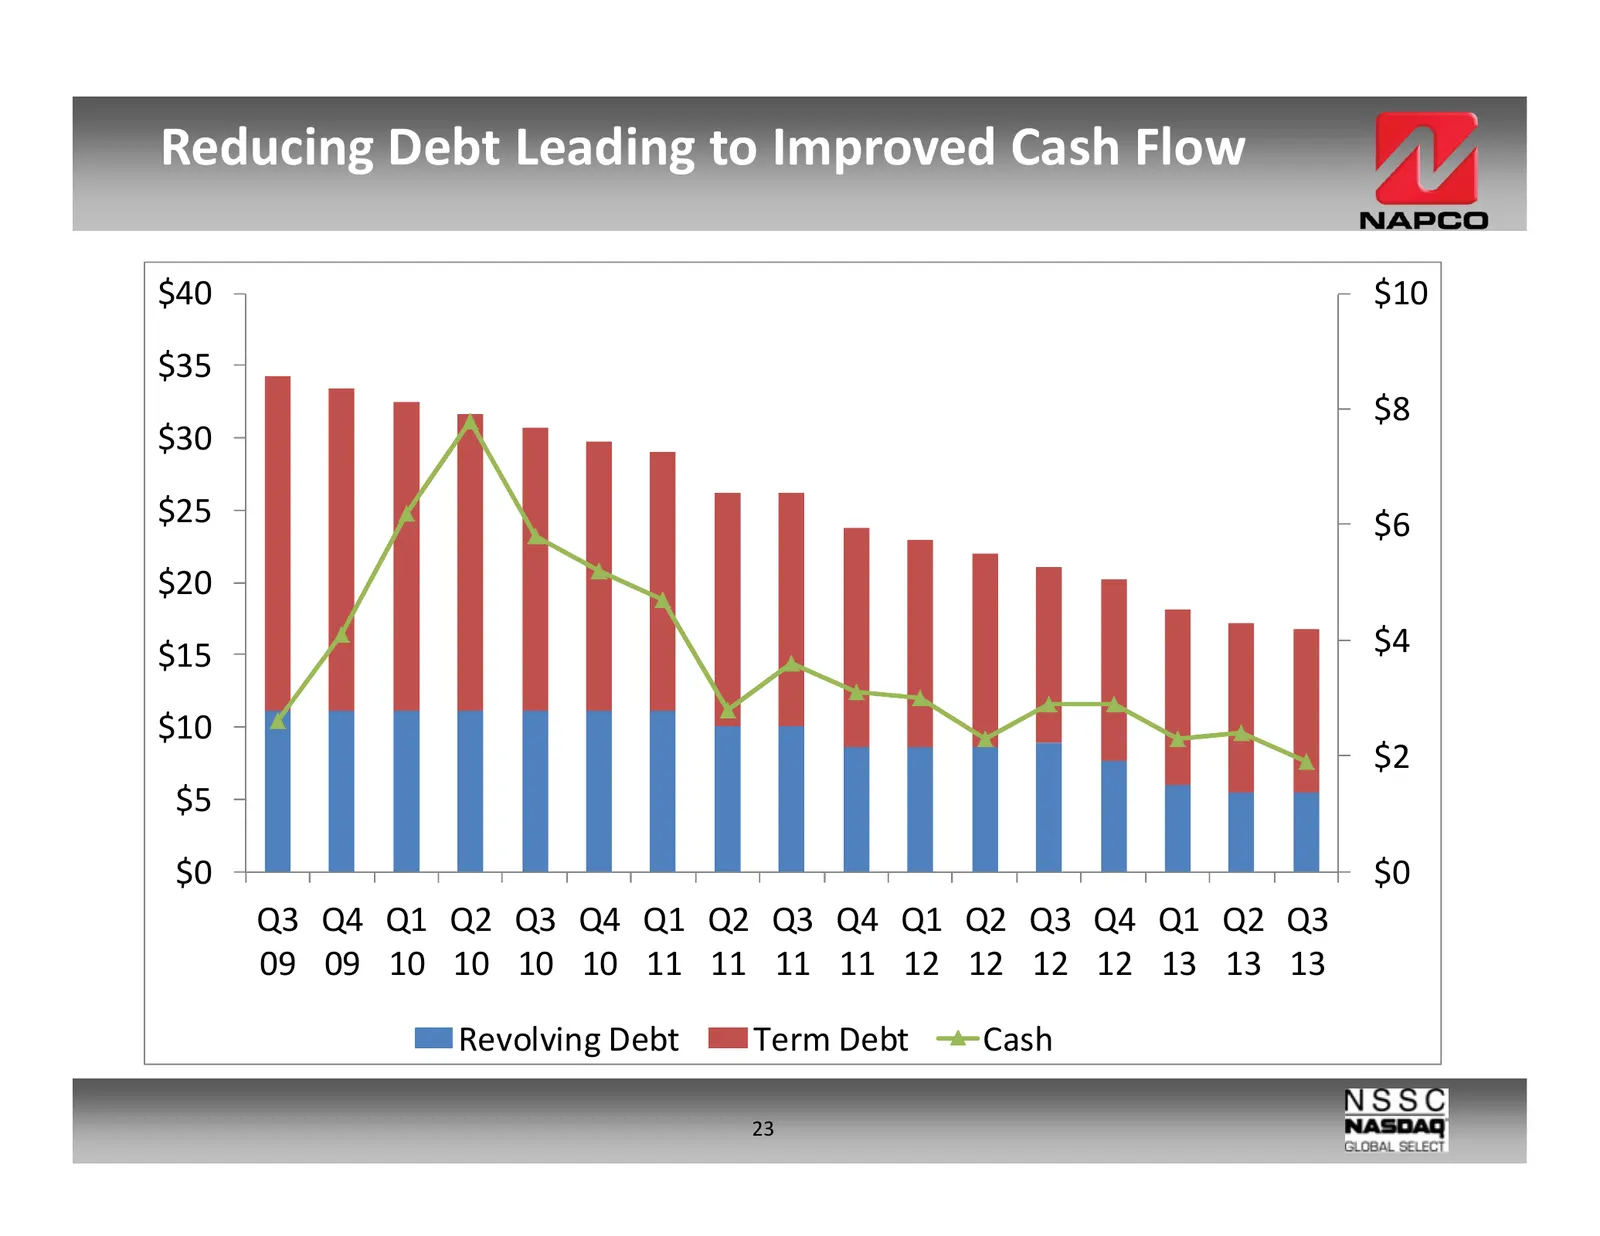
Slide 23: Reducing Debt Leading to Improved Cash Flow
Reducing Debt Leading to Improved Cash Flow $40 $10 $35 $8 $30 $25 $6 $20 $15 $4 $10 $2 $5 $0 $0 Q3 Q4 Q1 Q2 Q3 Q4 Q1 Q2 Q3 Q4 Q1 Q2 Q3 Q4 Q1 Q2 Q3 09 09 10 10 10 10 11 11 11 11 12 12 12 12 13 13 13 Revolving Debt Term Debt Cash 23
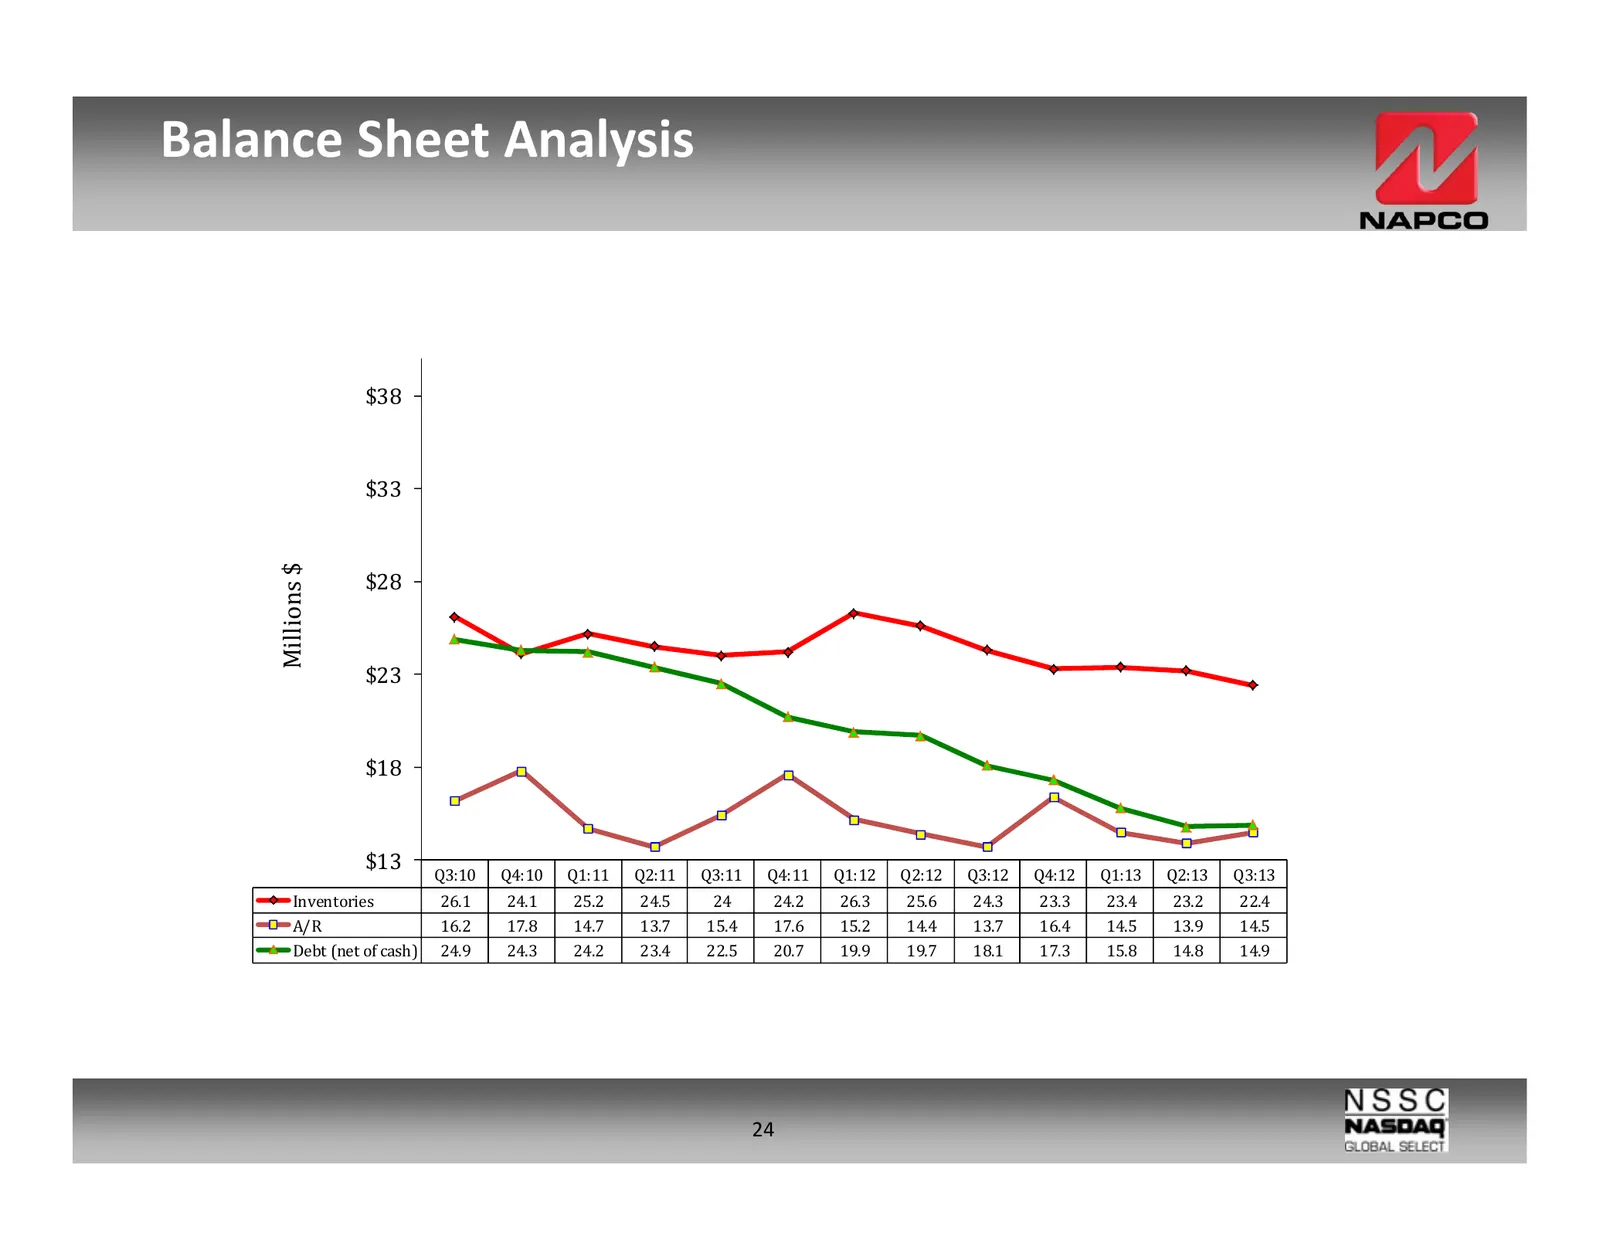
Slide 24: Balance Sheet Analysis
Balance Sheet Analysis $38 $33 Millions $ $28 $23 $18 $13 Q3:10 Q4:10 Q1:11 Q2:11 Q3:11 Q4:11 Q1:12 Q2:12 Q3:12 Q4:12 Q1:13 Q2:13 Q3:13 Inventories 26.1 24.1 25.2 24.5 24 24.2 26.3 25.6 24.3 23.3 23.4 23.2 22.4 A/R 16.2 17.8 14.7 13.7 15.4 17.6 15.2 14.4 13.7 16.4 14.5 13.9 14.5 Debt (net of cash) 2
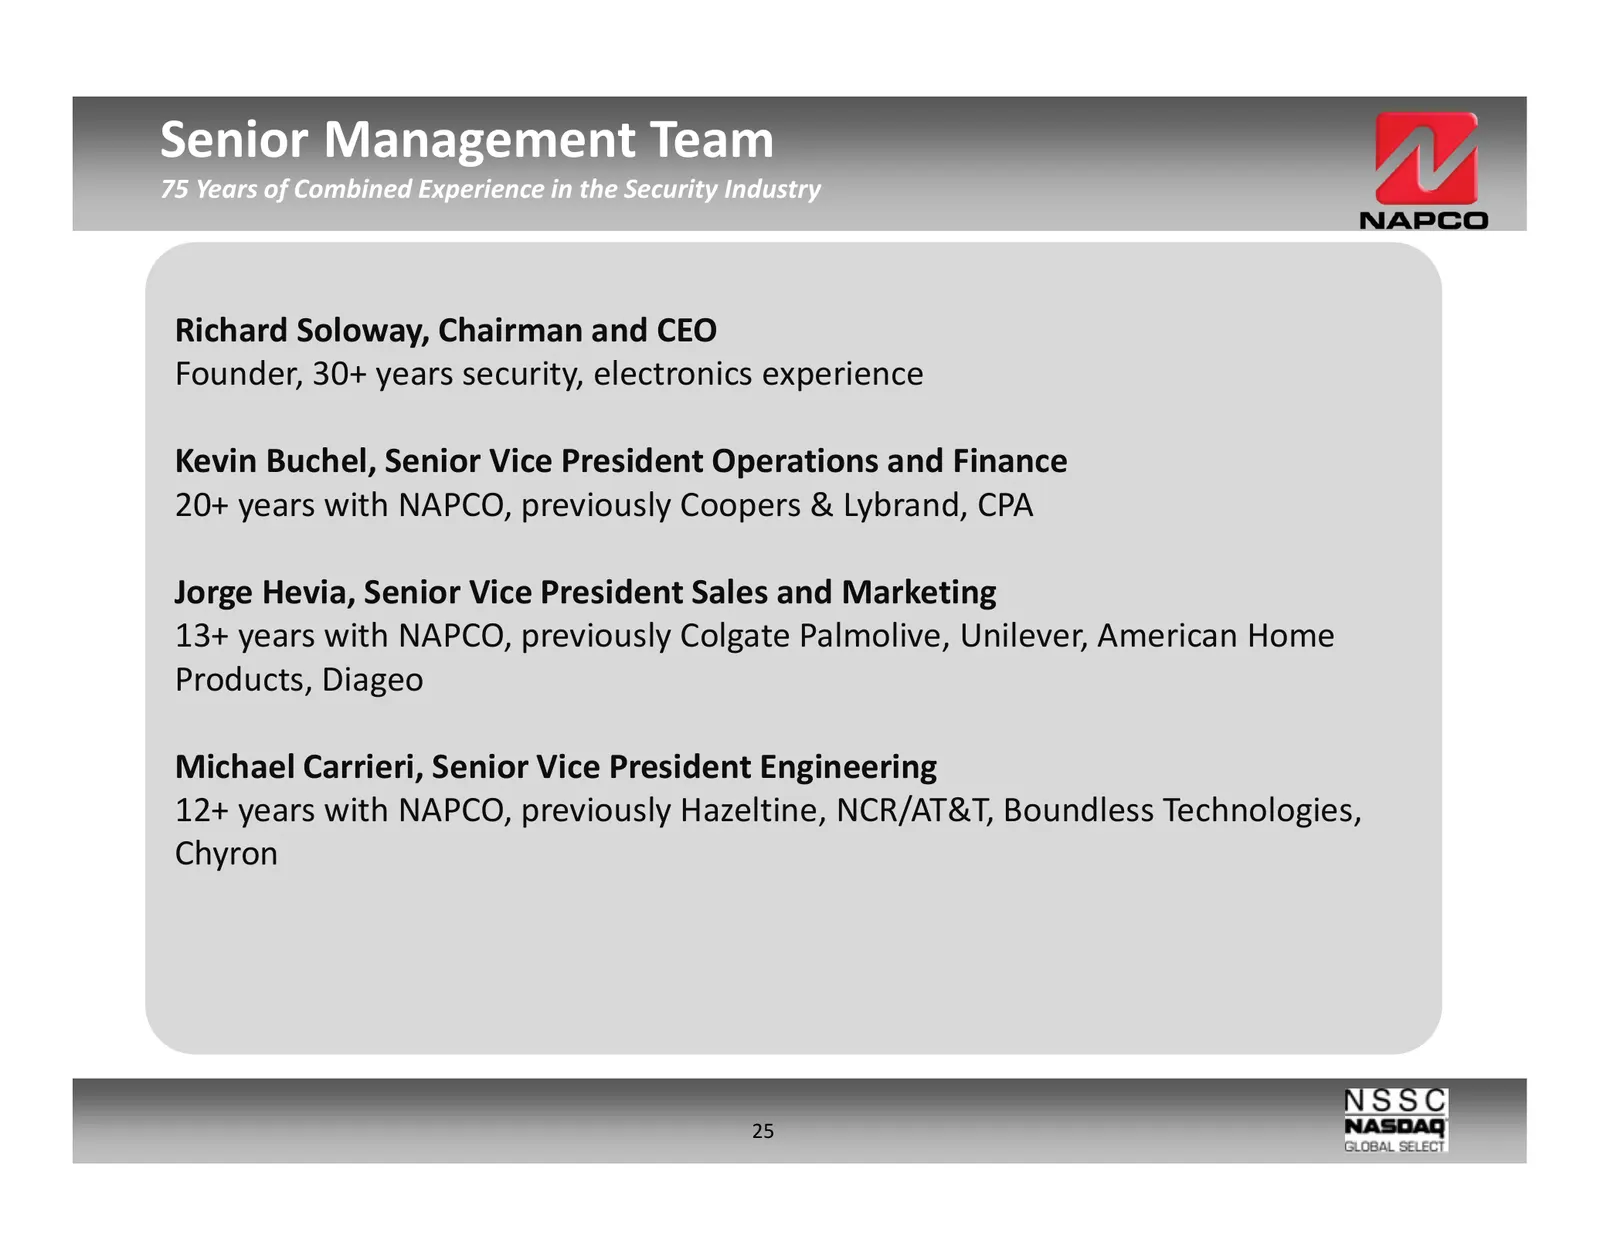
Slide 25: Senior Management Team
Senior Management Team 75 Years of Combined Experience in the Security Industry Richard Soloway, Chairman and CEO Founder, 30+ years security, electronics experience Kevin Buchel, Senior Vice President Operations and Finance 20+ years with NAPCO, previously Coopers & Lybrand, CPA Jorge Hevia, Senior
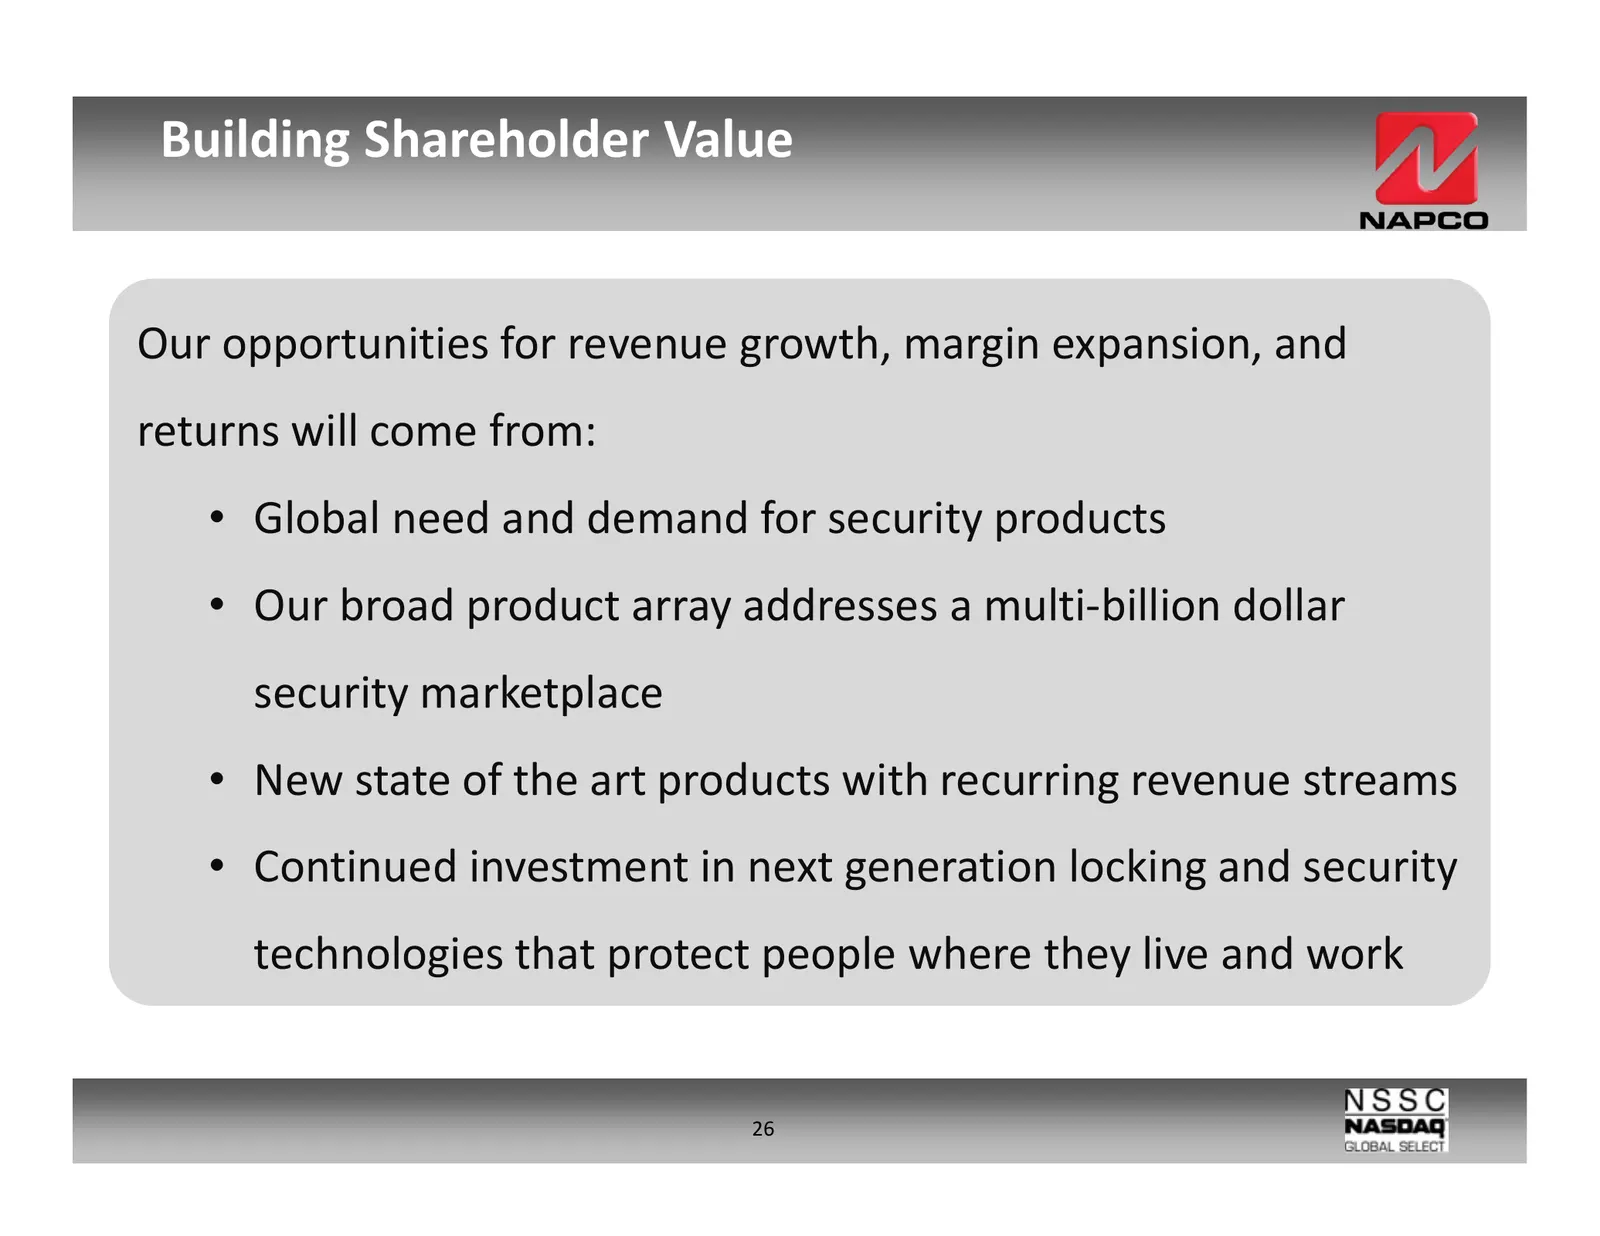
Slide 26: Building Shareholder Value
Building Shareholder Value Our opportunities for revenue growth, margin expansion, and returns will come from: • Global need and demand for security products • Our broad product array addresses a multi-billion dollar security marketplace • New state of the art products with recurring revenue streams
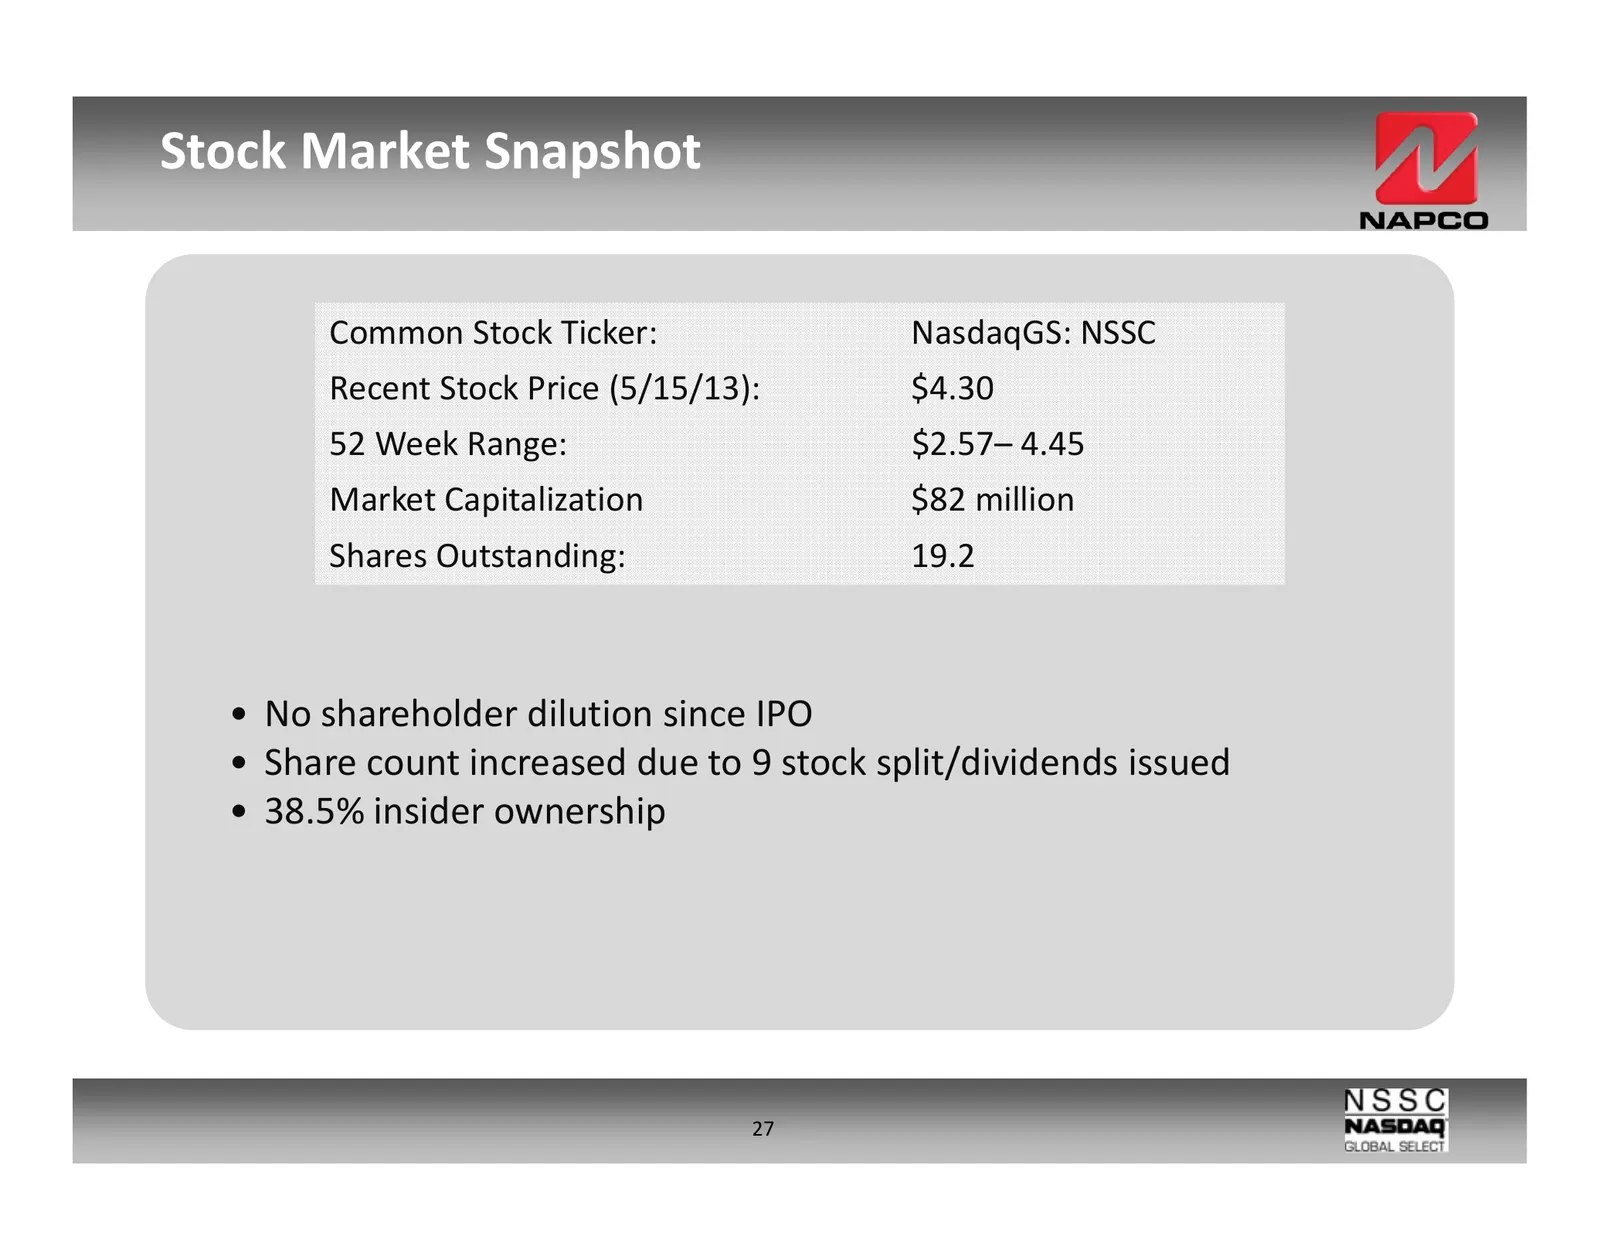
Slide 27: Stock Market Snapshot
Stock Market Snapshot Common Stock Ticker: NasdaqGS: NSSC Recent Stock Price (5/15/13): $4.30 52 Week Range: $2.57– 4.45 Market Capitalization $82 million Shares Outstanding: 19.2 • No shareholder dilution since IPO • Share count increased due to 9 stock split/dividends issued • 38.5% insider owners
Source: Internet Archive copy of napcosecurity.com