Anadarko Petroleum — Investor Presentation (February 2019)
32 slides from Anadarko Petroleum's investor presentation, Feb 11, 2019
Slide 1: Resilient Portfolio Delivers Cash Returns
Resilient Portfolio Delivers Cash Returns February 2019 Exhibit 99.1
Slide 2: Forward-looking statements and cautionary note
This presentation contains forward-looking statements within the meaning of Section 27A of the Securities Act of 1933 and Section 21E of the Securities Exchange Act of 1934. Anadarko believes that its expectations are based on reasonable assumptions. No assurance, however, can be given that such exp
Slide 3: Complementary and Diversified Portfolio: Anadarko's Investment Philosophy
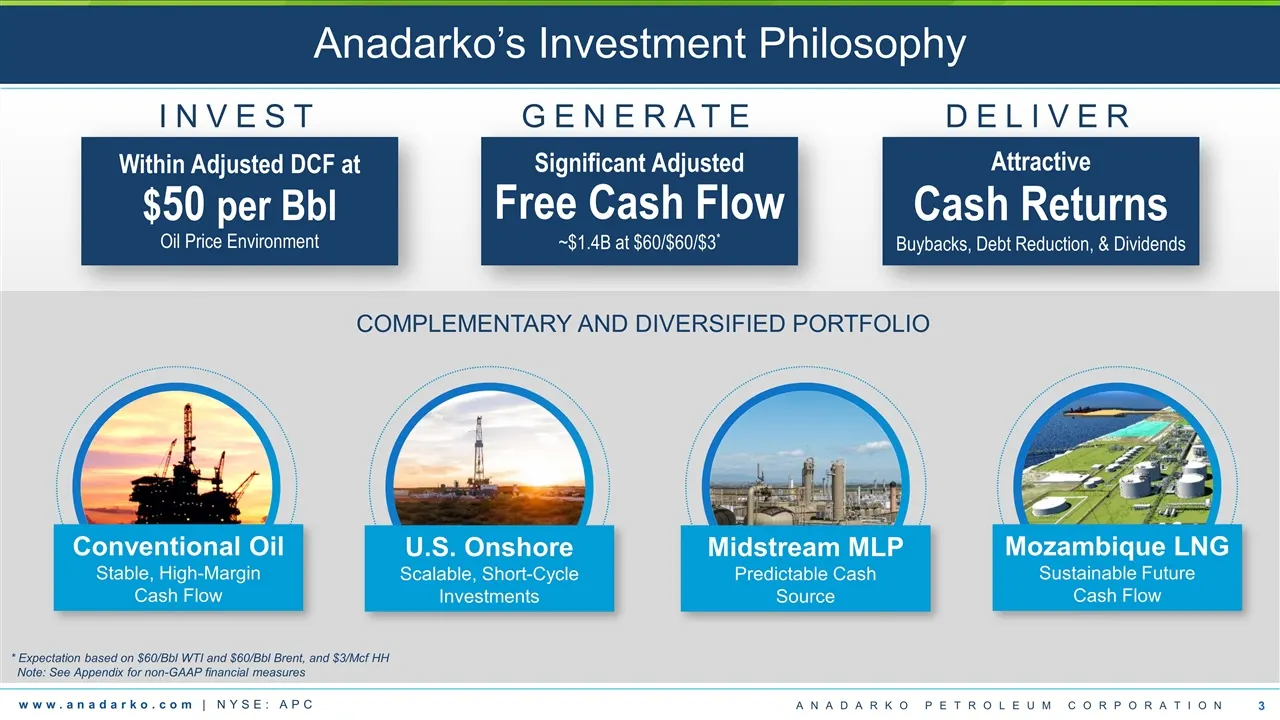
COMPLEMENTARY AND DIVERSIFIED PORTFOLIO Anadarko’s Investment Philosophy * Expectation based on $60/Bbl WTI and $60/Bbl Brent, and $3/Mcf HH Note: See Appendix for non-GAAP financial measures Within Adjusted DCF at $50 per Bbl Oil Price Environment Significant Adjusted Free Cash Flow ~$1.4B at $60/$
Slide 4: Committed to Ongoing Capital Returns
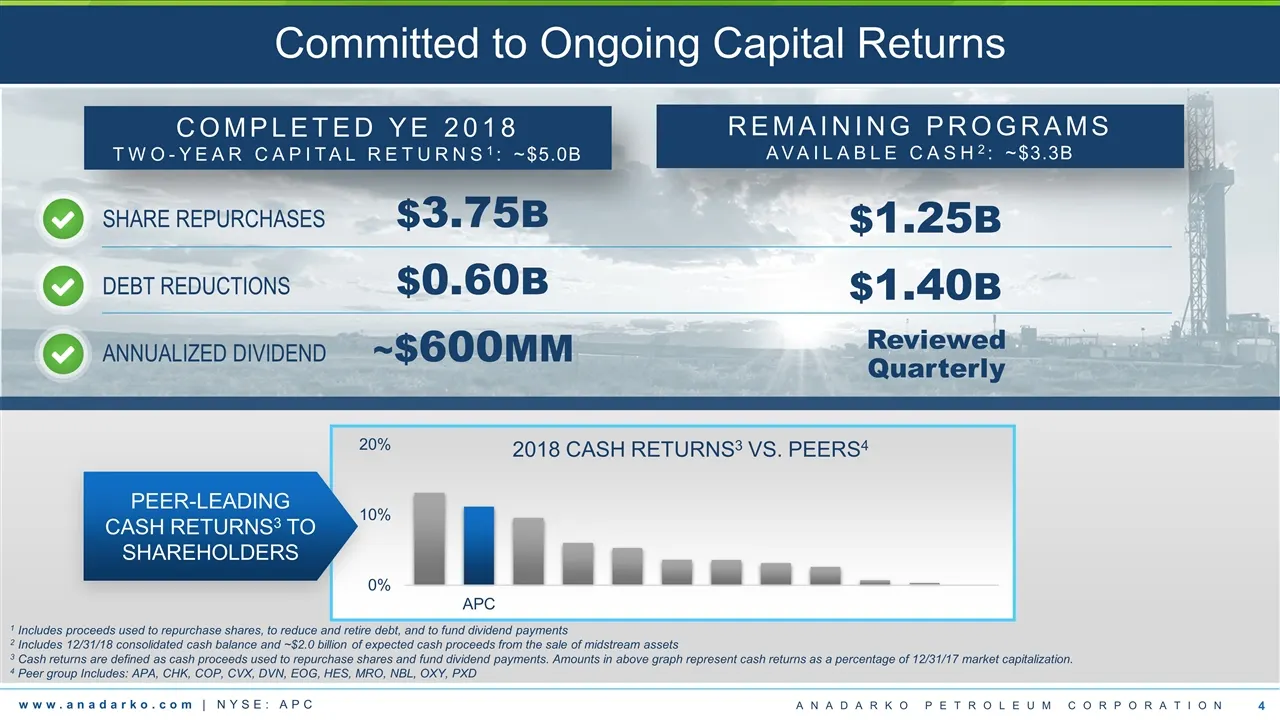
SHARE REPURCHASES$3.75B DEBT REDUCTIONS$0.60B ANNUALIZED DIVIDEND~$600MM Committed to Ongoing Capital Returns 1 Includes proceeds used to repurchase shares, to reduce and retire debt, and to fund dividend payments 2 Includes 12/31/18 consolidated cash balance and ~$2.0 billion of expected cash proce
Slide 5: Discipline Drives Free Cash Flow Yield
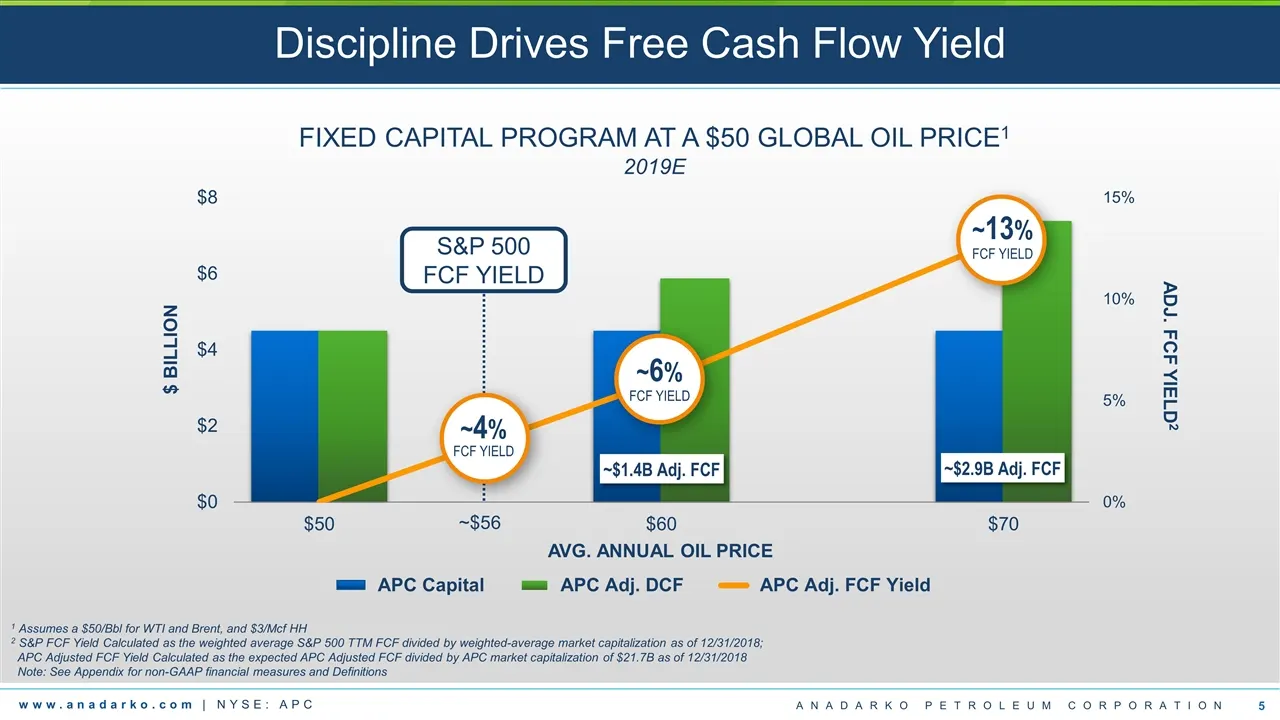
Discipline Drives Free Cash Flow Yield 1 Assumes a $50/Bbl for WTI and Brent, and $3/Mcf HH 2 S&P FCF Yield Calculated as the weighted average S&P 500 TTM FCF divided by weighted-average market capitalization as of 12/31/2018; APC Adjusted FCF Yield Calculated as the expected APC Adjusted FCF divide
Slide 6: Capital Efficiency Lowers Free Cash Flow Breakeven
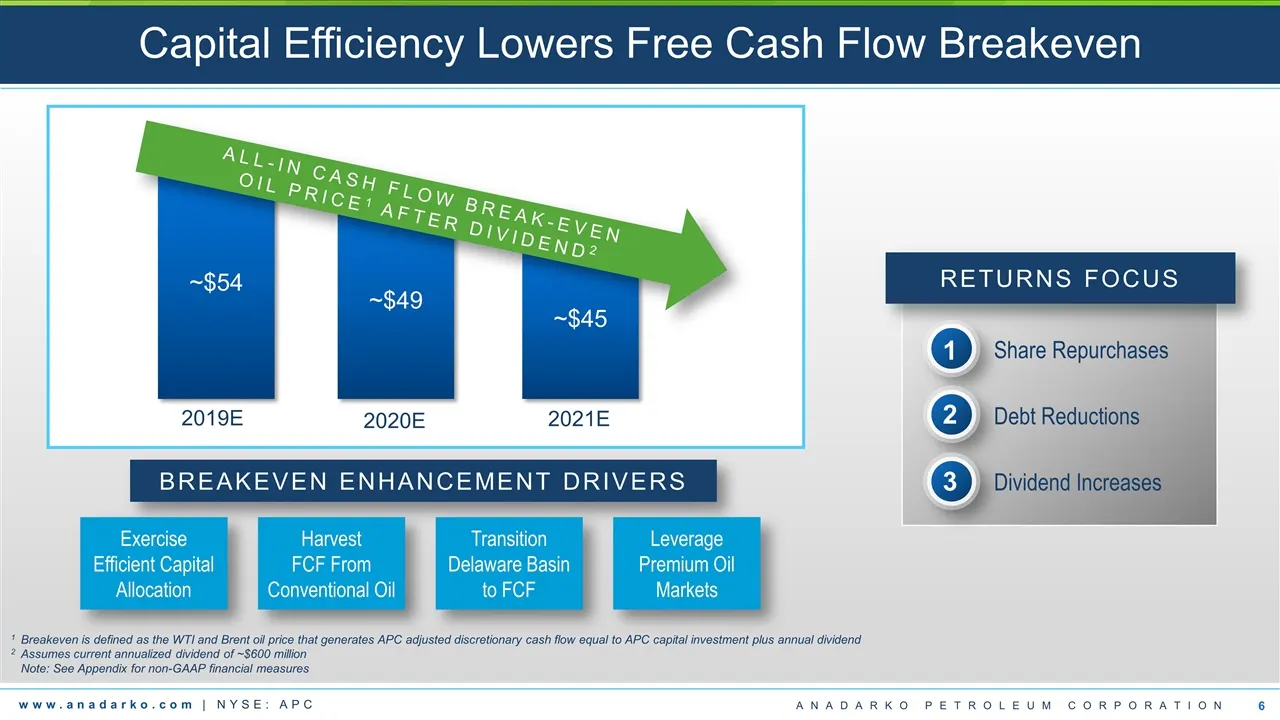
Capital Efficiency Lowers Free Cash Flow Breakeven BREAKEVEN ENHANCEMENT DRIVERS RETURNS FOCUS Leverage Premium Oil Markets Transition Delaware Basin to FCF Harvest FCF From Conventional Oil Exercise Efficient Capital Allocation Share Repurchases Debt Reductions Dividend Increases 1 2 3 ~$54 ~$49 ~$
Slide 7: Leverage to Premium Oil Markets
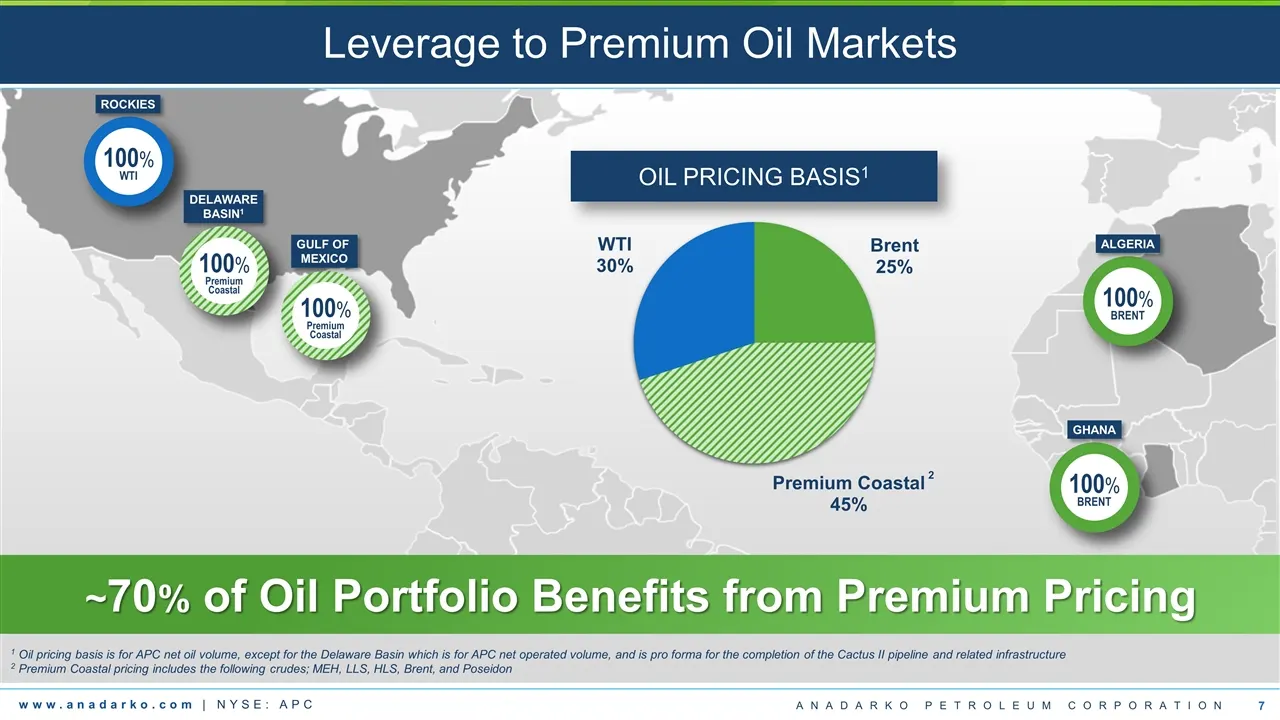
Leverage to Premium Oil Markets ~70% of Oil Portfolio Benefits from Premium Pricing OIL PRICING BASIS1 1 Oil pricing basis is for APC net oil volume, except for the Delaware Basin which is for APC net operated volume, and is pro forma for the completion of the Cactus II pipeline and related infrastr
Slide 8: Balance Sheet Strength
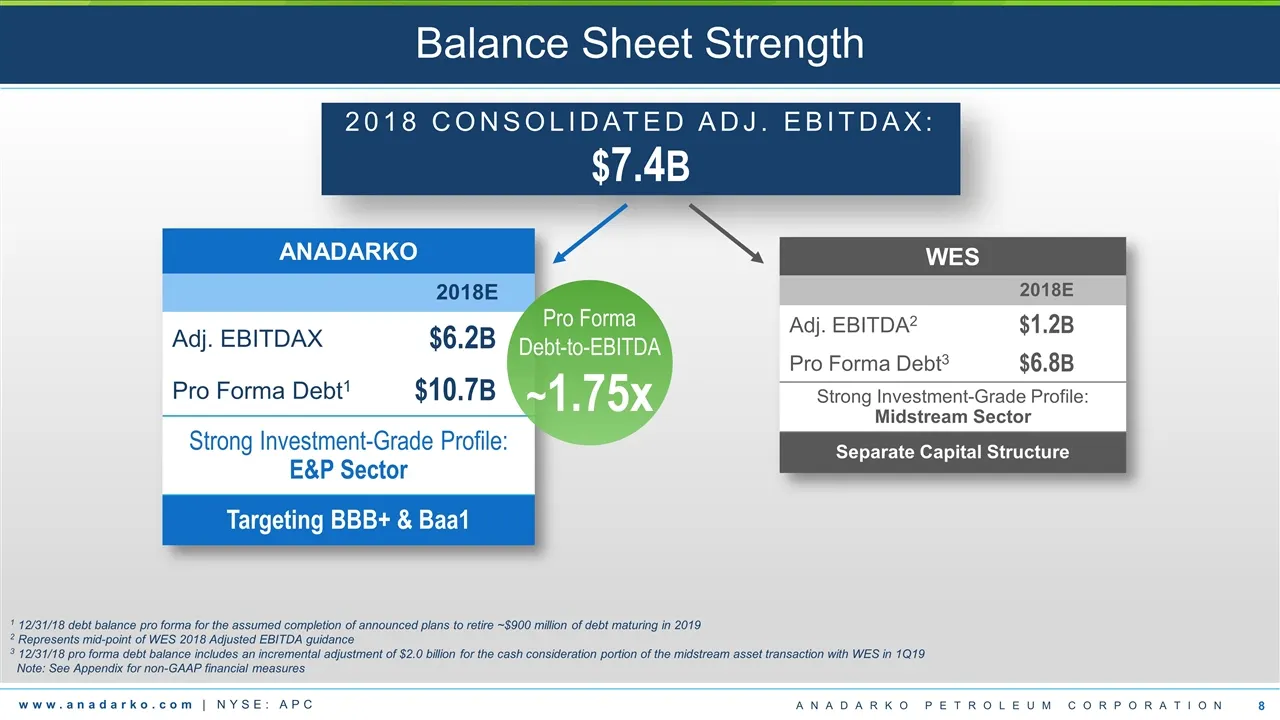
Balance Sheet Strength 2018 CONSOLIDATED ADJ. EBITDAX: $7.4B ANADARKO 2018E Adj. EBITDAX $6.2B Pro Forma Debt1 $10.7B Strong Investment-Grade Profile: E&P Sector Targeting BBB+ & Baa1 Pro Forma Debt-to-EBITDA ~1.75x WES 2018E Adj. EBITDA2 $1.2B Pro Forma Debt3 $6.8B Strong Investment-Grade Profile:
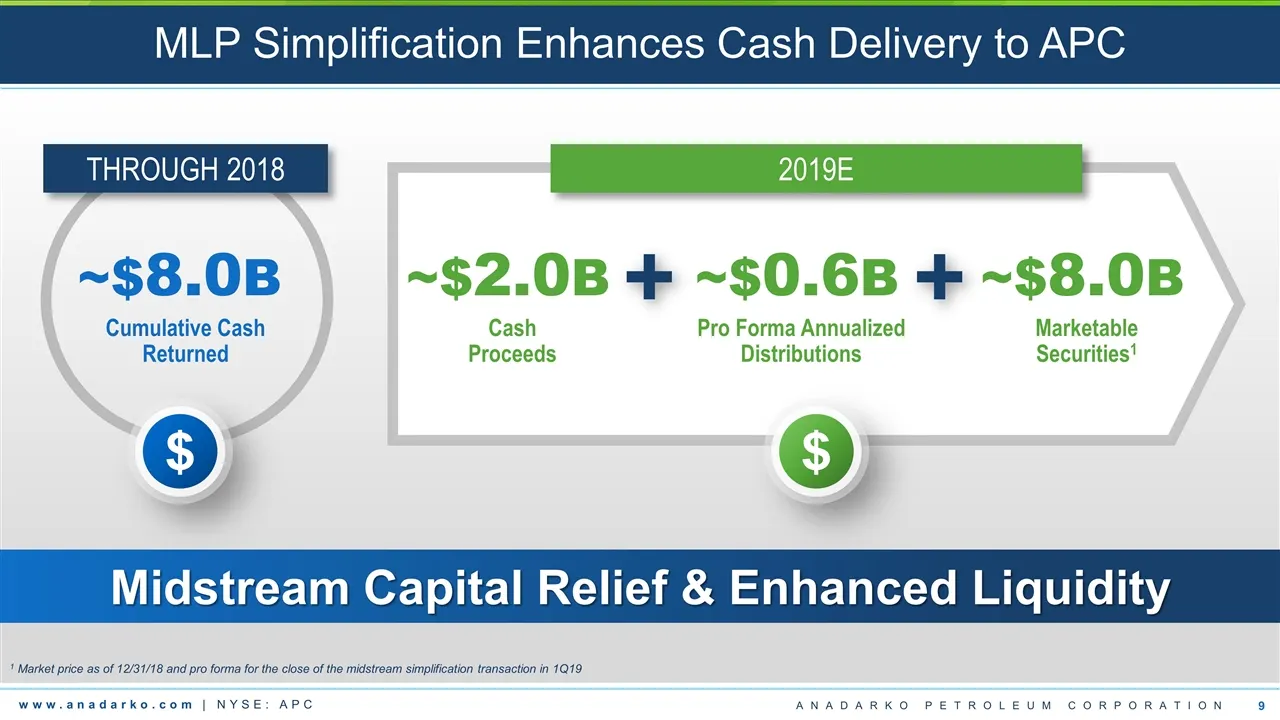
Slide 9: MLP Simplification Enhances Cash Delivery to APC
MLP Simplification Enhances Cash Delivery to APC Cumulative Cash Returned ~$8.0B THROUGH 2018 Marketable Securities1 ~$8.0B ~$2.0B Cash Proceeds ~$0.6B Pro Forma Annualized Distributions 1 Market price as of 12/31/18 and pro forma for the close of the midstream simplification transaction in 1Q19 201
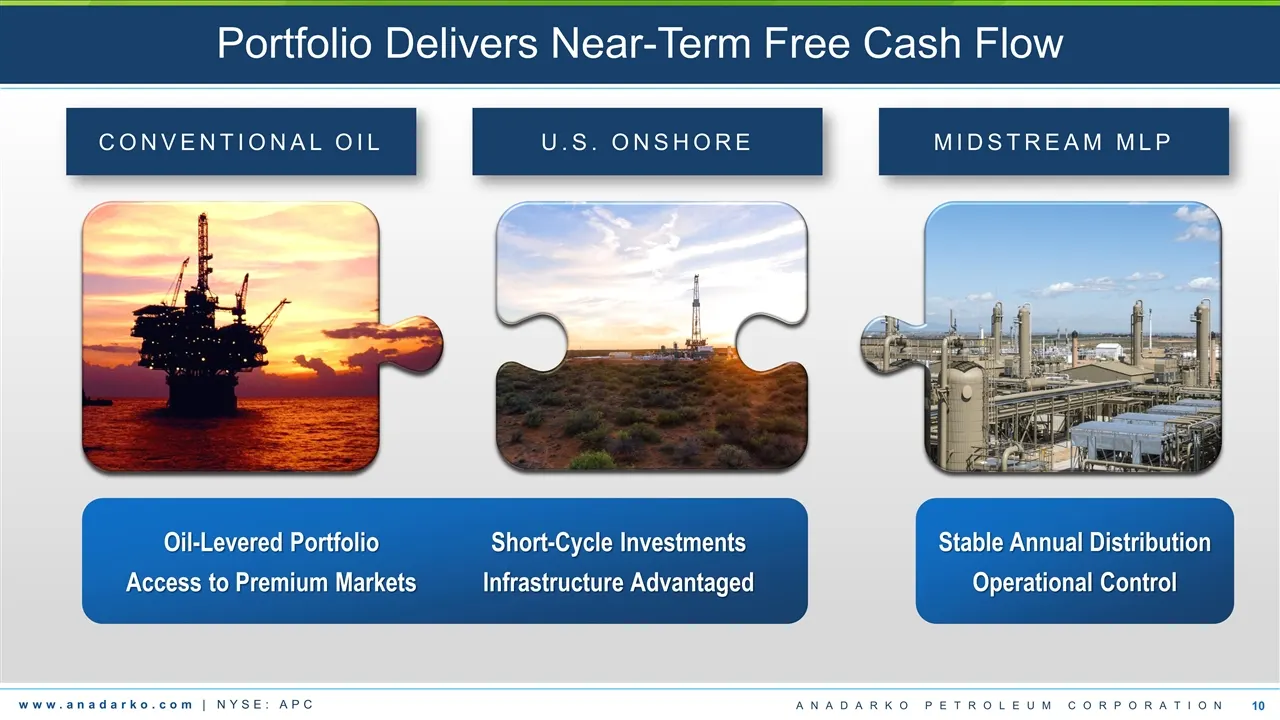
Slide 10: Portfolio Delivers Near-Term Free Cash Flow
Portfolio Delivers Near-Term Free Cash Flow U.S. ONSHORE CONVENTIONAL OIL MIDSTREAM MLP Stable Annual Distribution Operational Control Oil-Levered Portfolio Access to Premium Markets Short-Cycle Investments Infrastructure Advantaged
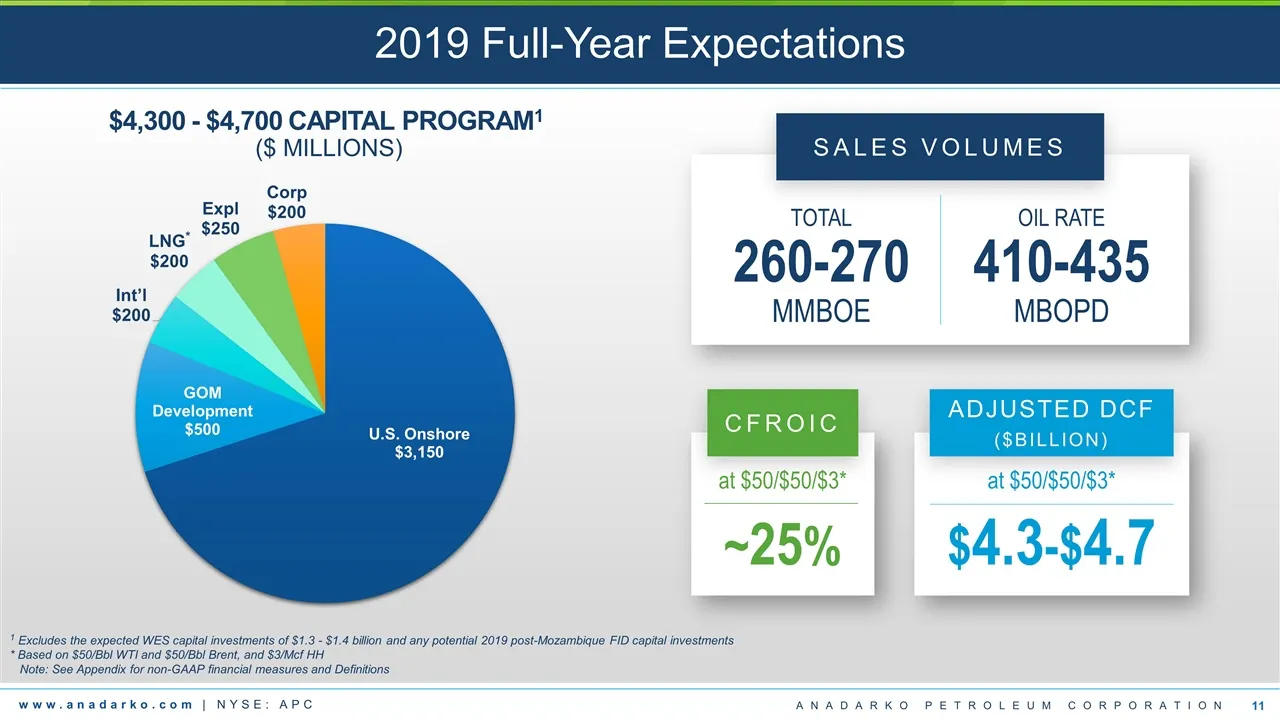
Slide 11: 2019 Full-Year Expectations
2019 Full-Year Expectations TOTALOIL RATE 260-270 410-435 MMBOEMBOPD SALES VOLUMES 1 Excludes the expected WES capital investments of $1.3 - $1.4 billion and any potential 2019 post-Mozambique FID capital investments * Based on $50/Bbl WTI and $50/Bbl Brent, and $3/Mcf HH Note: See Appendix for non-
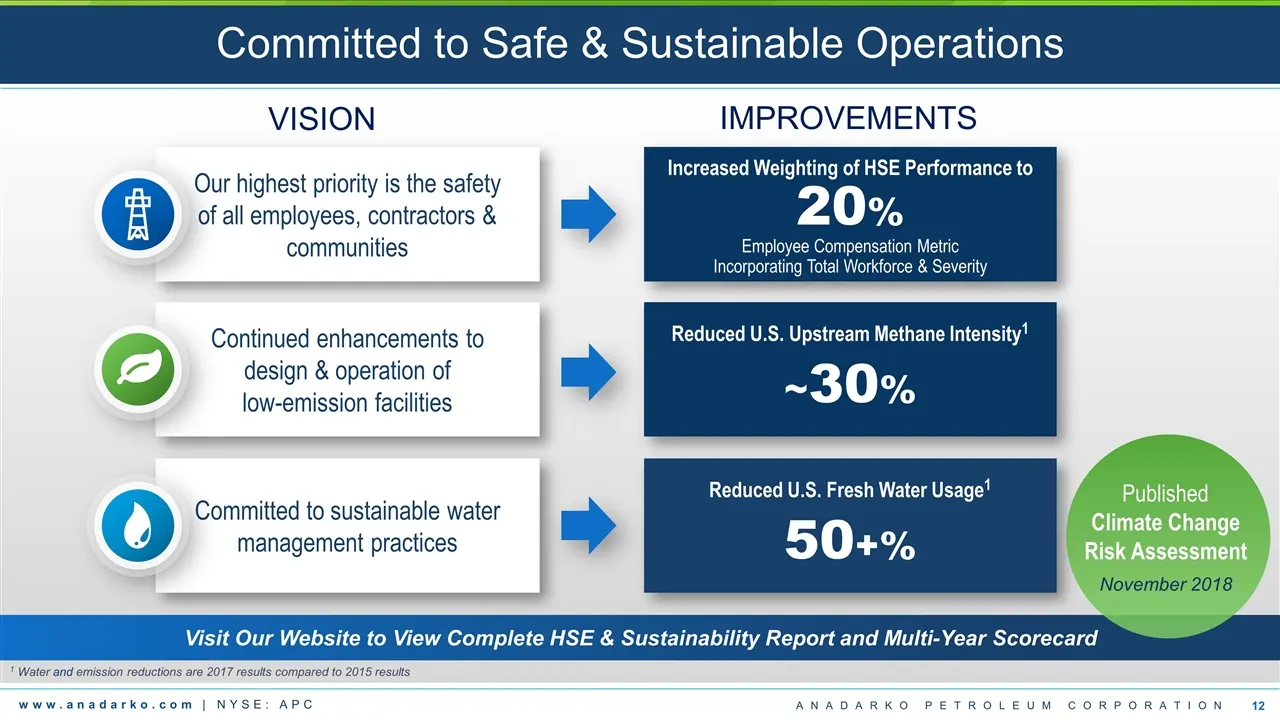
Slide 12: Committed to Safe & Sustainable Operations
Reduced U.S. Upstream Methane Intensity1 ~30% Continued enhancements to design & operation of low-emission facilities Visit Our Website to View Complete HSE & Sustainability Report and Multi-Year Scorecard Committed to Safe & Sustainable Operations VISION IMPROVEMENTS Increased Weighting of HSE Perf
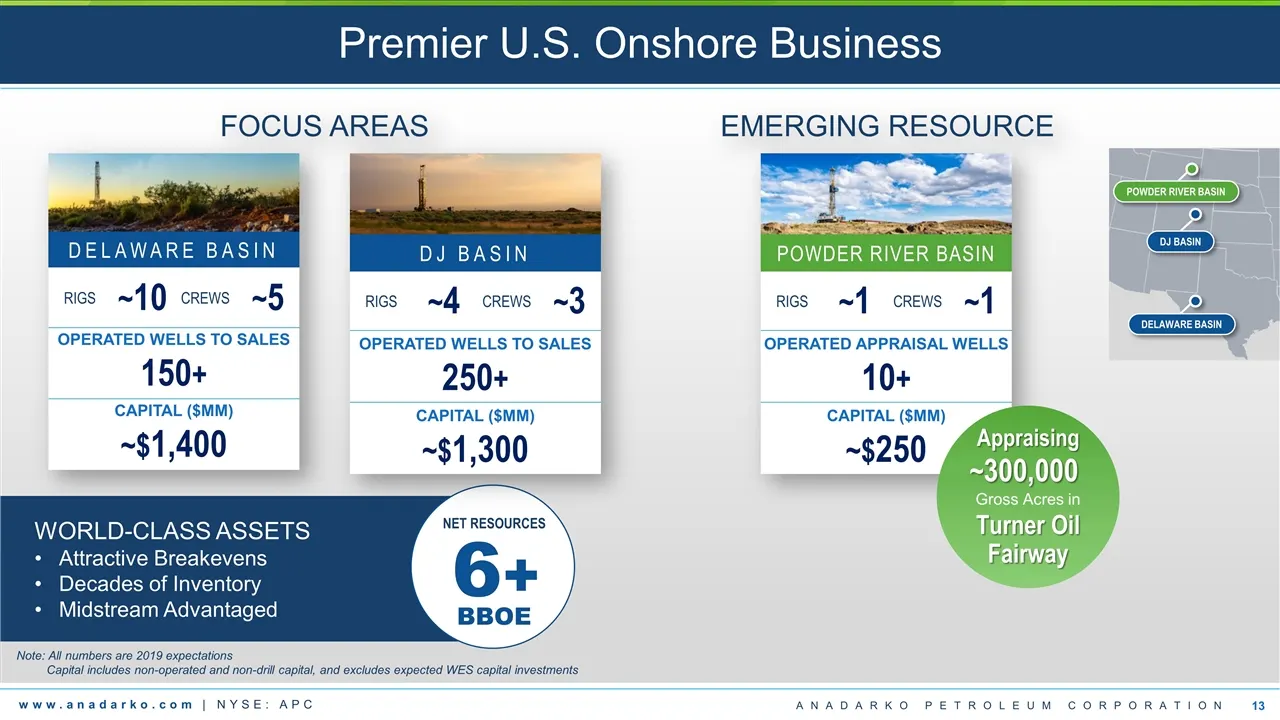
Slide 13: Premier U.S. Onshore Business
Premier U.S. Onshore Business WORLD-CLASS ASSETS Attractive Breakevens Decades of Inventory Midstream Advantaged 6+ BBOE NET RESOURCES FOCUS AREAS EMERGING RESOURCE DELAWARE BASIN RIGS ~10 CREWS ~5 OPERATED WELLS TO SALES 150+ CAPITAL ($MM) ~$1,400 DJ BASIN RIGS ~4 CREWS ~3 OPERATED WELLS TO SALES 2
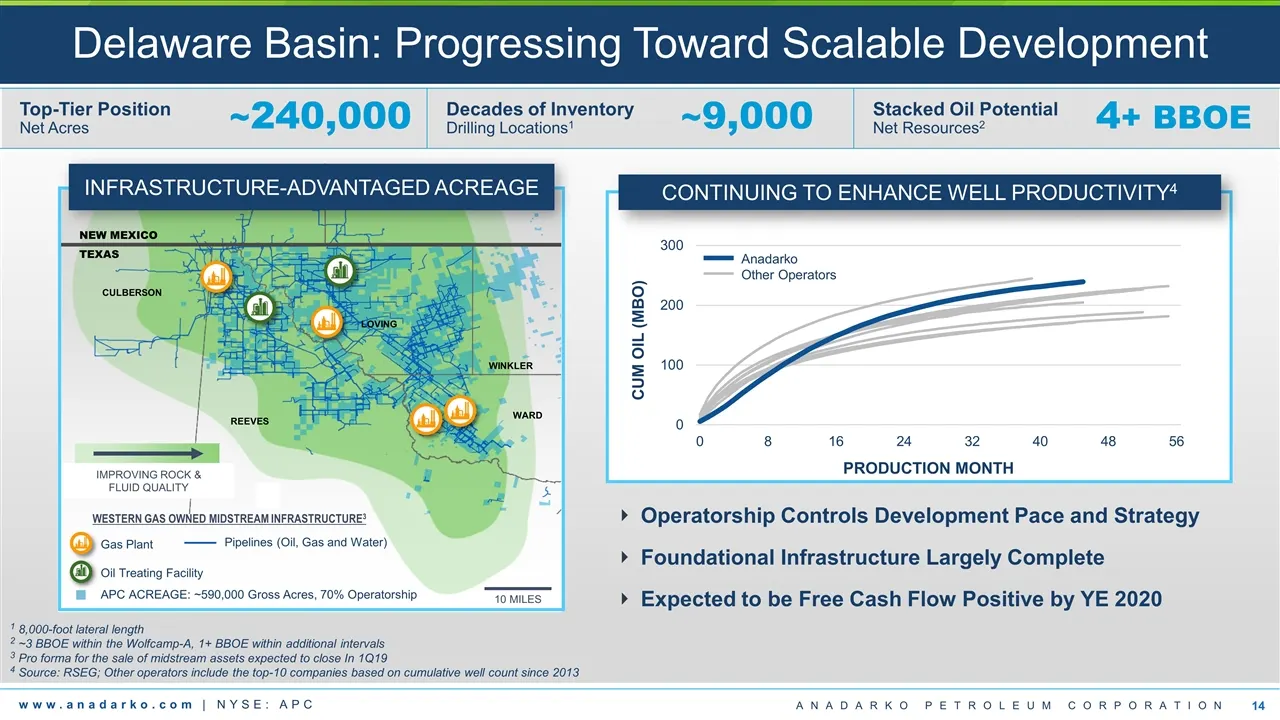
Slide 14: Delaware Basin: Progressing Toward Scalable Development
CUM OIL (MBO) PRODUCTION MONTH CONTINUING TO ENHANCE WELL PRODUCTIVITY4 Operatorship Controls Development Pace and Strategy Foundational Infrastructure Largely Complete Expected to be Free Cash Flow Positive by YE 2020 Delaware Basin: Progressing Toward Scalable Development 1 8,000-foot lateral leng
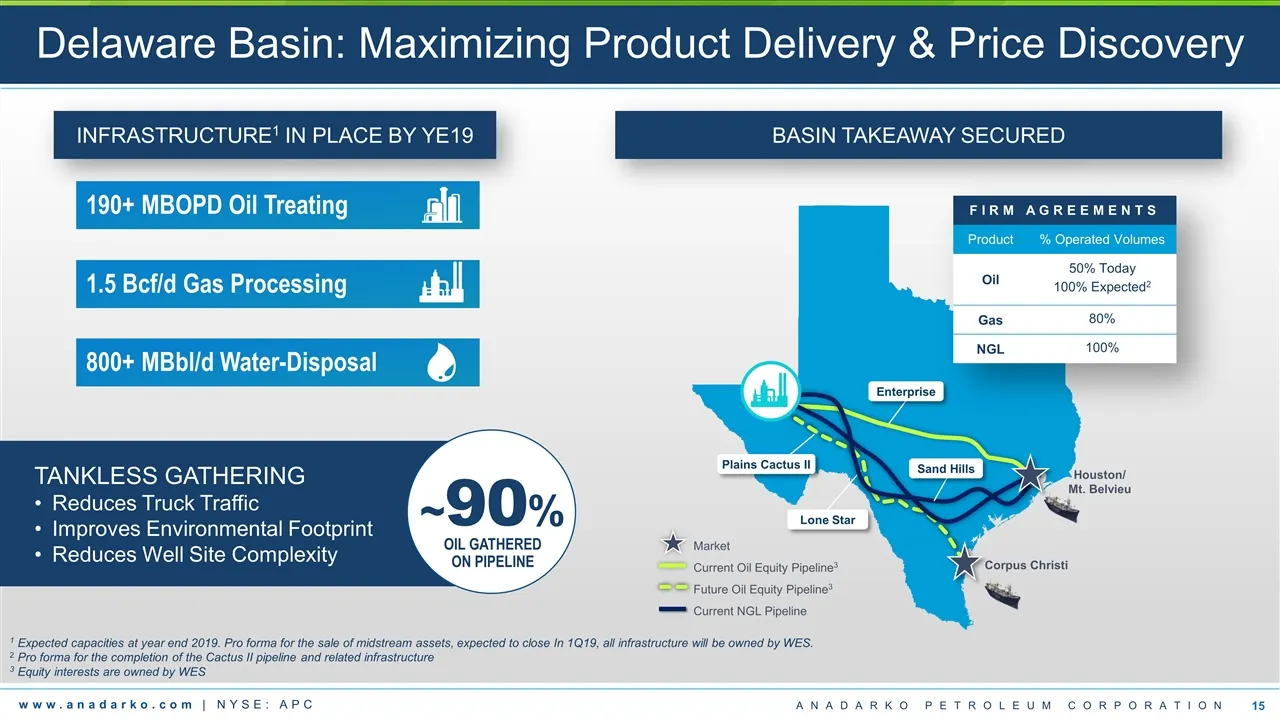
Slide 15: Delaware Basin: Maximizing Product Delivery & Price Discovery
Market Current Oil Equity Pipeline3 Future Oil Equity Pipeline3 Current NGL Pipeline Houston/ Mt. Belvieu Corpus Christi Lone Star Plains Cactus II Enterprise Sand Hills BASIN TAKEAWAY SECURED Delaware Basin: Maximizing Product Delivery & Price Discovery 1 Expected capacities at year end 2019. Pro f
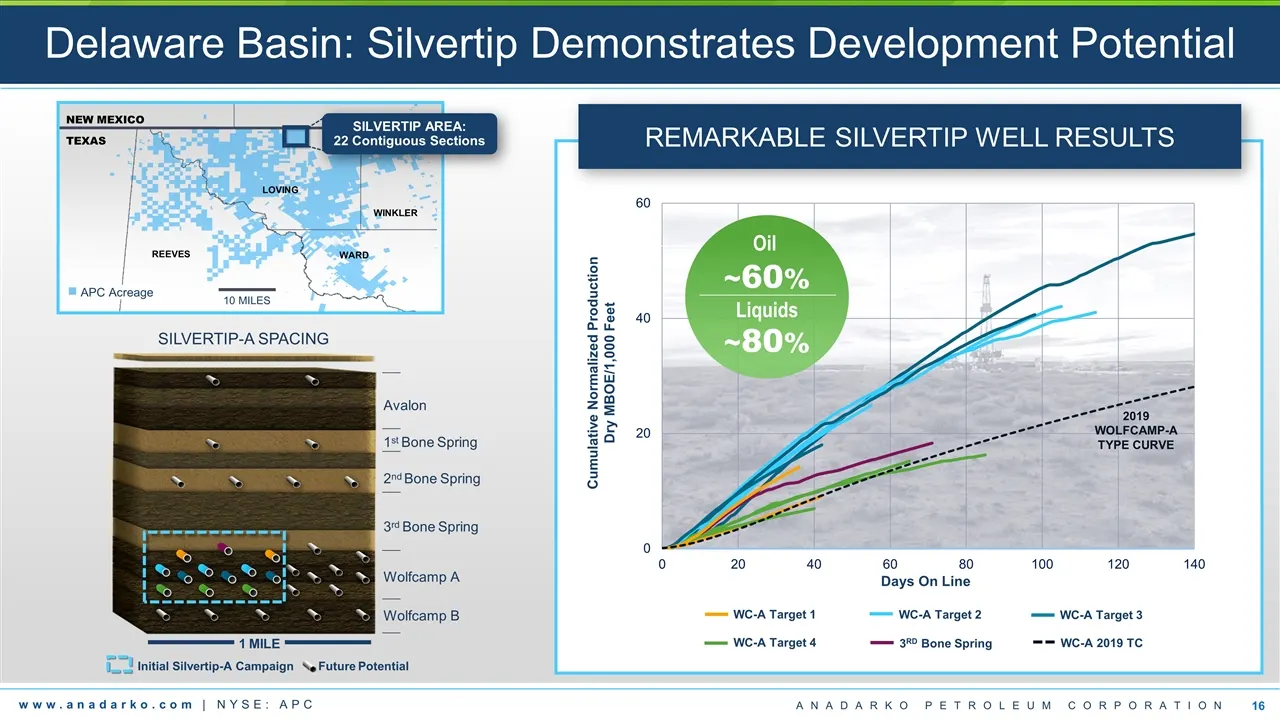
Slide 16: Delaware Basin: Silvertip Demonstrates Development Potential
Delaware Basin: Silvertip Demonstrates Development Potential Avalon 1st Bone Spring 2nd Bone Spring 3rd Bone Spring Wolfcamp A Wolfcamp B SILVERTIP-A SPACING Future Potential Initial Silvertip-A Campaign 1 MILE REEVES LOVING WINKLER WARD APC Acreage 10 MILES NEW MEXICO TEXAS SILVERTIP AREA: 22 Conti
Slide 17: Delaware Basin: Wolfcamp-A Economics
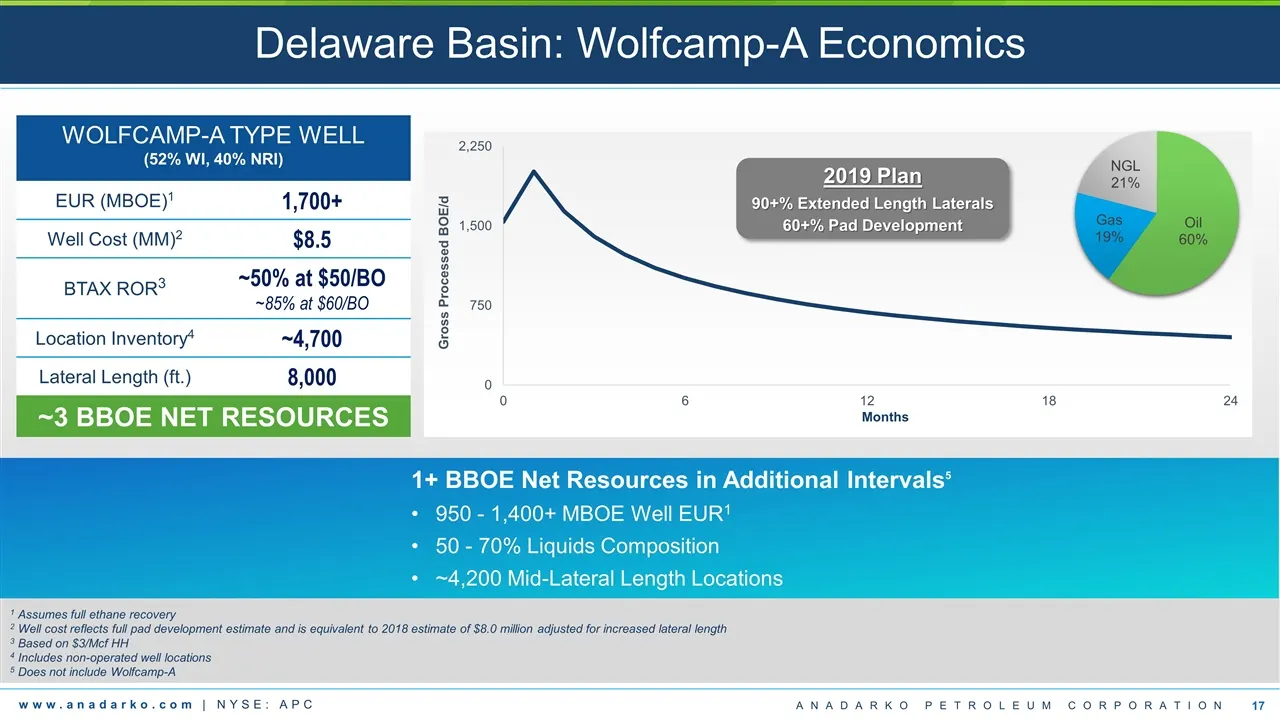
Delaware Basin: Wolfcamp-A Economics 1 Assumes full ethane recovery 2 Well cost reflects full pad development estimate and is equivalent to 2018 estimate of $8.0 million adjusted for increased lateral length 3 Based on $3/Mcf HH 4 Includes non-operated well locations 5 Does not include Wolfcamp-A WO
Slide 18: DJ Basin: Competitive Advantages Improve Cash Flow
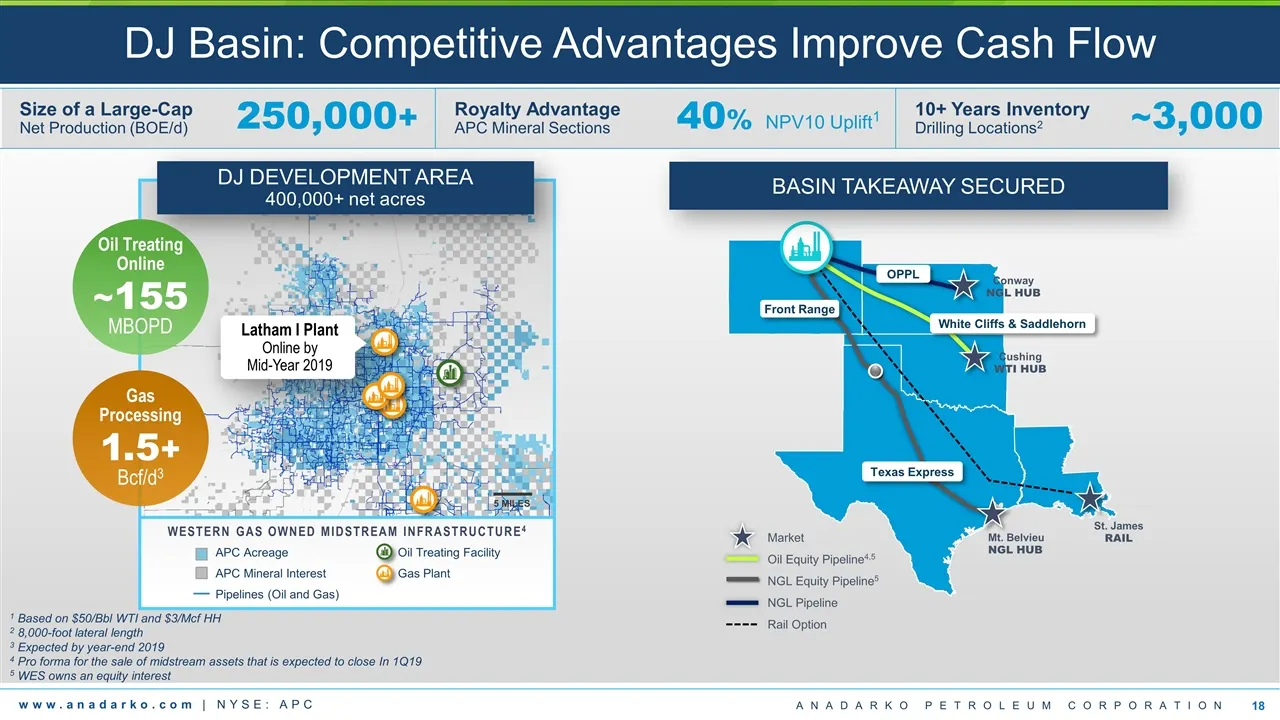
DJ Basin: Competitive Advantages Improve Cash Flow Size of a Large-Cap Net Production (BOE/d) 250,000+ Royalty Advantage APC Mineral Sections 40% NPV10 Uplift1 10+ Years Inventory Drilling Locations2 ~3,000 OPPL Mt. Belvieu NGL HUB Cushing WTI HUB Conway NGL HUB Market Oil Equity Pipeline4,5 NGL Equ
Slide 19: DJ Basin: Development Economics
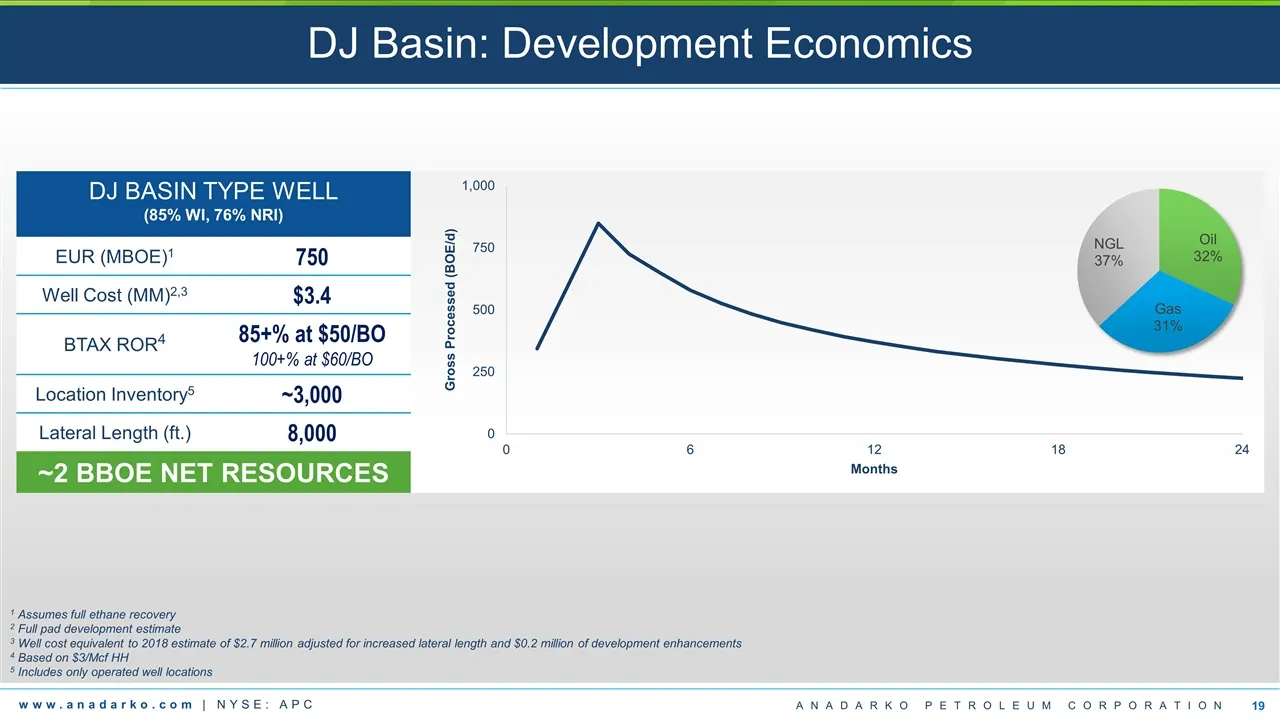
DJ Basin: Development Economics DJ BASIN TYPE WELL (85% WI, 76% NRI) EUR (MBOE)1 750 Well Cost (MM)2,3 $3.4 BTAX ROR4 85+% at $50/BO 100+% at $60/BO Location Inventory5 ~3,000 Lateral Length (ft.) 8,000 ~2 BBOE NET RESOURCES 1 Assumes full ethane recovery 2 Full pad development estimate 3 Well cost
Slide 20: PRB: Strategically Built Position
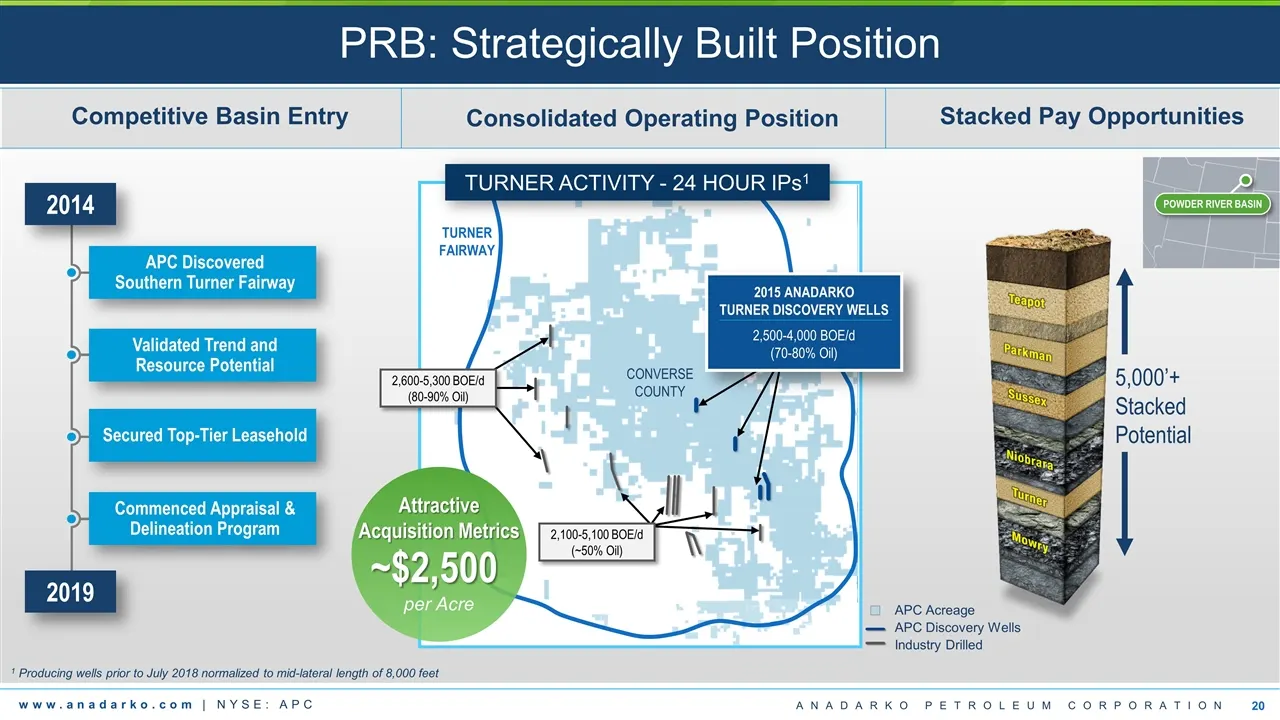
PRB: Strategically Built Position Competitive Basin Entry Consolidated Operating Position Stacked Pay Opportunities 5,000’+ Stacked Potential CONVERSE COUNTY 1 Producing wells prior to July 2018 normalized to mid-lateral length of 8,000 feet 2015 ANADARKO TURNER DISCOVERY WELLS 2,500-4,000 BOE/d (70
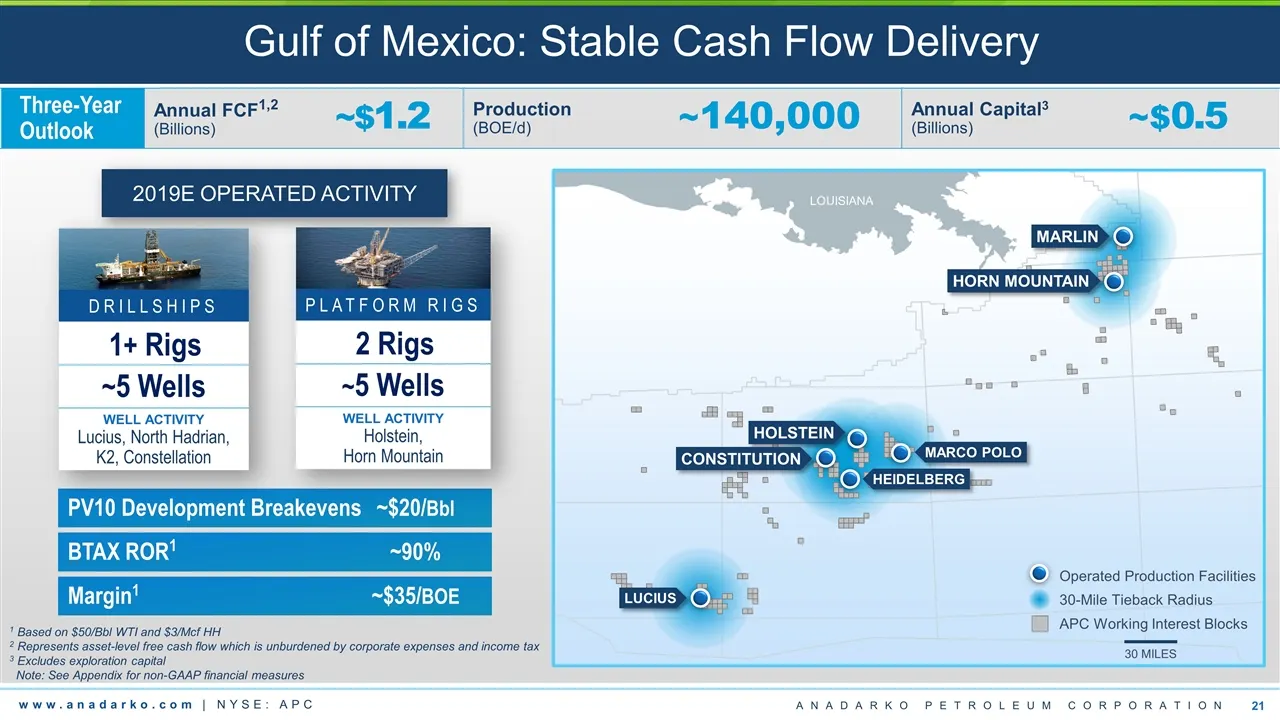
Slide 21: Gulf of Mexico: Stable Cash Flow Delivery
Gulf of Mexico: Stable Cash Flow Delivery LOUISIANA HEIDELBERG MARCO POLO HOLSTEIN HORN MOUNTAIN MARLIN CONSTITUTION LUCIUS Three-Year Outlook Annual FCF1,2 (Billions) ~$1.2 Production (BOE/d) ~140,000 Annual Capital3 (Billions) ~$0.5 2019E OPERATED ACTIVITY PV10 Development Breakevens~$20/Bbl 30 MI
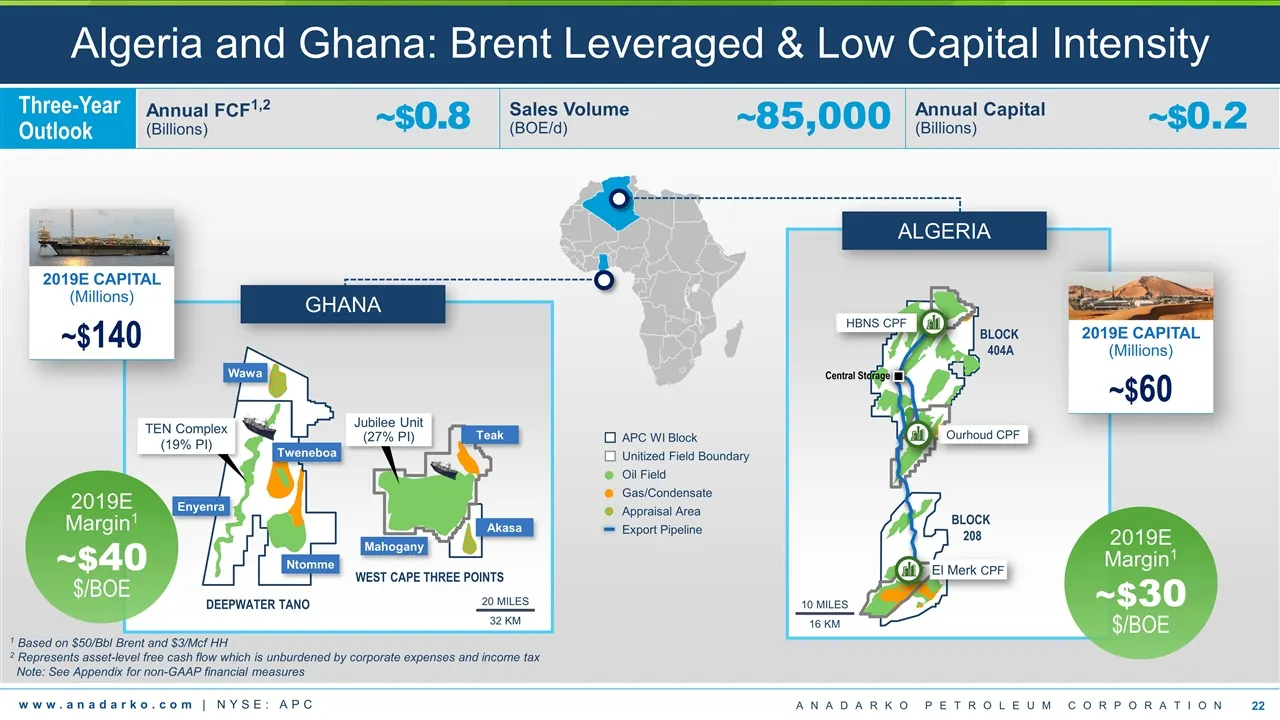
Slide 22: Algeria and Ghana: Brent Leveraged & Low Capital Intensity
Algeria and Ghana: Brent Leveraged & Low Capital Intensity APC WI Block Unitized Field Boundary Oil Field Gas/Condensate Appraisal Area Export Pipeline BLOCK 404A BLOCK 208 HBNS CPF Ourhoud CPF El Merk CPF ALGERIA 2019E CAPITAL (Millions) ~$60 WEST CAPE THREE POINTS Mahogany Akasa Teak Jubilee Unit
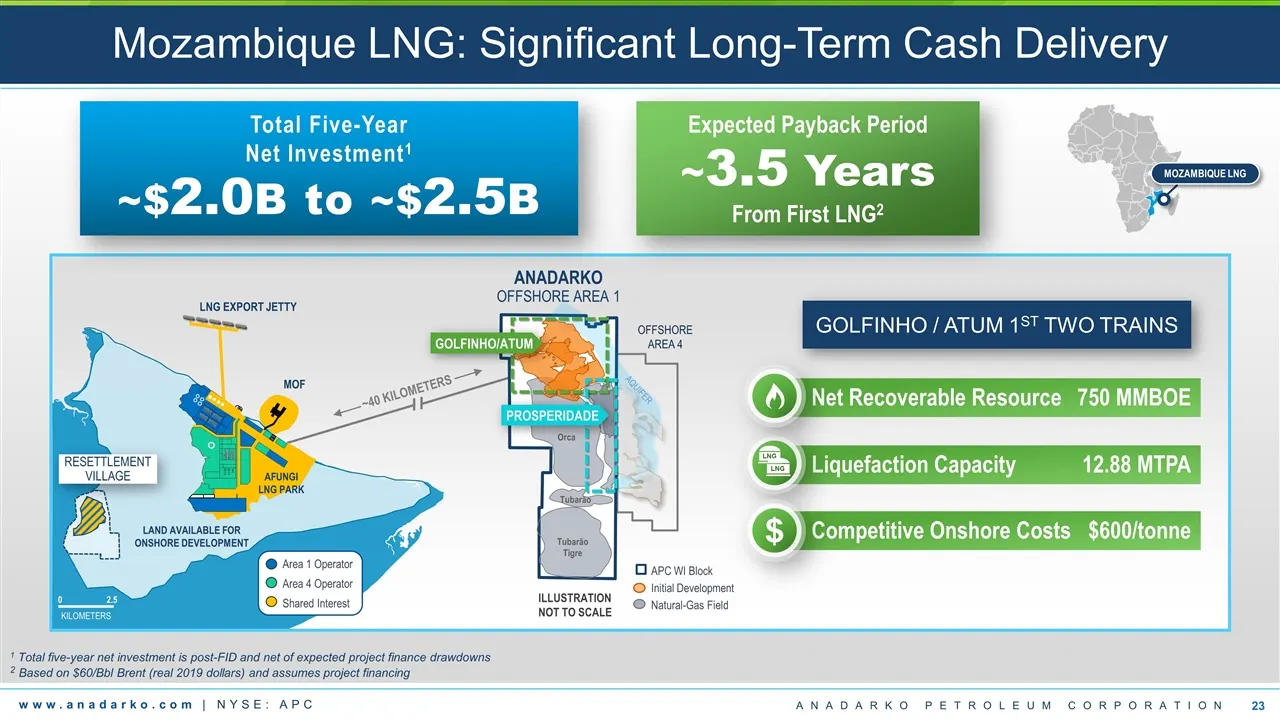
Slide 23: Mozambique LNG: Significant Long-Term Cash Delivery
Mozambique LNG: Significant Long-Term Cash Delivery 1 Total five-year net investment is post-FID and net of expected project finance drawdowns 2 Based on $60/Bbl Brent (real 2019 dollars) and assumes project financing OFFSHORE AREA 4 ILLUSTRATION NOT TO SCALE ANADARKO OFFSHORE AREA 1 Orca Tubarão Tu
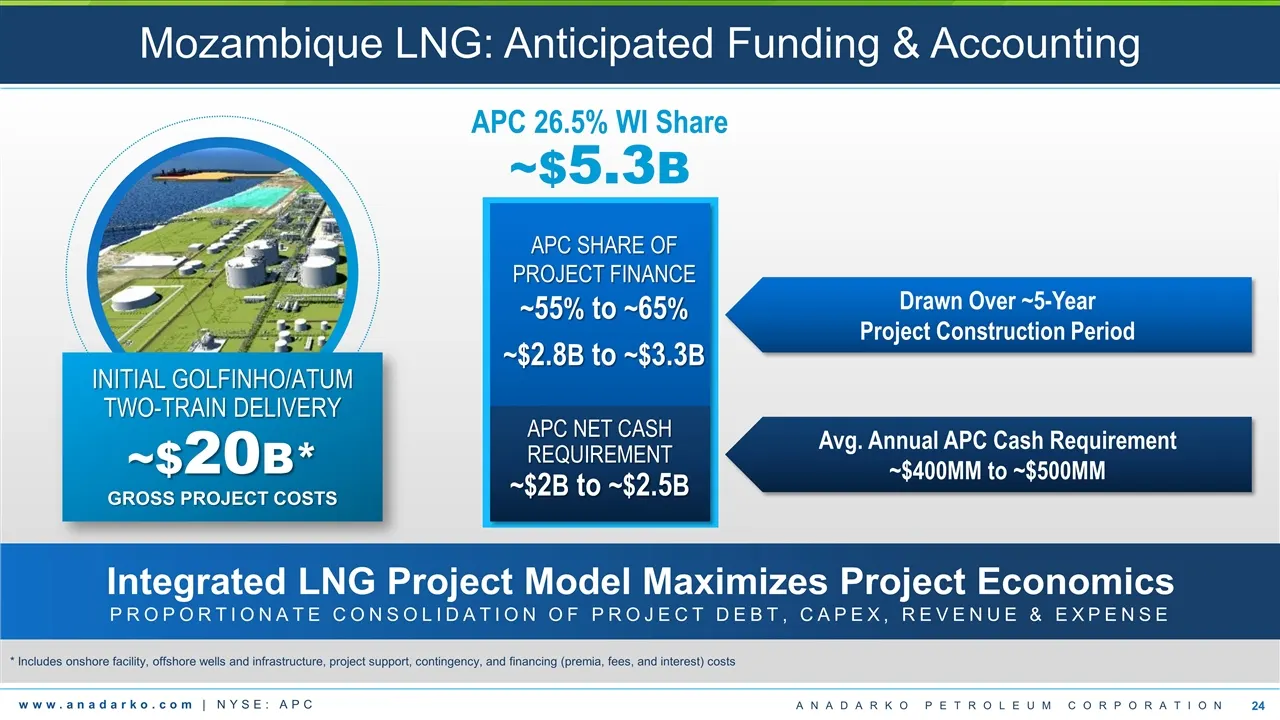
Slide 24: Mozambique LNG: Anticipated Funding & Accounting
Avg. Annual APC Cash Requirement ~$400MM to ~$500MM Mozambique LNG: Anticipated Funding & Accounting * Includes onshore facility, offshore wells and infrastructure, project support, contingency, and financing (premia, fees, and interest) costs INITIAL GOLFINHO/ATUM TWO-TRAIN DELIVERY ~$20B* GROSS PR
Slide 25: Mozambique LNG: Line of Sight to FID
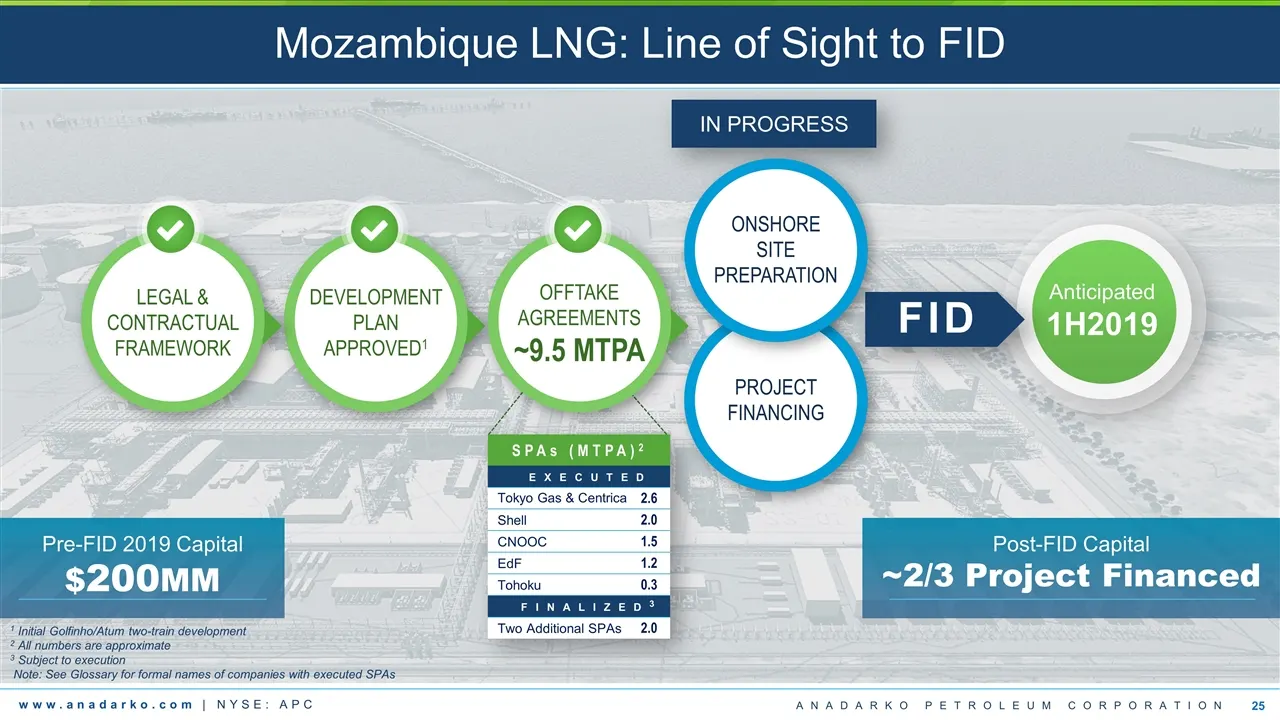
DEVELOPMENT PLAN APPROVED1 Mozambique LNG: Line of Sight to FID LEGAL & CONTRACTUAL FRAMEWORK IN PROGRESS Anticipated 1H2019 FID 1 Initial Golfinho/Atum two-train development 2 All numbers are approximate 3 Subject to execution Note: See Glossary for formal names of companies with executed SPAs Post
Slide 26: Appendix
ANADARKO PETROLEUM CORPORATION APPENDIX MIKE PEARL Senior Vice President 832 636 3271 KATE SLOAN Director JON VANDENBRAND 332 636 1007
Slide 27: Divested Sales-Volume Summary
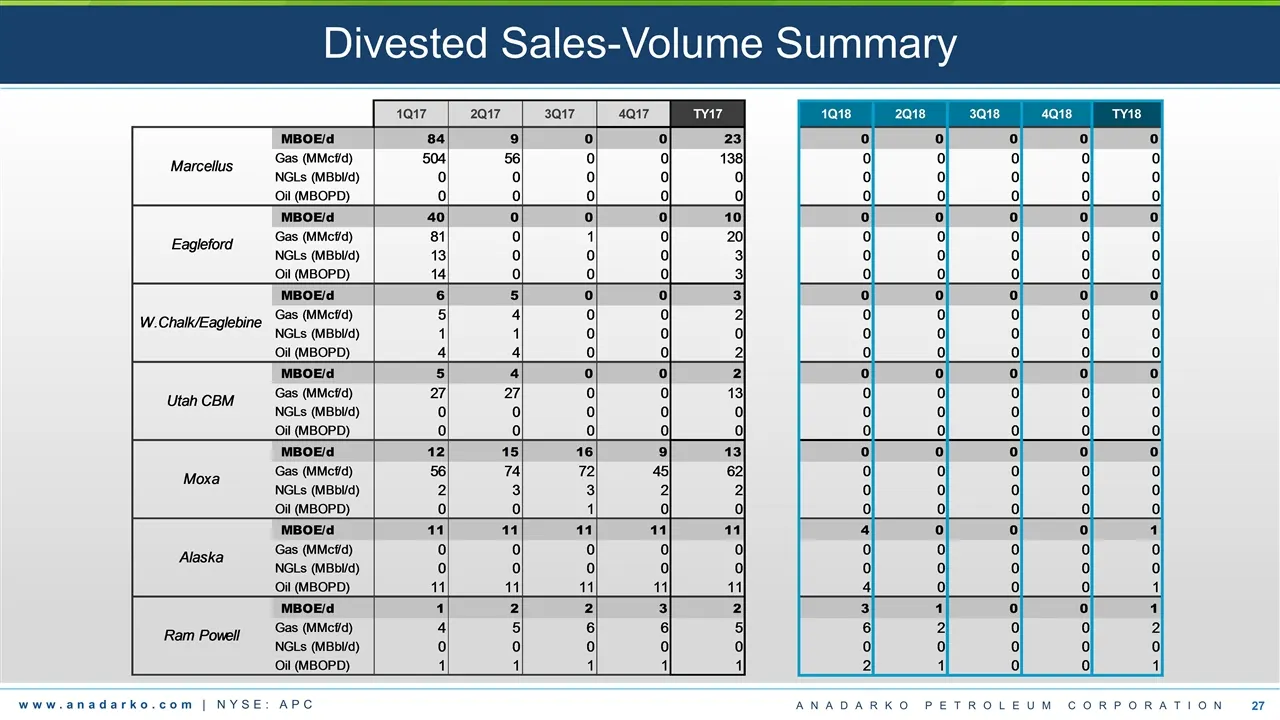
Divested Sales-Volume Summary
Slide 28: Non-GAAP Financial Measures; Management Estimates & Assumptions
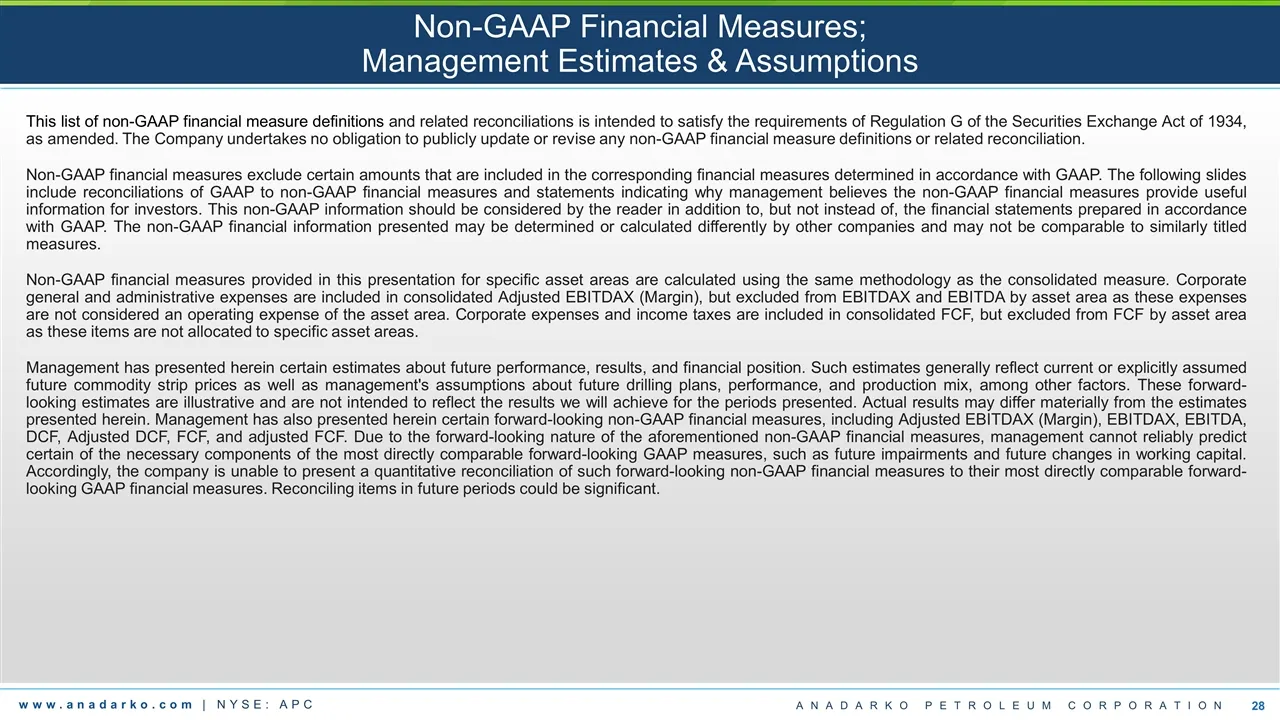
Non-GAAP Financial Measures; Management Estimates & Assumptions This list of non-GAAP financial measure definitions and related reconciliations is intended to satisfy the requirements of Regulation G of the Securities Exchange Act of 1934, as amended. The Company undertakes no obligation to publicly
Slide 29: Non-GAAP Financial Measures: Adjusted EBITDAX
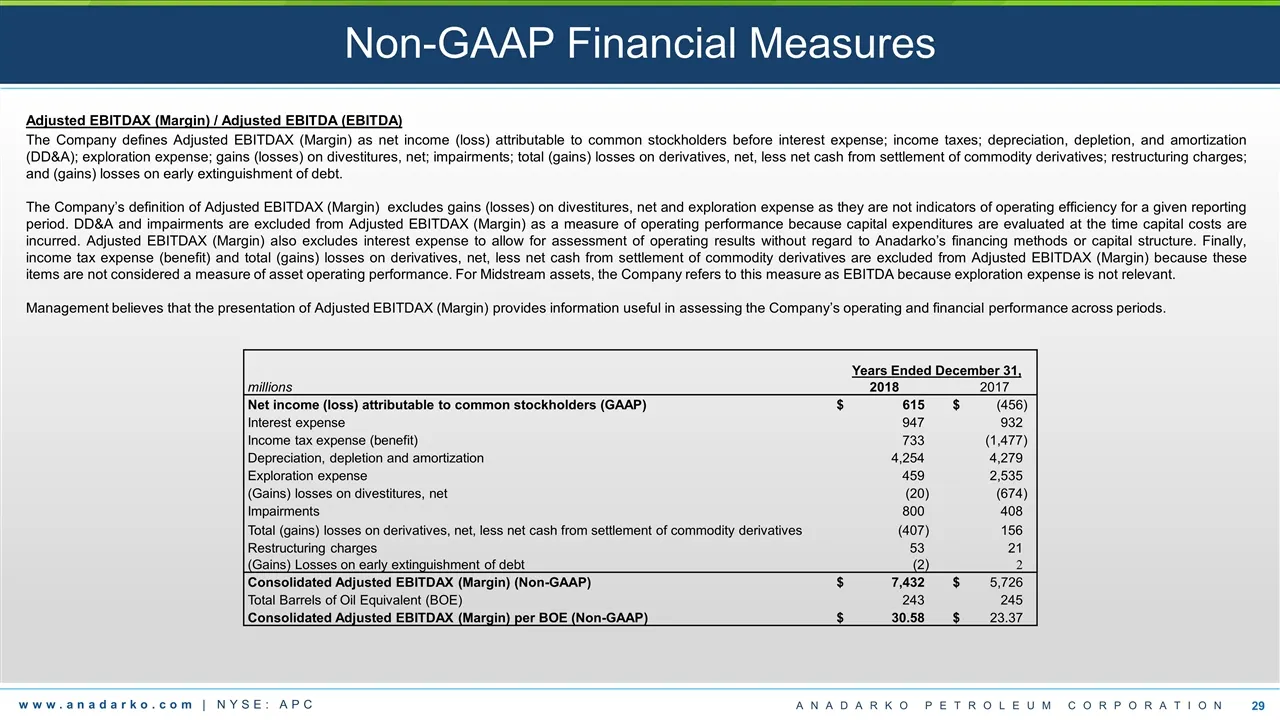
Non-GAAP Financial Measures Adjusted EBITDAX (Margin) / Adjusted EBITDA (EBITDA) The Company defines Adjusted EBITDAX (Margin) as net income (loss) attributable to common stockholders before interest expense; income taxes; depreciation, depletion, and amortization (DD&A); exploration expense; gains
Slide 30: Non-GAAP Financial Measures: DCF and Free Cash Flow
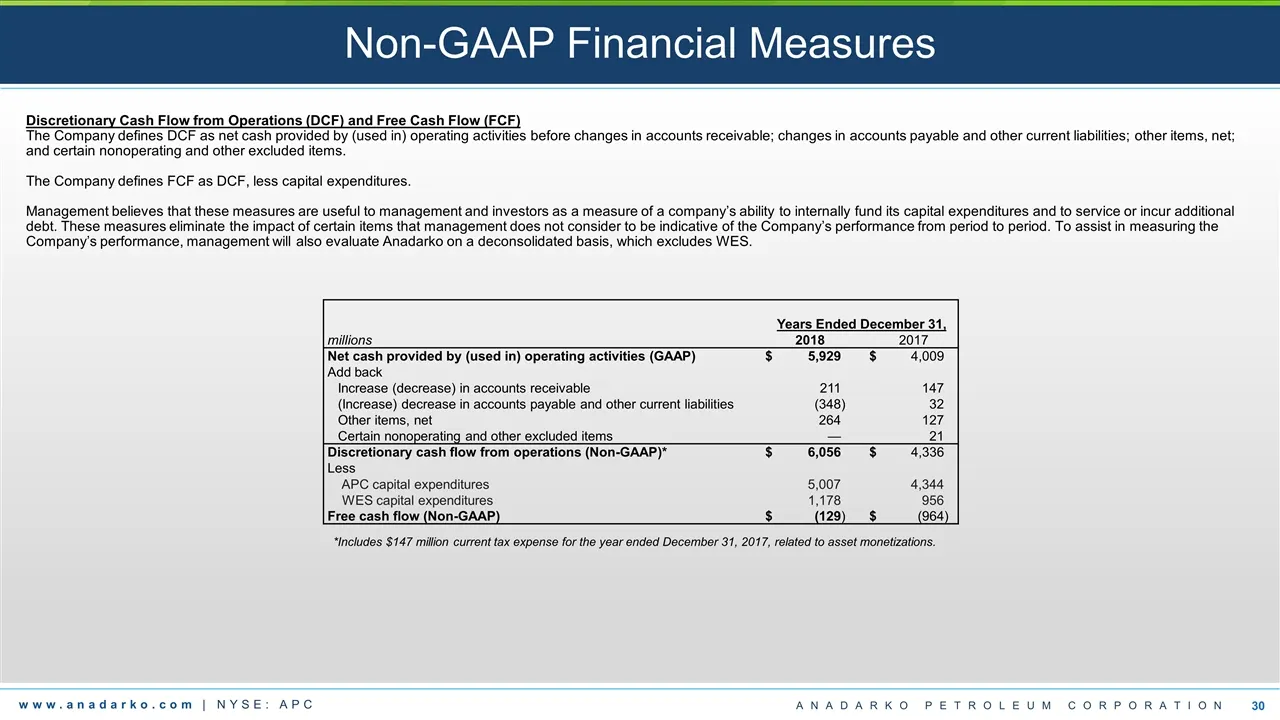
Non-GAAP Financial Measures Discretionary Cash Flow from Operations (DCF) and Free Cash Flow (FCF) The Company defines DCF as net cash provided by (used in) operating activities before changes in accounts receivable; changes in accounts payable and other current liabilities; other items, net; and ce
Slide 31: Adjusted Discretionary Cash Flow and Adjusted Free Cash Flow
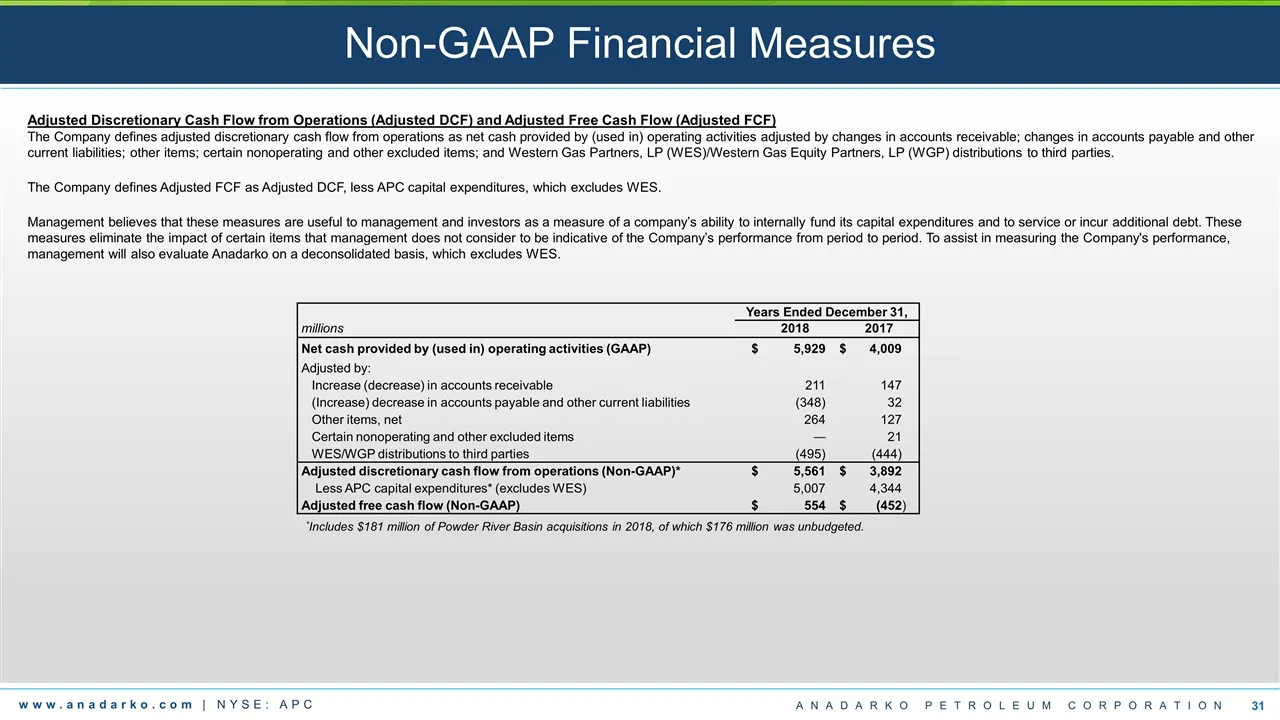
Adjusted Discretionary Cash Flow from Operations (Adjusted DCF) and Adjusted Free Cash Flow (Adjusted FCF) The Company defines adjusted discretionary cash flow from operations as net cash provided by (used in) operating activities adjusted by changes in accounts receivable; changes in accounts payab
Slide 32: Glossary of Abbreviations and Definitions
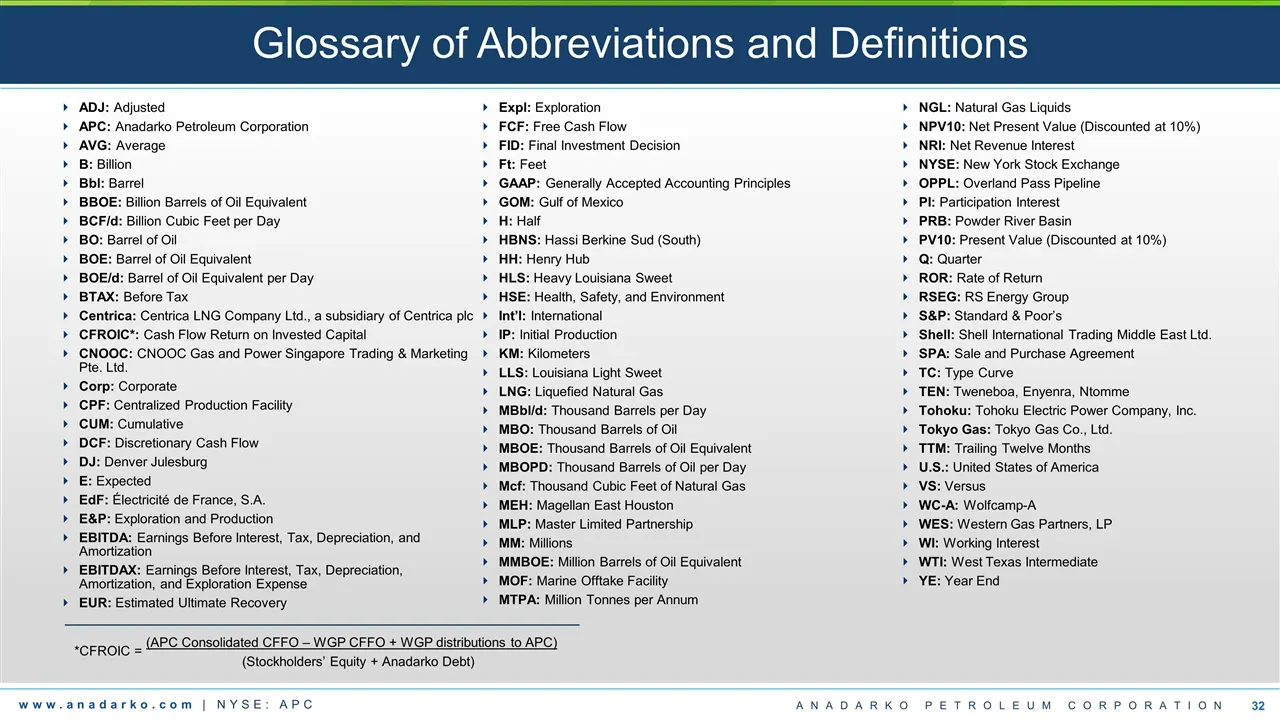
Glossary of Abbreviations and Definitions ADJ: Adjusted APC: Anadarko Petroleum Corporation AVG: Average B: Billion Bbl: Barrel BBOE: Billion Barrels of Oil Equivalent BCF/d: Billion Cubic Feet per Day BO: Barrel of Oil BOE: Barrel of Oil Equivalent BOE/d: Barrel of Oil Equivalent per Day BTAX: Befo
Source: SEC EDGAR · 8-K filed Feb 11, 2019
More decks from Anadarko Petroleum Corp
 Q2 2019 Earnings Presentation36 slides · Aug 1, 2019
 Merger or Acquisition (May 2019)45 slides · May 29, 2019
 Merger or Acquisition (May 2019)23 slides · May 6, 2019
 Q1 2019 Earnings Presentation20 slides · May 6, 2019
 Merger or Acquisition (April 2019)5 slides · Apr 24, 2019
 Merger or Acquisition (April 2019)29 slides · Apr 24, 2019