WashingtonFirst Bankshares Inc
WashingtonFirst Bankshares — Shareholder Meeting (April 2014)
26 slides from WashingtonFirst Bankshares's shareholder meeting presentation, Apr 29, 2014
Slide 1: Annual Shareholder Meeting April 29, 2014
Annual Shareholder Meeting April 29, 2014 The Tower Club, Tysons Corner NASDAQ: WFBI www.wfbi.com
Slide 2: Disclaimer
Disclaimer WashingtonFirst Bankshares, Inc. and Subsidiary (the “Company”) make forward-looking statements in this presentation that are subject to risks and uncertainties. These forward-looking statements include: statements of goals, intentions, earnings expectations, and other expectations; estim
Slide 3: Celebrating 10 years
Celebrating 10 years 3
Slide 4: The Early Years: 2004-2005
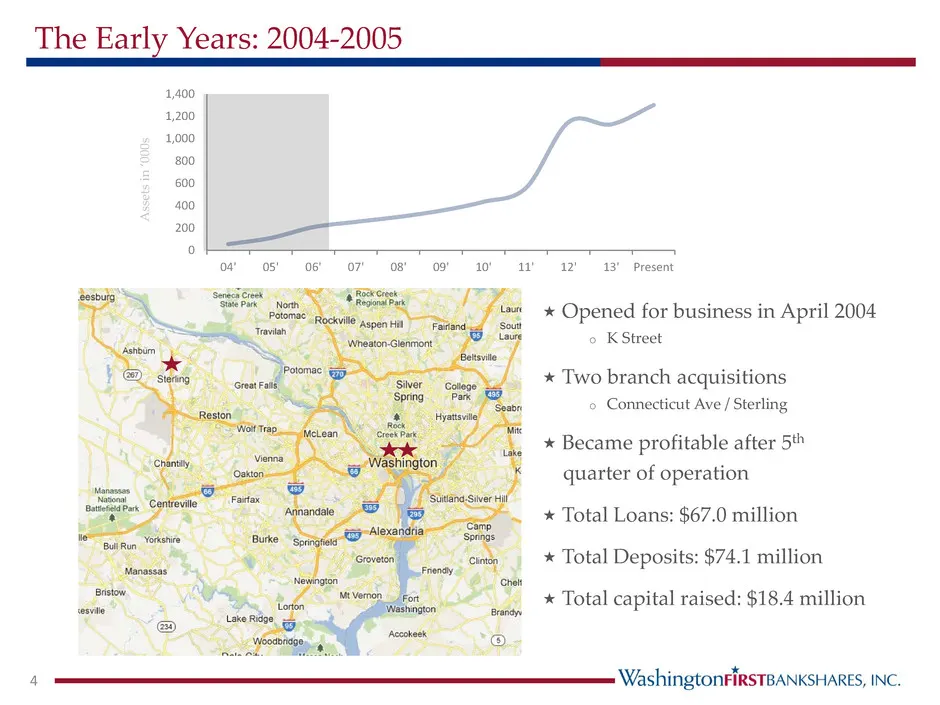
0 200 400 600 800 1,000 1,200 1,400 04' 05' 06' 07' 08' 09' 10' 11' 12' 13' Present The Early Years: 2004-2005 4 Opened for business in April 2004 o K Street Two branch acquisitions o Connecticut Ave / Sterling Became profitable after 5th quarter of operation Total Loans: $67.0 million Tot
Slide 5: Making Noise in the Market: 2006-2008
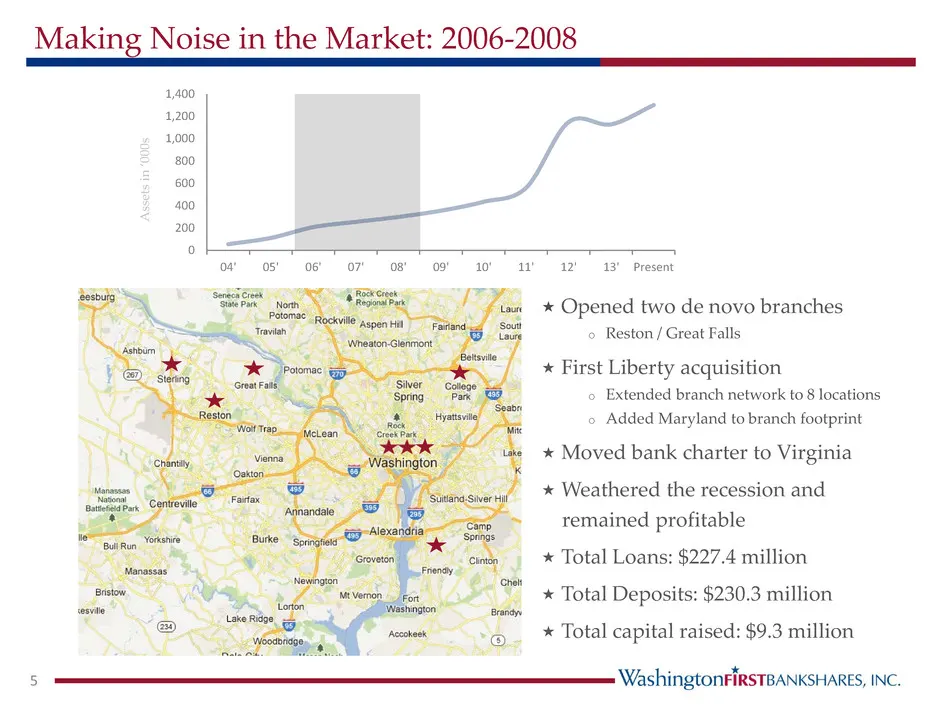
0 200 400 600 800 1,000 1,200 1,400 04' 05' 06' 07' 08' 09' 10' 11' 12' 13' Present Making Noise in the Market: 2006-2008 5 Opened two de novo branches o Reston / Great Falls First Liberty acquisition o Extended branch network to 8 locations o Added Maryland to branch footprint Moved bank char
Slide 6: The Adolescent Years: 2009-2011
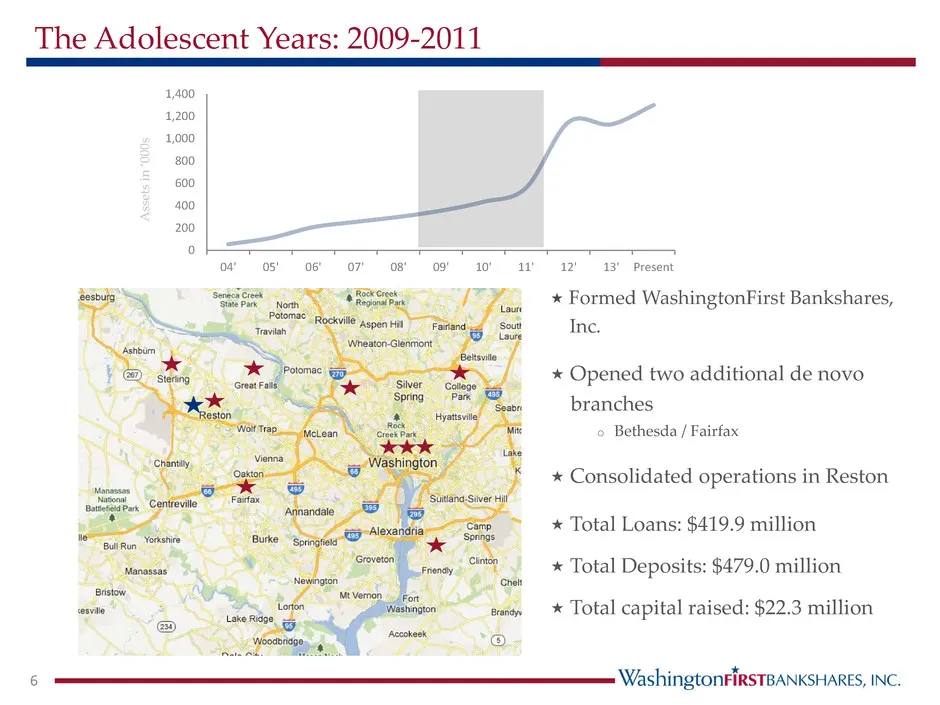
0 200 400 600 800 1,000 1,200 1,400 04' 05' 06' 07' 08' 09' 10' 11' 12' 13' Present The Adolescent Years: 2009-2011 6 Formed WashingtonFirst Bankshares, Inc. Opened two additional de novo branches o Bethesda / Fairfax Consolidated operations in Reston Total Loans: $419.9 million Total Depo
Slide 7: Transformative Years: 2012-Present
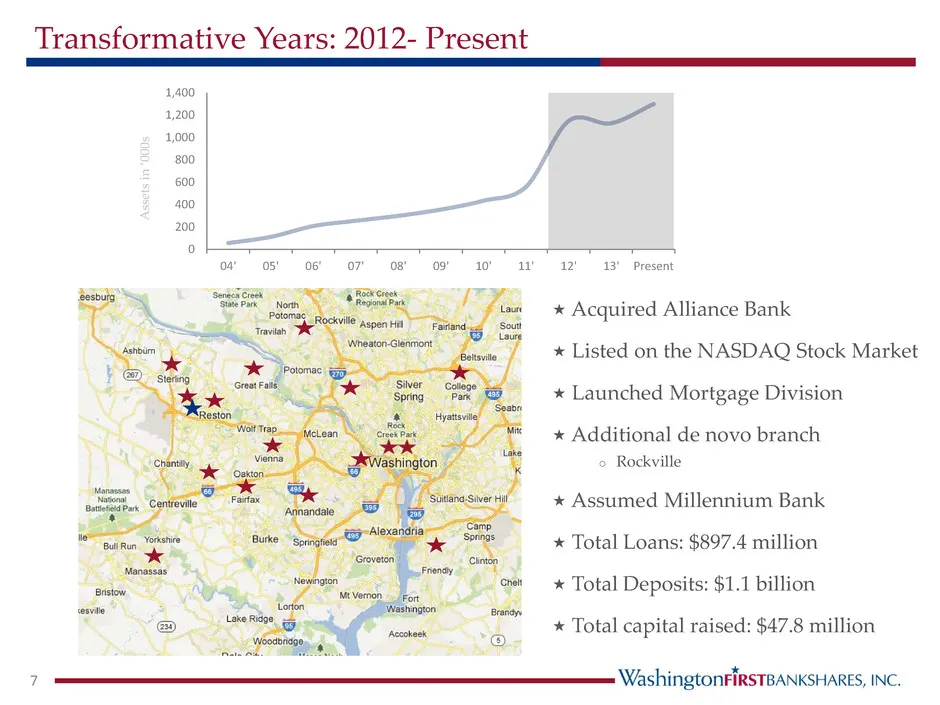
0 200 400 600 800 1,000 1,200 1,400 04' 05' 06' 07' 08' 09' 10' 11' 12' 13' Present Transformative Years: 2012- Present 7 Acquired Alliance Bank Listed on the NASDAQ Stock Market Launched Mortgage Division Additional de novo branch o Rockville Assumed Millennium Bank Total Loans: $897.4
Slide 8: Our Strategy
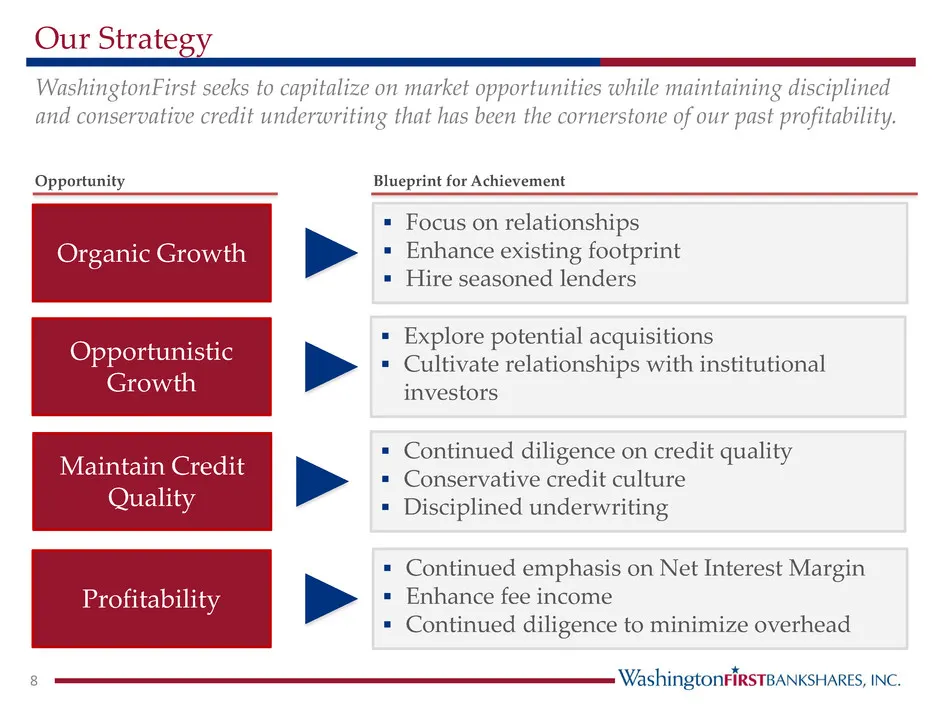
Our Strategy WashingtonFirst seeks to capitalize on market opportunities while maintaining disciplined and conservative credit underwriting that has been the cornerstone of our past profitability. Opportunity Organic Growth Focus on relationships Enhance existing footprint Hire seasoned lender
Slide 9: 2013 Performance
2013 Performance 9
Slide 10: Growth: Total Deposits and Total Loans
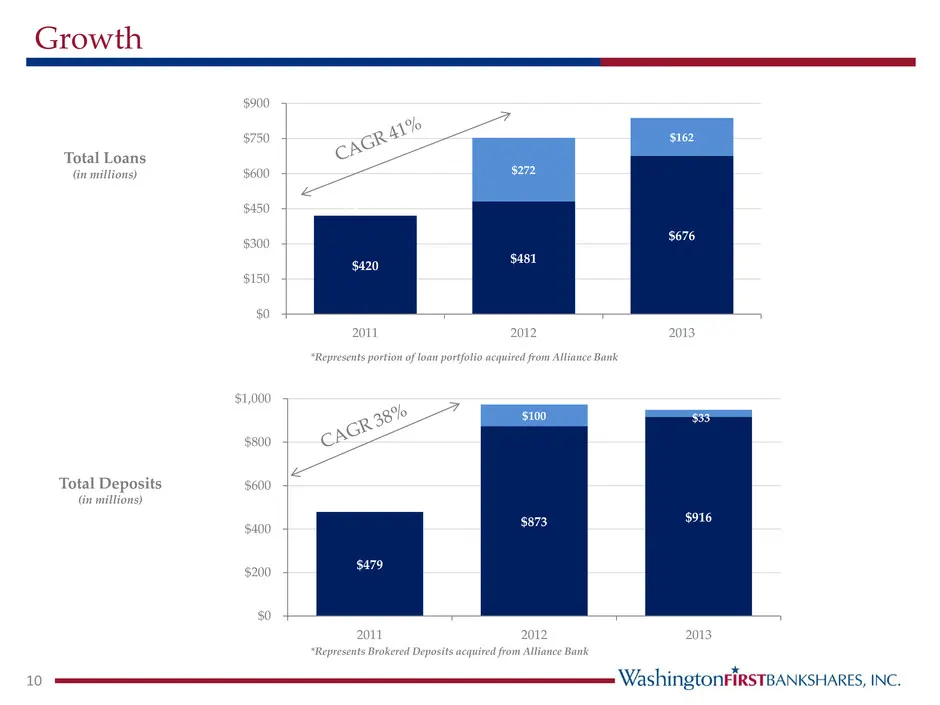
$479 $873 $916 $100 $33 $0 $200 $400 $600 $800 $1,000 2011 2012 2013 $420 $481 $676 $272 $162 $0 $150 $300 $450 $600 $750 $900 2011 2012 2013 Growth 10 Total Deposits (in millions) Total Loans (in millions) $2.4* *Represents portion of loan portfolio acquired from Alliance Bank *Represents Brokered
Slide 11: Earnings Growth
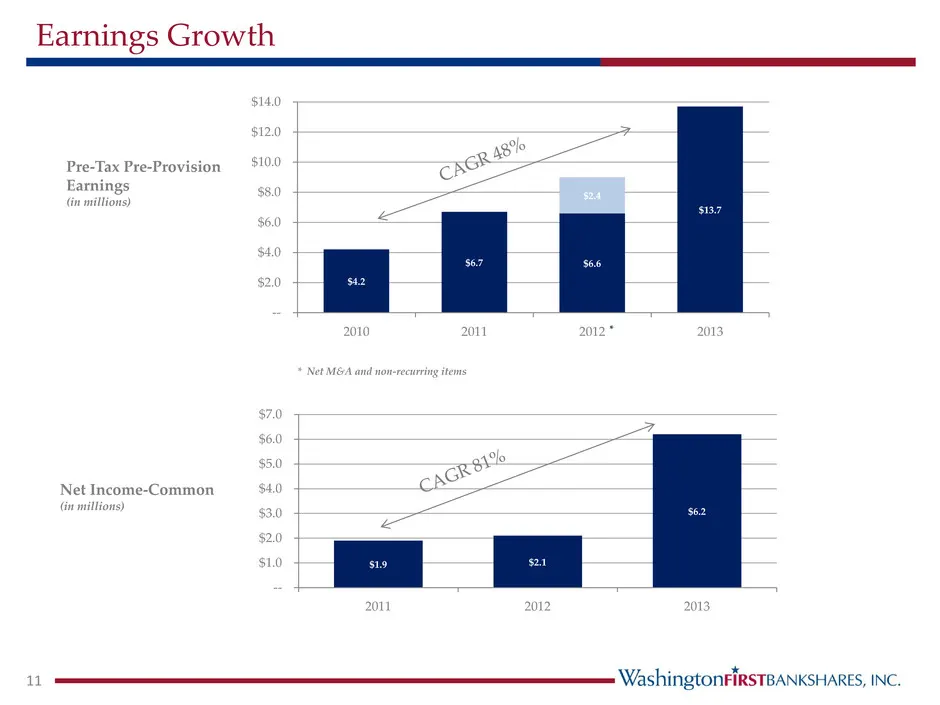
$4.2 $6.7 $6.6 $13.7 $2.4 -- $2.0 $4.0 $6.0 $8.0 $10.0 $12.0 $14.0 2010 2011 2012 2013 $1.9 $2.1 $6.2 -- $1.0 $2.0 $3.0 $4.0 $5.0 $6.0 $7.0 2011 2012 2013 Earnings Growth 11 Pre-Tax Pre-Provision Earnings (in millions) $2.4* * Net M&A and non-recurring items Net Income-Common (in millions) *
Slide 12: NPAs/Assets
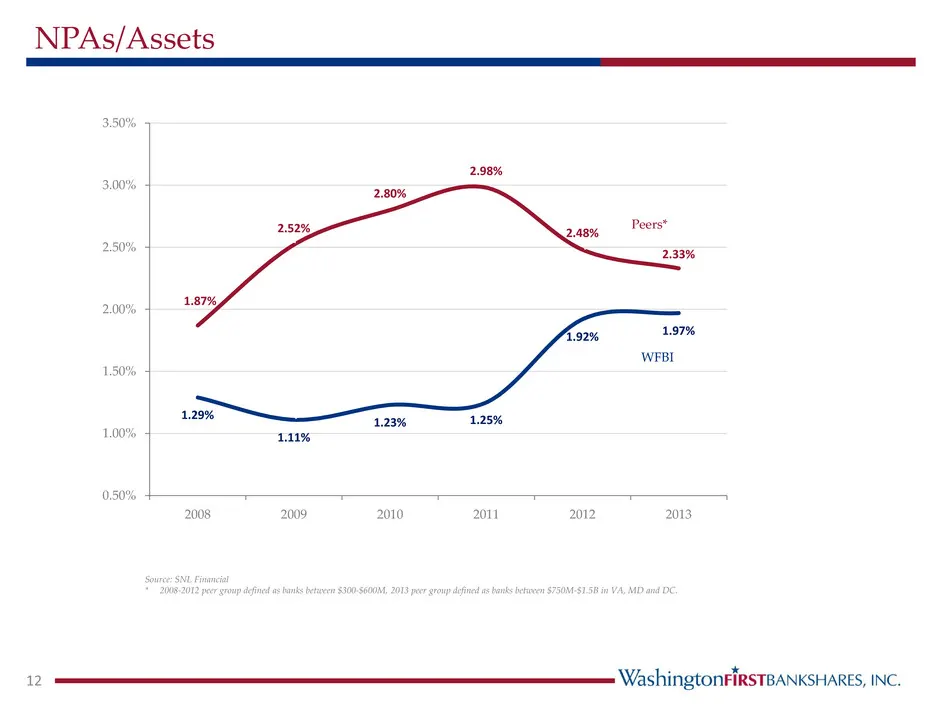
1.29% 1.11% 1.23% 1.25% 1.92% 1.97% 1.87% 2.52% 2.80% 2.98% 2.48% 2.33% 0.50% 1.00% 1.50% 2.00% 2.50% 3.00% 3.50% 2008 2009 2010 2011 2012 2013 NPAs/Assets 12 Source: SNL Financial * 2008-2012 peer group defined as banks between $300-$600M, 2013 peer group defined as banks between $750M-$1.5B in VA,
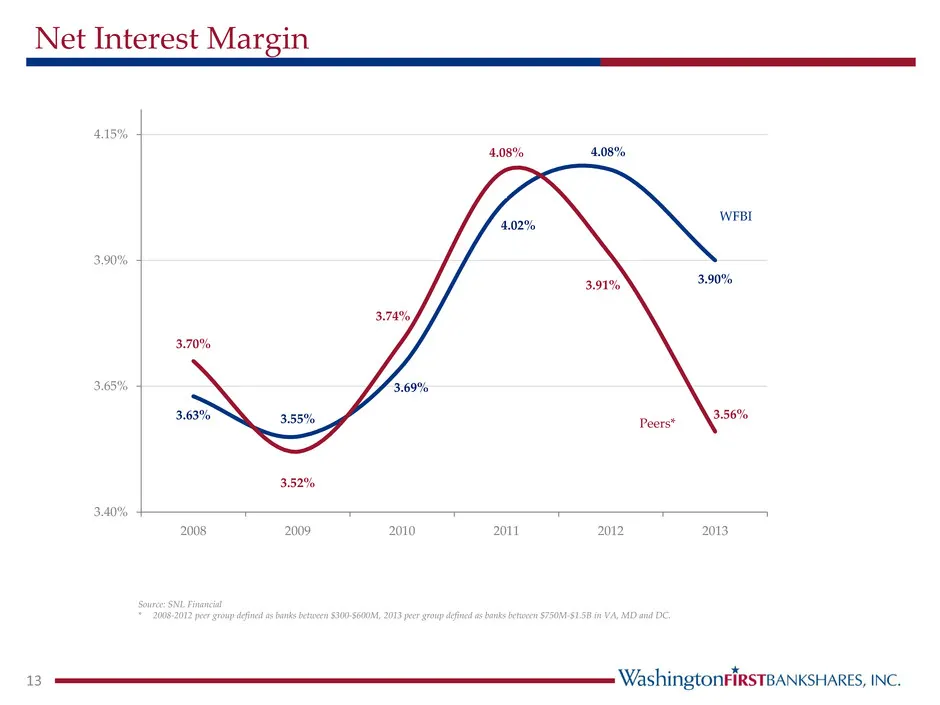
Slide 13: Net Interest Margin
3.63% 3.55% 3.69% 4.02% 4.08% 3.90% 3.70% 3.52% 3.74% 4.08% 3.91% 3.56% 3.40% 3.65% 3.90% 4.15% 2008 2009 2010 2011 2012 2013 Net Interest Margin 13 WFBI Peers* Source: SNL Financial * 2008-2012 peer group defined as banks between $300-$600M, 2013 peer group defined as banks between $750M-$1.5B in V
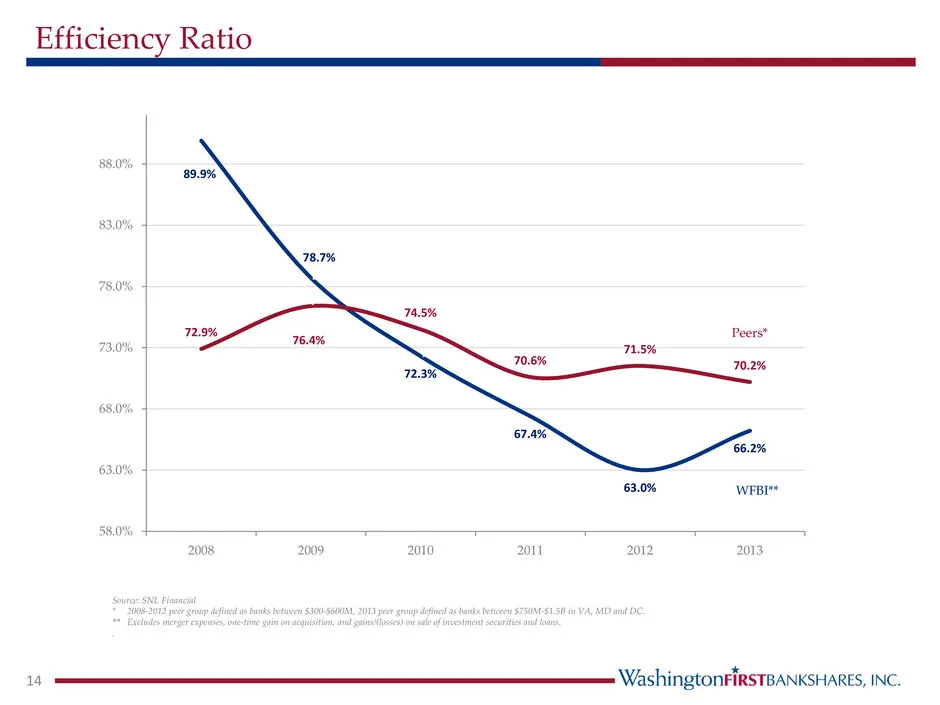
Slide 14: Efficiency Ratio
89.9% 78.7% 72.3% 67.4% 63.0% 66.2% 72.9% 76.4% 74.5% 70.6% 71.5% 70.2% 58.0% 63.0% 68.0% 73.0% 78.0% 83.0% 88.0% 2008 2009 2010 2011 2012 2013 Efficiency Ratio 14 Source: SNL Financial * 2008-2012 peer group defined as banks between $300-$600M, 2013 peer group defined as banks between $750M-$1.5B i
Slide 15: 2013 Key Highlights
2013 Key Highlights 15
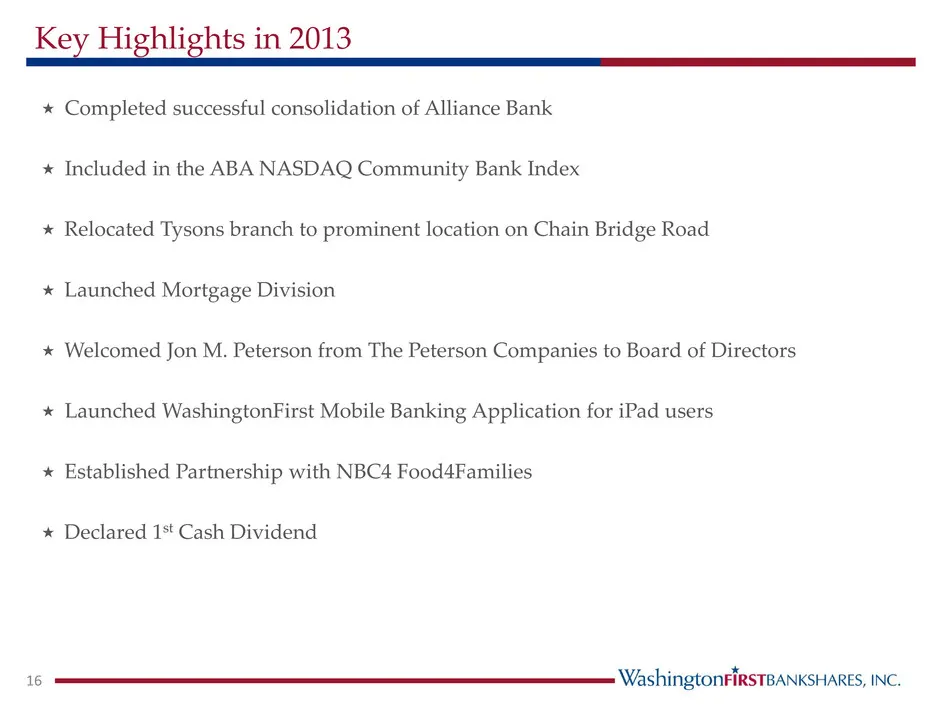
Slide 16: Key Highlights in 2013
Completed successful consolidation of Alliance Bank Included in the ABA NASDAQ Community Bank Index Relocated Tysons branch to prominent location on Chain Bridge Road Launched Mortgage Division Welcomed Jon M. Peterson from The Peterson Companies to Board of Directors Launched Washington
Slide 17: Looking Ahead
Looking Ahead 17
Slide 18: Key Highlights in early 2014
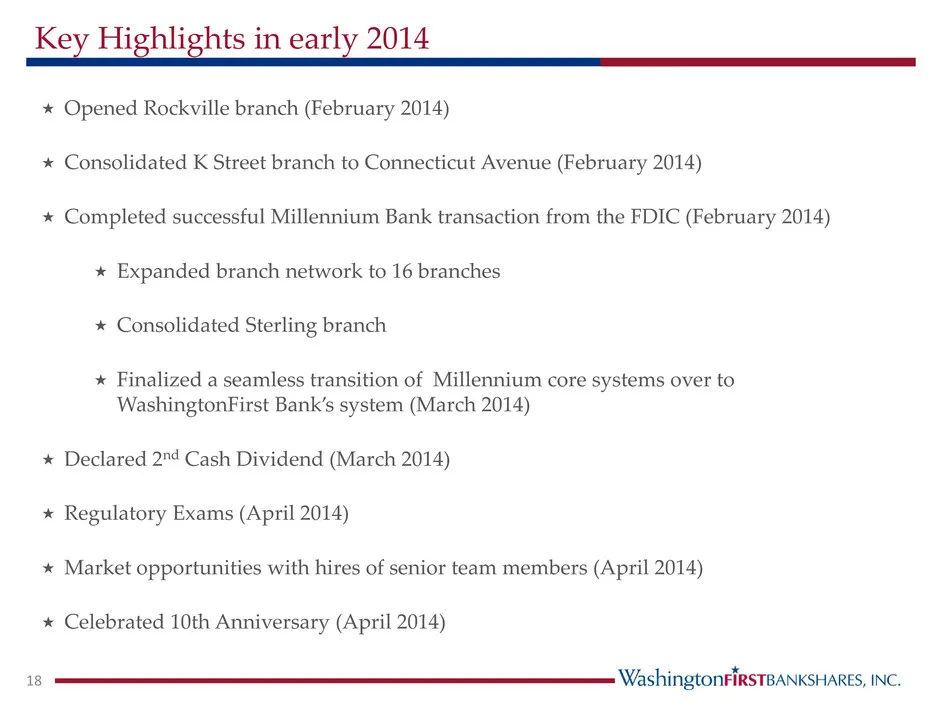
Opened Rockville branch (February 2014) Consolidated K Street branch to Connecticut Avenue (February 2014) Completed successful Millennium Bank transaction from the FDIC (February 2014) Expanded branch network to 16 branches Consolidated Sterling branch Finalized a seamless transition of
Slide 19: Looking Ahead in 2014
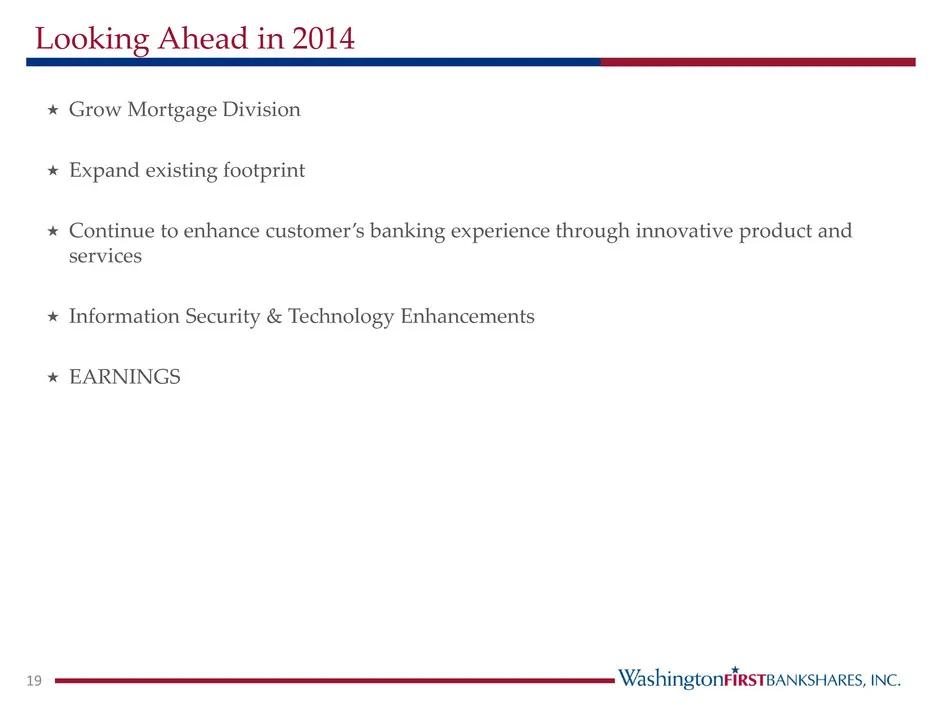
19 Grow Mortgage Division Expand existing footprint Continue to enhance customer’s banking experience through innovative product and services Information Security & Technology Enhancements EARNINGS Looking Ahead in 2014
Slide 20: Stock Performance
Stock Performance 20
Slide 21: Facts About Our Common Stock
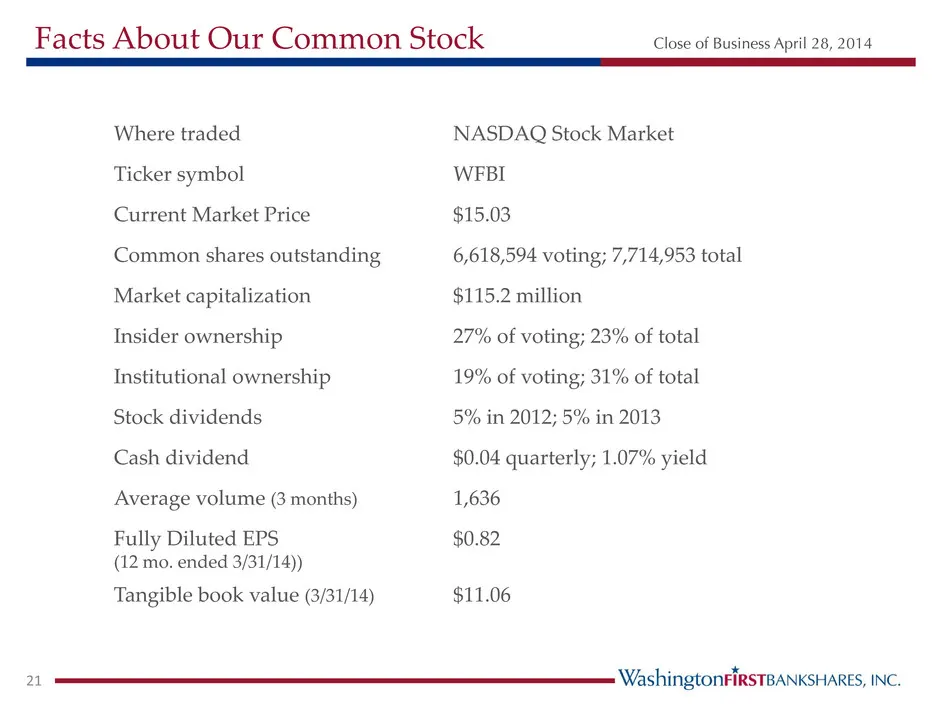
Facts About Our Common Stock Close of Business April 28, 2014 21 Where traded NASDAQ Stock Market Ticker symbol WFBI Current Market Price $15.03 Common shares outstanding 6,618,594 voting; 7,714,953 total Market capitalization $115.2 million Insider ownership 27% of voting; 23% of total Institutiona
Slide 22: WFBI Stock Performance (LTM)
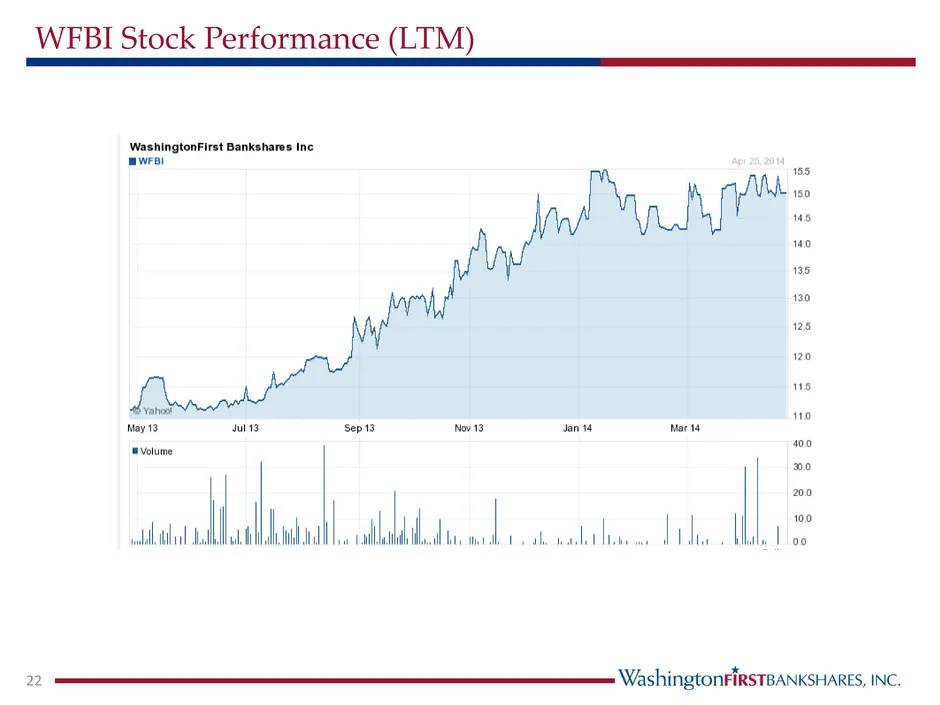
WFBI Stock Performance (LTM) 22
Slide 23: Public Recognition
Public Recognition 23
Slide 24: Public Recognition
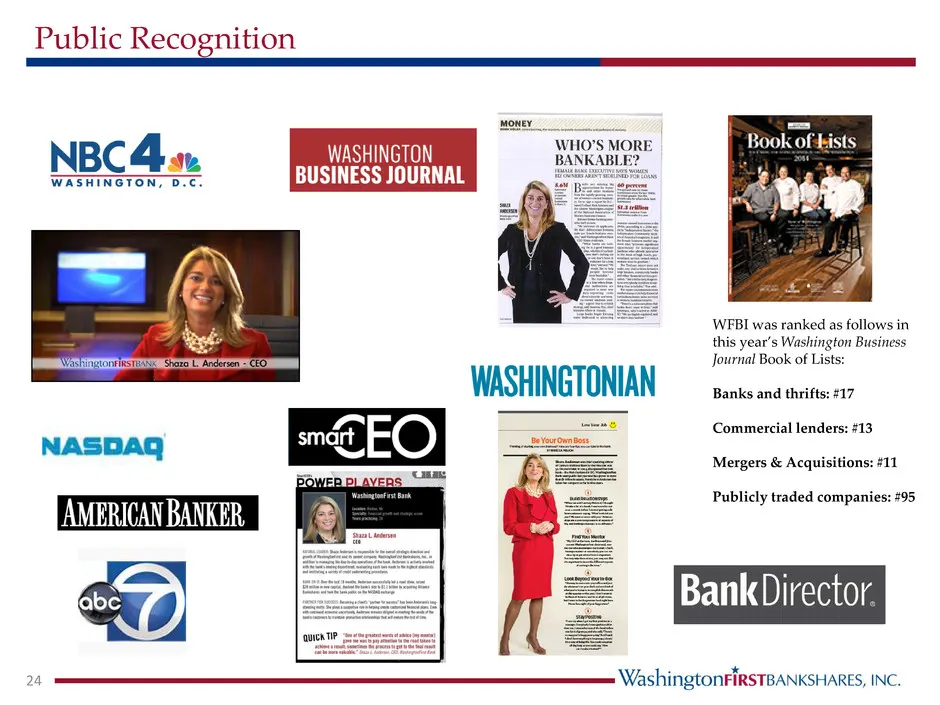
Public Recognition 24 WFBI was ranked as follows in this year’s Washington Business Journal Book of Lists: Banks and thrifts: #17 Commercial lenders: #13 Mergers & Acquisitions: #11 Publicly traded companies: #95
Slide 25: Thank you for your continued support
25 Thank you for your continued support
Slide 26: Questions?
Questions? 26
Source: SEC EDGAR · 8-K filed Apr 29, 2014
More decks from WashingtonFirst Bankshares Inc
 KBW 2017 Community Bank Investor Conference43 slides · Jul 31, 2017
 Merger or Acquisition (May 2017)15 slides · May 16, 2017
 Shareholder Meeting (April 2017)21 slides · Apr 26, 2017
 Investor Presentation (February 2017)37 slides · Feb 10, 2017
 Investor Presentation (September 2016)31 slides · Sep 6, 2016
 Investor Presentation (August 2016)31 slides · Aug 17, 2016