Wildhorse Resource Development Corp
Wildhorse Resource Development — Deloitte Oil & Gas Conference 2018
29 slides from Wildhorse Resource Development's conference presentation, Oct 30, 2018
Slide 1: Rule 425 filing: Chesapeake presentation at Deloitte Oil & Gas Conference
Filed by Chesapeake Energy Corporation (Commission File No. 001-13726) Pursuant to Rule 425 under the Securities Act of 1933 and deemed filed pursuant to rule 14a-12 under the Securities Exchange Act of 1934 Subject Company: WildHorse Resource Development Corporation (Commission File No. 001-37964)

Slide 2: The Transformation and the Future
THE TRANSFORMATION AND THE FUTURE Doug Lawler President and Chief Executive Officer
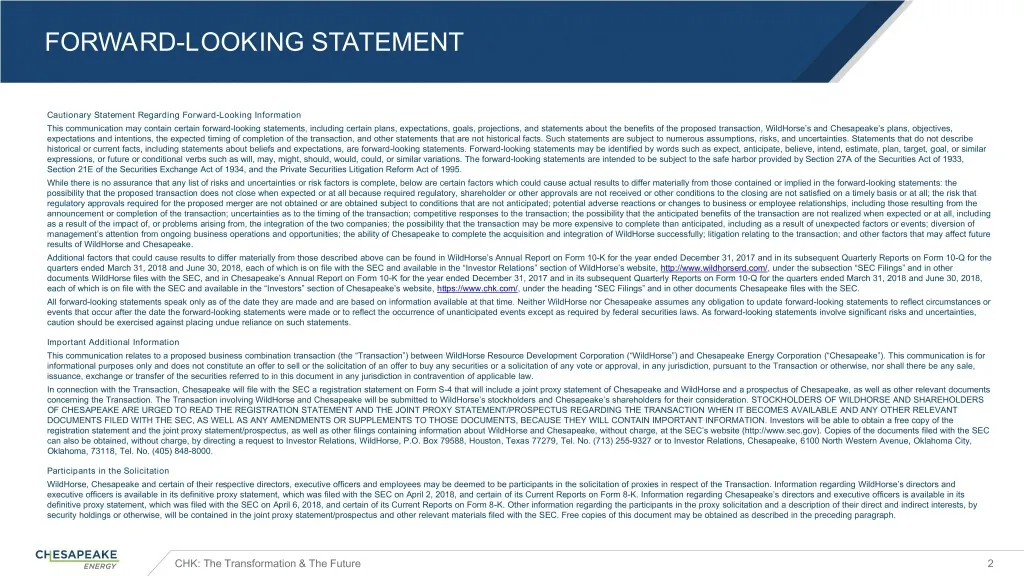
Slide 3: Forward-Looking Statement
FORWARD-LOOKING STATEMENT Cautionary Statement Regarding Forward-Looking Information This communication may contain certain forward-looking statements, including certain plans, expectations, goals, projections, and statements about the benefits of the proposed transaction, WildHorse’s and Chesapeake
Slide 4: Unconventional Trailblazer: The Early Years
UNCONVENTIONAL TRAILBLAZER The Early Years CHK: The Transformation & The Future 3
Slide 5: Production and Debt
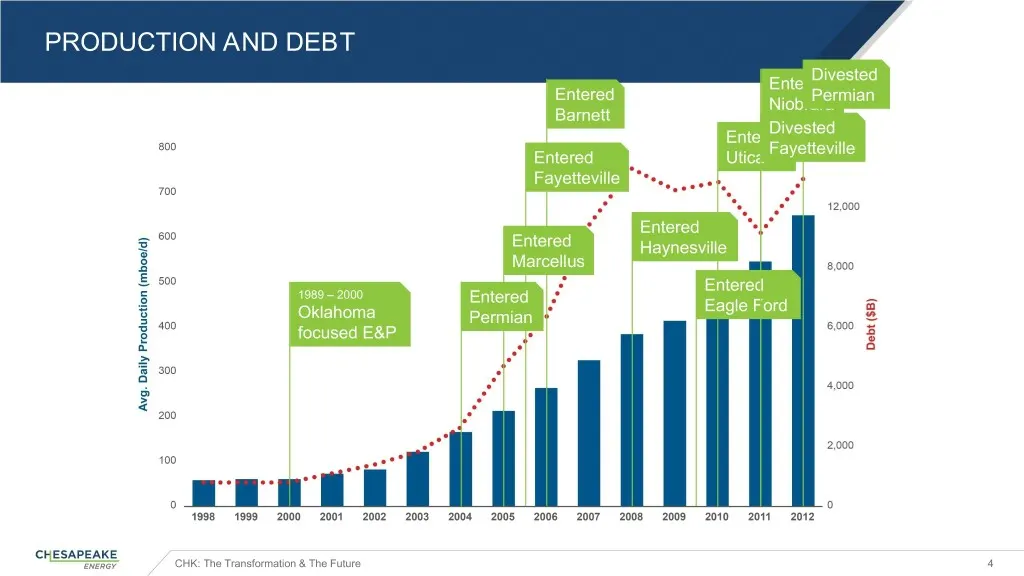
PRODUCTION AND DEBT Divested Entered Entered Permian Niobrara Barnett Divested Entered Fayetteville Entered Utica Fayetteville Entered Entered Haynesville Marcellus Entered 1989 – 2000 Entered Eagle Ford Oklahoma Permian focused E&P CHK: The Transformation & The Future 4
Slide 6: Complexity Across All Aspects of the Company
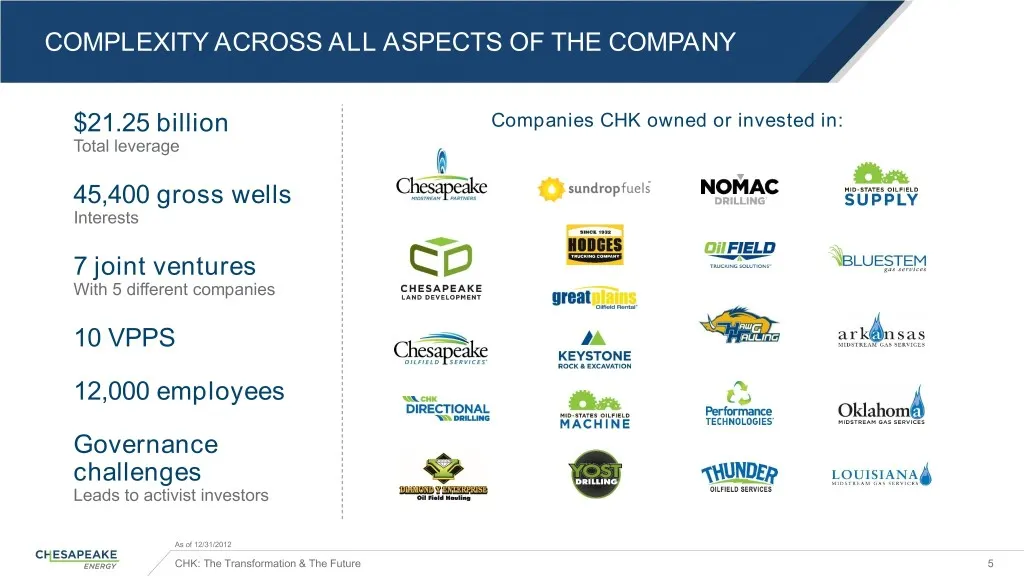
COMPLEXITY ACROSS ALL ASPECTS OF THE COMPANY $21.25 billion Companies CHK owned or invested in: Total leverage 45,400 gross wells Interests 7 joint ventures With 5 different companies 10 VPPS 12,000 employees Governance challenges Leads to activist investors As of 12/31/2012 CHK: The Transformation
Slide 7: The Transformation
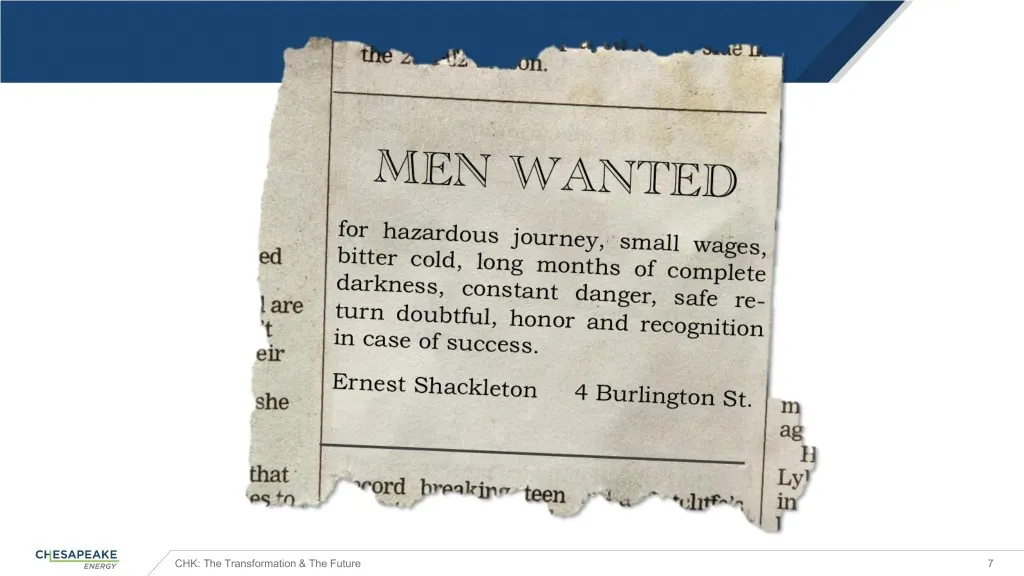
The Transformation CHK: The Transformation & The Future 6
Slide 8: CHK: The Transformation & The Future 7
CHK: The Transformation & The Future 7
Slide 9: The Greatest Challenge in the Industry
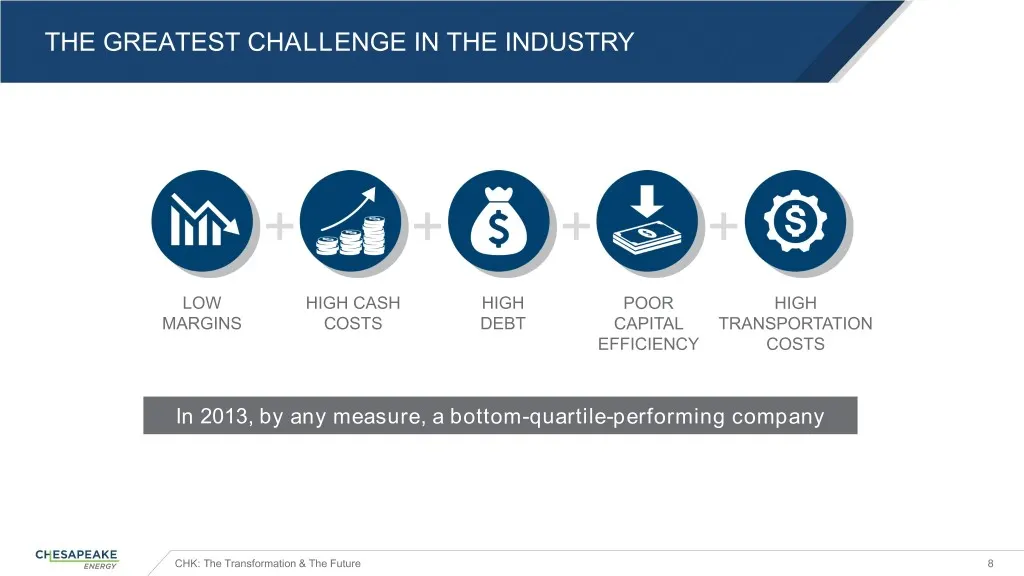
THE GREATEST CHALLENGE IN THE INDUSTRY + + + + LOW HIGH CASH HIGH POOR HIGH MARGINS COSTS DEBT CAPITAL TRANSPORTATION EFFICIENCY COSTS In 2013, by any measure, a bottom-quartile-performing company CHK: The Transformation & The Future 8
Slide 10: Core Values and Business Strategies
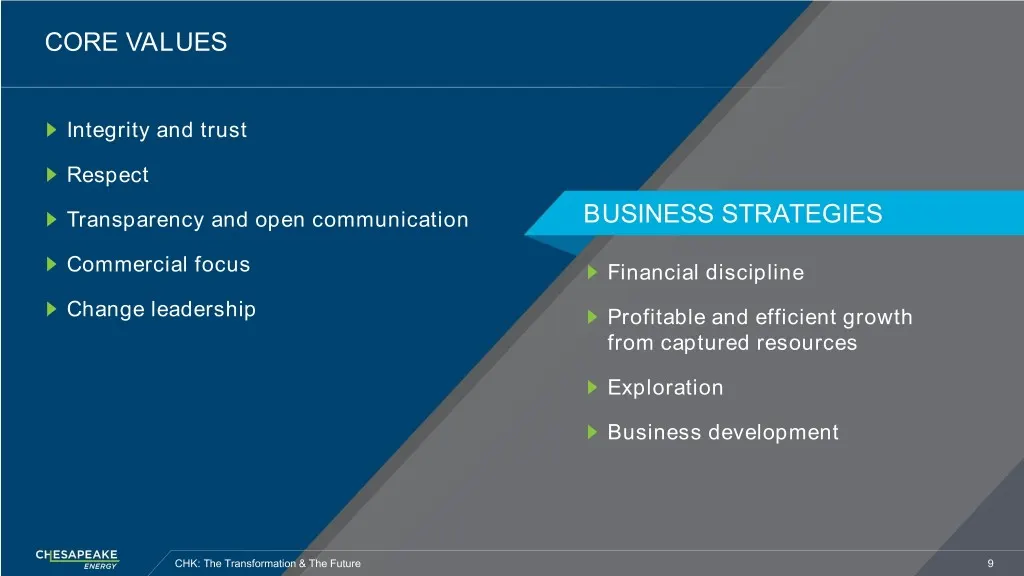
CORE VALUES Integrity and trust Respect Transparency and open communication BUSINESS STRATEGIES Commercial focus Financial discipline Change leadership Profitable and efficient growth from captured resources Exploration Business development CHK: The Transformation & The Future 9
Slide 11: The Transformation Begins
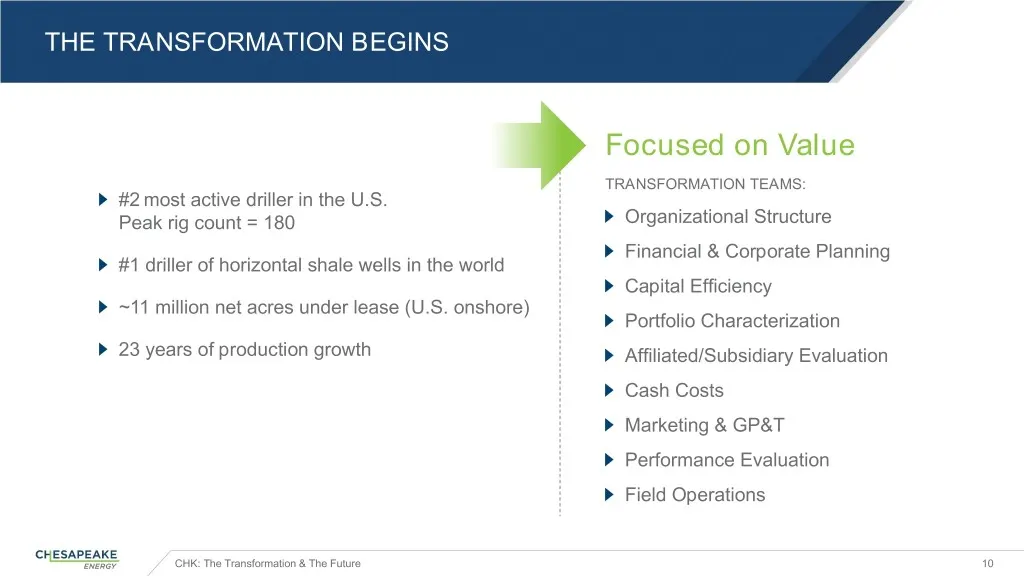
THE TRANSFORMATION BEGINS Focused on Volume Focused on Value TRANSFORMATION TEAMS: #2 most active driller in the U.S. Peak rig count = 180 Organizational Structure Financial & Corporate Planning #1 driller of horizontal shale wells in the world Capital Efficiency ~11 million net acres under lease (U
Slide 12: Best-in-Class EHSR Performance
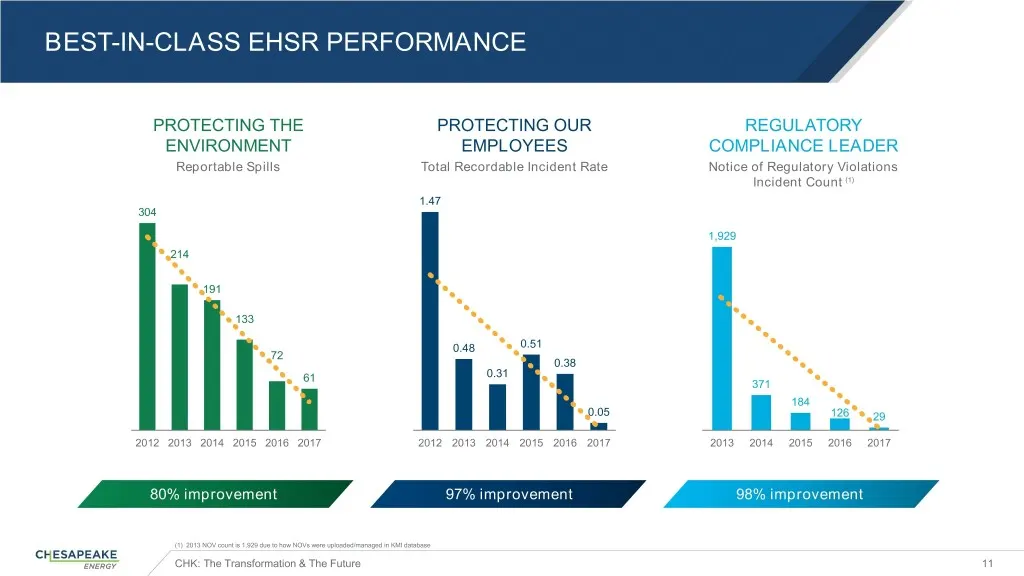
BEST-IN-CLASS EHSR PERFORMANCE PROTECTING THE PROTECTING OUR REGULATORY ENVIRONMENT EMPLOYEES COMPLIANCE LEADER Reportable Spills Total Recordable Incident Rate Notice of Regulatory Violations Incident Count (1) 1.47 304 1,929 214 191 133 0.48 0.51 72 0.38 61 0.31 371 184 0.05 126 29 2012 2013 2014
Slide 13: Capital Efficiency Defined
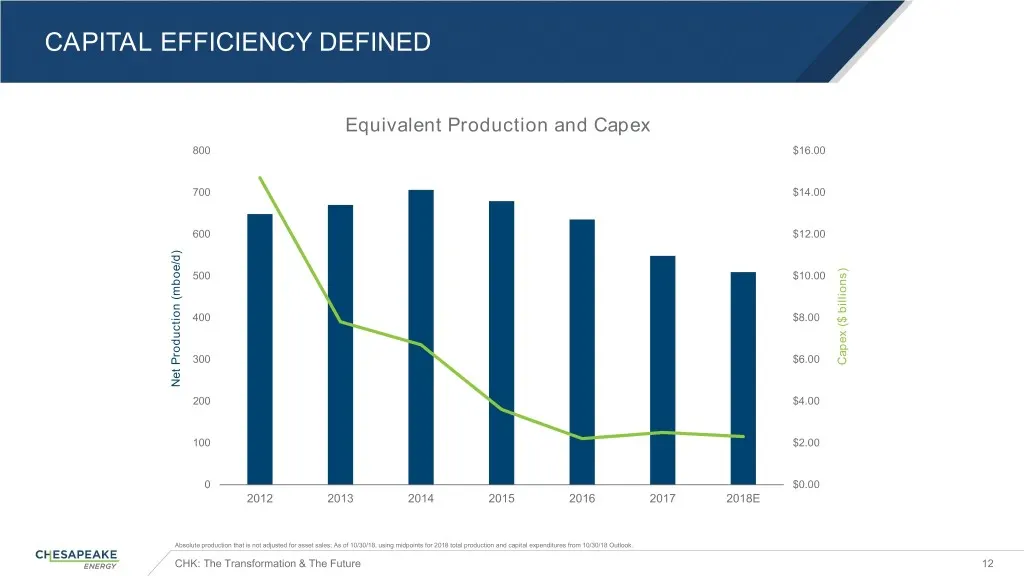
CAPITAL EFFICIENCY DEFINED Equivalent Production and Capex 800 $16.00 700 $14.00 600 $12.00 500 $10.00 400 $8.00 300 $6.00 Capex($ billions) Net Production Net (mboe/d) 200 $4.00 100 $2.00 0 $0.00 2012 2013 2014 2015 2016 2017 2018E Absolute production that is not adjusted for asset sales; As of 10/
Slide 14: Cash Cost Leadership
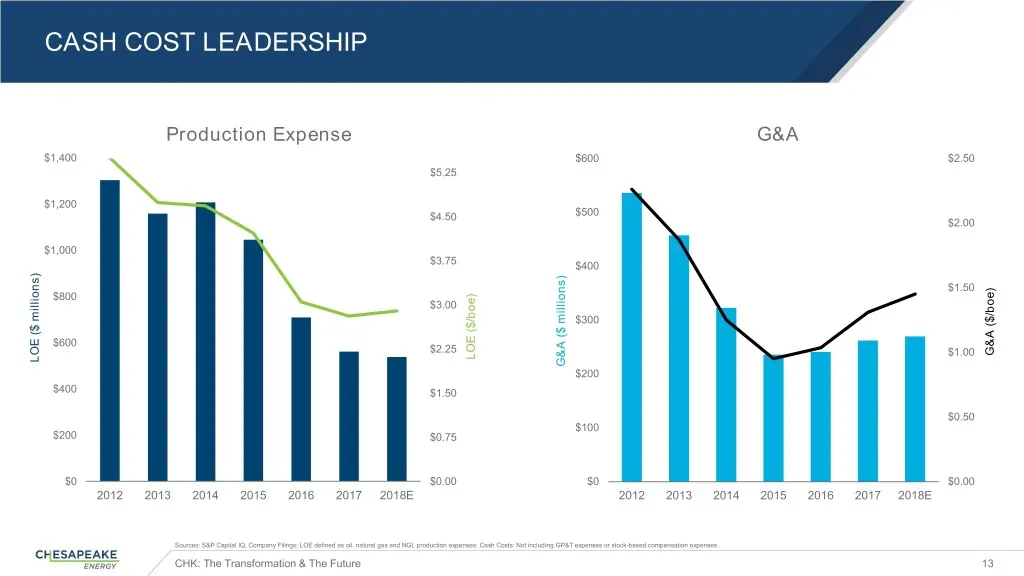
CASH COST LEADERSHIP Production Expense G&A $1,400 $600 $2.50 $5.25 $1,200 $4.50 $500 $2.00 $1,000 $3.75 $400 $1.50 $800 $3.00 $300 $600 $2.25 $1.00 G&A ($/boe) LOE LOE ($/boe) LOE LOE millions) ($ G&A G&A millions) ($ $200 $400 $1.50 $0.50 $100 $200 $0.75 $0 $0.00 $0 $0.00 2012 2013 2014 2015 2016
Slide 15: Optimizing Downstream Commitments
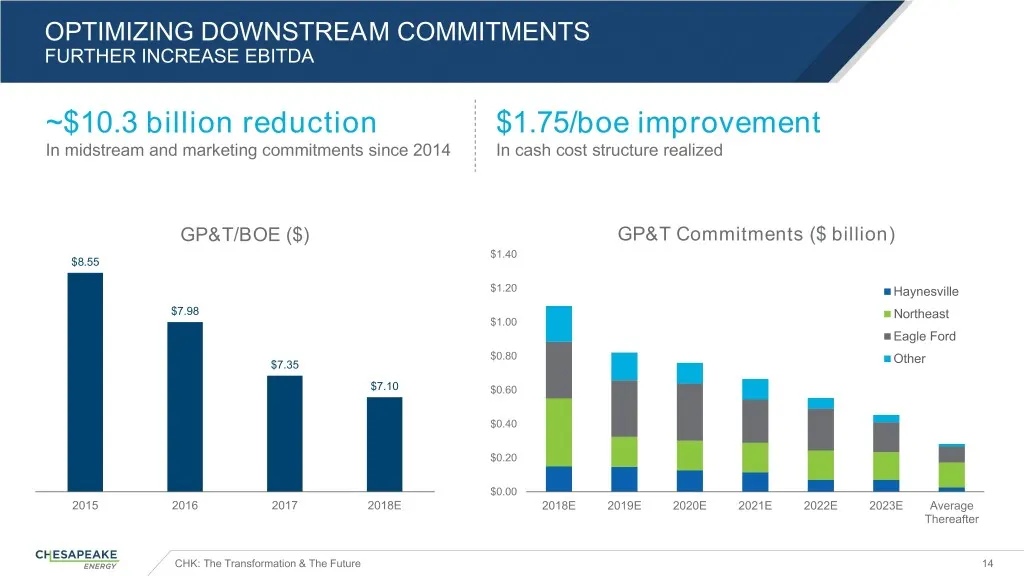
OPTIMIZING DOWNSTREAM COMMITMENTS FURTHER INCREASE EBITDA ~$10.3 billion reduction $1.75/boe improvement In midstream and marketing commitments since 2014 In cash cost structure realized GP&T/BOE ($) GP&T Commitments ($ billion) $1.40 $8.55 $1.20 Haynesville $7.98 Northeast $1.00 Eagle Ford $0.80 $7
Slide 16: Transformed into a More Competitive Company
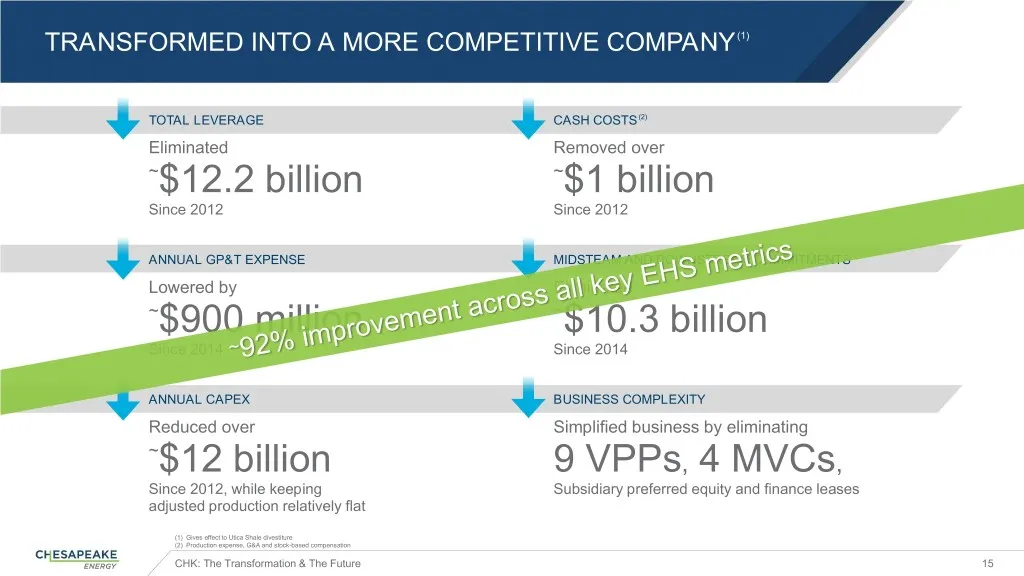
TRANSFORMED INTO A MORE COMPETITIVE COMPANY (1) TOTAL LEVERAGE CASH COSTS (2) Eliminated Removed over ~$12.2 billion ~$1 billion Since 2012 Since 2012 ANNUAL GP&T EXPENSE MIDSTEAM AND DOWNSTREAM COMMITMENTS Lowered by Eliminated ~$900 million ~$10.3 billion Since 2014 Since 2014 ANNUAL CAPEX BUSINES
Slide 17: The Future
The Future CHK: The Transformation & The Future 16
Slide 18: Accelerates Chesapeake's Strategic Plan
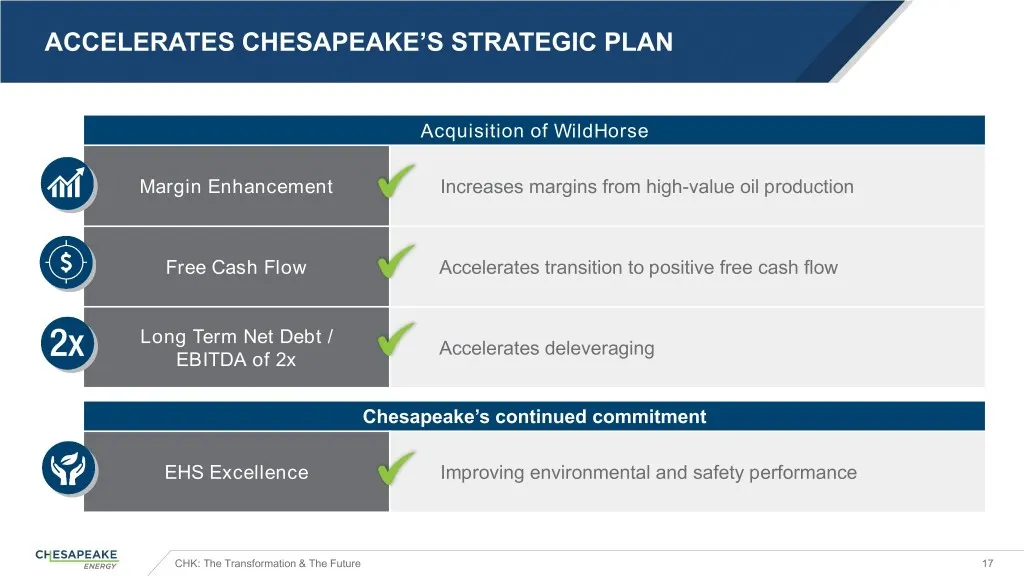
ACCELERATES CHESAPEAKE’S STRATEGIC PLAN Acquisition of WildHorse Margin Enhancement Increases margins from high-value oil production Free Cash Flow Accelerates transition to positive free cash flow Long Term Net Debt / Accelerates deleveraging EBITDA of 2x Chesapeake’s continued commitment EHS Excel
Slide 19: Transaction Overview
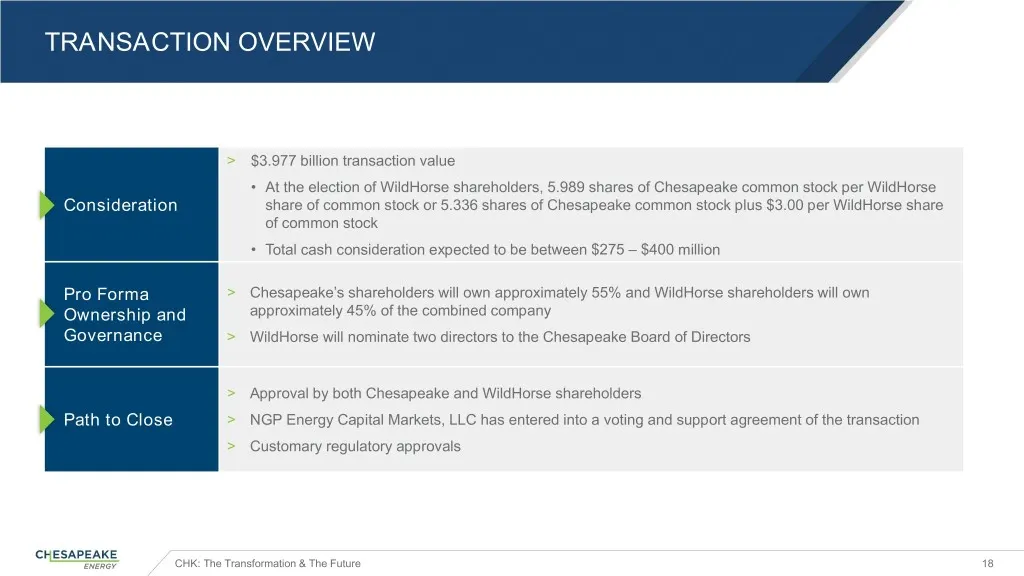
TRANSACTION OVERVIEW > $3.977 billion transaction value • At the election of WildHorse shareholders, 5.989 shares of Chesapeake common stock per WildHorse Consideration share of common stock or 5.336 shares of Chesapeake common stock plus $3.00 per WildHorse share of common stock • Total cash consid
Slide 20: Strategic Portfolio Addition Positions CHK for Additional Value Creation
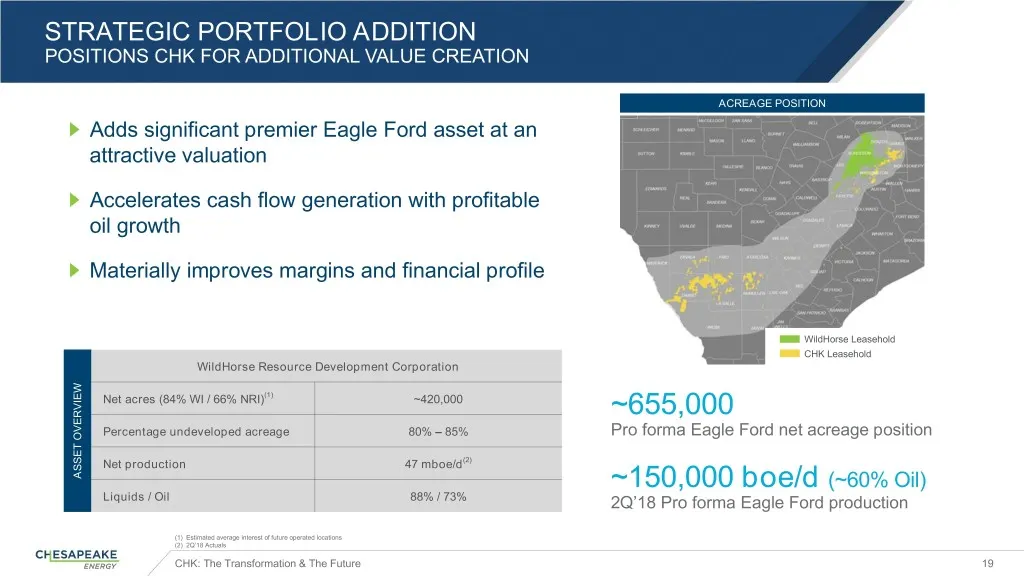
STRATEGIC PORTFOLIO ADDITION POSITIONS CHK FOR ADDITIONAL VALUE CREATION ACREAGE POSITION Adds significant premier Eagle Ford asset at an attractive valuation Accelerates cash flow generation with profitable oil growth Materially improves margins and financial profile WildHorse Leasehold CHK Leaseho
Slide 21: Accelerating Value, Delivering on Our Promises
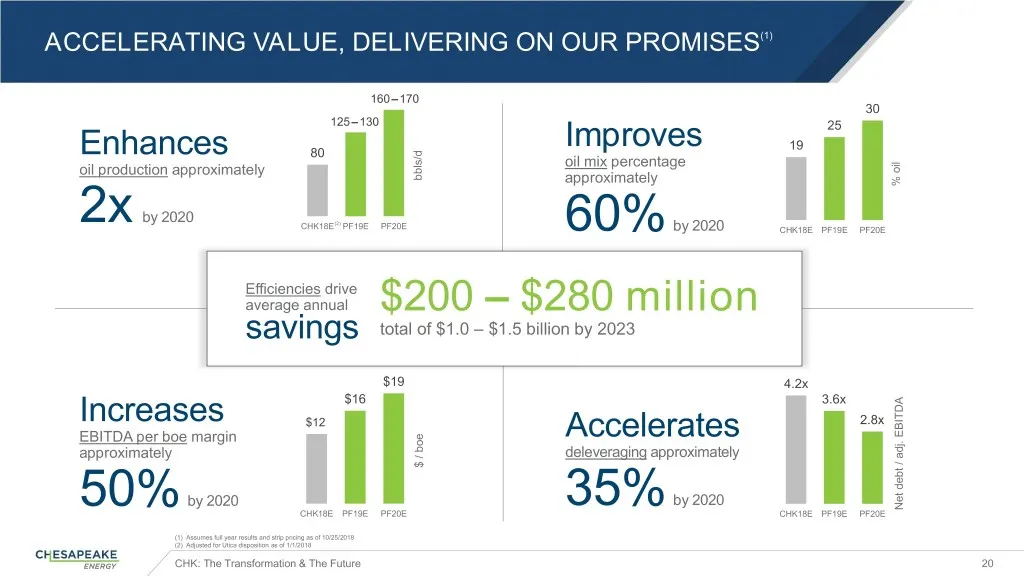
ACCELERATING VALUE, DELIVERING ON OUR PROMISES(1) 160165–170 30 125130–130 25 Improves 19 Enhances 80 oil mix percentage oil production approximately bbls/d approximately % oil % by 2020 2x CHK18E(2) PF19E PF20E 60% by 2020 CHK18E PF19E PF20E Efficiencies drive average annual $200 – $280 million sav
Slide 22: Cost Savings Create Significant Shareholder Value
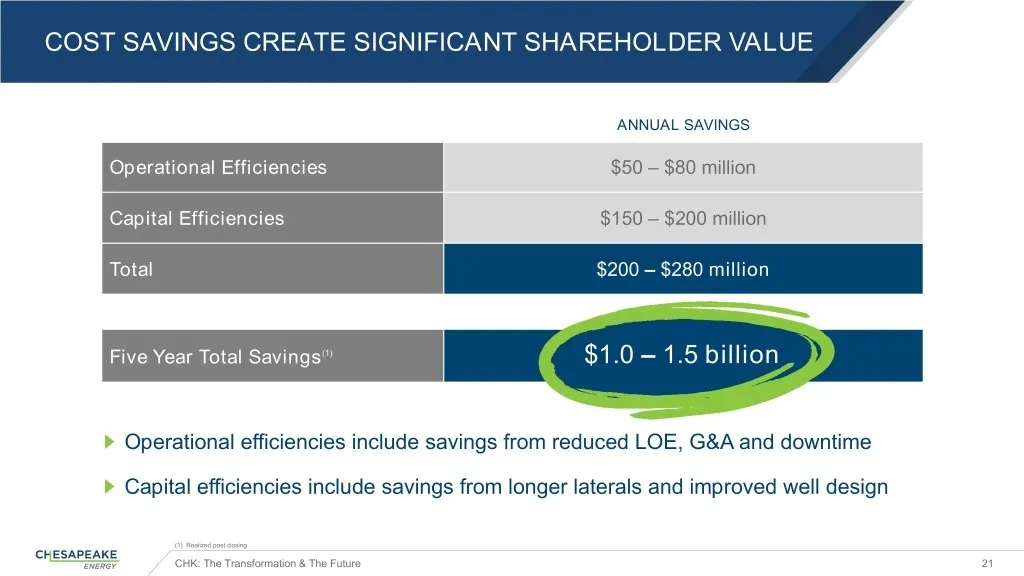
COST SAVINGS CREATE SIGNIFICANT SHAREHOLDER VALUE ANNUAL SAVINGS Operational Efficiencies $50 – $80 million Capital Efficiencies $150 – $200 million Total $200 – $280 million Five Year Total Savings(1) $1.0$1.0 – – 1.5$1.5 billion Operational efficiencies include savings from reduced LOE, G&A and do
Slide 23: Opportunities to Capture Additional Marketing Synergies
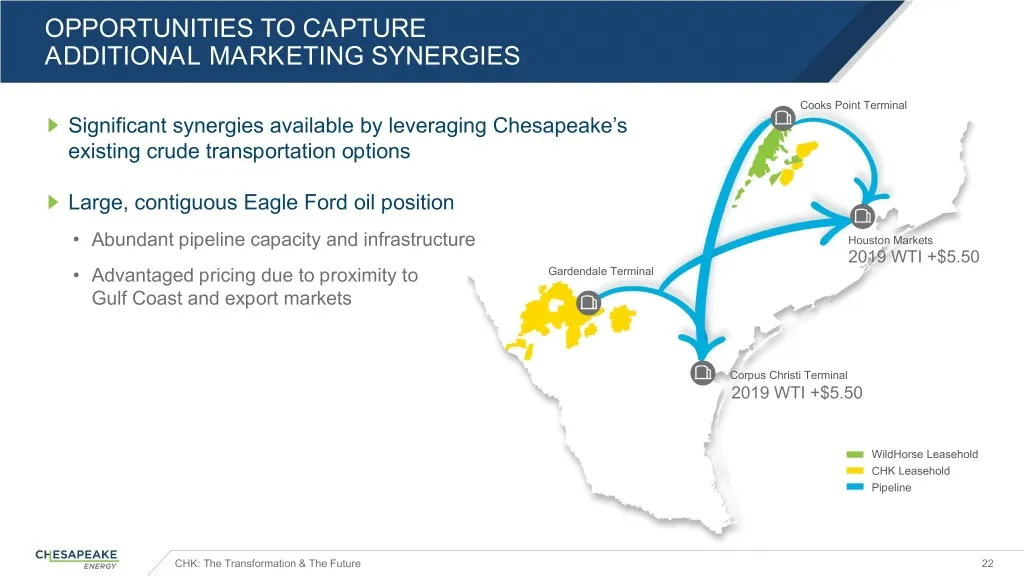
OPPORTUNITIES TO CAPTURE ADDITIONAL MARKETING SYNERGIES Cooks Point Terminal Significant synergies available by leveraging Chesapeake’s existing crude transportation options Large, contiguous Eagle Ford oil position • Abundant pipeline capacity and infrastructure Houston Markets 2019 WTI +$5.50 • Ad
Slide 24: Creating an Eagle Ford Powerhouse
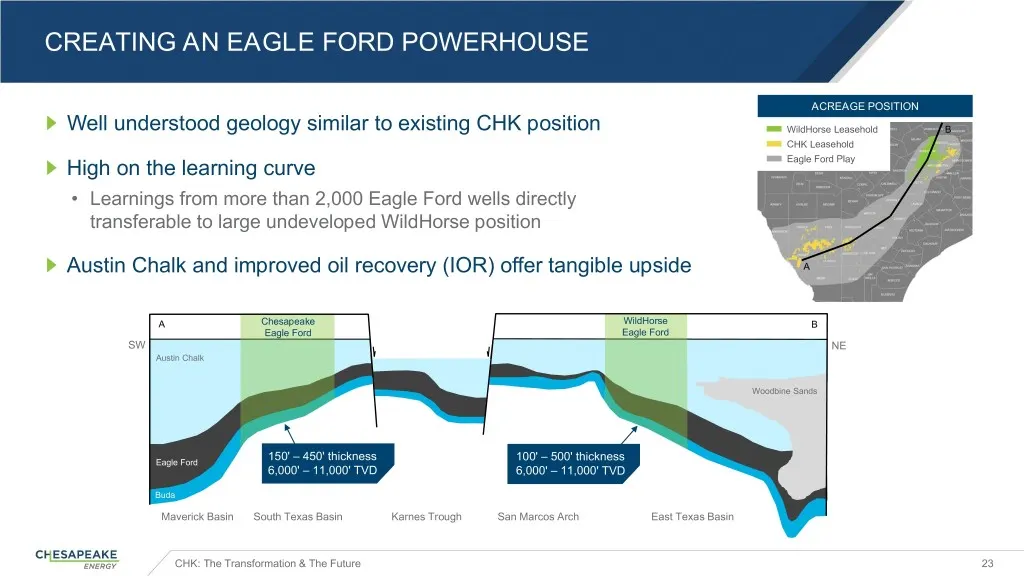
CREATING AN EAGLE FORD POWERHOUSE ACREAGE POSITION Well understood geology similar to existing CHK position WildHorse Leasehold B CHK Leasehold High on the learning curve Eagle Ford Play • Learnings from more than 2,000 Eagle Ford wells directly transferable to large undeveloped WildHorse position A
Slide 25: The Chesapeake Advantage
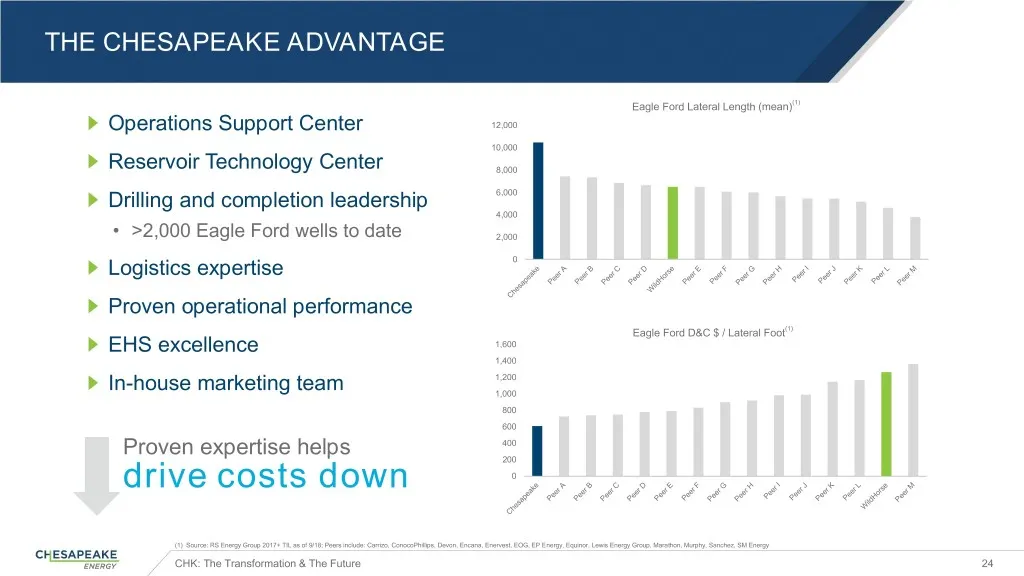
THE CHESAPEAKE ADVANTAGE Eagle Ford Lateral Length (mean)(1) Operations Support Center 12,000 10,000 Reservoir Technology Center 8,000 Drilling and completion leadership 6,000 4,000 • >2,000 Eagle Ford wells to date 2,000 Logistics expertise 0 Proven operational performance Eagle Ford D&C $ / Latera
Slide 26: CHK Today: Diverse and Strong Portfolio
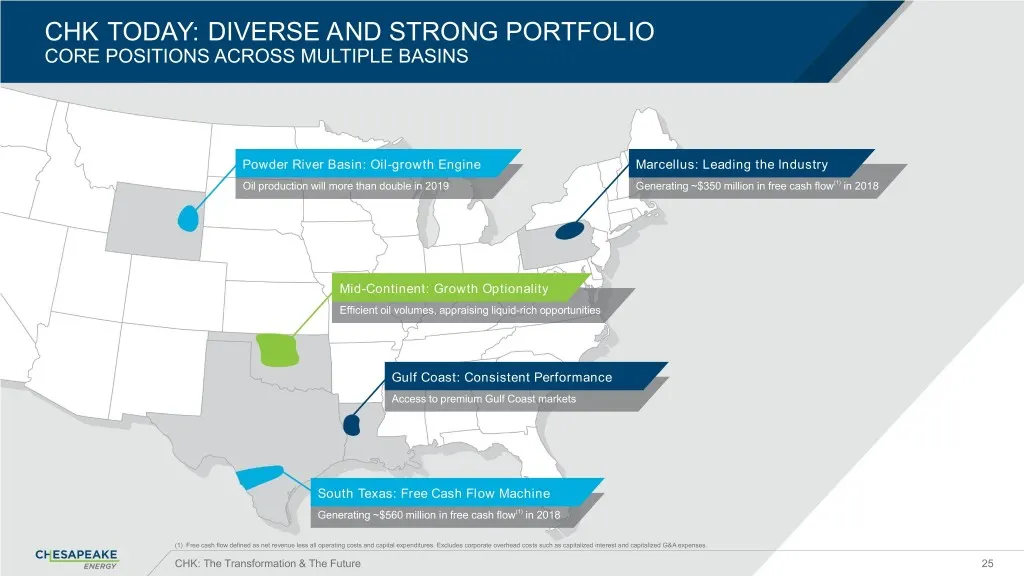
CHK TODAY: DIVERSE AND STRONG PORTFOLIO CORE POSITIONS ACROSS MULTIPLE BASINS Powder River Basin: Oil-growth Engine Marcellus: Leading the Industry Oil production will more than double in 2019 Generating ~$350 million in free cash flow(1) in 2018 Mid-Continent: Growth Optionality Efficient oil volum
Slide 27: Acquisition Creates Premier Diversified Independent
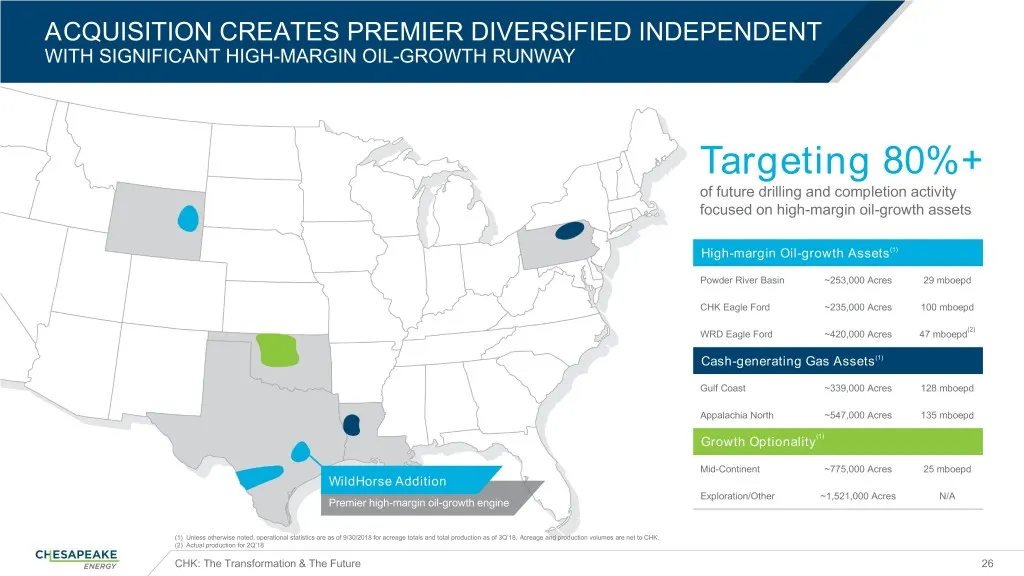
ACQUISITION CREATES PREMIER DIVERSIFIED INDEPENDENT WITH SIGNIFICANT HIGH-MARGIN OIL-GROWTH RUNWAY Targeting 80%+ of future drilling and completion activity focused on high-margin oil-growth assets High-margin Oil-growth Assets(1) Powder River Basin ~253,000 Acres 29 mboepd CHK Eagle Ford ~235,000 A
Slide 28: Accelerates CHK's Strategic and Financial Plan
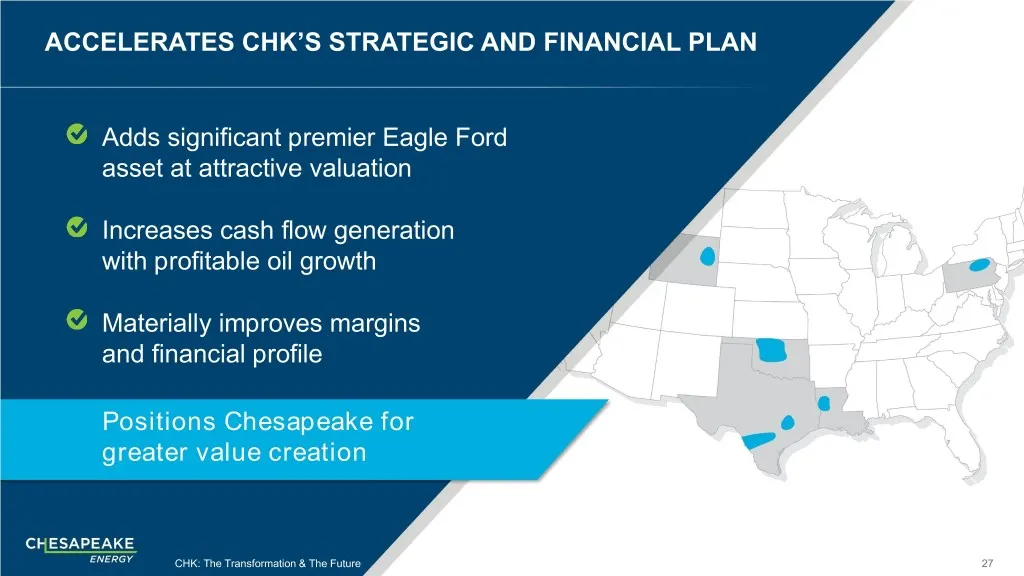
ACCELERATES CHK’S STRATEGIC AND FINANCIAL PLAN Adds significant premier Eagle Ford asset at attractive valuation Increases cash flow generation with profitable oil growth Materially improves margins and financial profile Positions Chesapeake for greater value creation CHK: The Transformation & The F

Slide 29: How Did All This Happen?
HOW DID ALL THIS HAPPEN? Power of our people drives our competitive advantage CHK: The Transformation & The Future 28
Source: SEC EDGAR · 425 filed Oct 30, 2018