Scatec ASA · OSL:SCATC
Scatec ASA — Scatec Solar — Q3 2020 Earnings Presentation
24 slides from Scatec ASA's earnings presentation, Oct 16, 2020
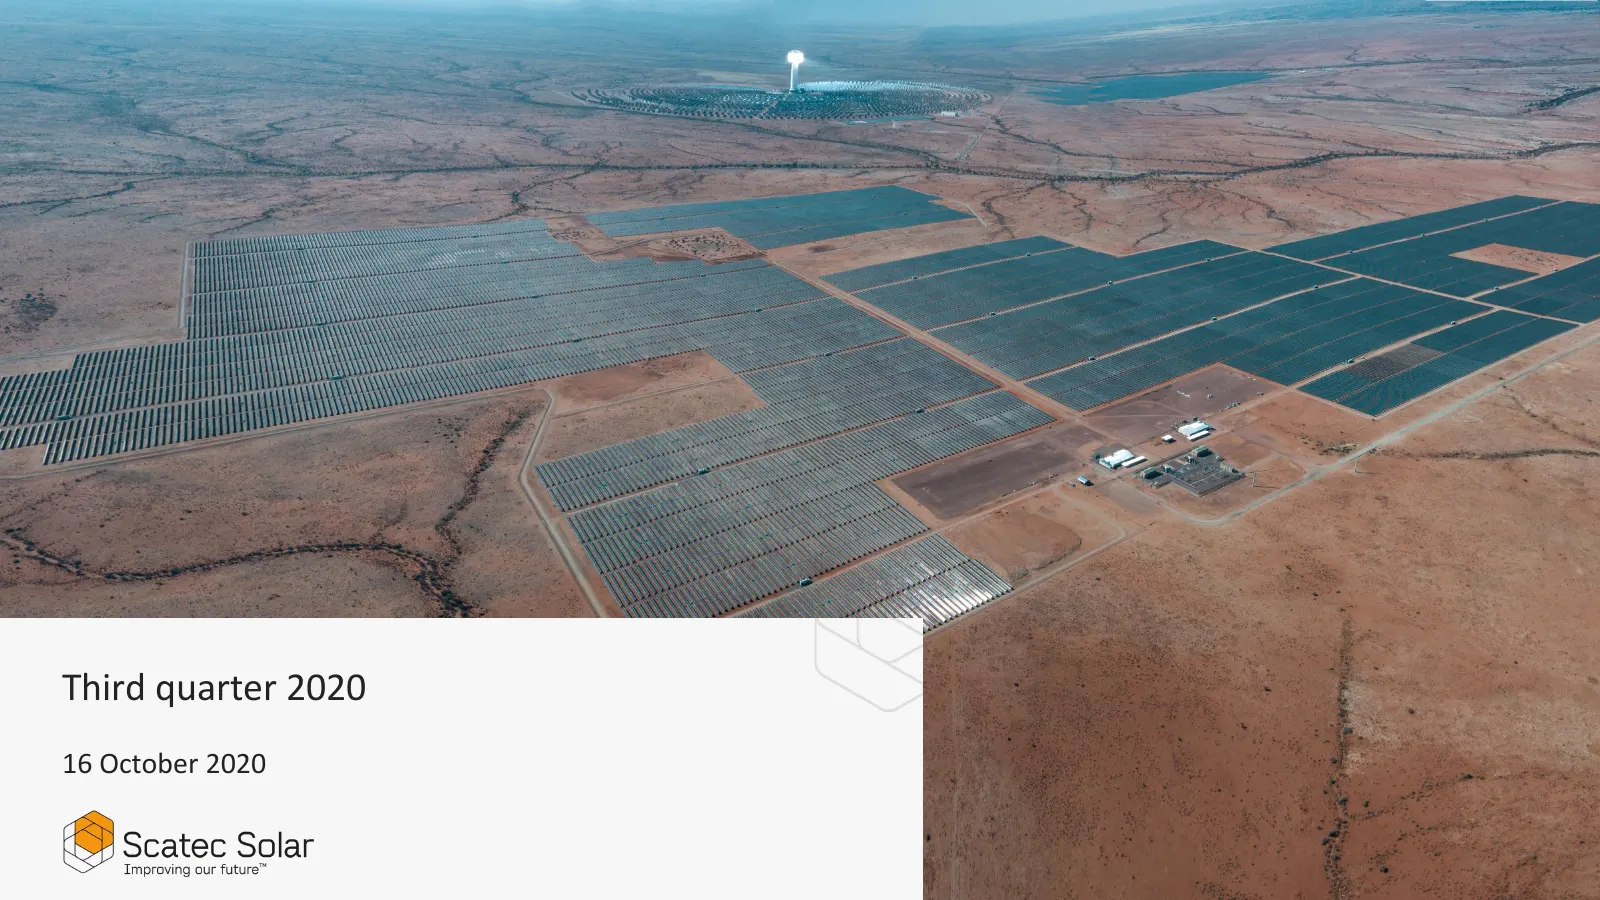
Slide 1: Third quarter 2020
Third quarter 2020 16 October 2020
Slide 2: Disclaimer
Disclaimer The following presentation is being made only to, and is only directed at, persons to whom such presentation may lawfully be communicated (’relevant persons’). Any person who is not a relevant person should not rely, act or make assessment on the basis of this presentation or anything inc
Slide 3: Agenda
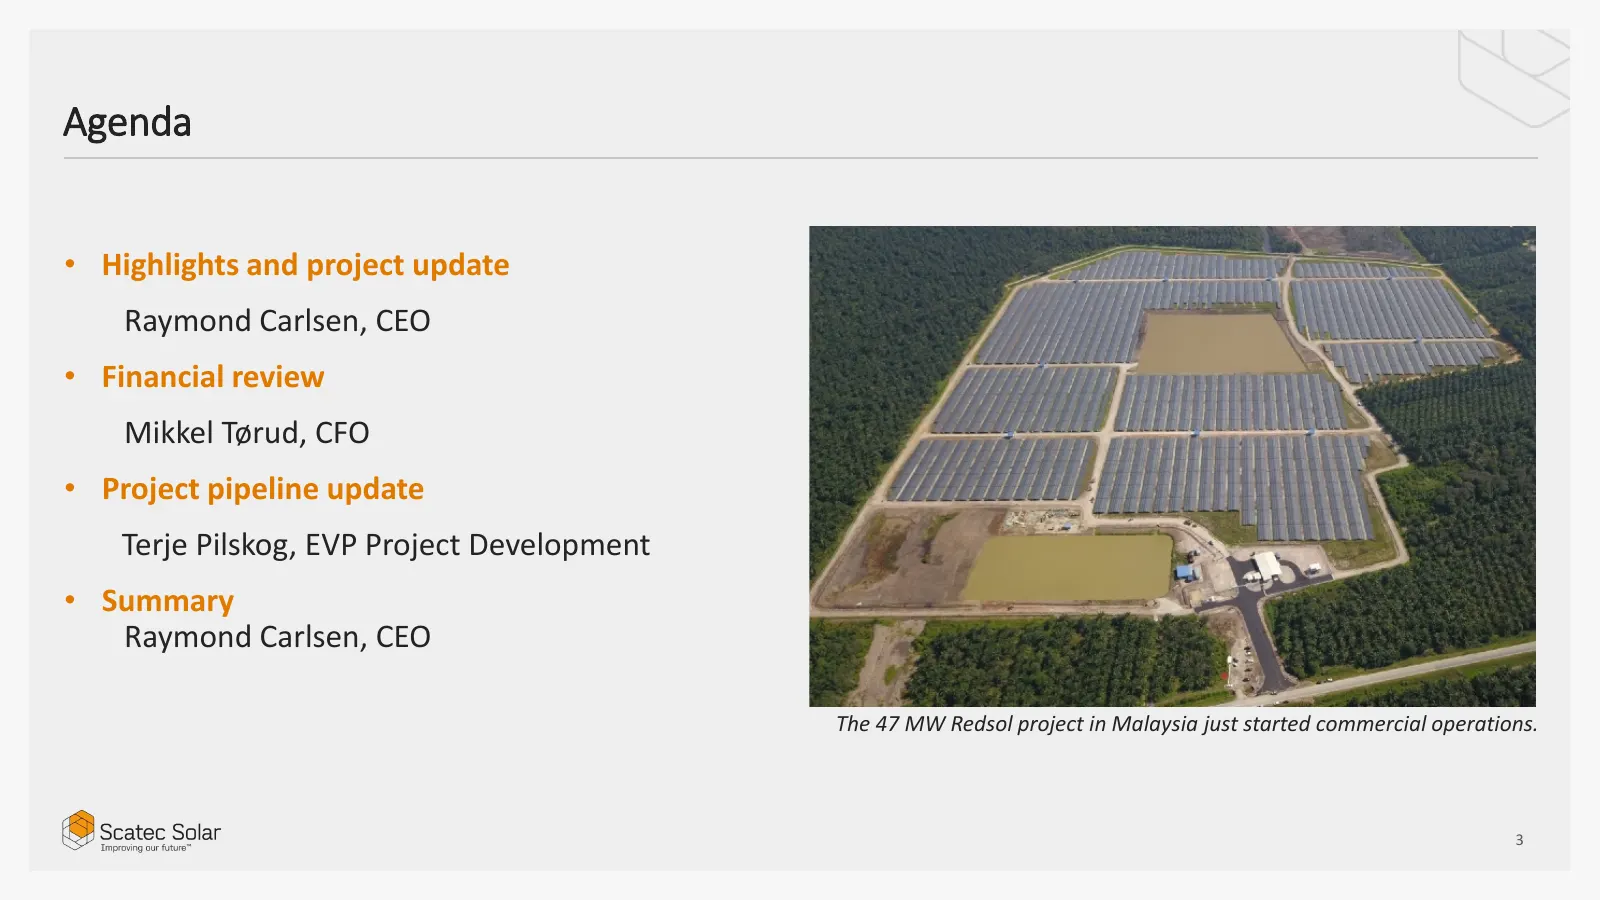
Agenda • Highlights and project update Raymond Carlsen, CEO • Financial review Mikkel Tørud, CFO • Project pipeline update Terje Pilskog, EVP Project Development • Summary Raymond Carlsen, CEO The 47 MW Redsol project in Malaysia just started commercial operations. 3
Slide 4: Acquisition of SN Power
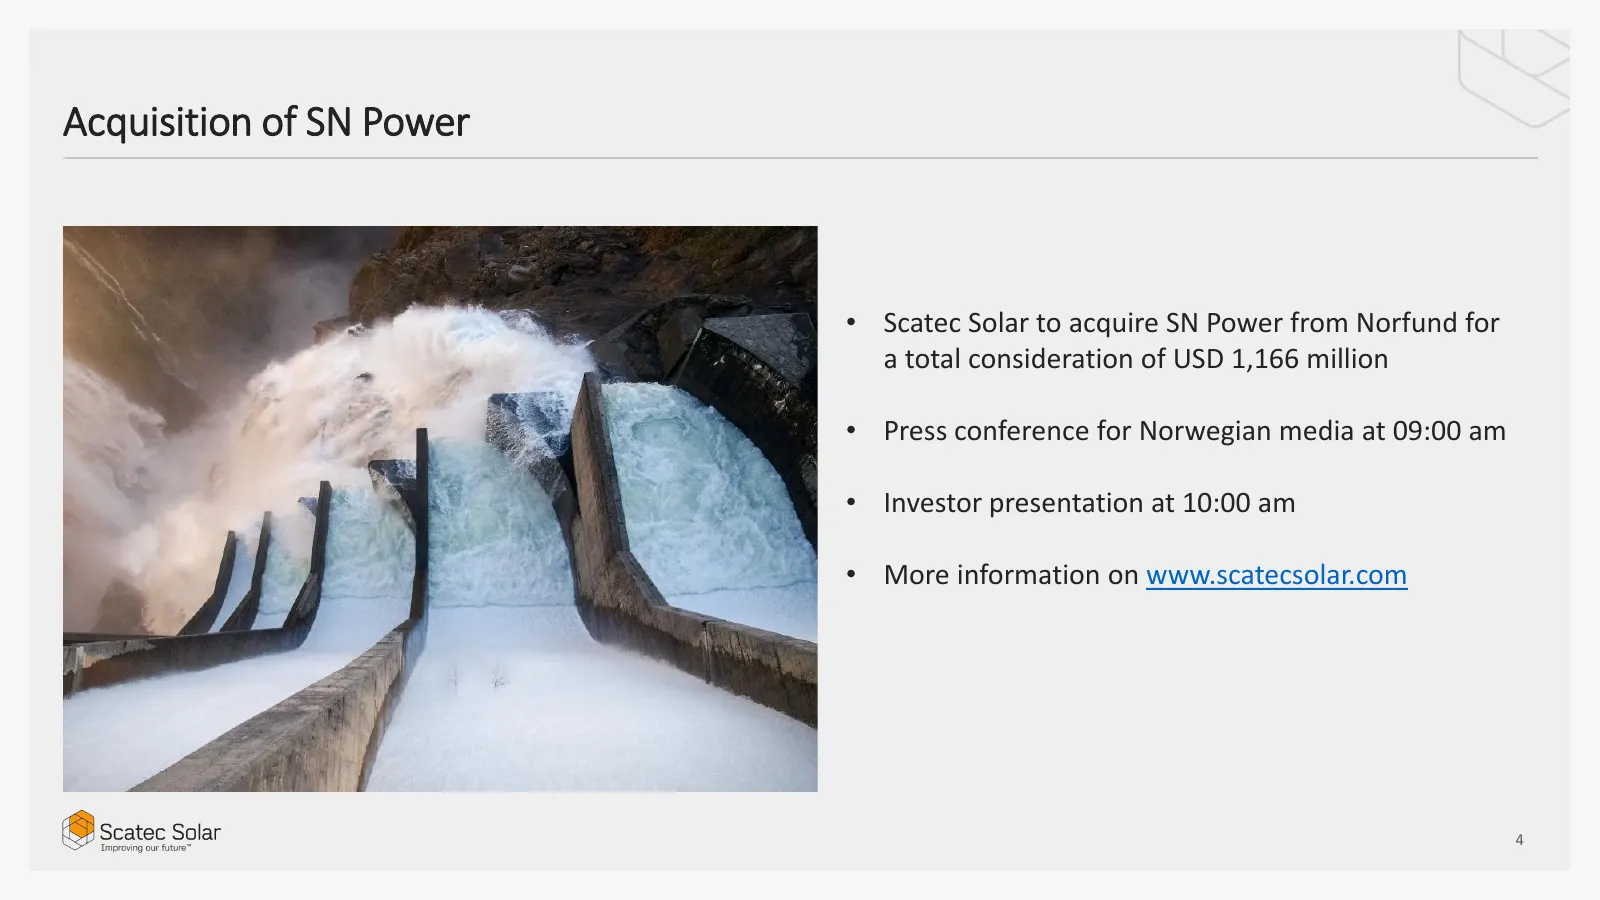
Acquisition of SN Power • Scatec Solar to acquire SN Power from Norfund for a total consideration of USD 1,166 million • Press conference for Norwegian media at 09:00 am • Investor presentation at 10:00 am • More information on www.scatecsolar.com 4
Slide 5: Increased power production and growth in project pipeline
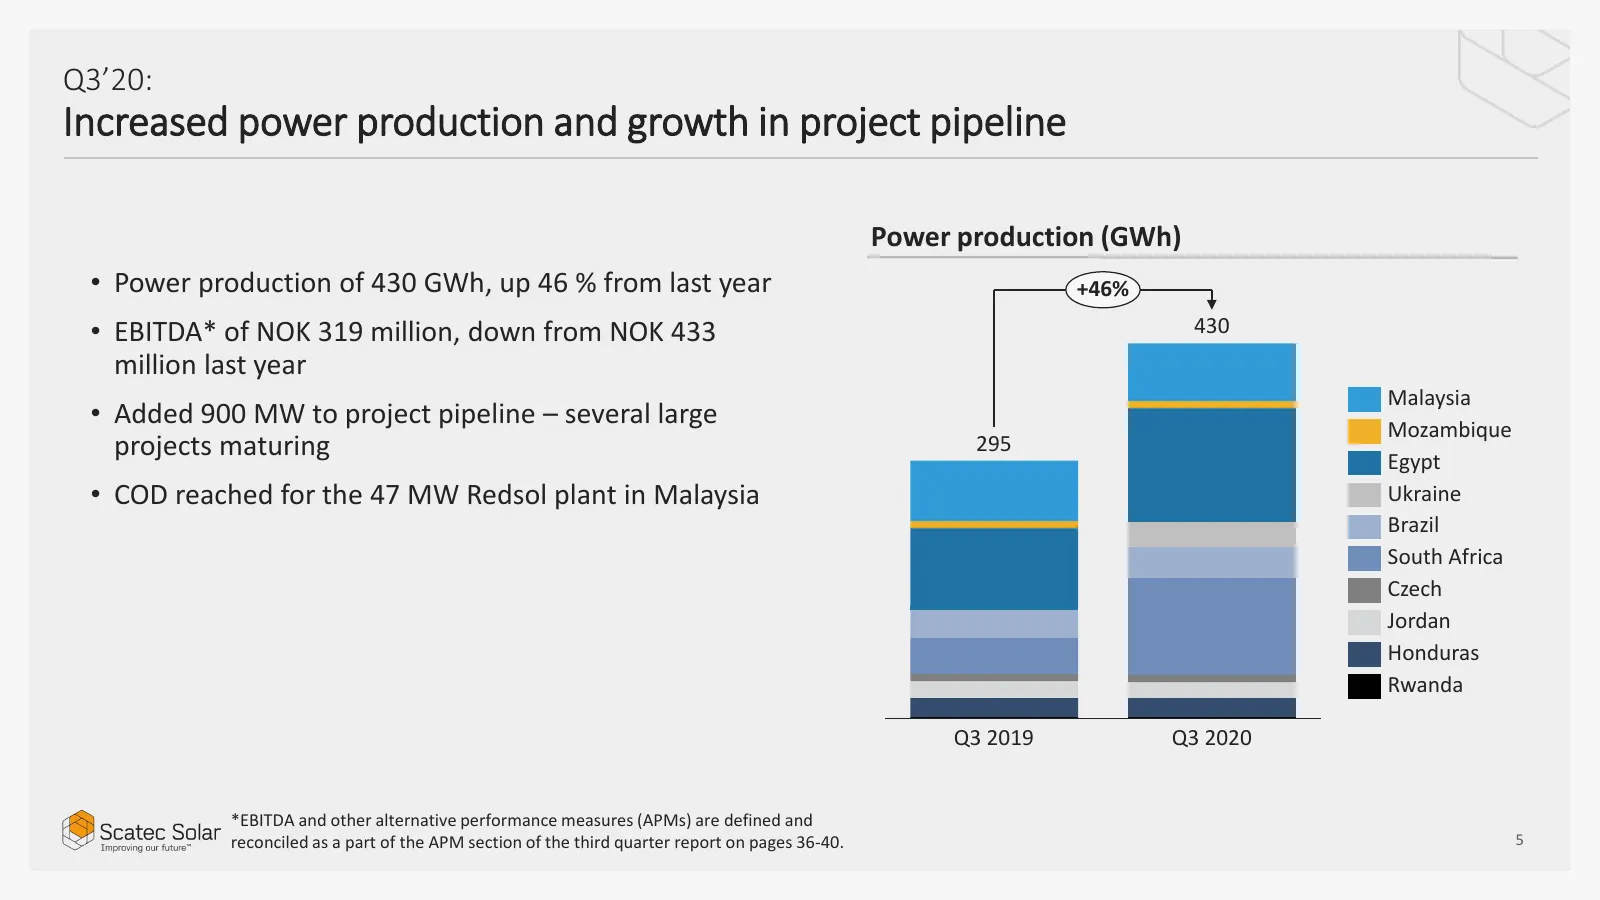
Q3’20: Increased power production and growth in project pipeline Power production (GWh) • Power production of 430 GWh, up 46 % from last year +46% • EBITDA* of NOK 319 million, down from NOK 433 430 million last year Malaysia • Added 900 MW to project pipeline – several large Mozambique projects mat
Slide 6: Diversified portfolio of 1.9 GW in operation and under construction
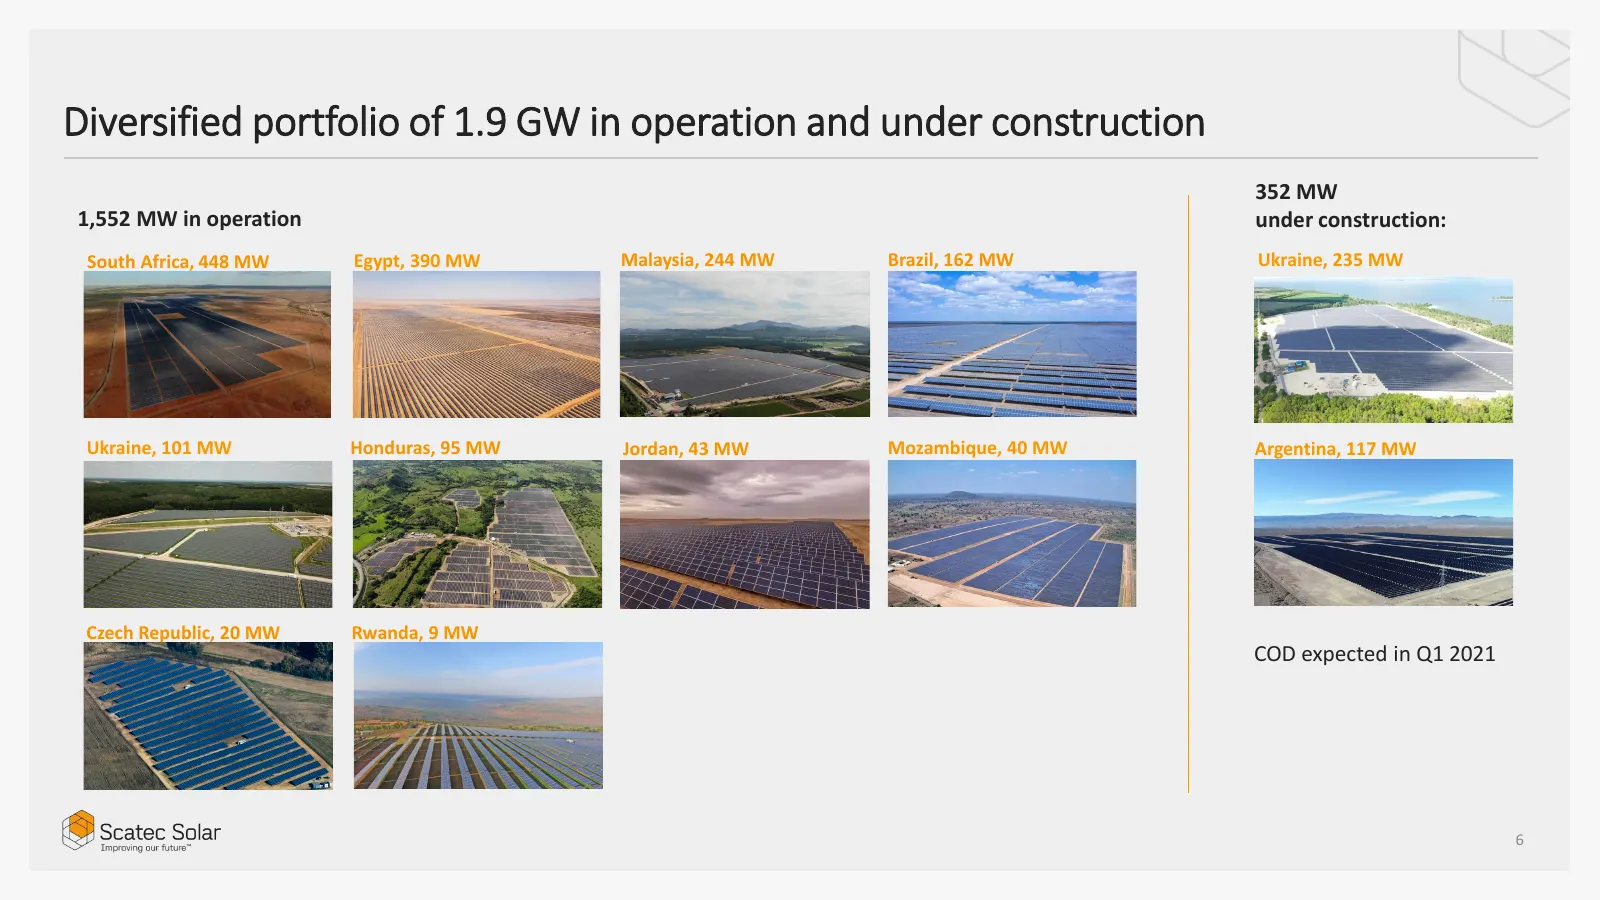
Diversified portfolio of 1.9 GW in operation and under construction 352 MW 1,552 MW in operation under construction: South Africa, 448 MW Egypt, 390 MW Malaysia, 244 MW Brazil, 162 MW Ukraine, 235 MW Ukraine, 101 MW Honduras, 95 MW Jordan, 43 MW Mozambique, 40 MW Argentina, 117 MW Czech Republic, 20
Slide 7: Financial review
Financial review Mikkel Tørud, CFO 7
Slide 8: Increased power production – strong growth in project pipeline
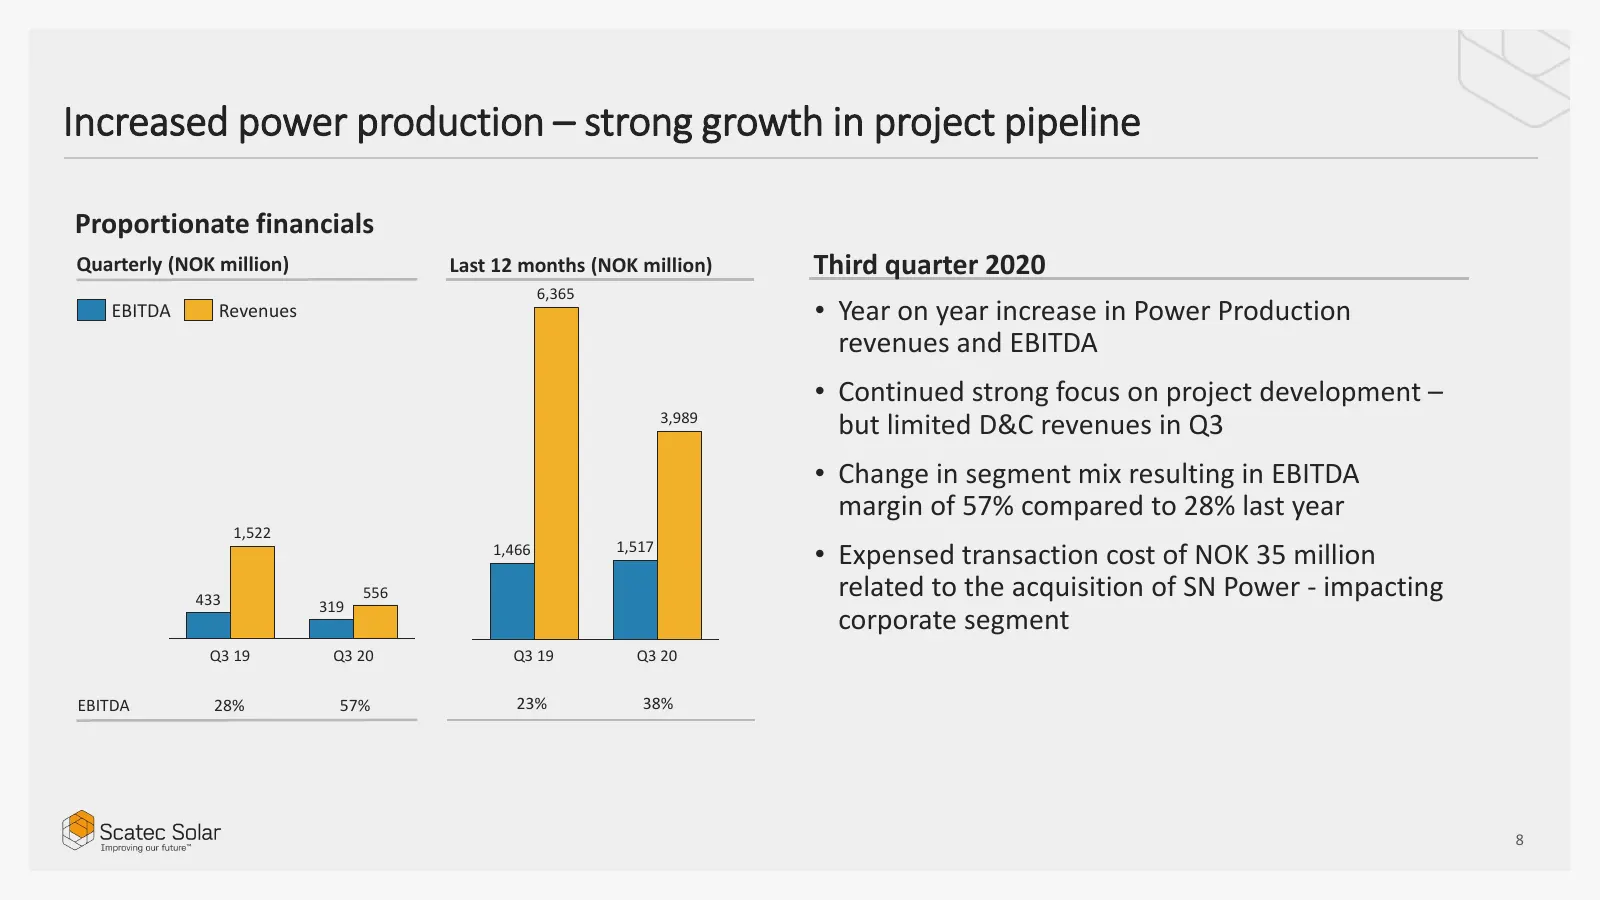
Increased power production – strong growth in project pipeline Proportionate financials Quarterly (NOK million) Last 12 months (NOK million) Third quarter 2020 6,365 EBITDA Revenues • Year on year increase in Power Production revenues and EBITDA • Continued strong focus on project development – 3,98
Slide 9: Steadily increasing power production
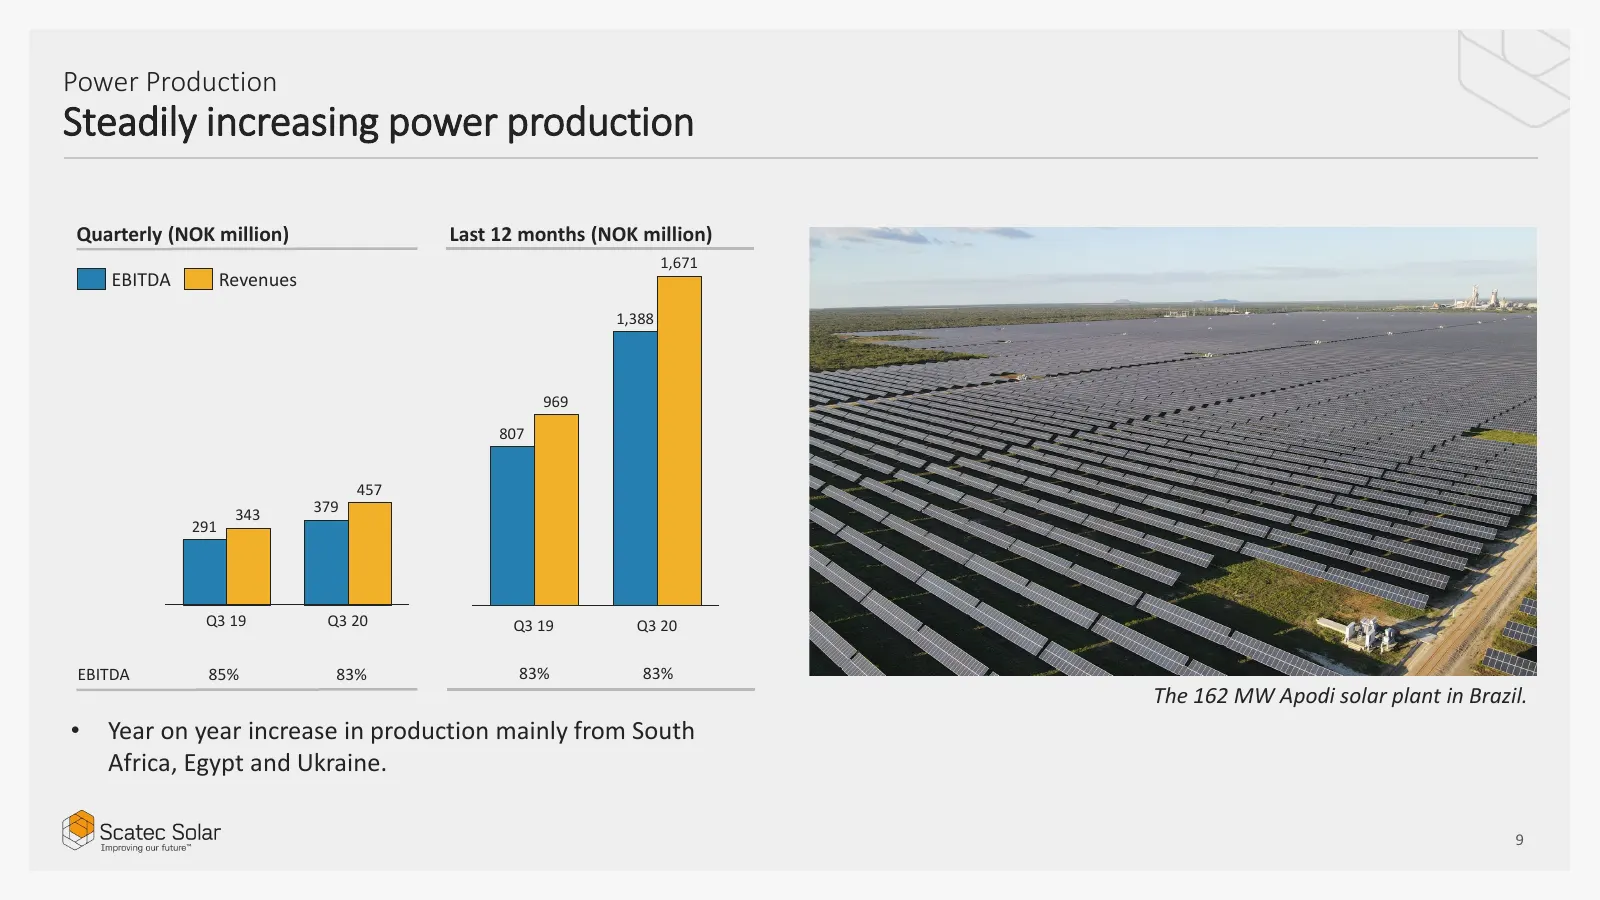
Power Production Steadily increasing power production Quarterly (NOK million) Last 12 months (NOK million) 1,671 EBITDA Revenues 1,388 969 807 457 343 379 291 Q3 19 Q3 20 Q3 19 Q3 20 EBITDA 85% 83% 83% 83% The 162 MW Apodi solar plant in Brazil. • Year on year increase in production mainly from Sout
Slide 10: Revenues growth while EBITDA is affected by O&M contract mix effects
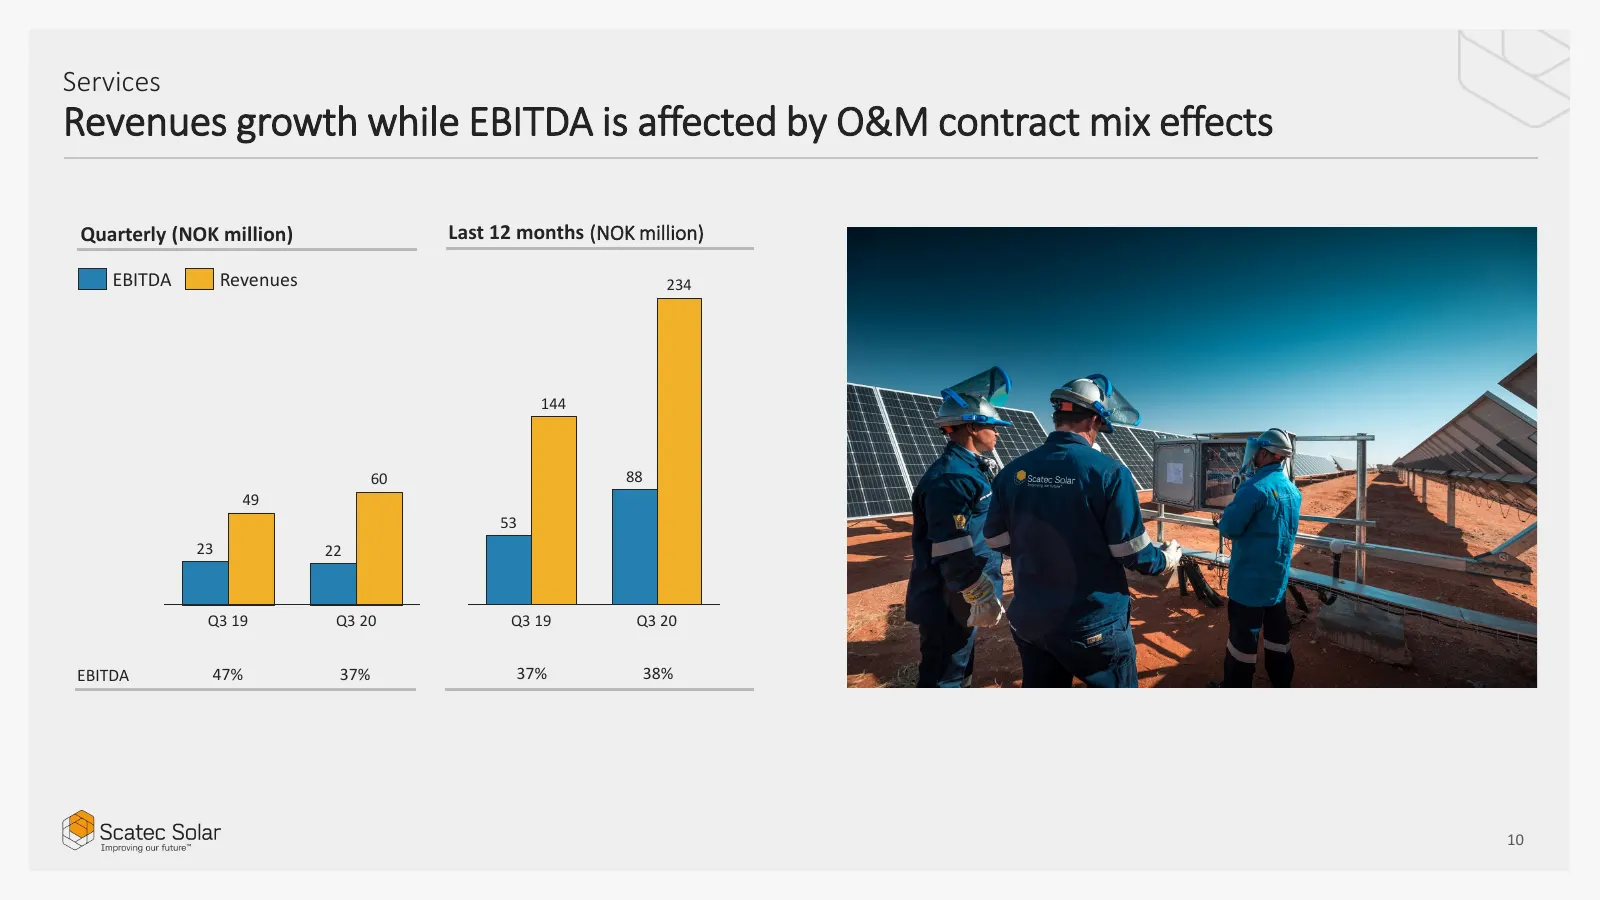
Services Revenues growth while EBITDA is affected by O&M contract mix effects Quarterly (NOK million) Last 12 months (NOK million) EBITDA Revenues 234 144 60 88 49 53 23 22 Q3 19 Q3 20 Q3 19 Q3 20 EBITDA 47% 37% 37% 38% 10
Slide 11: Low construction activity – strong project pipeline development
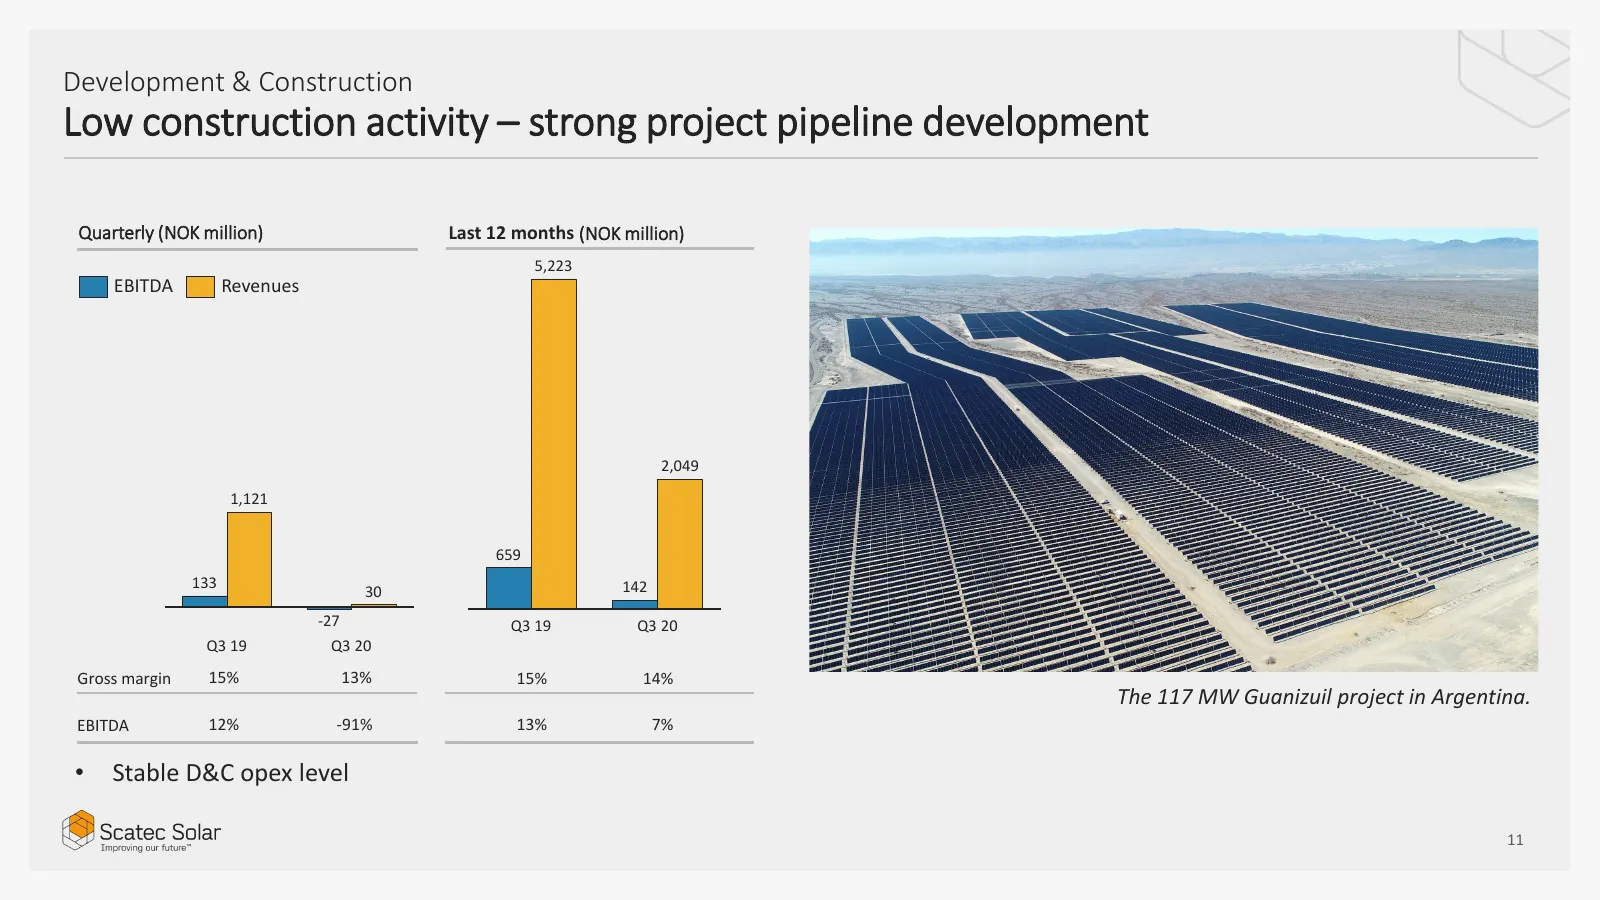
Development & Construction Low construction activity – strong project pipeline development Quarterly (NOK million) Last 12 months (NOK million) 5,223 EBITDA Revenues 2,049 1,121 659 133 142 30 -27 Q3 19 Q3 20 Q3 19 Q3 20 Gross margin 15% 13% 15% 14% The 117 MW Guanizuil project in Argentina. EBITDA
Slide 12: A solid financial position – NOK 3.5 billion of available liquidity
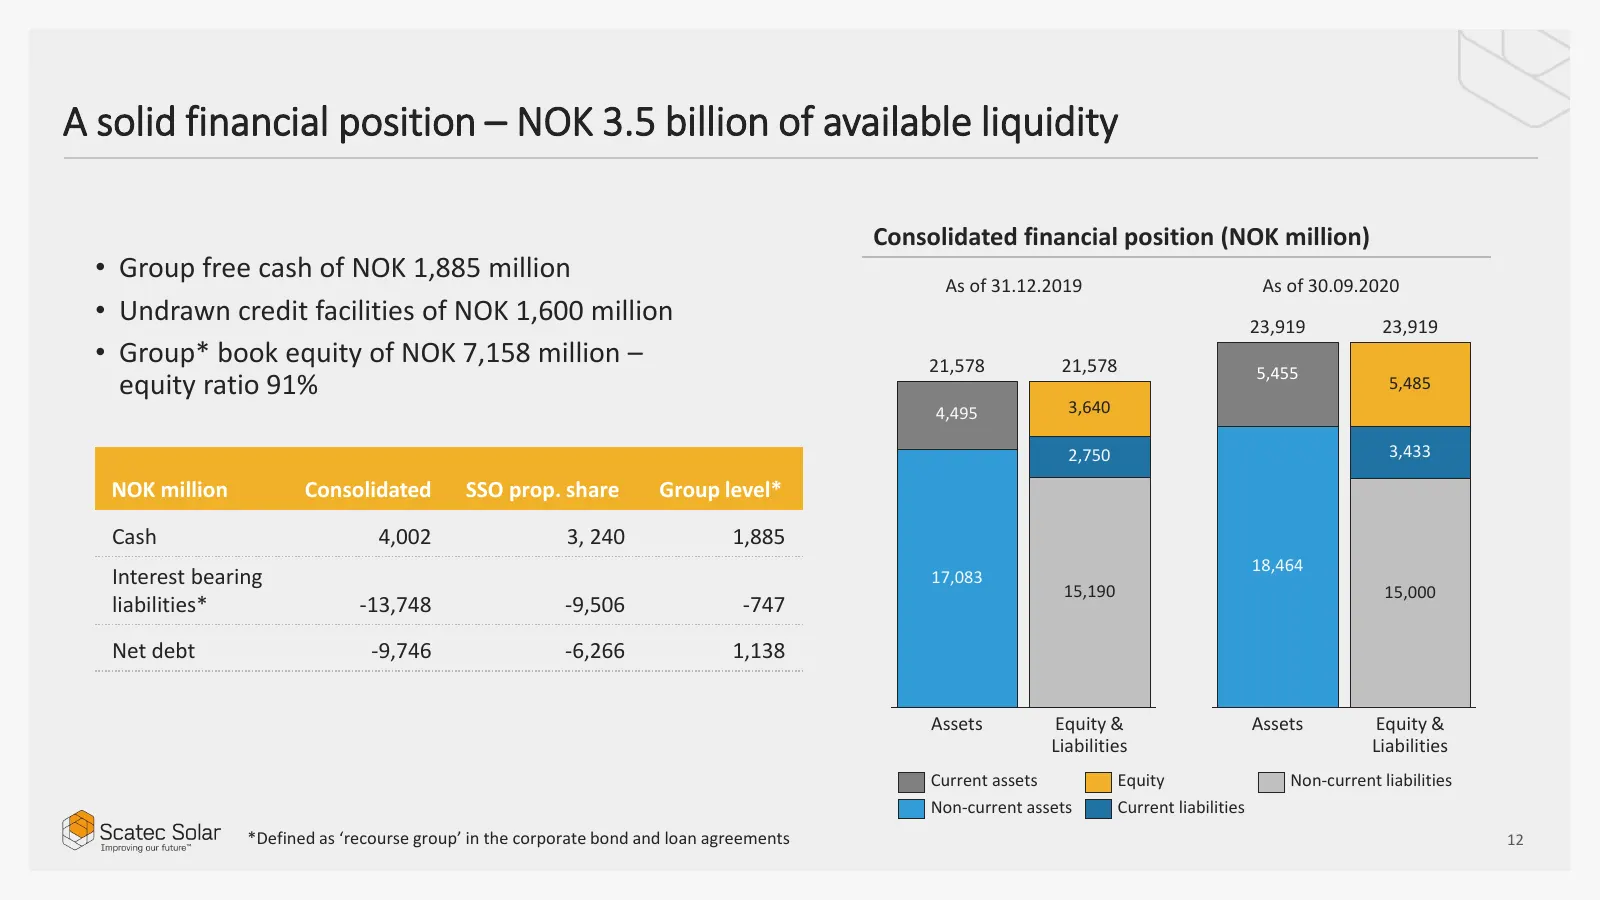
A solid financial position – NOK 3.5 billion of available liquidity Consolidated financial position (NOK million) • Group free cash of NOK 1,885 million As of 31.12.2019 As of 30.09.2020 • Undrawn credit facilities of NOK 1,600 million 23,919 23,919 • Group* book equity of NOK 7,158 million – 21,578
Slide 13: Q3'20 movement of free cash
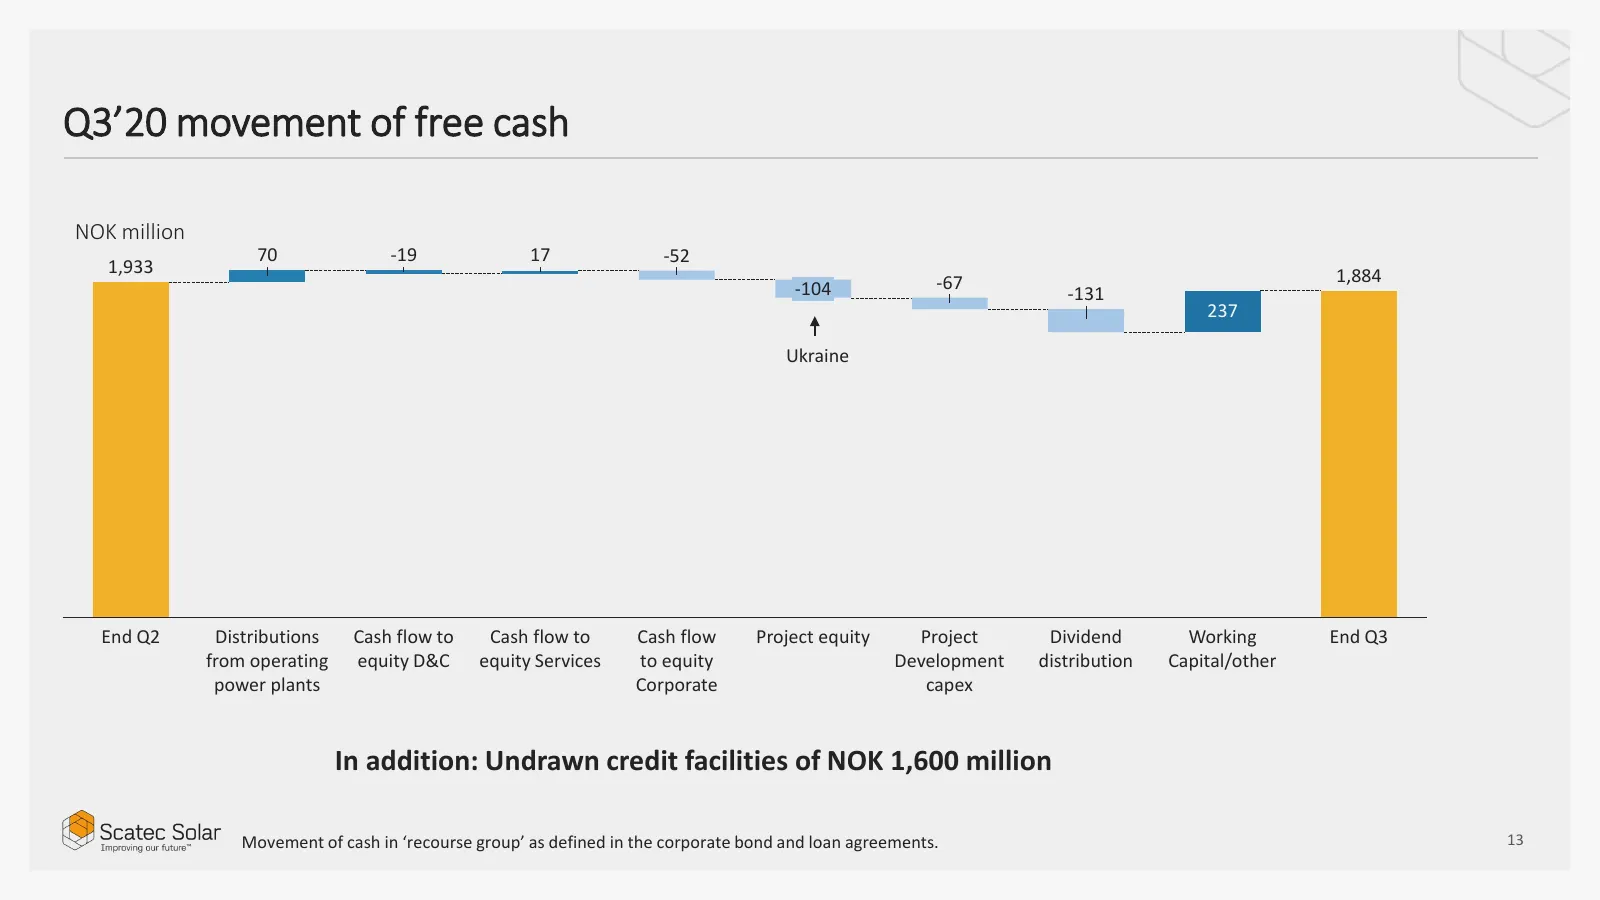
Q3’20 movement of free cash NOK million 70 -19 17 -52 1,933 1,884 -104 -67 -131 237 Ukraine End Q2 Distributions Cash flow to Cash flow to Cash flow Project equity Project Dividend Working End Q3 from operating equity D&C equity Services to equity Development distribution Capital/other power plants
Slide 14: Short term guidance
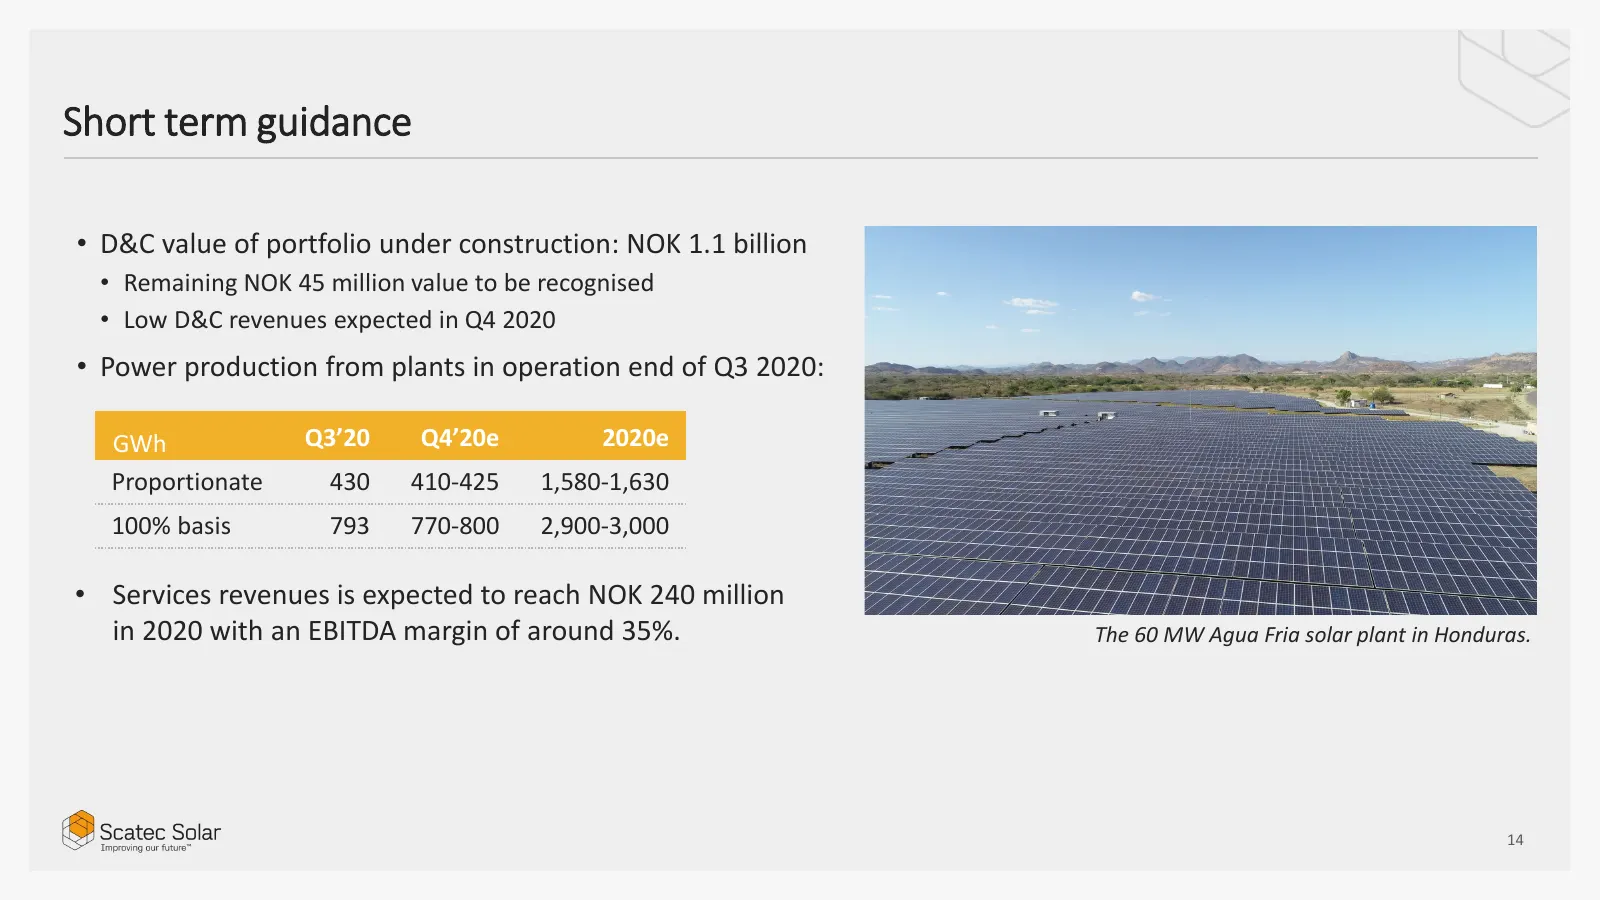
Short term guidance • D&C value of portfolio under construction: NOK 1.1 billion • Remaining NOK 45 million value to be recognised • Low D&C revenues expected in Q4 2020 • Power production from plants in operation end of Q3 2020: GWh Q3’20 Q4’20e 2020e Proportionate 430 410-425 1,580-1,630 100% basi
Slide 15: Project pipeline update
Project pipeline update Terje Pilskog, EVP Project Development 15
Slide 16: Project pipeline increased by 900 MW – several new large projects maturing
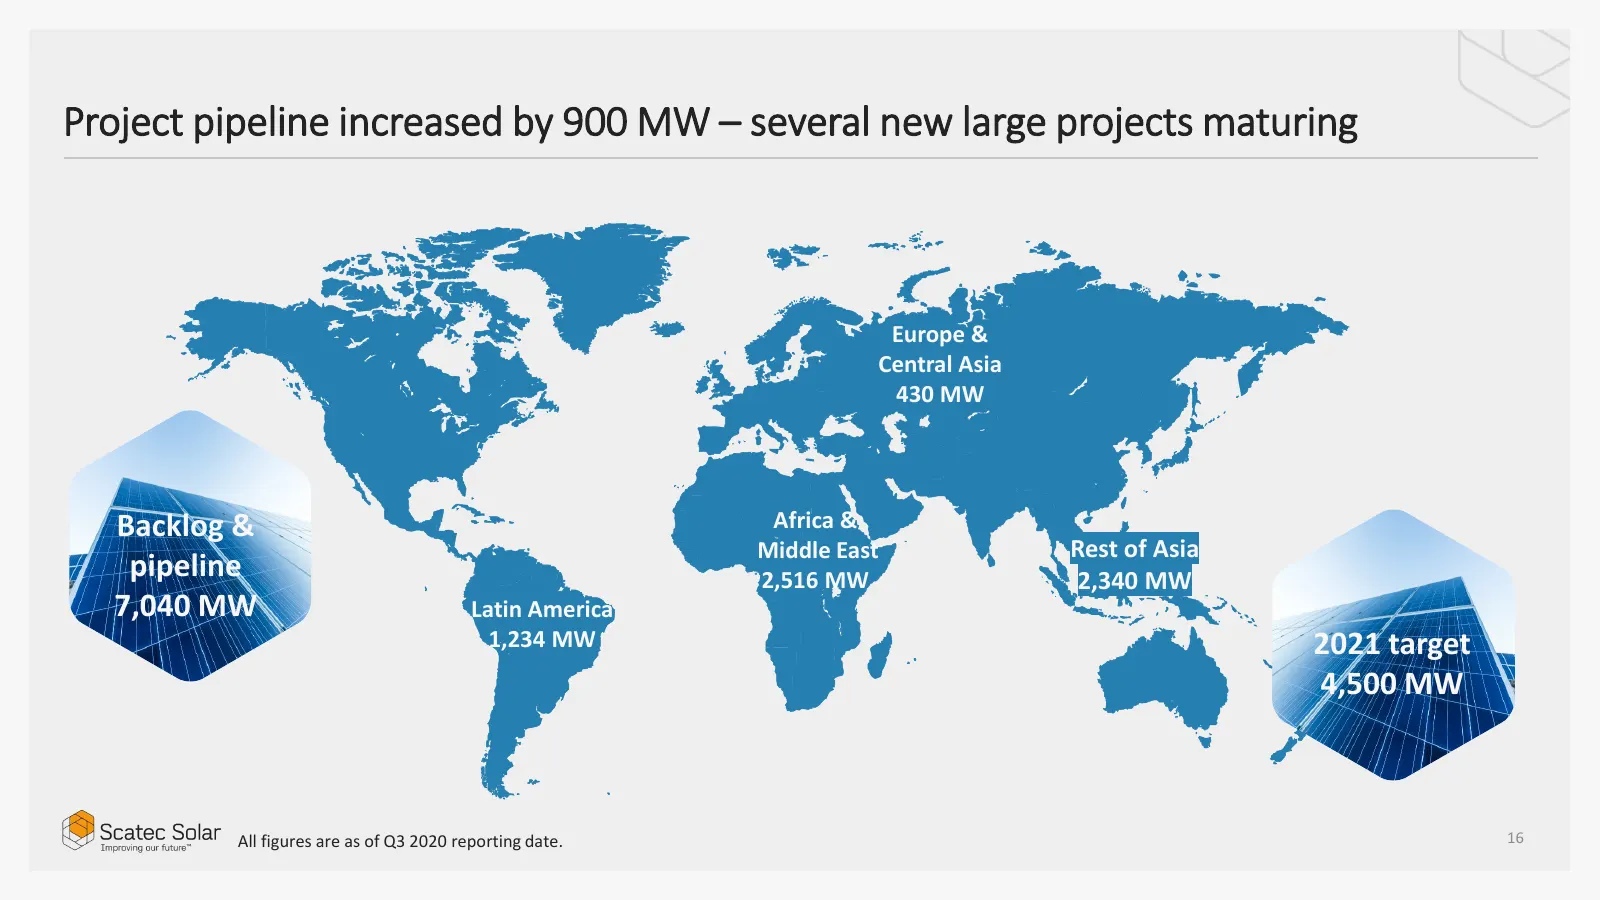
Project pipeline increased by 900 MW – several new large projects maturing Europe & Central Asia 430 MW Backlog & Africa & Middle East Rest of Asia pipeline 2,516 MW 2,340 MW 7,040 MW Latin America 1,234 MW 2021 target 4,500 MW All figures are as of Q3 2020 reporting date. 16
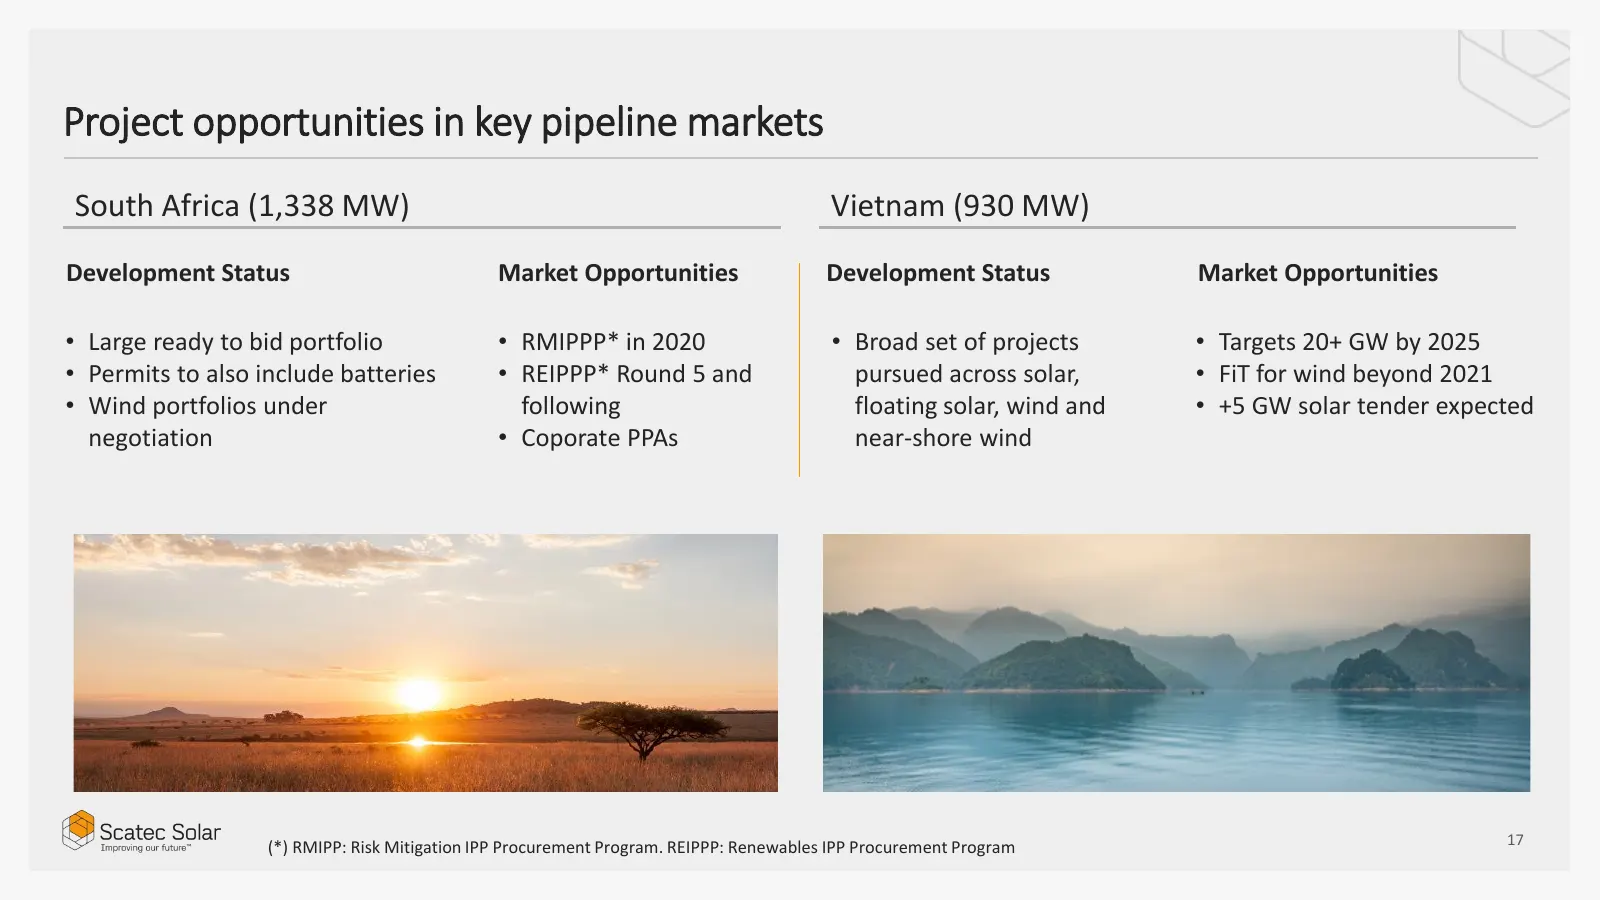
Slide 17: Project opportunities in key pipeline markets
Project opportunities in key pipeline markets South Africa (1,338 MW) Vietnam (930 MW) Development Status Market Opportunities Development Status Market Opportunities • Large ready to bid portfolio • RMIPPP* in 2020 • Broad set of projects • Targets 20+ GW by 2025 • Permits to also include batteries
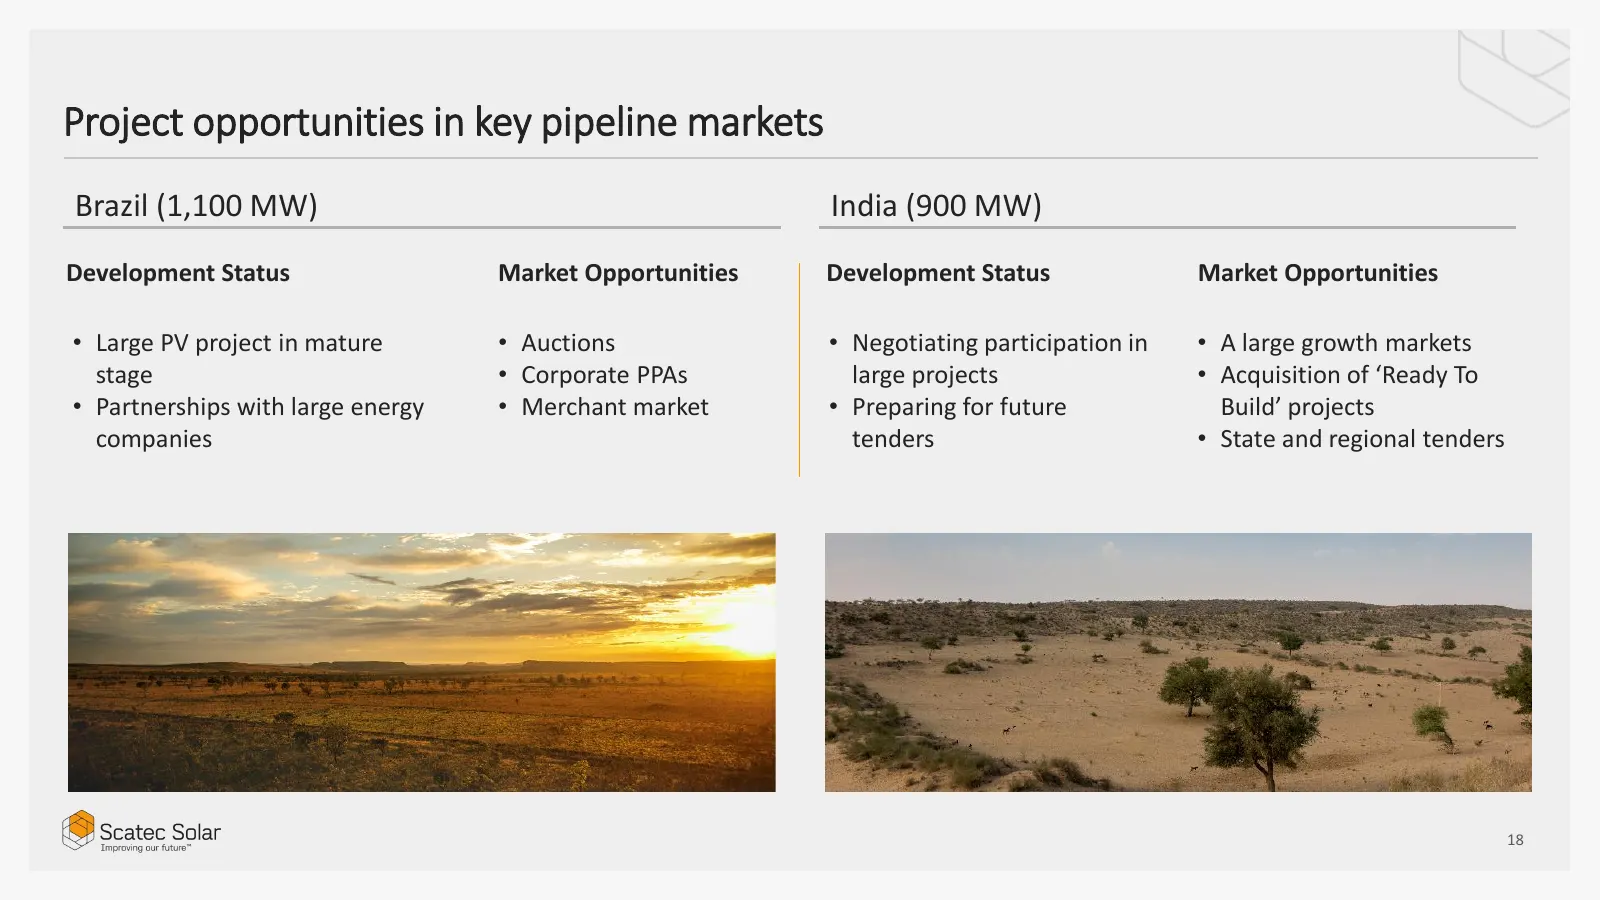
Slide 18: Project opportunities in key pipeline markets
Project opportunities in key pipeline markets Brazil (1,100 MW) India (900 MW) Development Status Market Opportunities Development Status Market Opportunities • Large PV project in mature • Auctions • Negotiating participation in • A large growth markets stage • Corporate PPAs large projects • Acqui
Slide 19: Outlook and summary
Outlook and summary Raymond Carlsen, CEO 19
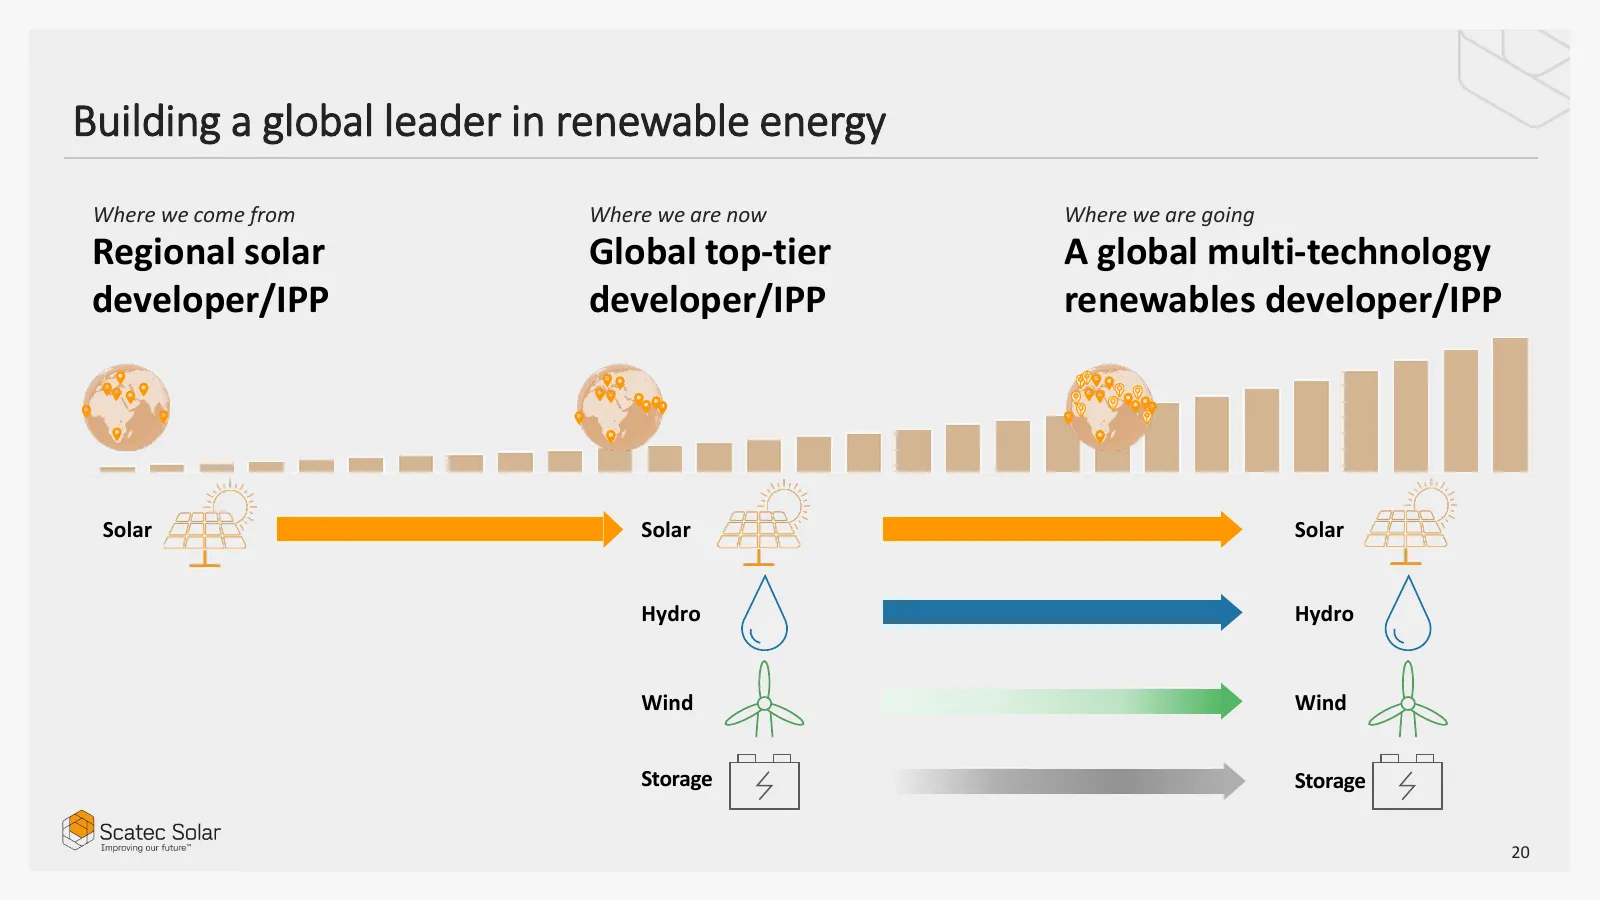
Slide 20: Building a global leader in renewable energy
Building a global leader in renewable energy Where we come from Where we are now Where we are going Regional solar Global top-tier A global multi-technology developer/IPP developer/IPP renewables developer/IPP Solar Solar Solar Hydro Hydro Wind Wind Storage Storage 20
Slide 21: Stable production and strong growth in project pipeline
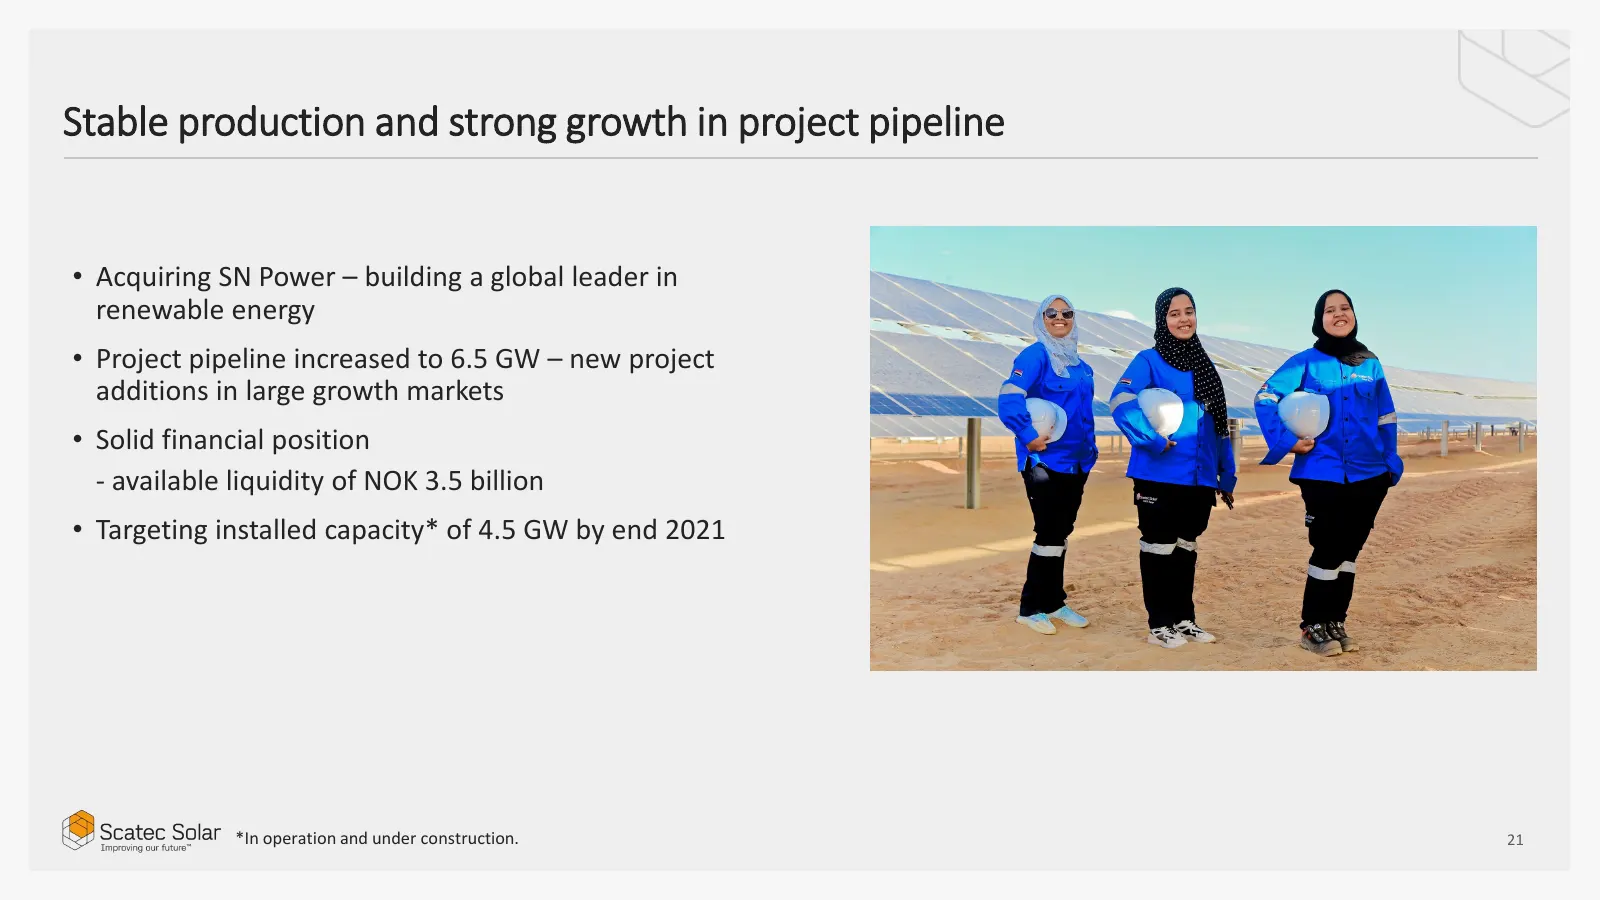
Stable production and strong growth in project pipeline • Acquiring SN Power – building a global leader in renewable energy • Project pipeline increased to 6.5 GW – new project additions in large growth markets • Solid financial position - available liquidity of NOK 3.5 billion • Targeting installed
Slide 22: Acquisition of SN Power
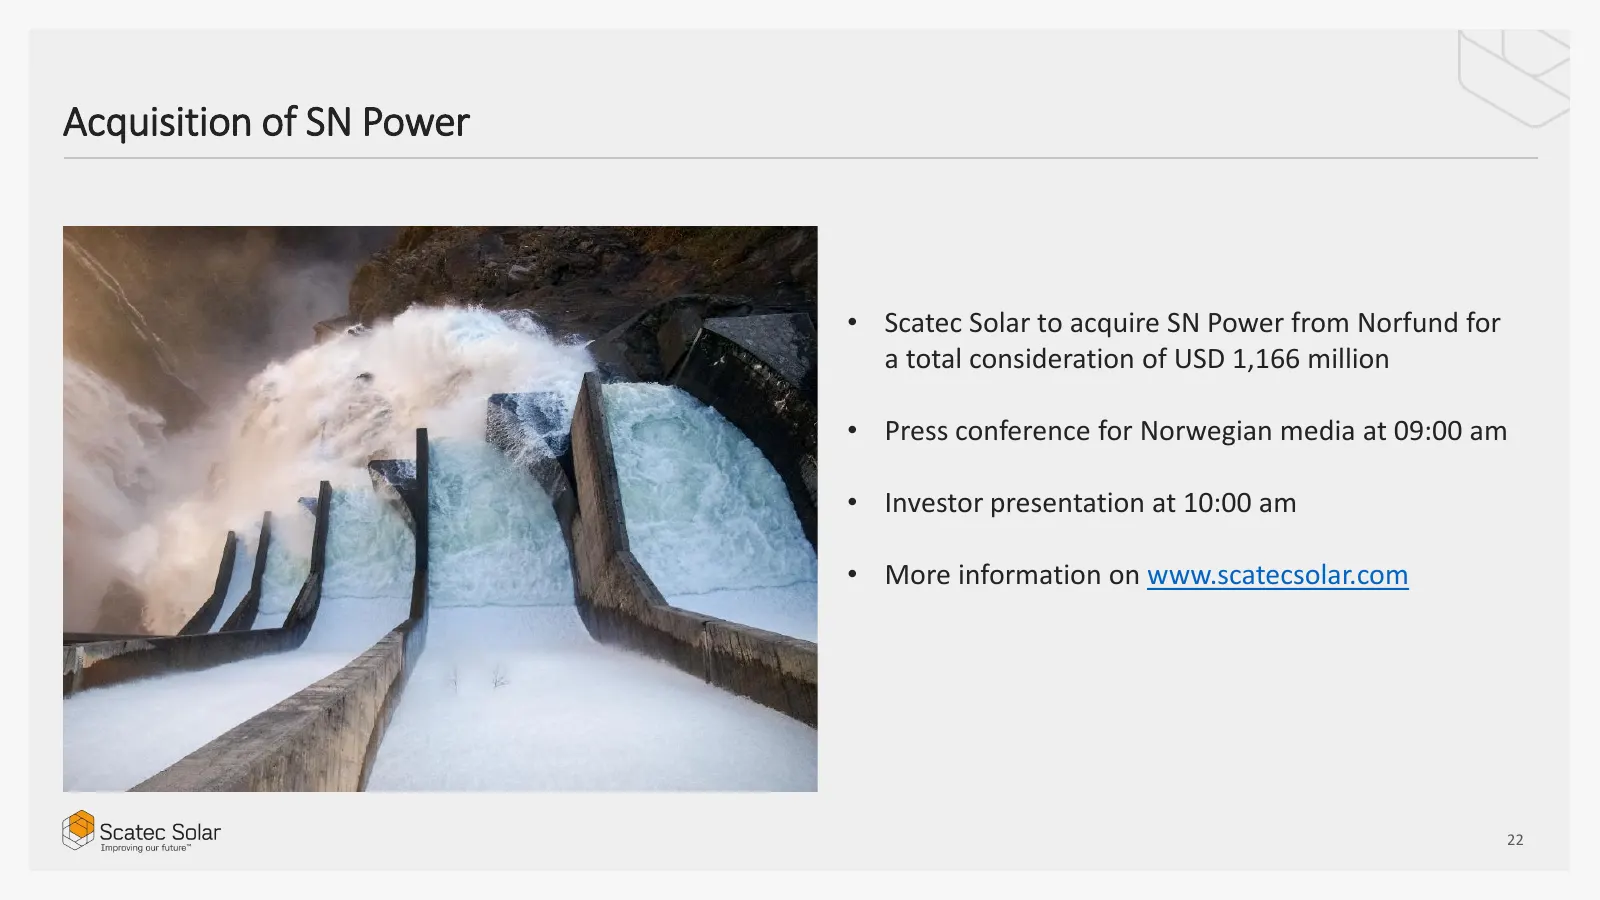
Acquisition of SN Power • Scatec Solar to acquire SN Power from Norfund for a total consideration of USD 1,166 million • Press conference for Norwegian media at 09:00 am • Investor presentation at 10:00 am • More information on www.scatecsolar.com 22
Slide 23: Thank you!
CCC ANN KI AS AN j}/ “if Hii Thank you! )Scatec Solar Improving our future™

Slide 24: Scatec Solar
Scatec Solar Improving our future™
Source: Internet Archive copy of scatec.com
More decks from Scatec ASA
 Q3 2026 Earnings Presentation32 slides · Oct 30, 2026
 Q2 2026 Earnings Presentation23 slides · Aug 21, 2026
 Investor Presentation (August 2026)22 slides · August 2026
 Q1 2026 Earnings Presentation23 slides · May 6, 2026
 Investor Presentation (March 2026)22 slides · March 2026
 Q4 2025 Earnings Presentation24 slides · Jan 30, 2026