Transformers and Rectifiers (India) Limited · NSE:TARIL
Transformers and Rectifiers (India) — Q2 FY2010 Earnings Presentation
17 slides from Transformers and Rectifiers (India)'s earnings presentation, Oct 14, 2009
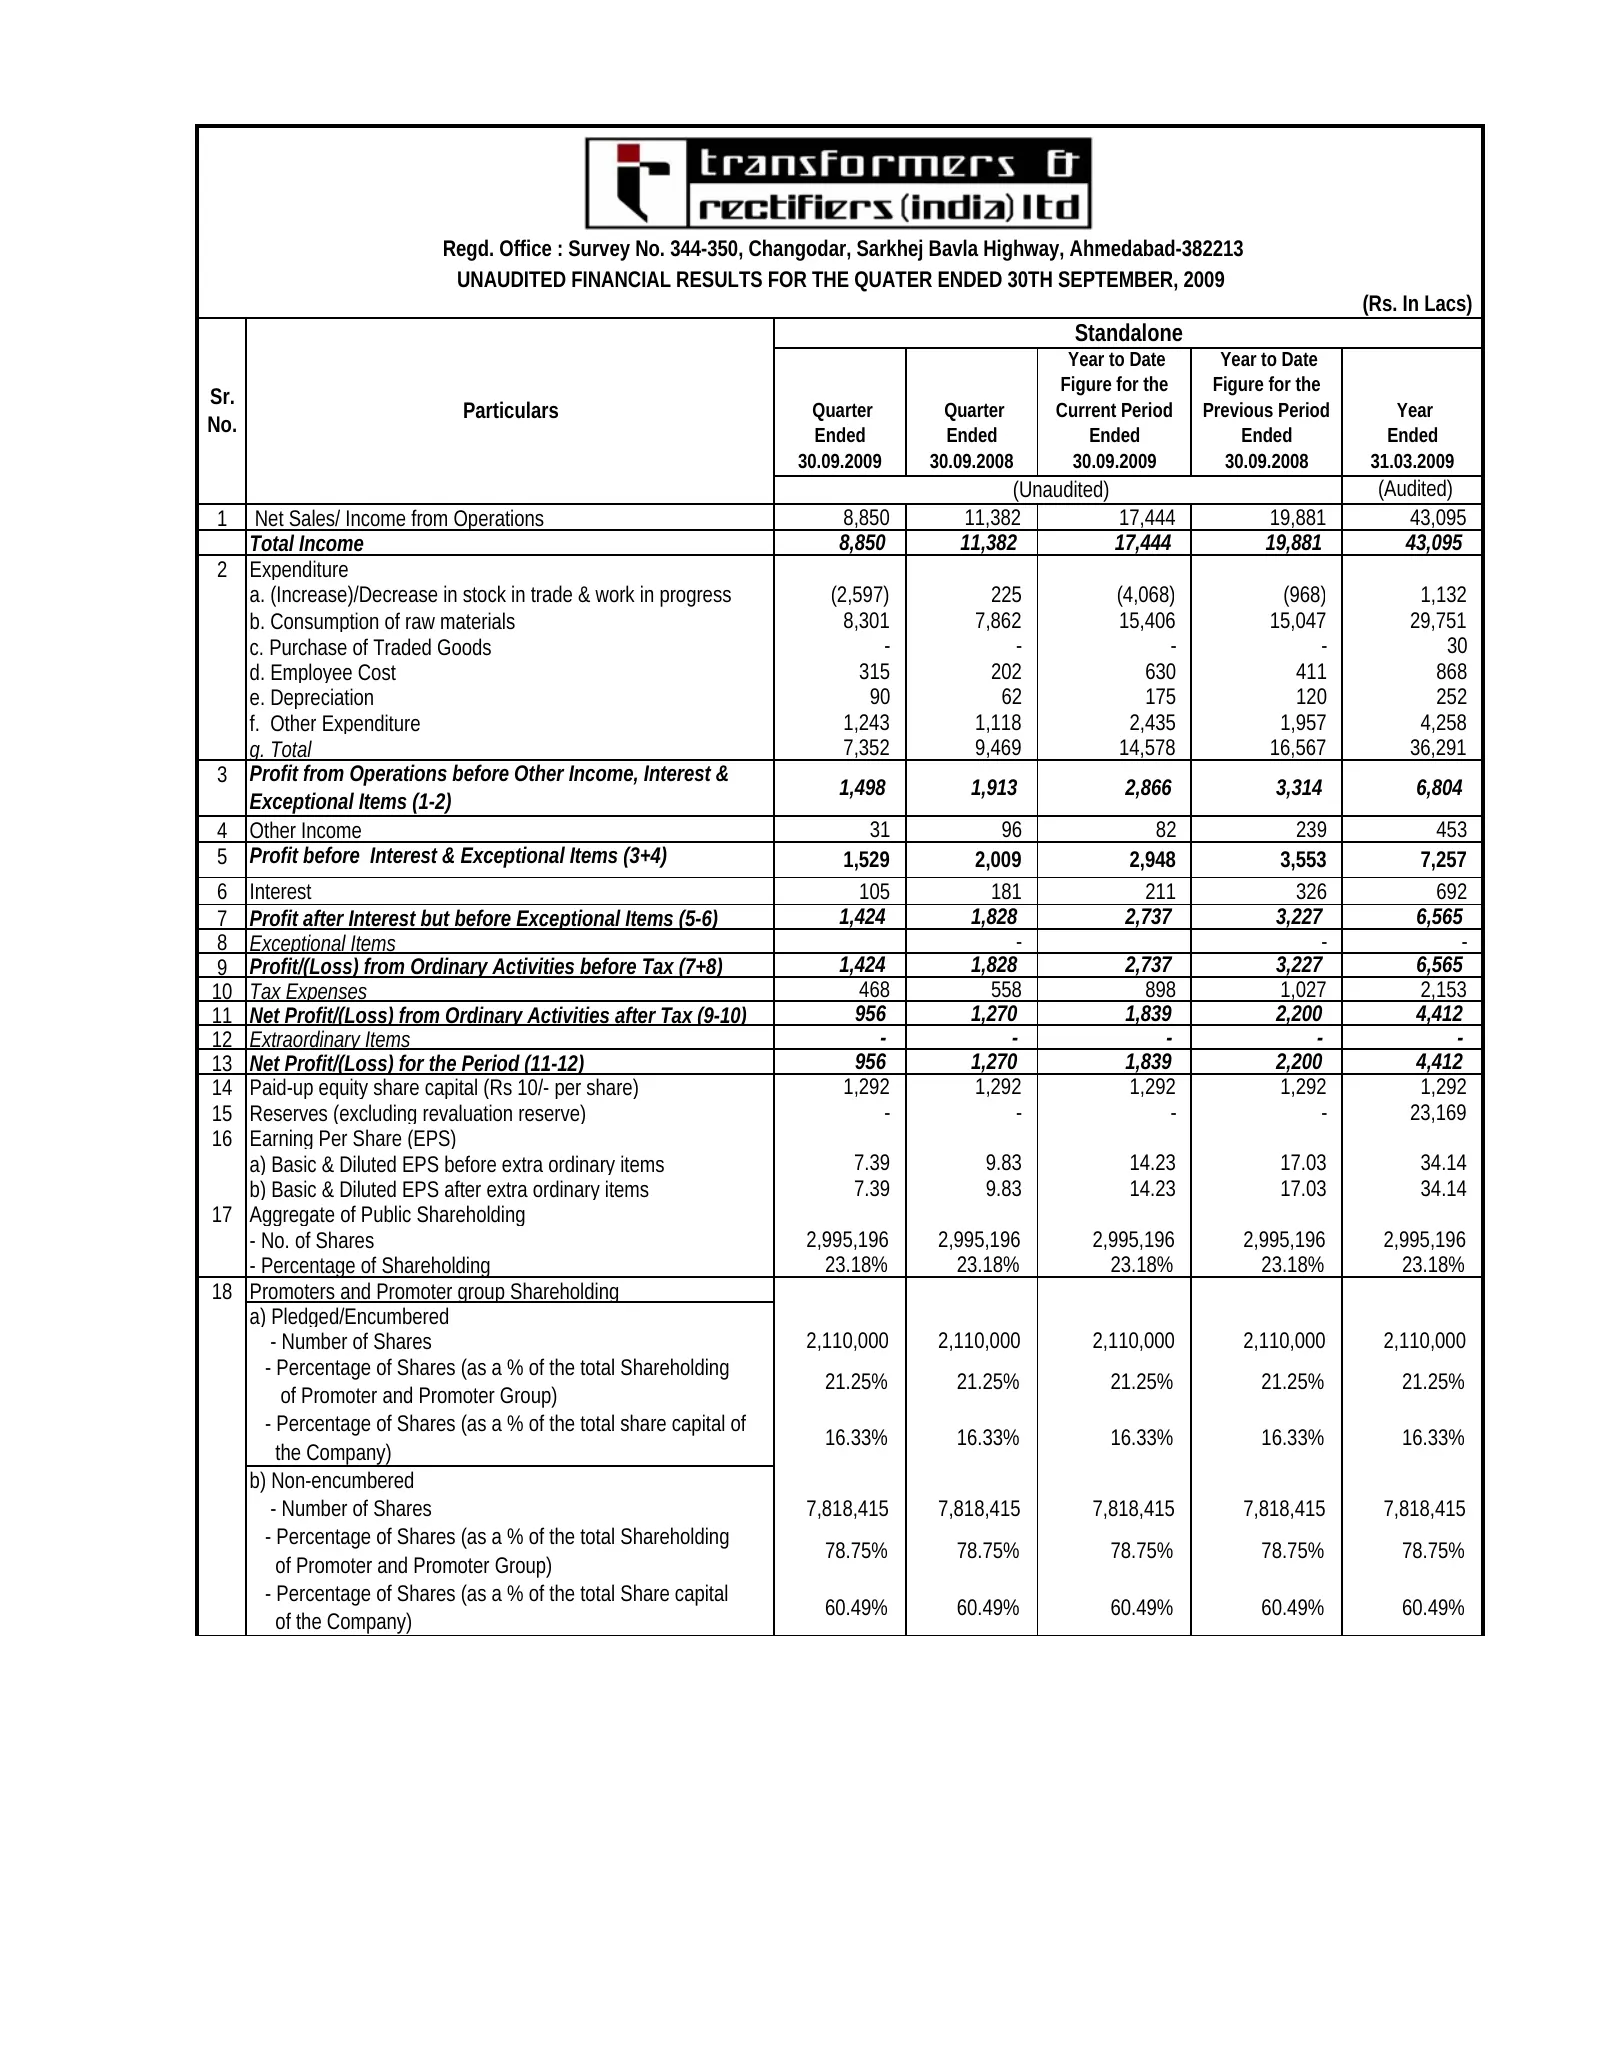
Slide 1: Unaudited Financial Results for the Quarter Ended 30th September 2009
Regd. Office : Survey No. 344-350, Changodar, Sarkhej Bavla Highway, Ahmedabad-382213 UNAUDITED FINANCIAL RESULTS FOR THE QUATER ENDED 30TH SEPTEMBER, 2009 (Rs. In Lacs) Standalone Year to Date Year to Date Figure for the Figure for the Sr. Particulars Quarter Quarter Current Period Previous Period
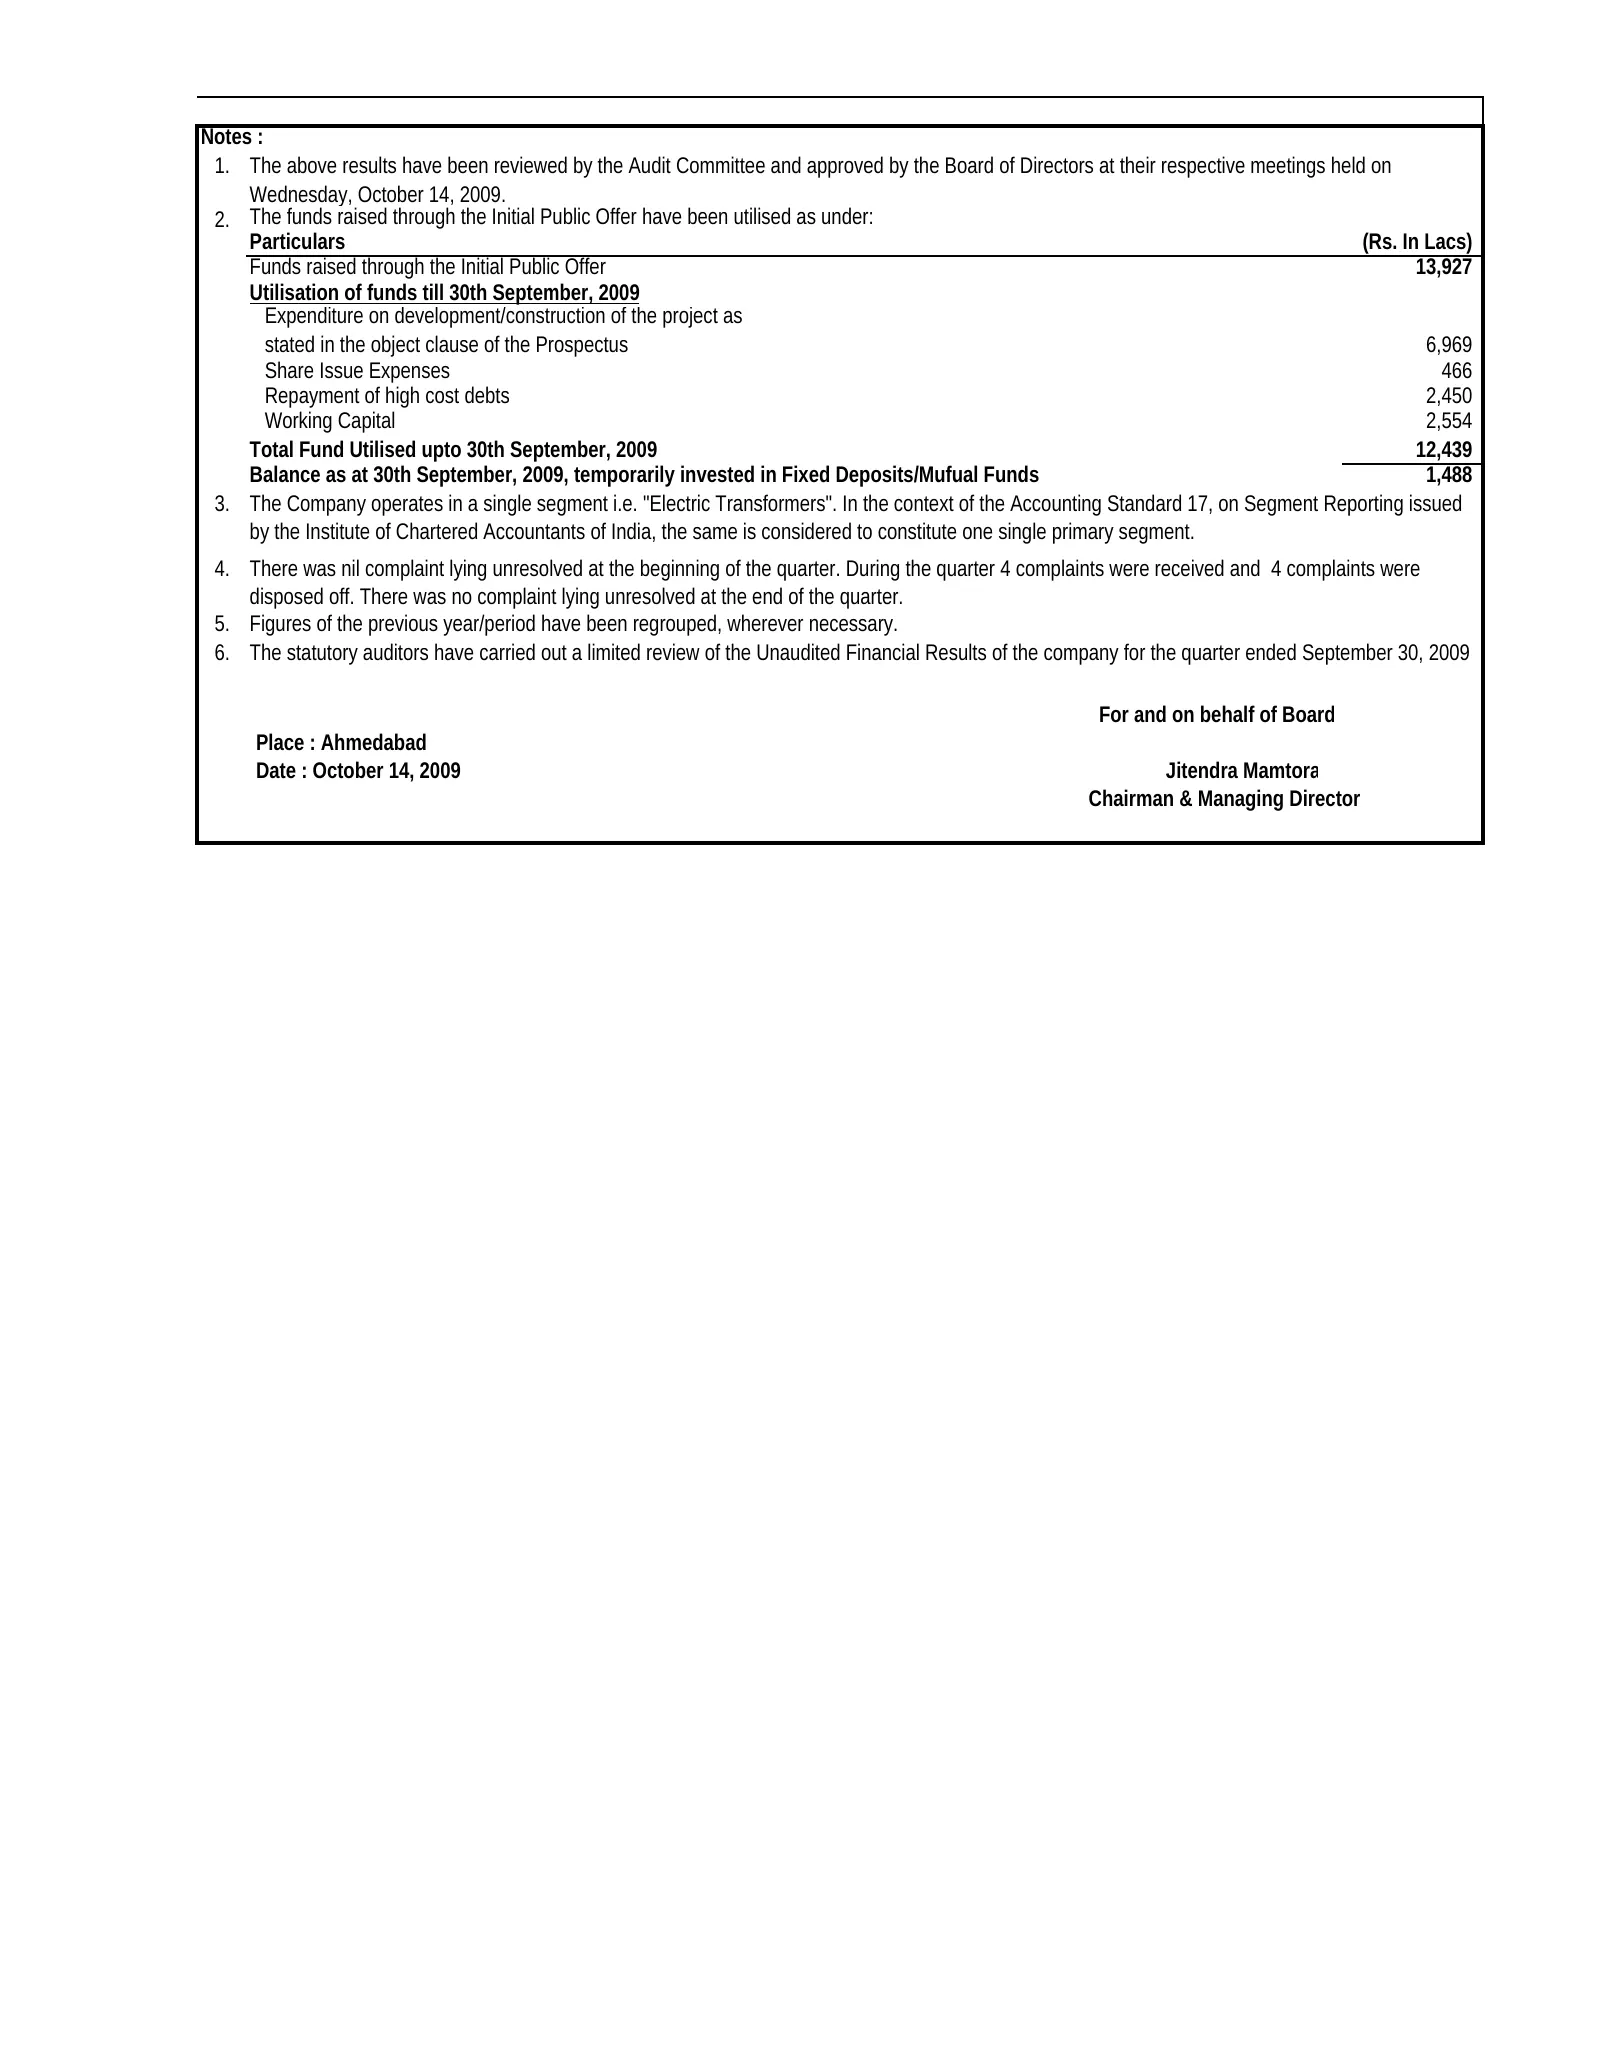
Slide 2: Notes to the Results
Notes : 1. The above results have been reviewed by the Audit Committee and approved by the Board of Directors at their respective meetings held on Wednesday, October 14, 2009. 2. The funds raised through the Initial Public Offer have been utilised as under: Particulars (Rs. In Lacs) Funds raised thr
Slide 3: Company Presentation Q2 FY'2010
Company Presentation Q2 FY’2010 Power to Empower 14th October’2009 www.transformerindia.com 1
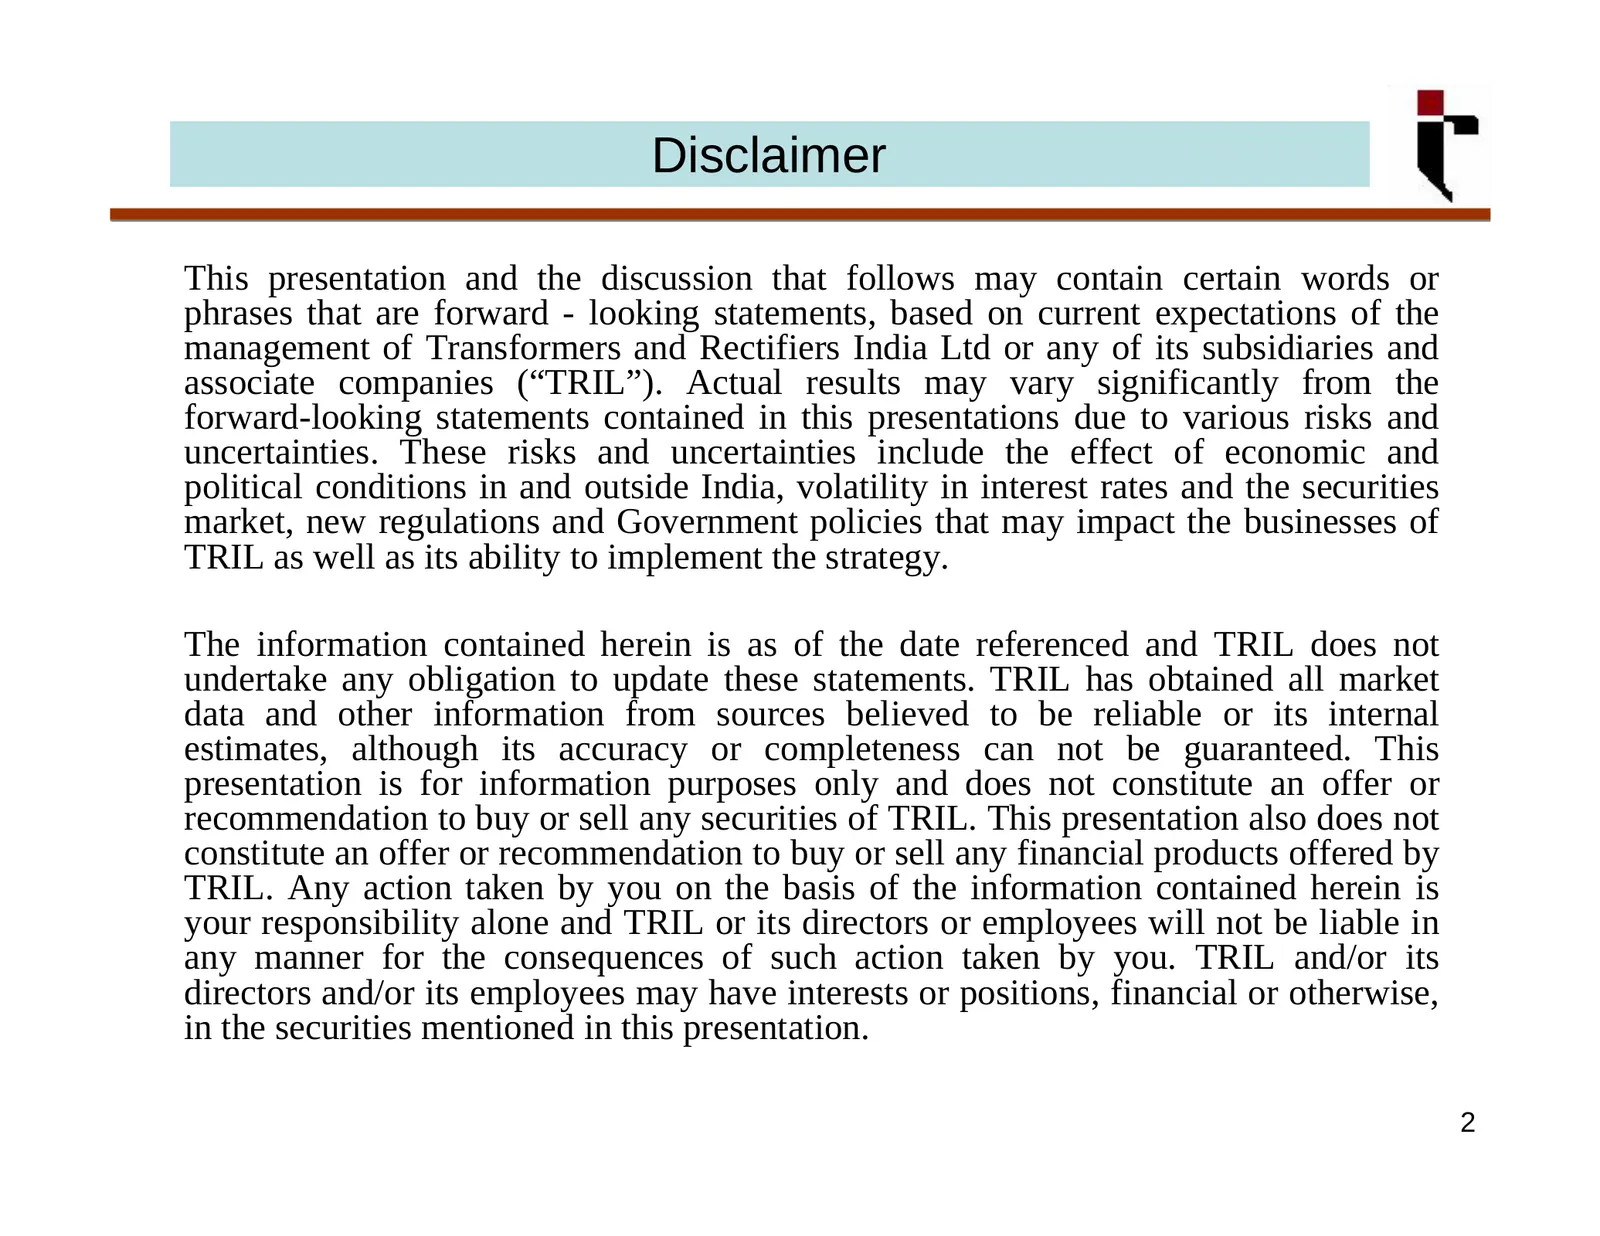
Slide 4: Disclaimer
Disclaimer This presentation and the discussion that follows may contain certain words or phrases that are forward - looking statements, based on current expectations of the management of Transformers and Rectifiers India Ltd or any of its subsidiaries and associate companies (“TRIL”). Actual result
Slide 5: 400 KV Transformer execution undertaken
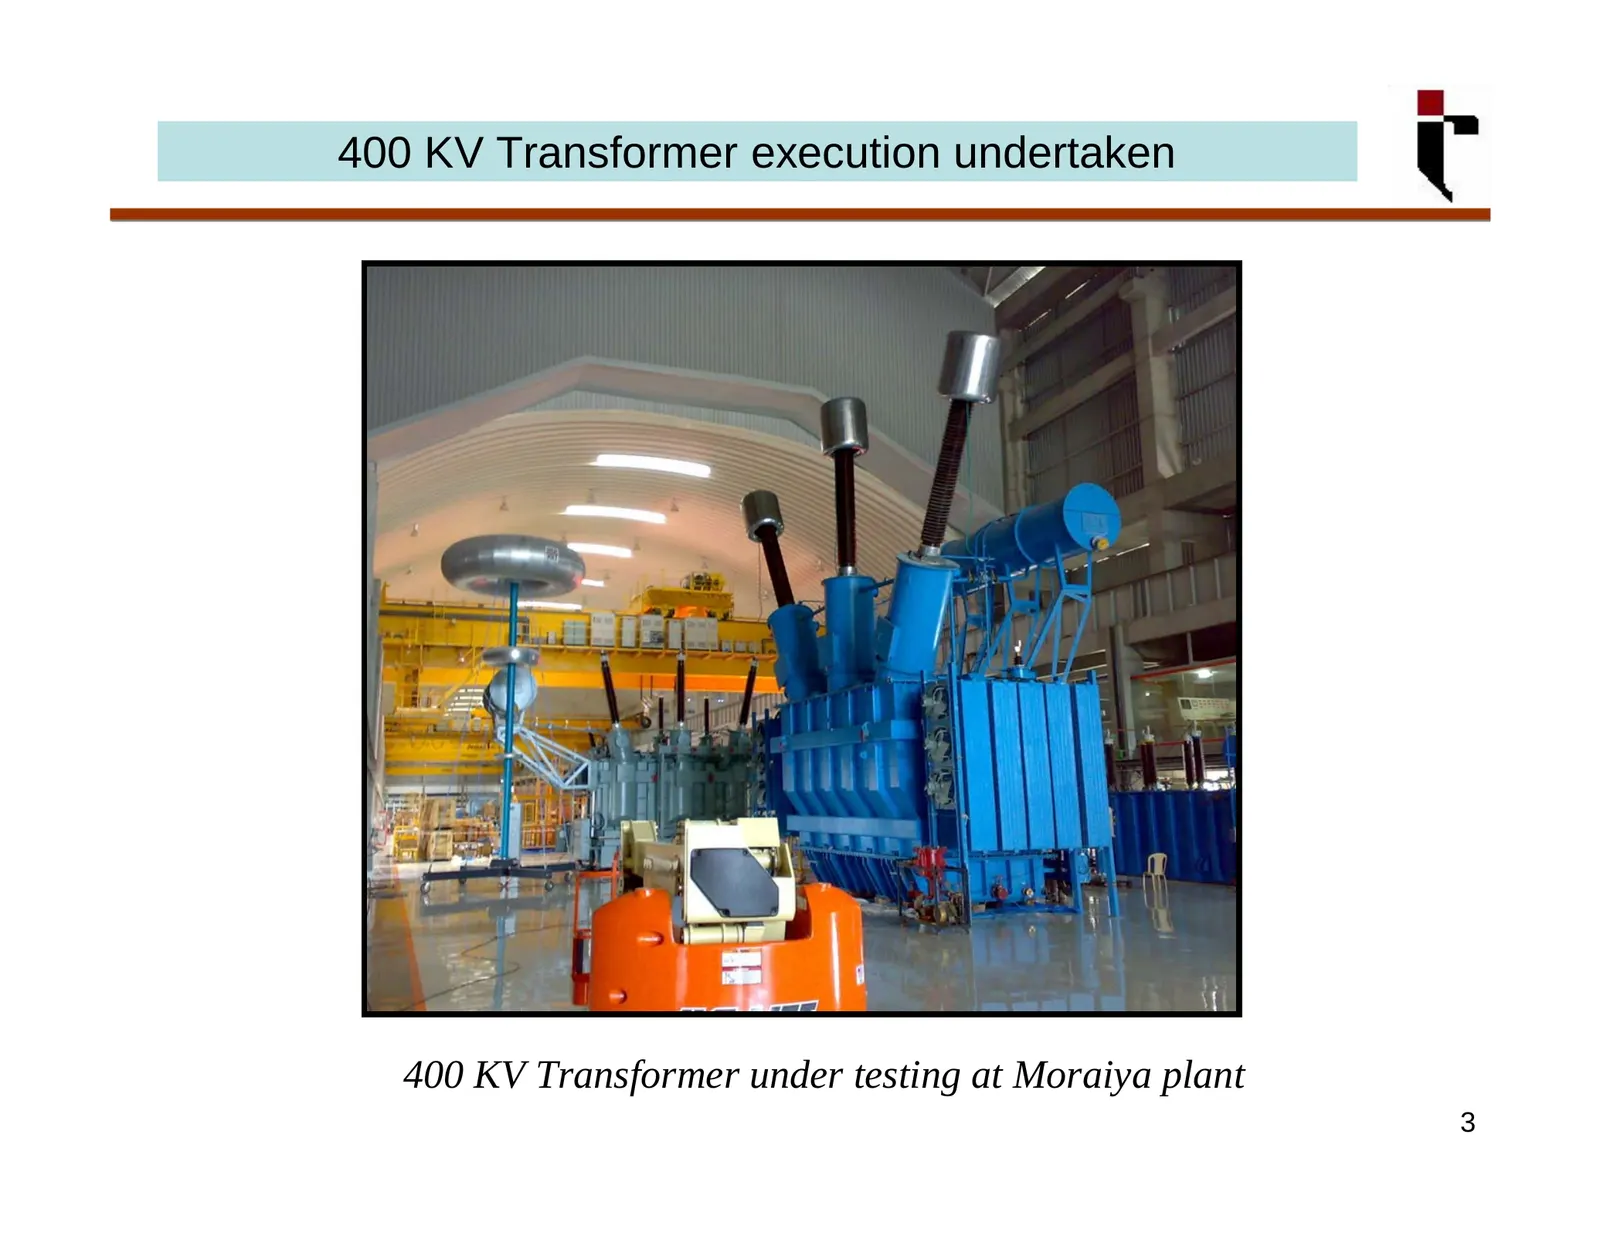
400 KV Transformer execution undertaken 400 KV Transformer under testing at Moraiya plant 3
Slide 6: Financials – Standalone (Q2 FY'2010)
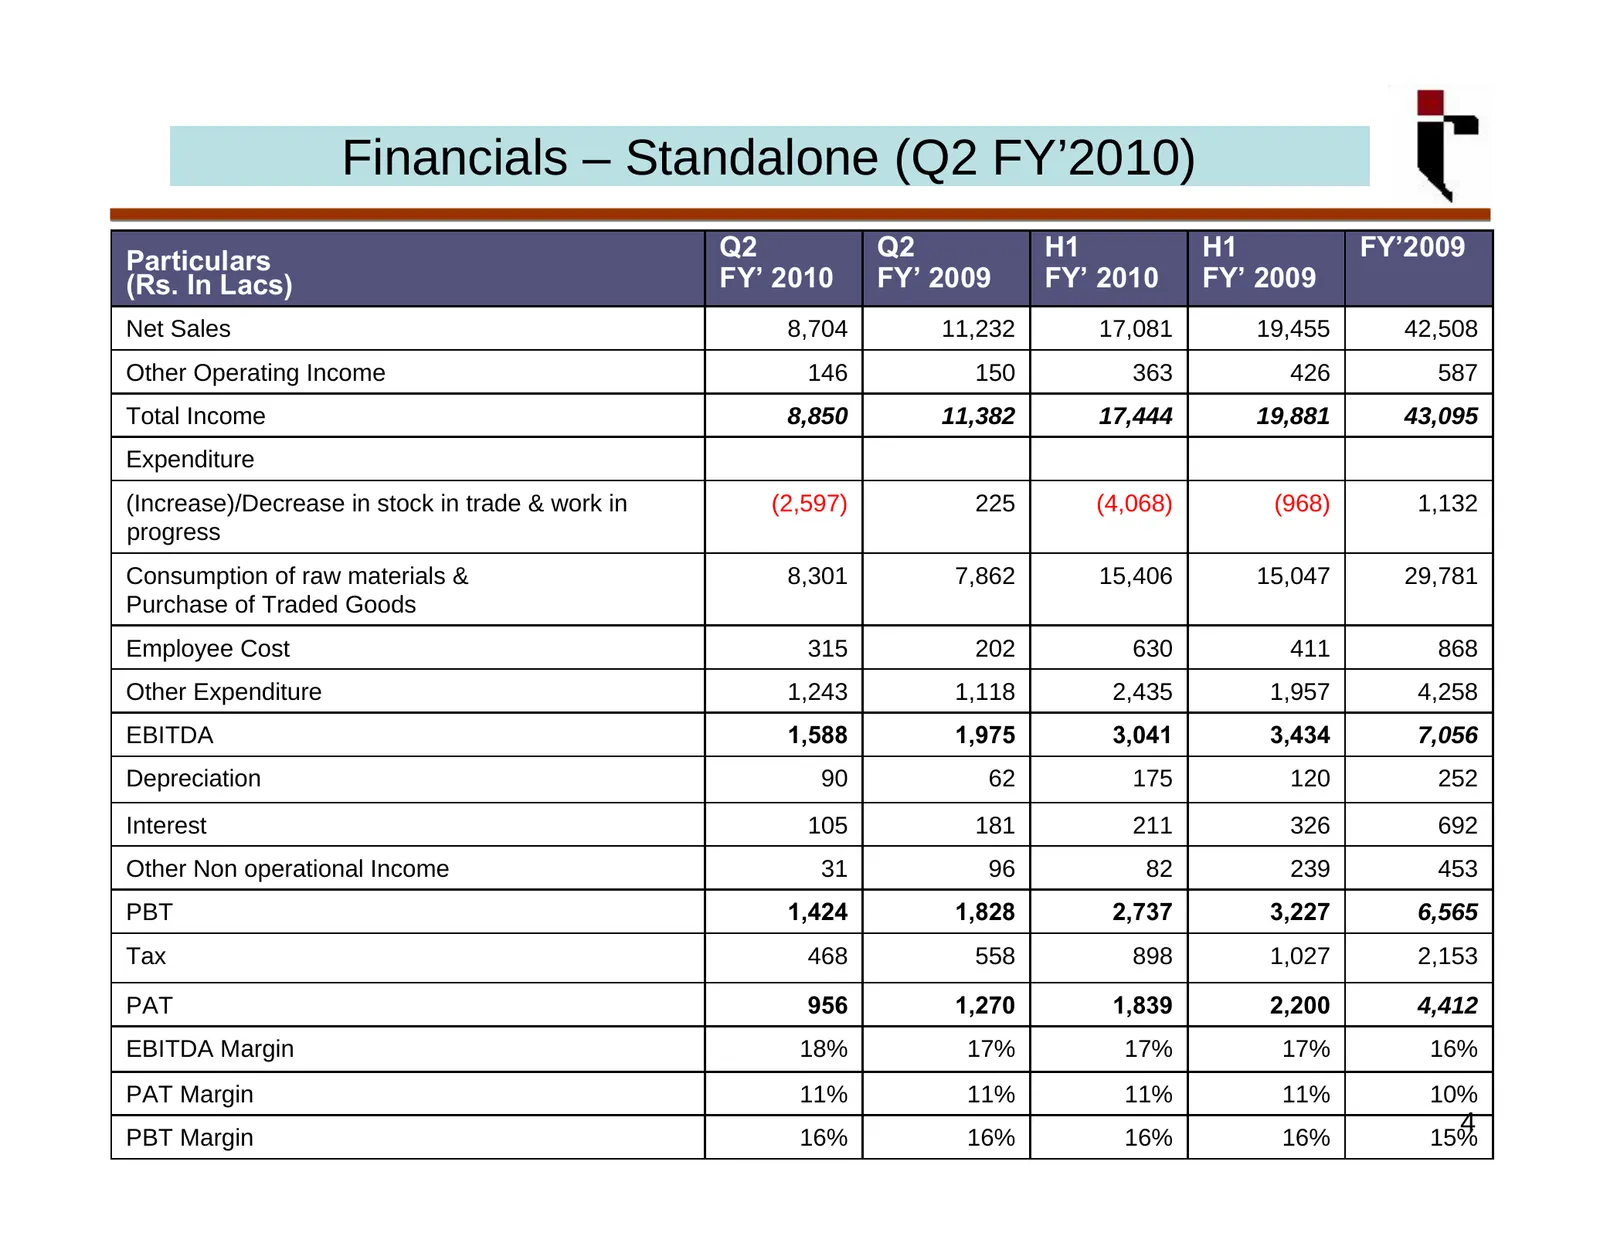
Financials – Standalone (Q2 FY’2010) Particulars Q2 Q2 H1 H1 FY’2009 (Rs. In Lacs) FY’ 2010 FY’ 2009 FY’ 2010 FY’ 2009 Net Sales 8,704 11,232 17,081 19,455 42,508 Other Operating Income 146 150 363 426 587 Total Income 8,850 11,382 17,444 19,881 43,095 Expenditure (Increase)/Decrease in stock in tra
Slide 7: Highlights of Q2 FY'2010
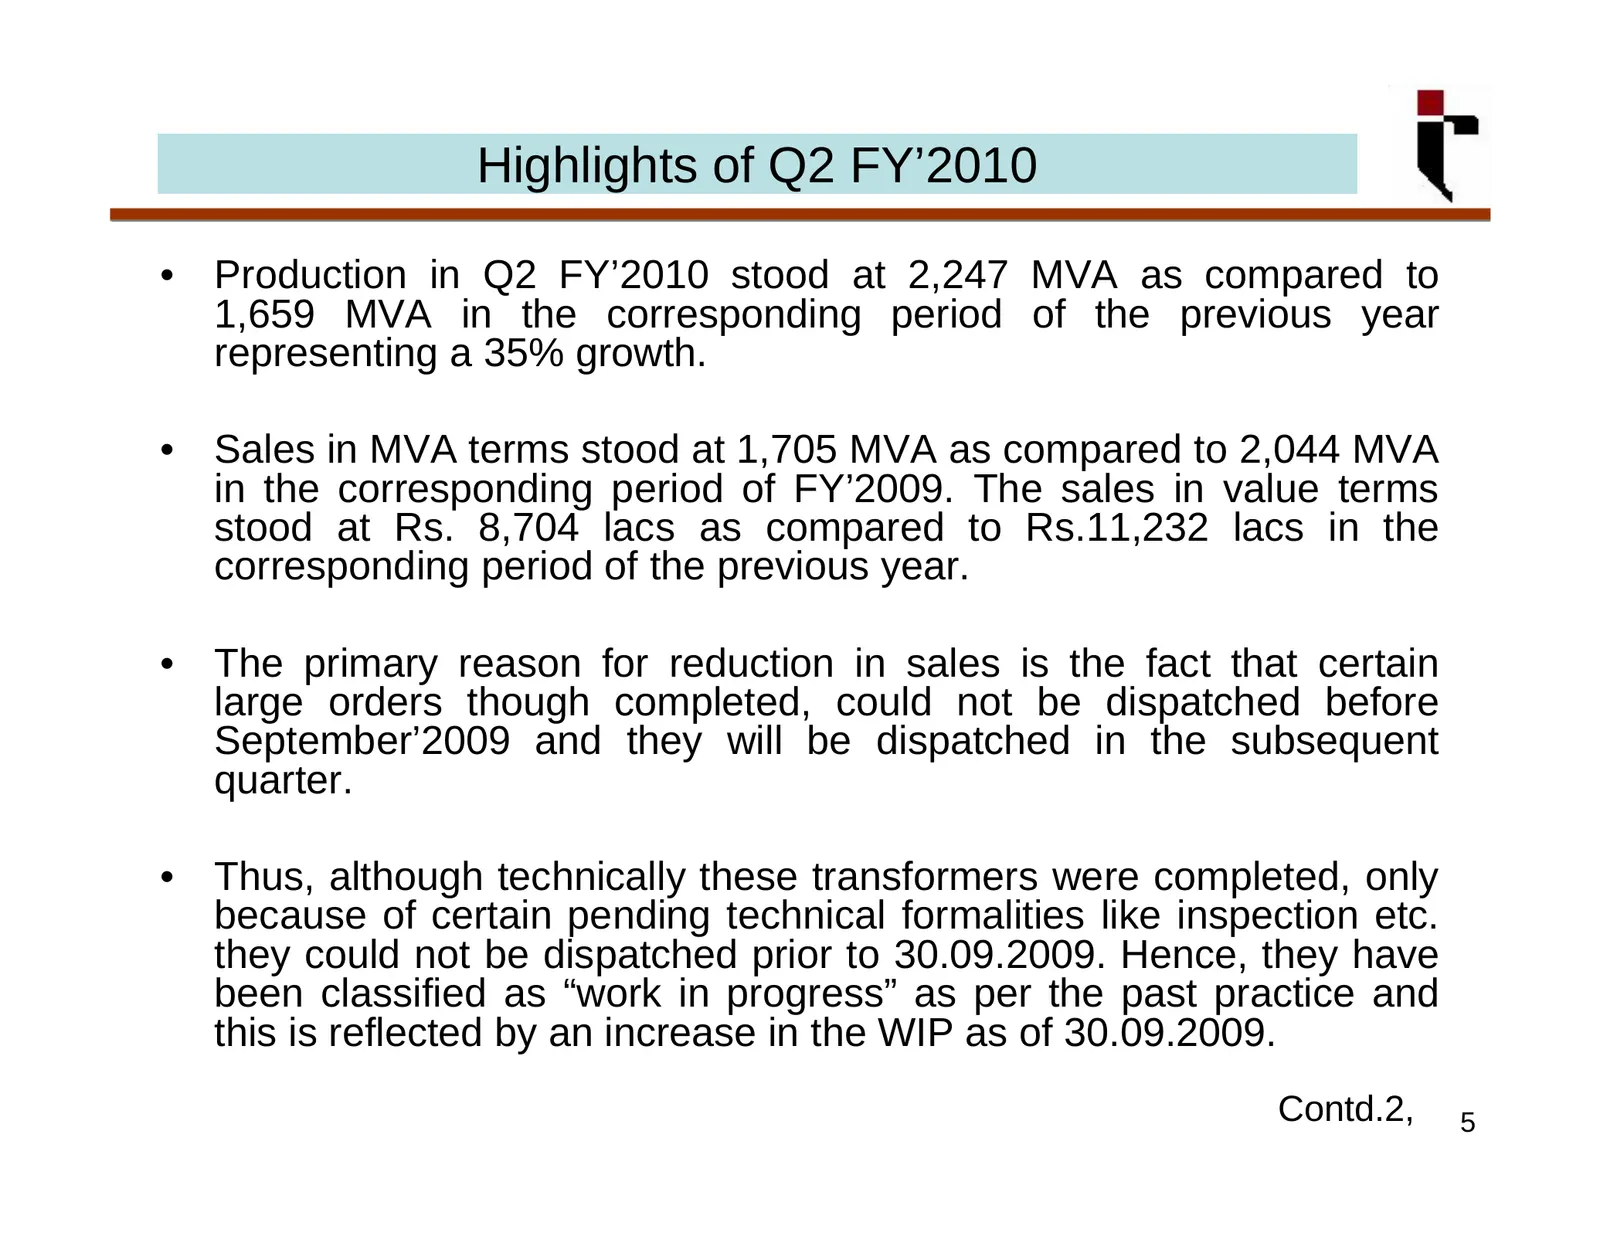
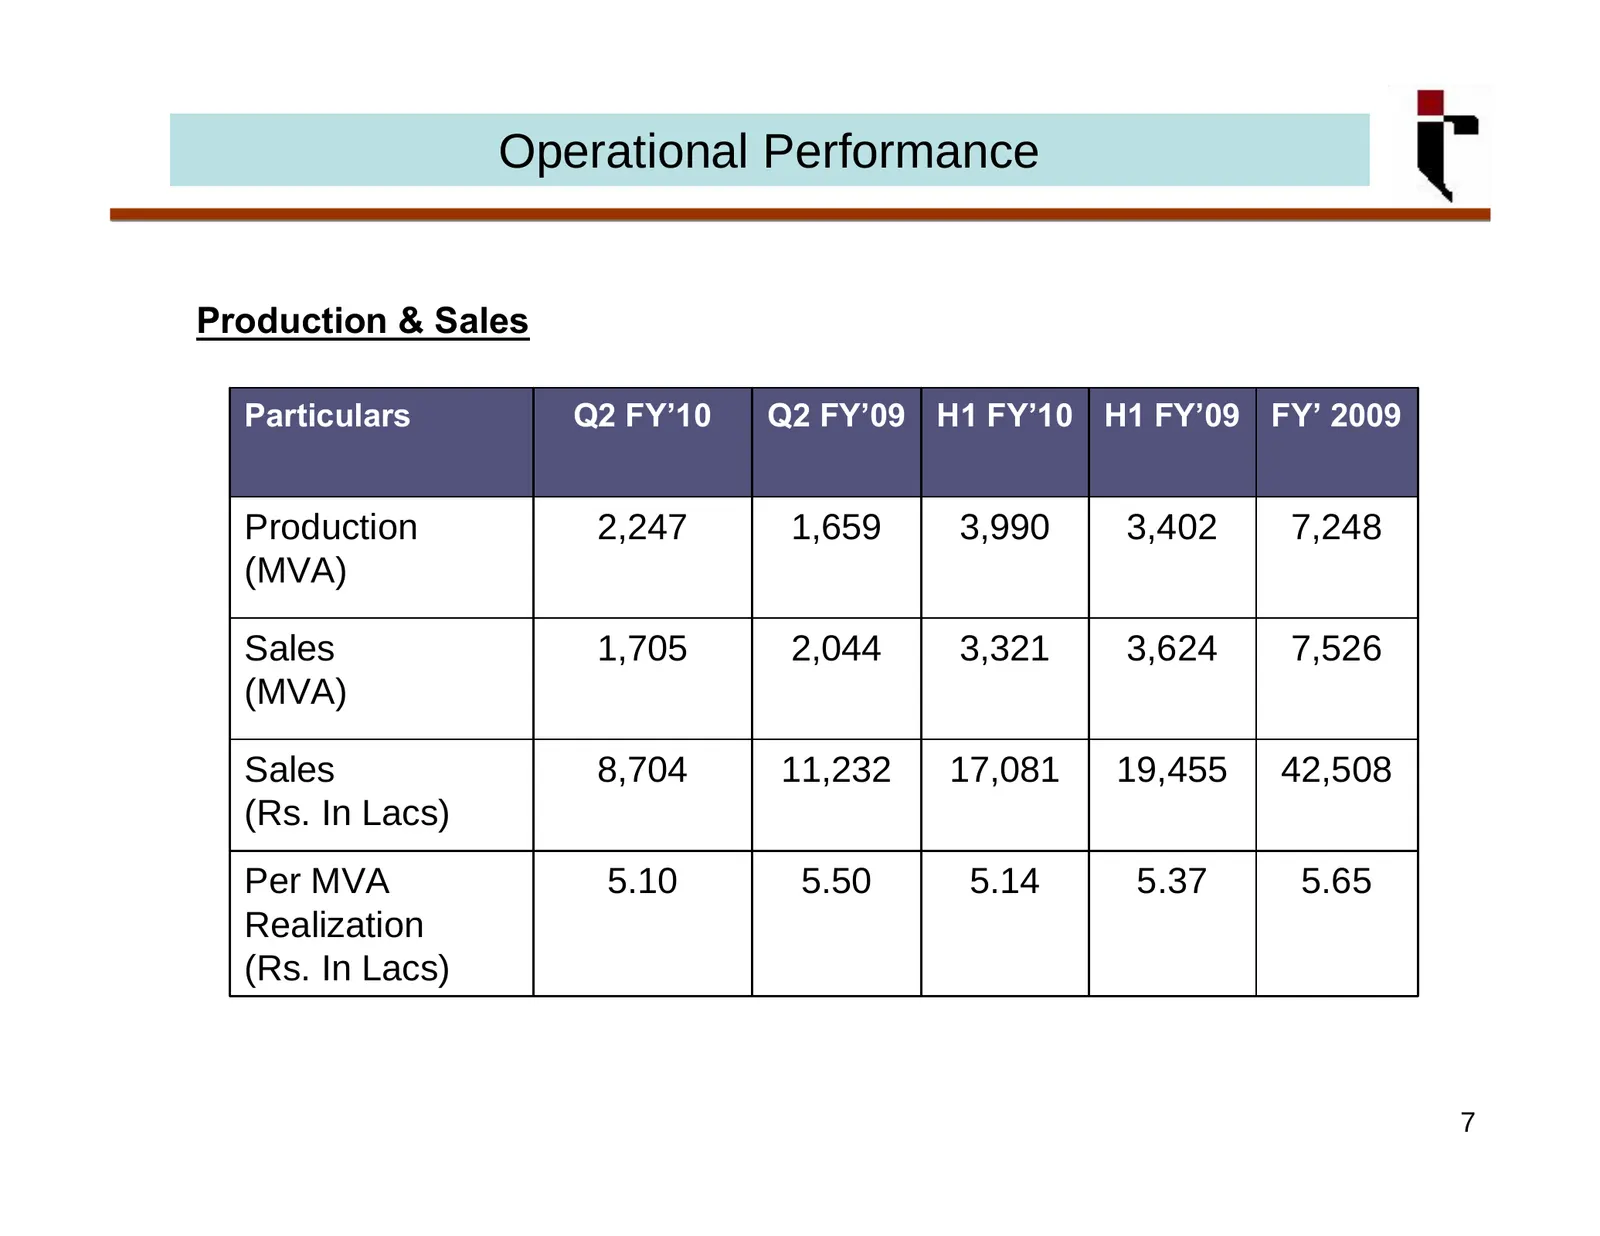
Highlights of Q2 FY’2010 • Production in Q2 FY’2010 stood at 2,247 MVA as compared to 1,659 MVA in the corresponding period of the previous year representing a 35% growth. • Sales in MVA terms stood at 1,705 MVA as compared to 2,044 MVA in the corresponding period of FY’2009. The sales in value term
Slide 8: Highlights of Q2 FY'2010
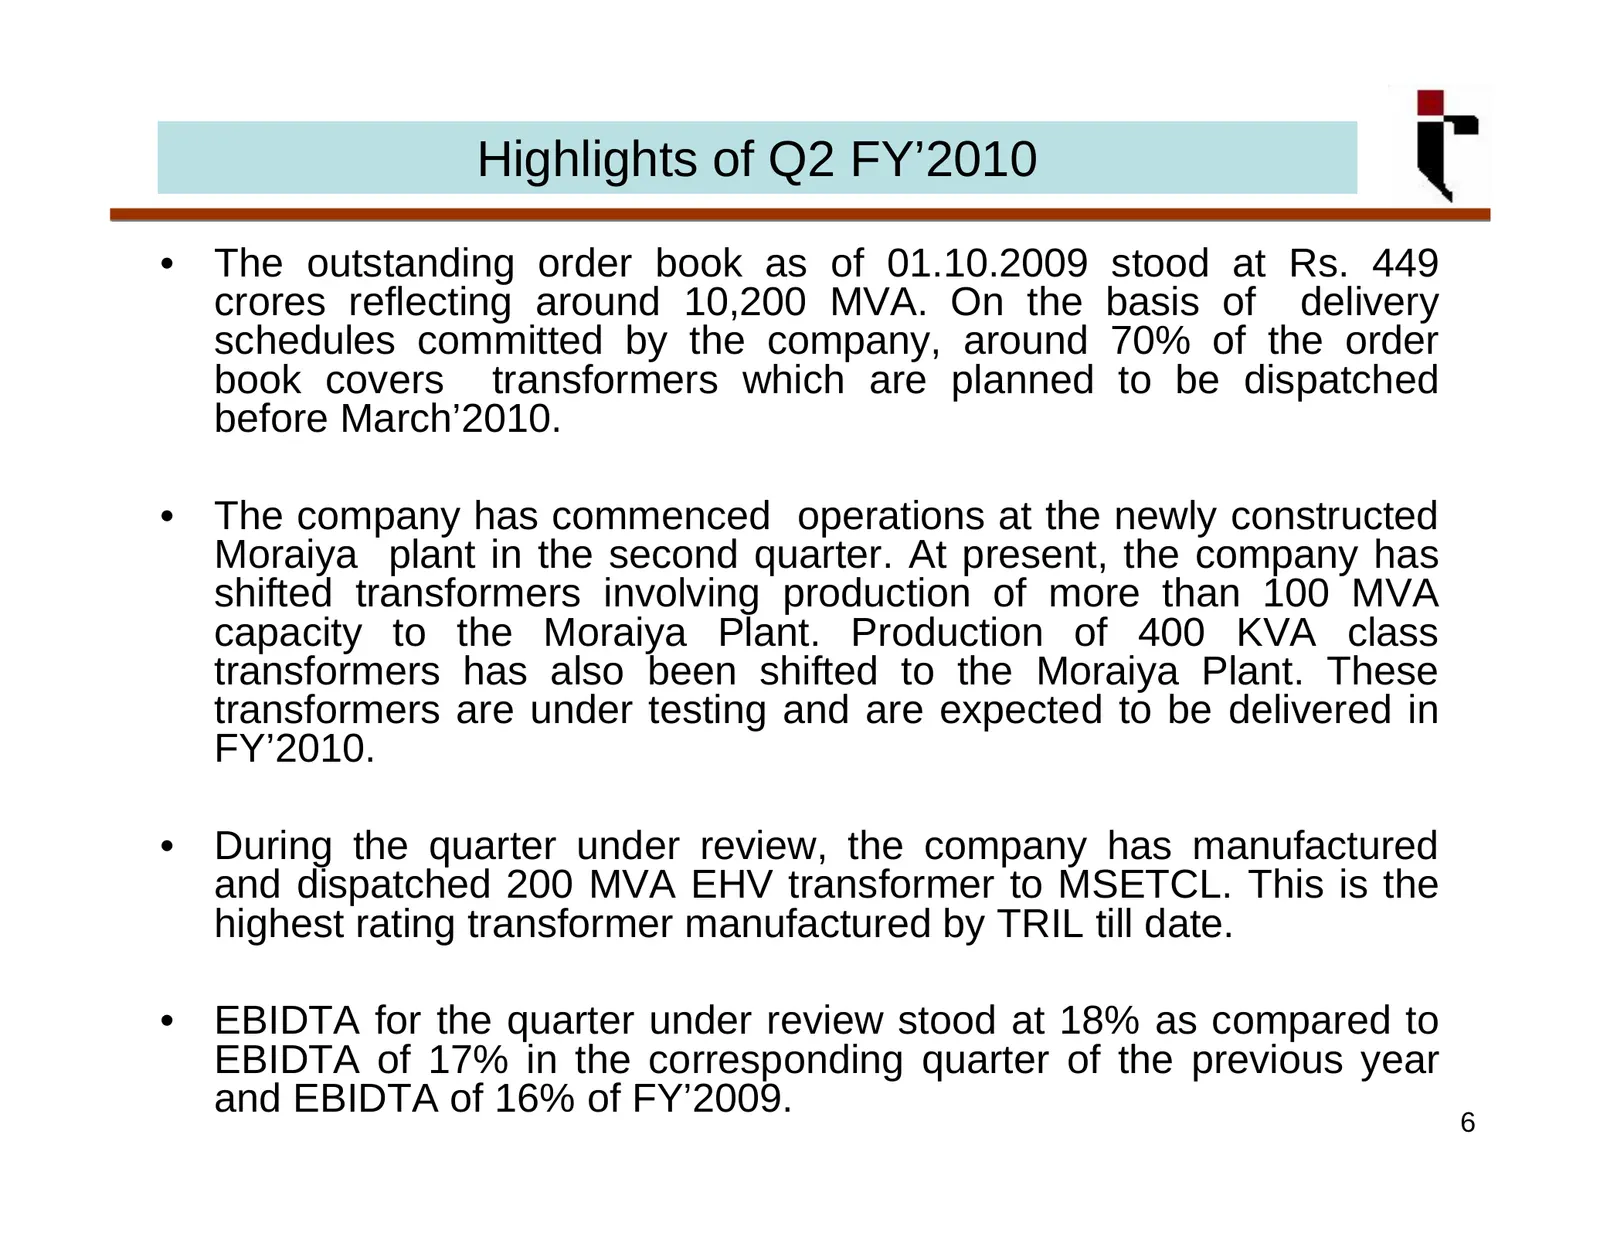
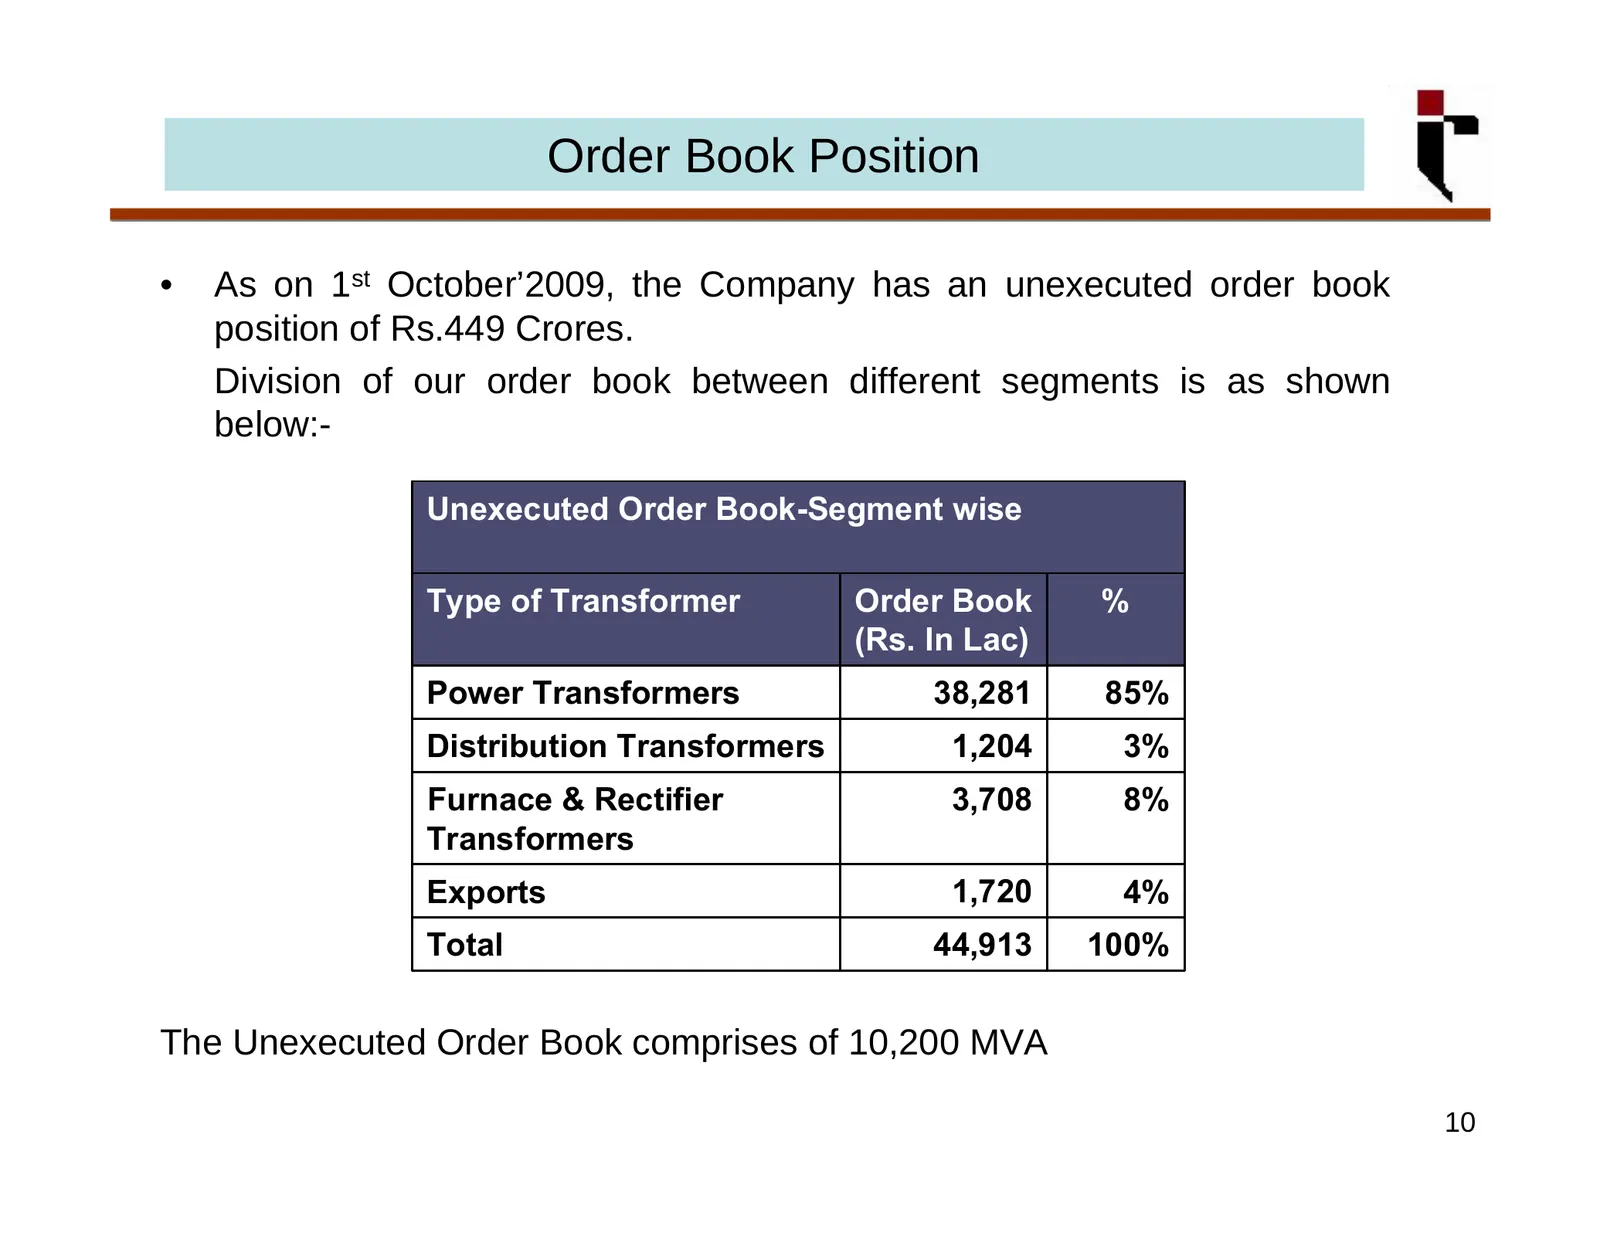
Highlights of Q2 FY’2010 • The outstanding order book as of 01.10.2009 stood at Rs. 449 crores reflecting around 10,200 MVA. On the basis of delivery schedules committed by the company, around 70% of the order book covers transformers which are planned to be dispatched before March’2010. • The compa
Slide 9: Operational Performance Production & Sales
Operational Performance Production & Sales Particulars Q2 FY’10 Q2 FY’09 H1 FY’10 H1 FY’09 FY’ 2009 Production 2,247 1,659 3,990 3,402 7,248 (MVA) Sales 1,705 2,044 3,321 3,624 7,526 (MVA) Sales 8,704 11,232 17,081 19,455 42,508 (Rs. In Lacs) Per MVA 5.10 5.50 5.14 5.37 5.65 Realization (Rs. In Lacs
Slide 10: Operational Performance – Sales Breakup by Customer Segment
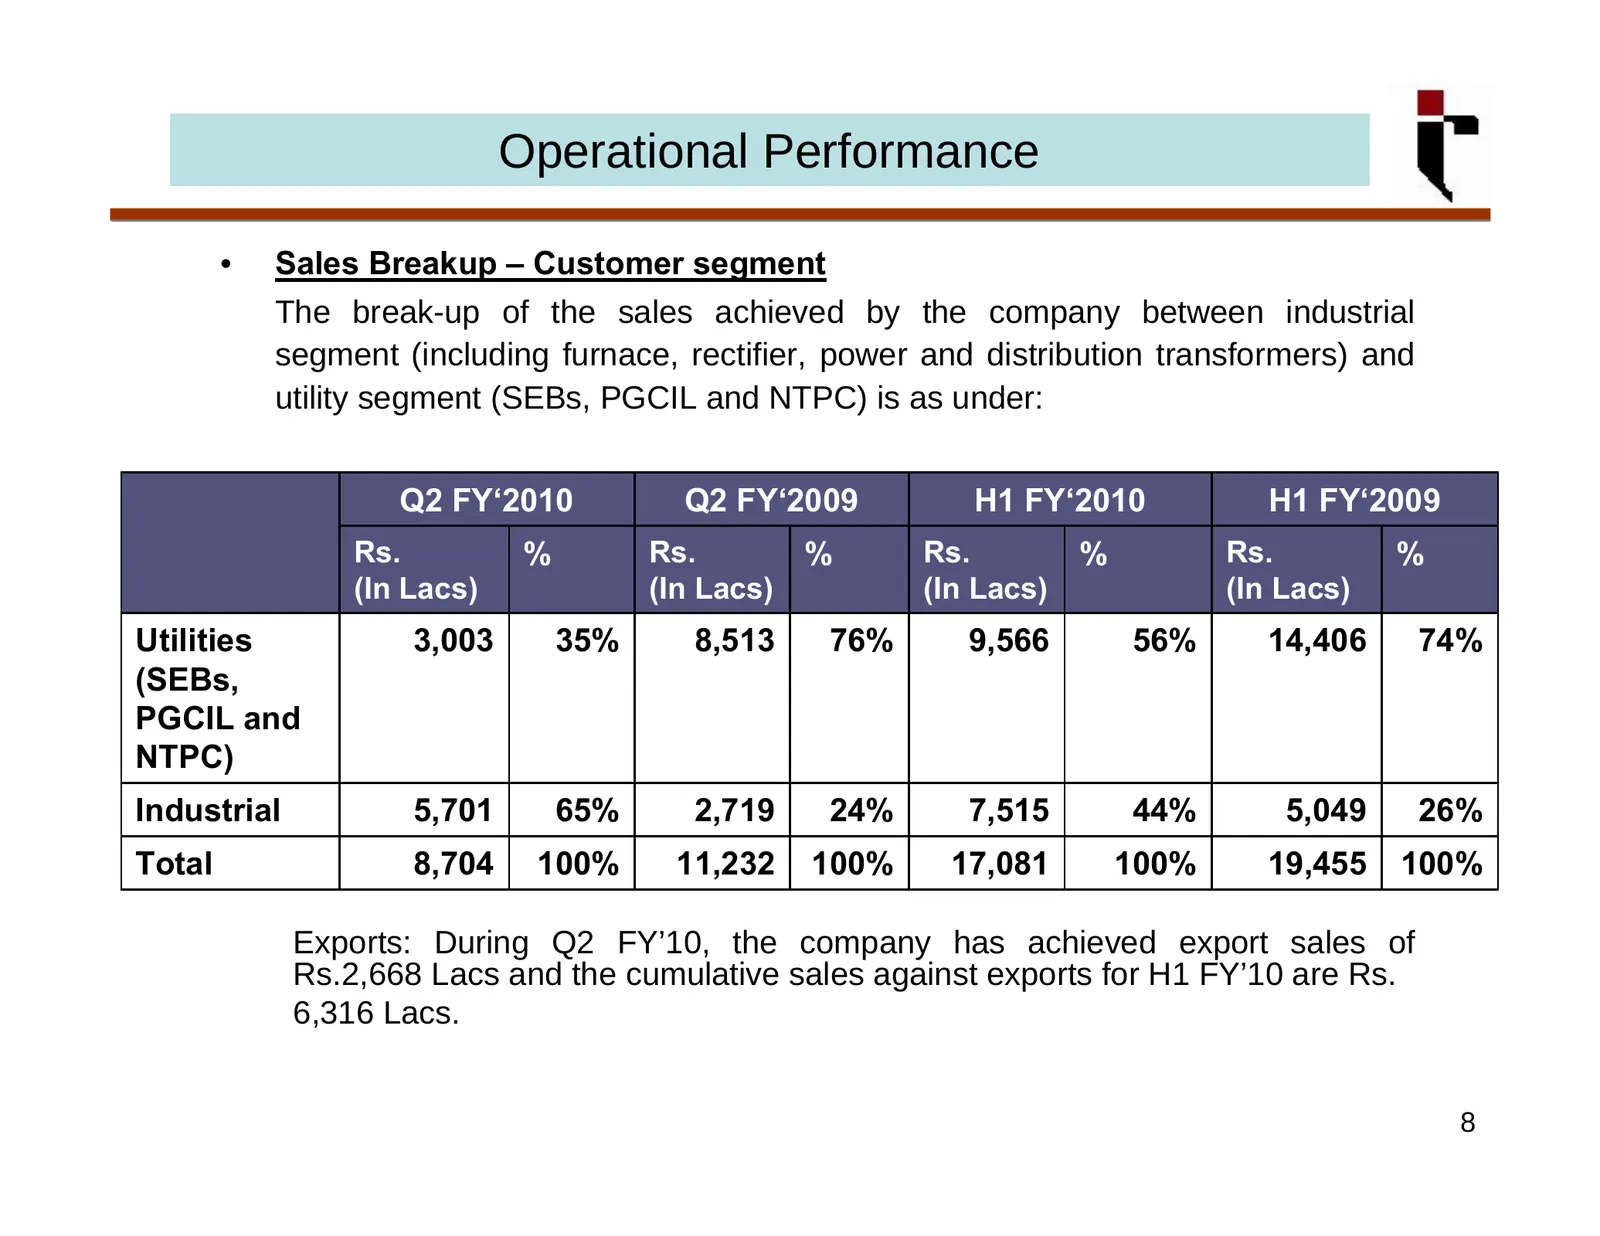
Operational Performance • Sales Breakup – Customer segment The break-up of the sales achieved by the company between industrial segment (including furnace, rectifier, power and distribution transformers) and utility segment (SEBs, PGCIL and NTPC) is as under: Q2 FY‘2010 Q2 FY‘2009 H1 FY‘2010 H1 FY‘2
Slide 11: Operational Performance – Sales Breakup by Product Segment
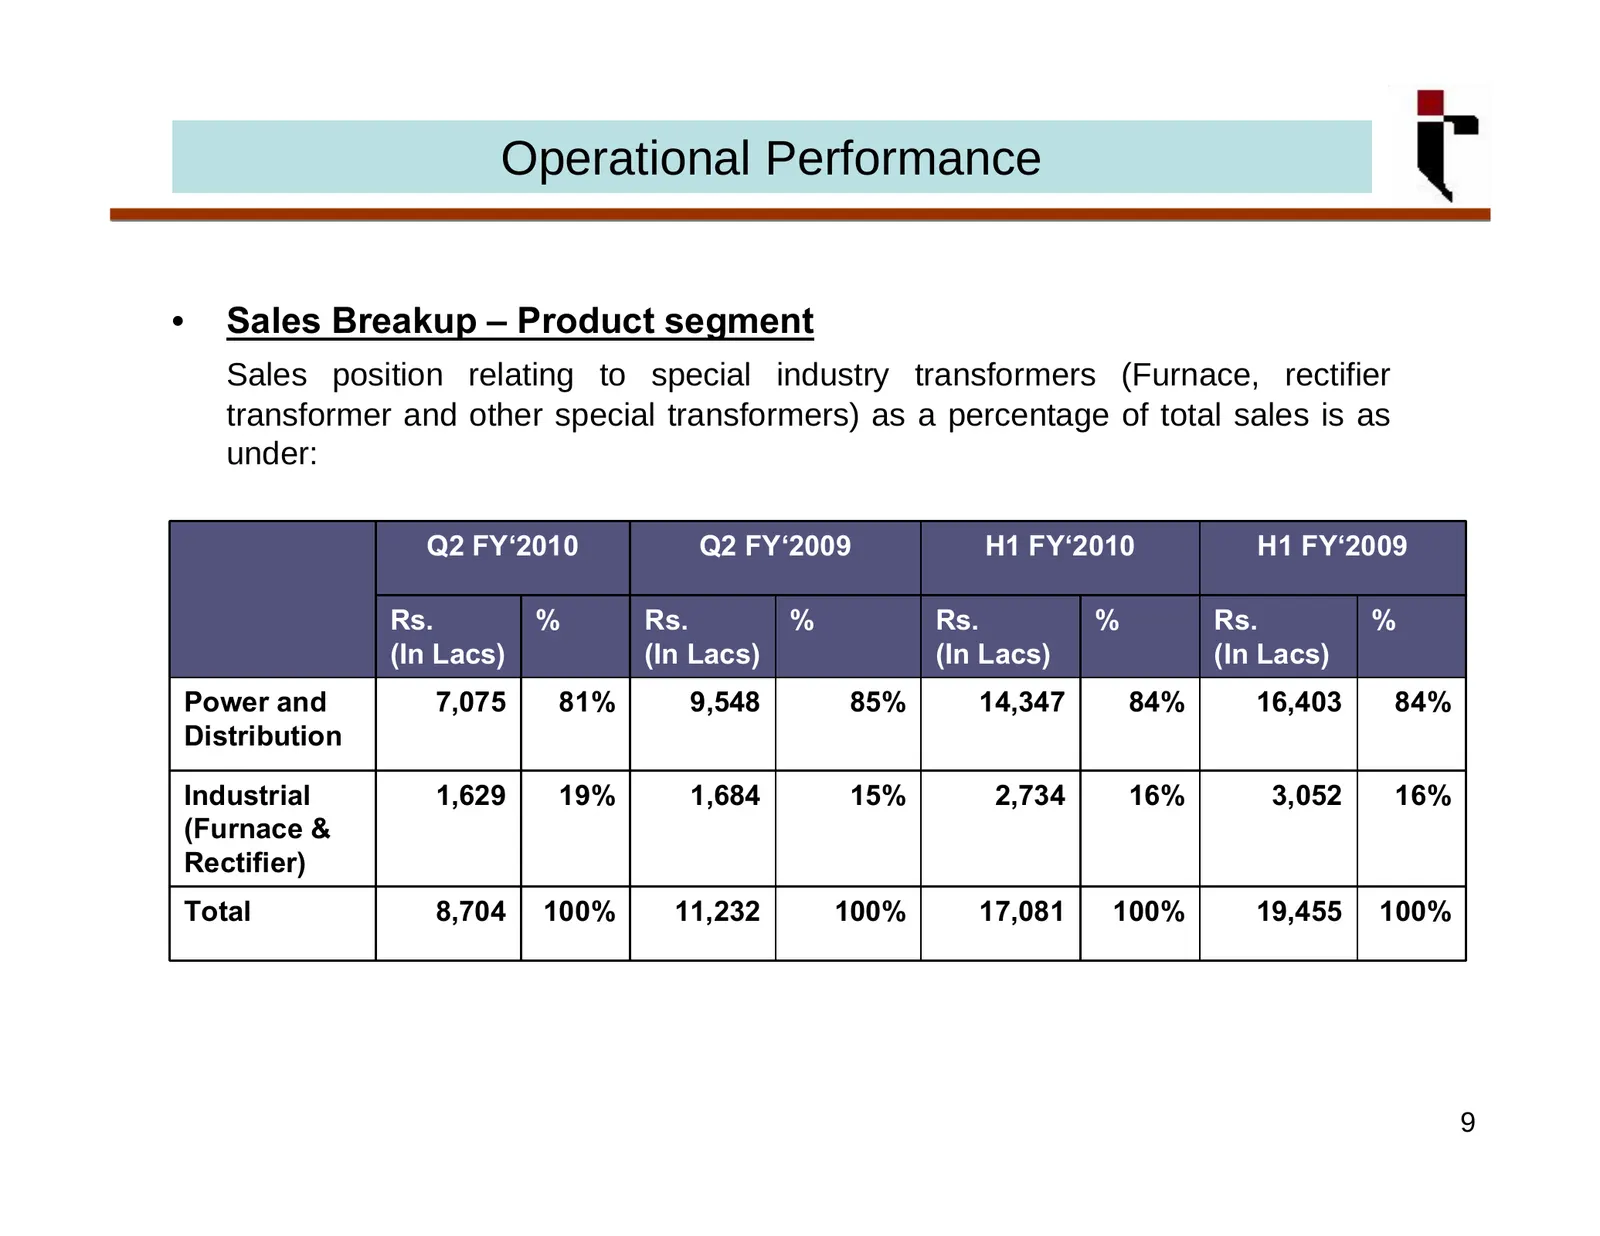
Operational Performance • Sales Breakup – Product segment Sales position relating to special industry transformers (Furnace, rectifier transformer and other special transformers) as a percentage of total sales is as under: Q2 FY‘2010 Q2 FY‘2009 H1 FY‘2010 H1 FY‘2009 Rs. % Rs. % Rs. % Rs. % (In Lacs)
Slide 12: Order Book Position
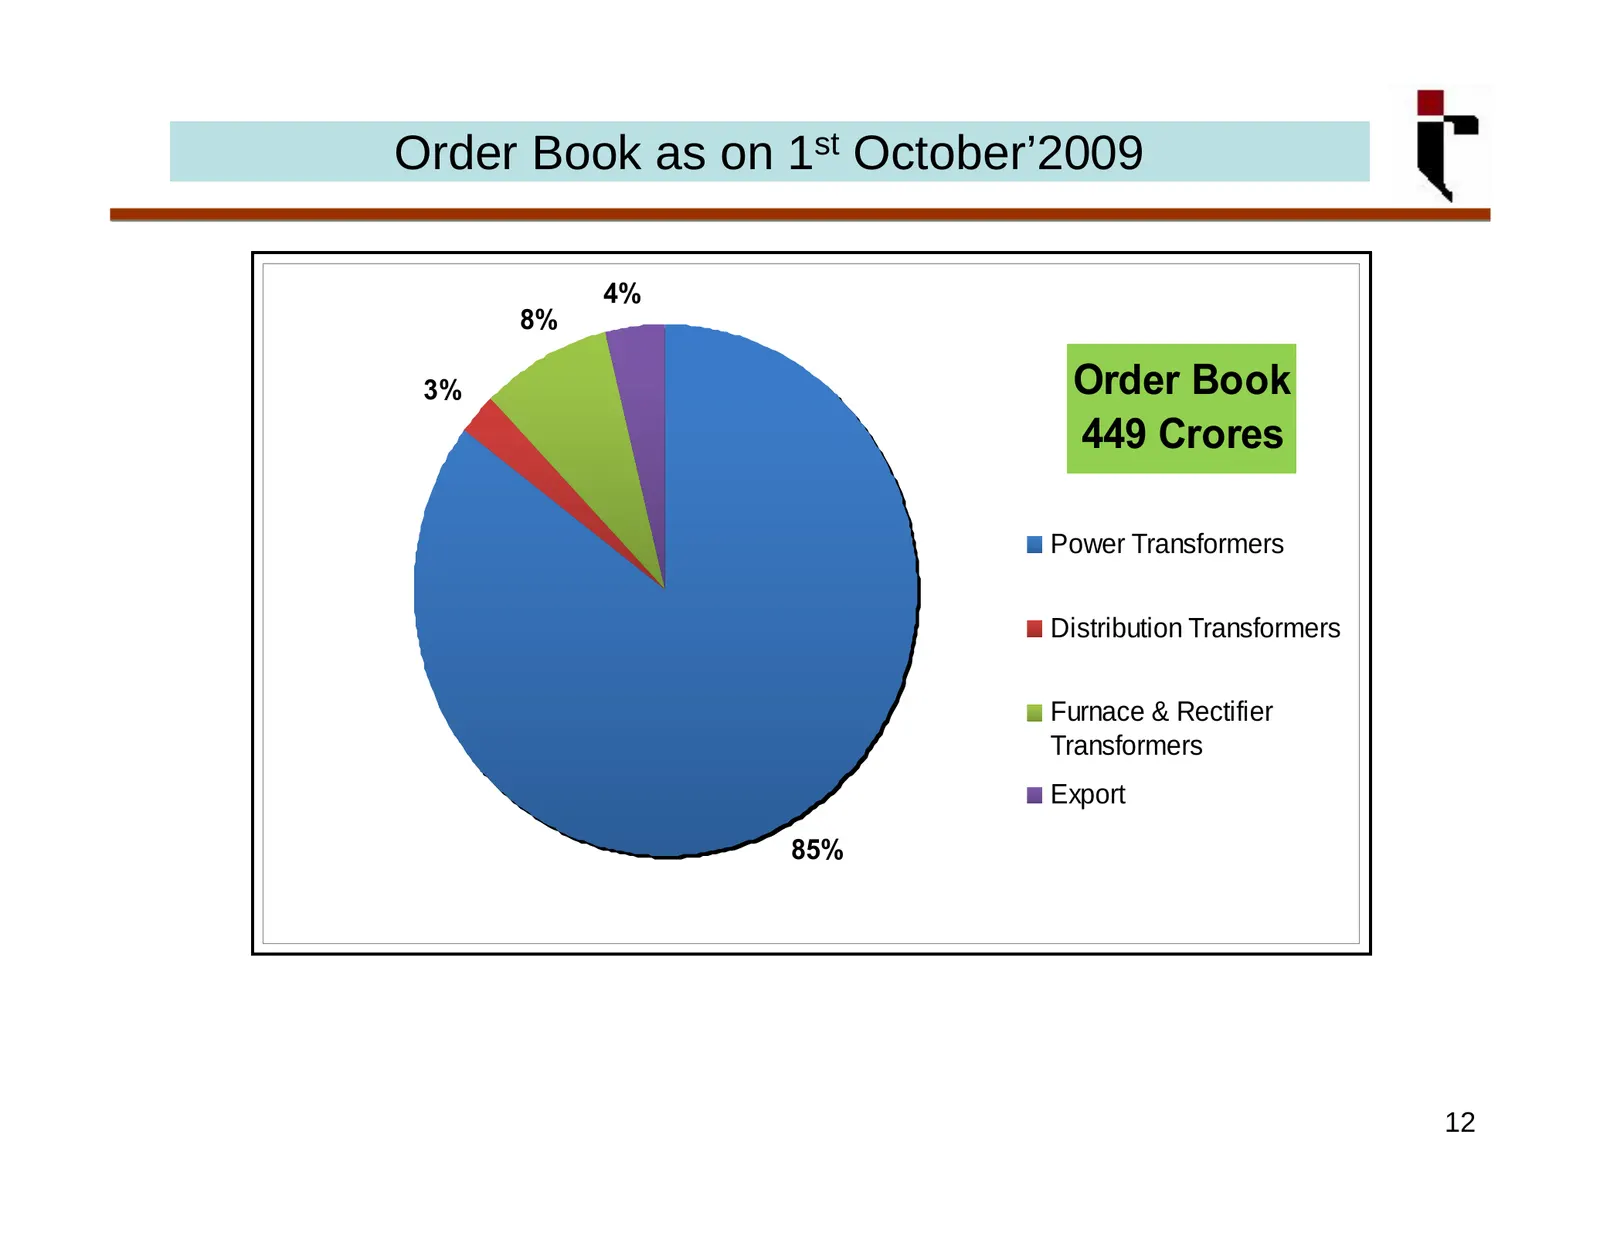
Order Book Position • As on 1st October’2009, the Company has an unexecuted order book position of Rs.449 Crores. Division of our order book between different segments is as shown below:- Unexecuted Order Book-Segment wise Type of Transformer Order Book % (Rs. In Lac) Power Transformers 38,281 85% D
Slide 13: Order Book Position – KV Class wise
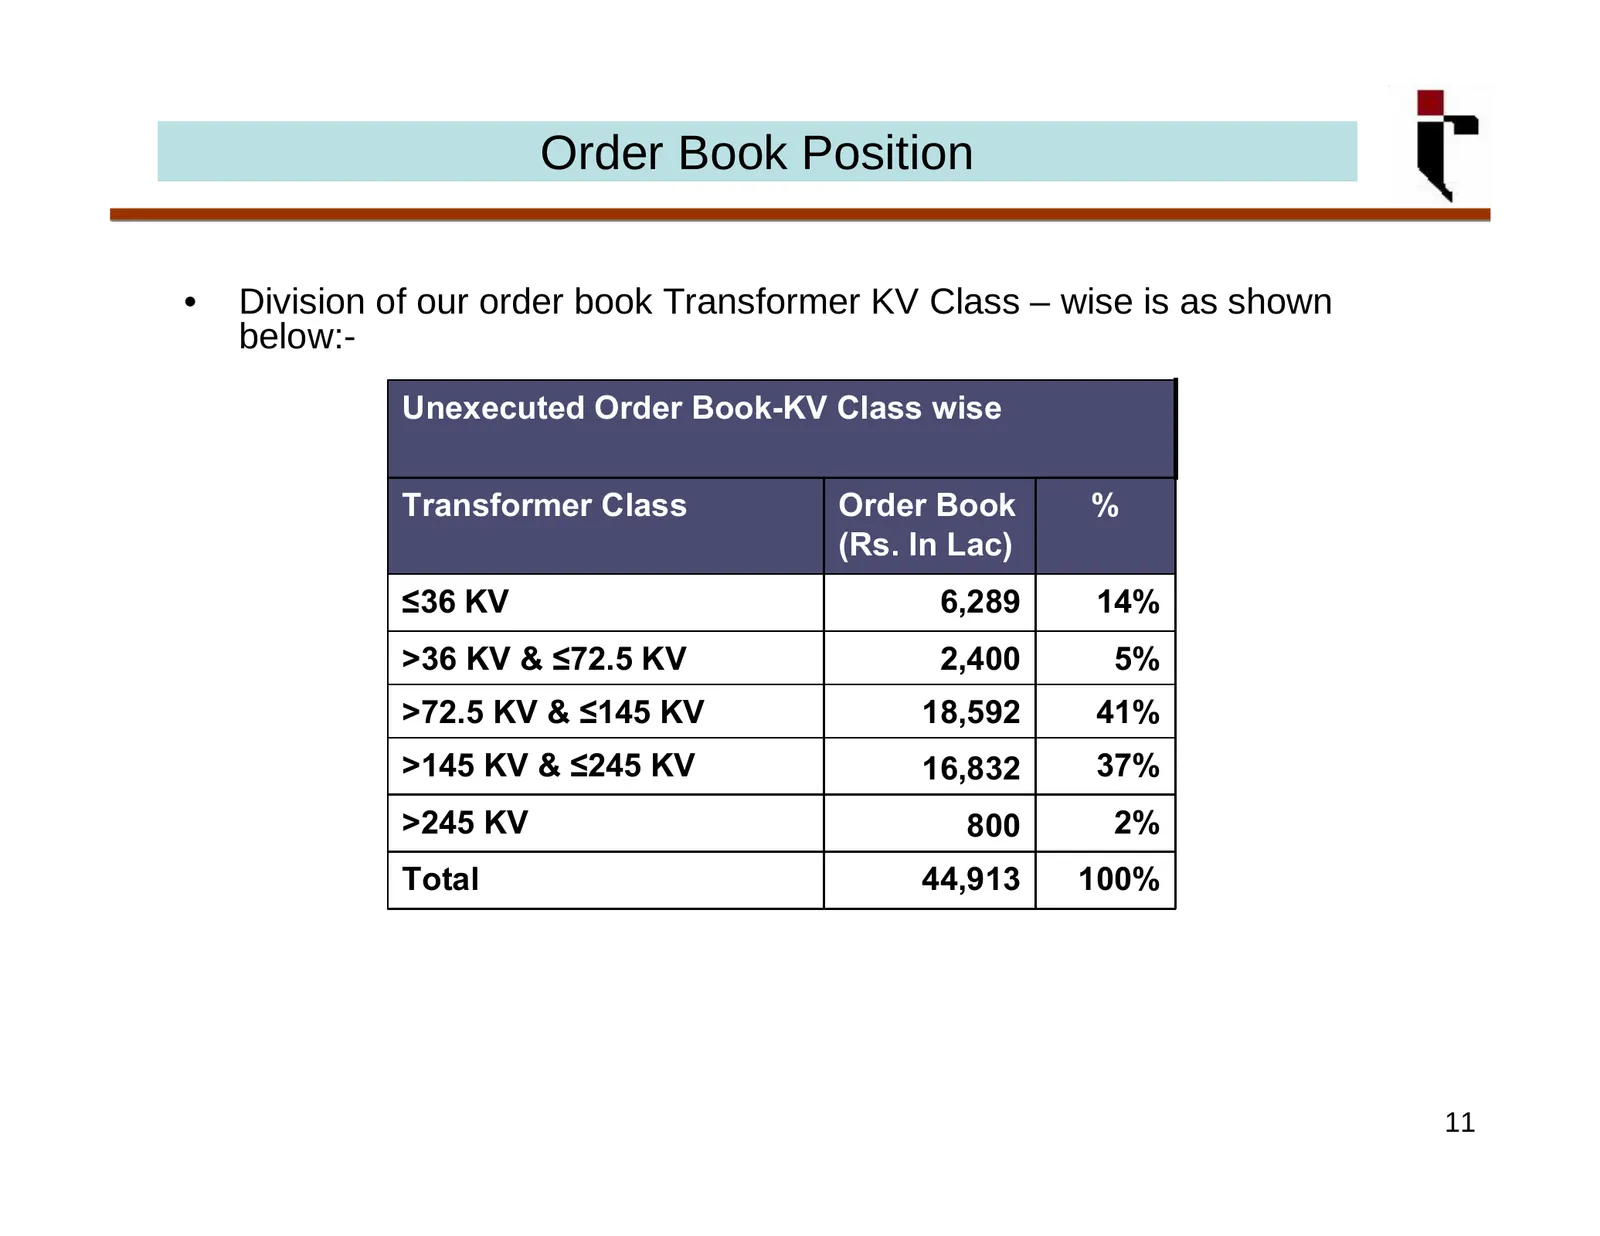
Order Book Position • Division of our order book Transformer KV Class – wise is as shown below:- Unexecuted Order Book-KV Class wise Transformer Class Order Book % (Rs. In Lac) ≤36 KV 6,289 14% >36 KV & ≤72.5 KV 2,400 5% >72.5 KV & ≤145 KV 18,592 41% >145 KV & ≤245 KV 16,832 37% >245 KV 800 2% Total
Slide 14: Order Book as on 1st October 2009
Order Book as on 1st October’2009 4% 8% 3% Order Book 449 Crores Power Transformers Distribution Transformers Furnace & Rectifier Transformers Export 85% 12
Slide 15: Breakup of Other Income - Standalone
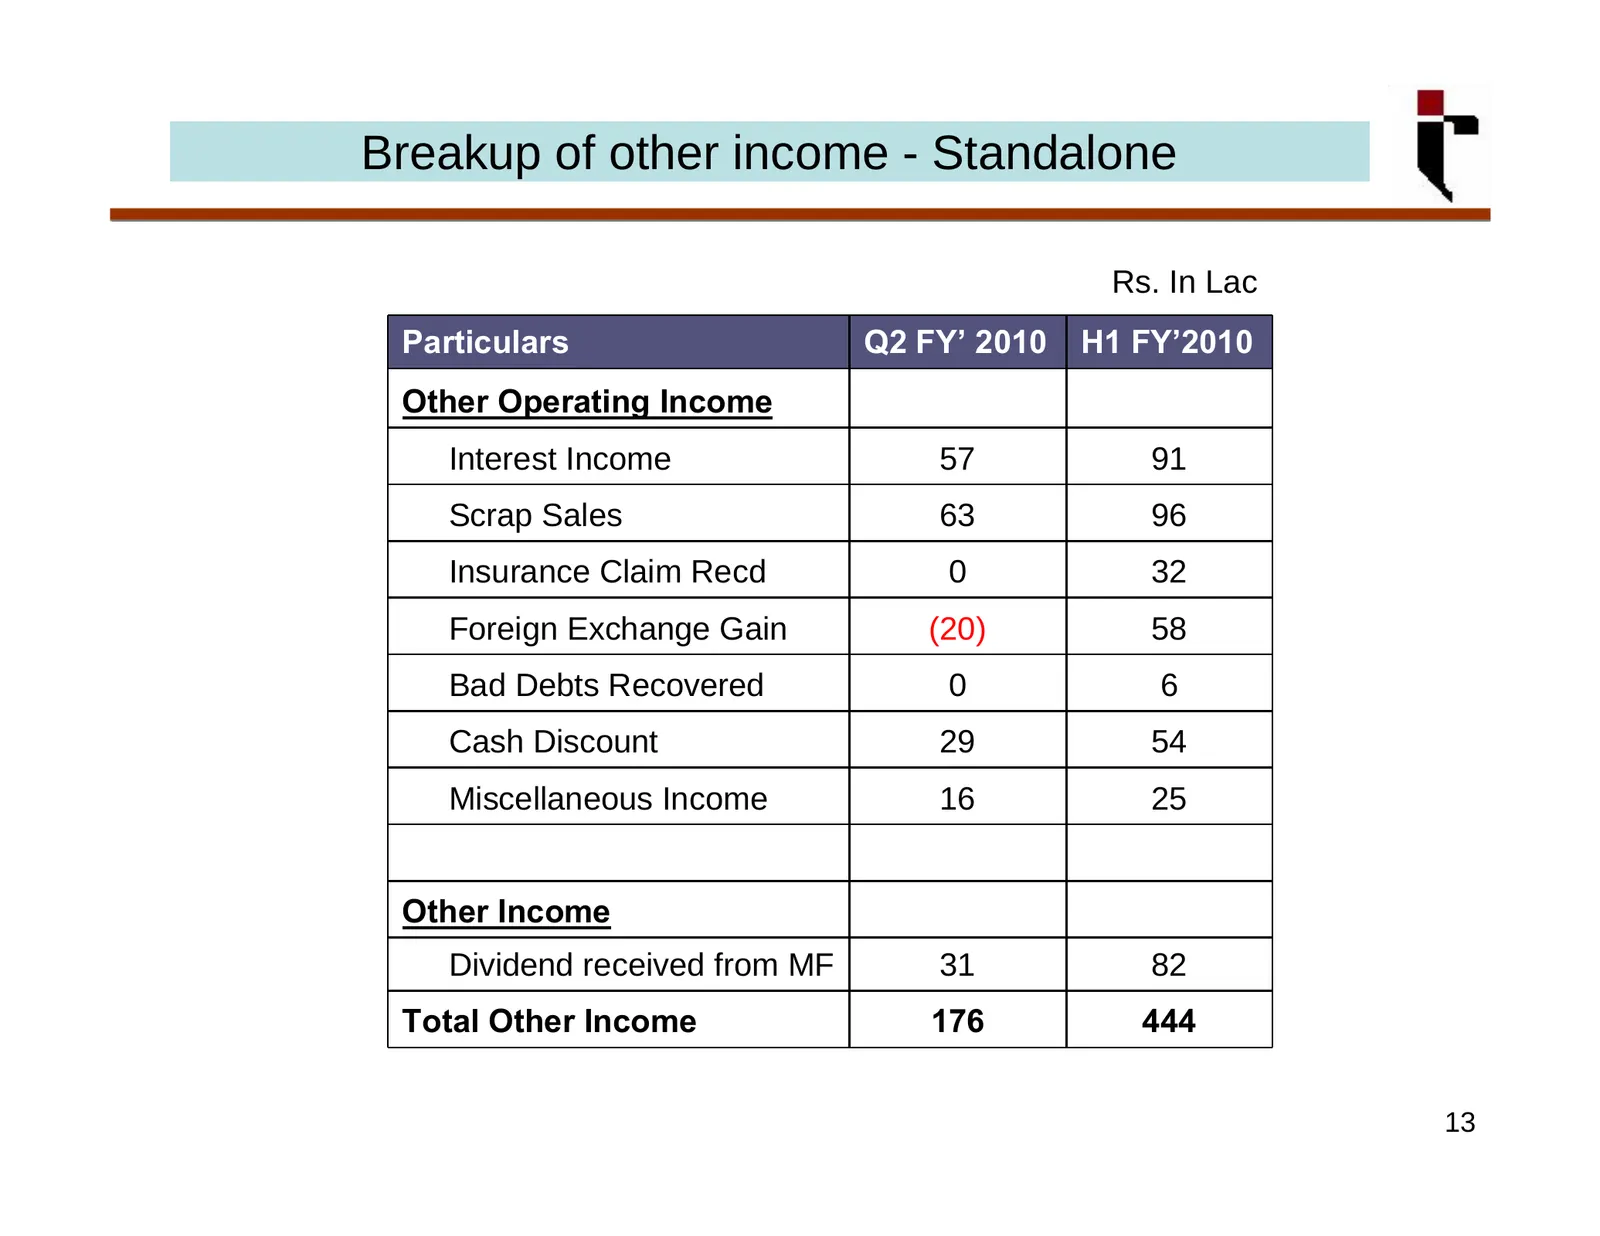
Breakup of other income - Standalone Rs. In Lac Particulars Q2 FY’ 2010 H1 FY’2010 Other Operating Income Interest Income 57 91 Scrap Sales 63 96 Insurance Claim Recd 0 32 Foreign Exchange Gain (20) 58 Bad Debts Recovered 0 6 Cash Discount 29 54 Miscellaneous Income 16 25 Other Income Dividend recei
Slide 16: Consistent Financial Performance – YoY
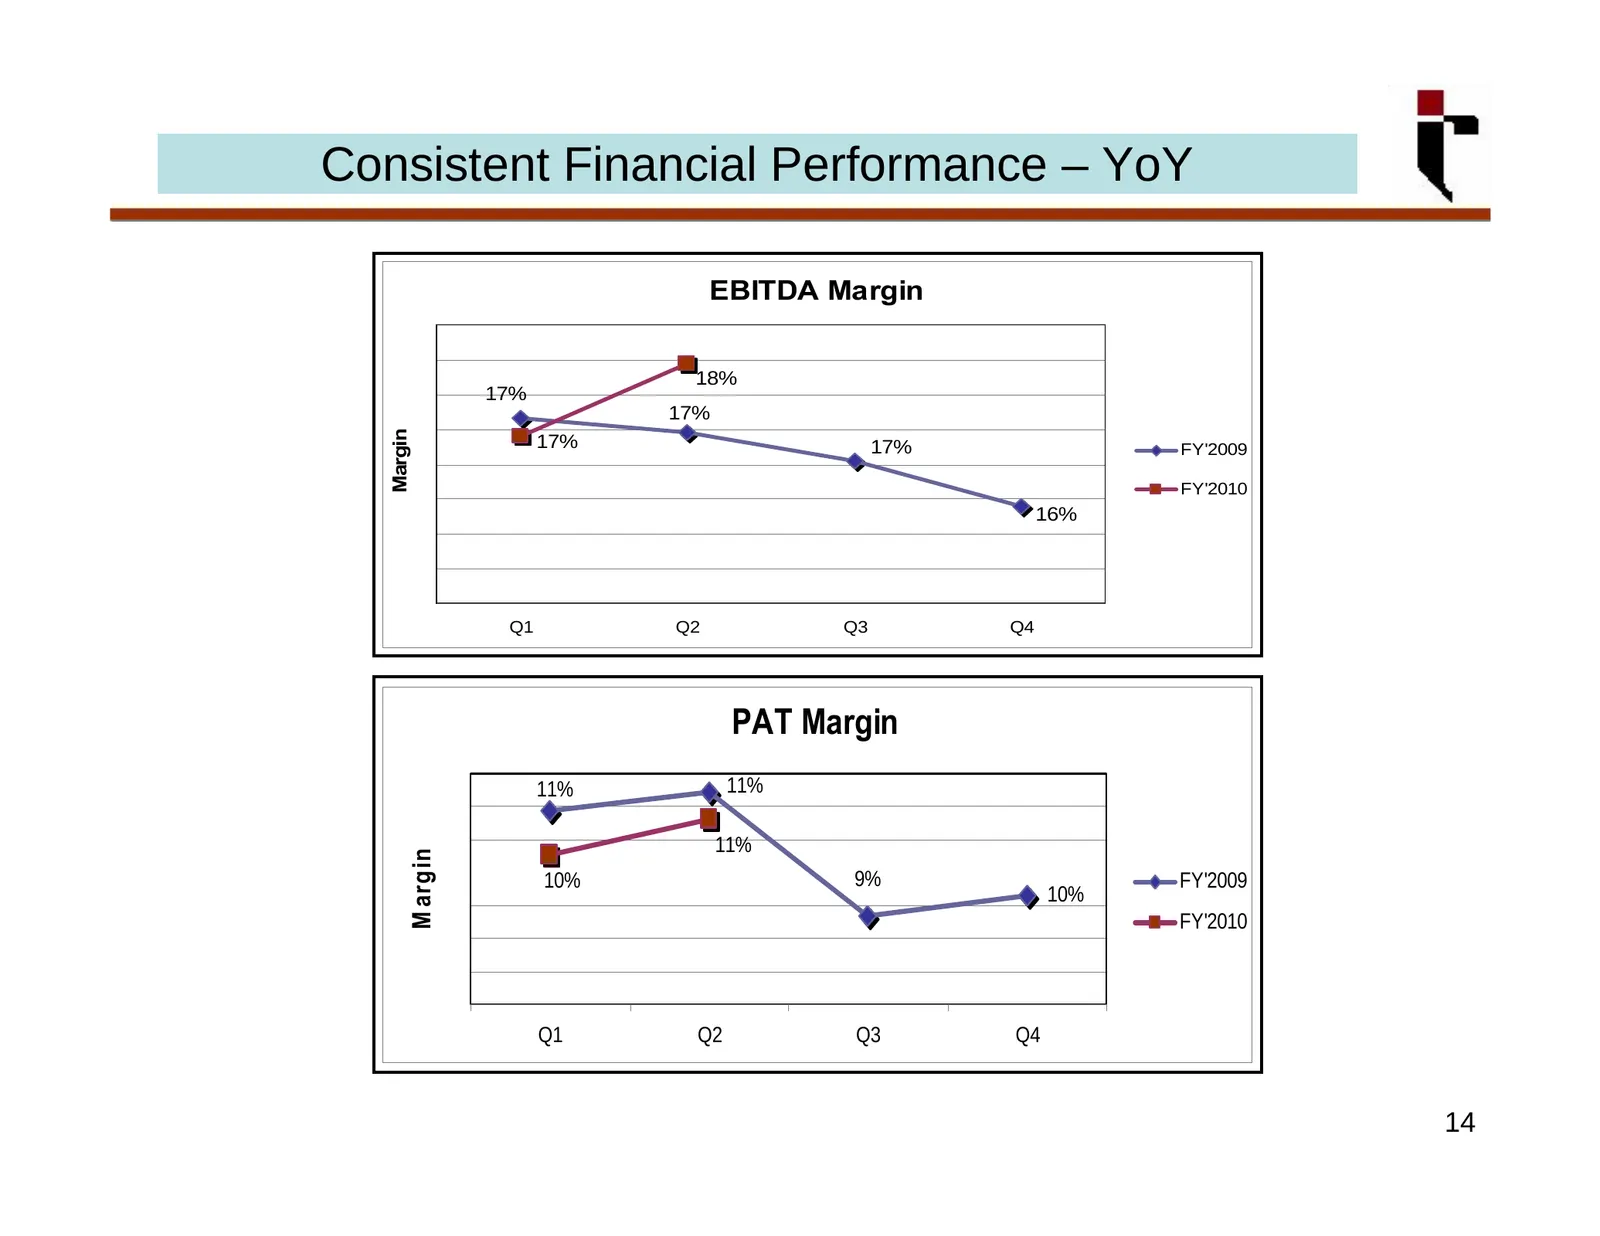
Consistent Financial Performance – YoY EBITDA Margin 18% 17% 17% Margin 17% 17% FY'2009 FY'2010 16% Q1 Q2 Q3 Q4 PAT Margin 11% 11% 11% M argin 10% 9% FY'2009 10% FY'2010 Q1 Q2 Q3 Q4 14

Slide 17: Thank You
Thank You 15 www.transformerindia.com
Source: Internet Archive copy of transformerindia.com
More decks from Transformers and Rectifiers (India) Limited
 Q2 FY27 Earnings Presentation36 slides · Oct 13, 2026
 Q1 FY27 Earnings Presentation35 slides · Jul 20, 2026
 Q1 FY27 Earnings Presentation36 slides · Jul 20, 2026
 Q4 FY26 Earnings Presentation25 slides · Apr 21, 2026
 Q4 FY26 Earnings Presentation26 slides · Apr 21, 2026
 Q3 FY26 Earnings Presentation20 slides · Jan 8, 2026