F-Secure Oyj · OMXHEX:FSECURE
F-Secure Oyj — Q1 2019 Earnings Presentation
23 slides from F-Secure Oyj's earnings presentation, 2019
Slide 1: F-Secure Q1/2019: Strong revenue growth in corporate security
F-Secure Q1 / 2019 STRONG REVENUE GROWTH IN CORPORATE SECURITY
Slide 2: Agenda
AGENDA Key takeaways from Q1 Key figures Business updates Outlook Financials
Slide 3: Key takeaways from Q1
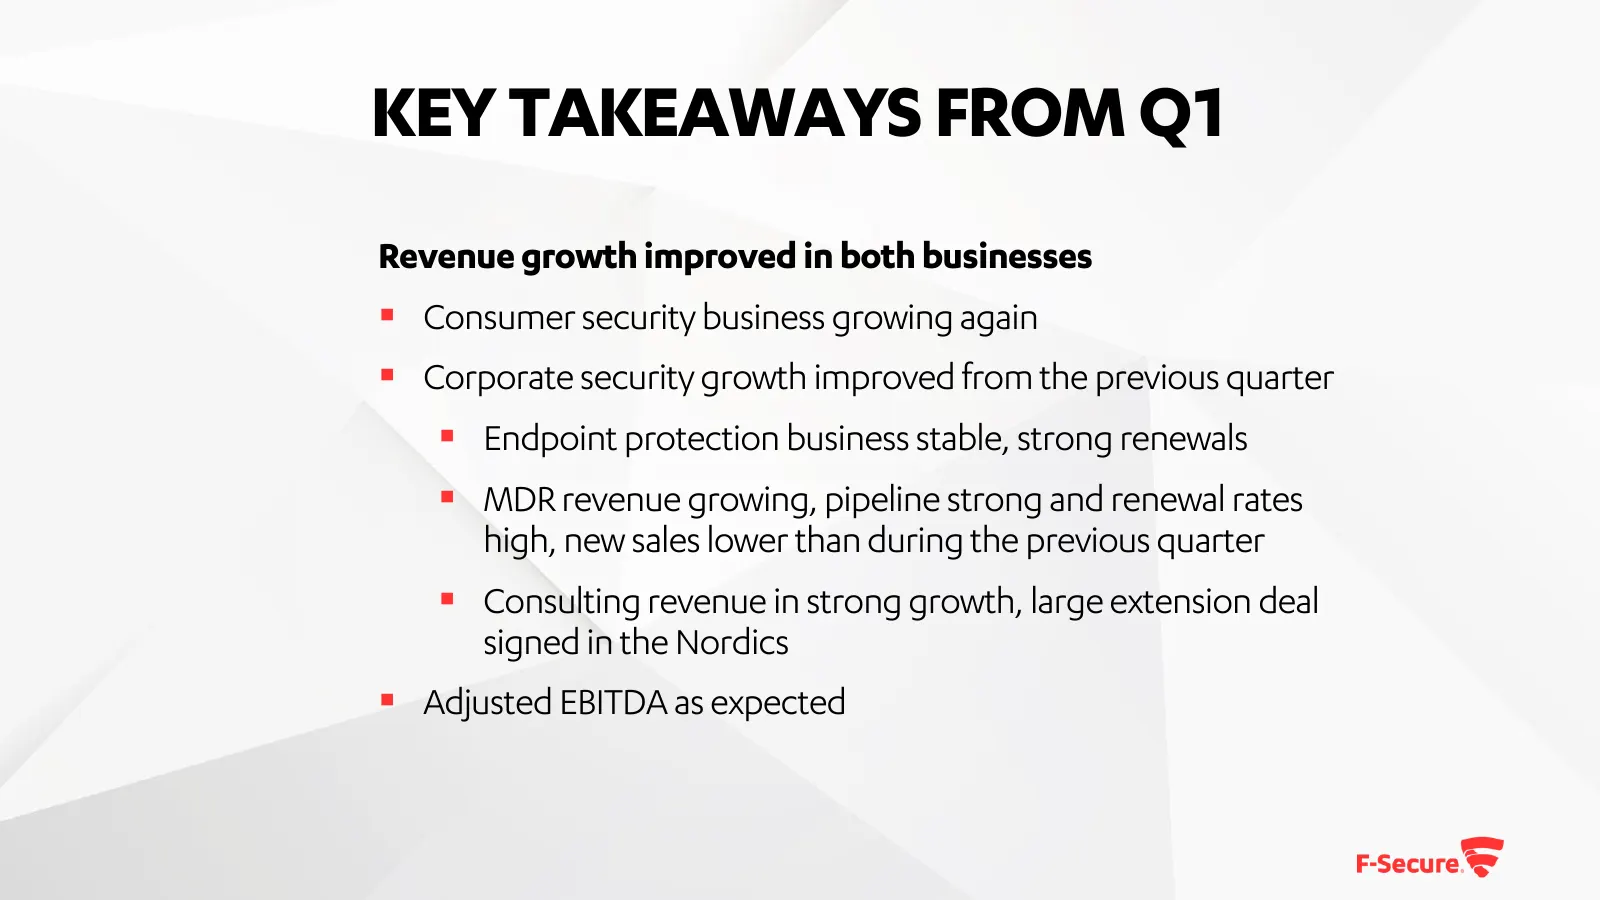
KEY TAKEAWAYS FROM Q1 Revenue growth improved in both businesses ▪ Consumer security business growing again ▪ Corporate security growth improved from the previous quarter ▪ Endpoint protection business stable, strong renewals ▪ MDR revenue growing, pipeline strong and renewal rates high, new sales l
Slide 4: Key figures
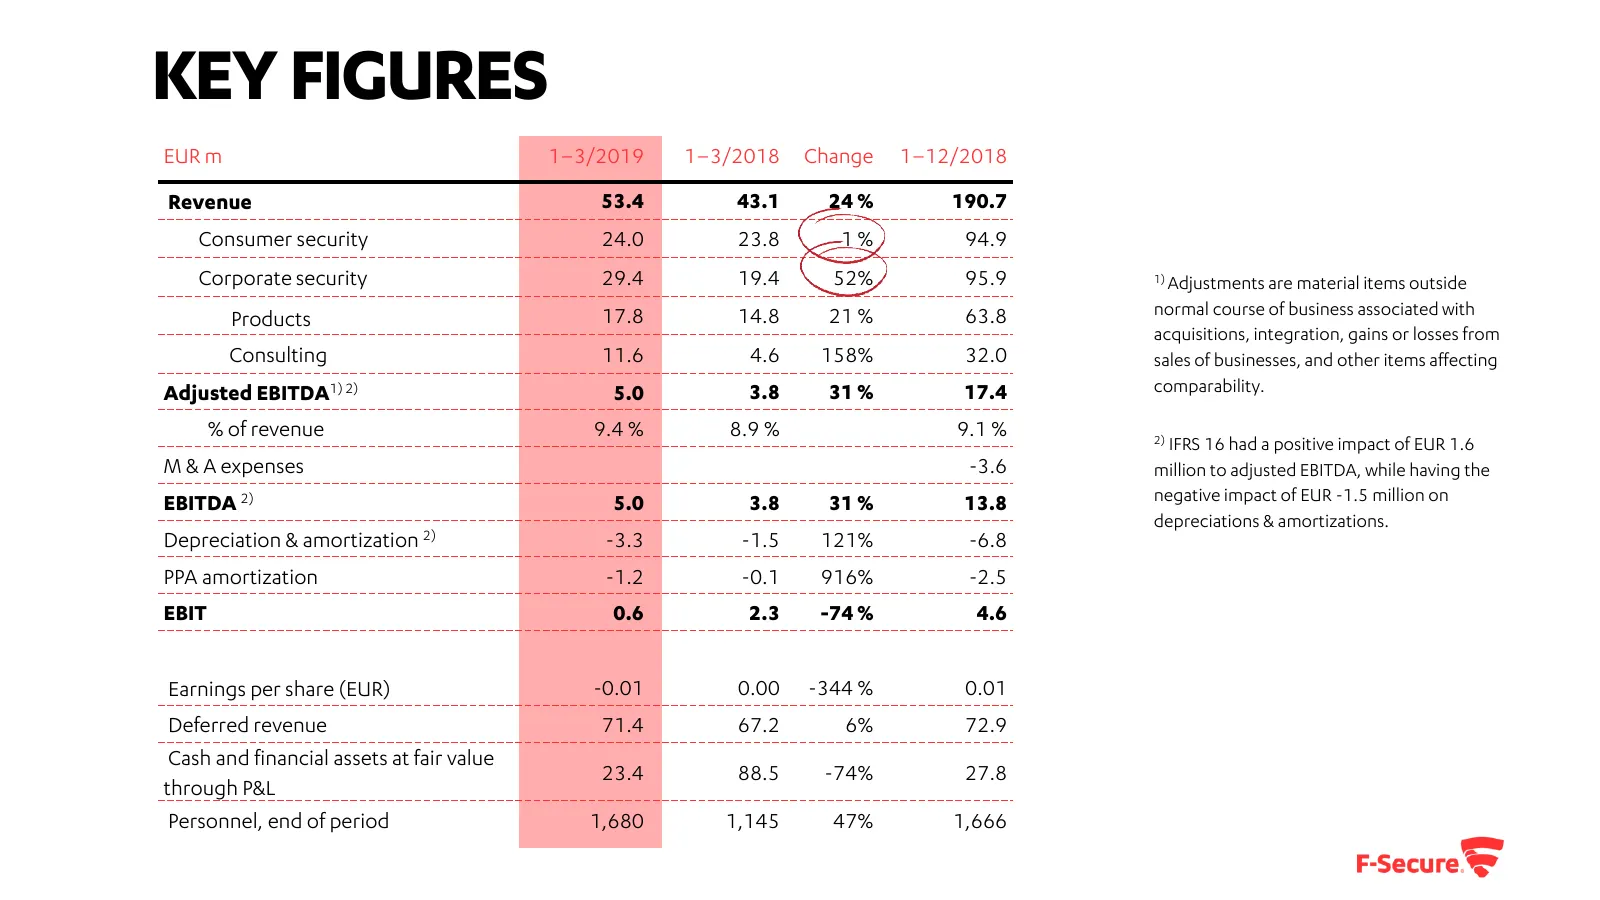
KEY FIGURES EUR m 1–3/2019 1–3/2018 Change 1–12/2018 Revenue 53.4 43.1 24 % 190.7 Consumer security 24.0 23.8 1% 94.9 Corporate security 29.4 19.4 52% 95.9 1) Adjustments are material items outside 17.8 14.8 21 % 63.8 normal course of business associated with Products acquisitions, integration, gain
Slide 5: Adjusted EBITDA according to expectations
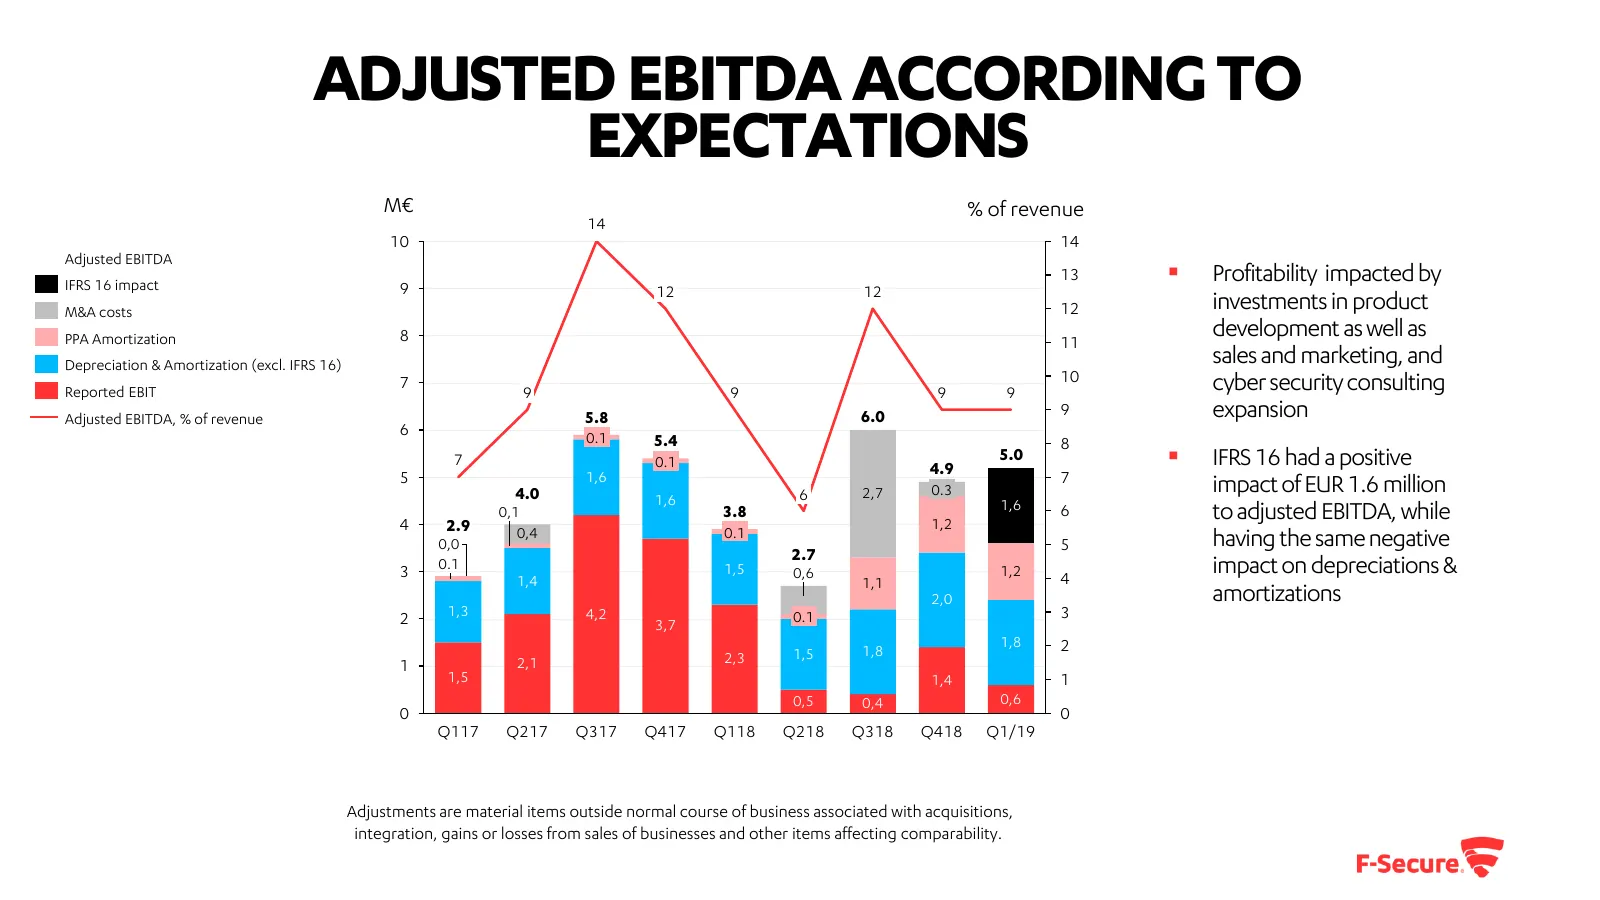
ADJUSTED EBITDA ACCORDING TO EXPECTATIONS M€ % of revenue 14 10 14 Adjusted EBITDA IFRS 16 impact 9 13 ▪ Profitability impacted by 12 12 M&A costs 12 investments in product PPA Amortization 8 11 development as well as Depreciation & Amortization (excl. IFRS 16) sales and marketing, and 7 10 cyber se
Slide 6: Impact of IFRS 16 in Q1/2019
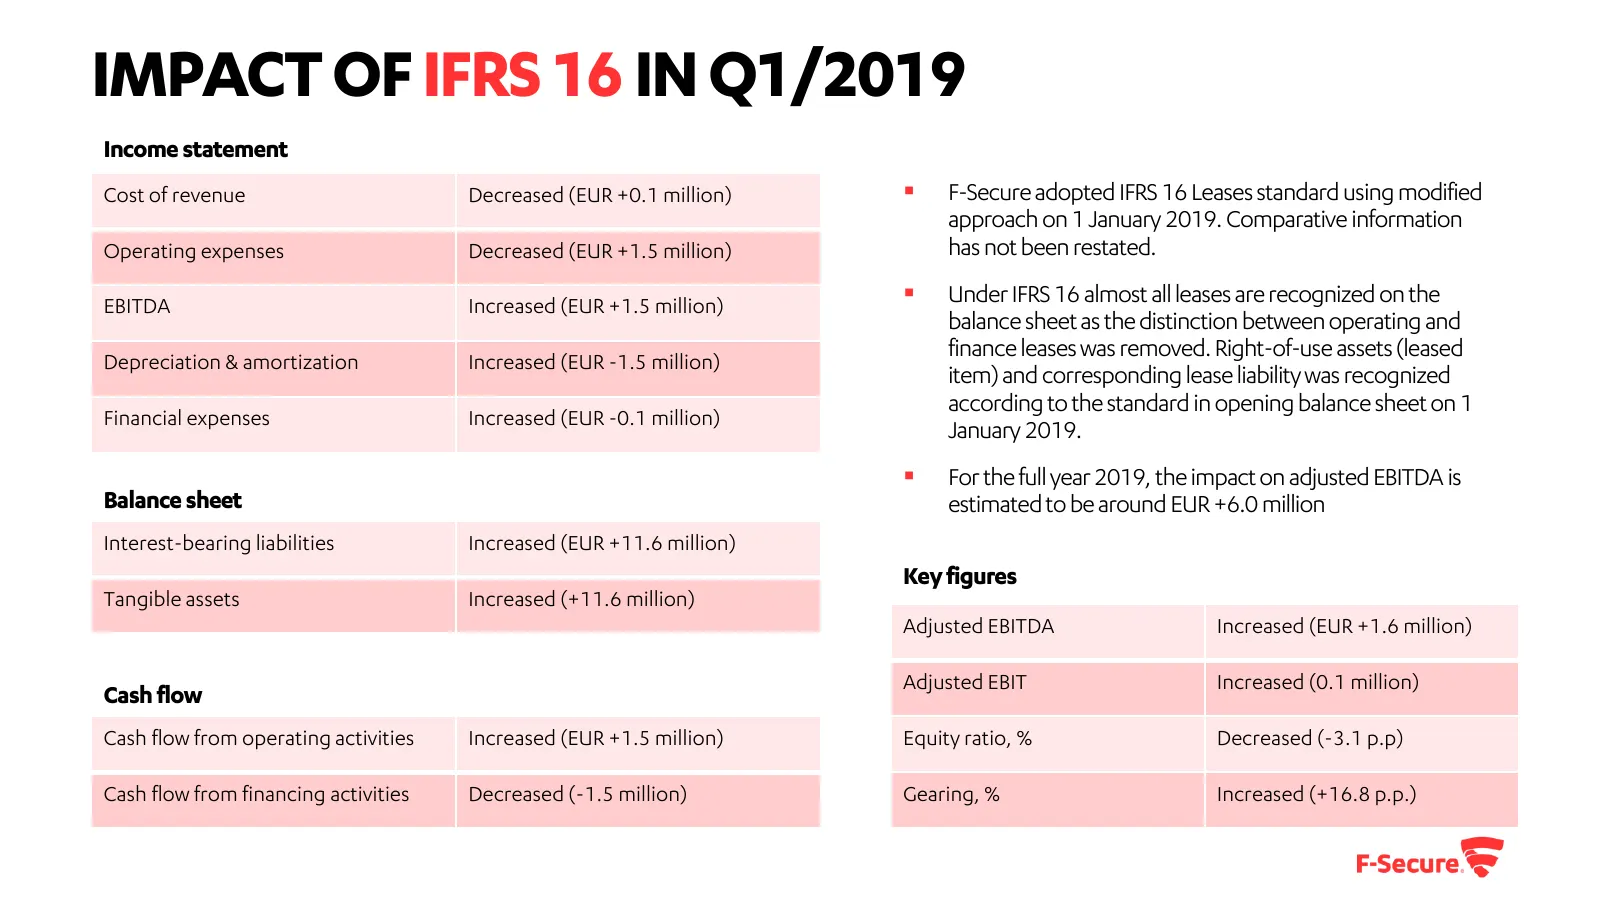
IMPACT OF IFRS 16 IN Q1/2019 Income statement Cost of revenue Decreased (EUR +0.1 million) ▪ F-Secure adopted IFRS 16 Leases standard using modified approach on 1 January 2019. Comparative information Operating expenses Decreased (EUR +1.5 million) has not been restated. EBITDA Increased (EUR +1.5 m
Slide 7: Corporate security revenue grew by +52% in Q1
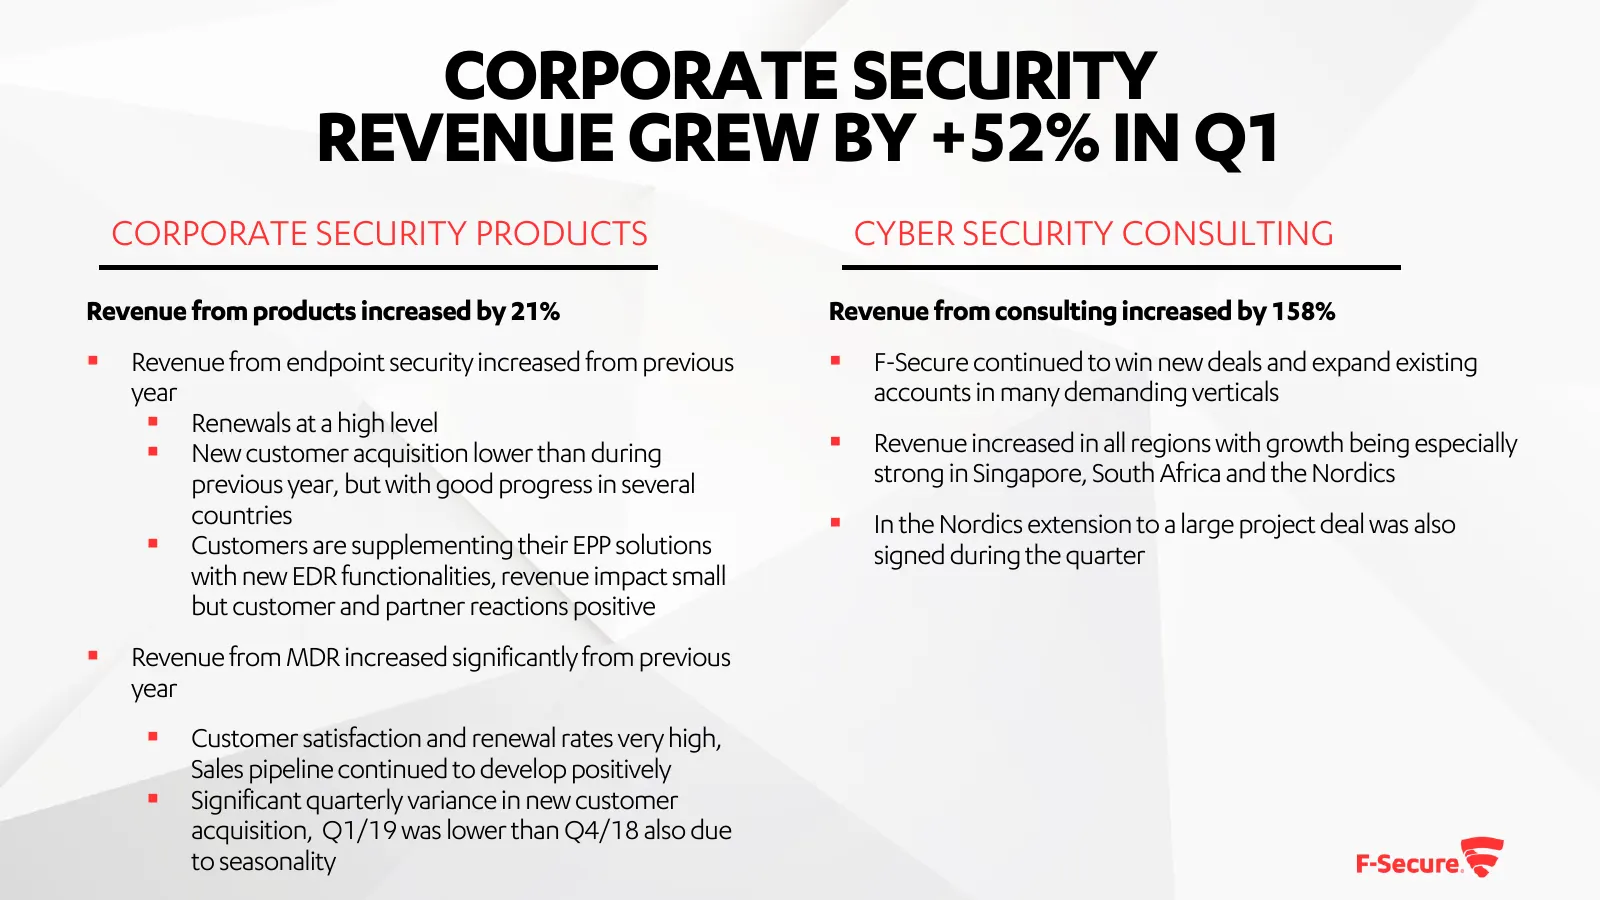
CORPORATE SECURITY REVENUE GREW BY +52% IN Q1 CORPORATE SECURITY PRODUCTS CYBER SECURITY CONSULTING Revenue from products increased by 21% Revenue from consulting increased by 158% ▪ Revenue from endpoint security increased from previous ▪ F-Secure continued to win new deals and expand existing year
Slide 8: We continuously get awarded for best protection
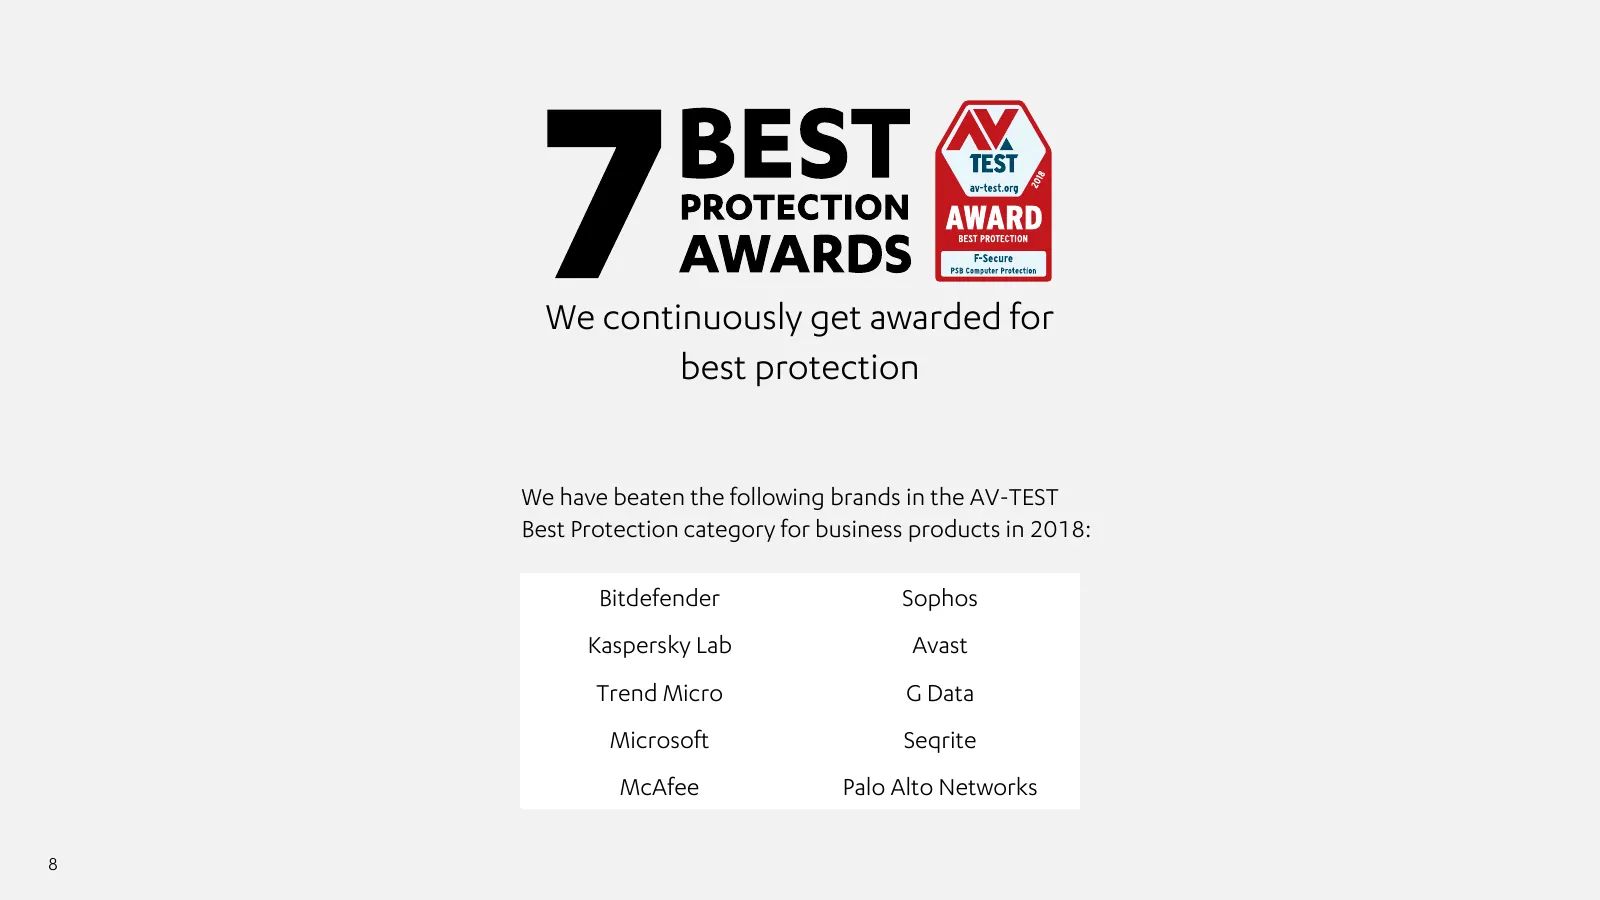
We continuously get awarded for best protection We have beaten the following brands in the AV-TEST Best Protection category for business products in 2018: Bitdefender Sophos Kaspersky Lab Avast Trend Micro G Data Microsoft Seqrite McAfee Palo Alto Networks 8 8
Slide 9: Companies are struggling to detect and respond
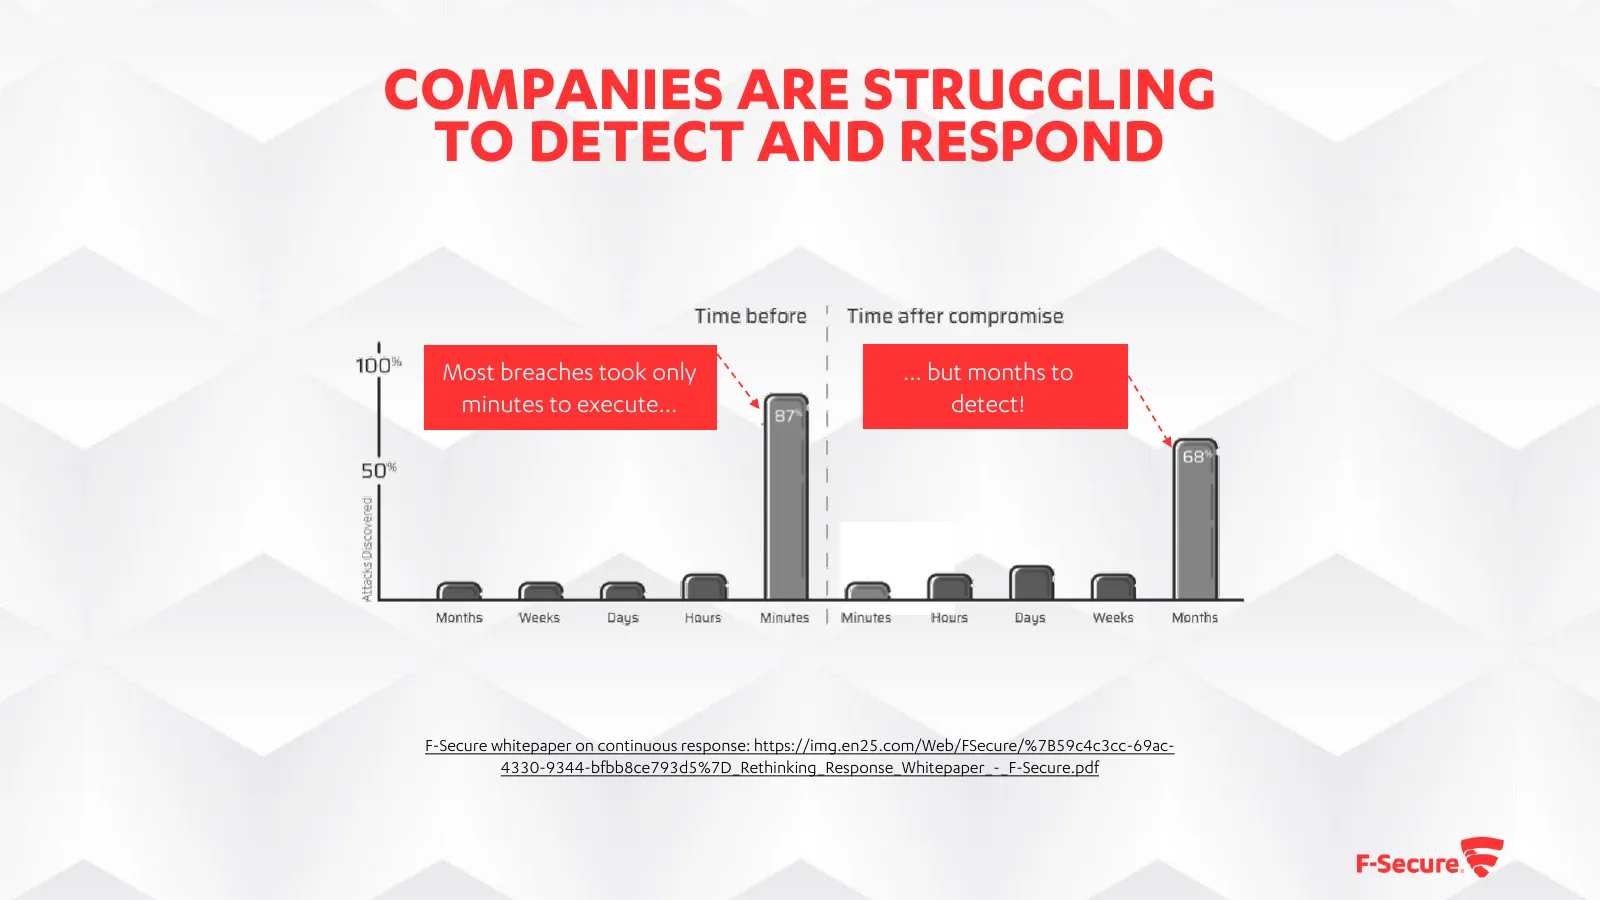
COMPANIES ARE STRUGGLING TO DETECT AND RESPOND Most breaches took only … but months to minutes to execute… detect! F-Secure whitepaper on continuous response: https://img.en25.com/Web/FSecure/%7B59c4c3cc-69ac- 4330-9344-bfbb8ce793d5%7D_Rethinking_Response_Whitepaper_-_F-Secure.pdf
Slide 10: F-Secure Countercept is the only MDR solution designed to skill-up your team
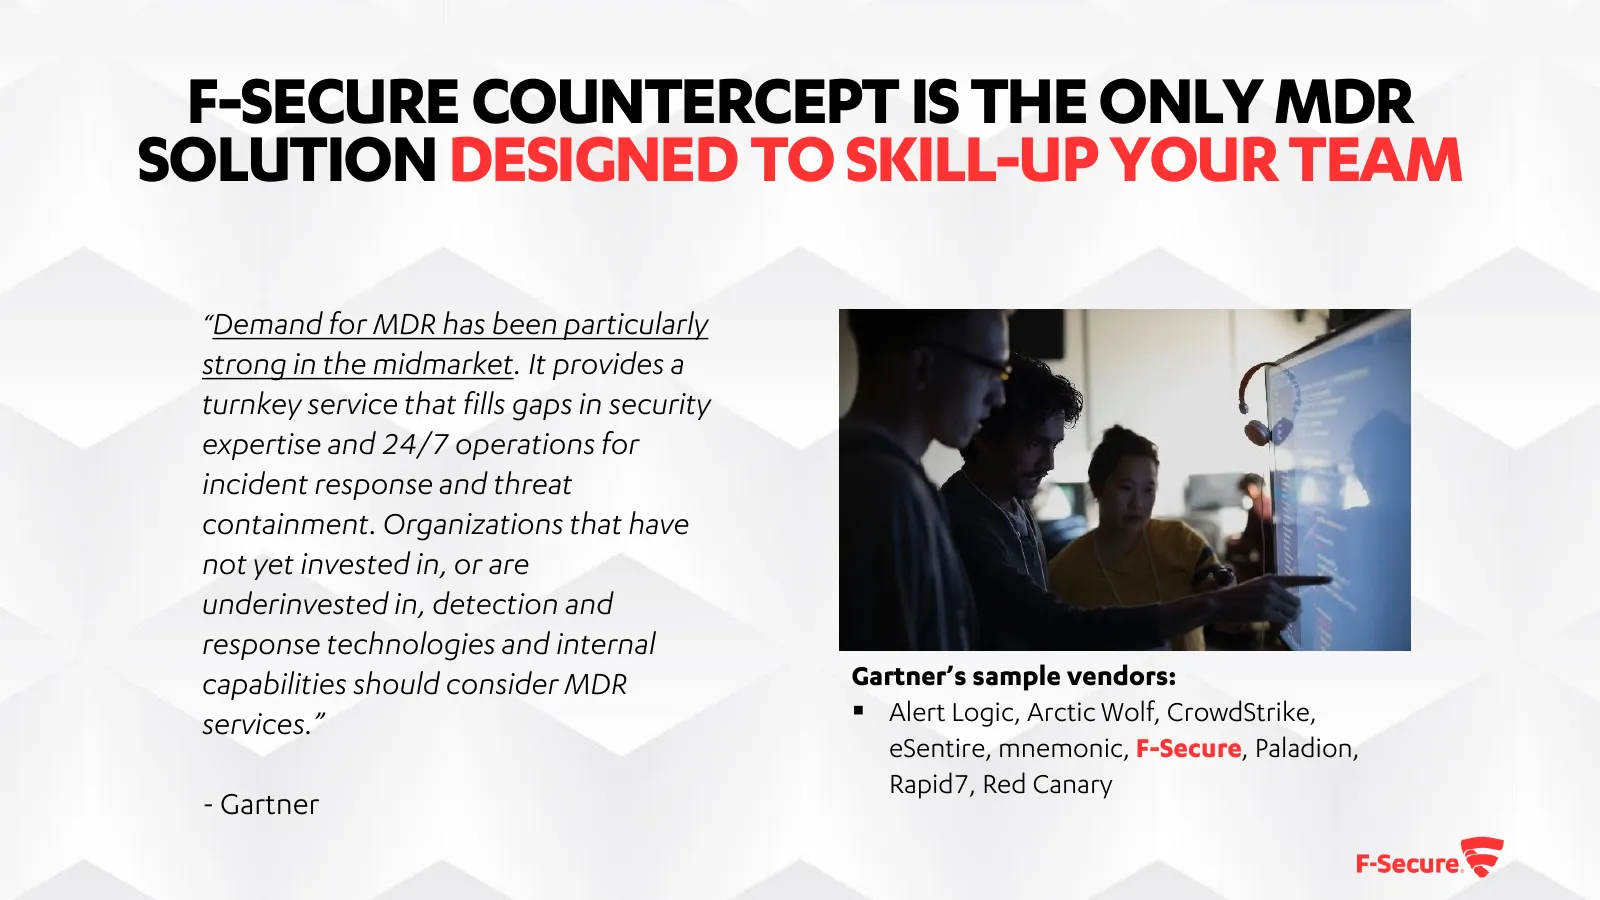
F-SECURE COUNTERCEPT IS THE ONLY MDR SOLUTION DESIGNED TO SKILL-UP YOUR TEAM “Demand for MDR has been particularly strong in the midmarket. It provides a turnkey service that fills gaps in security expertise and 24/7 operations for incident response and threat containment. Organizations that have no
Slide 11: Consumer security revenue growing again in Q1
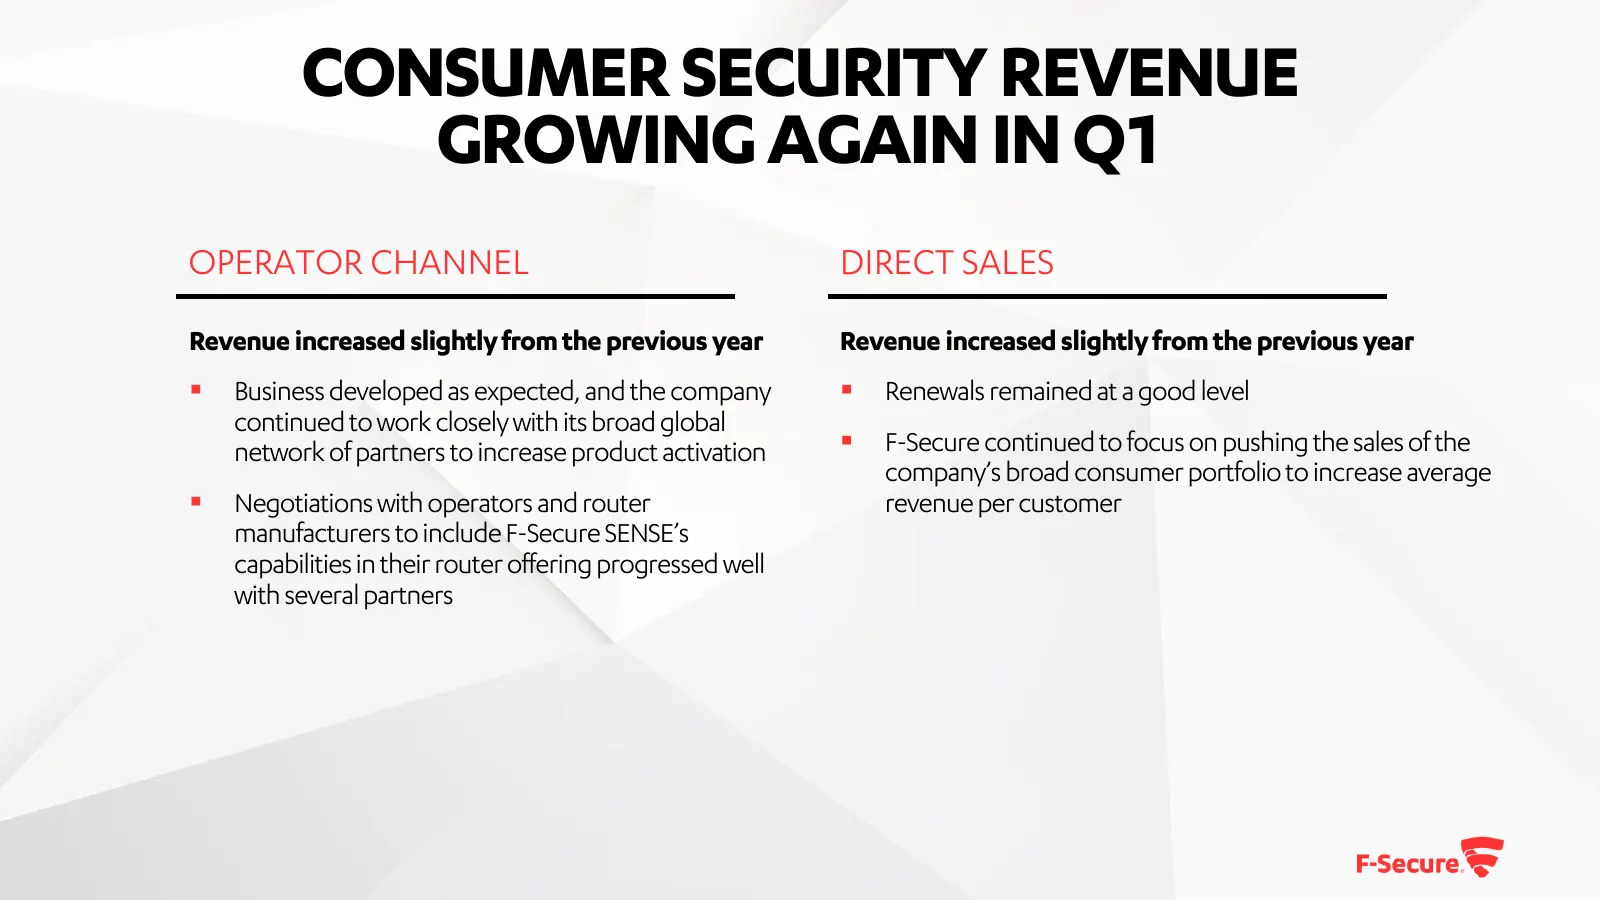
CONSUMER SECURITY REVENUE GROWING AGAIN IN Q1 OPERATOR CHANNEL DIRECT SALES Revenue increased slightly from the previous year Revenue increased slightly from the previous year ▪ Business developed as expected, and the company ▪ Renewals remained at a good level continued to work closely with its bro
Slide 12: Scalable software business complemented by expert services
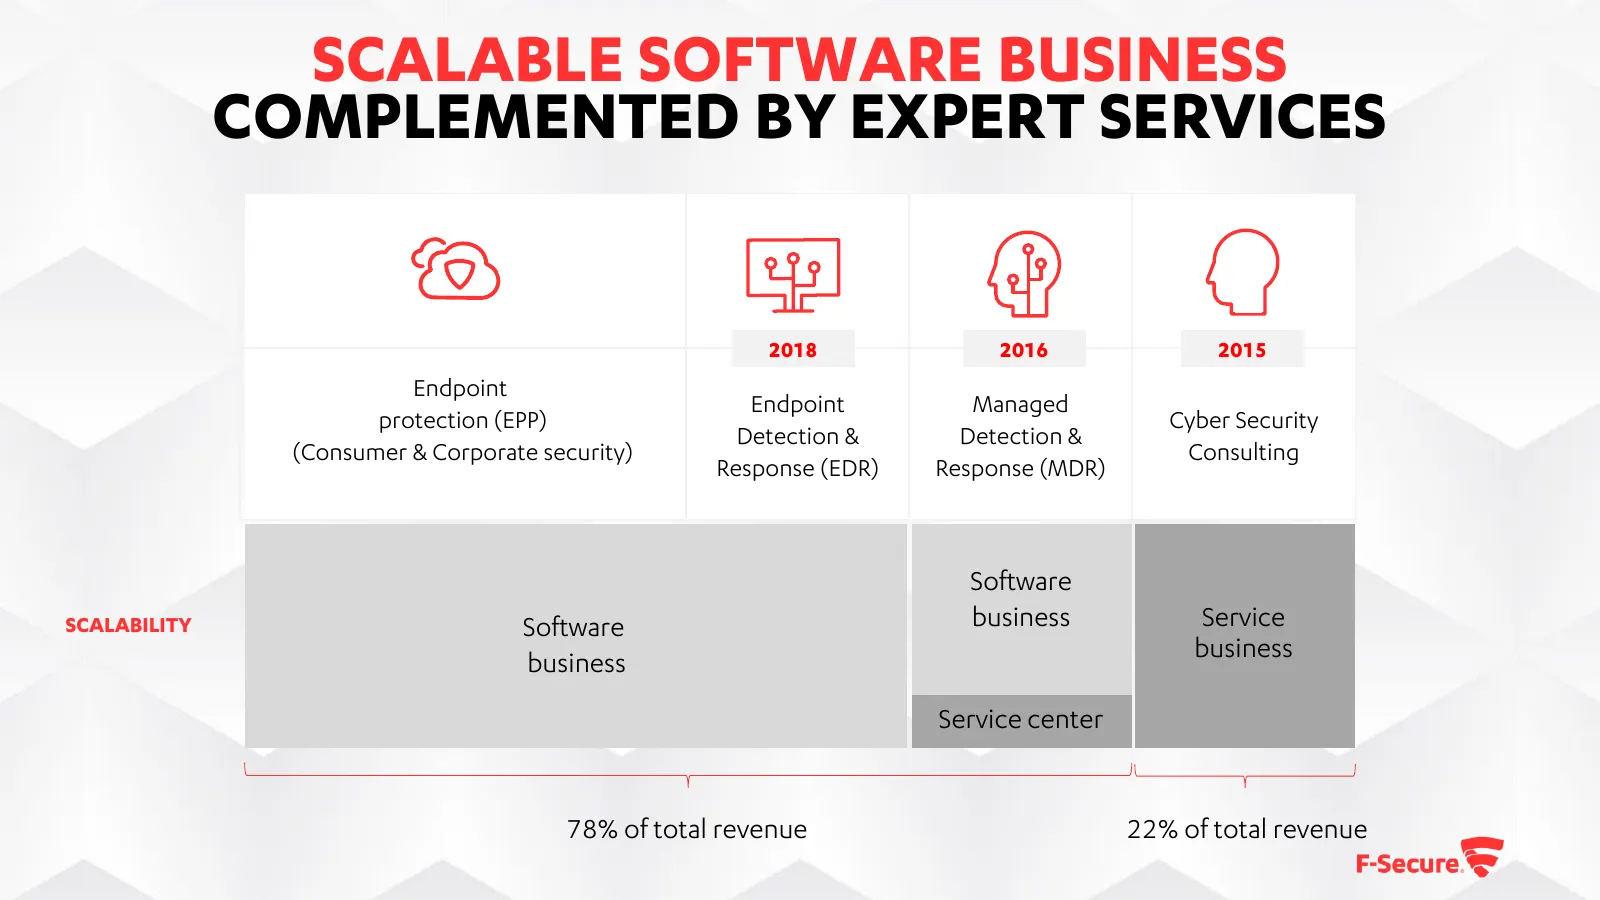
SCALABLE SOFTWARE BUSINESS COMPLEMENTED BY EXPERT SERVICES 2018 2016 2015 Endpoint Endpoint Managed protection (EPP) Cyber Security Detection & Detection & (Consumer & Corporate security) Consulting Response (EDR) Response (MDR) Software SCALABILITY Software business Service business business Servic
Slide 13: Outlook for 2019 unchanged
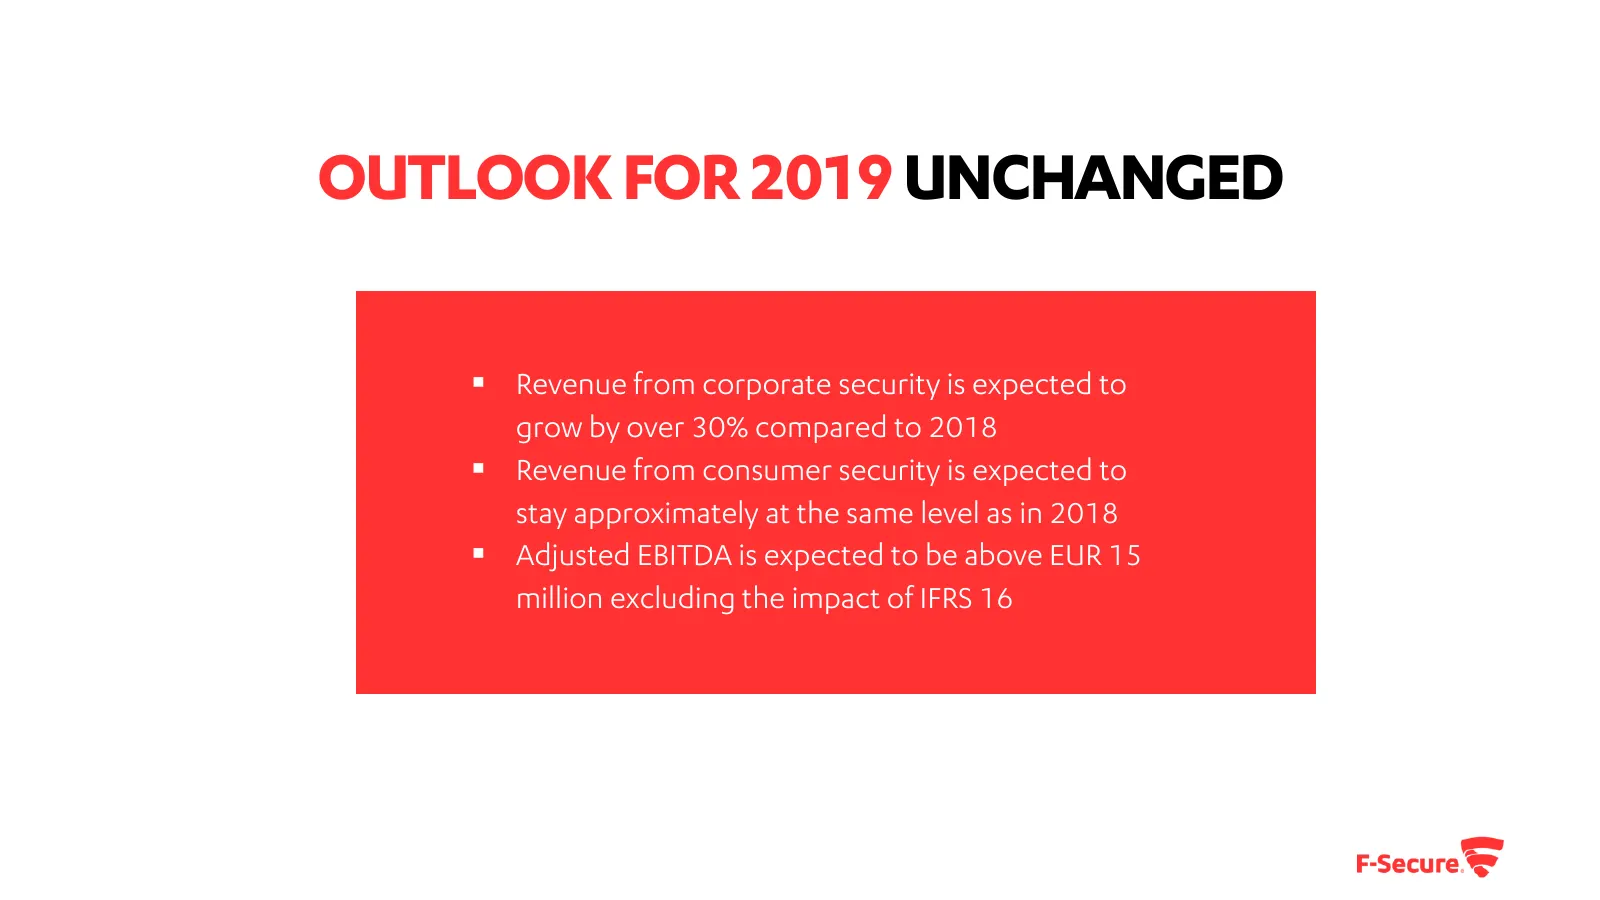
OUTLOOK FOR 2019 UNCHANGED ▪ Revenue from corporate security is expected to grow by over 30% compared to 2018 ▪ Revenue from consumer security is expected to stay approximately at the same level as in 2018 ▪ Adjusted EBITDA is expected to be above EUR 15 million excluding the impact of IFRS 16
Slide 14: Outlook for 2018-2021 unchanged
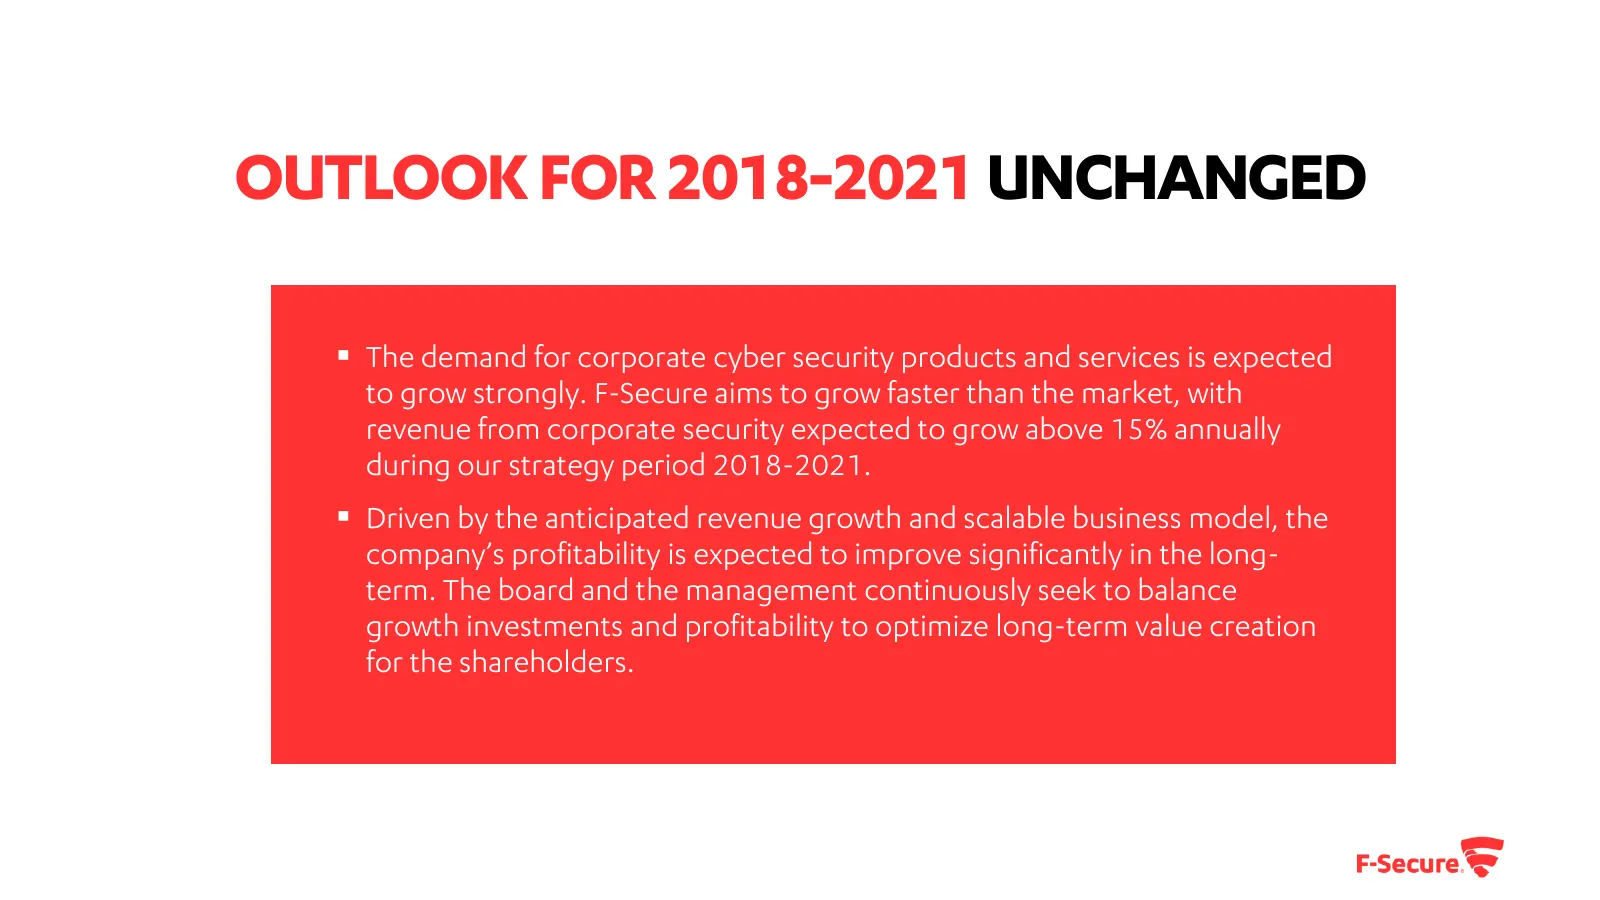
OUTLOOK FOR 2018-2021 UNCHANGED ▪ The demand for corporate cyber security products and services is expected to grow strongly. F-Secure aims to grow faster than the market, with revenue from corporate security expected to grow above 15% annually during our strategy period 2018-2021. ▪ Driven by the a
Slide 15: Financials Q1 2019
FINANCIALS Q1 2019 All income statement figures refer to continuing operations, and figures in brackets refer to the corresponding period in the previous year, unless otherwise stated.
Slide 16: Revenue
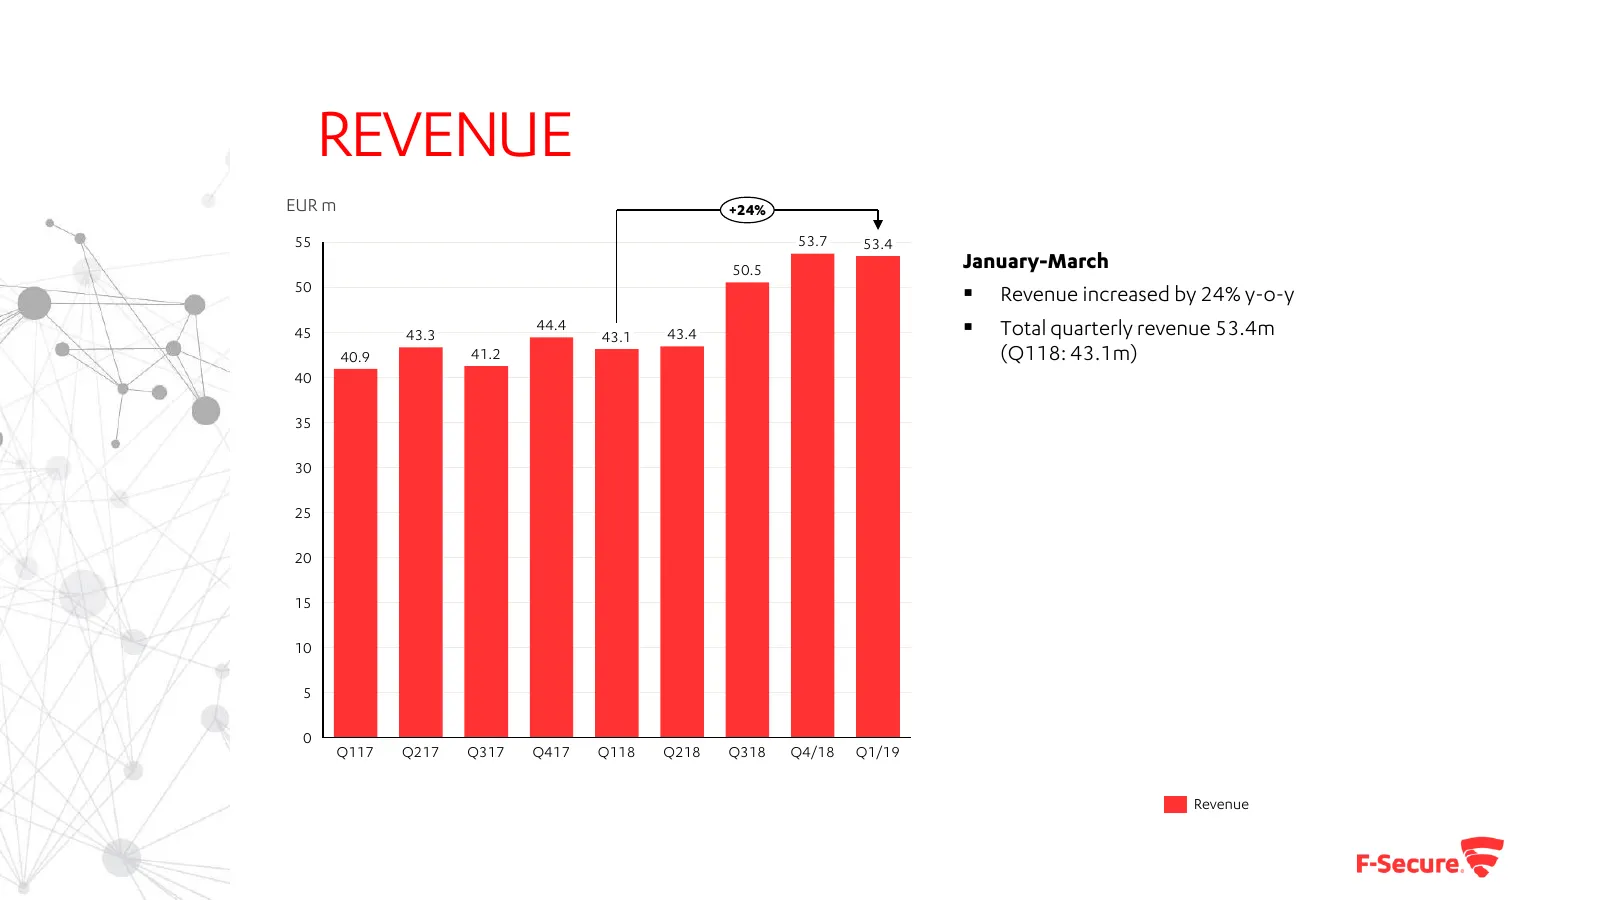
REVENUE EUR m +24% 55 53.7 53.4 50.5 January-March 50 ▪ Revenue increased by 24% y-o-y 45 43.3 44.4 43.1 43.4 ▪ Total quarterly revenue 53.4m 40.9 41.2 (Q118: 43.1m) 40 35 30 25 20 15 10 5 0 Q117 Q217 Q317 Q417 Q118 Q218 Q318 Q4/18 Q1/19 Revenue
Slide 17: Revenue split
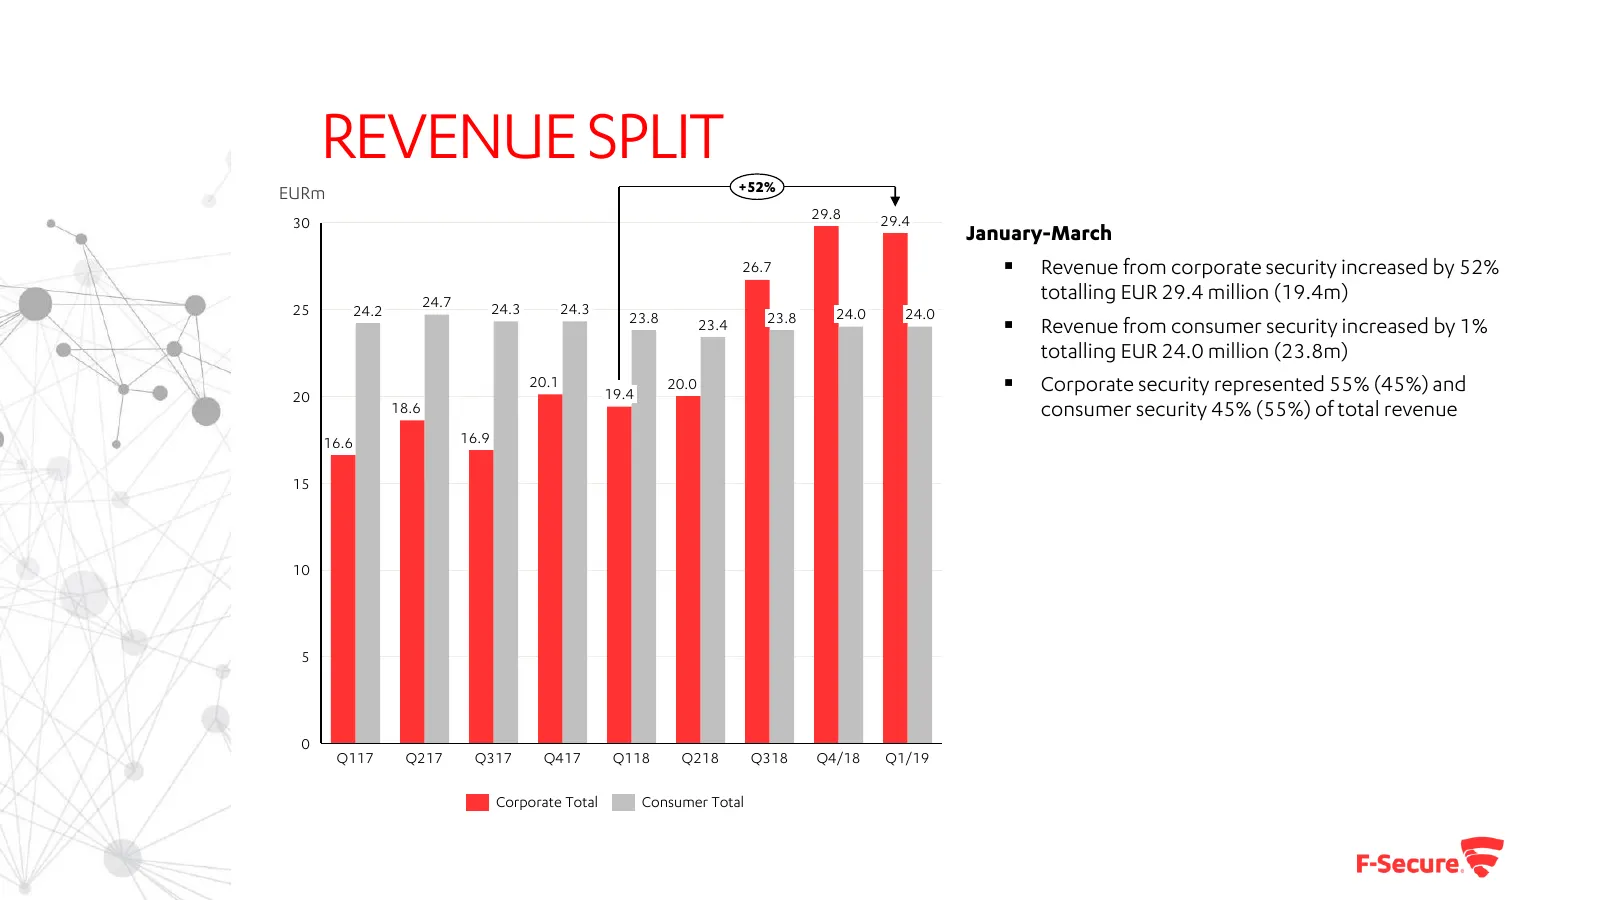
REVENUE SPLIT +52% EURm 29.8 29.4 30 January-March 26.7 ▪ Revenue from corporate security increased by 52% 24.7 totalling EUR 29.4 million (19.4m) 25 24.2 24.3 24.3 24.0 24.0 23.8 23.8 23.4 ▪ Revenue from consumer security increased by 1% totalling EUR 24.0 million (23.8m) 20 20.1 19.4 20.0 ▪ Corpor
Slide 18: Profitability
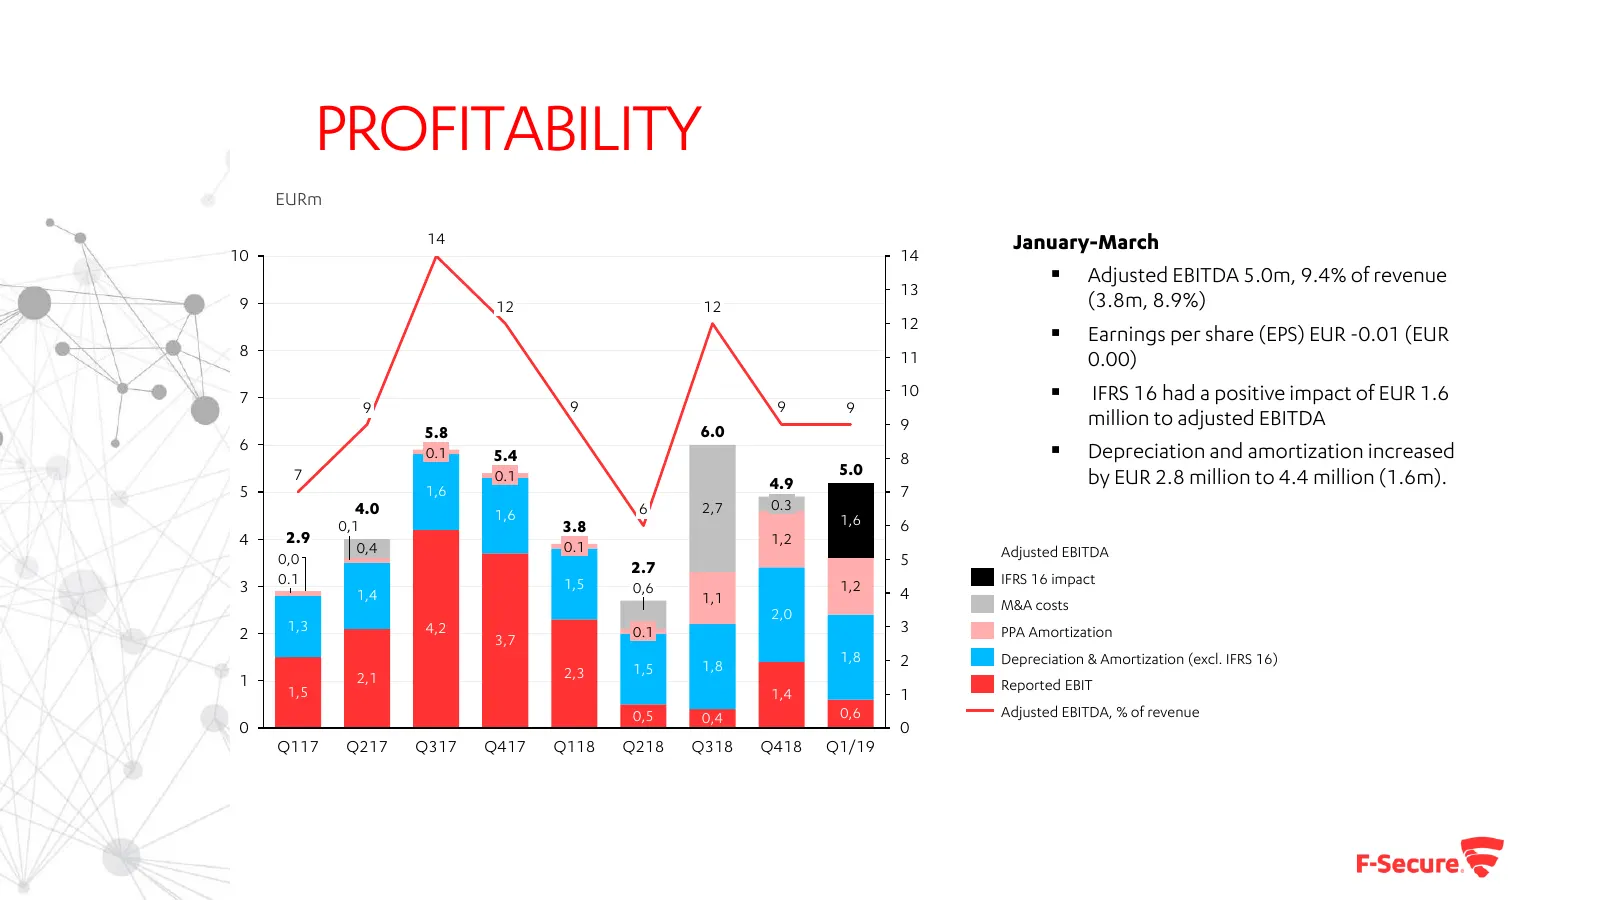
PROFITABILITY EURm 14 January-March 10 14 ▪ Adjusted EBITDA 5.0m, 9.4% of revenue 13 9 12 12 (3.8m, 8.9%) 12 ▪ Earnings per share (EPS) EUR -0.01 (EUR 8 11 0.00) 7 10 ▪ IFRS 16 had a positive impact of EUR 1.6 9 9 9 9 9 million to adjusted EBITDA 5.8 6.0 6 0.1 ▪ Depreciation and amortization increas
Slide 19: Operating expenses
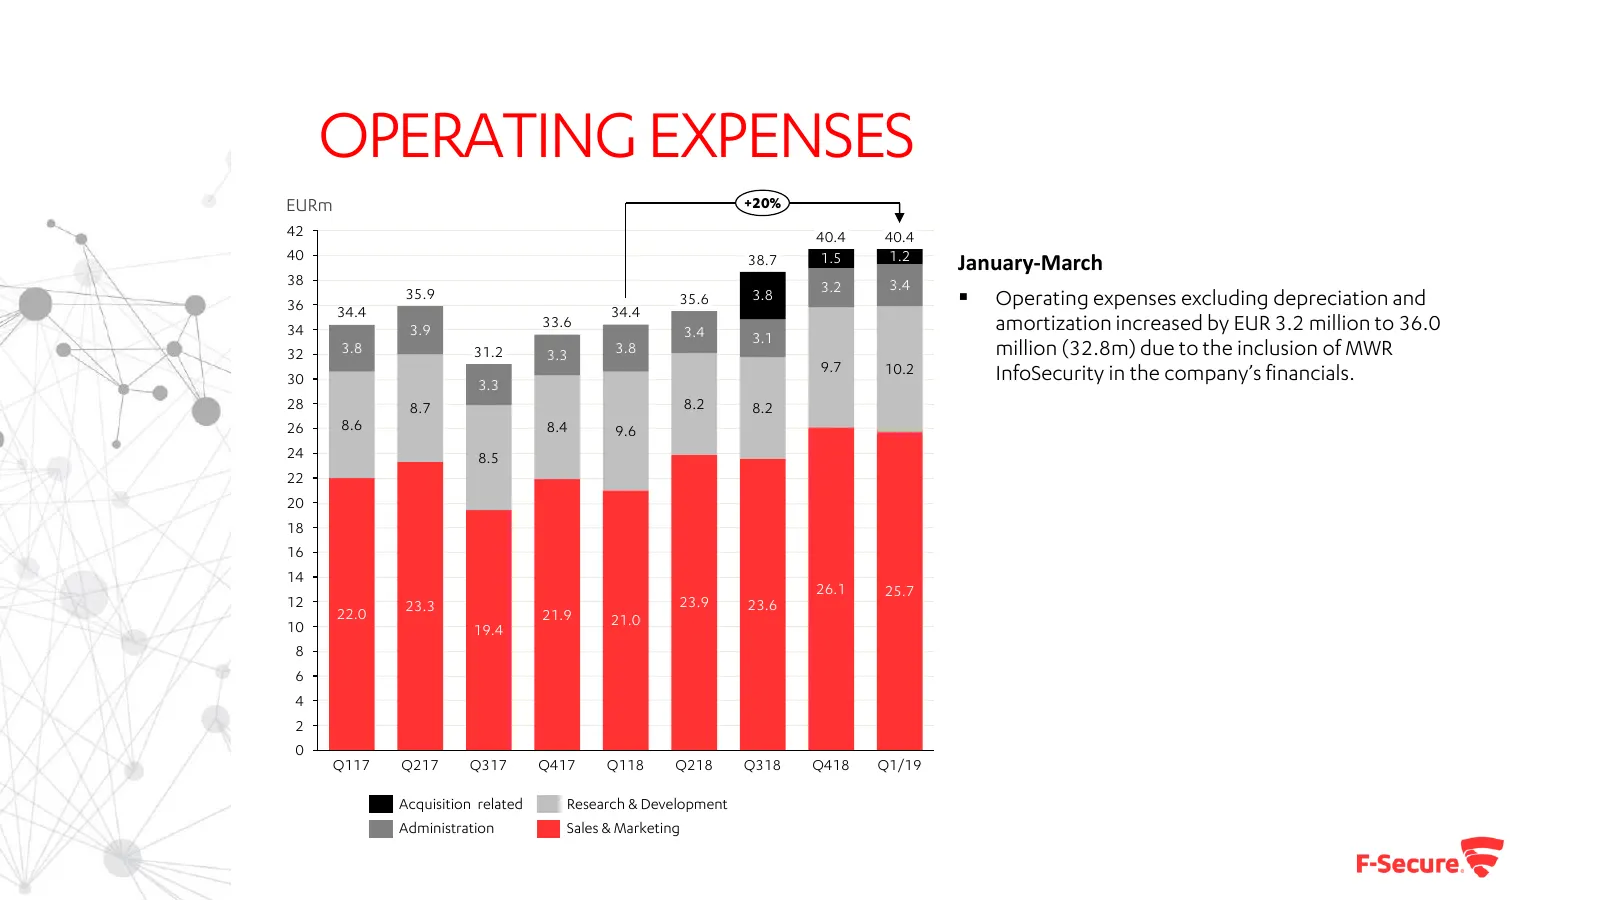
OPERATING EXPENSES EURm +20% 42 40.4 40.4 40 38.7 1.5 1.2 January-March 38 3.2 3.4 36 35.9 35.6 3.8 ▪ Operating expenses excluding depreciation and 34.4 34.4 34 3.9 33.6 3.4 amortization increased by EUR 3.2 million to 36.0 3.1 32 3.8 31.2 3.3 3.8 million (32.8m) due to the inclusion of MWR 9.7 10.2
Slide 20: Deferred revenue
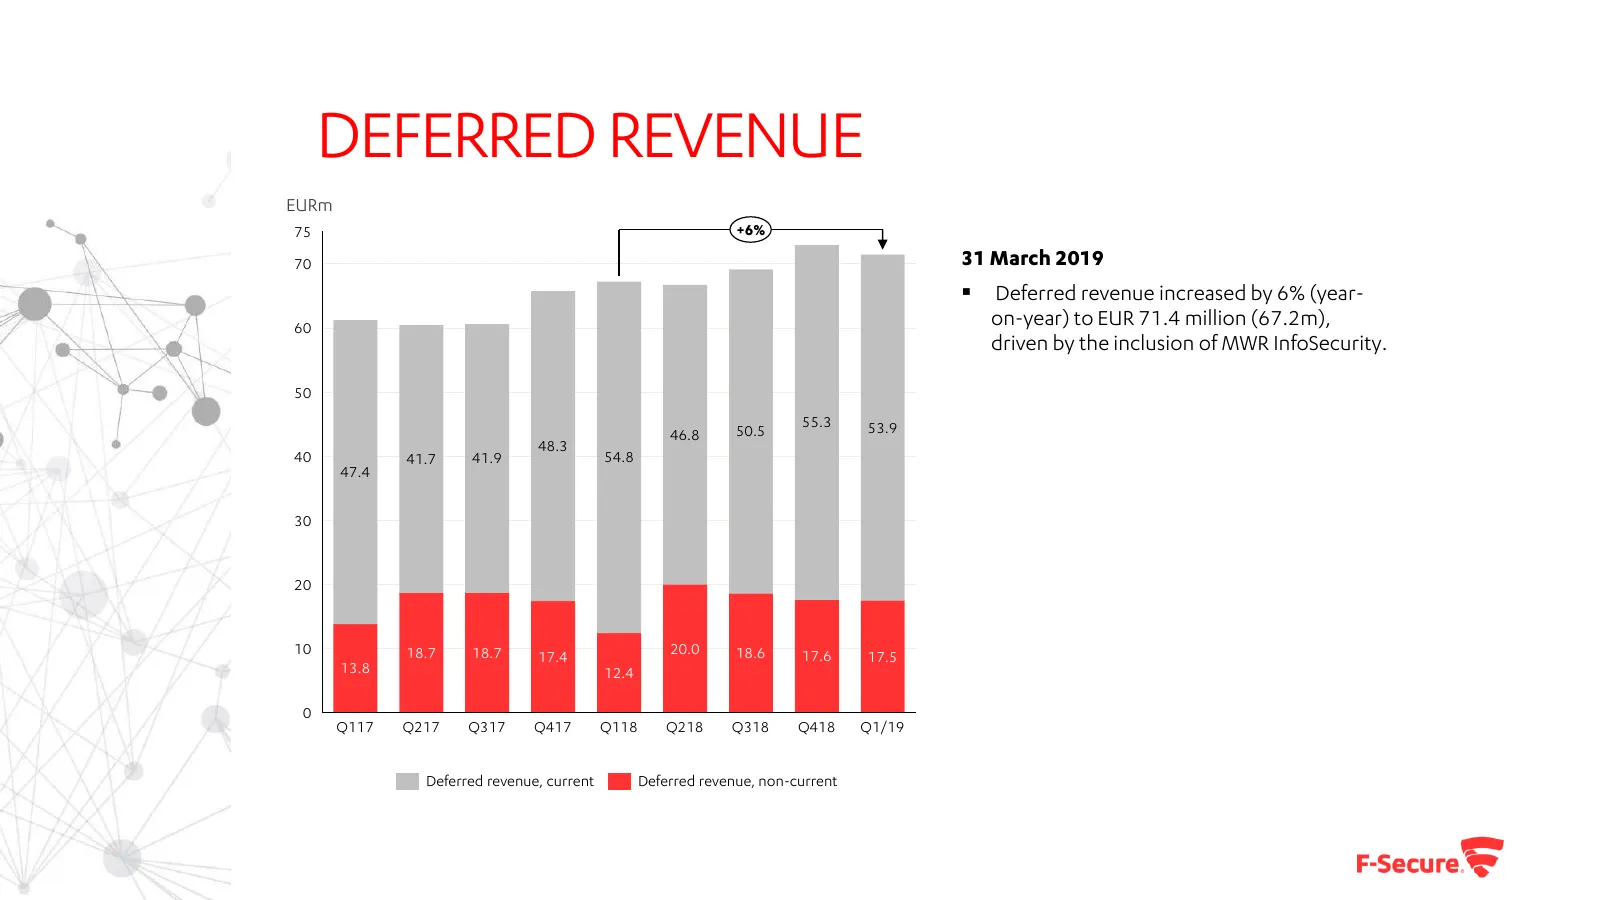
DEFERRED REVENUE EURm 75 +6% 70 31 March 2019 ▪ Deferred revenue increased by 6% (year- 60 on-year) to EUR 71.4 million (67.2m), driven by the inclusion of MWR InfoSecurity. 50 55.3 53.9 46.8 50.5 48.3 40 41.7 41.9 54.8 47.4 30 20 10 18.7 18.7 20.0 18.6 17.6 17.5 17.4 13.8 12.4 0 Q117 Q217 Q317 Q417
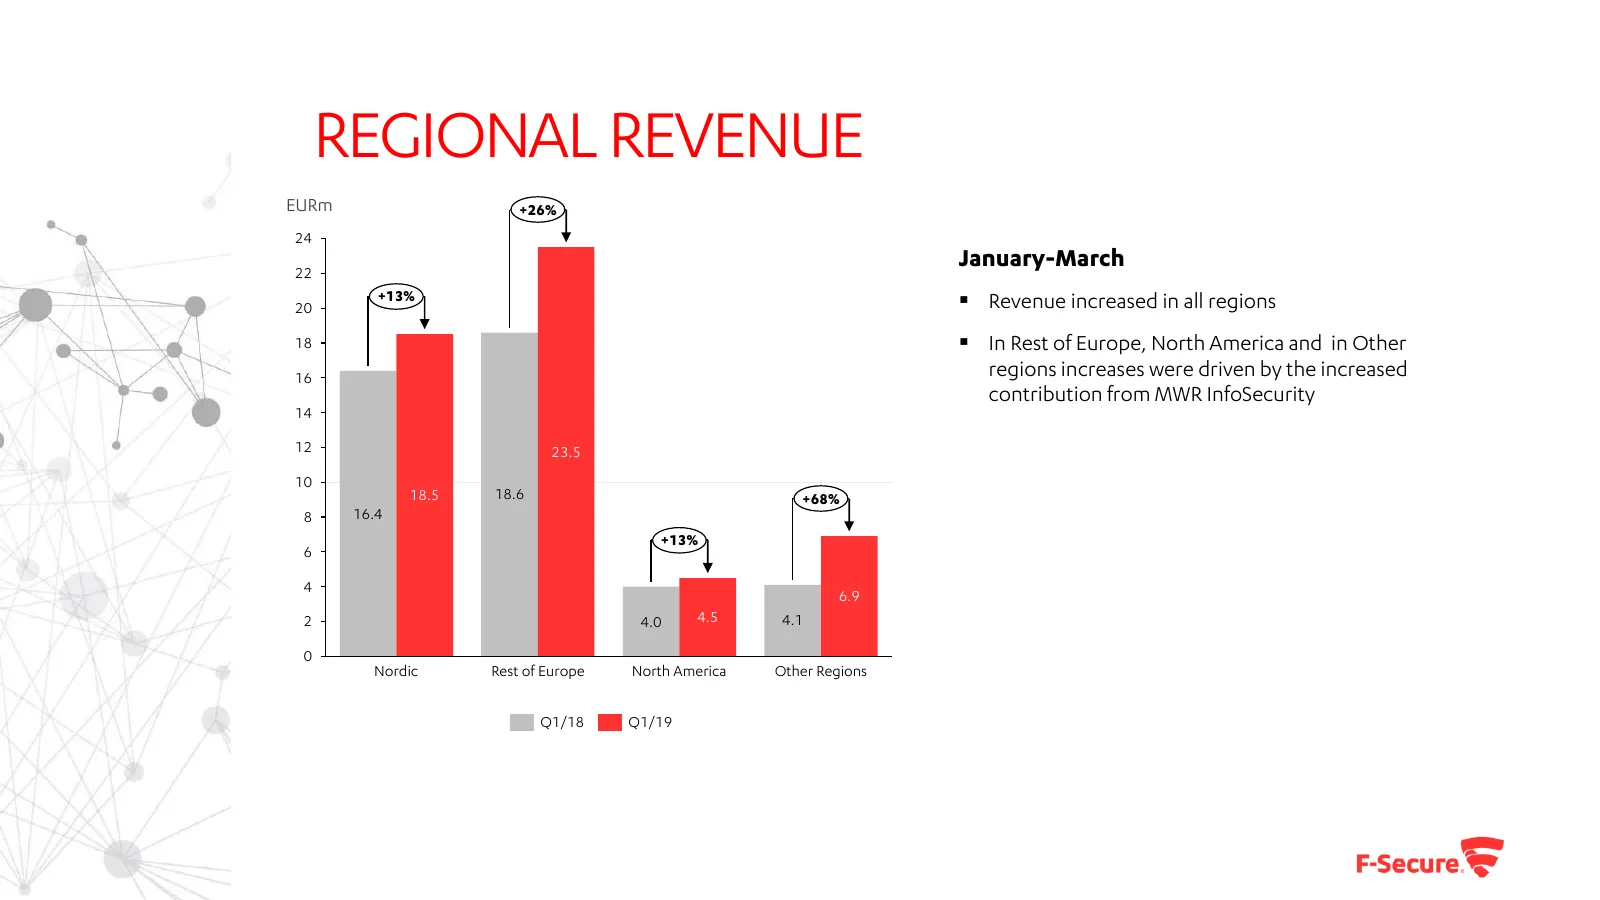
Slide 21: Regional revenue
REGIONAL REVENUE EURm +26% 24 22 January-March 20 +13% ▪ Revenue increased in all regions 18 ▪ In Rest of Europe, North America and in Other 16 regions increases were driven by the increased contribution from MWR InfoSecurity 14 12 23.5 10 18.5 18.6 +68% 8 16.4 +13% 6 4 6.9 2 4.0 4.5 4.1 0 Nordic Re
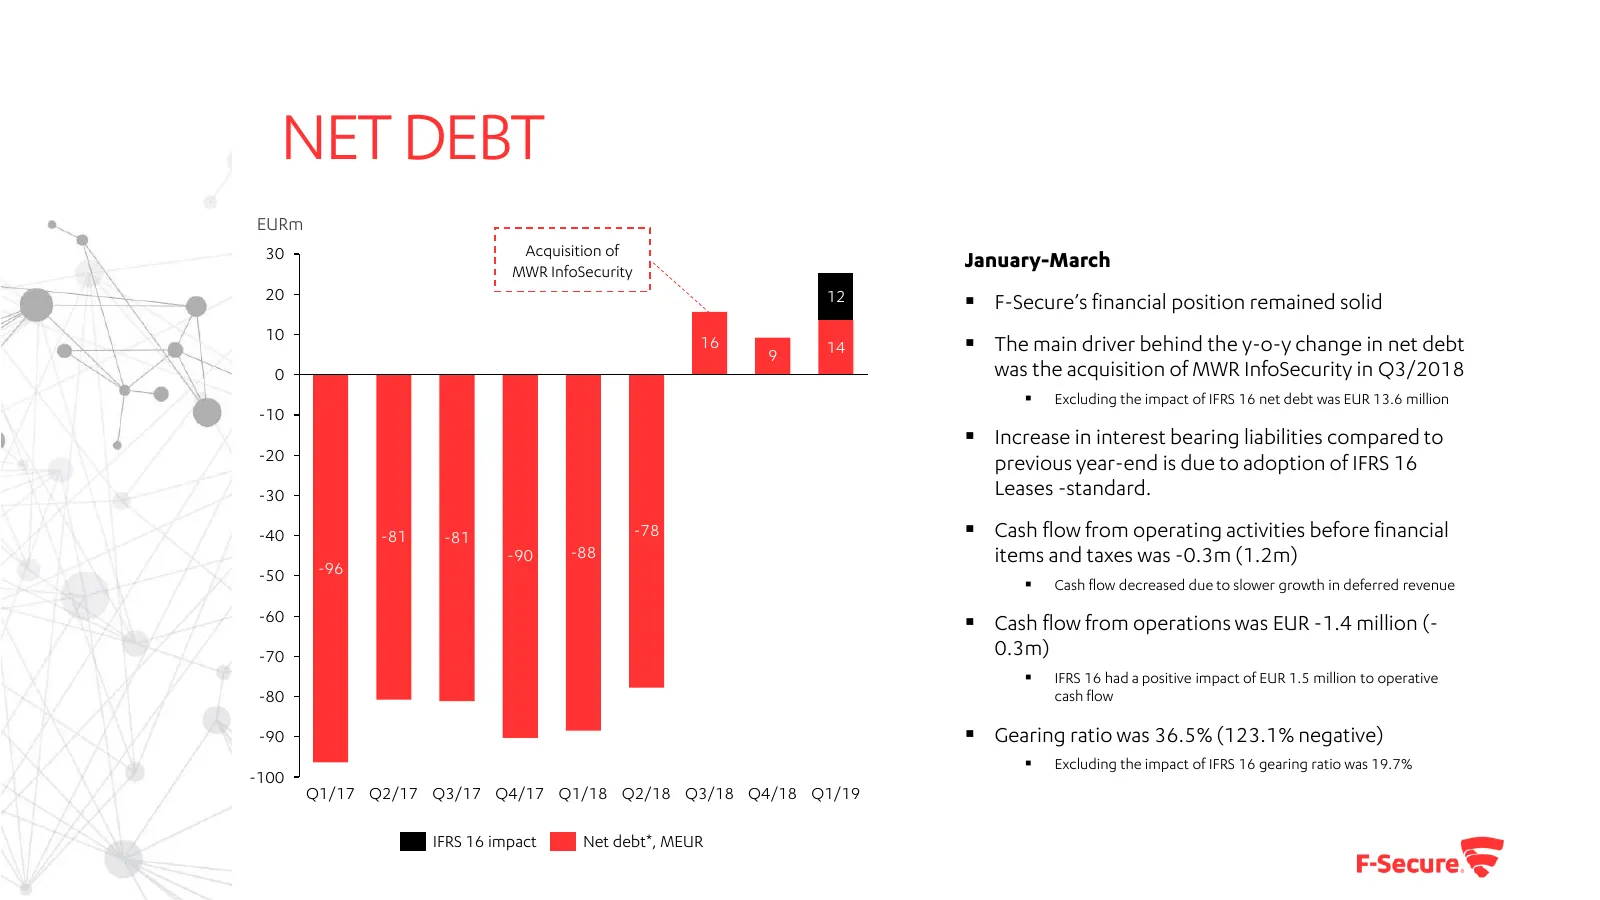
Slide 22: Net debt
NET DEBT EURm 30 Acquisition of MWR InfoSecurity January-March 20 12 ▪ F-Secure’s financial position remained solid 10 16 9 14 ▪ The main driver behind the y-o-y change in net debt 0 was the acquisition of MWR InfoSecurity in Q3/2018 ▪ Excluding the impact of IFRS 16 net debt was EUR 13.6 million -1
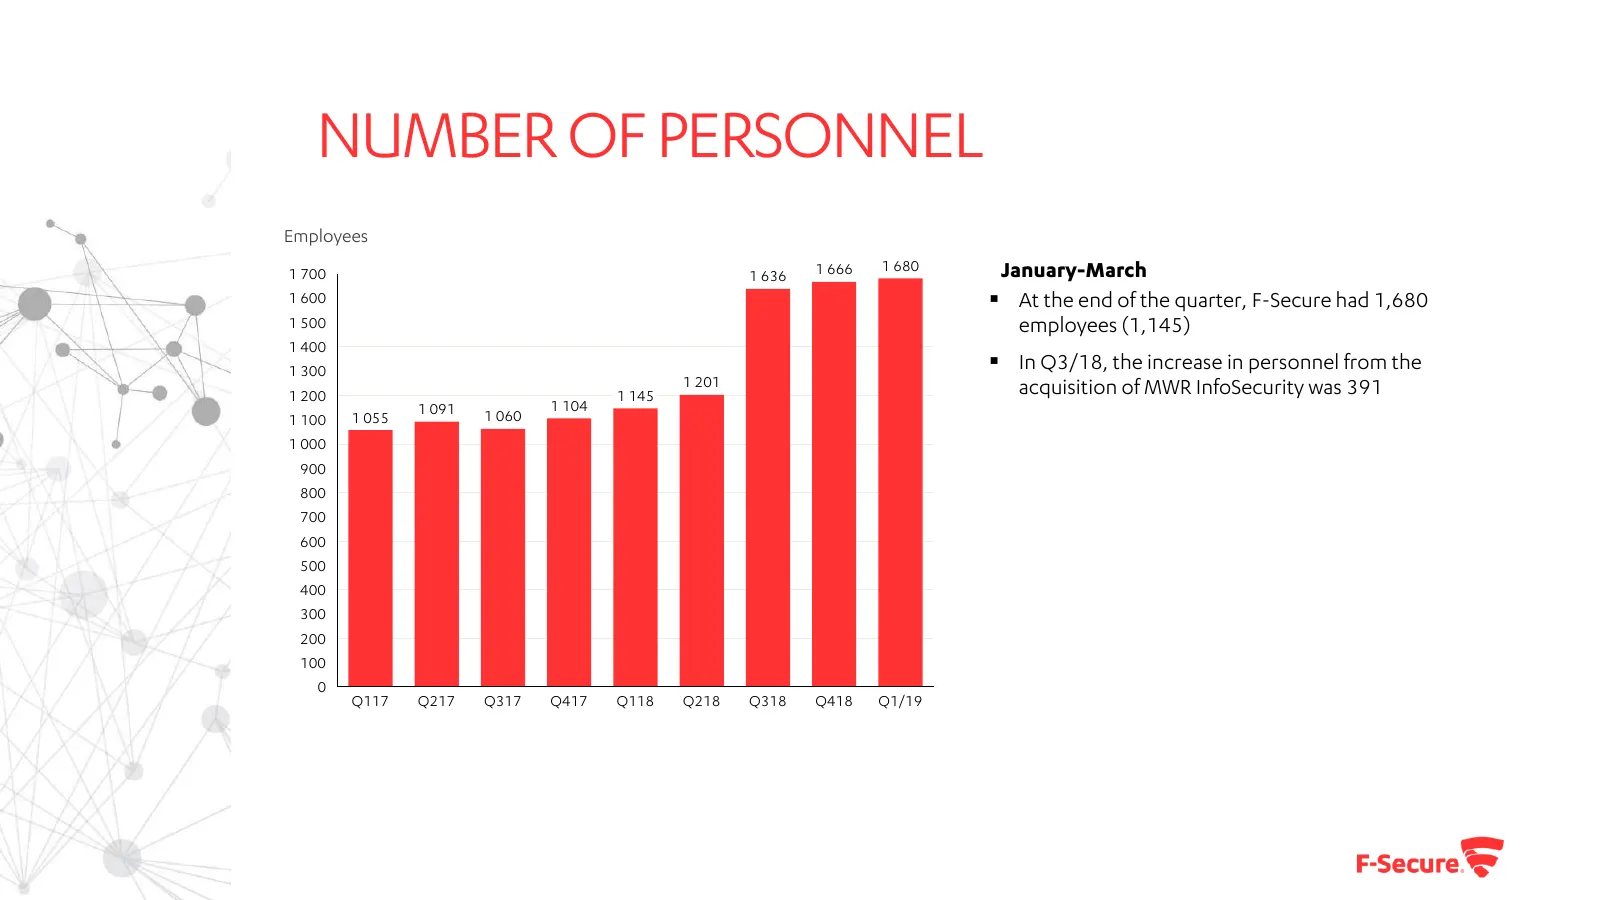
Slide 23: Number of personnel
NUMBER OF PERSONNEL Employees 1 666 1 680 January-March 1 700 1 636 1 600 ▪ At the end of the quarter, F-Secure had 1,680 1 500 employees (1,145) 1 400 1 300 ▪ In Q3/18, the increase in personnel from the 1 201 acquisition of MWR InfoSecurity was 391 1 200 1 145 1 091 1 104 1 100 1 055 1 060 1 000 9
Source: Internet Archive copy of f-secure.com
More decks from F-Secure Oyj
 Q3 2026 Earnings Presentation23 slides · Oct 28, 2026
 Q2 2026 Earnings Presentation20 slides · Jul 17, 2026
 Investor Day (June 2026)42 slides · Jun 4, 2026
 Q1 2026 Earnings Presentation19 slides · Apr 29, 2026
 Q4 2025 Earnings Presentation29 slides · Feb 5, 2026
 Q3 2025 Earnings Presentation18 slides · Oct 28, 2025