Seche Environnement SA · EURONEXT:SCHP
Seche Environnement SA — H1 2022 Earnings Presentation
40 slides from Seche Environnement SA's earnings presentation, Sep 13, 2022
Slide 1: Half-Year Results as of June 30, 2022
Half-Year Results as of June 30, 2022 Analysts Meeting of September 13, 2022
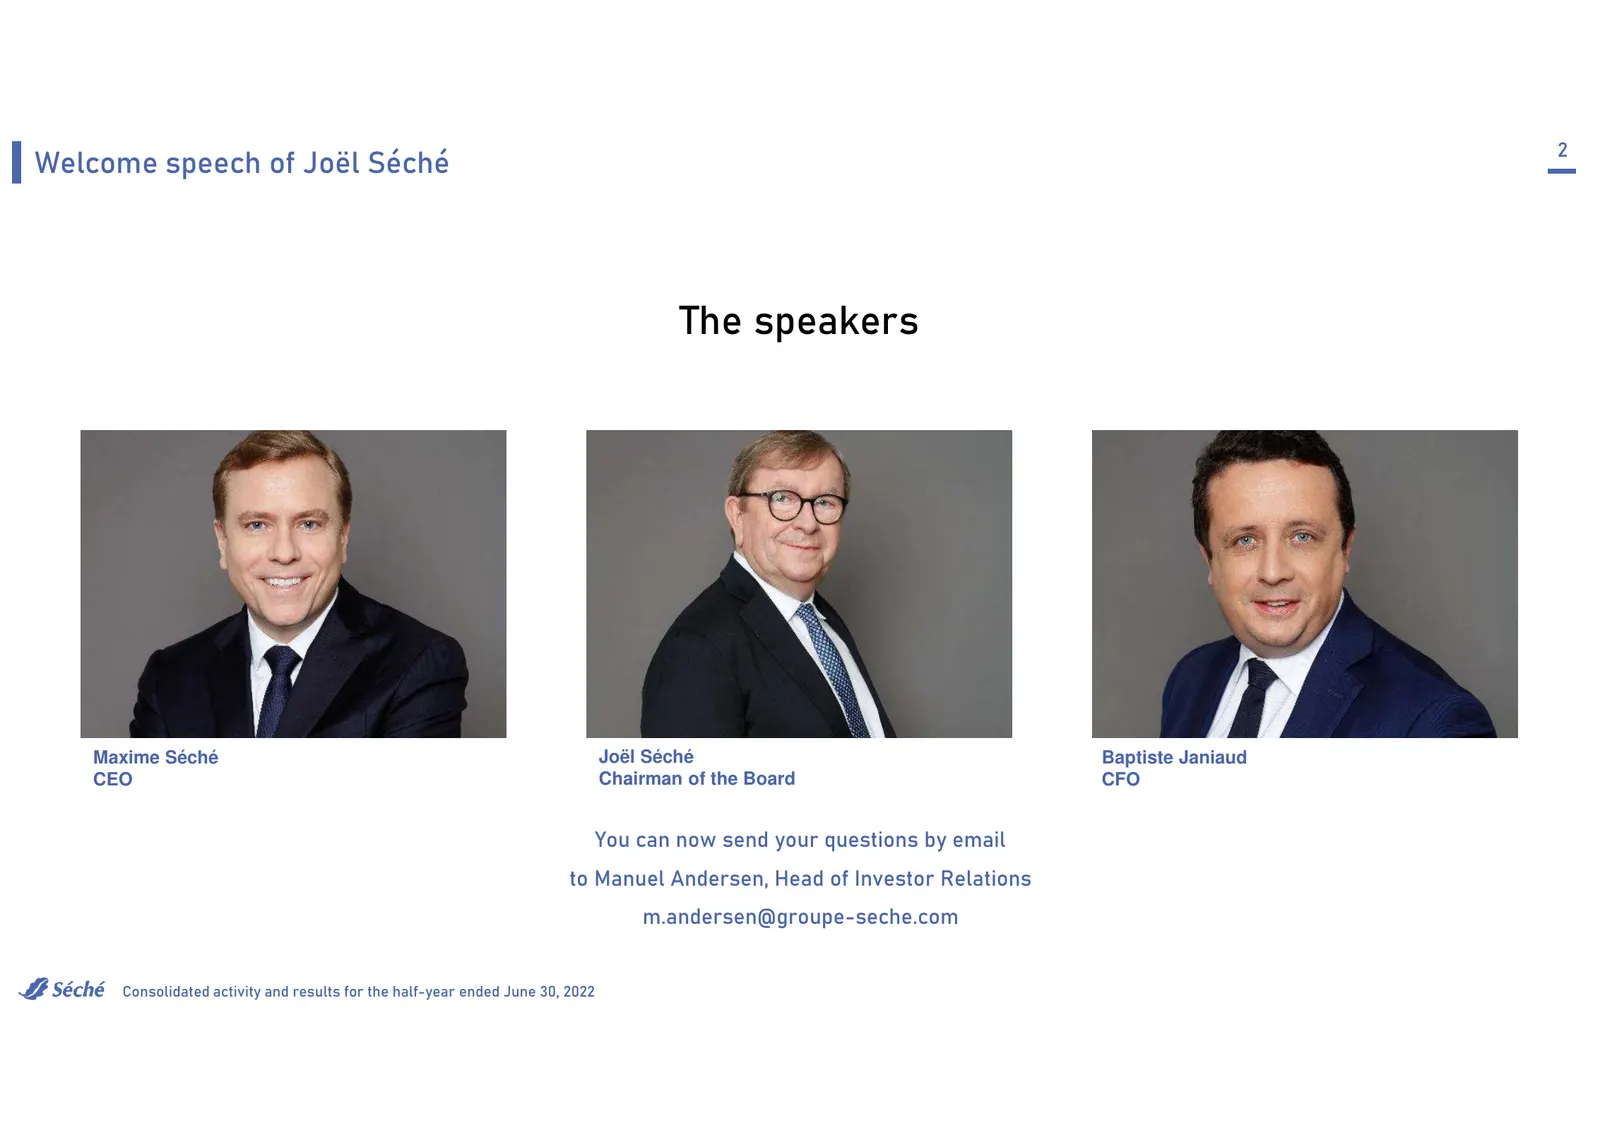
Slide 2: The speakers
2 Welcome speech of Joël Séché The speakers Maxime Séché Joël Séché Baptiste Janiaud CEO Chairman of the Board CFO You can now send your questions by email to Manuel Andersen, Head of Investor Relations m.andersen@groupe-seche.com Consolidated activity and results for the half-year ended June 30, 20
Slide 3: Excellent commercial, operational and financial performance in H1 2022
3 Excellent commercial, operational and financial performance in H1 2022 Joël Séché, Chairman of the Board of Directors Consolidated activity and results for the half-year ended June 30, 2022
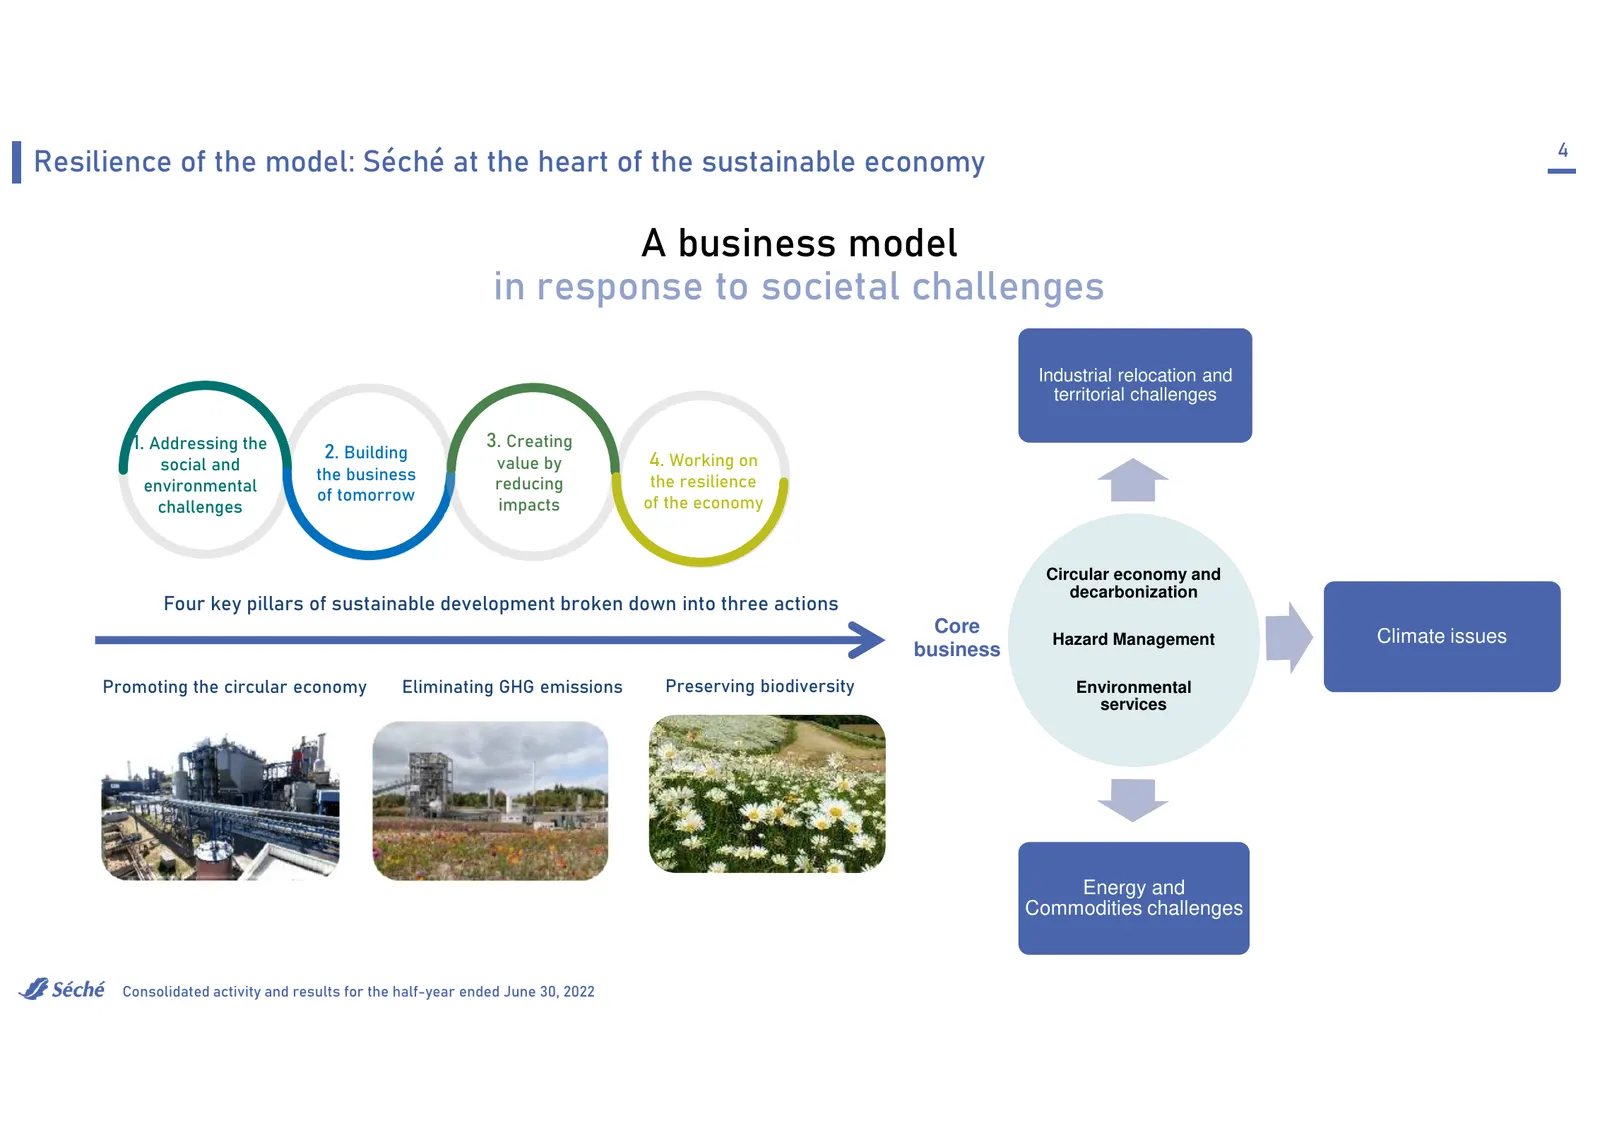
Slide 4: A business model in response to societal challenges
4 Resilience of the model: Séché at the heart of the sustainable economy A business model in response to societal challenges Industrial relocation and territorial challenges 1. Addressing the 3. Creating 2. Building value by 4. Working on social and the business the resilience environmental reducing
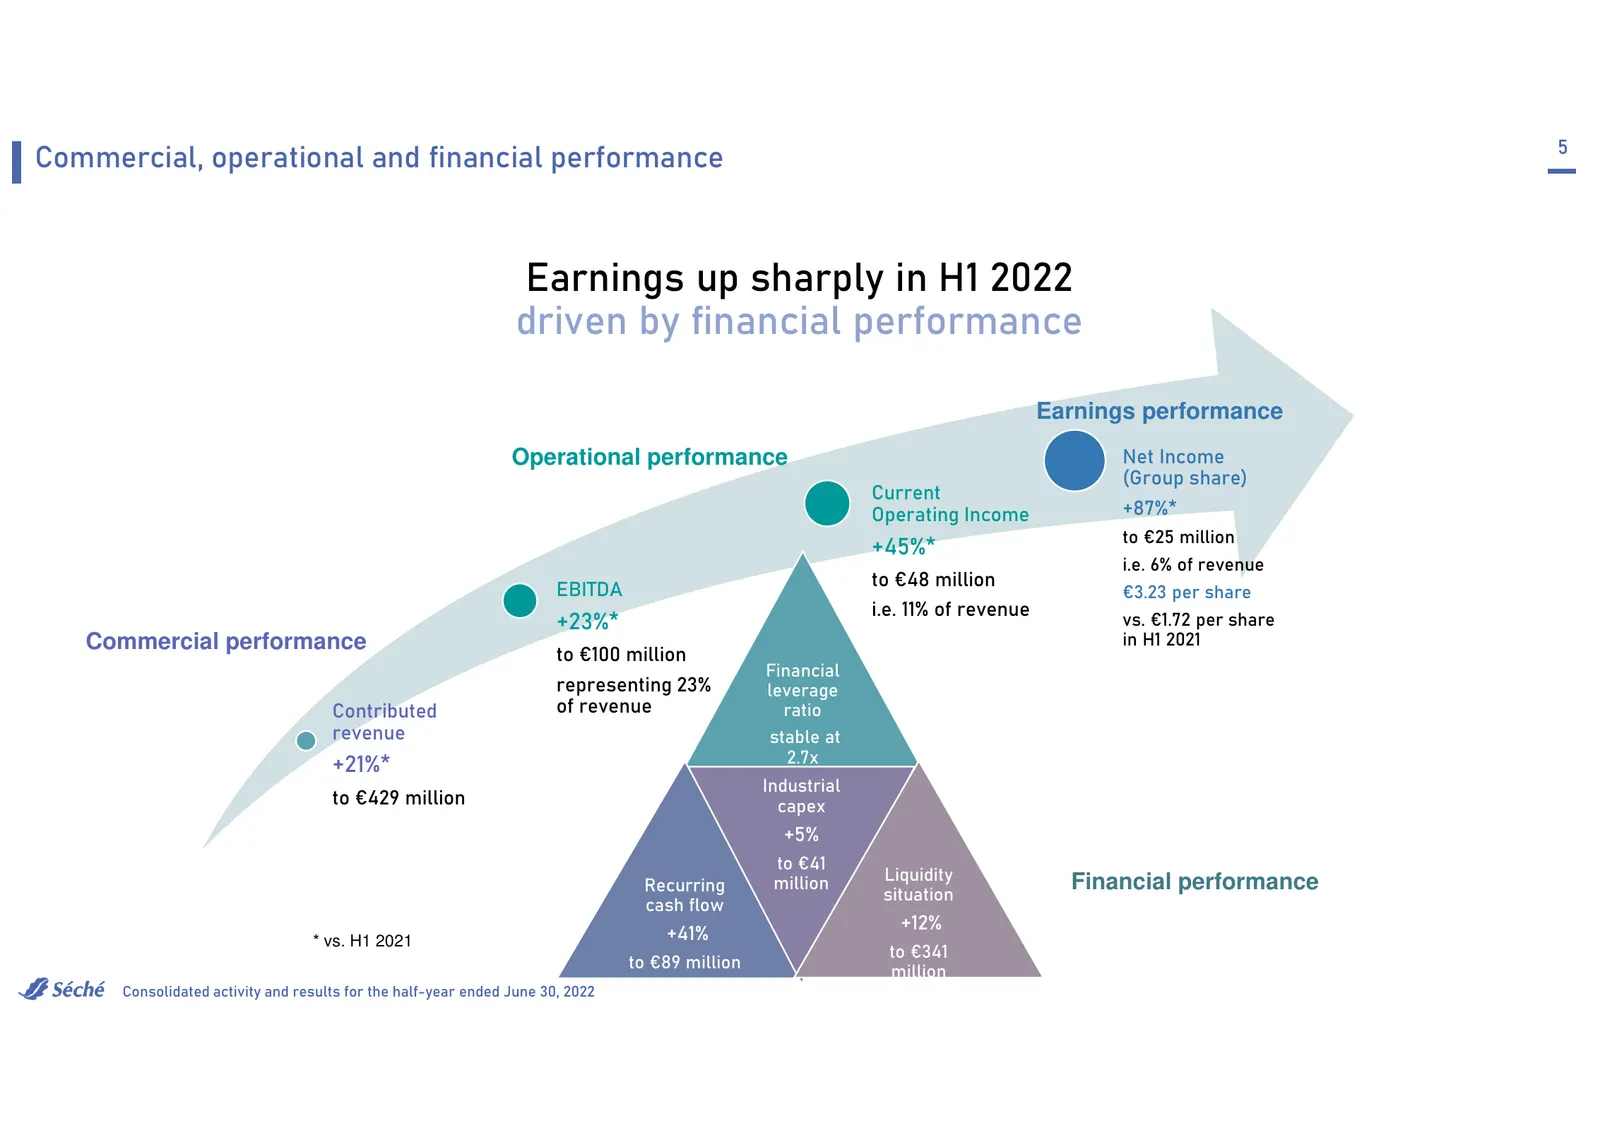
Slide 5: Earnings up sharply in H1 2022 driven by financial performance
5 Commercial, operational and financial performance Earnings up sharply in H1 2022 driven by financial performance Earnings performance Operational performance Net Income (Group share) Current Operating Income +87%* to €25 million +45%* i.e. 6% of revenue to €48 million EBITDA €3.23 per share i.e. 1
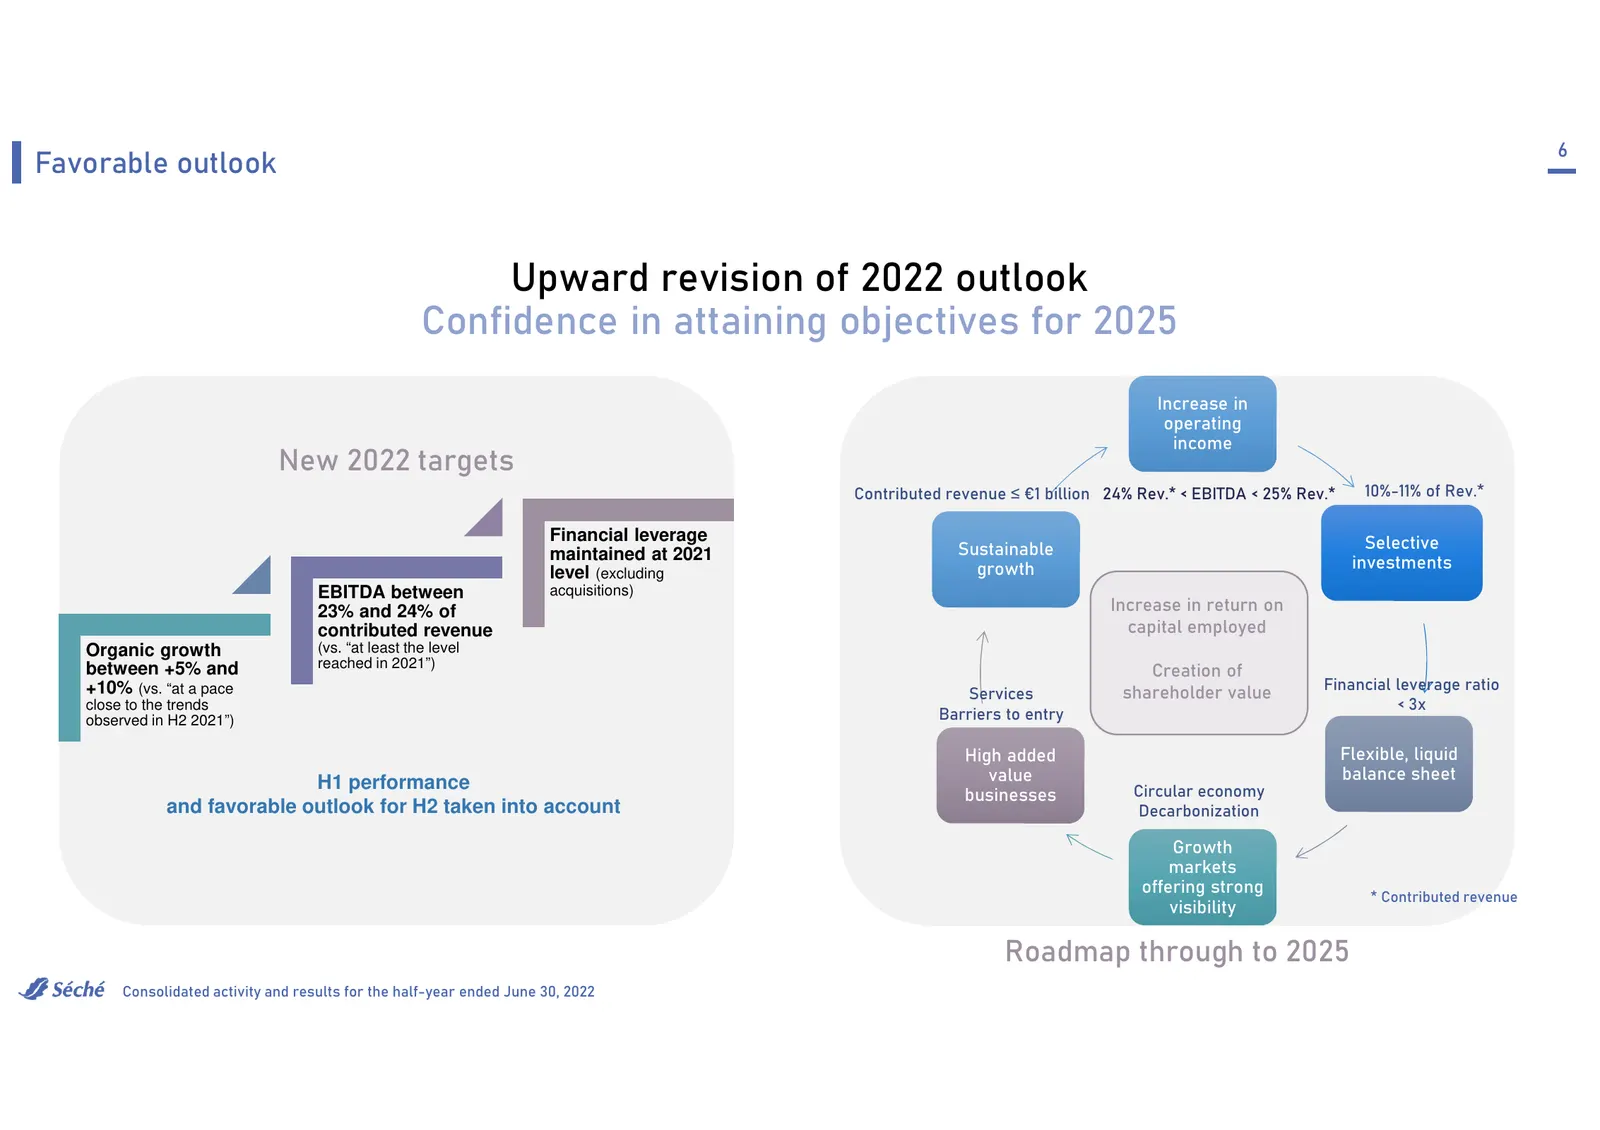
Slide 6: Upward revision of 2022 outlook; confidence in 2025 objectives
6 Favorable outlook Upward revision of 2022 outlook Confidence in attaining objectives for 2025 Increase in operating income New 2022 targets Contributed revenue ≤ €1 billion 24% Rev.* < EBITDA < 25% Rev.* 10%-11% of Rev.* Financial leverage Selective maintained at 2021 Sustainable growth investment
Slide 7: Growth strategy validated in H1 2022
7 Growth strategy validated in H1 2022 Maxime Séché, Chief Executive Officer Consolidated activity and results for the half-year ended June 30, 2022
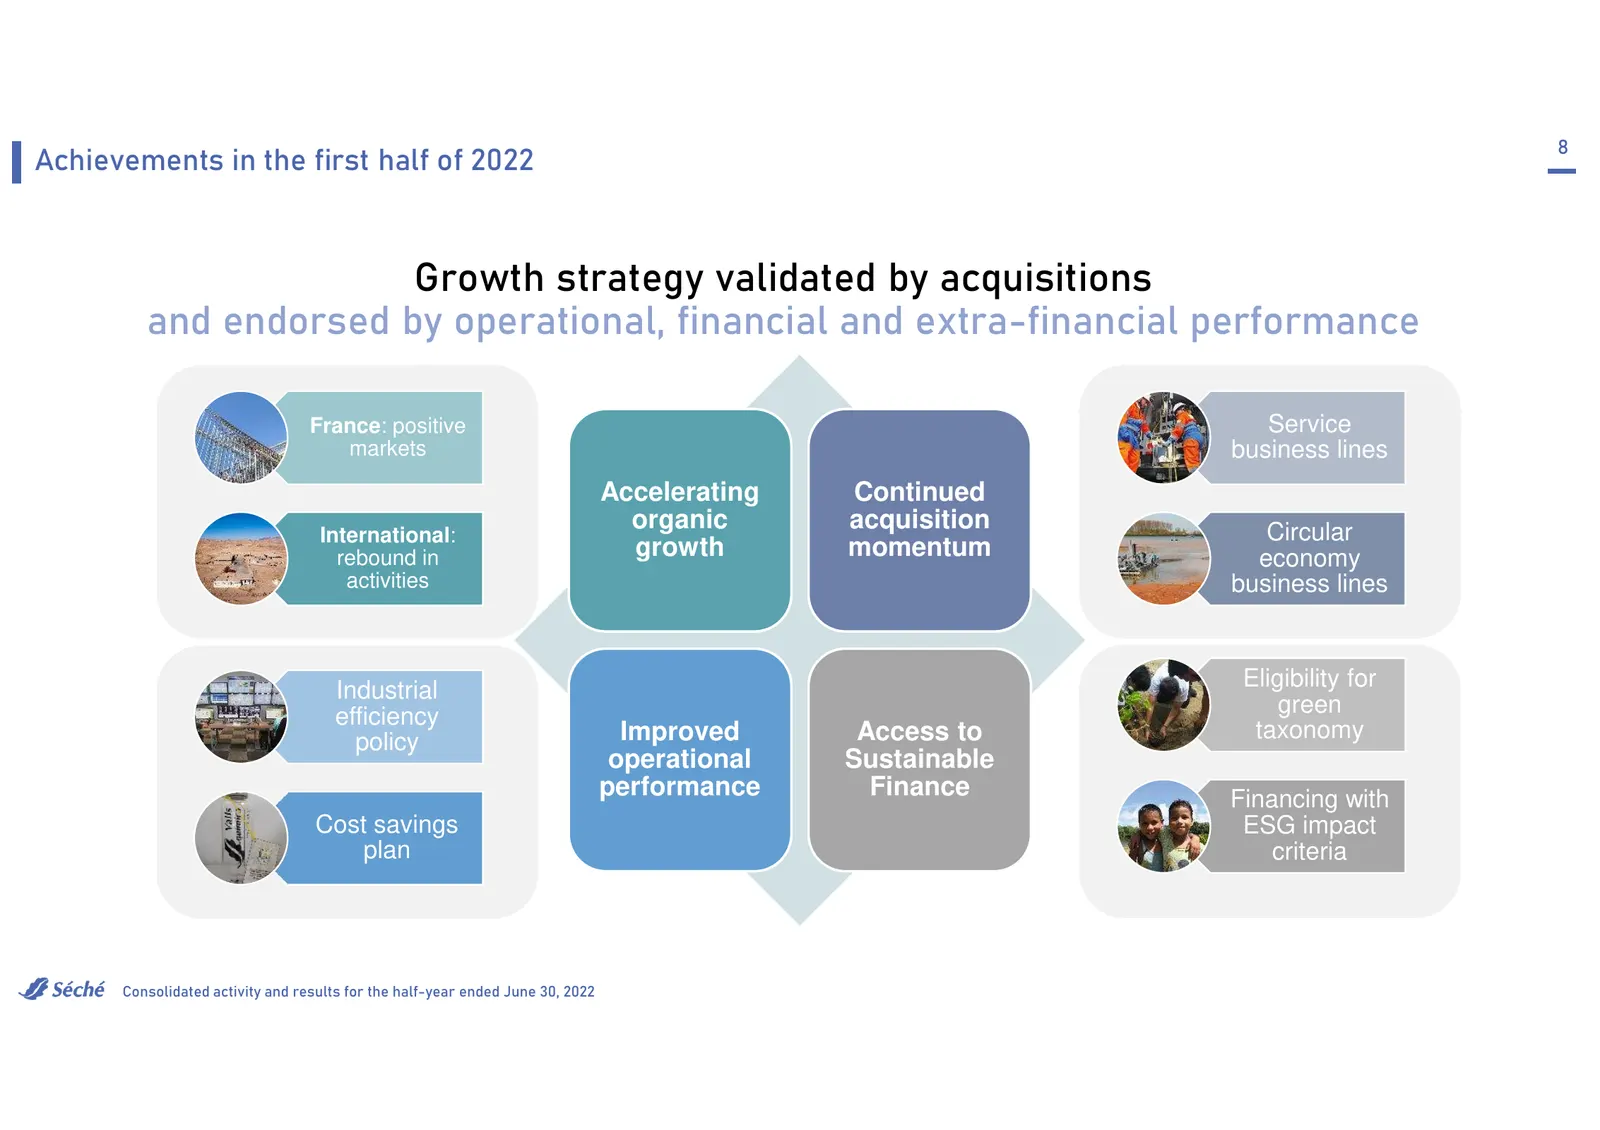
Slide 8: Growth strategy validated by acquisitions and performance
8 Achievements in the first half of 2022 Growth strategy validated by acquisitions and endorsed by operational, financial and extra-financial performance France: positive Service markets business lines Accelerating Continued organic acquisition Circular International: rebound in growth momentum econ
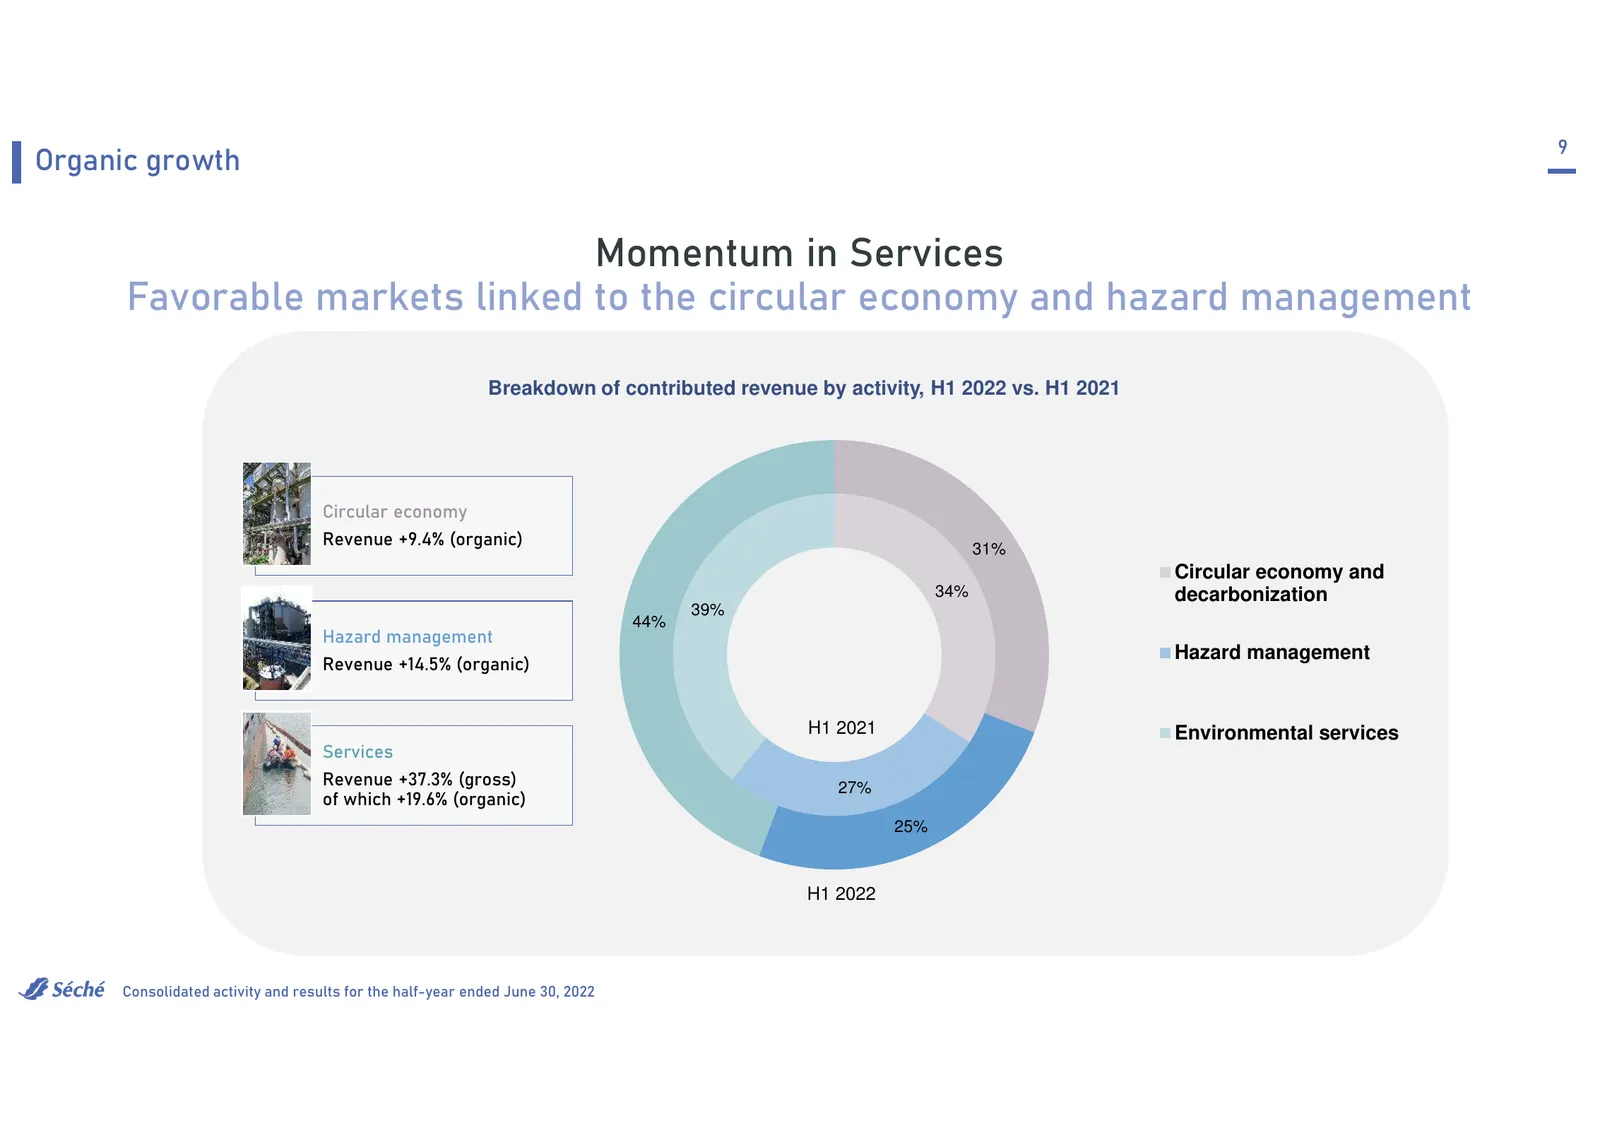
Slide 9: Momentum in Services
9 Organic growth Momentum in Services Favorable markets linked to the circular economy and hazard management Breakdown of contributed revenue by activity, H1 2022 vs. H1 2021 Circular economy Revenue +9.4% (organic) 31% Circular economy and 34% decarbonization 39% 44% Hazard management Hazard manage
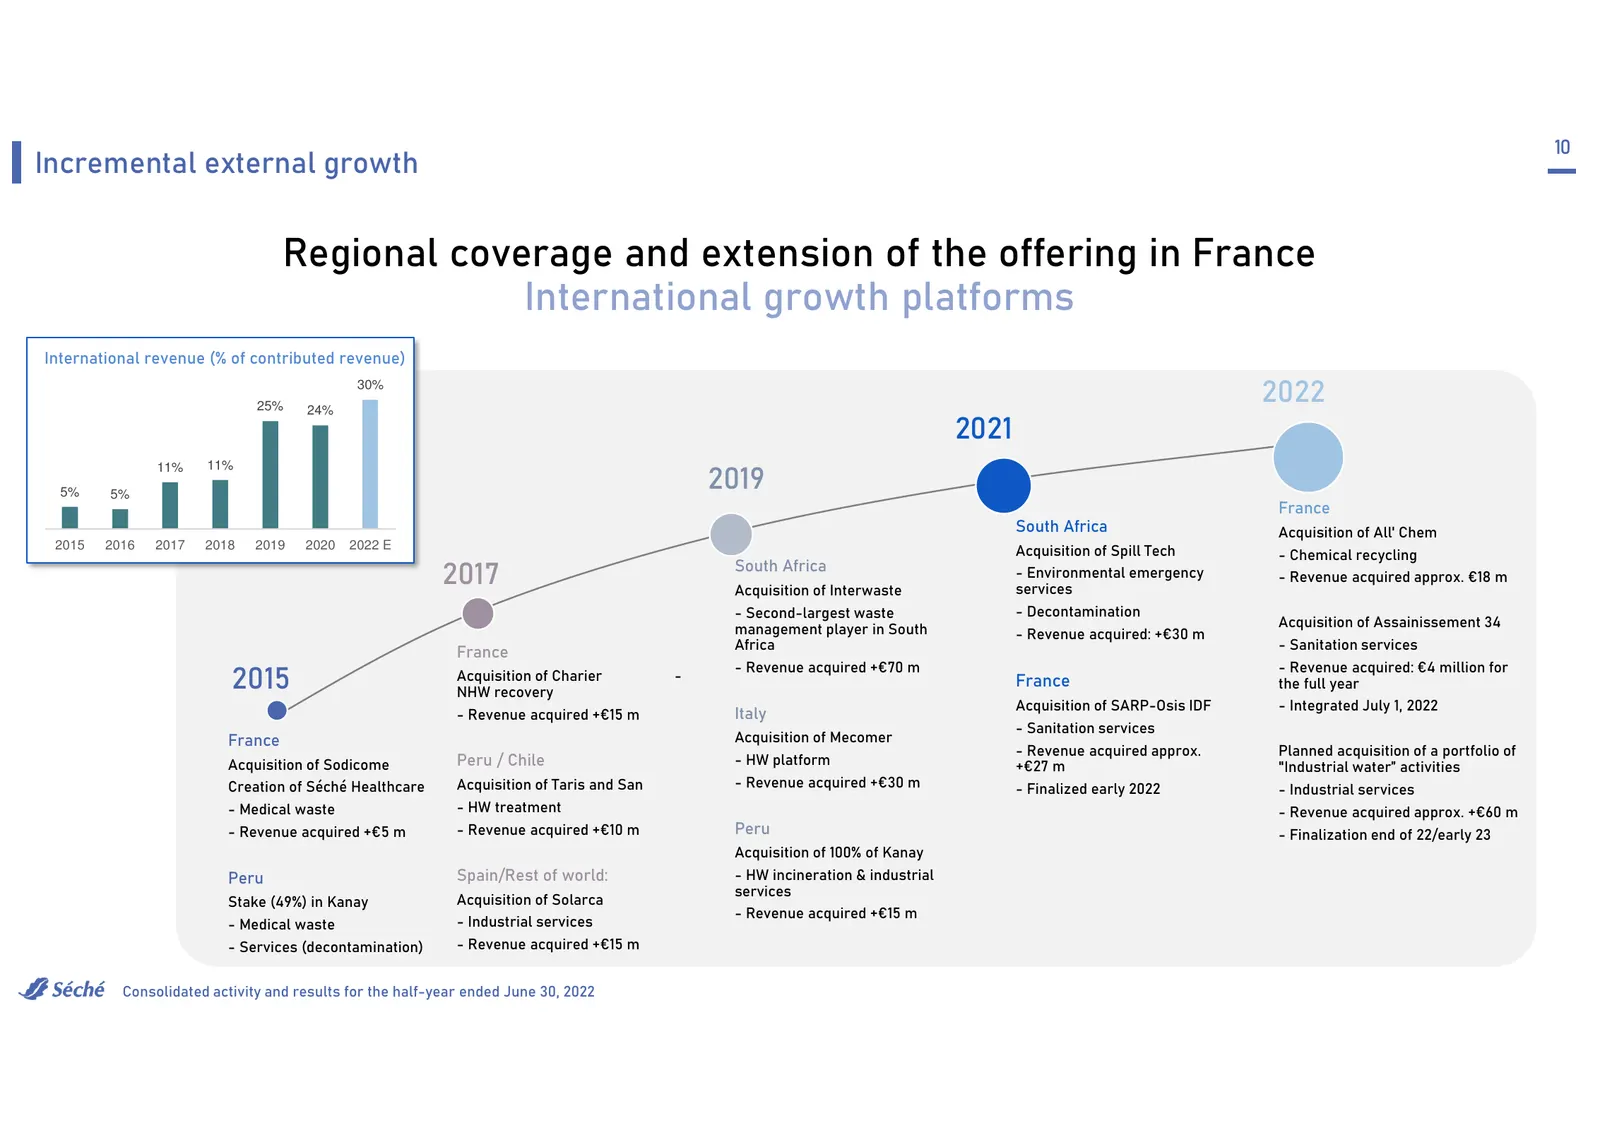
Slide 10: Regional coverage and extension of the offering in France; International growth platforms
10 Incremental external growth Regional coverage and extension of the offering in France International growth platforms International revenue (% of contributed revenue) 25% 24% 30% 2022 2021 11% 11% 5% 5% 2019 France South Africa Acquisition of All' Chem 2015 2016 2017 2018 2019 2020 2022 E Acquisit
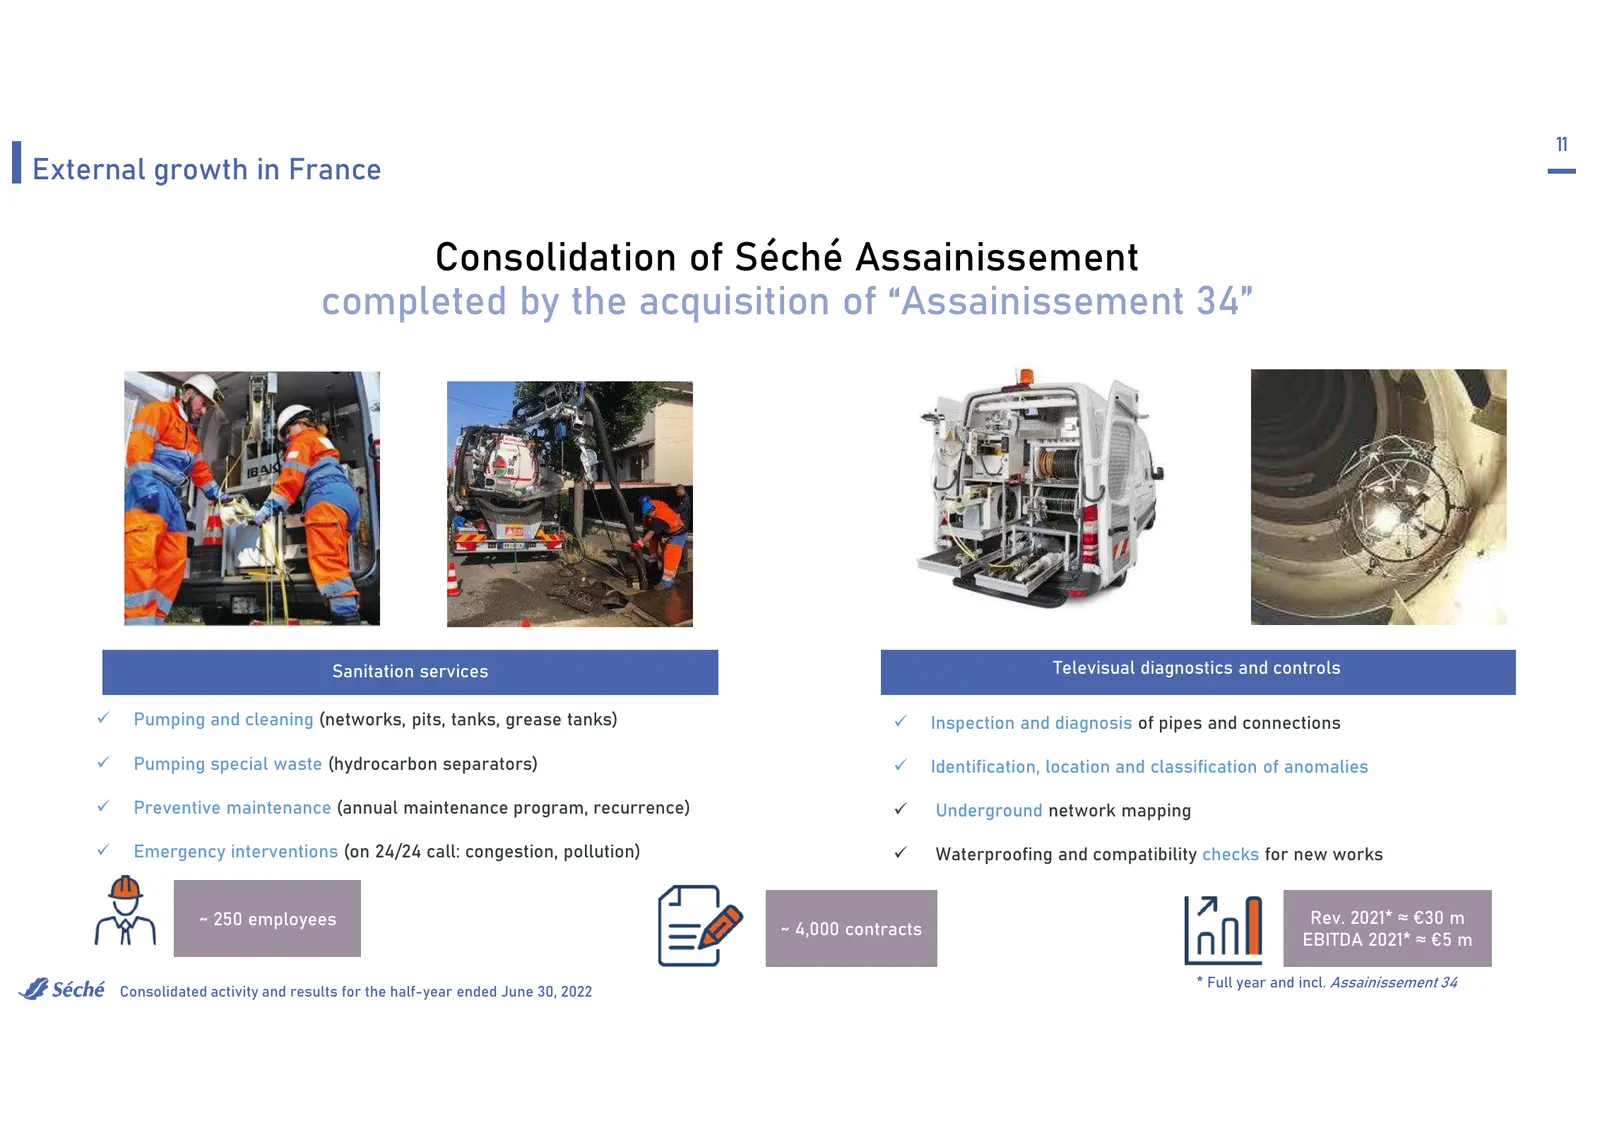
Slide 11: Consolidation of Séché Assainissement with Assainissement 34
11 External growth in France Consolidation of Séché Assainissement completed by the acquisition of “Assainissement 34” Sanitation services Televisual diagnostics and controls Pumping and cleaning (networks, pits, tanks, grease tanks) Inspection and diagnosis of pipes and connections Pumping sp
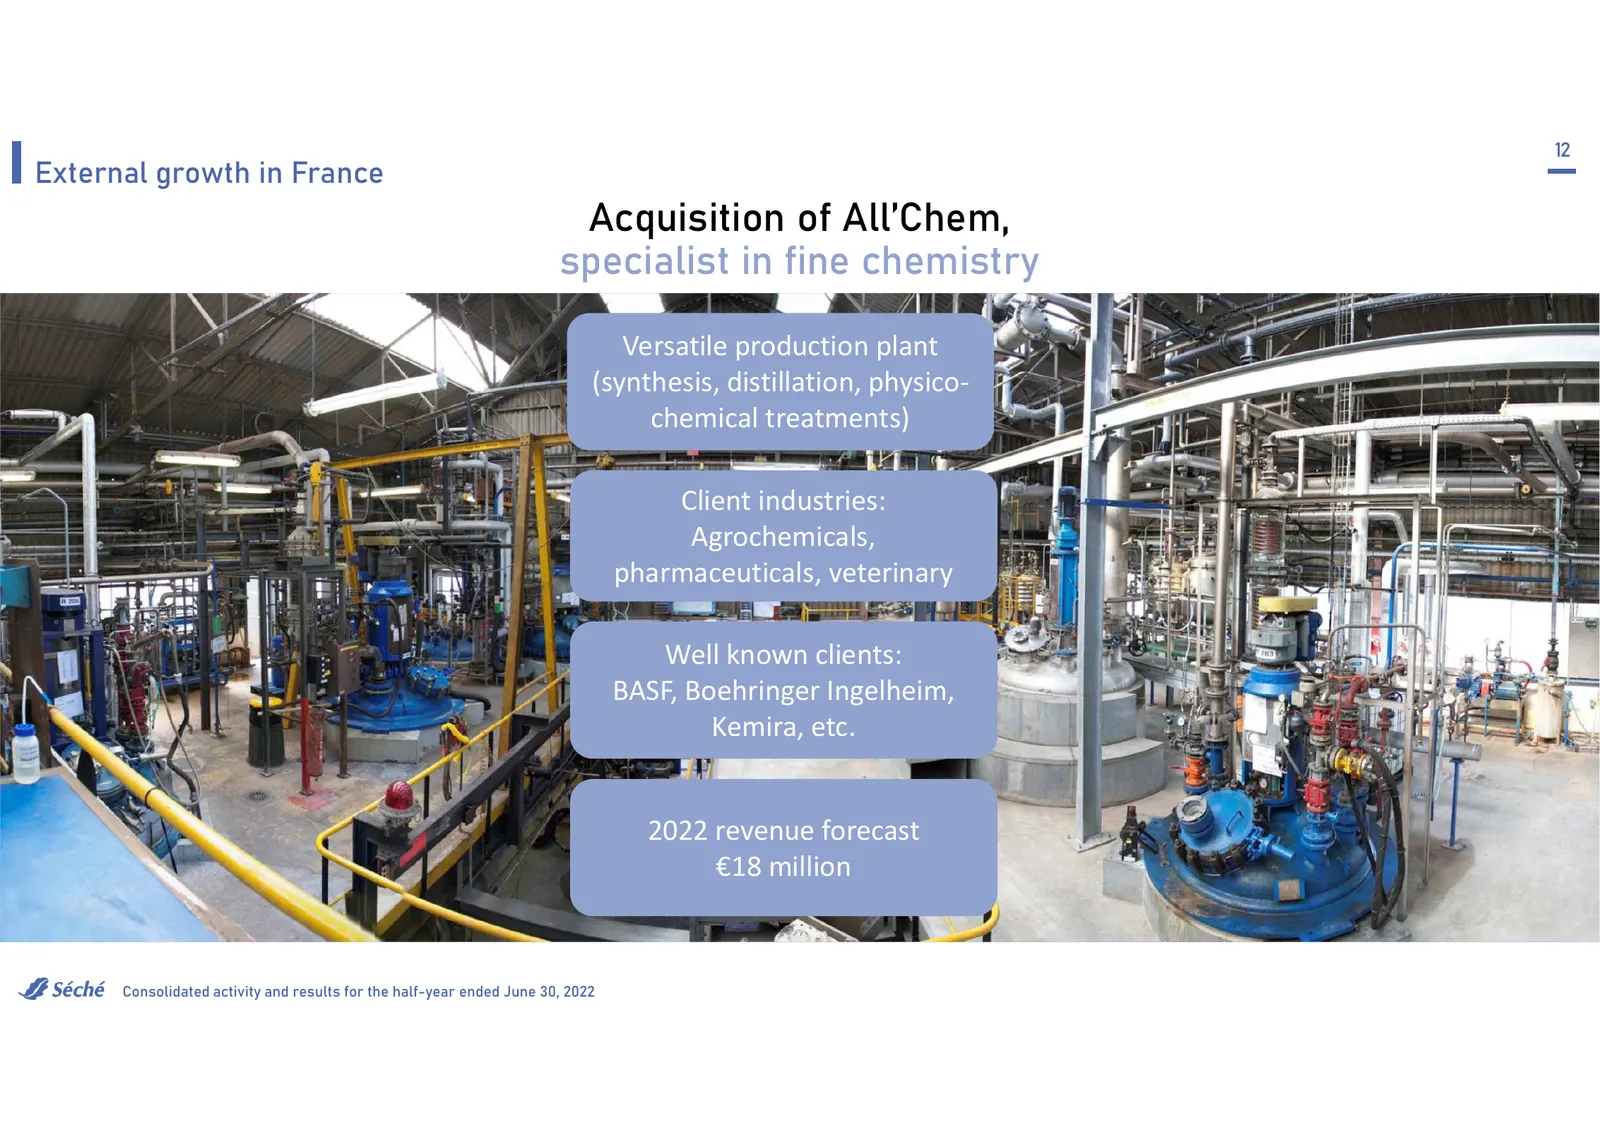
Slide 12: Acquisition of All'Chem, specialist in fine chemistry
12 External growth in France Acquisition of All’Chem, specialist in fine chemistry Versatile production plant (synthesis, distillation, physico- chemical treatments) Client industries: Agrochemicals, pharmaceuticals, veterinary Well known clients: BASF, Boehringer Ingelheim, Kemira, etc. 2022 revenu
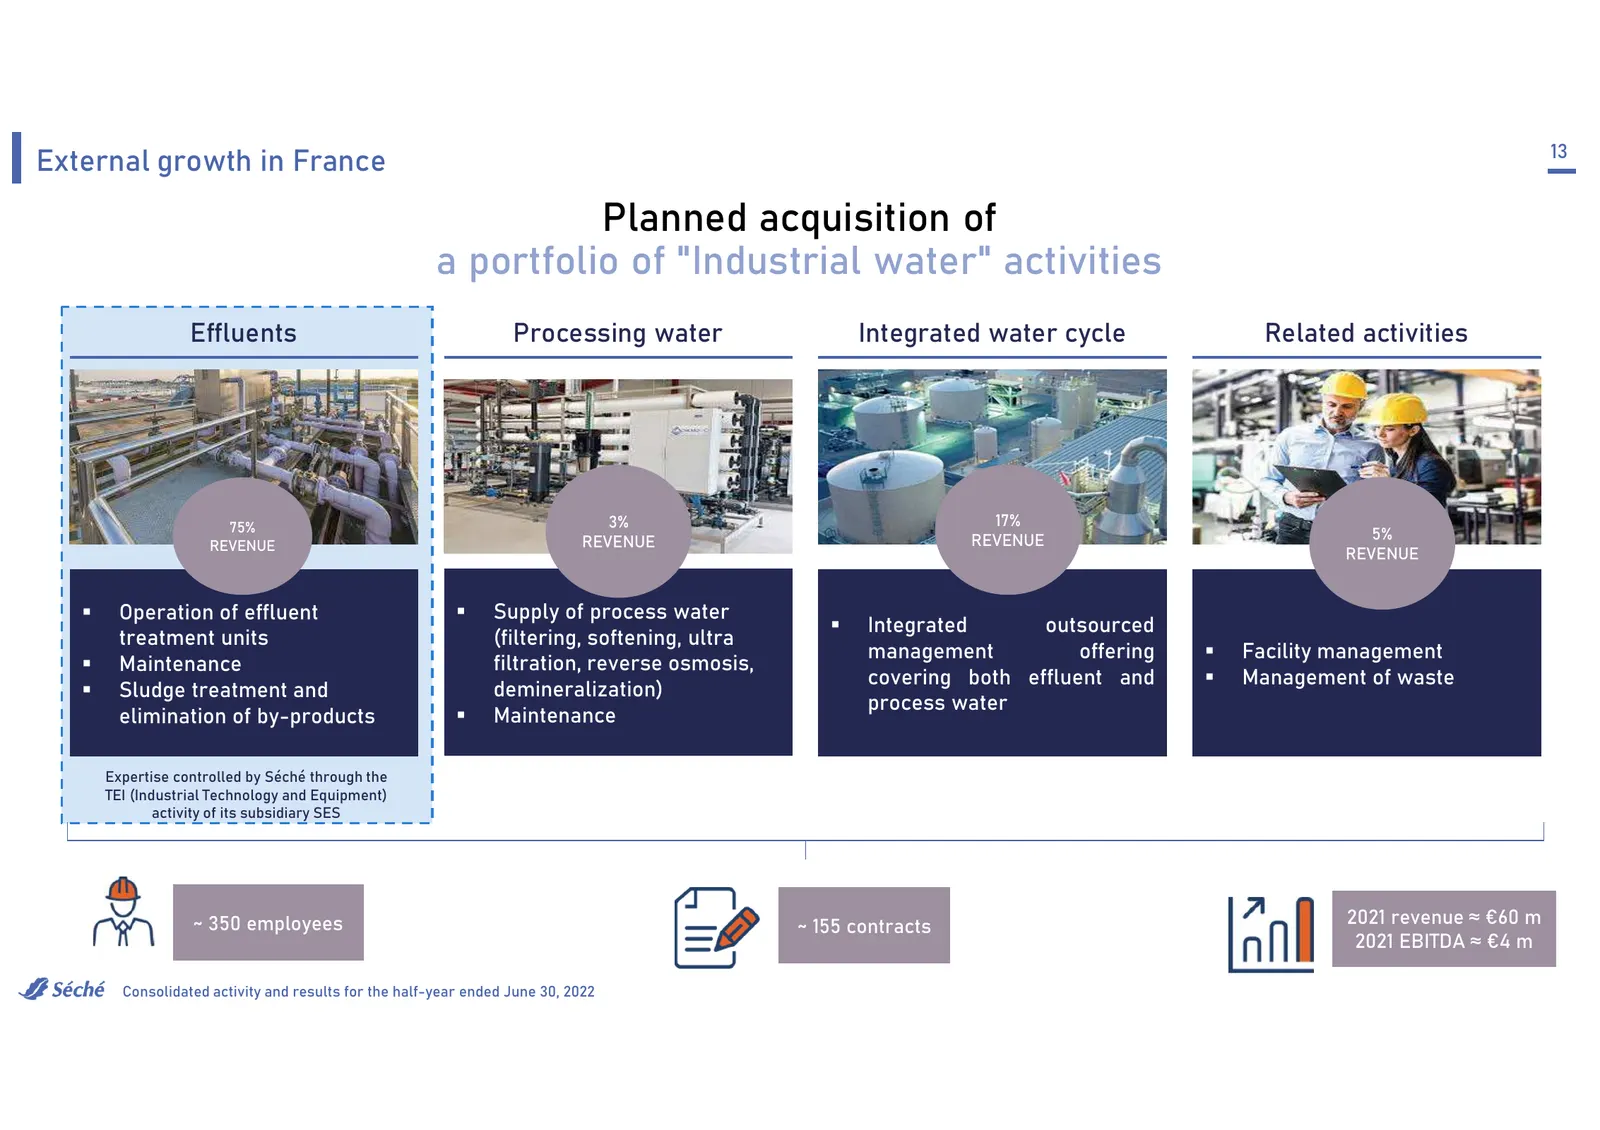
Slide 13: Planned acquisition of Industrial water activities
13 External growth in France Planned acquisition of a portfolio of "Industrial water" activities Effluents Processing water Integrated water cycle Related activities 75% 3% 17% REVENUE REVENUE 5% REVENUE REVENUE Operation of effluent Supply of process water Integrated outsourced treatment unit
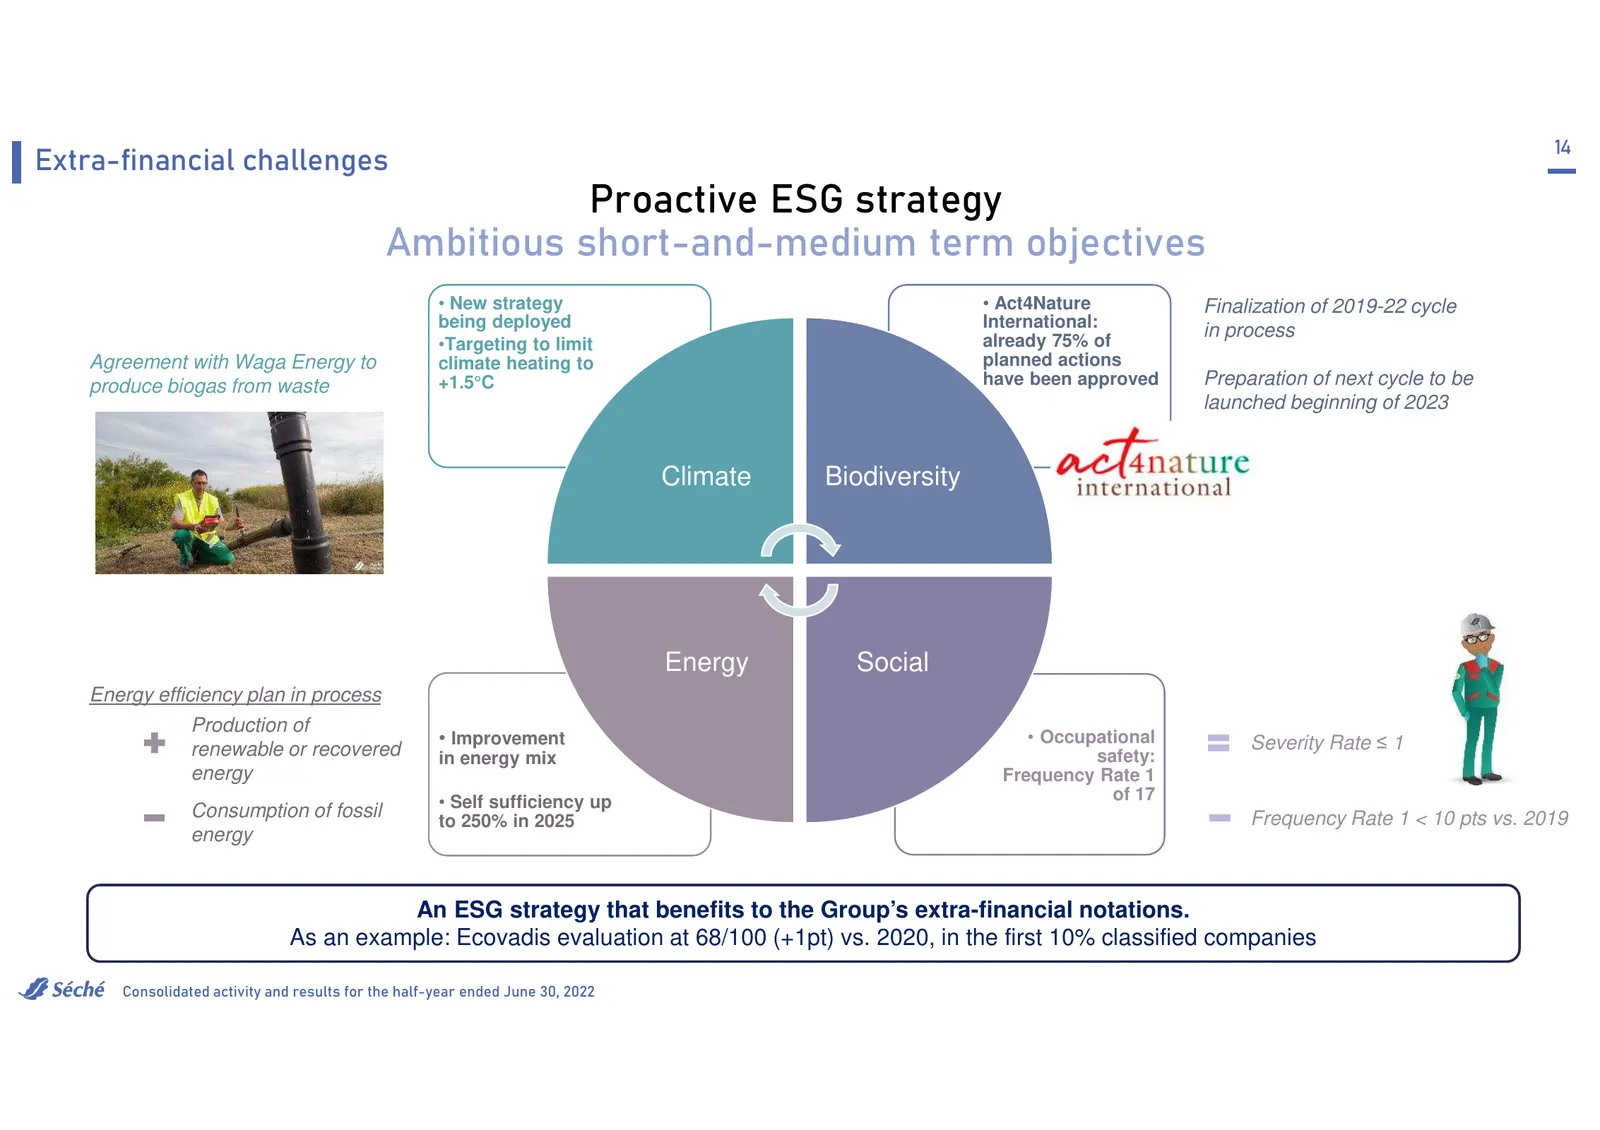
Slide 14: Proactive ESG strategy
14 Extra-financial challenges Proactive ESG strategy Ambitious short-and-medium term objectives • New strategy • Act4Nature Finalization of 2019-22 cycle being deployed International: in process •Targeting to limit already 75% of Agreement with Waga Energy to climate heating to planned actions produ
Slide 15: Consolidated financial statements at June 30, 2022
15 Consolidated financial statements at June 30, 2022 Baptiste Janiaud, Chief Financial Officer Consolidated activity and results for the half-year ended June 30, 2022
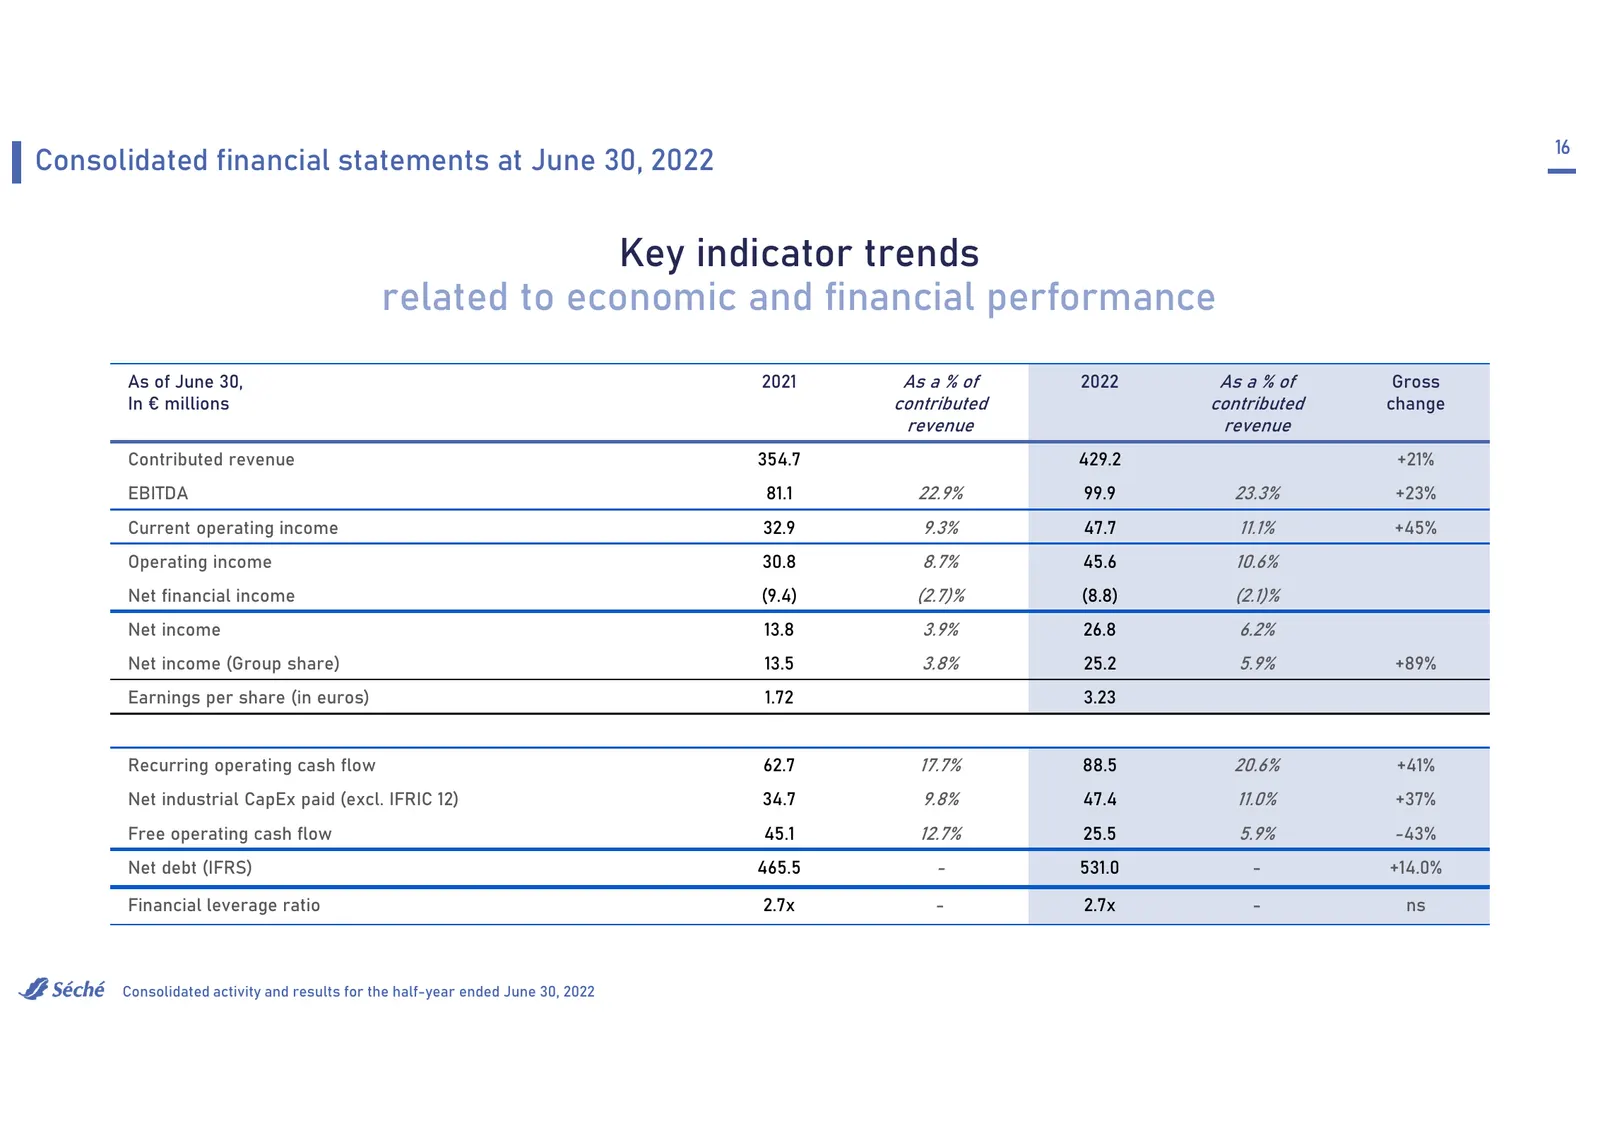
Slide 16: Key indicator trends related to economic and financial performance
16 Consolidated financial statements at June 30, 2022 Key indicator trends related to economic and financial performance As of June 30, 2021 As a % of 2022 As a % of Gross In € millions contributed contributed change revenue revenue Contributed revenue 354.7 429.2 +21% EBITDA 81.1 22.9% 99.9 23.3% +
Slide 17: Sharp increase in contributed revenue: +21%
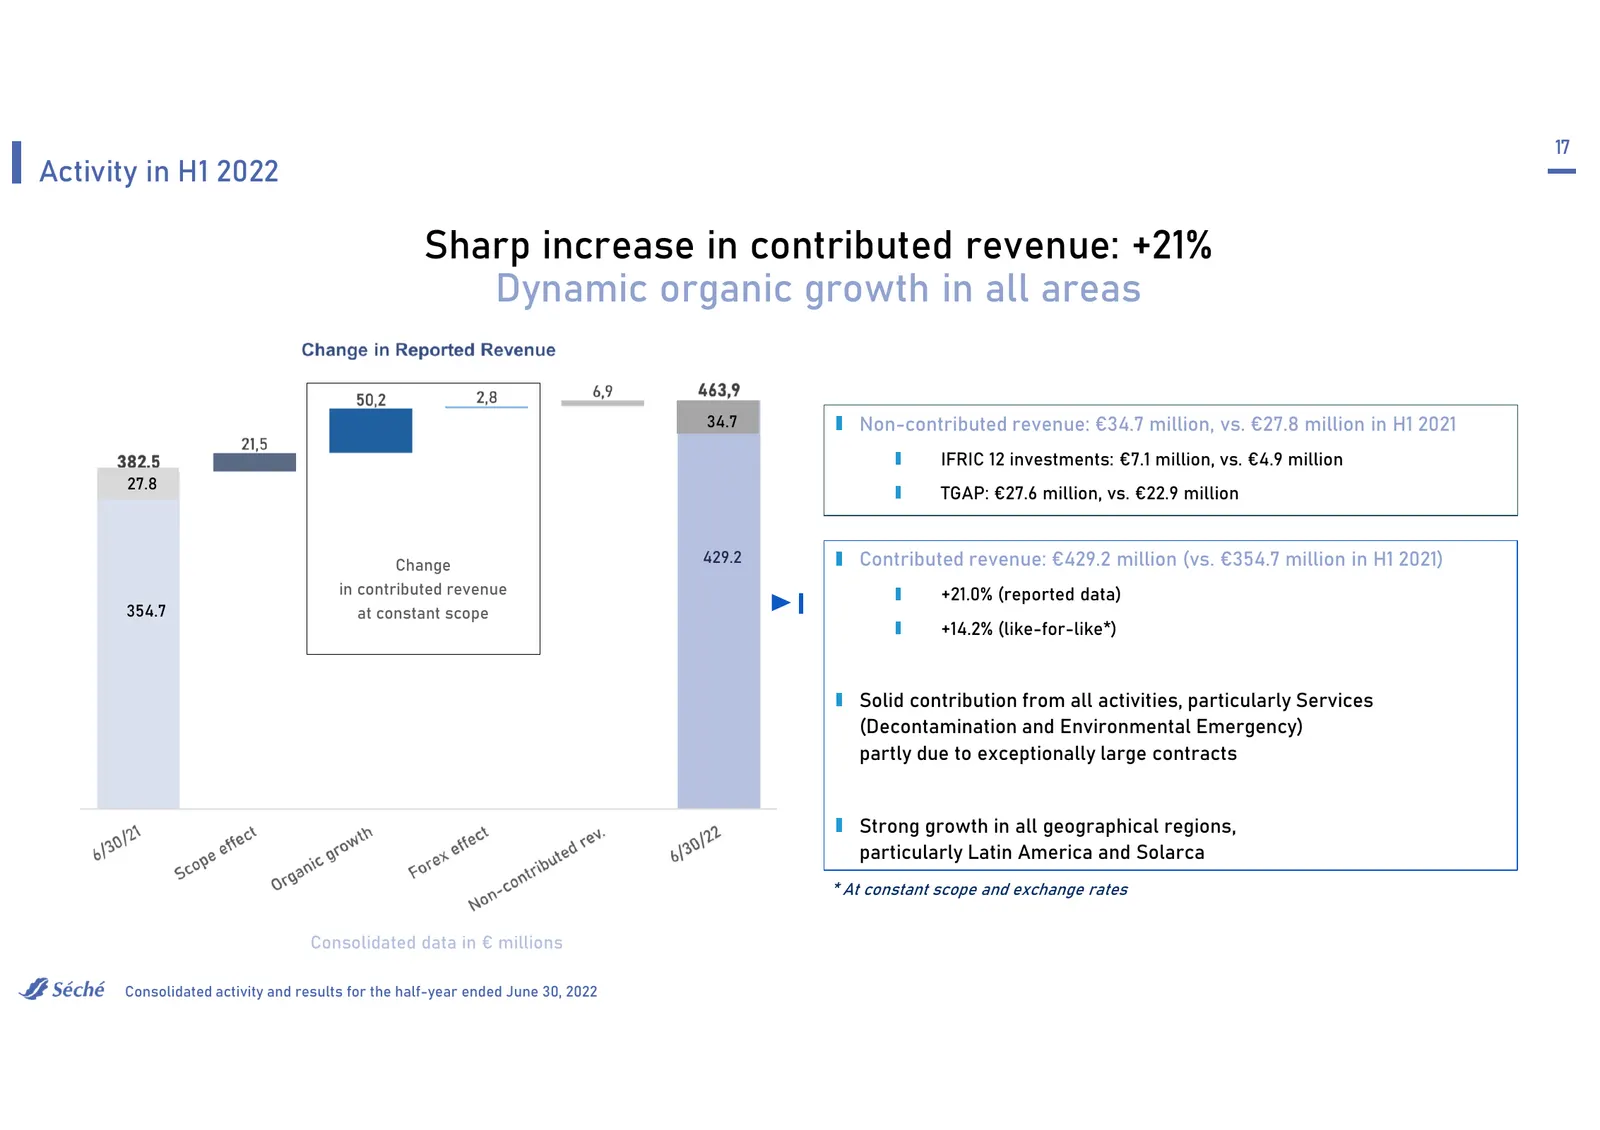
17 Activity in H1 2022 Sharp increase in contributed revenue: +21% Dynamic organic growth in all areas 34.7 Non-contributed revenue: €34.7 million, vs. €27.8 million in H1 2021 IFRIC 12 investments: €7.1 million, vs. €4.9 million 27.8 TGAP: €27.6 million, vs. €22.9 million Change 429.2 Contributed r
Slide 18: Solid level of activity confirmed
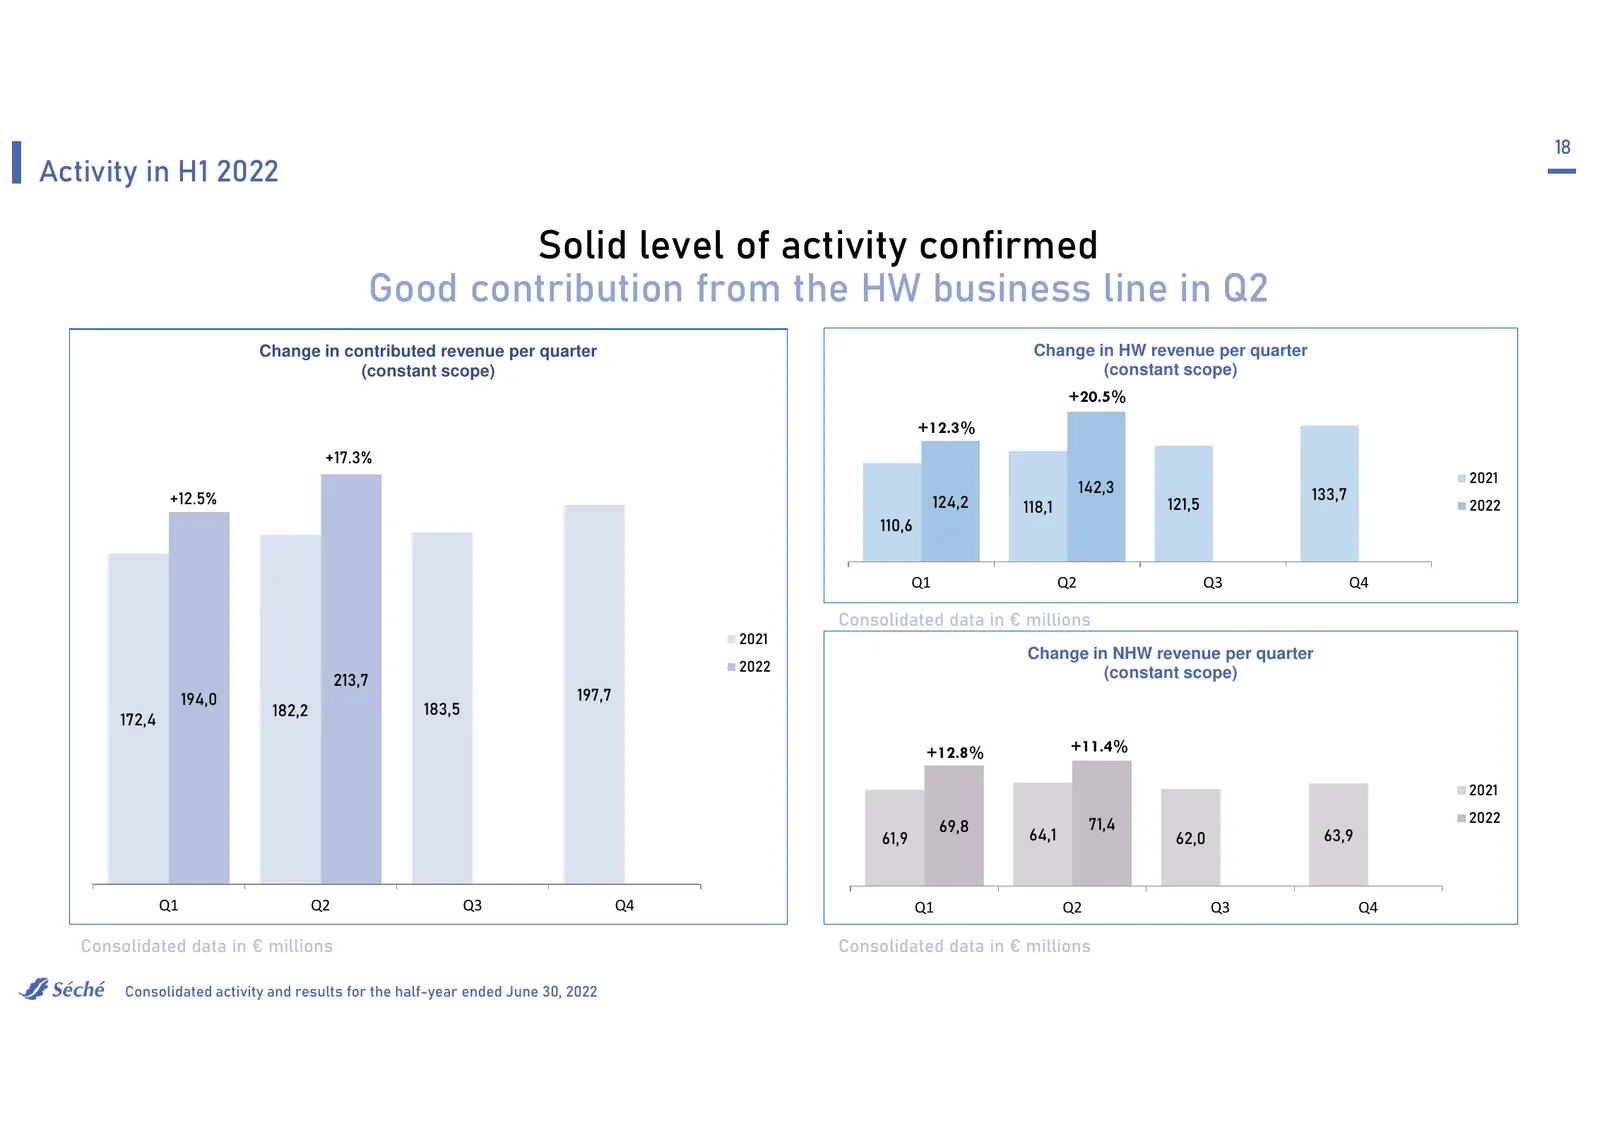
18 Activity in H1 2022 Solid level of activity confirmed Good contribution from the HW business line in Q2 Change in contributed revenue per quarter Change in HW revenue per quarter (constant scope) (constant scope) +20.5% +12.3% +17.3% 2021 142,3 133,7 +12.5% 124,2 121,5 2022 118,1 110,6 Q1 Q2 Q3 Q
Slide 19: Good contribution from all geographical scopes
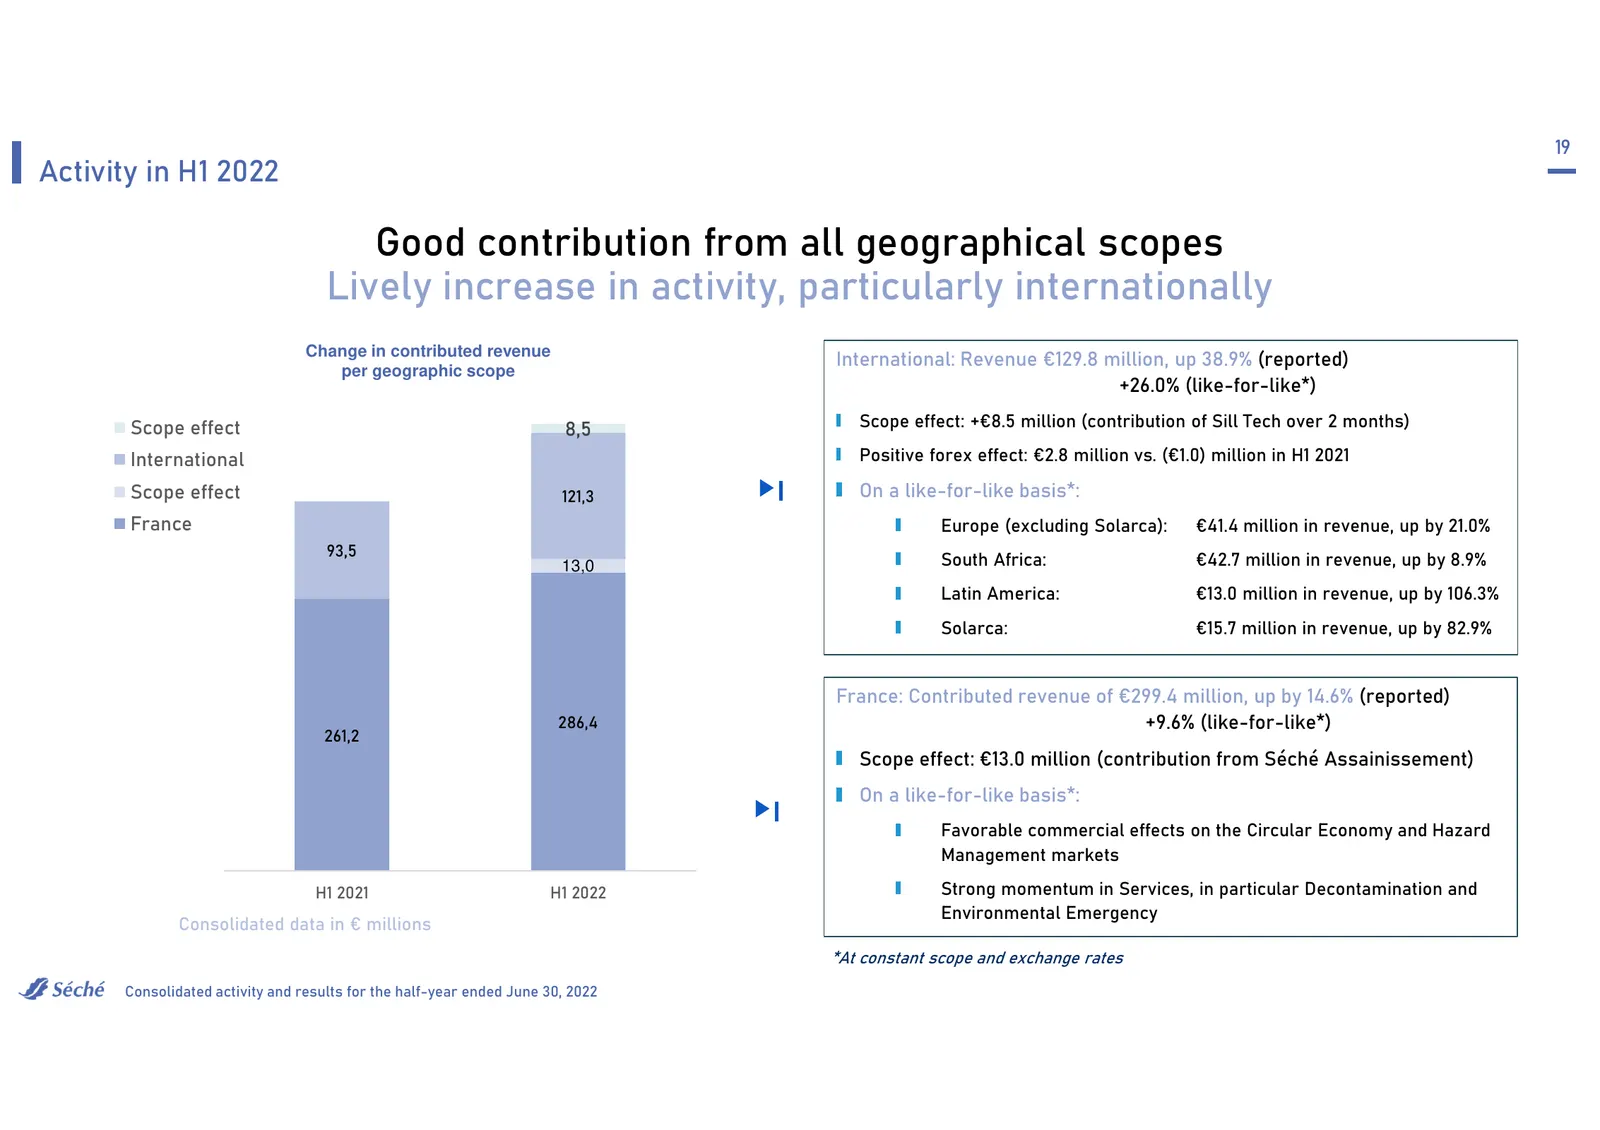
19 Activity in H1 2022 Good contribution from all geographical scopes Lively increase in activity, particularly internationally Change in contributed revenue International: Revenue €129.8 million, up 38.9% (reported) per geographic scope +26.0% (like-for-like*) Scope effect 8,5 Scope effect: +€8.5 m
Slide 20: Development of the business mix
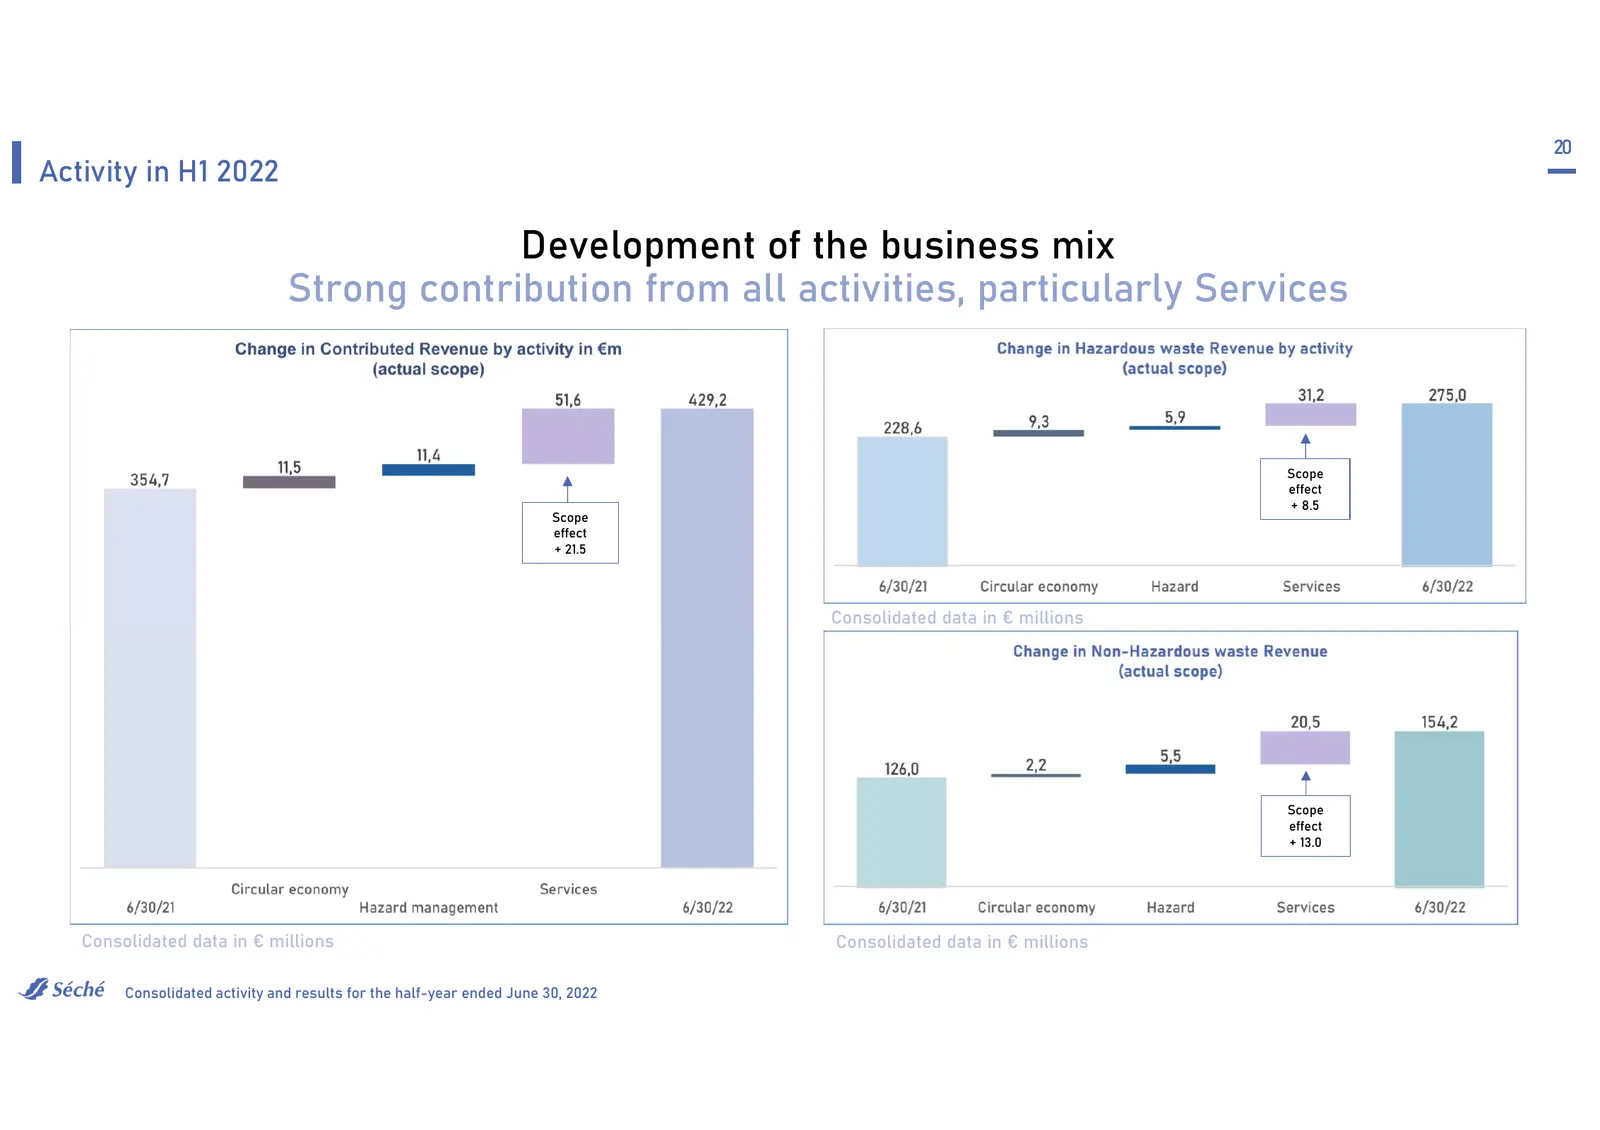
20 Activity in H1 2022 Development of the business mix Strong contribution from all activities, particularly Services Scope effect + 8.5 Scope effect + 21.5 Consolidated data in € millions Scope effect + 13.0 Consolidated data in € millions Consolidated data in € millions Consolidated activity and r
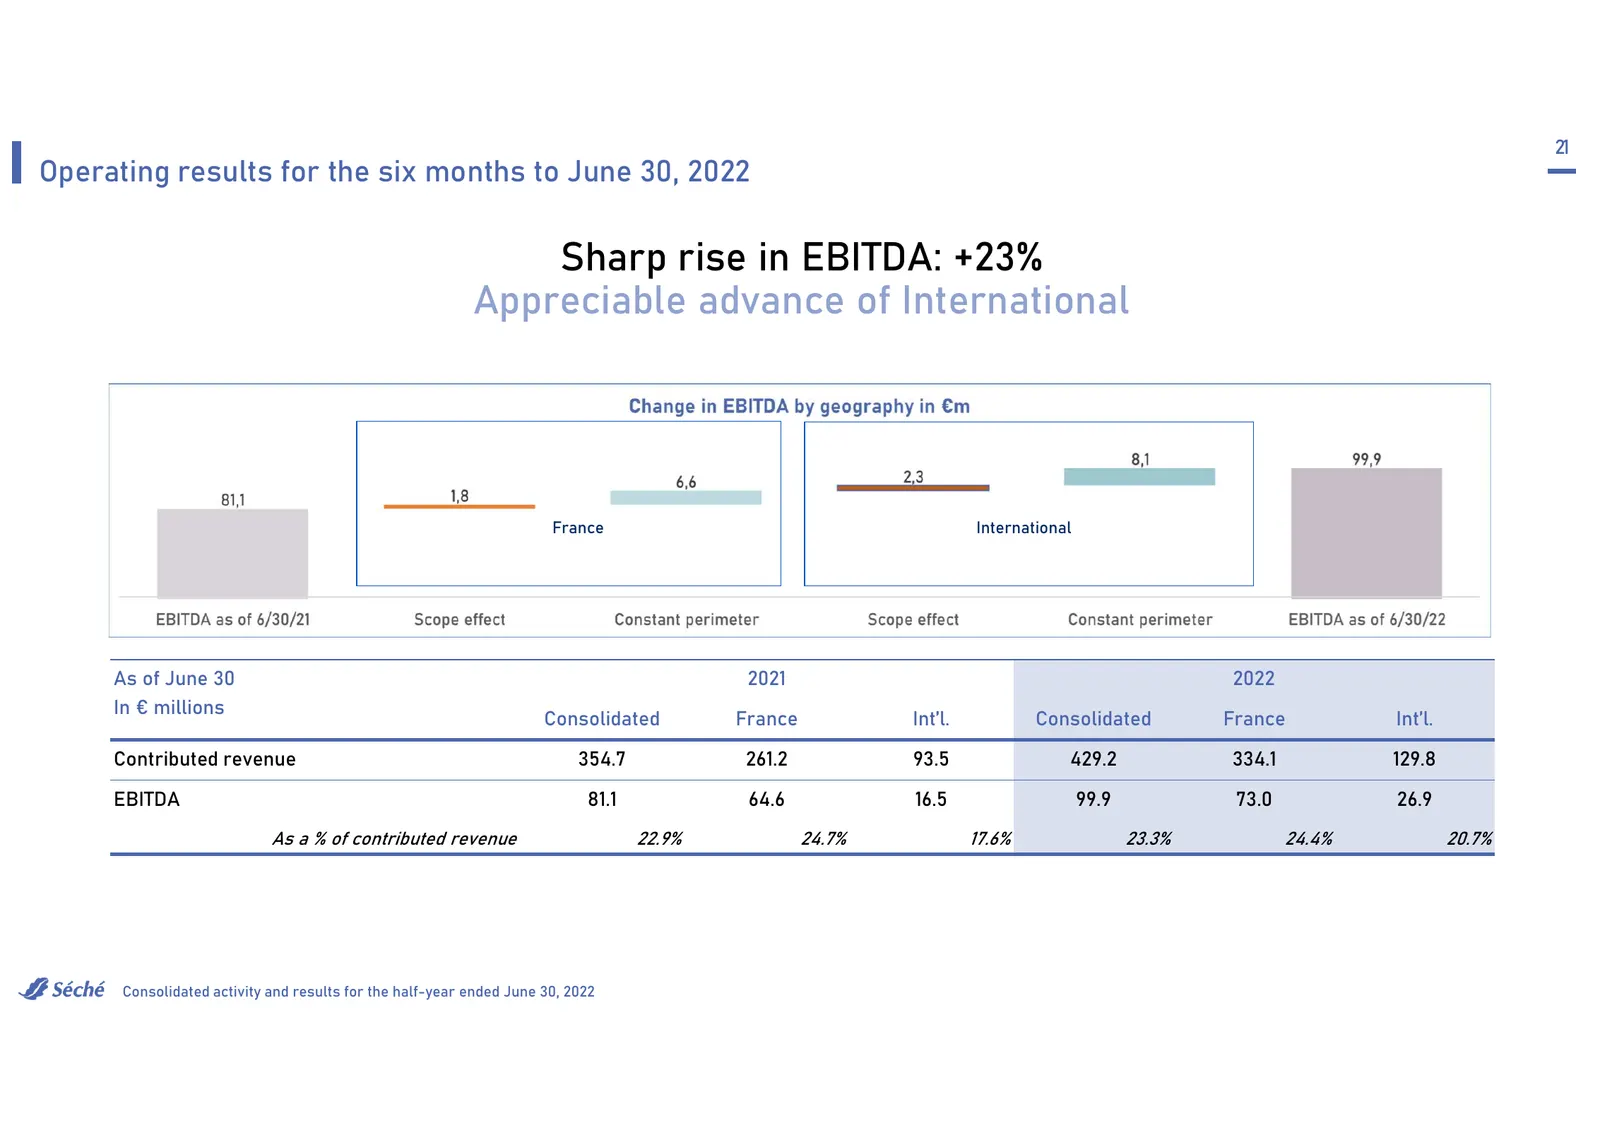
Slide 21: Sharp rise in EBITDA: +23%
21 Operating results for the six months to June 30, 2022 Sharp rise in EBITDA: +23% Appreciable advance of International France International As of June 30 2021 2022 In € millions Consolidated France Int’l. Consolidated France Int’l. Contributed revenue 354.7 261.2 93.5 429.2 334.1 129.8 EBITDA 81.1
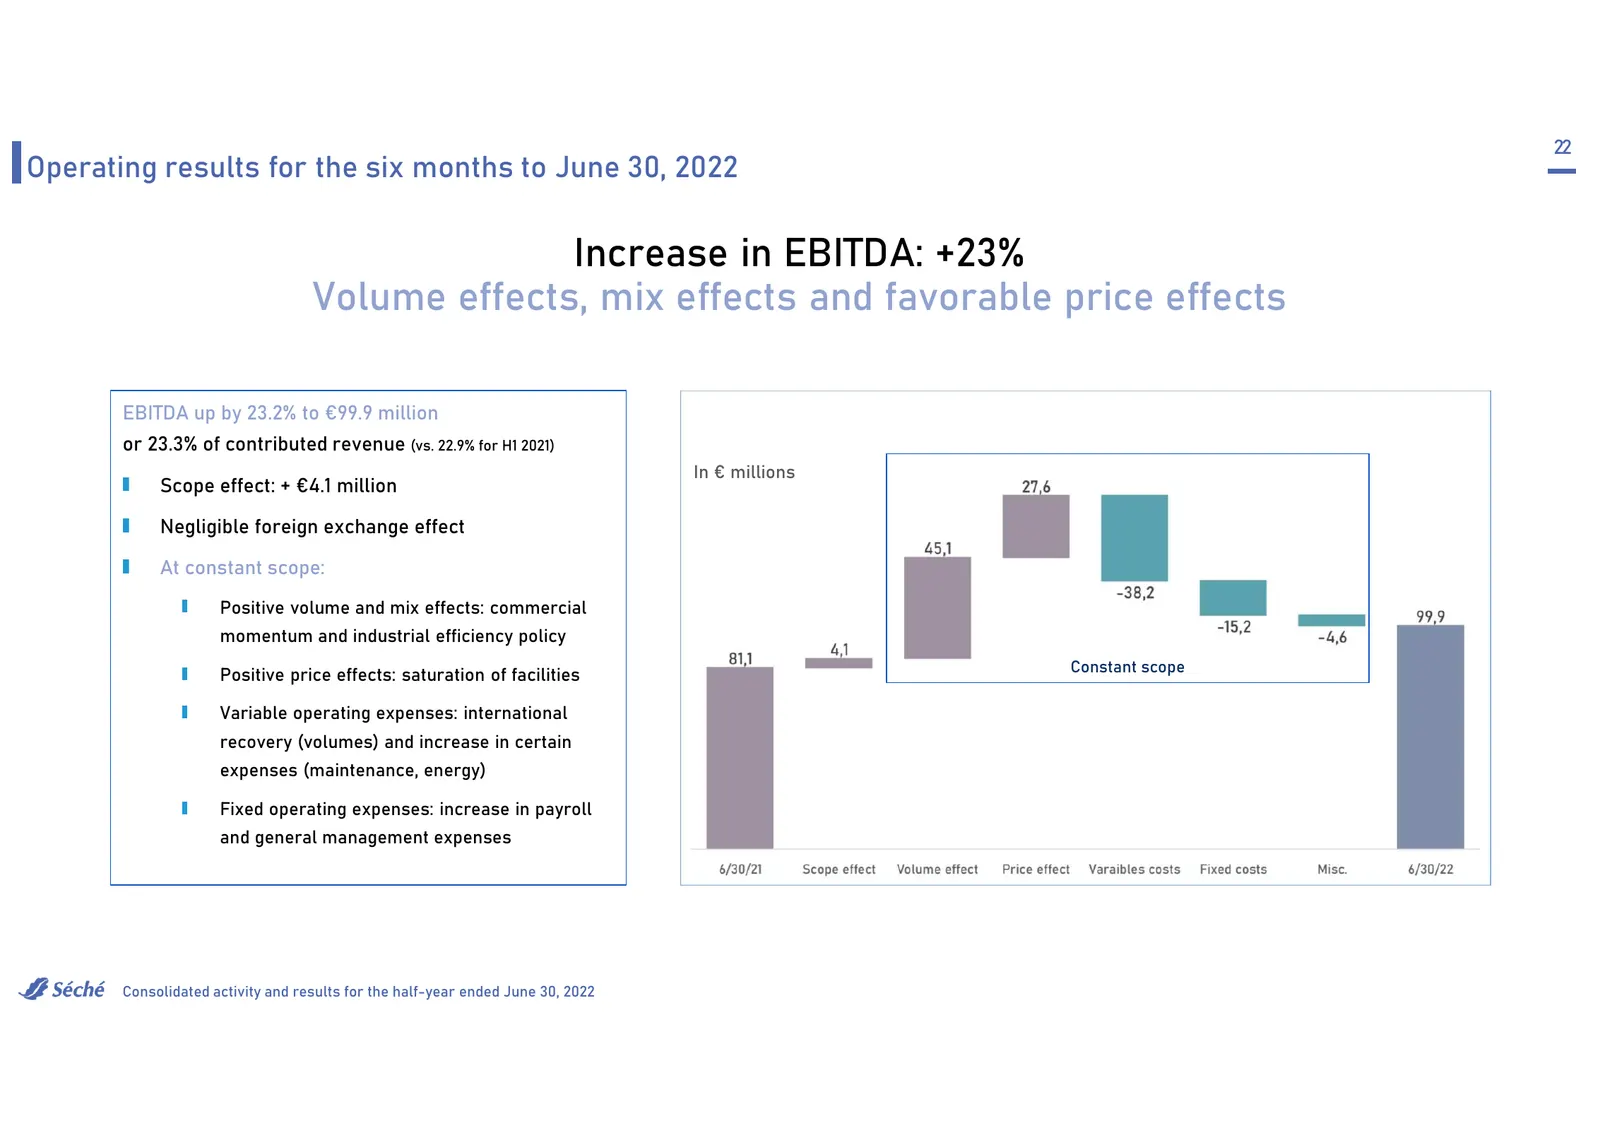
Slide 22: Increase in EBITDA: +23%
22 Operating results for the six months to June 30, 2022 Increase in EBITDA: +23% Volume effects, mix effects and favorable price effects EBITDA up by 23.2% to €99.9 million or 23.3% of contributed revenue (vs. 22.9% for H1 2021) In € millions Scope effect: + €4.1 million Negligible foreign exchange
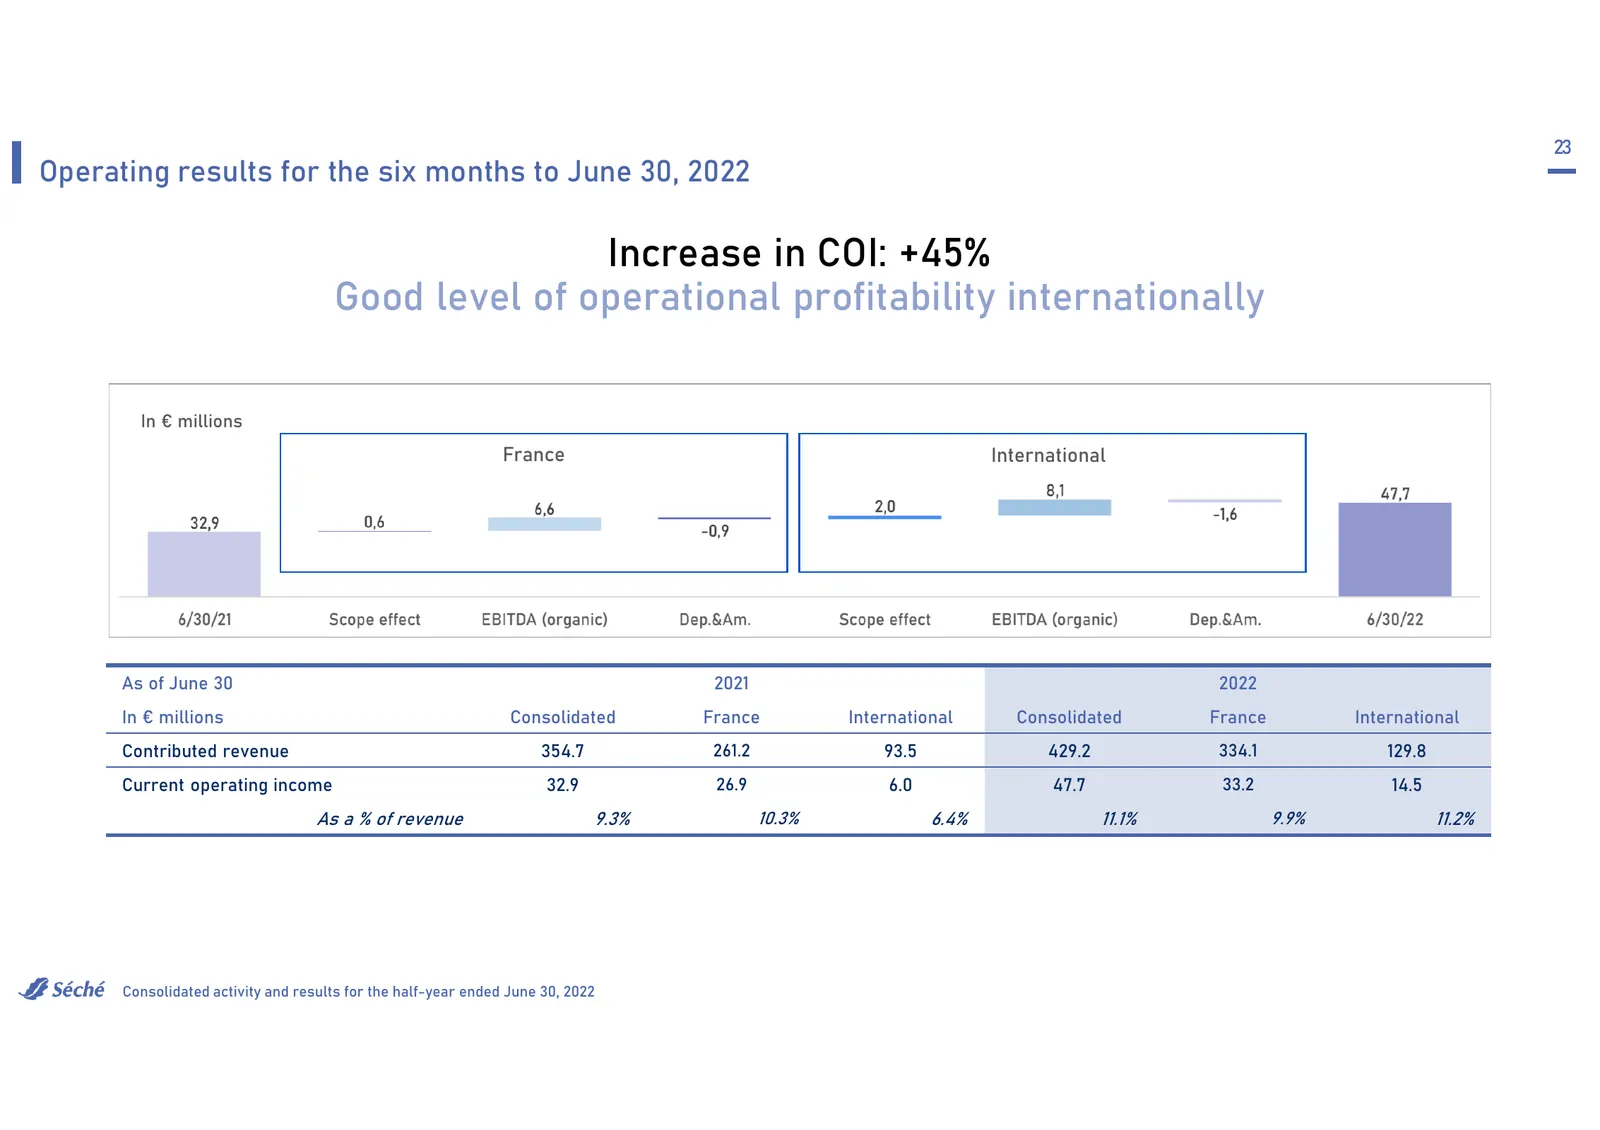
Slide 23: Increase in COI: +45%
23 Operating results for the six months to June 30, 2022 Increase in COI: +45% Good level of operational profitability internationally In € millions France International As of June 30 2021 2022 In € millions Consolidated France International Consolidated France International Contributed revenue 354.
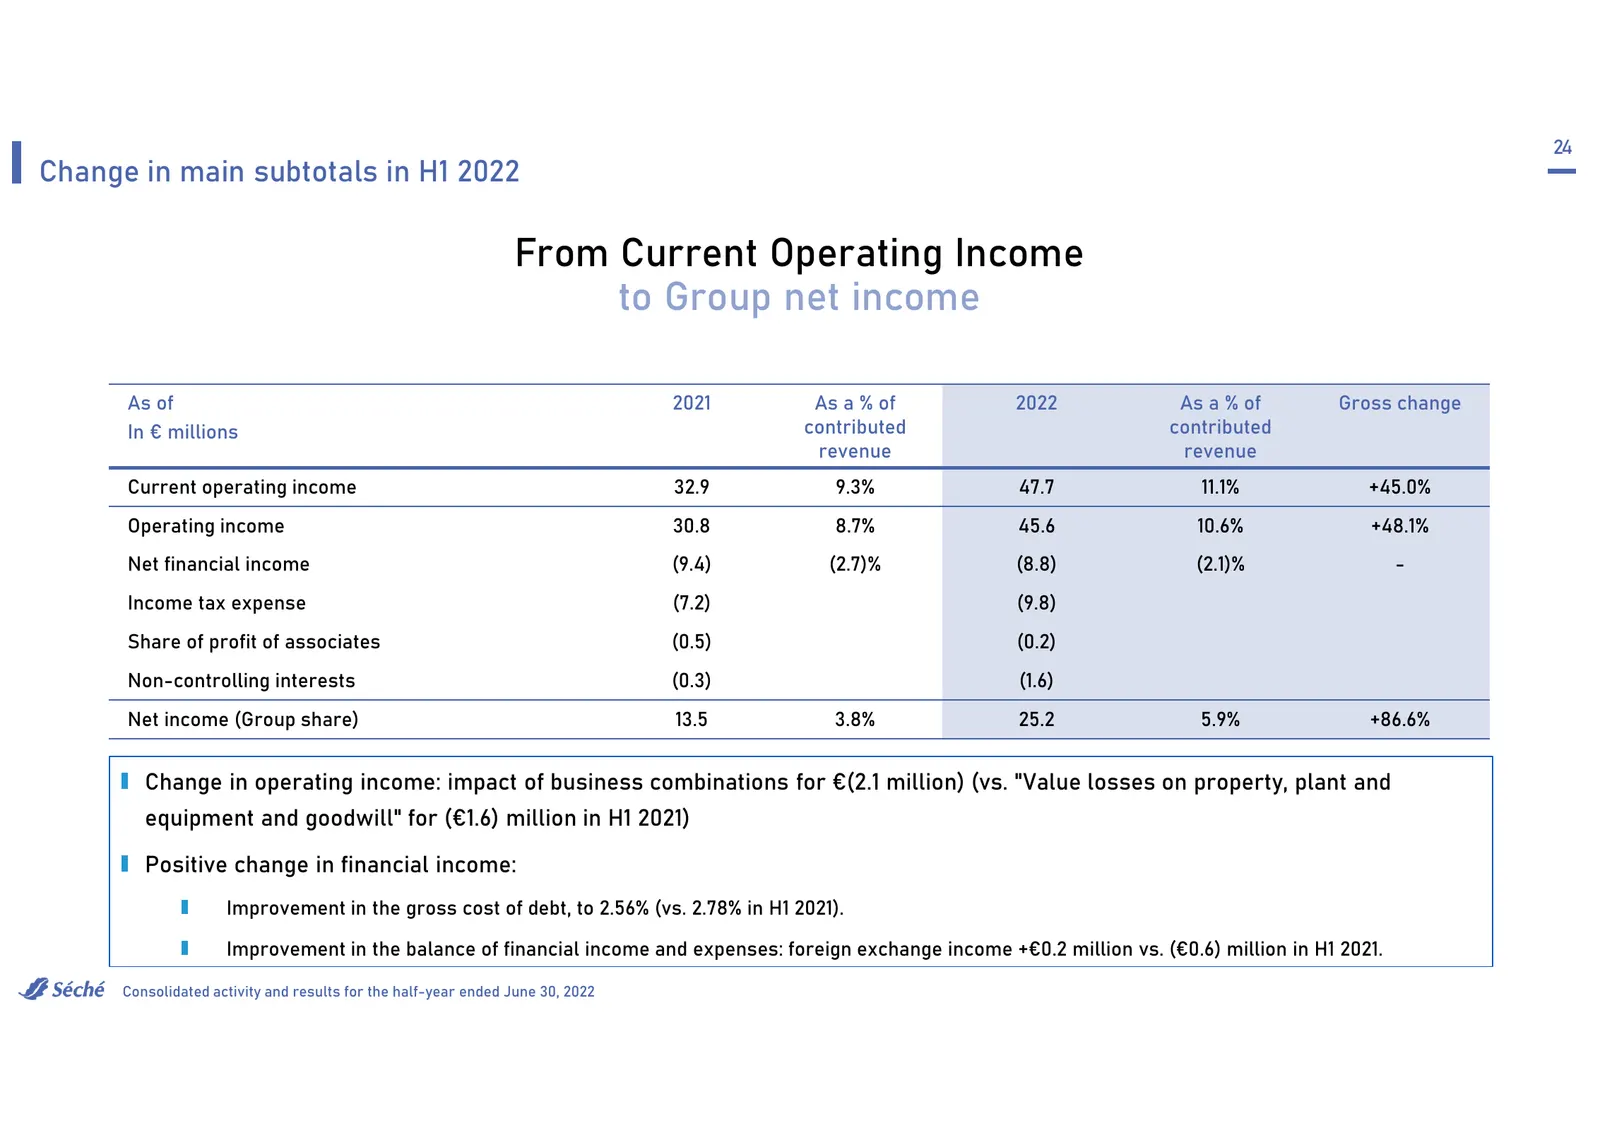
Slide 24: From Current Operating Income to Group net income
24 Change in main subtotals in H1 2022 From Current Operating Income to Group net income As of 2021 As a % of 2022 As a % of Gross change In € millions contributed contributed revenue revenue Current operating income 32.9 9.3% 47.7 11.1% +45.0% Operating income 30.8 8.7% 45.6 10.6% +48.1% Net financ
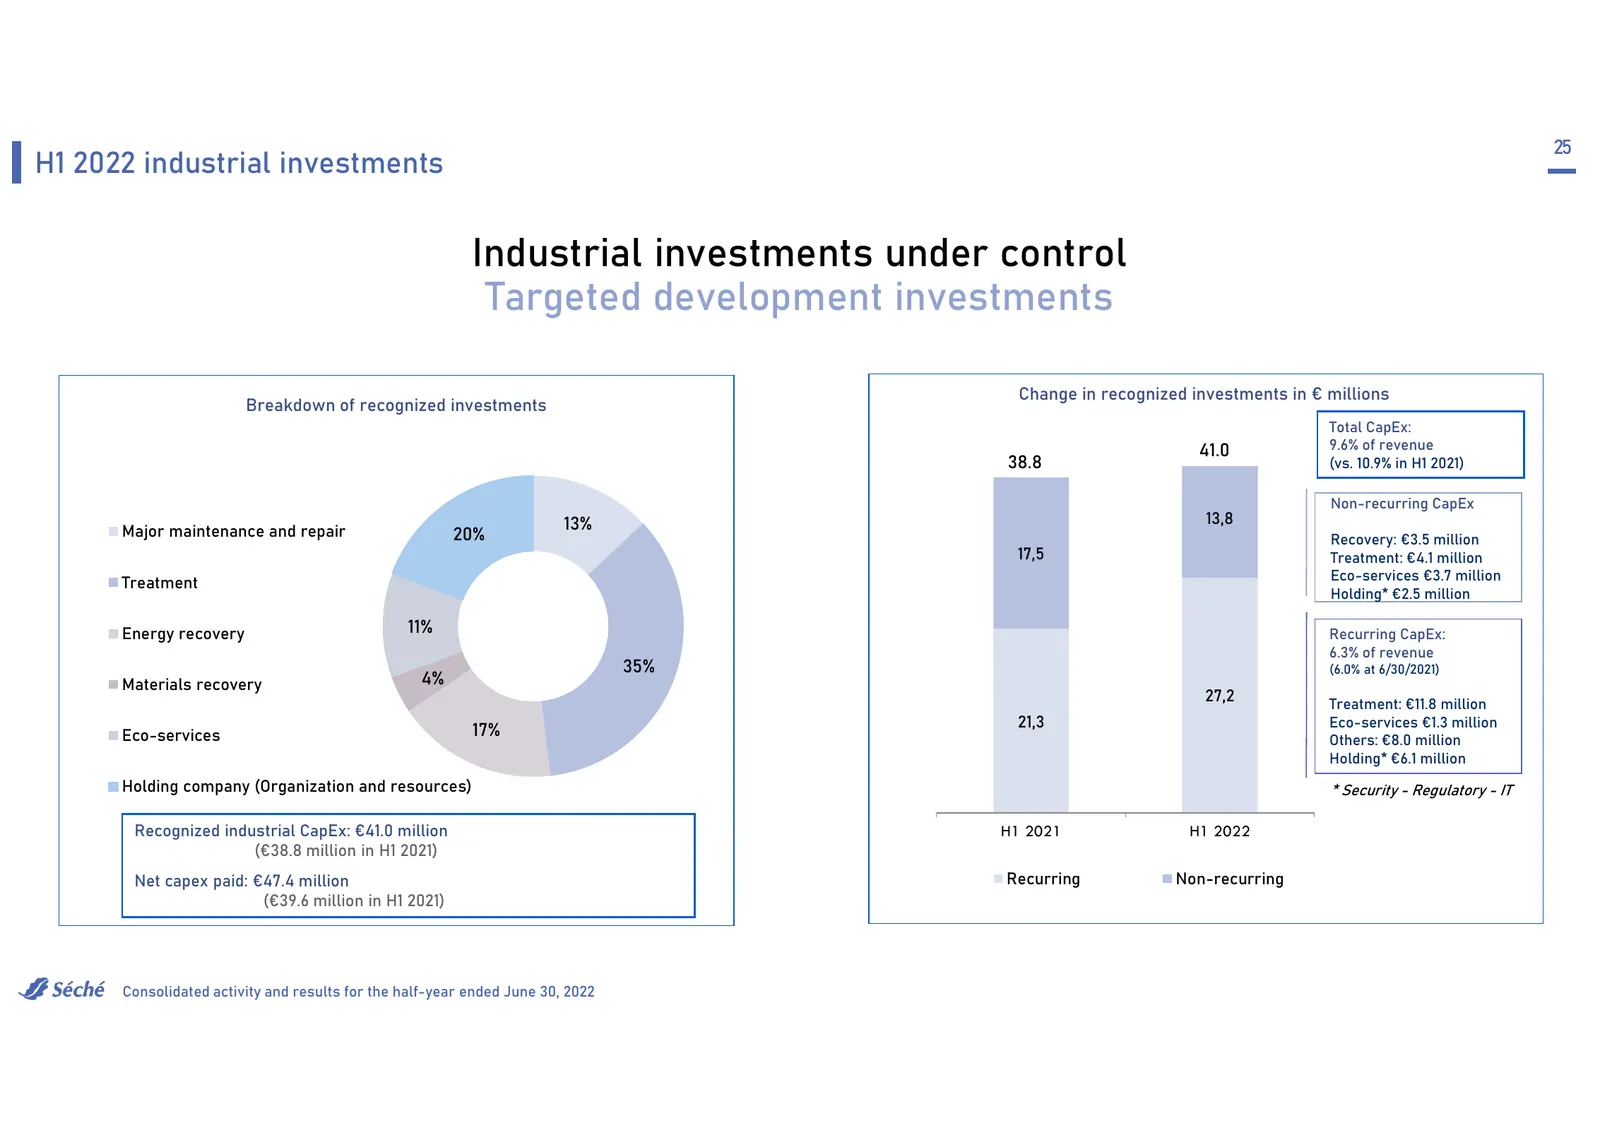
Slide 25: Industrial investments under control
25 H1 2022 industrial investments Industrial investments under control Targeted development investments Change in recognized investments in € millions Breakdown of recognized investments Total CapEx: 41.0 9.6% of revenue 38.8 (vs. 10.9% in H1 2021) Non-recurring CapEx 13% 13,8 Major maintenance and
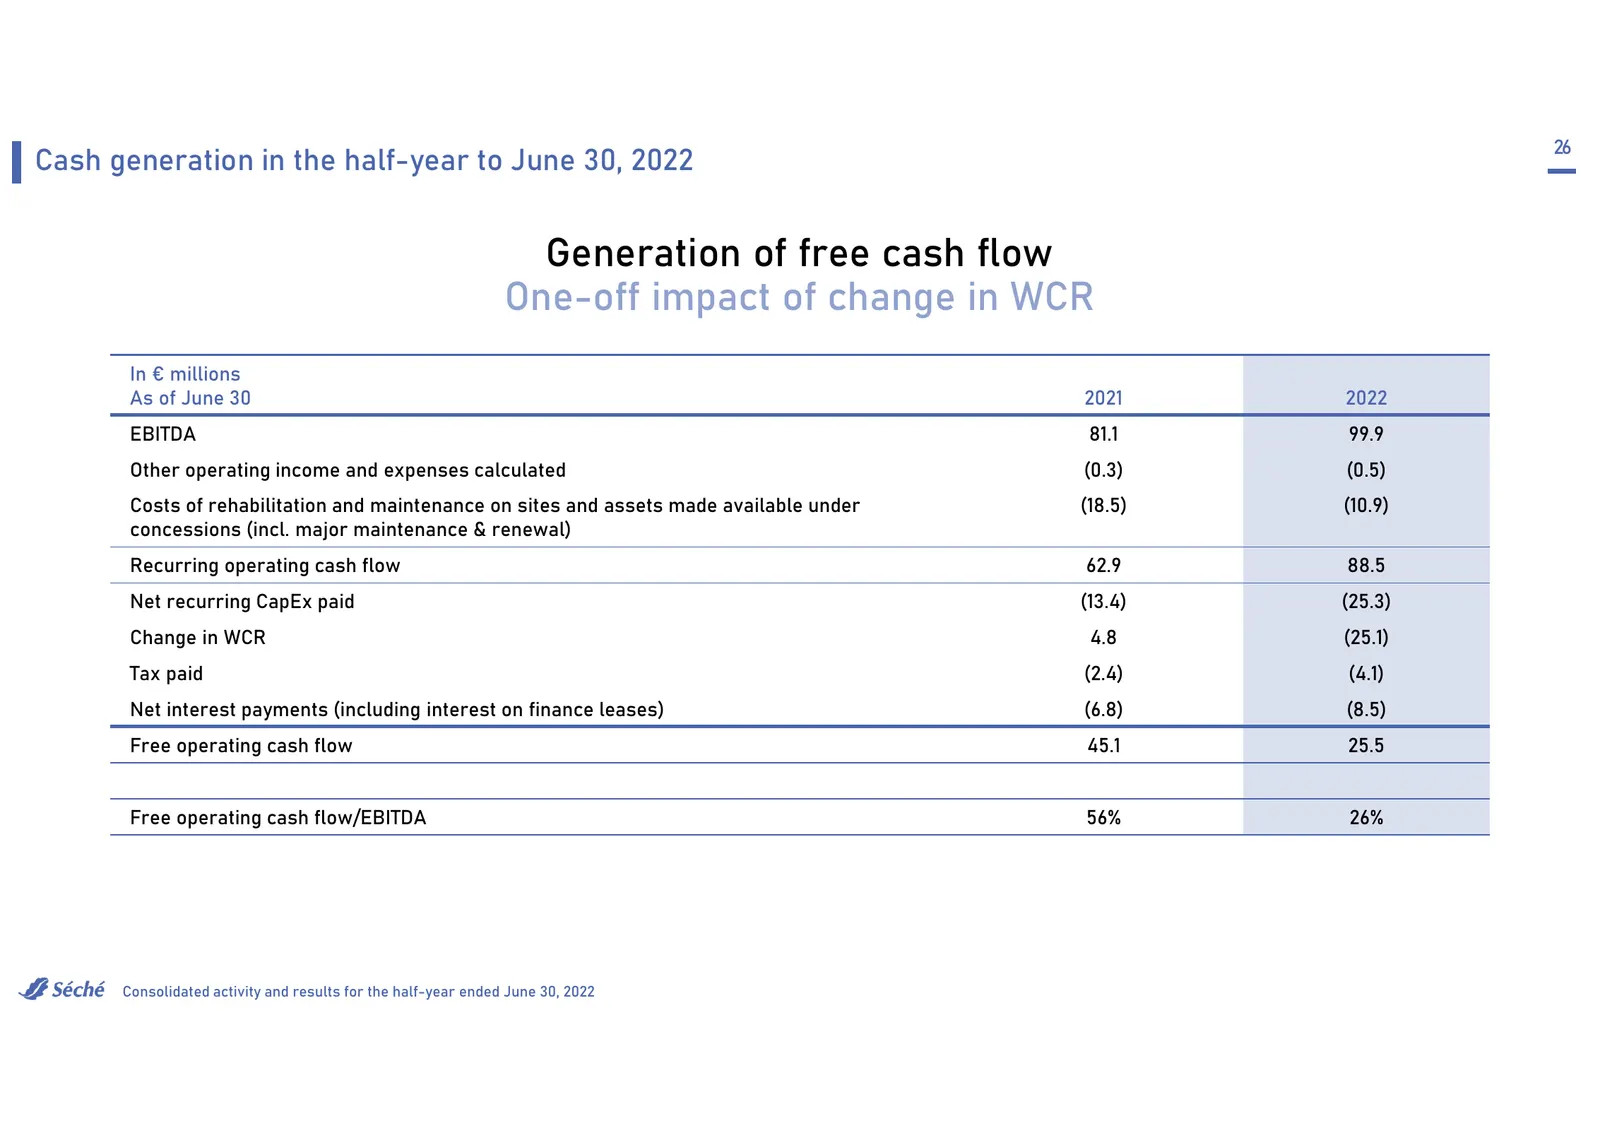
Slide 26: Generation of free cash flow
26 Cash generation in the half-year to June 30, 2022 Generation of free cash flow One-off impact of change in WCR In € millions As of June 30 2021 2022 EBITDA 81.1 99.9 Other operating income and expenses calculated (0.3) (0.5) Costs of rehabilitation and maintenance on sites and assets made availab
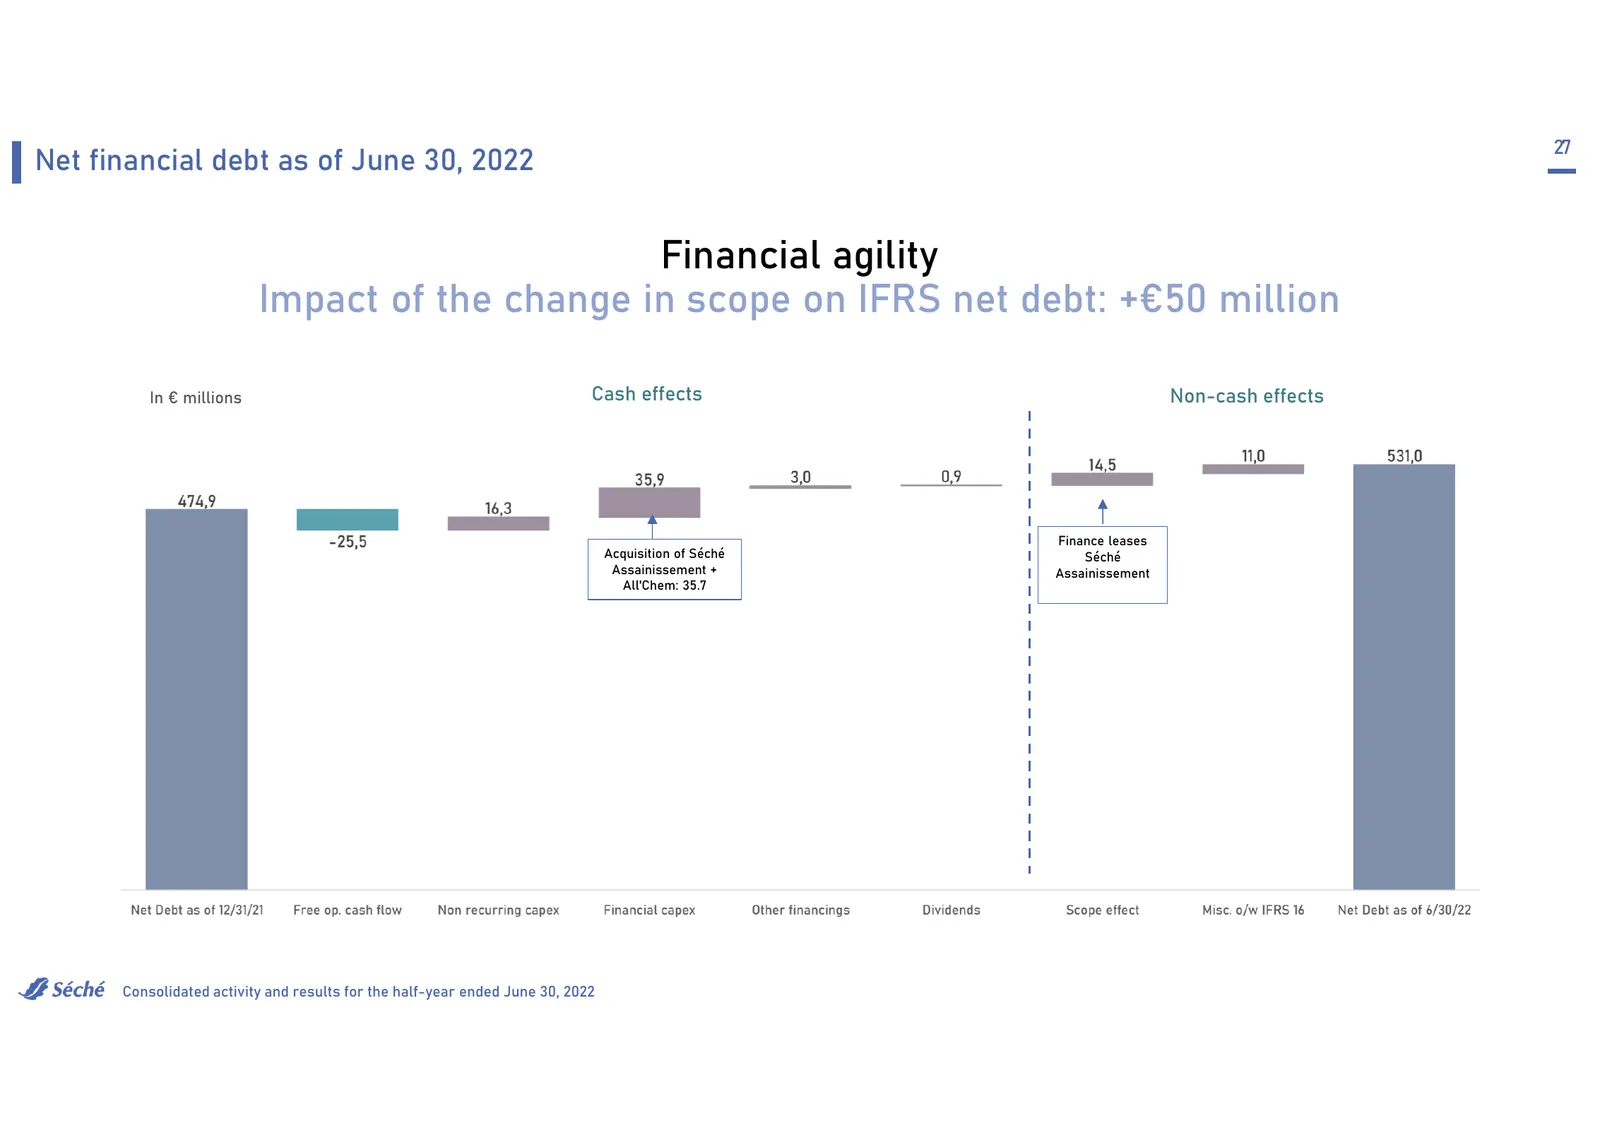
Slide 27: Financial agility
27 Net financial debt as of June 30, 2022 Financial agility Impact of the change in scope on IFRS net debt: +€50 million In € millions Cash effects Non-cash effects Finance leases Acquisition of Séché Séché Assainissement + Assainissement All'Chem: 35.7 Consolidated activity and results for the half
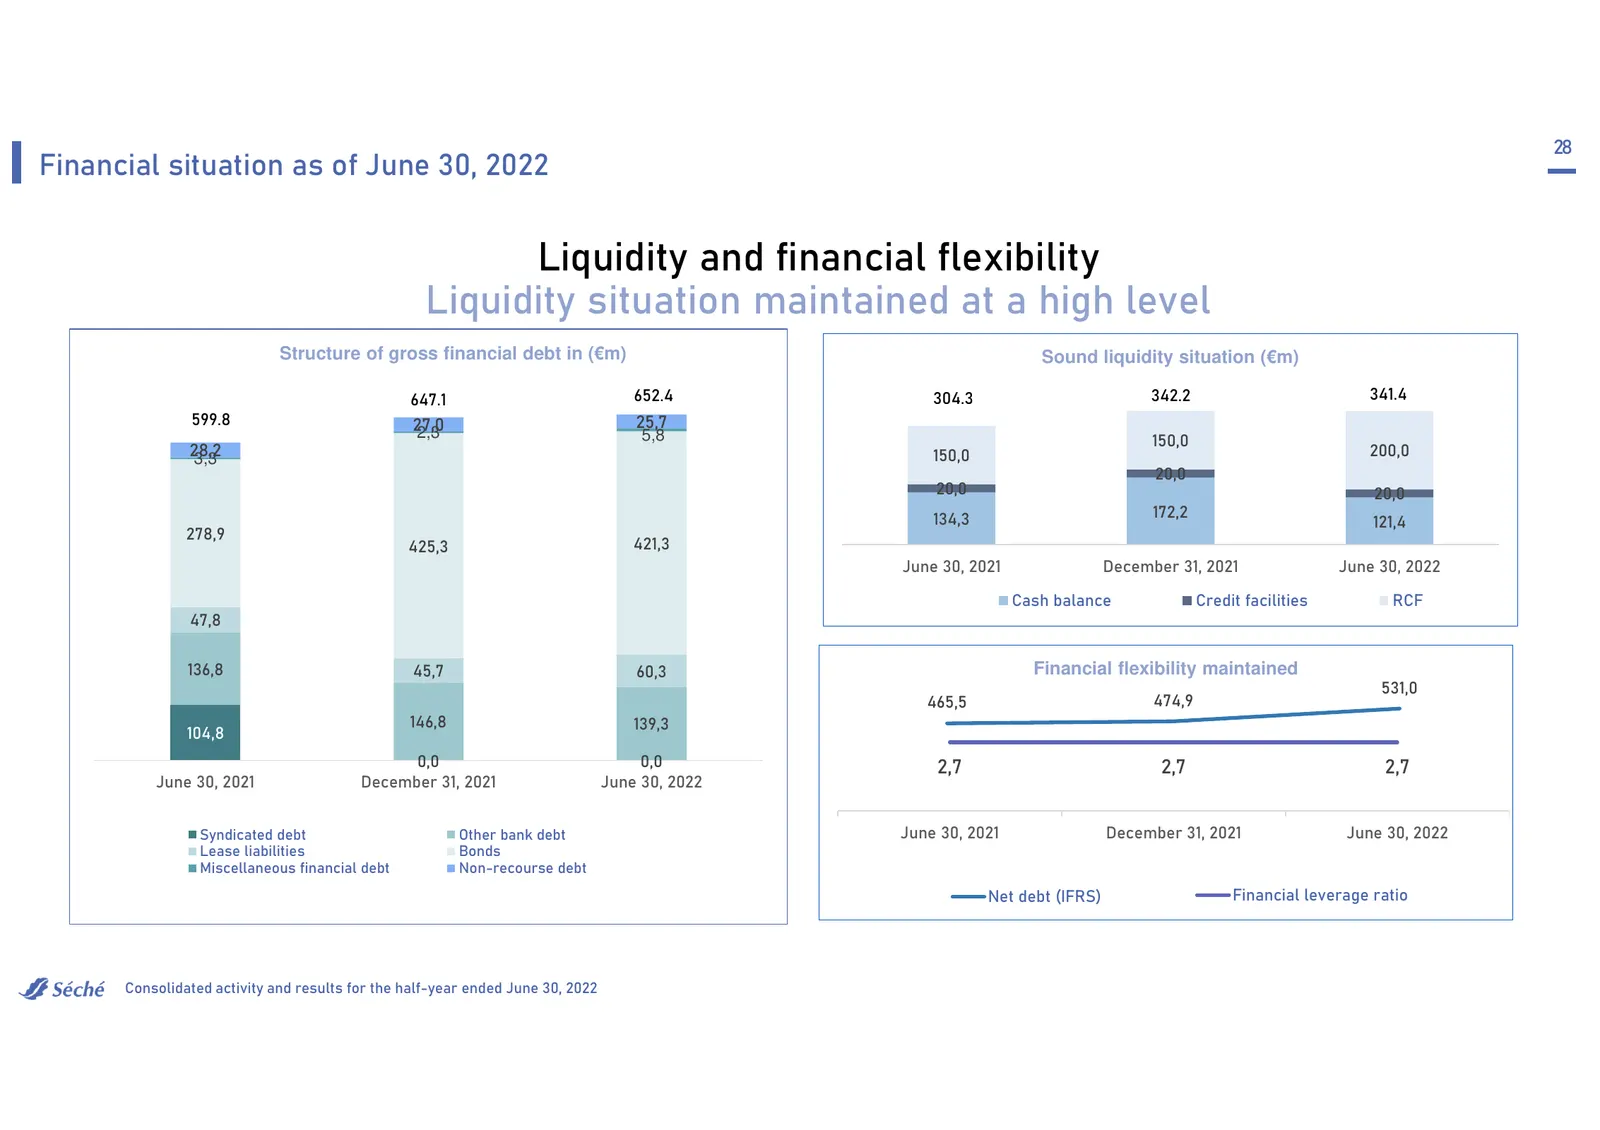
Slide 28: Liquidity and financial flexibility
28 Financial situation as of June 30, 2022 Liquidity and financial flexibility Liquidity situation maintained at a high level Structure of gross financial debt in (€m) Sound liquidity situation (€m) 647.1 652.4 304.3 342.2 341.4 599.8 27,0 25,7 2,3 5,8 150,0 28,2 3,3 150,0 200,0 20,0 20,0 20,0 134,3
Slide 29: New RCF with ESG impact criteria
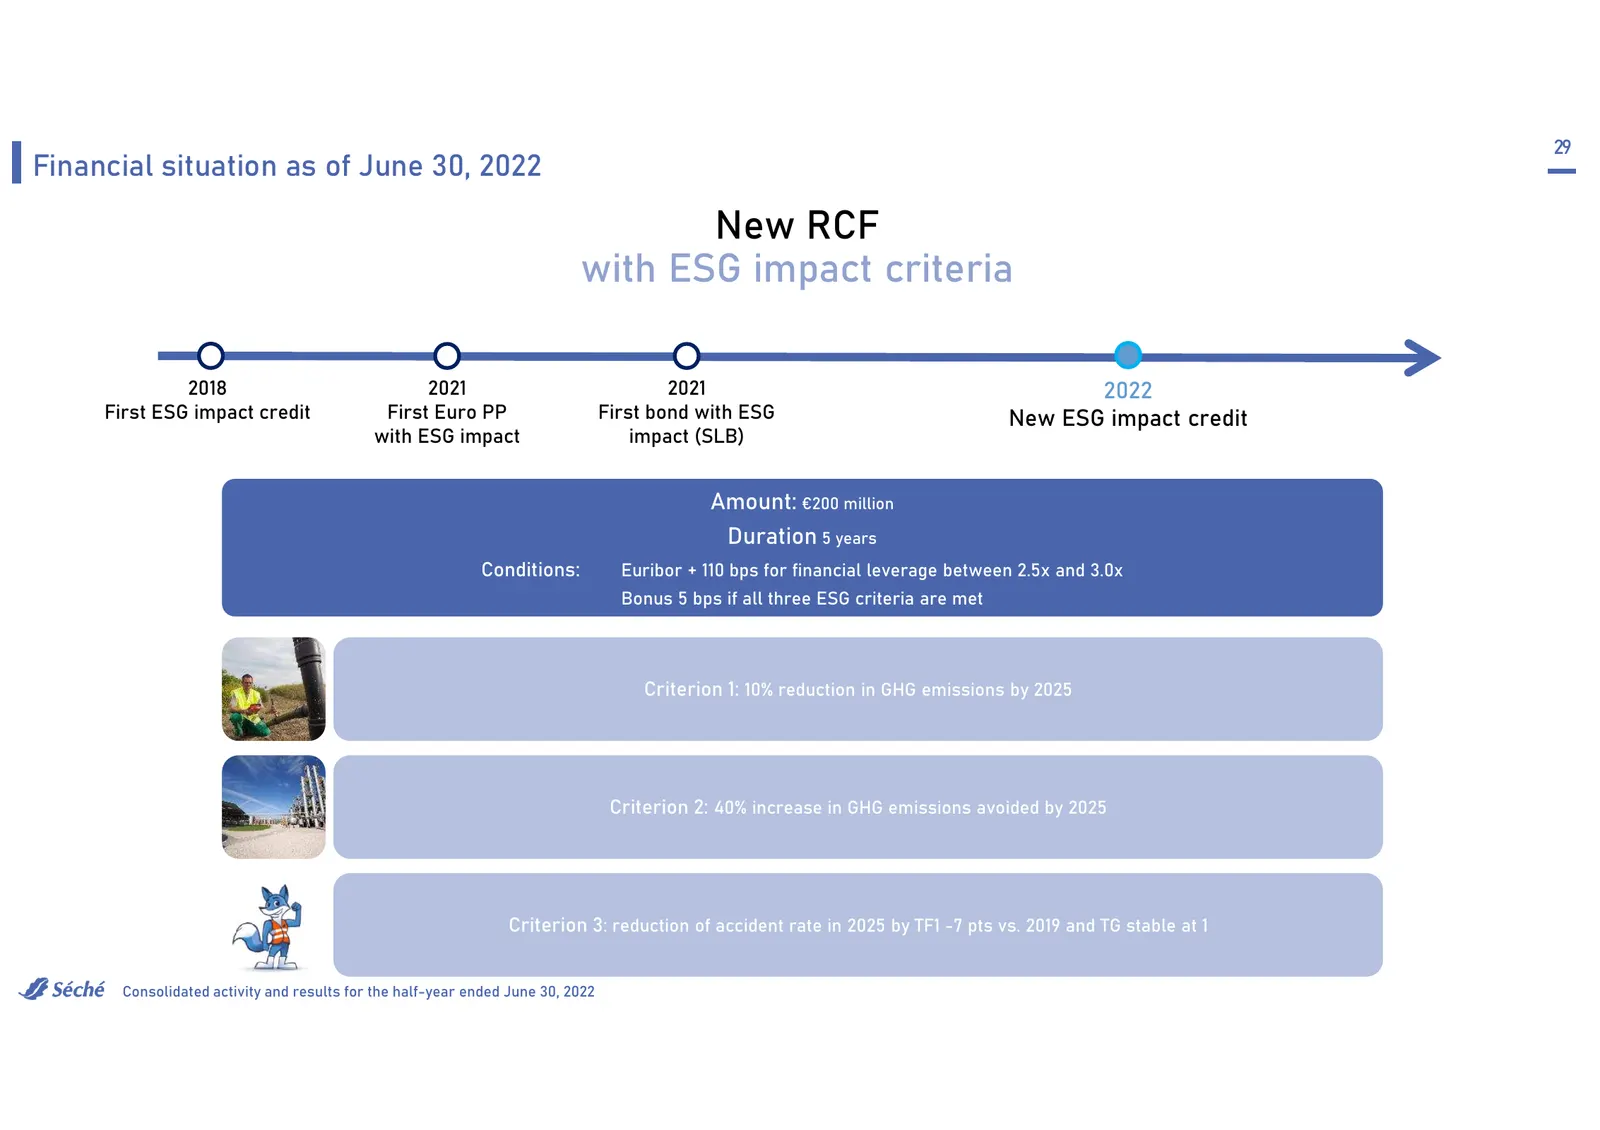
29 Financial situation as of June 30, 2022 New RCF with ESG impact criteria 2018 2021 2021 2022 First ESG impact credit First Euro PP First bond with ESG New ESG impact credit with ESG impact impact (SLB) Amount: €200 million Duration 5 years Conditions: Euribor + 110 bps for financial leverage betw
Slide 30: Liquidity: maturity of gross financial debt
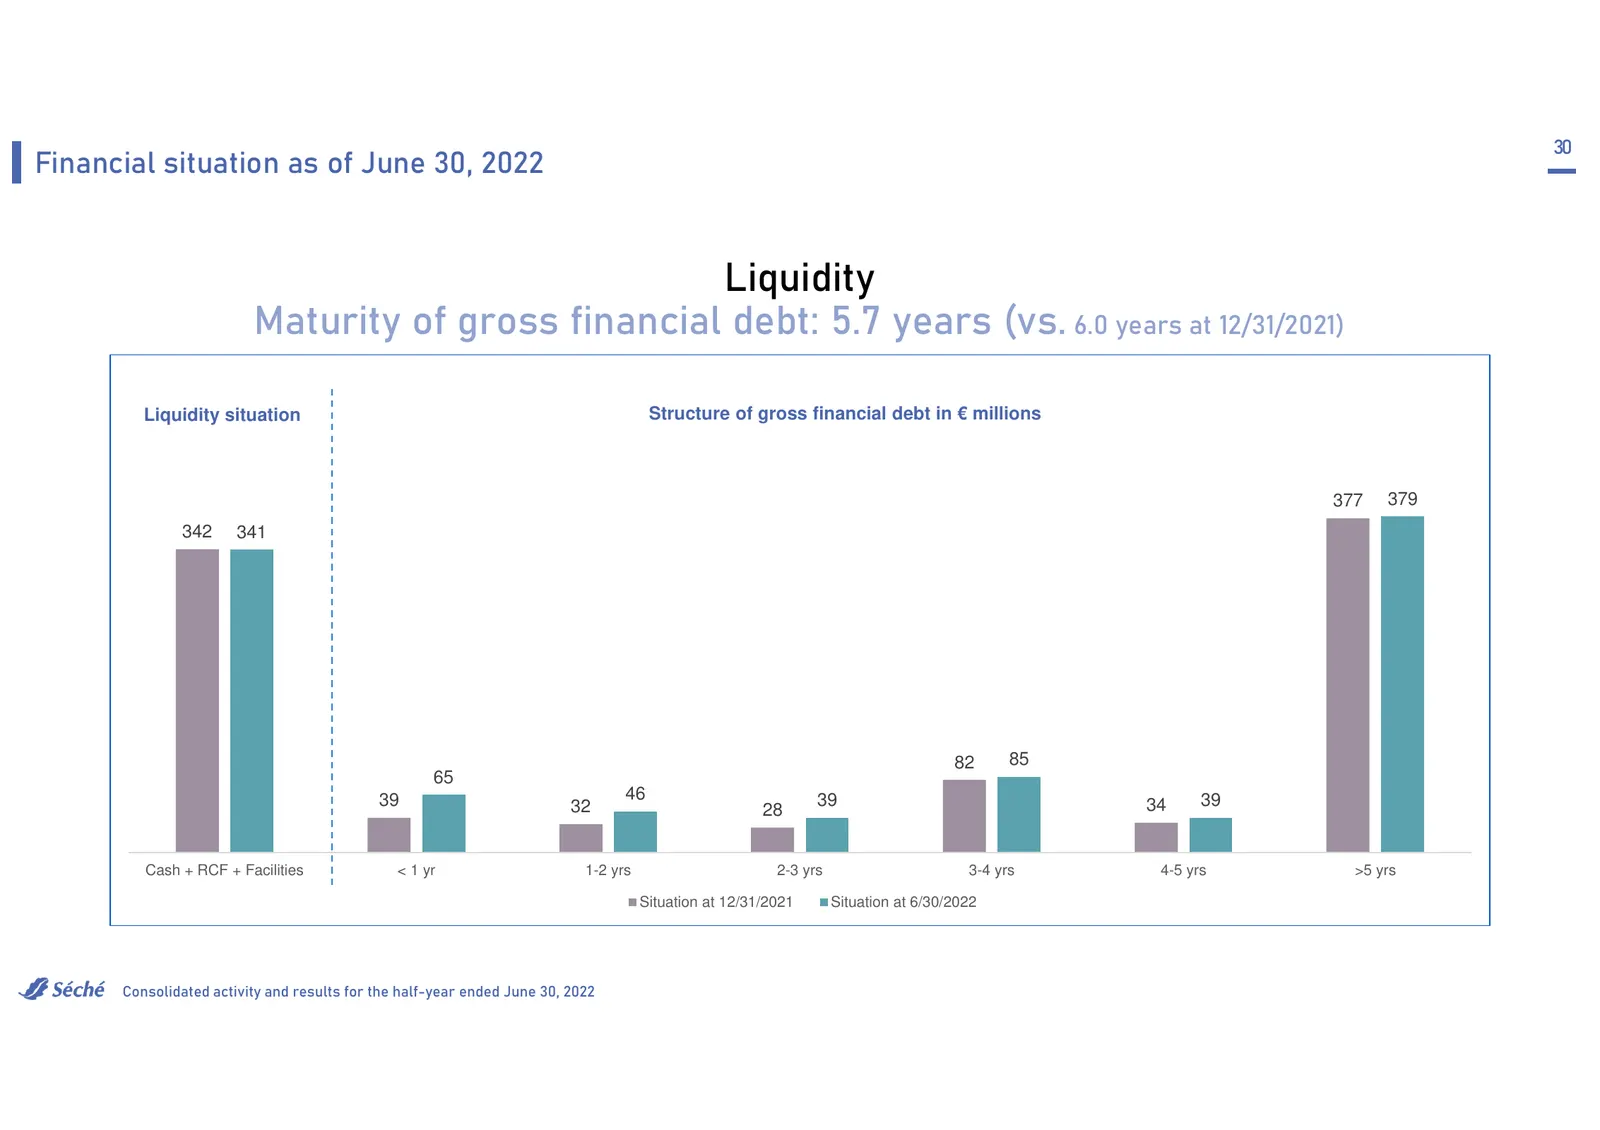
30 Financial situation as of June 30, 2022 Liquidity Maturity of gross financial debt: 5.7 years (vs. 6.0 years at 12/31/2021) Liquidity situation Structure of gross financial debt in € millions 377 379 342 341 82 85 65 39 46 39 39 32 28 34 Cash + RCF + Facilities < 1 yr 1-2 yrs 2-3 yrs 3-4 yrs 4-5
Slide 31: Outlook: 2022 targets revised upwards
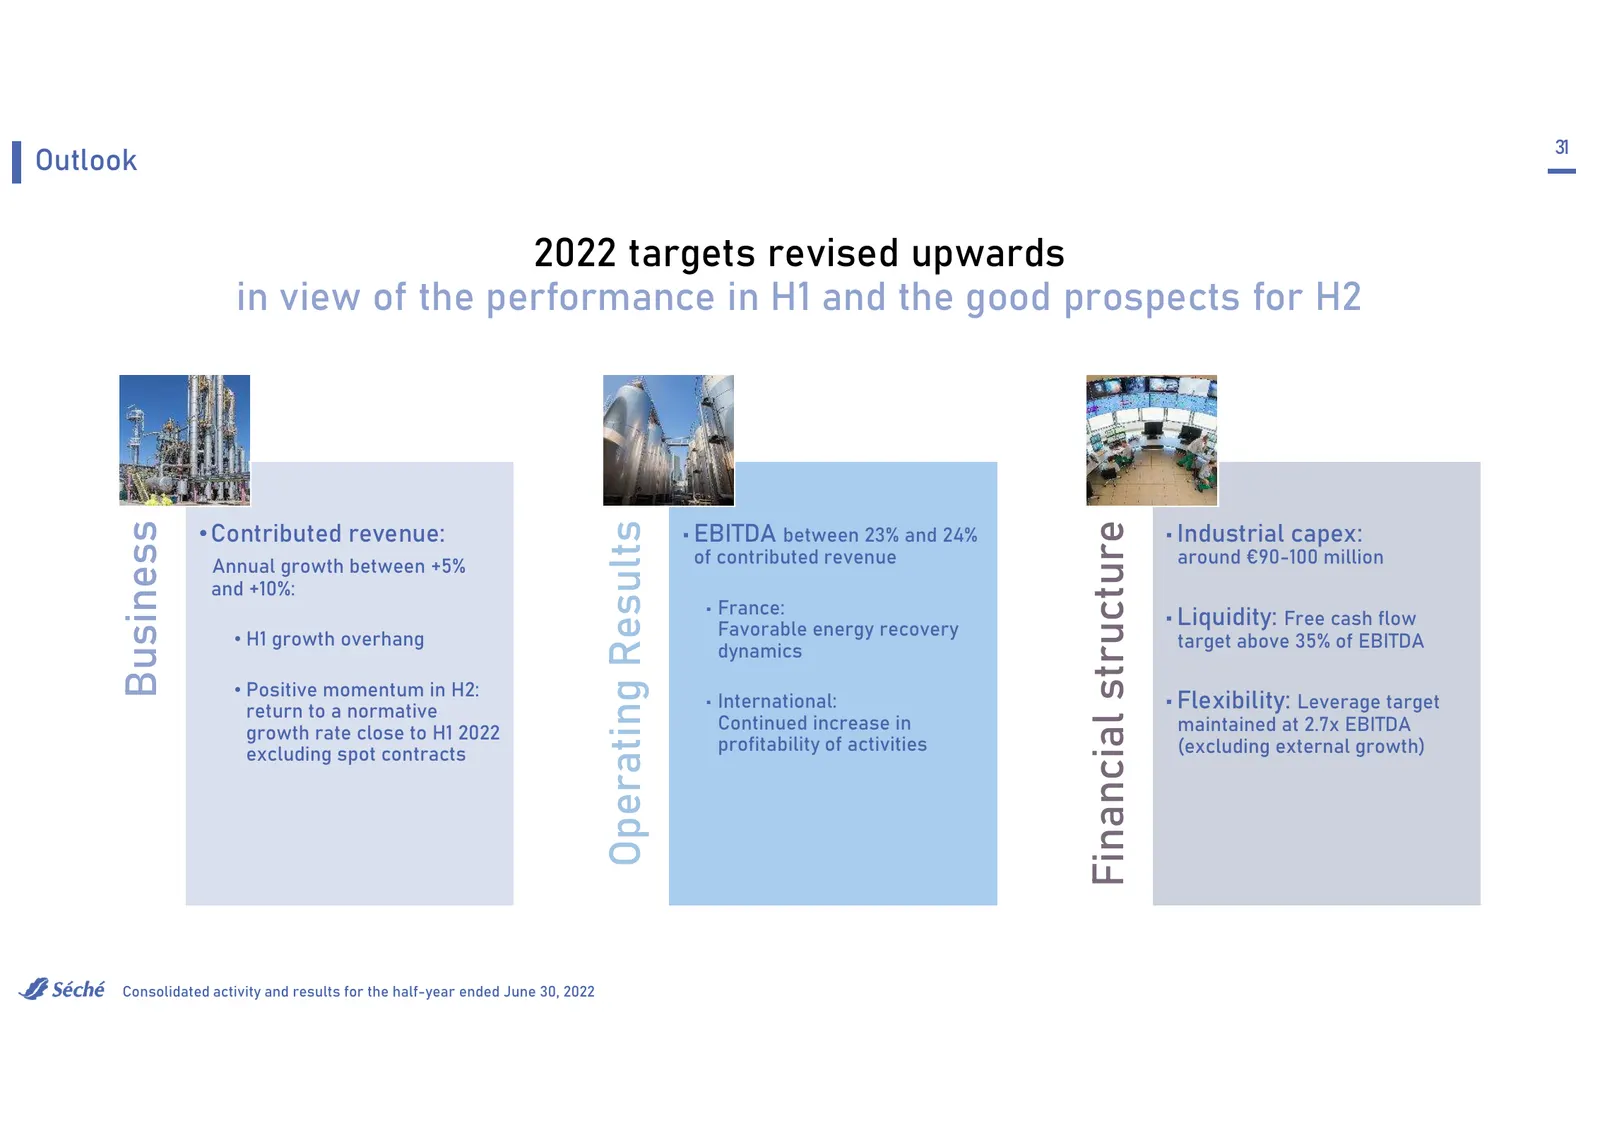
31 Outlook 2022 targets revised upwards in view of the performance in H1 and the good prospects for H2 Financial structure Operating Results Business • Contributed revenue: • EBITDA between 23% and 24% • Industrial capex: Annual growth between +5% of contributed revenue around €90-100 million and +1
Slide 32: Note
32 NOTE This document may contain information of a provisional nature. This information represents either trends or targets at the date of this document's creation and may not be considered as results forecasts or as any other type of performance indicators. This information is by nature subject to
Slide 33: Appendices
33 Appendices Consolidated activity and results for the half-year ended June 30, 2022
Slide 34: Definition of contributed revenue
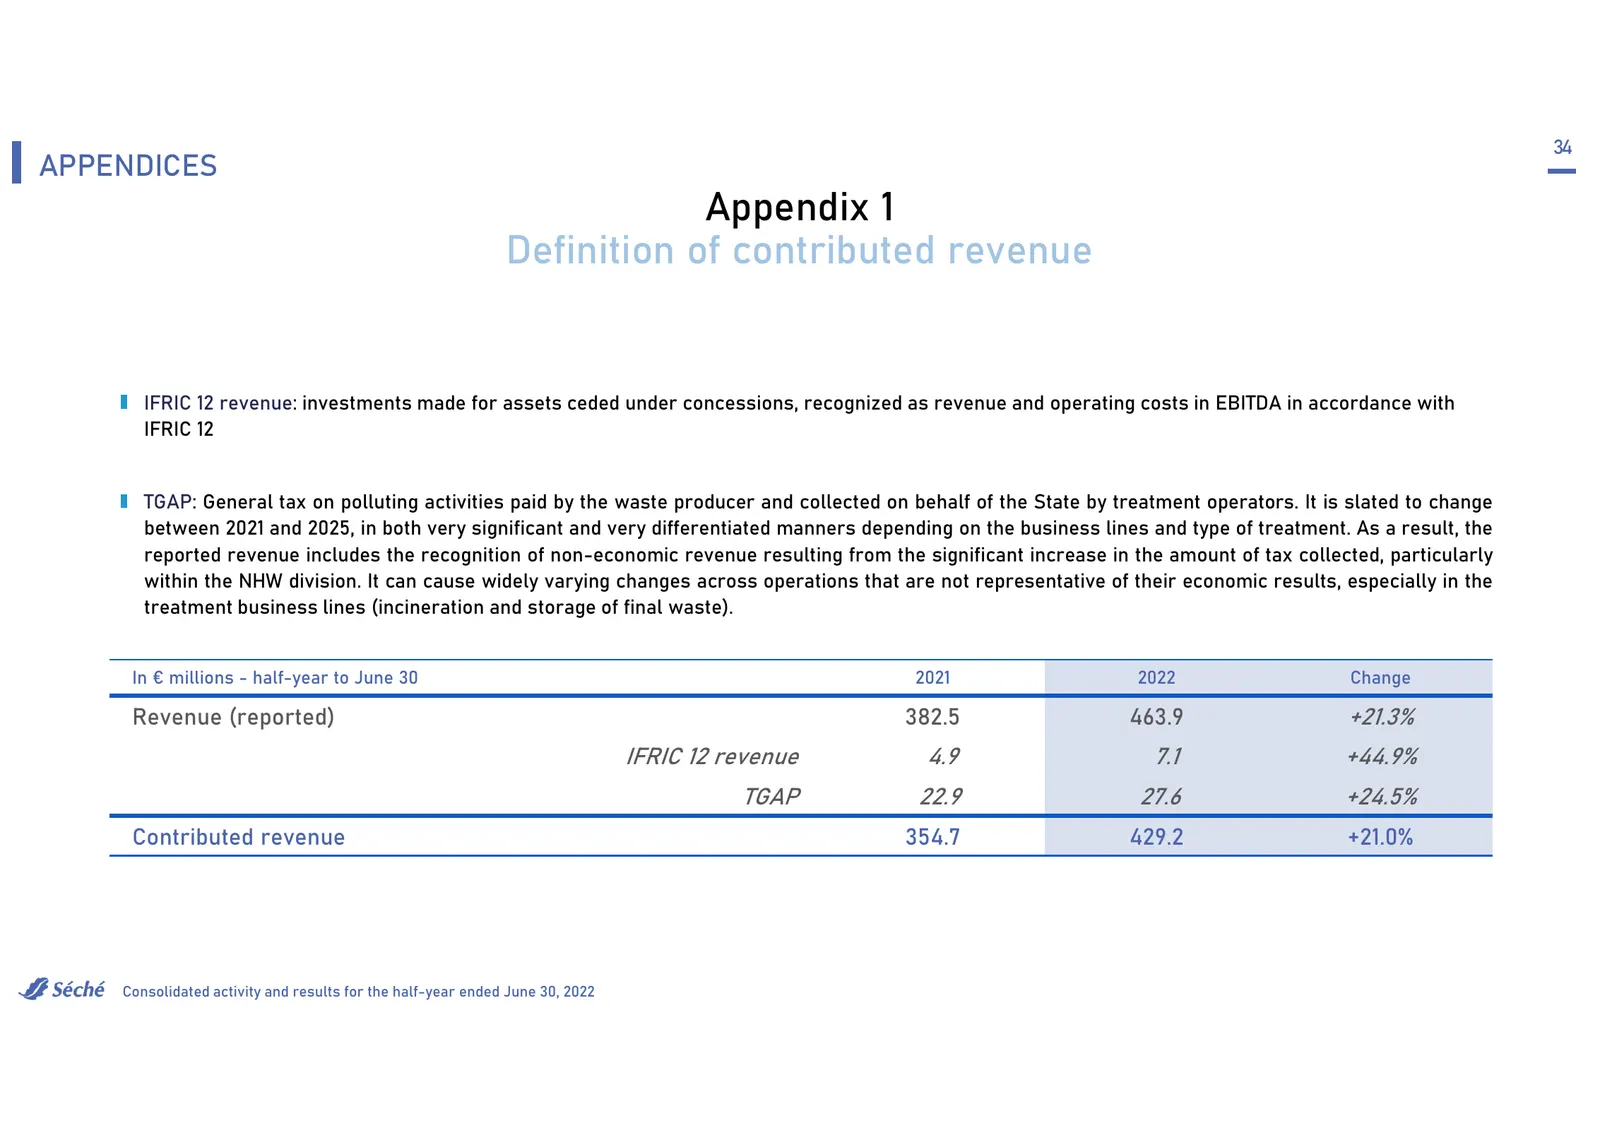
34 APPENDICES Appendix 1 Definition of contributed revenue IFRIC 12 revenue: investments made for assets ceded under concessions, recognized as revenue and operating costs in EBITDA in accordance with IFRIC 12 TGAP: General tax on polluting activities paid by the waste producer and collected on beha
Slide 35: Contributed revenue by geographic area
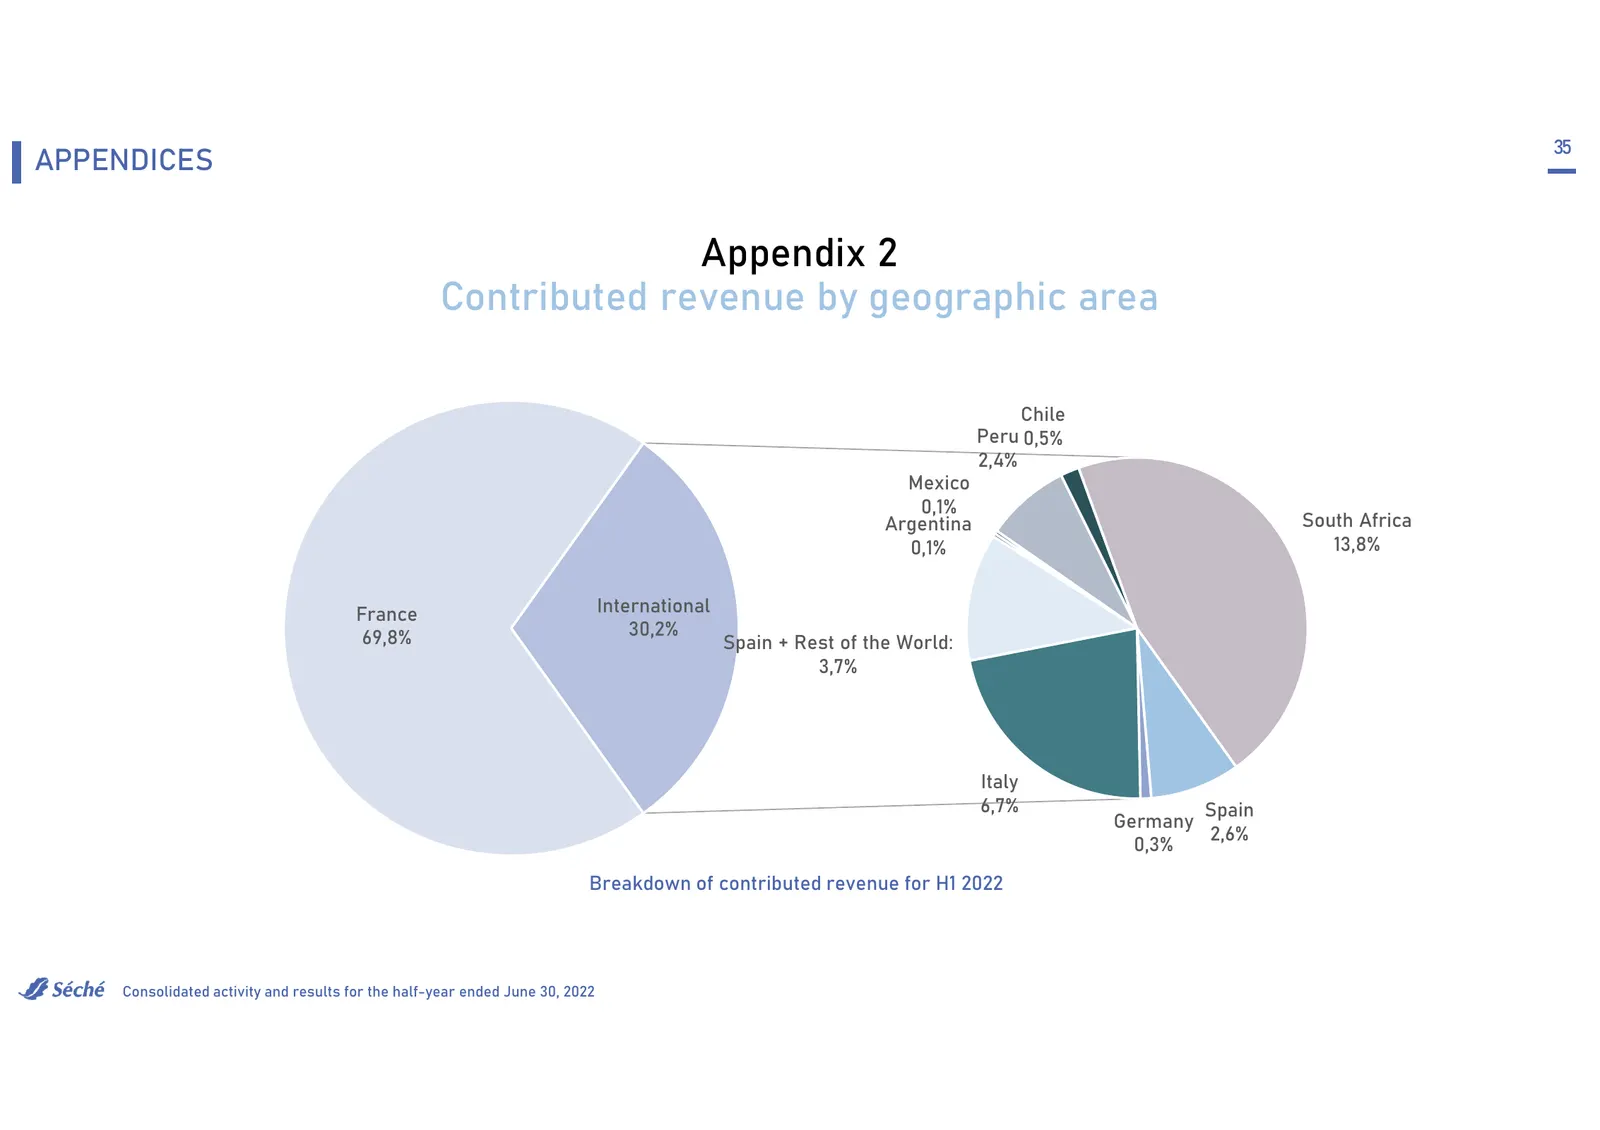
35 APPENDICES Appendix 2 Contributed revenue by geographic area Chile Peru 0,5% 2,4% Mexico 0,1% Argentina South Africa 0,1% 13,8% France International 69,8% 30,2% Spain + Rest of the World: 3,7% Italy 6,7% Spain Germany 2,6% 0,3% Breakdown of contributed revenue for H1 2022 Consolidated activity an
Slide 36: Breakdown of contributed revenue by division
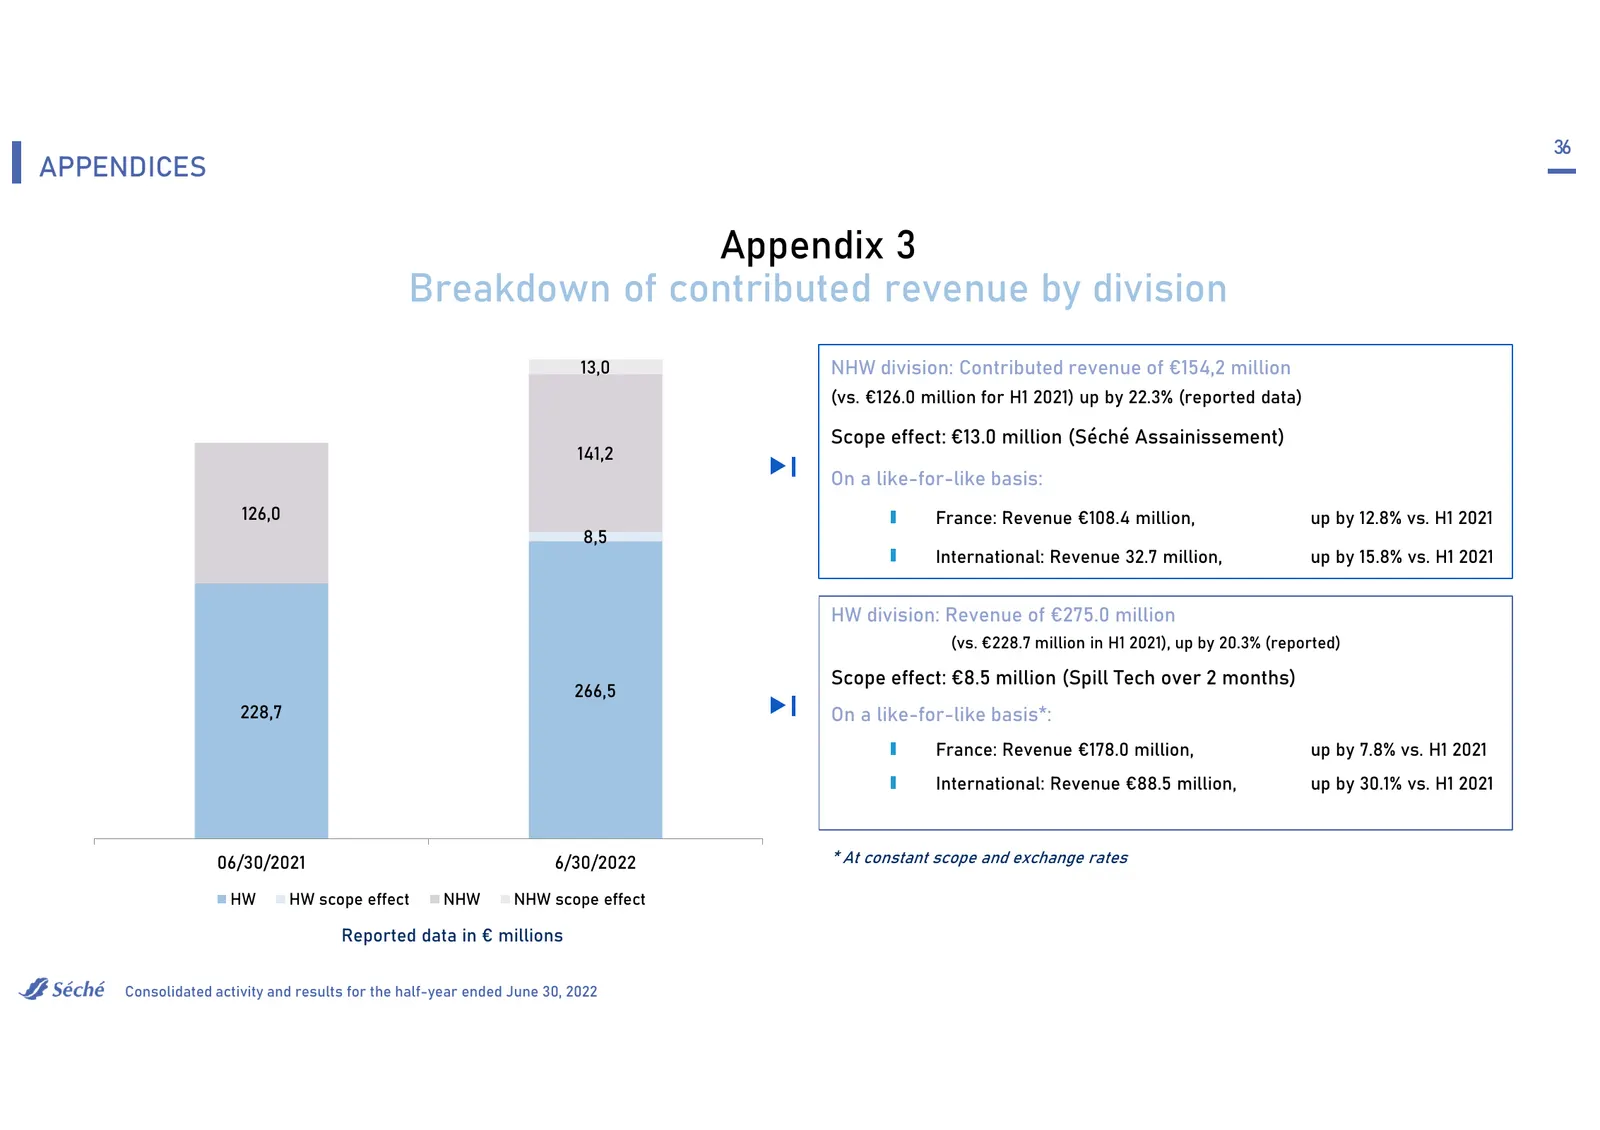
36 APPENDICES Appendix 3 Breakdown of contributed revenue by division 13,0 NHW division: Contributed revenue of €154,2 million (vs. €126.0 million for H1 2021) up by 22.3% (reported data) Scope effect: €13.0 million (Séché Assainissement) 141,2 On a like-for-like basis: 126,0 France: Revenue €108.4
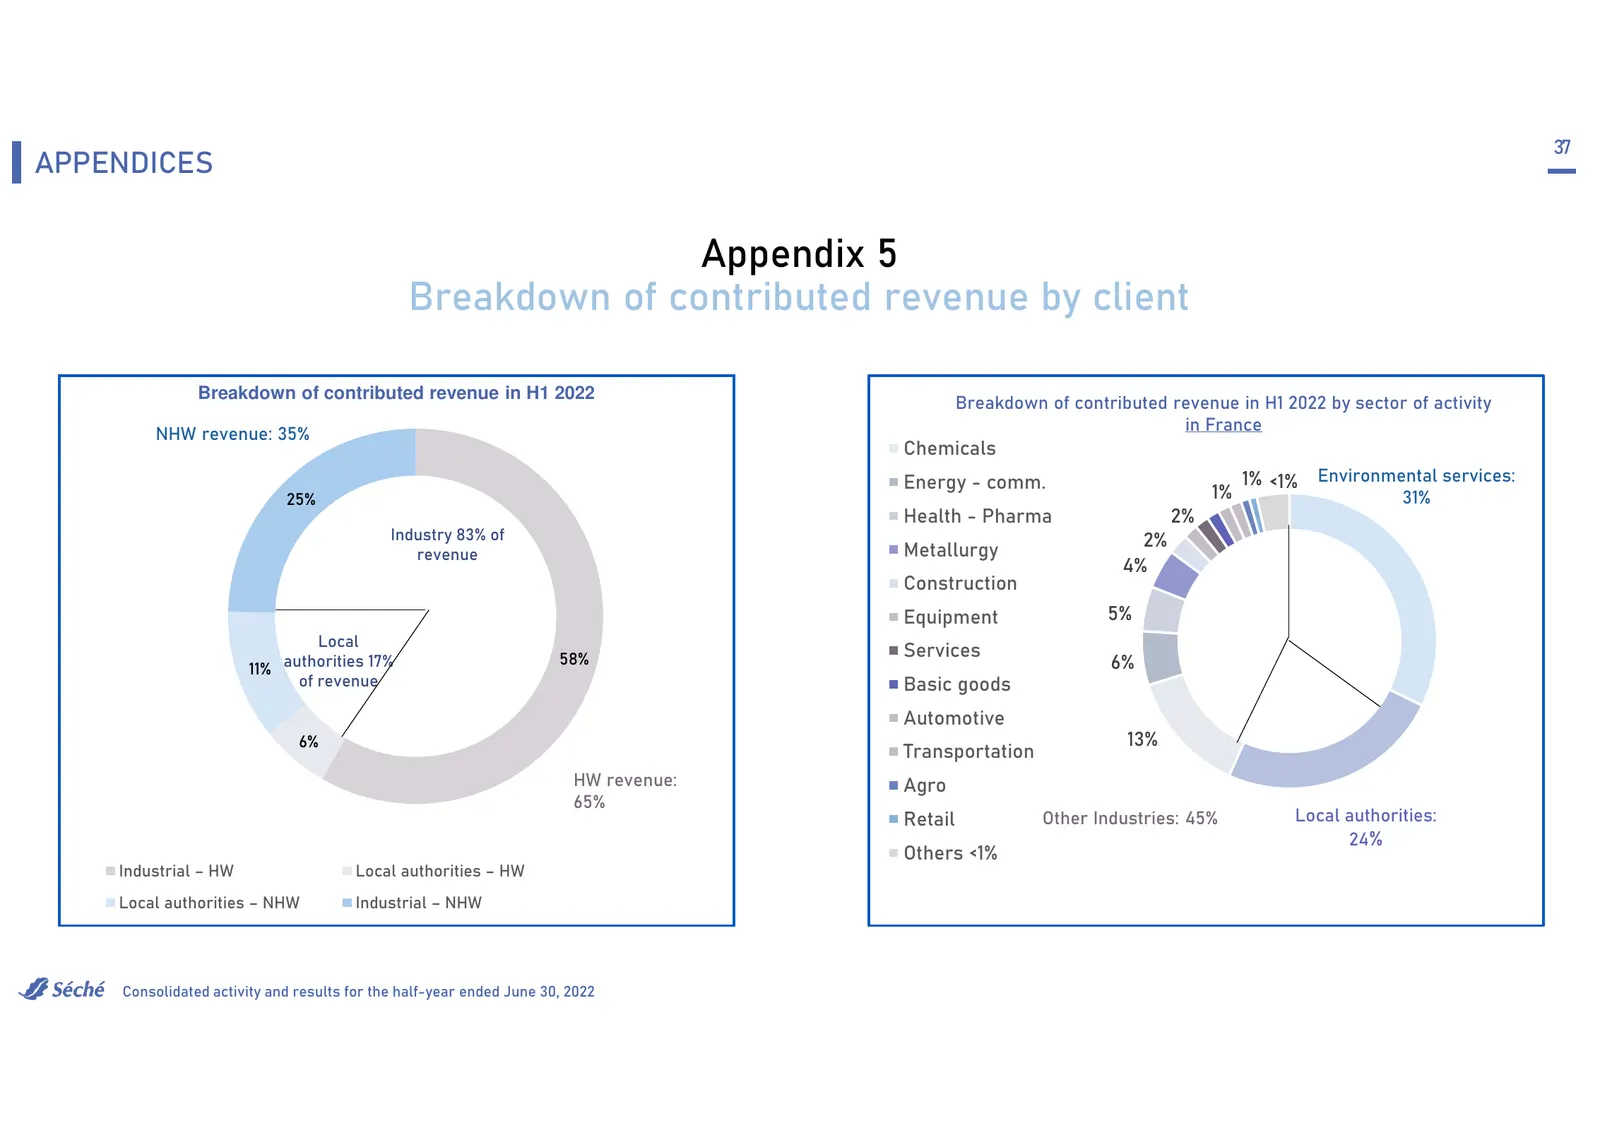
Slide 37: Breakdown of contributed revenue by client
37 APPENDICES Appendix 5 Breakdown of contributed revenue by client Breakdown of contributed revenue in H1 2022 Breakdown of contributed revenue in H1 2022 by sector of activity in France NHW revenue: 35% Chemicals Energy - comm. 1% <1% Environmental services: 25% 1% 31% Health - Pharma 2% Industry
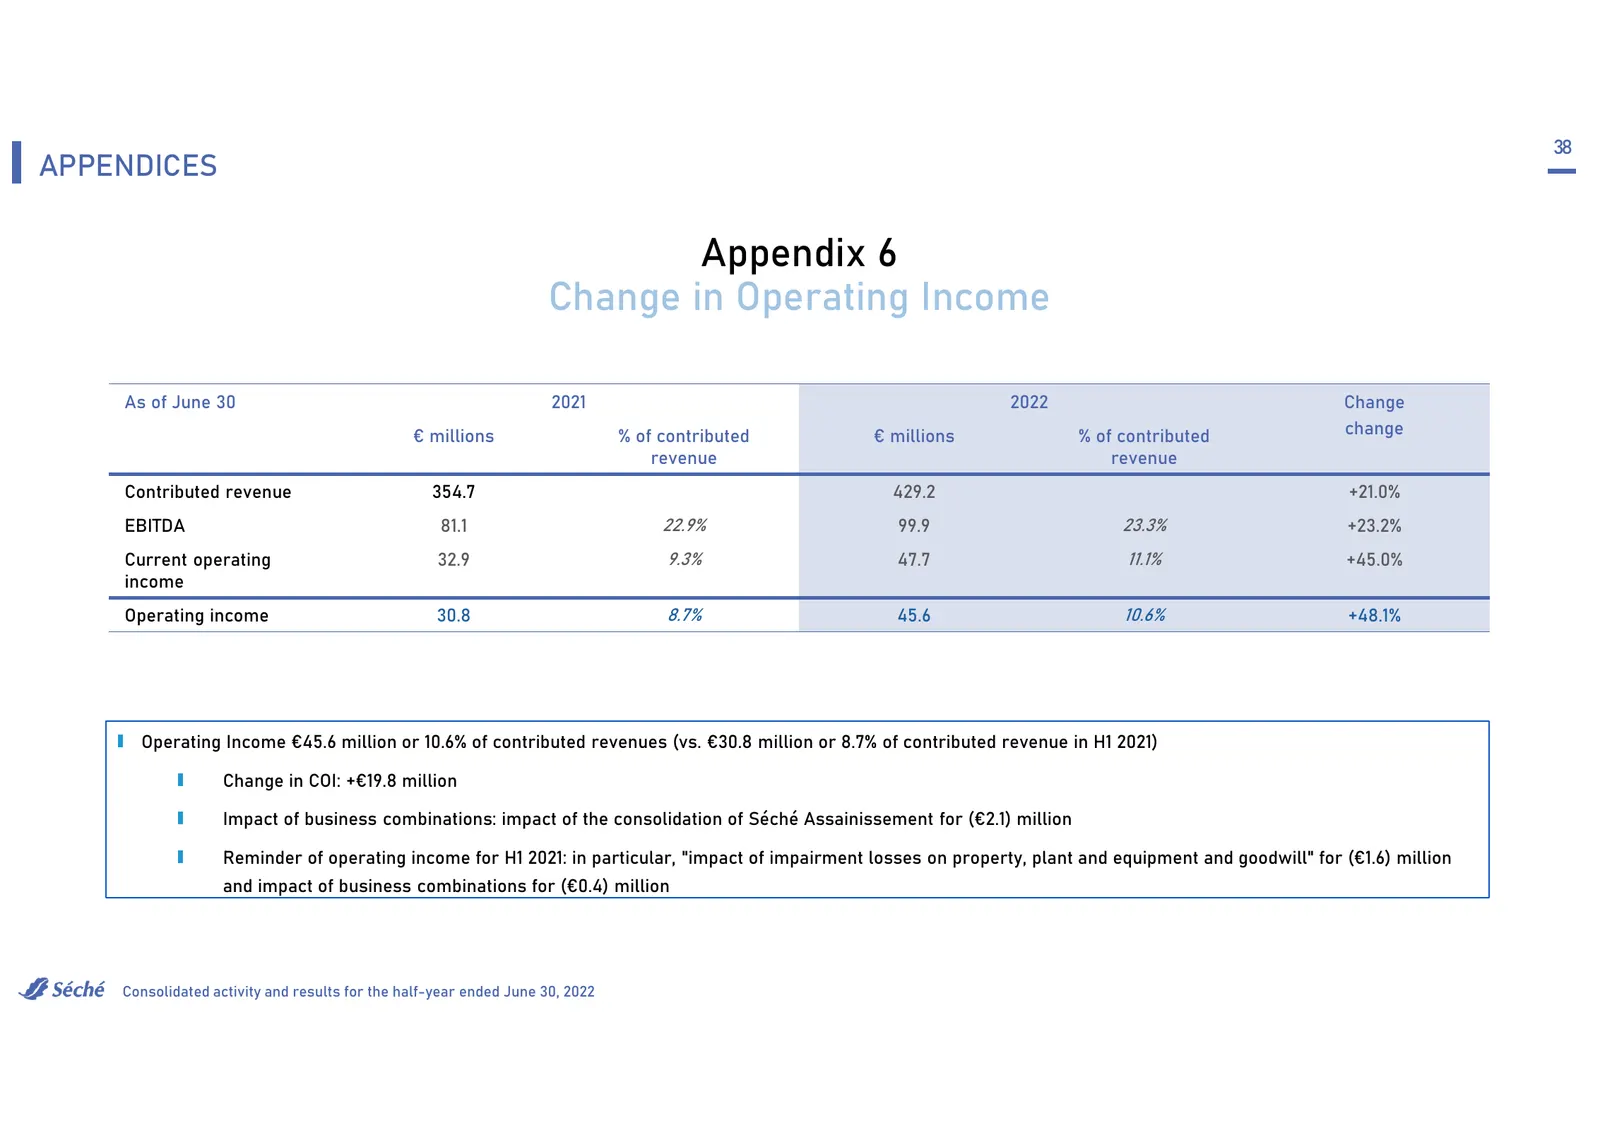
Slide 38: Change in Operating Income
38 APPENDICES Appendix 6 Change in Operating Income As of June 30 2021 2022 Change € millions % of contributed € millions % of contributed change revenue revenue Contributed revenue 354.7 429.2 +21.0% EBITDA 81.1 22.9% 99.9 23.3% +23.2% Current operating 32.9 9.3% 47.7 11.1% +45.0% income Operating
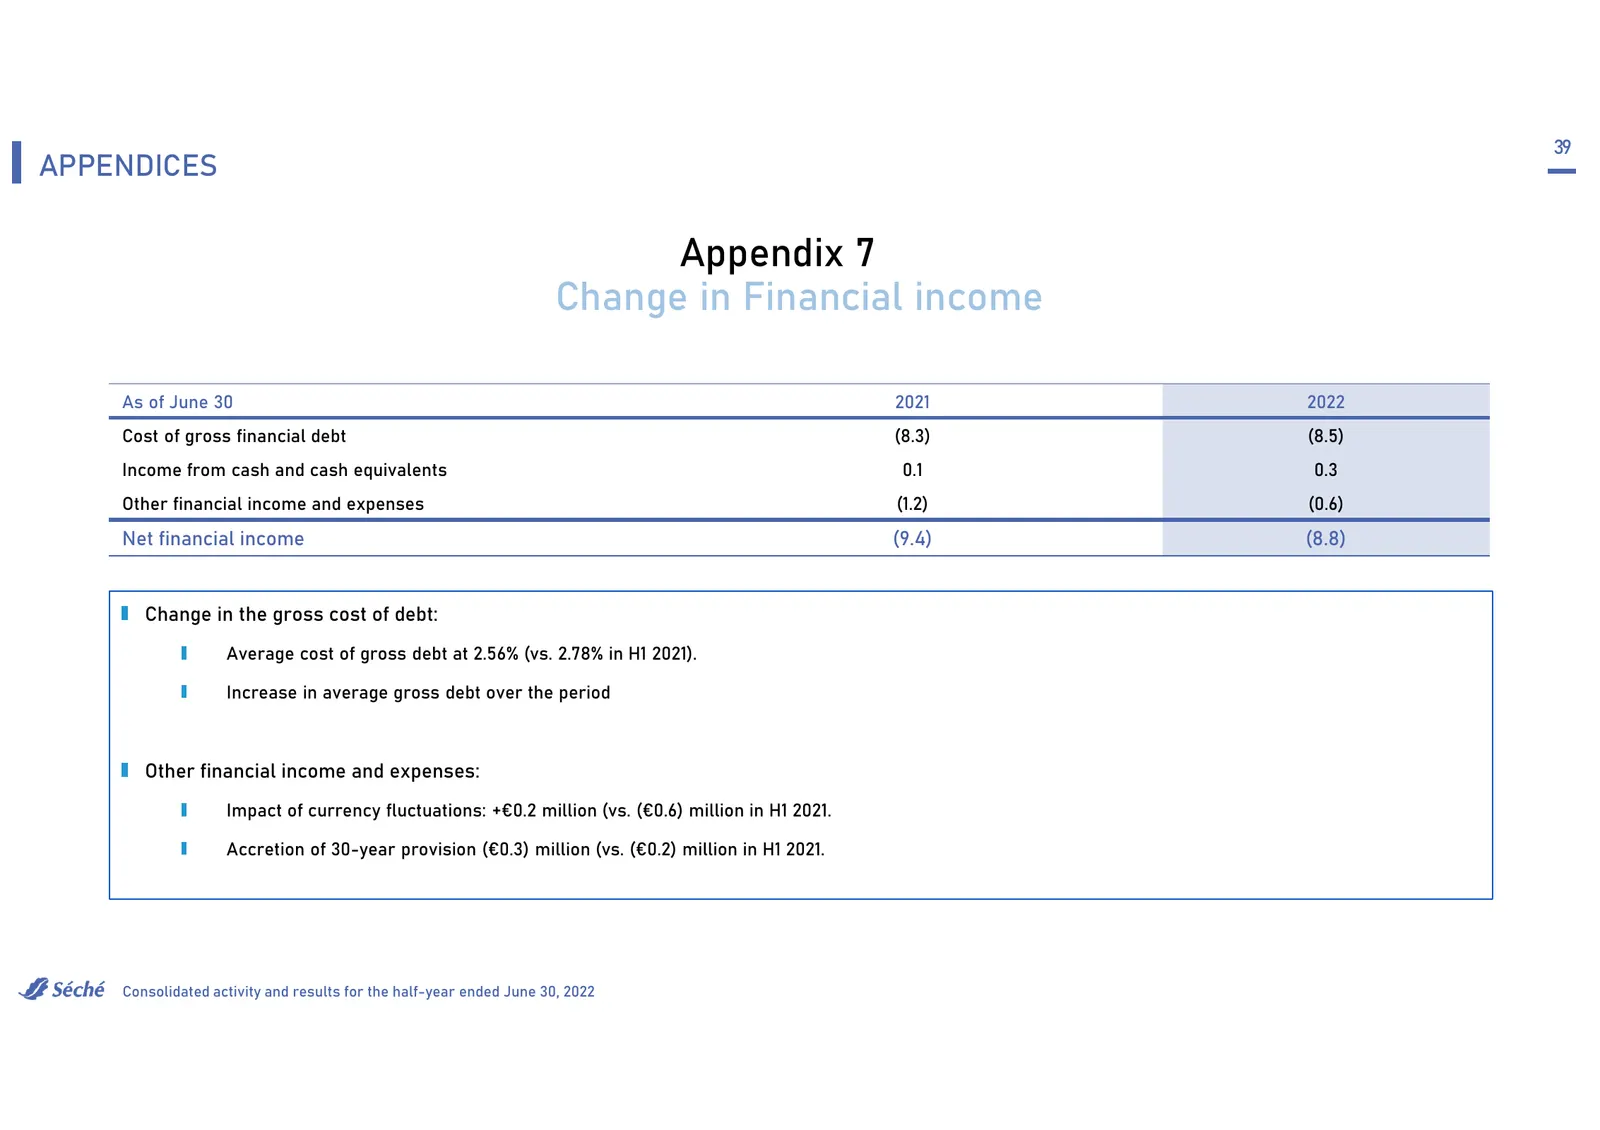
Slide 39: Change in Financial income
39 APPENDICES Appendix 7 Change in Financial income As of June 30 2021 2022 Cost of gross financial debt (8.3) (8.5) Income from cash and cash equivalents 0.1 0.3 Other financial income and expenses (1.2) (0.6) Net financial income (9.4) (8.8) Change in the gross cost of debt: Average cost of gross
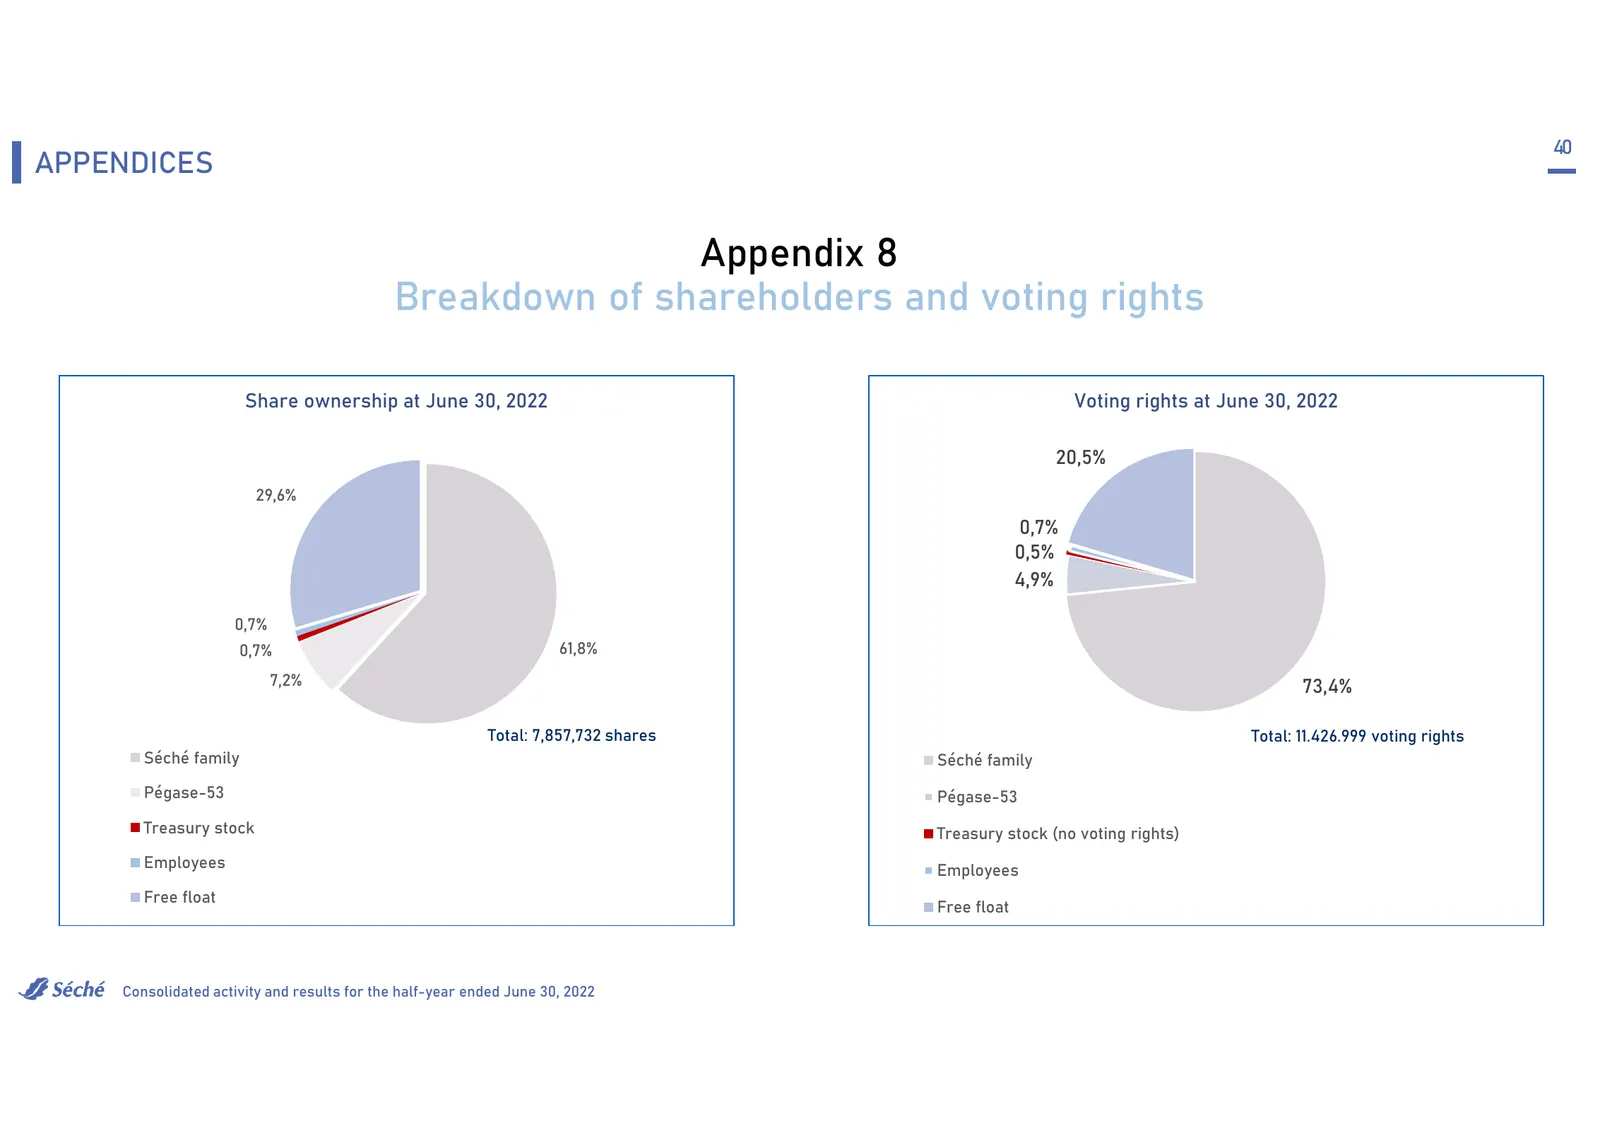
Slide 40: Breakdown of shareholders and voting rights
40 APPENDICES Appendix 8 Breakdown of shareholders and voting rights Share ownership at June 30, 2022 Voting rights at June 30, 2022 20,5% 29,6% 0,7% 0,5% 4,9% 0,7% 0,7% 61,8% 7,2% 73,4% Total: 7,857,732 shares Total: 11.426.999 voting rights Séché family Séché family Pégase-53 Pégase-53 Treasury st
Source: Internet Archive copy of groupe-seche.com
More decks from Seche Environnement SA
 Groupe Séché Environnement — Q3 2026 Earnings Presentation13 slides · Oct 27, 2026
 H1 2026 Earnings Presentation34 slides · Sep 9, 2026
 H1 2026 Earnings Presentation34 slides · Sep 9, 2026
 Q1 2026 Earnings Presentation10 slides · Apr 23, 2026
 FY2025 Earnings Presentation43 slides · Mar 10, 2026
 Q3 2025 Earnings Presentation13 slides · Oct 28, 2025