Stellarone — Q1 2010 Earnings Presentation
23 slides from Stellarone's earnings presentation, May 21, 2010

Slide 1: Investor Presentation First Quarter 2010
Investor Presentation First Quarter 2010 Ed Barham, President and Chief Executive Officer Jeff Farrar, Executive Vice President and Chief Financial Officer EXHIBIT 99.1

Slide 2: Forward-Looking Statements
Forward -Looking Statements • StellarOne Corporation (StellarOne) may from time to time make written or oral statements, including statements in this presentation which may constitute forward- looking statements within the meaning of Section 27A of the Securities Act of 1933, as amended, and Section
Slide 3: Corporate Profile
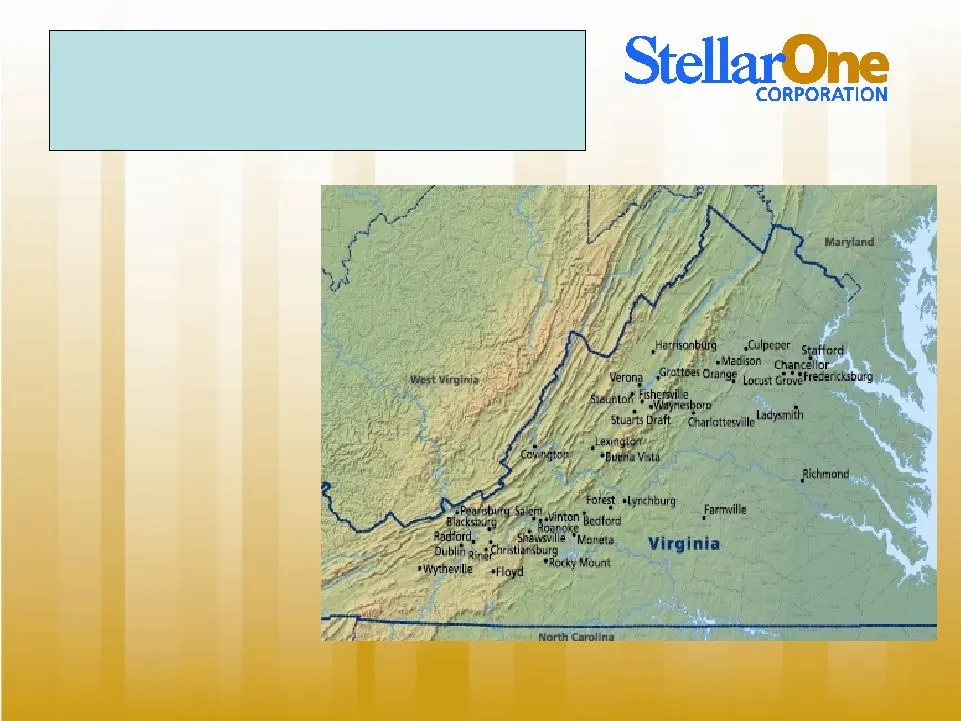
Corporate Profile • $3.0 billion bank holding company headquartered in Charlottesville, Virginia. • Legacy bank established in 1900. • Fifty-five financial centers. • Commercial and mortgage loan production office in Richmond, Virginia. • Combination of eight legacy community banks with significant
Slide 4: Strong Position In Strong Virginia Market
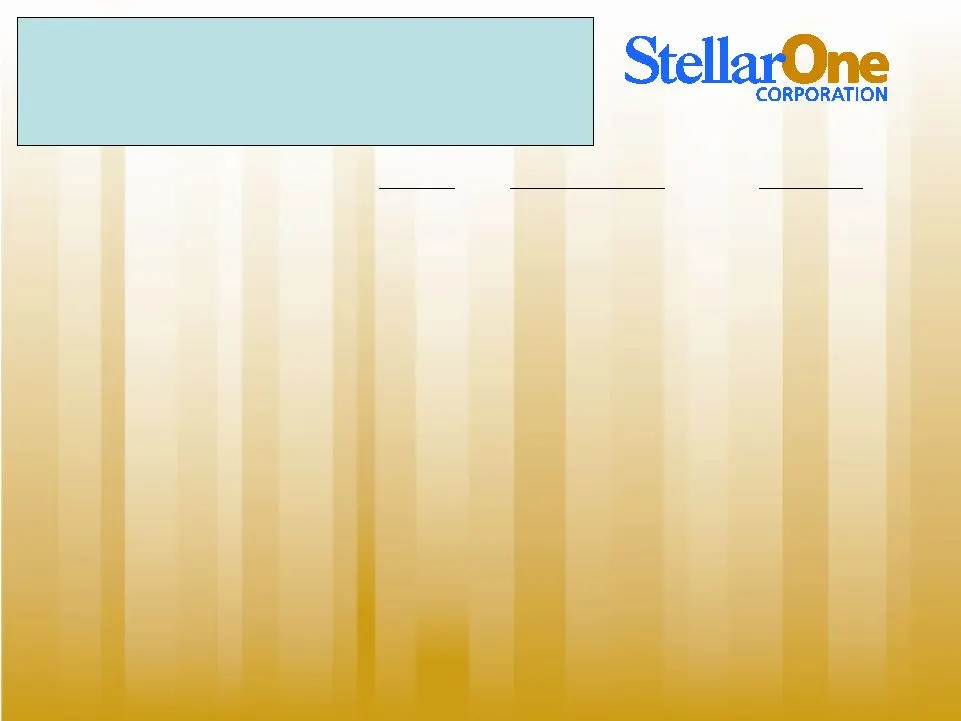
Strong Position In Strong Virginia Market 2009 Total Market Share (%) 2009 Total Deposits in Market ($M) 2009 Number of Branches Source: SNL Financial 16.73% $25,666 Bank Wells Fargo (CA) 13.32% 20,427 Bank Capital One Financial (VA) 13.05% 20,014 Bank BB&T Corp. (NC) 12.10% 18,554 Bank Bank of Amer
Slide 5: Deposit Franchise
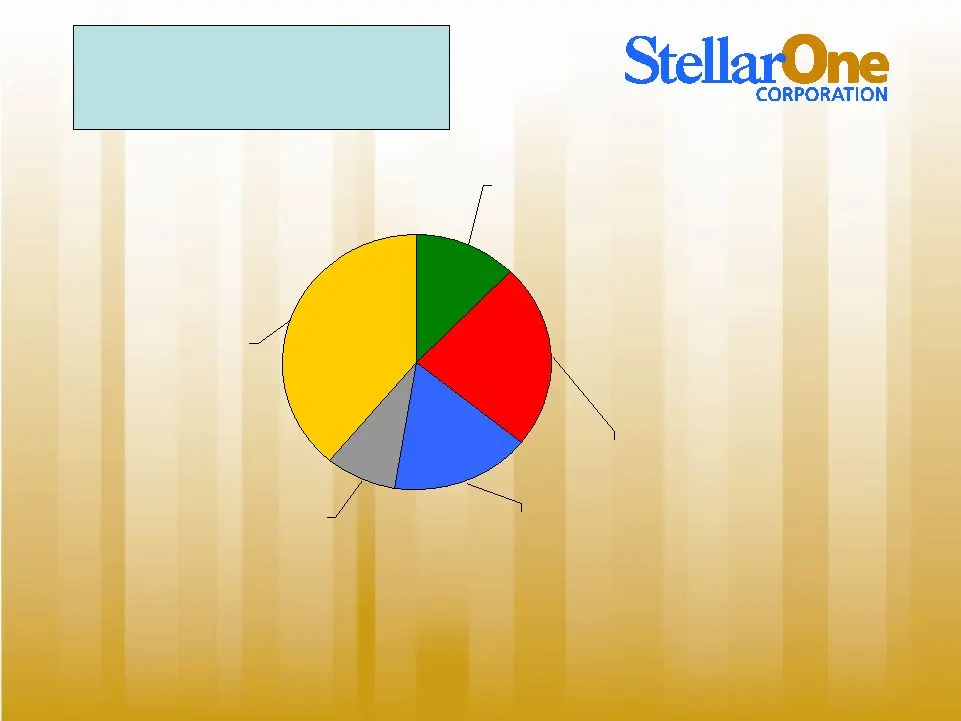
Deposit Franchise Total Deposits: Total Deposits: $2.41 billion $2.41 billion Note: Deposit composition as of March 31, 2010 NOW – 23% MMDA – 17% Savings – 9% Time Deposits – 39% Non-interest bearing – 12%
Slide 6: Merger of Equals - Strategy for Growth
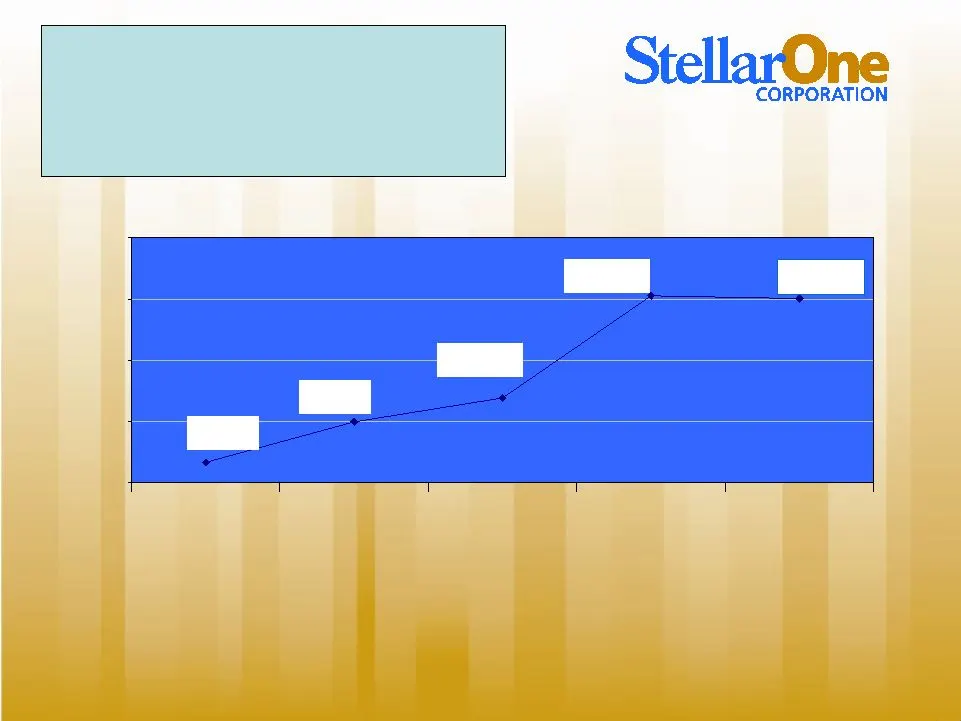
$3,050,000 $1,387,000 $985,000 $325,000 $3,003,000 $0 $1,000,000 $2,000,000 $3,000,000 $4,000,000 1998 MOE with Virginia Heartland Bank 2001 MOE with Virginia Financial Corporation 2003 Purchase of Eight First VA Branches 2008 MOE with FNB Corporation Current Merger of Equals - Strategy for Growth (
Slide 7: Fiduciary, Brokerage and Wealth Management AUM
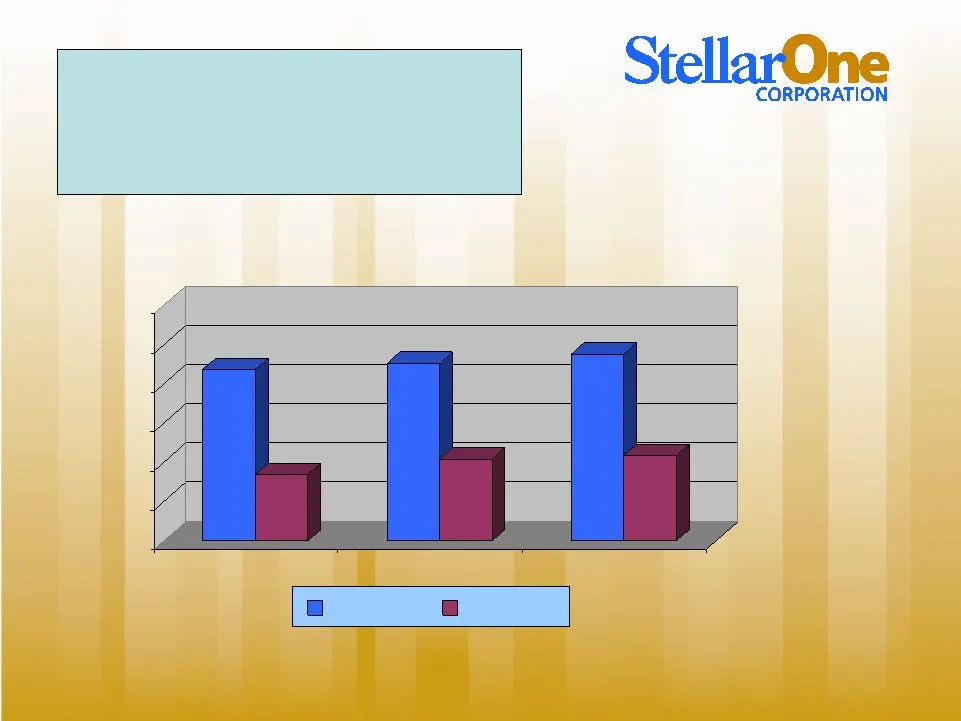
$437,134 $170,175 $452,616 $209,075 $476,509 $218,501 $0 $100,000 $200,000 $300,000 $400,000 $500,000 $600,000 2008 2009 1Q 2010 Fiduciary Brokerage Wealth Management (AUM) (Dollars in thousands)
Slide 8: Common Equity
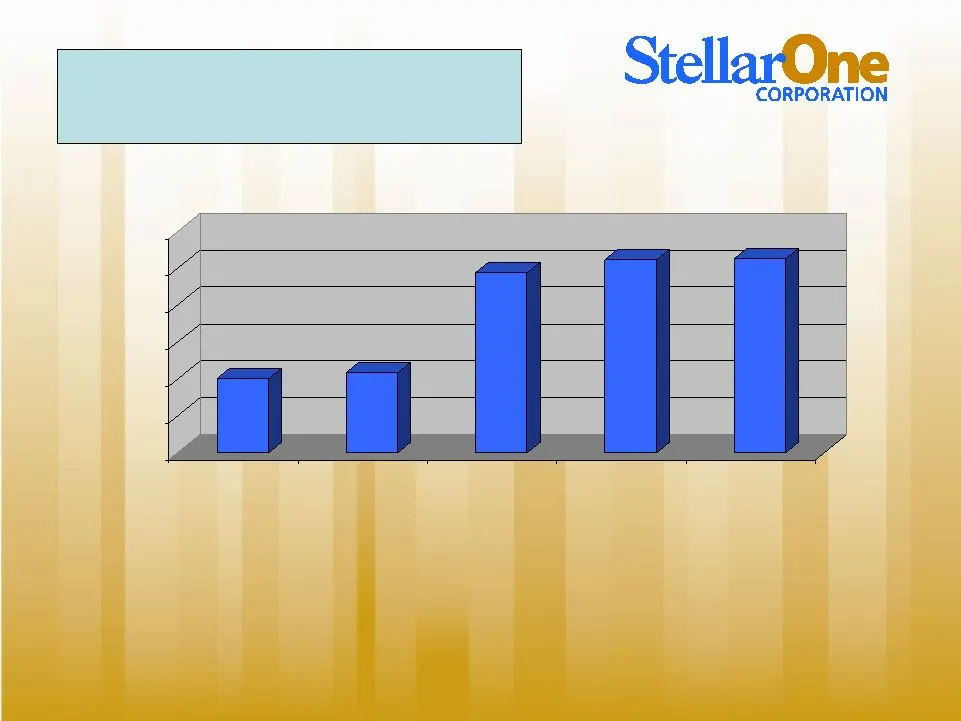
$150,652 $162,768 $364,785 $392,387 $394,006 $0 $75,000 $150,000 $225,000 $300,000 $375,000 $450,000 2006 2007 2008 2009 1Q 2010 Common Equity (Dollars in thousands)
Slide 9: Tangible Book Value per Common Share
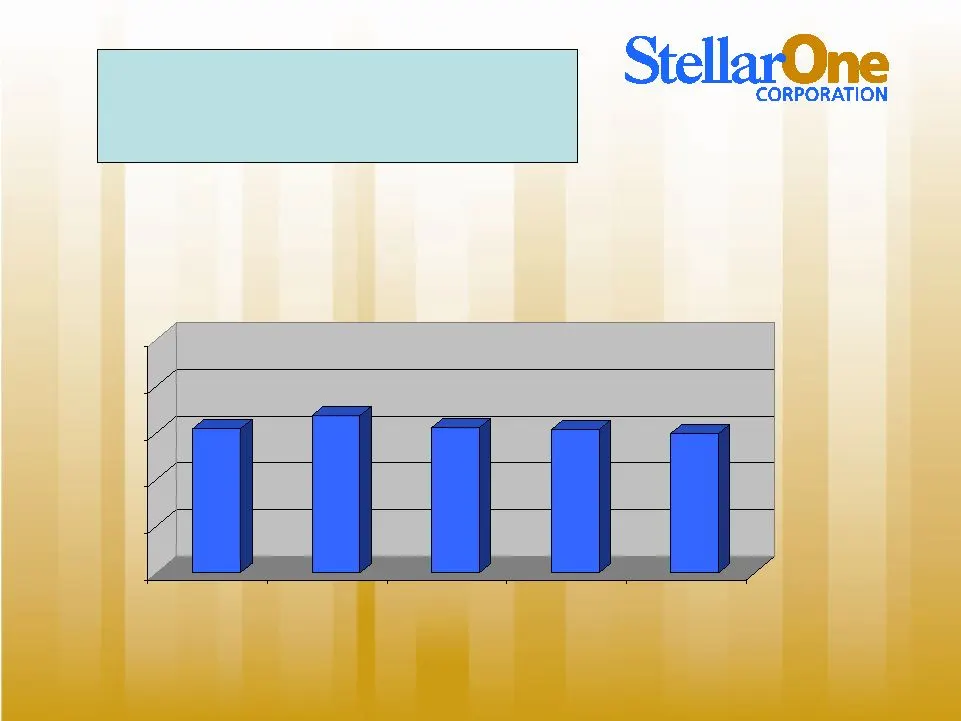
$12.32 $13.49 $12.47 $12.30 $11.94 $0.00 $4.00 $8.00 $12.00 $16.00 $20.00 2006 2007 2008 2009 1Q - 2010 Tangible Book Value per Common Share
Slide 10: Capital Ratios
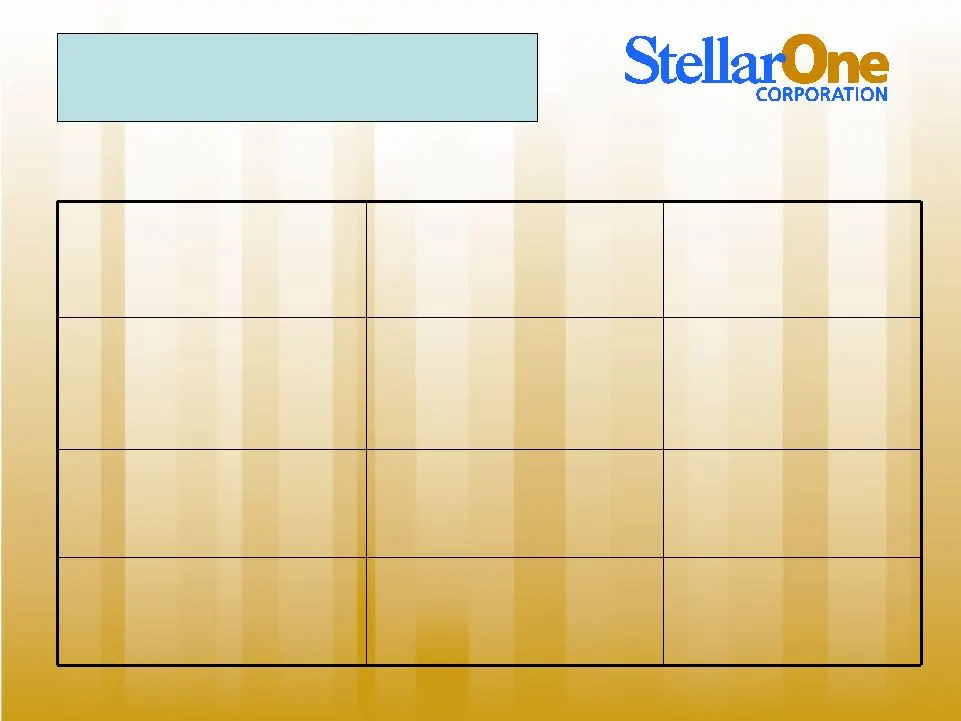
Capital Ratios StellarOne Peer Median Tier 1 Risk-based Capital to Risk Adjusted Assets 13.67% 13.21% Tangible Equity to Tangible Assets 10.45% 8.31% Total Equity to Total Assets 14.07% 10.40%
Slide 11: Loan Diversification
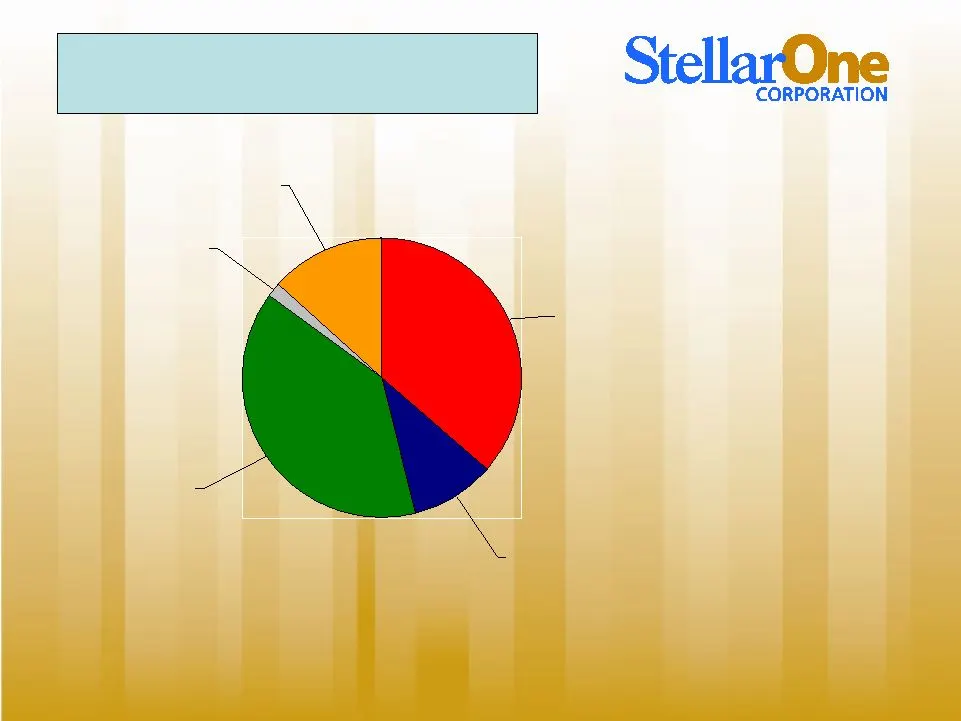
Loan Diversification Commercial and Industrial 10% Commercial R/E 39% Consumer 2% Const. & Development 13% 1-4 Family R/E 36% Gross Loans: Gross Loans: $2.16 billion $2.16 billion Loan/Deposit Ratio: Loan/Deposit Ratio: 89.7% 89.7% Note: Loan composition as of March 31, 2010
Slide 12: Asset Quality
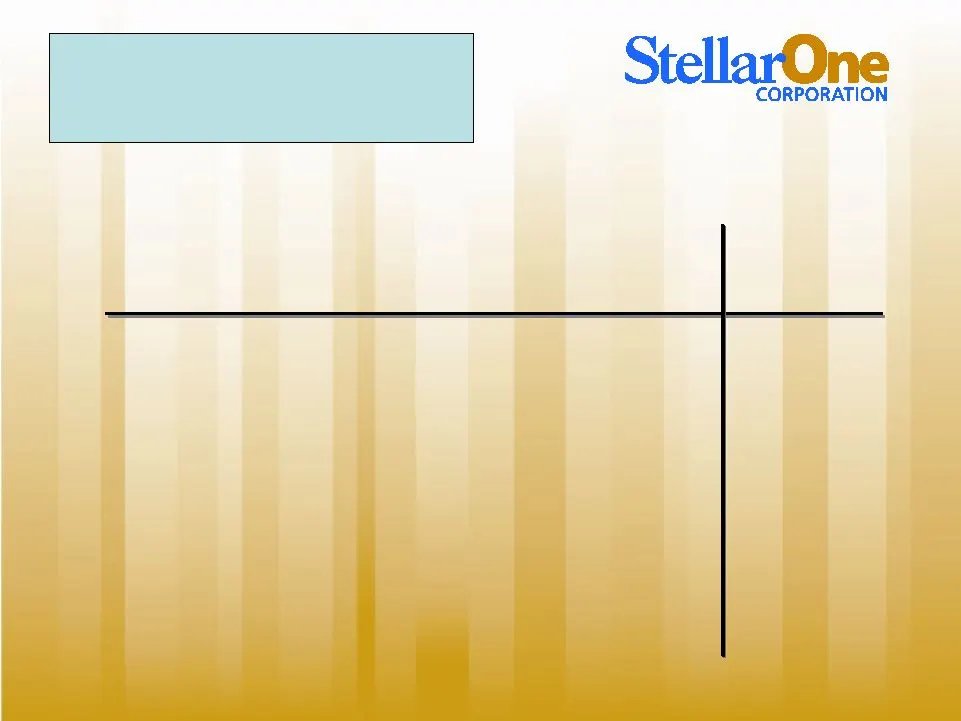
2006 2007 2008 2009 2010 1st Qtr. Non-Performing Assets / Total Assets 0.19% 0.44% 1.66% 2.18% 2.07% Net Charge-offs / Average Loans (0.01)% 0.12% 0.80% 1.24% 1.13% Allowance / Loans 1.19% 1.23% 1.35% 1.84% 1.88% Asset Quality
Slide 13: Gross Non-Performing Loans - $59.2 million
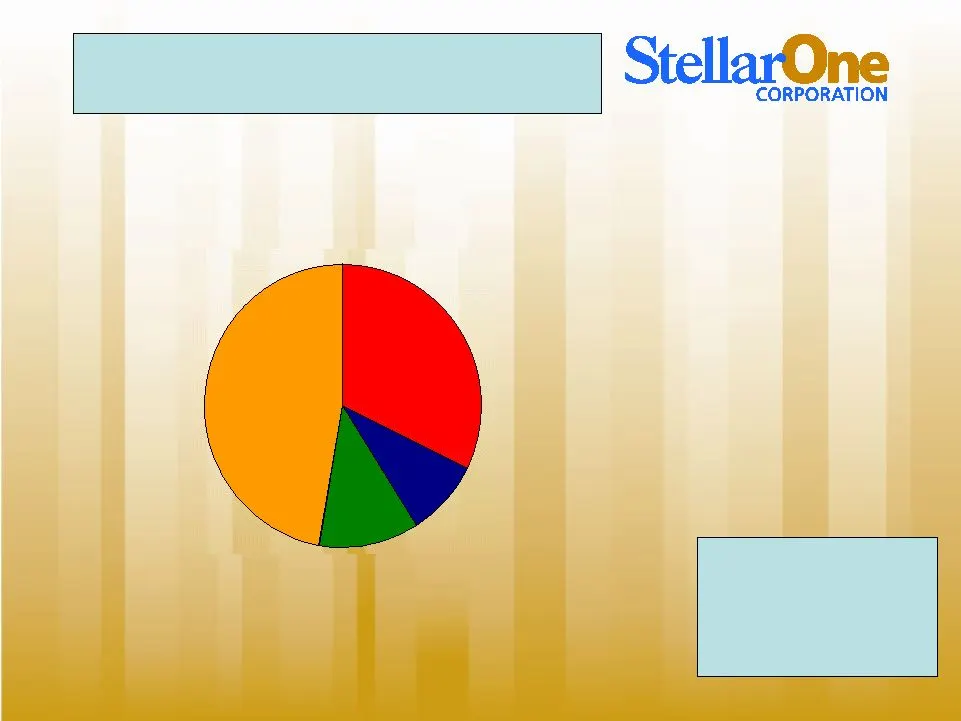
Gross Non – Performing Loans - $59.2 million or 2.74% of Gross Loans Receivable Gross Non – Performing Loans - $59.2 million or 2.74% of Gross Loans Receivable Non-Performing Loans (dollars in thousands) Note: Nonaccrual loan composition as of March 31, 2010 Commercial and Industrial $5,263, 9% Comm
Slide 14: Gross Non-Performing A&D Loans: $27.9 million
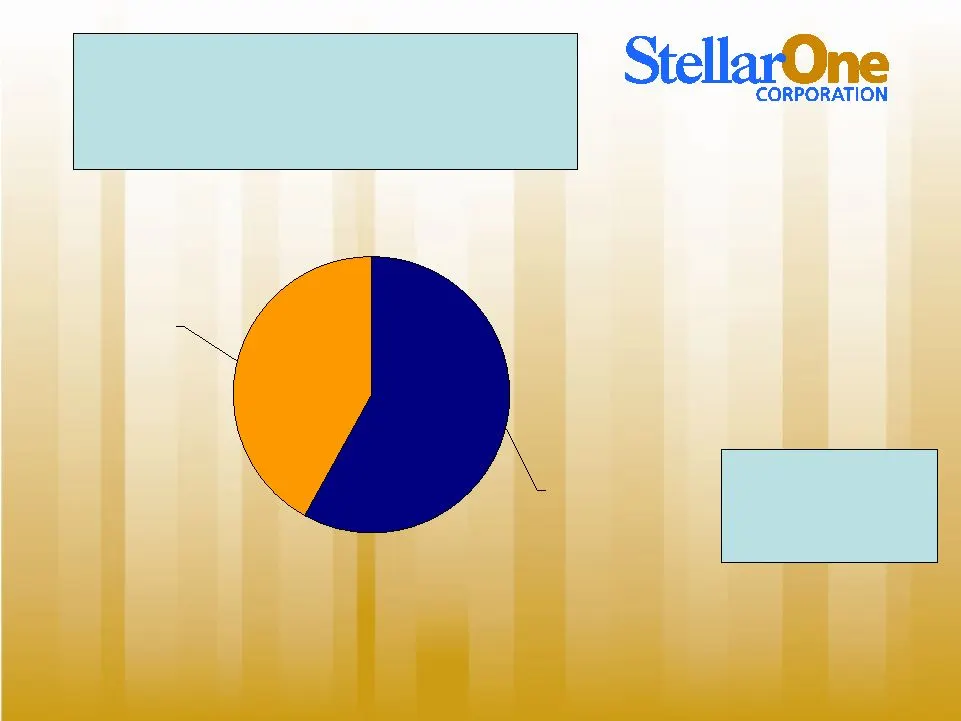
Gross Non – Performing A&D Loans: $27.9 million Non-Performing Loans – Acquisition and Development Component (dollars in thousands) Nonperforming Acquistion and Development (SML) - $16.2 million Nonperforming Acquisition & Development (Exclusive of SML) - $11.7 million Gross Non – Performing A&D Loa
Slide 15: Non-Performing Assets
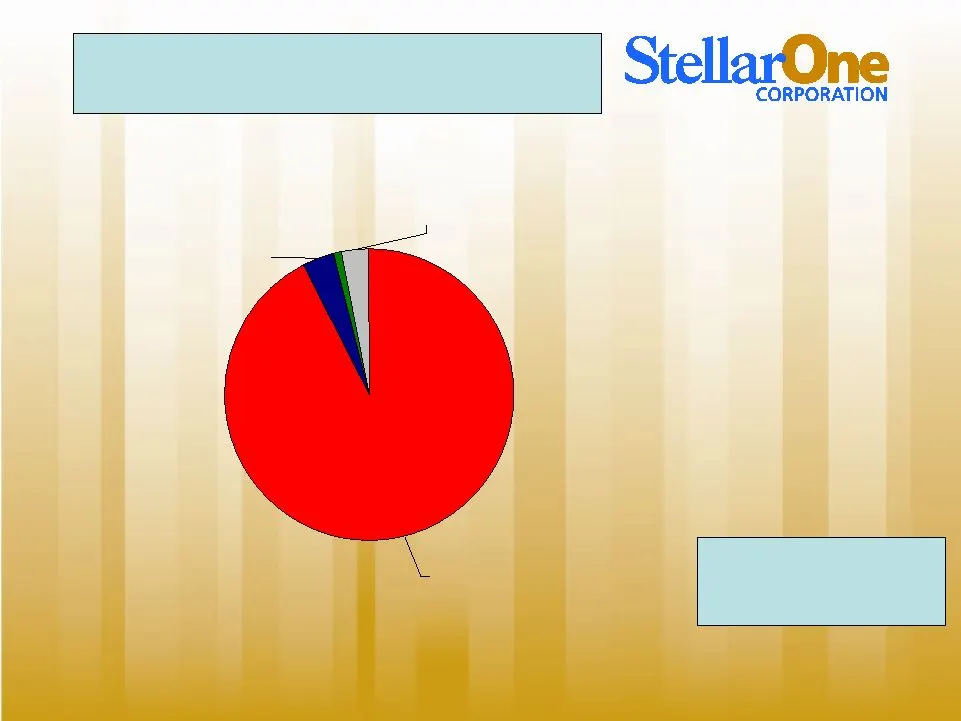
Non-Performing Assets (dollars in thousands) OREO, $2,267 LHFS, $608 TDR's, $1,810 Nonaccrual loans, $57,343 NPA’s as a Percentage of Loans and OREO – 2.87% Note: Data as of March 31, 2010
Slide 16: Asset Quality Metrics
Asset Quality Metrics • Largest NPL’s: – $10.1 million in loans to a SML developer (mixed use property, lots and single-family dwellings). – $10.2 million residential A&D construction relationship on a highly attractive and established project (non-SML) which will likely move to OREO in 2 nd Quarter
Slide 17: First Quarter Highlights
st Quarter Highlights • Earnings improvement that exceeded consensus estimate. • Significant improvement in PTPP earnings. • Decrease in total non-performing assets for the second consecutive quarter. • Continued improvement in net interest margin for second consecutive quarter. • Improved contribut
Slide 18: PPPT Earnings by Quarter
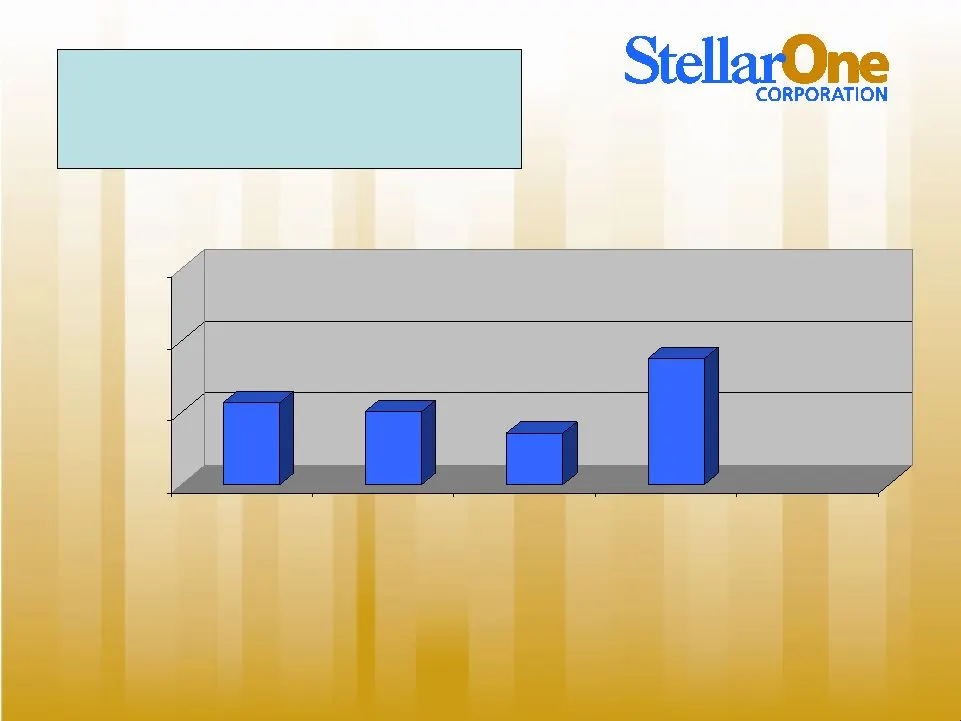
$5,689 $5,112 $3,572 $8,766 $0 $5,000 $10,000 $15,000 2Q - 2009 3Q - 2009 4Q - 2009 1Q - 2010 PPPT (Pre - provision, pre - tax) Earnings by Quarter (Dollars in thousands)
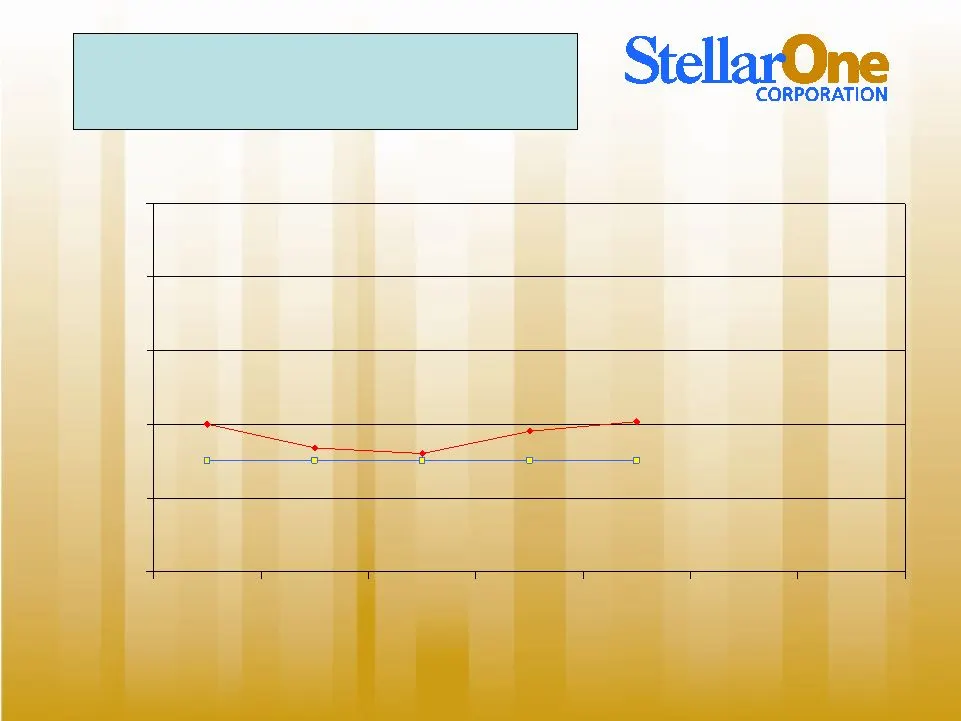
Slide 19: Net Interest Margin Versus Prime Rate
3.25% 3.25% 3.25% 3.25% 3.52% 3.45% 3.30% 3.34% 3.50% 3.25% 2.50% 3.00% 3.50% 4.00% 4.50% 5.00% 1Q 2009 2Q 2009 3Q 2009 4Q 2009 1Q 2010 Net Interest Margin Versus Prime Rate
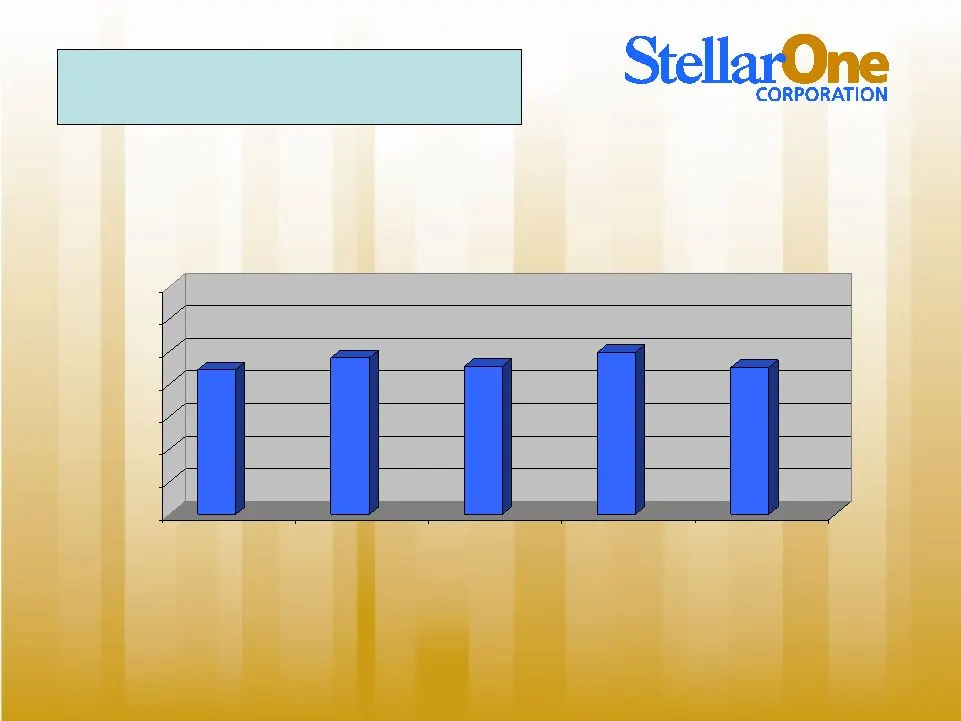
Slide 20: Overhead by Quarter
Overhead by Quarter (Dollars in thousands) $22,224 $24,057 $22,748 $24,875 $22,547 $0 $5,000 $10,000 $15,000 $20,000 $25,000 $30,000 $35,000 1Q - 2009 2Q - 2009 3Q - 2009 4Q - 2009 1Q -2010
Slide 21: Strategic Outlook
• Offense vs. defense on lending front. • Reduce NPA’s as soon as practical. • Continue initiatives to leverage overhead structure. • Accelerate growth in non-interest revenues. • Repay TARP as soon as practical. • Initiate acquisition strategy in higher growth markets. Strategic Outlook
Slide 22: Final Considerations
Final Considerations • Reliable track record for merger integration and growth. • Highly liquid and well-capitalized balance sheet with minimal intangibles when compared to peer. • Franchise sits in most stable portion of a good Virginia market. • Opportunity for growth in Richmond and Tidewater are

Slide 23: Thank you!
Investor Presentation First Quarter 2010 Thank you!
Source: SEC EDGAR · 8-K filed May 21, 2010
More decks from Stellarone Corp
 Merger or Acquisition (June 2013)17 slides · Jun 12, 2013
 Merger or Acquisition (June 2013)17 slides · Jun 10, 2013
 Shareholder Meeting (April 2010)54 slides · Apr 27, 2010
 Keefe, Bruyette & Woods Community Bank Investor Conference (July 2009)32 slides · Jul 29, 2009
 FNB Corp (VA) — Merger or Acquisition (October 2007)5 slides · Oct 2, 2007
 FNB Corp \va\ — Merger or Acquisition (August 2007)23 slides · Aug 14, 2007