Rsa Security — Investor Presentation (September 2003)
24 slides from Rsa Security's investor presentation, Sep 4, 2003
Slide 1: e-Security Solutions for Competitive Advantage
e-Security Solutions for Competitive Advantage September 4, 2003 1
Slide 2: Risk Statements
Risk Statements Various remarks that we may make about the Company's future expectations, plans and prospects constitute forward-looking statements. Actual results may differ materially from those indicated by these forward-looking statements as a result of various important factors, including those
Slide 3: Risk Statements (2 of 3)
This presentation contains forward-looking statements about RSA Security's strategy and plans for the future, as well as the potential size of the market for RSA Security's products. These statements involve a number of risks and uncertainties that could cause RSA Security's plans to change or that
Slide 4: Risk Statements (3 of 3)
pressures or quality or security failures in the products, which could make RSA Security's products obsolete or difficult to sell; changes in customer requirements, failure of the market to accept new technologies or technological changes in the computer industry, any of which could impact the size
Slide 5: Leading Supplier of Identity & Access Management Solutions
Leading Supplier of Identity & Access Management Solutions Two decades of market leadership Proven products and technologies More than 12,000 customers worldwide 1,000+ employees $232 million in FY02 revenue ? 2003 RSA Security Inc. All rights reserved 9
Slide 6: Information Security Market Segments
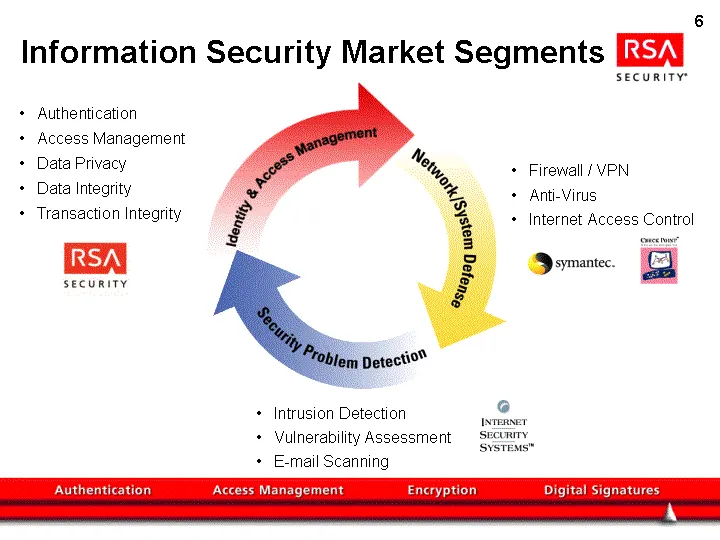
Firewall / VPN Anti-Virus Internet Access Control Intrusion Detection Vulnerability Assessment E-mail Scanning Information Security Market Segments 11 Authentication Access Management Data Privacy Data Integrity Transaction Integrity
Slide 7: RSA Security's Family of Solutions
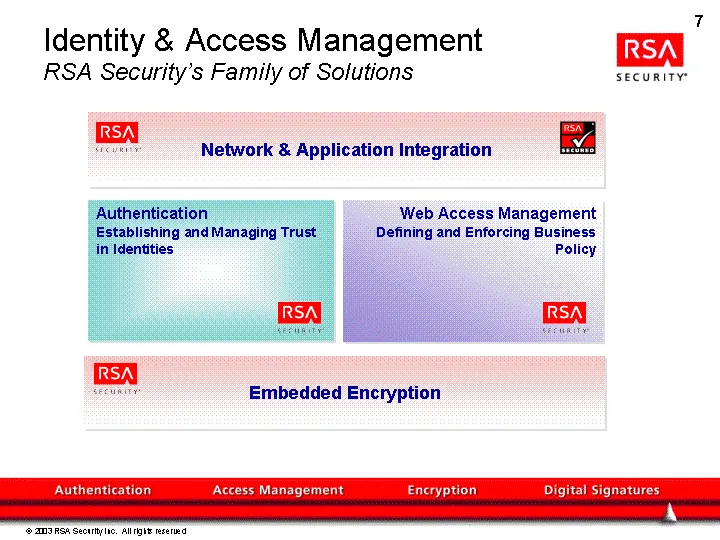
Identity & Access Management RSA Security's Family of Solutions Network & Application Integration Authentication Establishing and Managing Trust in Identities Web Access Management Defining and Enforcing Business Policy Embedded Encryption ? 2003 RSA Security Inc. All rights reserved 13
Slide 8: Advancing Business Opportunity
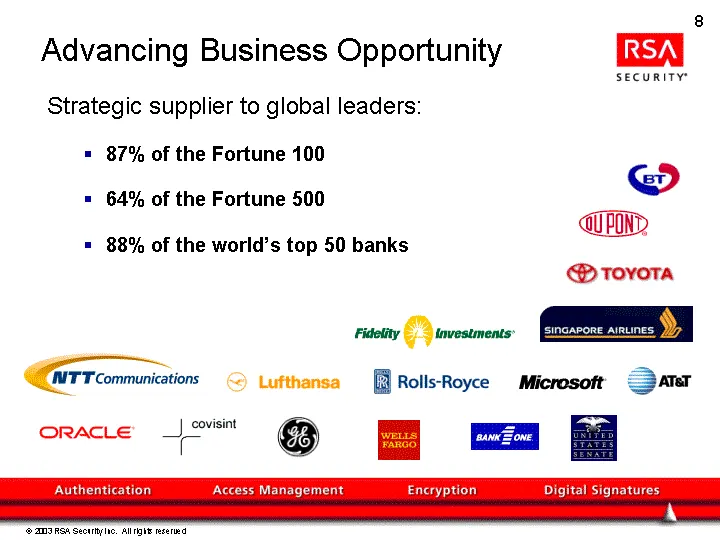
Advancing Business Opportunity Strategic supplier to global leaders: 87% of the Fortune 100 64% of the Fortune 500 88% of the world's top 50 banks ? 2003 RSA Security Inc. All rights reserved 15
Slide 9: Seamless and Transparent Solutions
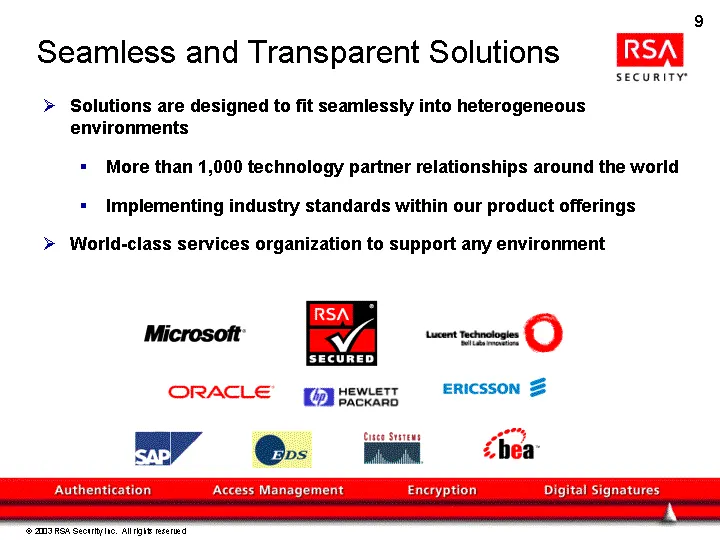
Seamless and Transparent Solutions Solutions are designed to fit seamlessly into heterogeneous environments More than 1,000 technology partner relationships around the world Implementing industry standards within our product offerings World-class services organization to support any environment ? 20
Slide 10: Proven Customer Support
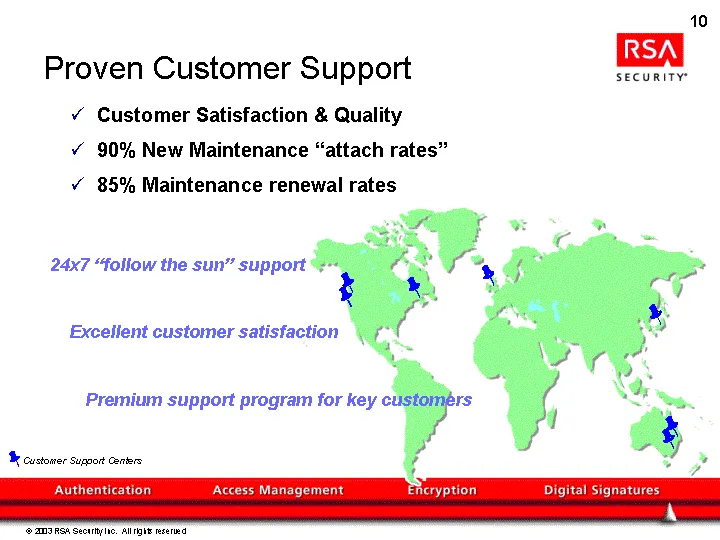
Proven Customer Support Customer Satisfaction & Quality 90% New Maintenance "attach rates" 85% Maintenance renewal rates Customer Support Centers 24x7 "follow the sun" support Excellent customer satisfaction Premium support program for key customers 19 ? 2003 RSA Security Inc. All rights reserved
Slide 11: Identity & Access Management Market Drivers
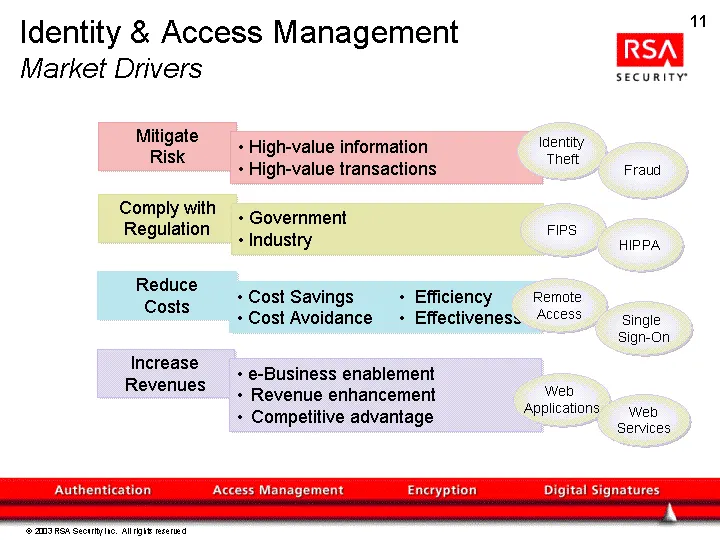
Identity & Access Management Market Drivers ? 2003 RSA Security Inc. All rights reserved Increase Revenues • e-Business enablement Revenue enhancement Competitive advantage Mitigate Risk • High-value information • High-value transactions Comply with Regulation • Government Industry Remote Access Sin
Slide 12: Traditional RSA Strong Authentication Market
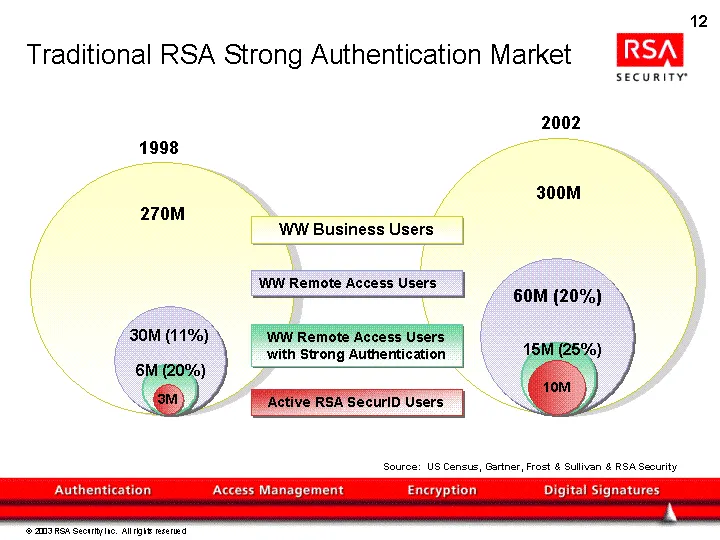
Traditional RSA Strong Authentication Market 270M 30M (11%) 6M (20%) 1998 3M 300M 60M (20%) 15M (25%) 2002 10M WW Business Users WW Remote Access Users WW Remote Access Users with Strong Authentication Active RSA SecurID Users Source: US Census, Gartner, Frost & Sullivan & RSA Security 23 ? 2003 RSA
Slide 13: Identity Management Evolution
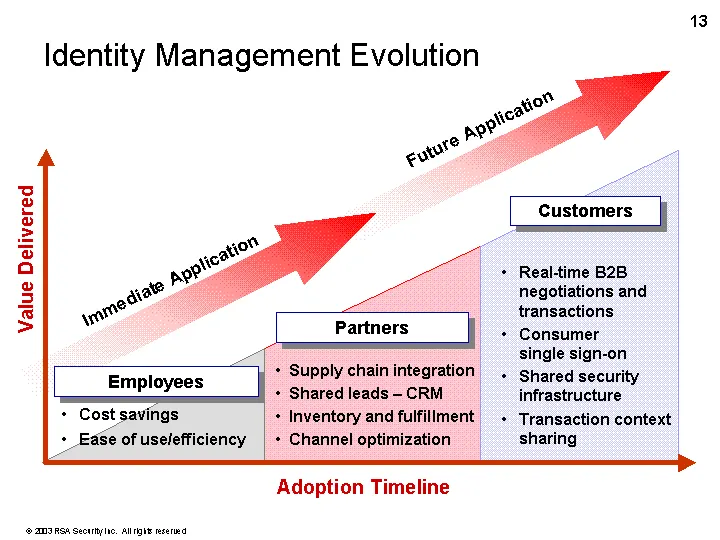
Identity Management Evolution Value Delivered Adoption Timeline Supply chain integration Shared leads - CRM Inventory and fulfillment Channel optimization Real-time B2B negotiations and transactions Consumer single sign-on Shared security infrastructure Transaction context sharing Cost savings Ease
Slide 14: A View of the Future
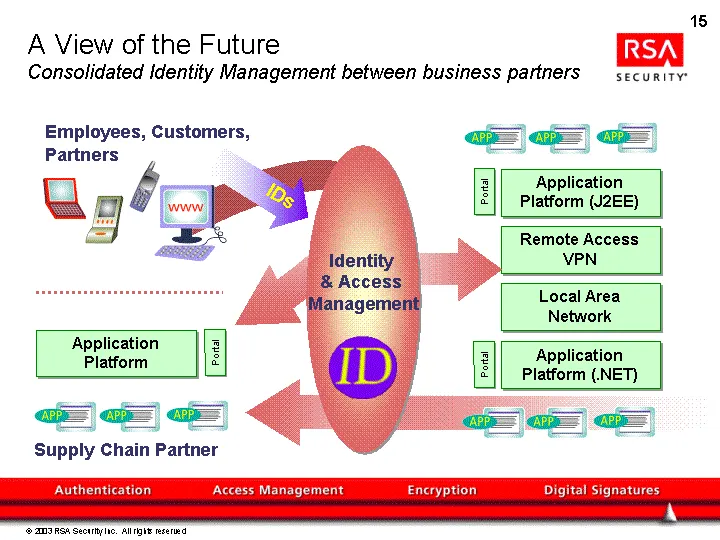
Portal Supply Chain Partner Application Platform (J2EE) Remote Access VPN Local Area Network Application Platform (.NET) A View of the Future Consolidated Identity Management between business partners Portal Application Platform Employees, Customers, Partners Portal ? 2003 RSA Security Inc. All righ
Slide 15: Our Competitive Advantage
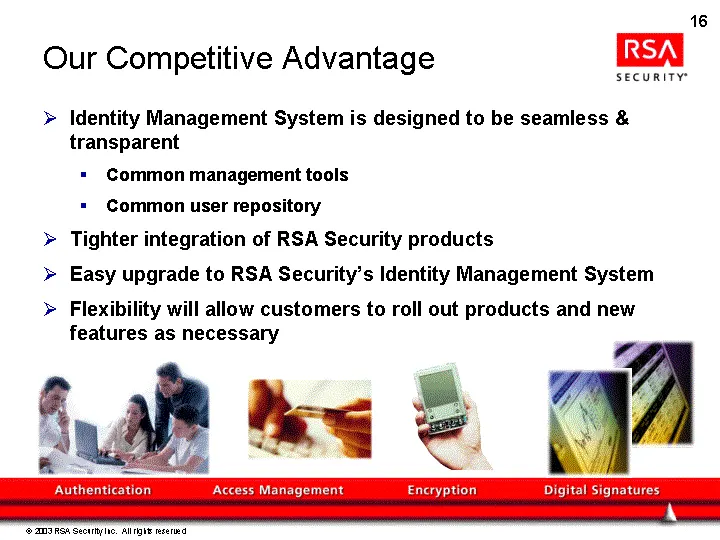
Our Competitive Advantage Identity Management System is designed to be seamless & transparent Common management tools Common user repository Tighter integration of RSA Security products Easy upgrade to RSA Security's Identity Management System Flexibility will allow customers to roll out products an
Slide 16: Diverse Vertical Markets
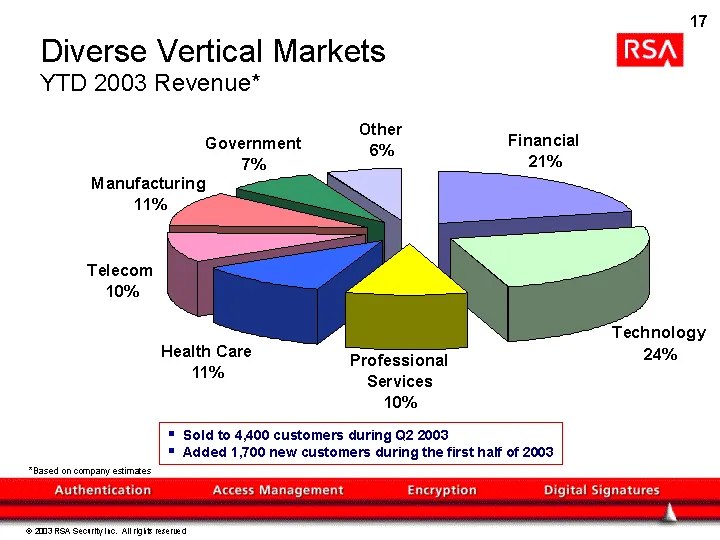
? 2003 RSA Security Inc. All rights reserved Sold to 4,400 customers during Q2 2003 Added 1,700 new customers during the first half of 2003 *Based on company estimates 33 Diverse Vertical Markets YTD 2003 Revenue*
Slide 17: Near-Term Strategic Objectives
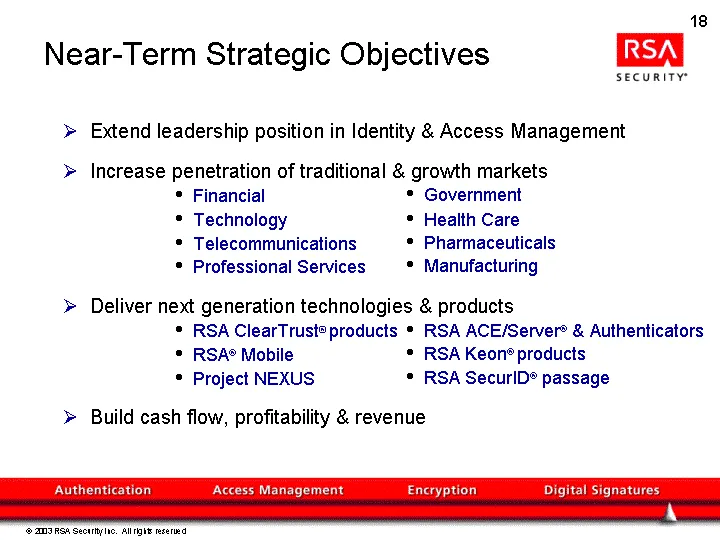
Extend leadership position in Identity & Access Management Increase penetration of traditional & growth markets Financial Technology Telecommunications Professional Services Deliver next generation technologies & products RSA ClearTrust(r) products RSA(r) Mobile Project NEXUS Build cash flow, profit
Slide 18: Financial Performance
SECURITY" Financial Performance
Slide 19: Q2 2003 Financial Highlights
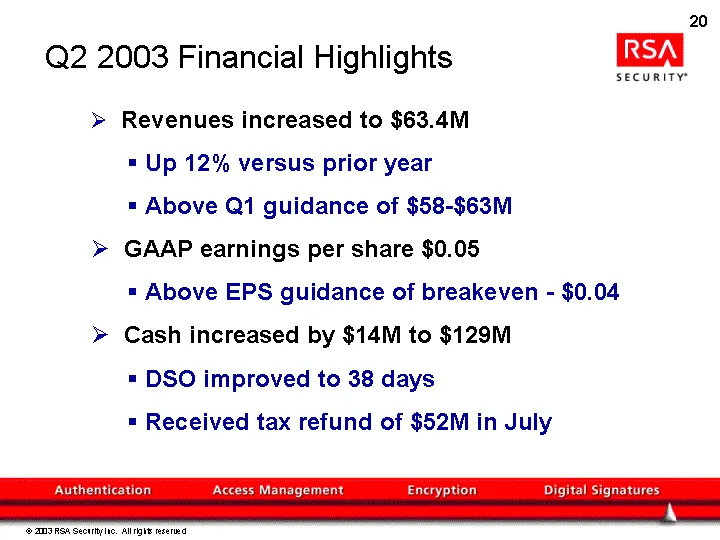
Q2 2003 Financial Highlights Revenues increased to $63.4M Up 12% versus prior year Above Q1 guidance of $58-$63M GAAP earnings per share $0.05 Above EPS guidance of breakeven - $0.04 Cash increased by $14M to $129M DSO improved to 38 days Received tax refund of $52M in July ? 2003 RSA Security Inc.
Slide 20: Revenue Trends Q1 2002-Q2 2003
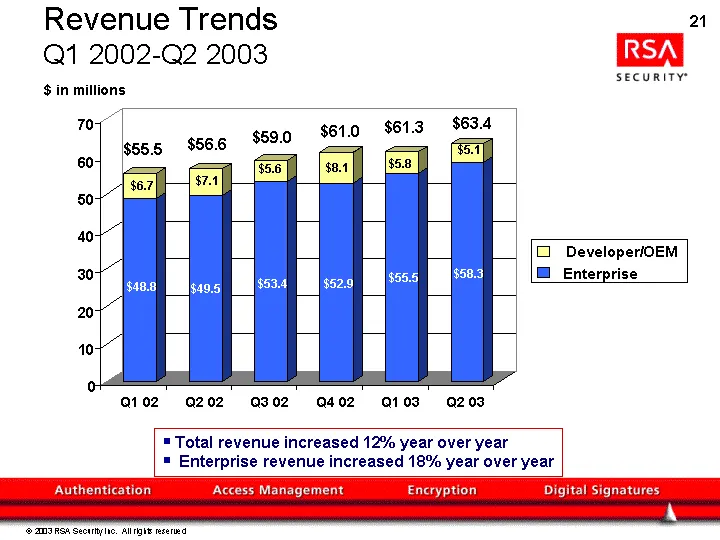
Revenue Trends Q1 2002-Q2 2003 $ in millions Total revenue increased 12% year over year Enterprise revenue increased 18% year over year ? 2003 RSA Security Inc. All rights reserved $48.8 $6.7 $49.5 $7.1 $53.4 $5.6 $52.9 $8.1 $55.5 $5.8 $58.3 $5.1 0 10 20 30 40 50 60 70 Q1 02 Q2 02 Q3 02 Q4 02 Q1 03
Slide 21: Revenue Mix - Q2 2003
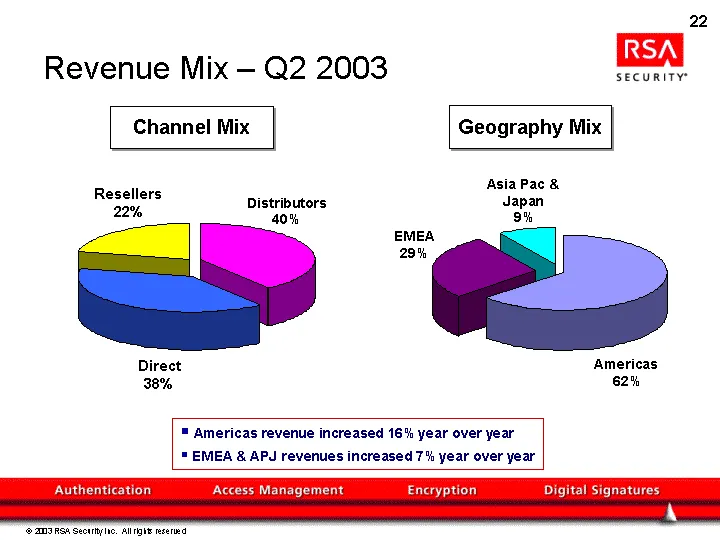
Revenue Mix - Q2 2003 Geography Mix Americas revenue increased 16% year over year EMEA & APJ revenues increased 7% year over year Americas 62% EMEA 29% Asia Pac & Japan 9% Direct 38% Distributors 40% Resellers 22% Channel Mix 43 ? 2003 RSA Security Inc. All rights reserved
Slide 22: Financial Results - Balance Sheet Summary
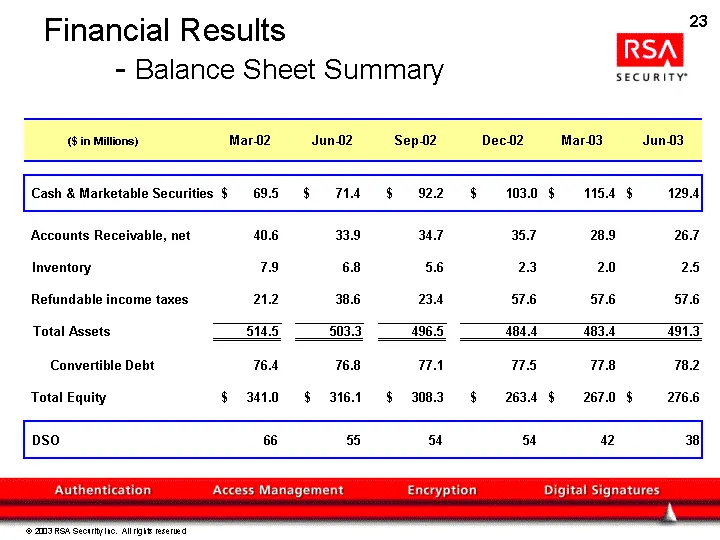
Financial Results - Balance Sheet Summary ($ in Millions) Mar-02 Jun-02 Sep-02 Dec-02 Mar-03 Jun-03 Cash & Marketable Securities 69.5 $ 71.4 $ 92.2 $ 103.0 $ 115.4 $ 129.4 $ Accounts Receivable, net 40.6 33.9 34.7 35.7 28.9 26.7 Inventory 7.9 6.8 5.6 2.3 2.0 2.5 Refundable income taxes 21.2 38.6 23.
Slide 23: Financial Performance - P&L % of Revenue
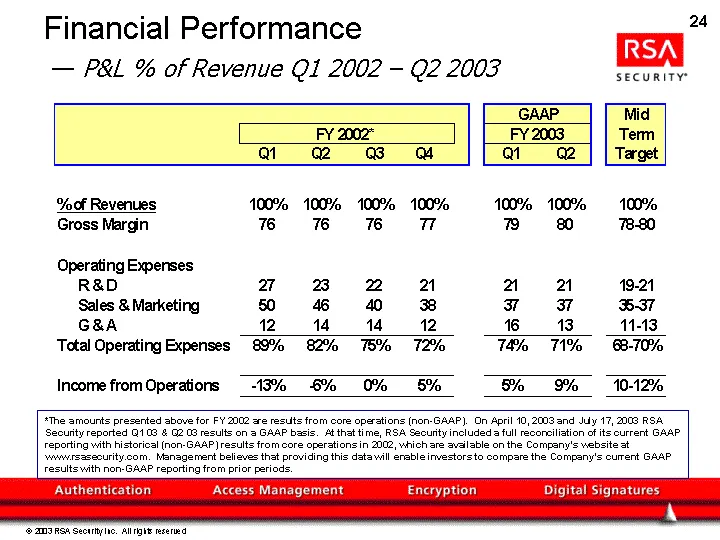
Financial Performance - P&L % of Revenue Q1 2002 - Q2 2003 *The amounts presented above for FY 2002 are results from core operations (non-GAAP). On April 10, 2003 and July 17, 2003 RSA Security reported Q1 03 & Q2 03 results on a GAAP basis. At that time, RSA Security included a full reconciliation
Slide 24: Investment Summary
Investment Summary Expanding IT security market Market leadership position Proven products and technology Large and expanding customer base Building profitability and cash flow Building Shareholder Value and Confidence ? 2003 RSA Security Inc. All rights reserved 49
Source: SEC EDGAR · 8-K filed Sep 4, 2003
More decks from Rsa Security Inc
 Merger or Acquisition (June 2006)29 slides · Jun 30, 2006
 Investor Presentation (May 2006)31 slides · May 10, 2006
 Investor Presentation (December 2005)19 slides · Dec 9, 2005
 Investor Presentation (November 2005)23 slides · Nov 3, 2005
 Investor Presentation (July 2005)18 slides · Jul 29, 2005
 Investor Presentation (April 2005)24 slides · Apr 28, 2005