Dun & Bradstreet Holdings Inc.
Dun & Bradstreet — Q3 2023 Earnings Presentation
13 slides from Dun & Bradstreet's earnings presentation, Nov 1, 2023
Slide 1: Third Quarter 2023 Financial Results
Restricted Confidential November 1, 2023 Third Quarter 2023 Financial Results
Slide 2: Disclaimer
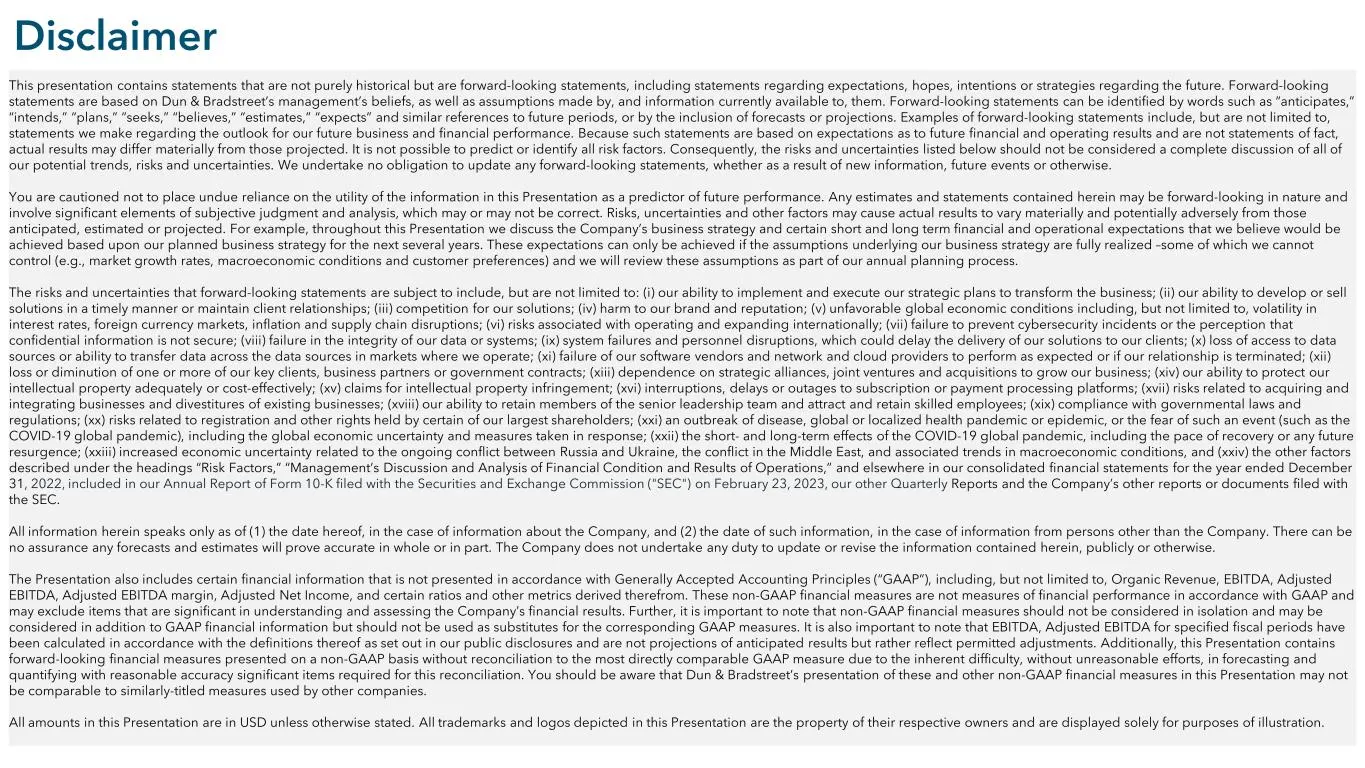
Restricted Confidential Disclaimer This presentation contains statements that are not purely historical but are forward-looking statements, including statements regarding expectations, hopes, intentions or strategies regarding the future. Forward-looking statements are based on Dun & Bradstreet’s ma
Slide 3: Financial Highlights (GAAP)
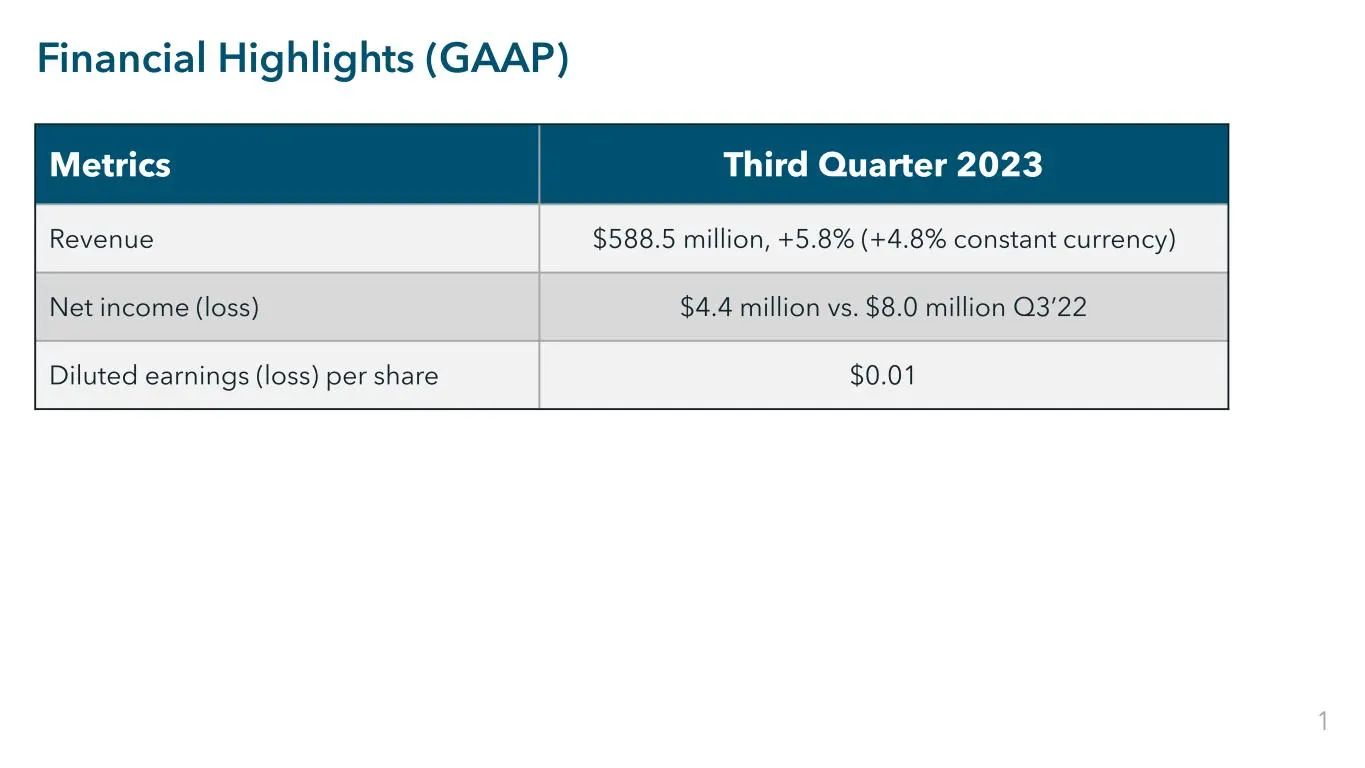
Restricted Confidential Financial Highlights (GAAP) Metrics Third Quarter 2023 Revenue $588.5 million, +5.8% (+4.8% constant currency) Net income (loss) $4.4 million vs. $8.0 million Q3’22 Diluted earnings (loss) per share $0.01 1
Slide 4: Financial Highlights (Non-GAAP)
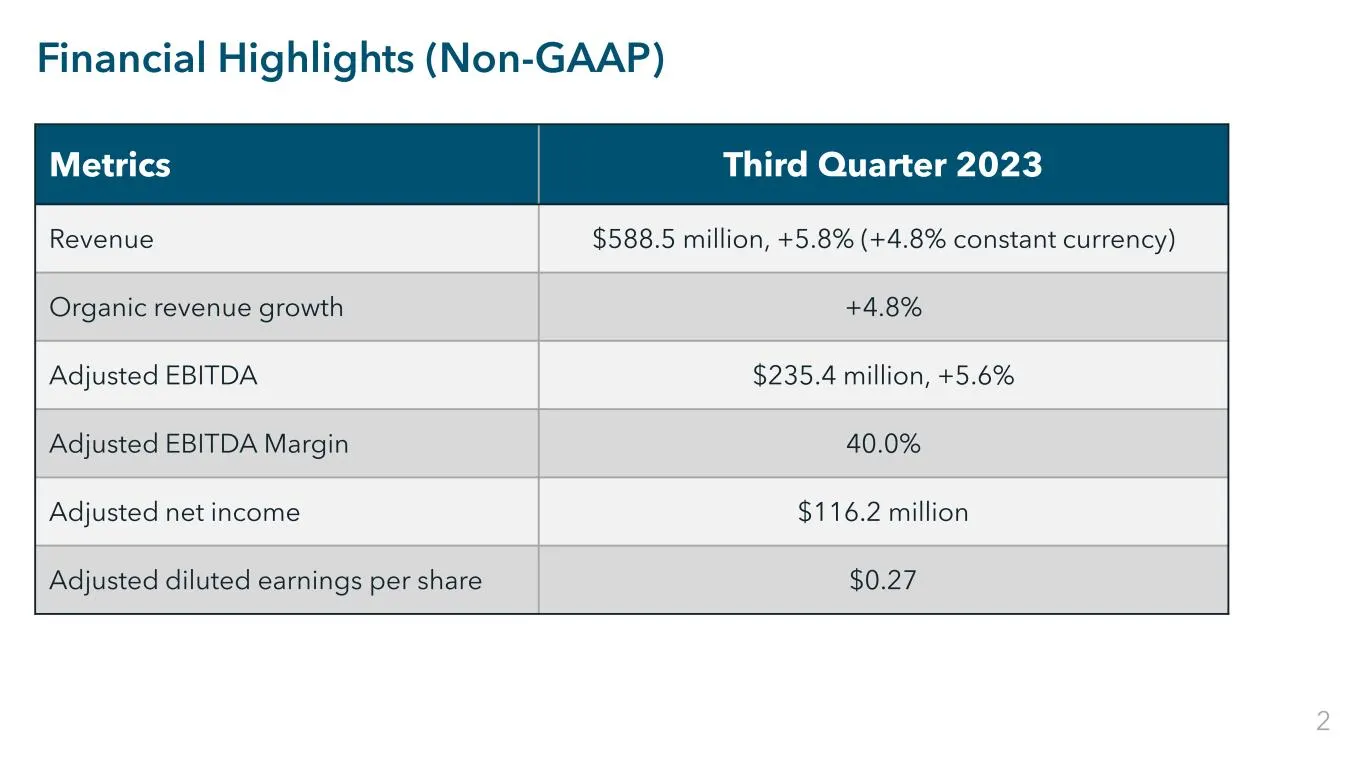
Restricted Confidential Financial Highlights (Non-GAAP) Metrics Third Quarter 2023 Revenue $588.5 million, +5.8% (+4.8% constant currency) Organic revenue growth +4.8% Adjusted EBITDA $235.4 million, +5.6% Adjusted EBITDA Margin 40.0% Adjusted net income $116.2 million Adjusted diluted earnings per
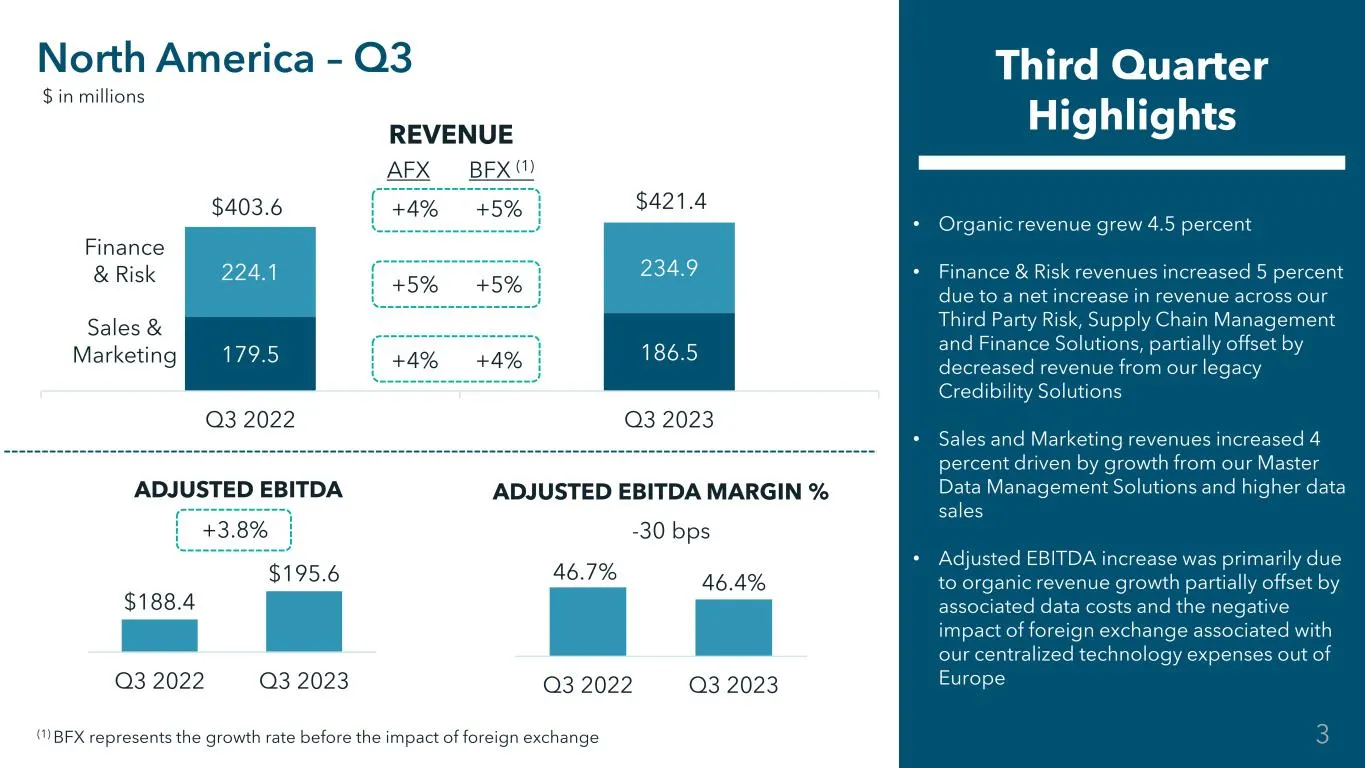
Slide 5: North America – Q3 Third Quarter Highlights
Restricted Confidential 179.5 186.5 224.1 234.9 Q3 2022 Q3 2023 +4% +5% +5% +5% +4% +4% • Organic revenue grew 4.5 percent • Finance & Risk revenues increased 5 percent due to a net increase in revenue across our Third Party Risk, Supply Chain Management and Finance Solutions, partially offset by de
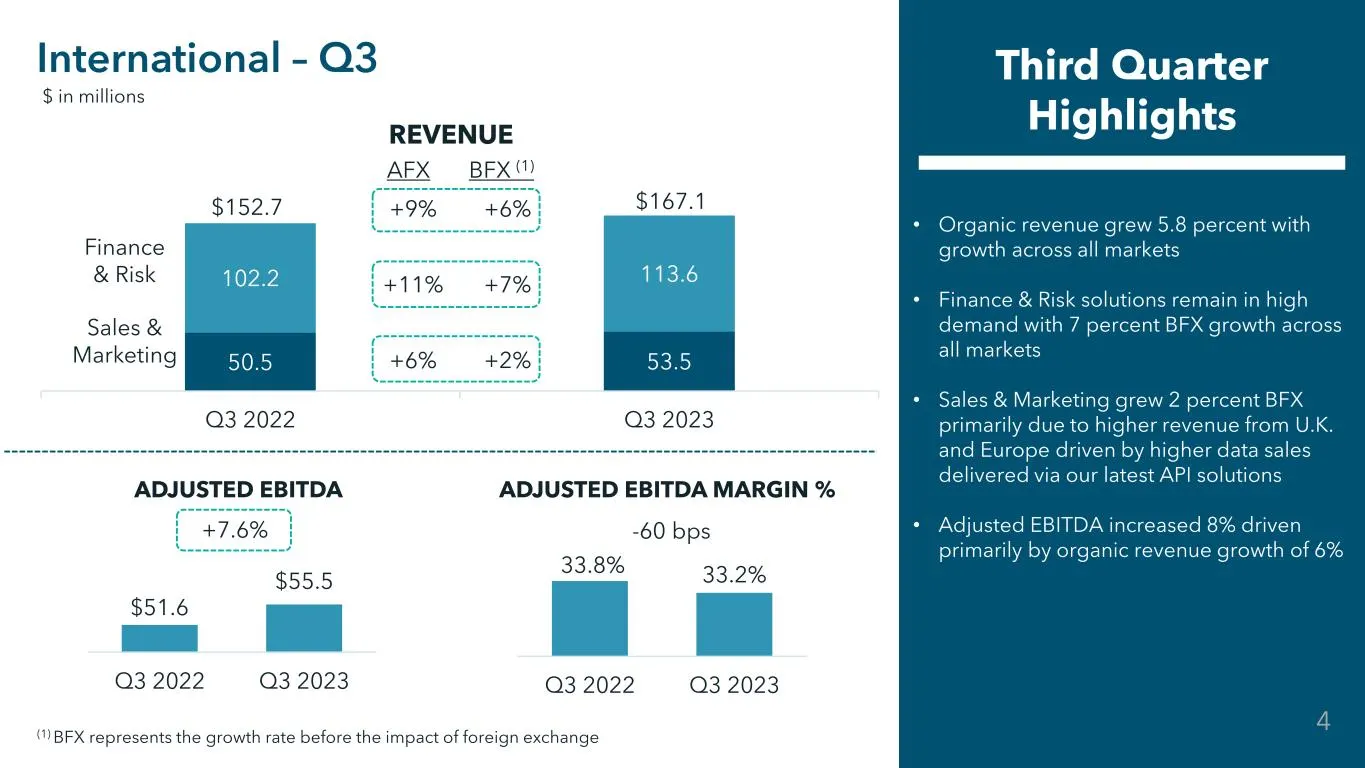
Slide 6: International – Q3 Third Quarter Highlights
Restricted Confidential 50.5 53.5 102.2 113.6 Q3 2022 Q3 2023 +9% +6% +11% +7% +6% +2% • Organic revenue grew 5.8 percent with growth across all markets • Finance & Risk solutions remain in high demand with 7 percent BFX growth across all markets • Sales & Marketing grew 2 percent BFX primarily due
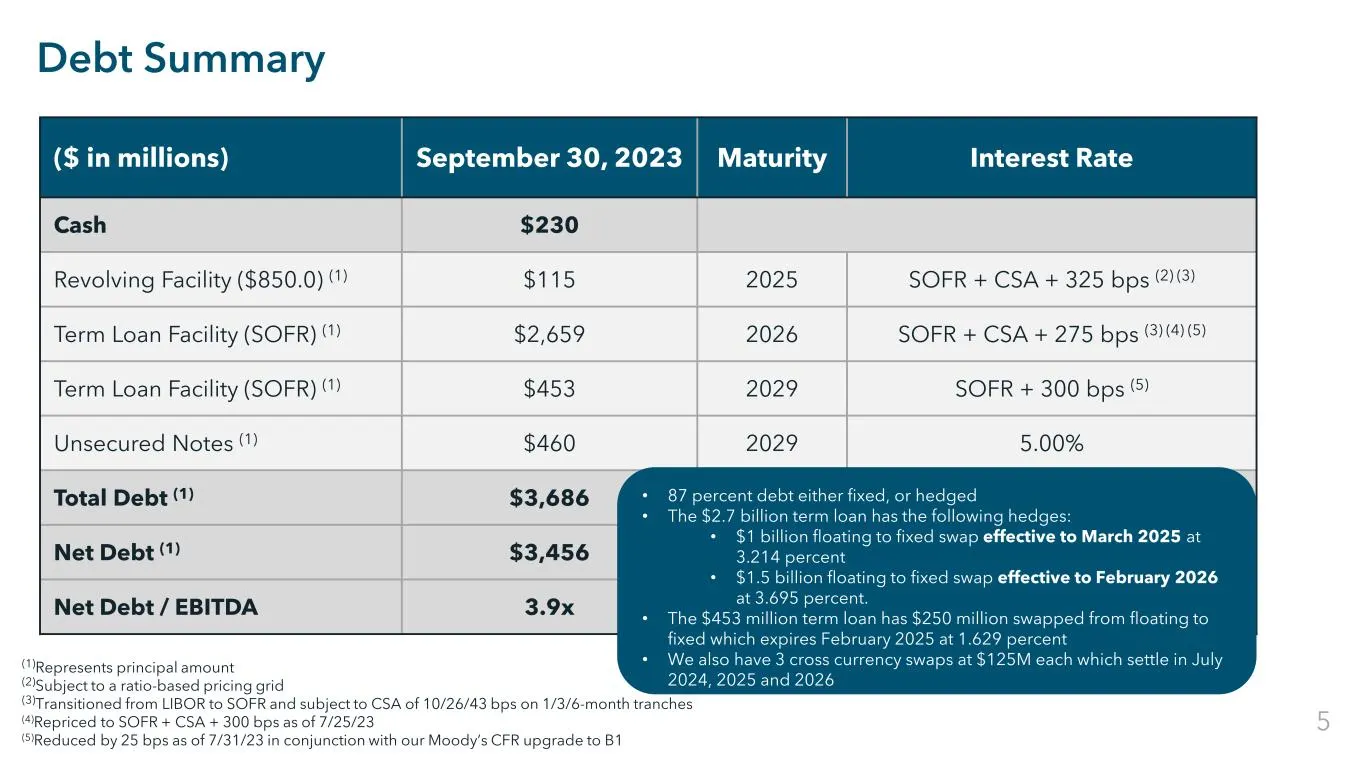
Slide 7: Debt Summary
Restricted Confidential Debt Summary ($ in millions) September 30, 2023 Maturity Interest Rate Cash $230 Revolving Facility ($850.0) (1) $115 2025 SOFR + CSA + 325 bps (2) (3) Term Loan Facility (SOFR) (1) $2,659 2026 SOFR + CSA + 275 bps (3) (4) (5) Term Loan Facility (SOFR) (1) $453 2029 SOFR + 30
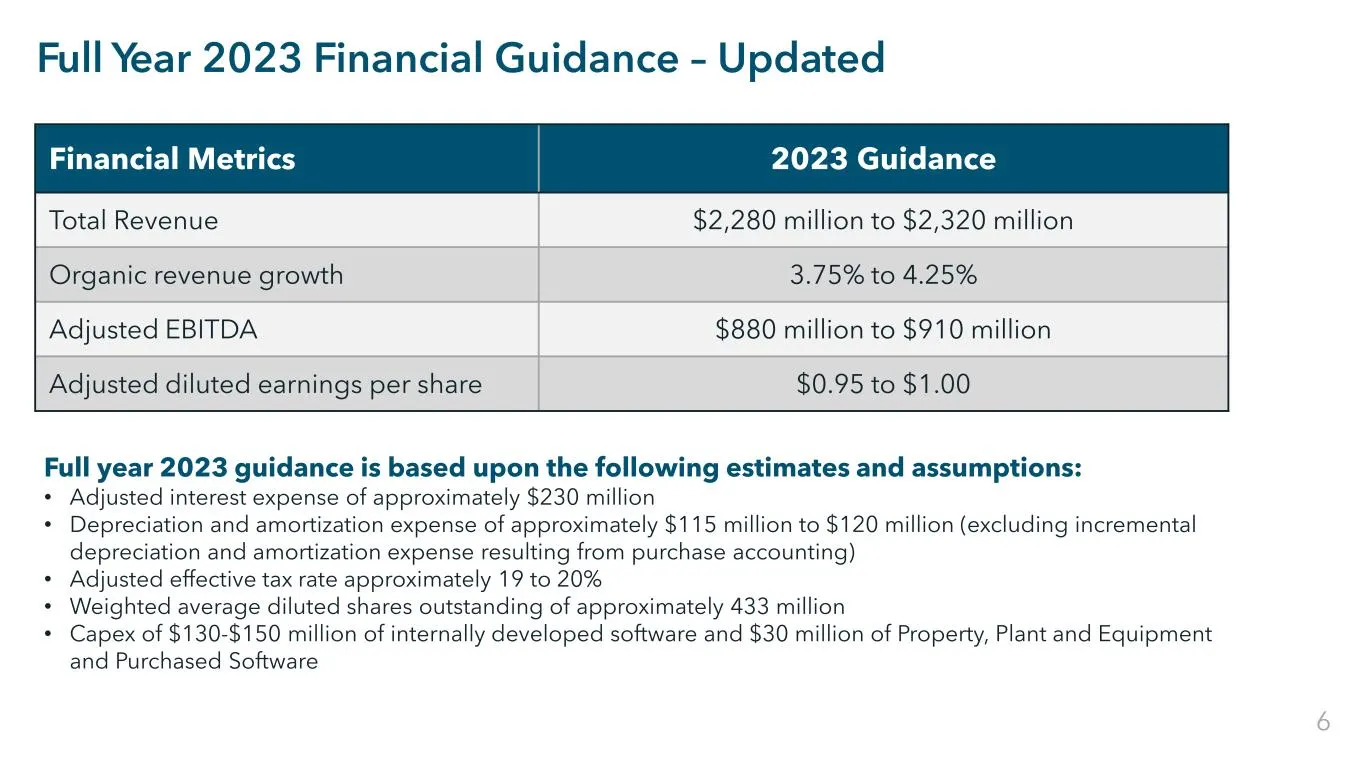
Slide 8: Full Year 2023 Financial Guidance – Updated
Restricted Confidential Full Year 2023 Financial Guidance – Updated Financial Metrics 2023 Guidance Total Revenue $2,280 million to $2,320 million Organic revenue growth 3.75% to 4.25% Adjusted EBITDA $880 million to $910 million Adjusted diluted earnings per share $0.95 to $1.00 Full year 2023 guid
Slide 9: Appendix
Restricted Confidential Appendix
Slide 10: Non-GAAP Financial Measures
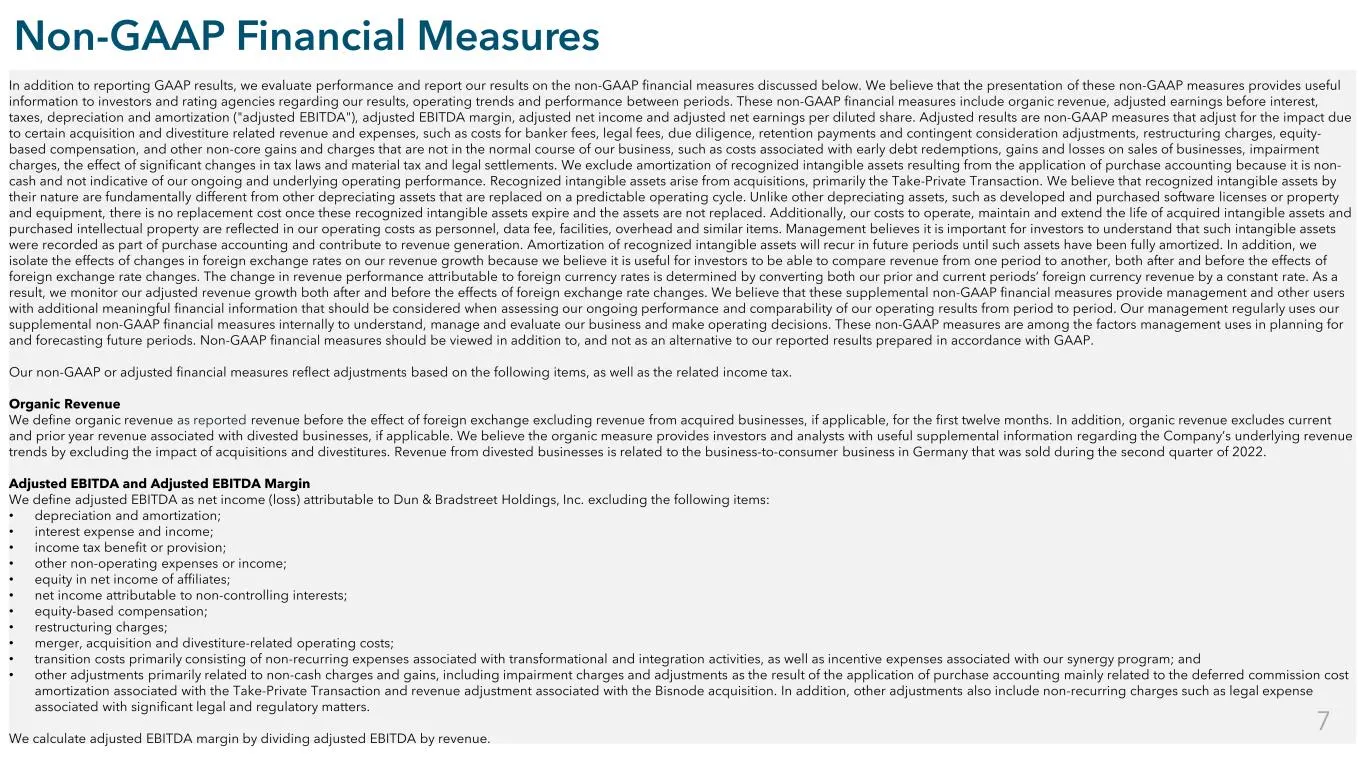
Restricted Confidential Non-GAAP Financial Measures In addition to reporting GAAP results, we evaluate performance and report our results on the non-GAAP financial measures discussed below. We believe that the presentation of these non-GAAP measures provides useful information to investors and ratin
Slide 11: Non-GAAP Financial Measures (Continued)
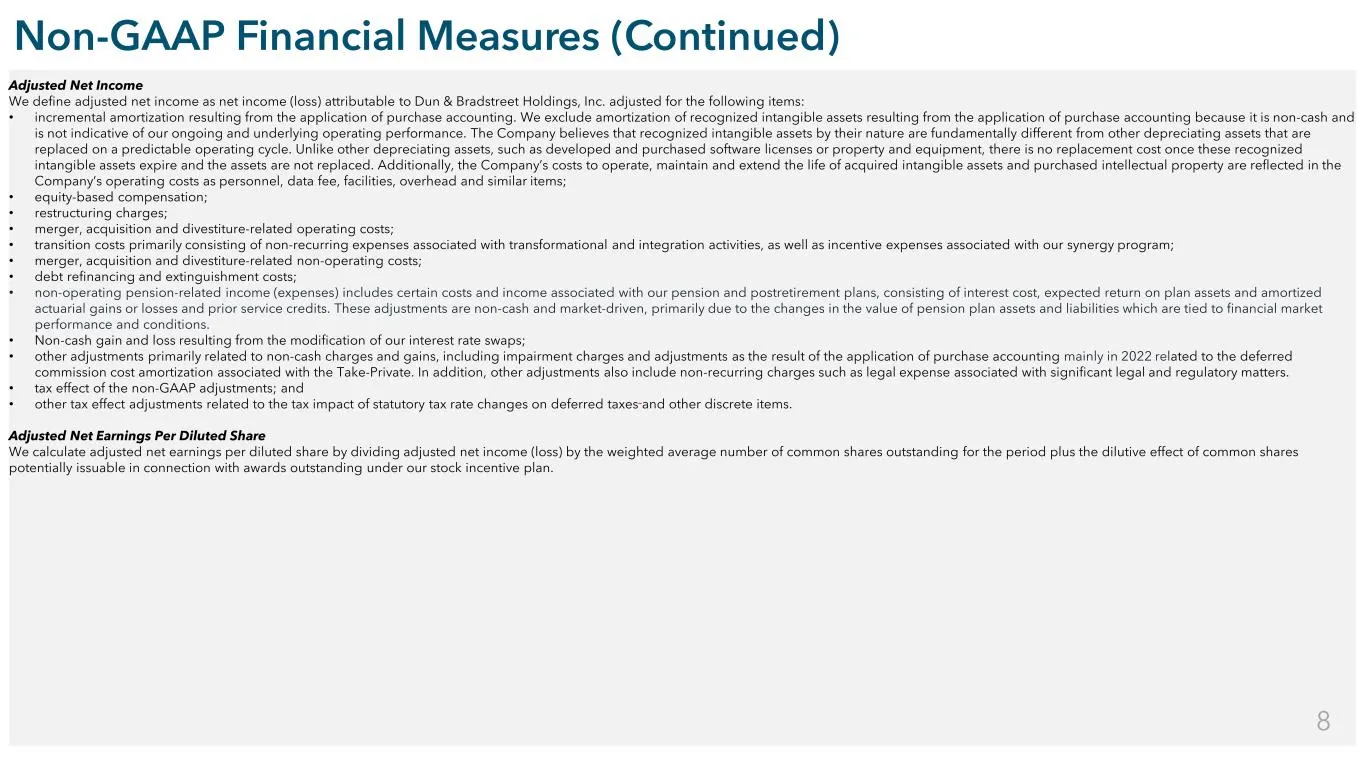
Restricted Confidential Non-GAAP Financial Measures (Continued) Adjusted Net Income We define adjusted net income as net income (loss) attributable to Dun & Bradstreet Holdings, Inc. adjusted for the following items: • incremental amortization resulting from the application of purchase accounting. W
Slide 12: Non-GAAP Reconciliation: Adjusted EBITDA
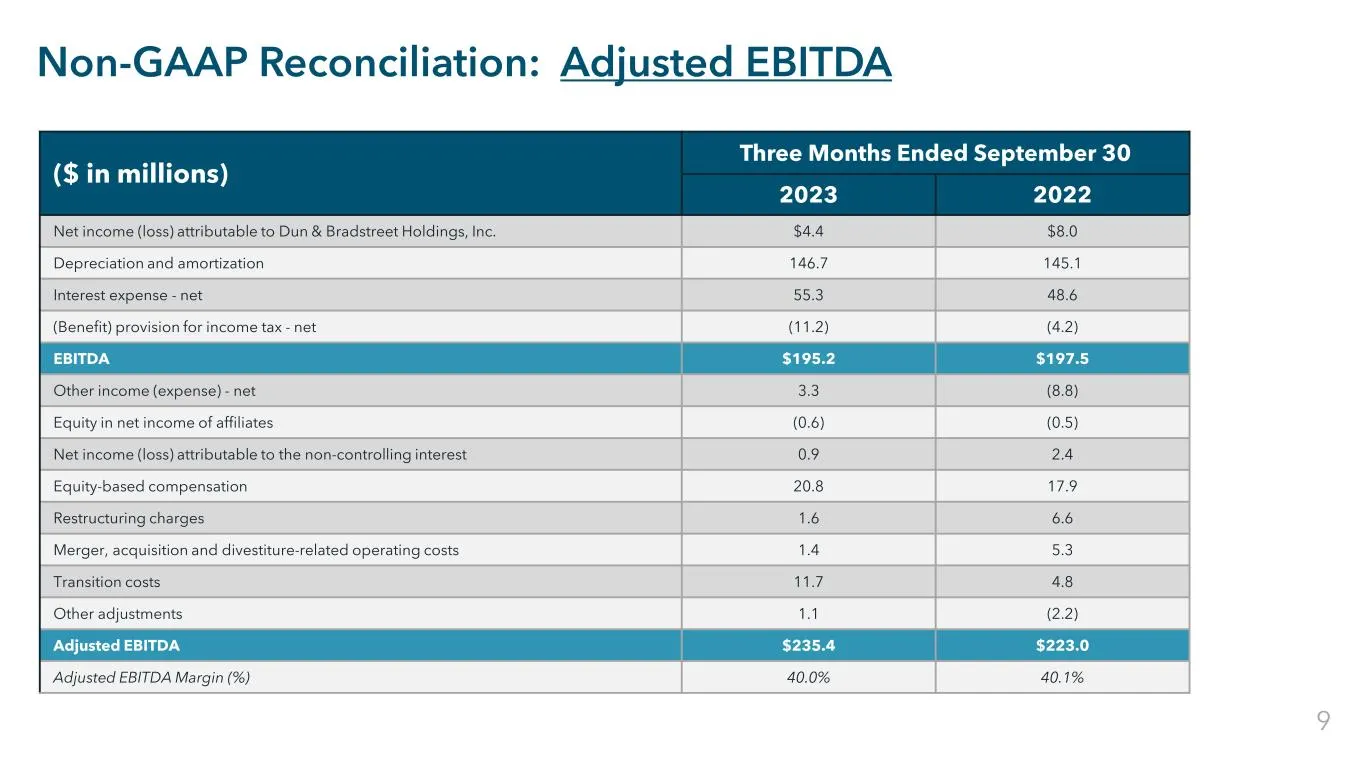
Restricted Confidential Non-GAAP Reconciliation: Adjusted EBITDA ($ in millions) Three Months Ended September 30 2023 2022 Net income (loss) attributable to Dun & Bradstreet Holdings, Inc. $4.4 $8.0 Depreciation and amortization 146.7 145.1 Interest expense - net 55.3 48.6 (Benefit) provision for in
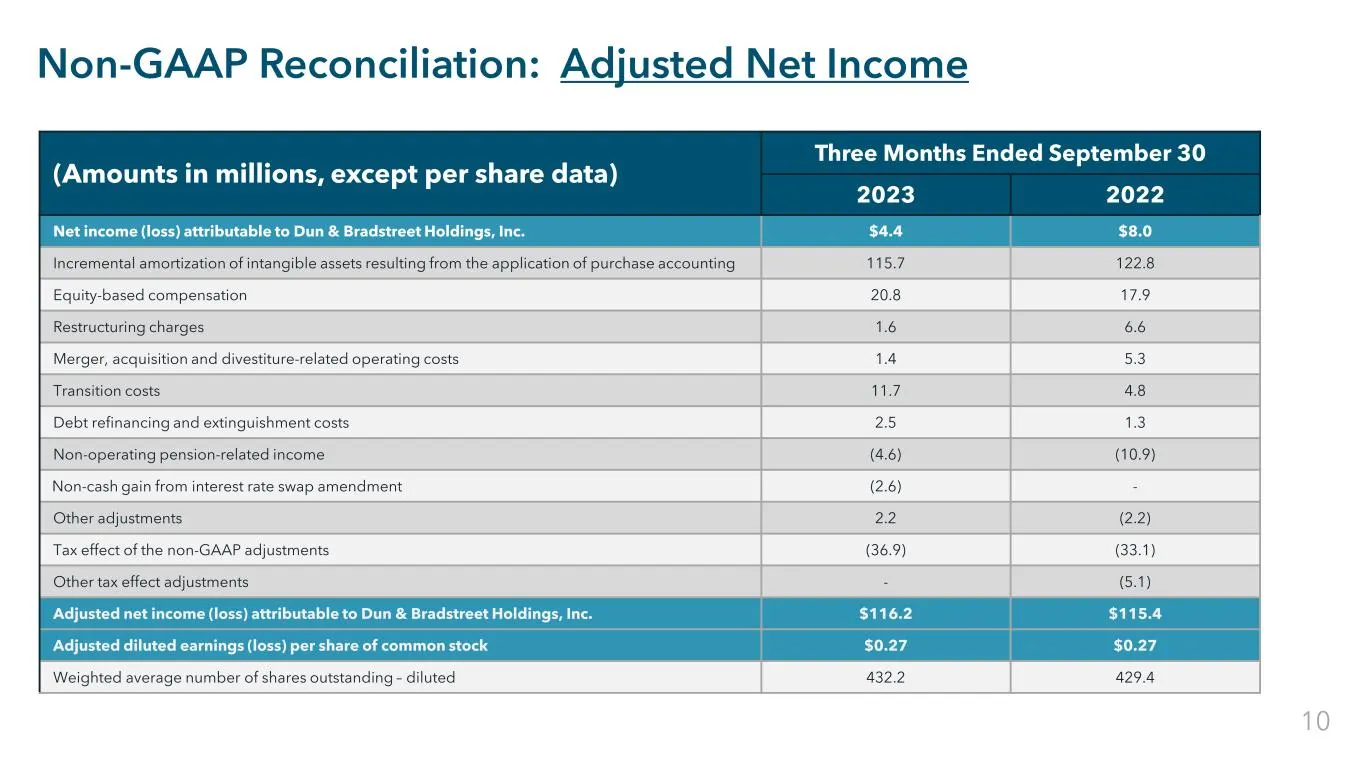
Slide 13: Non-GAAP Reconciliation: Adjusted Net Income
Restricted Confidential Non-GAAP Reconciliation: Adjusted Net Income (Amounts in millions, except per share data) Three Months Ended September 30 2023 2022 Net income (loss) attributable to Dun & Bradstreet Holdings, Inc. $4.4 $8.0 Incremental amortization of intangible assets resulting from the app
Source: SEC EDGAR · 8-K filed Nov 1, 2023
More decks from Dun & Bradstreet Holdings Inc.
 Q1 2025 Earnings Presentation12 slides · May 1, 2025
 Q4 2024 Earnings Presentation15 slides · Feb 20, 2025
 Q3 2024 Earnings Presentation13 slides · Oct 31, 2024
 Q2 2024 Earnings Presentation13 slides · Aug 1, 2024
 Q1 2024 Earnings Presentation13 slides · May 2, 2024
 FY2023 Earnings Presentation16 slides · Feb 15, 2024