WashingtonFirst Bankshares Inc
WashingtonFirst Bankshares — Investor Presentation (February 2016)
29 slides from WashingtonFirst Bankshares's investor presentation, Feb 25, 2016
Slide 1: Investor Presentation February 2016
NASDAQ: WFBI www.wfbi.com Investor Presentation February 2016 February 23, 2016
Slide 2: Disclaimer
Disclaimer 1 WashingtonFirst Bankshares, Inc. and its subsidiaries (the “Company”) make forward- looking statements in this presentation that are subject to risks and uncertainties. These forward-looking statements include: statements of goals, intentions, earnings expectations, and other expectatio
Slide 3: Corporate Overview
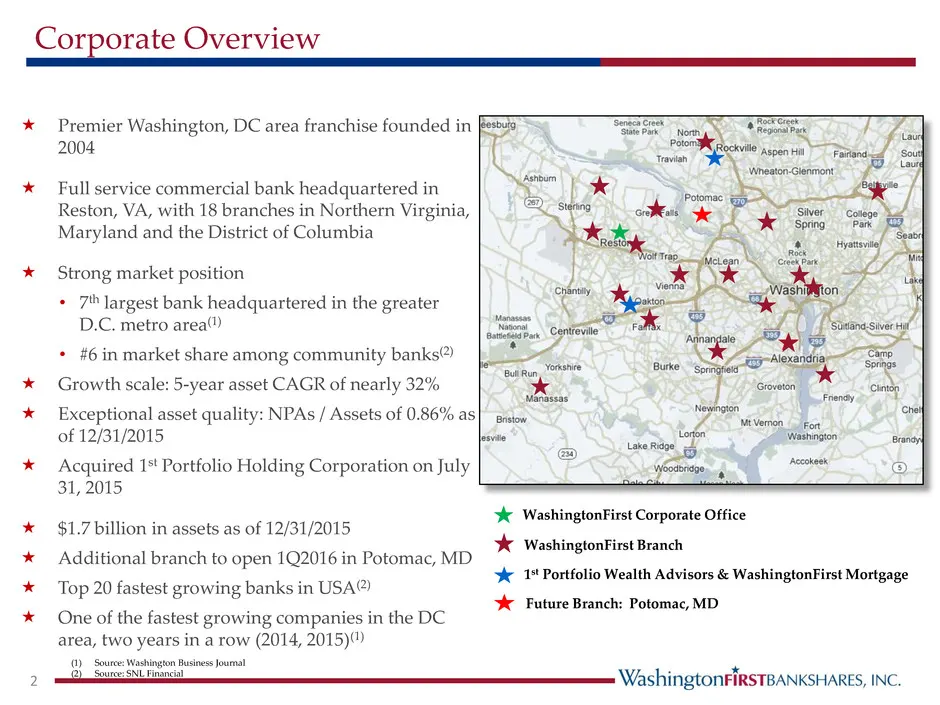
Corporate Overview 2 WashingtonFirst Corporate Office WashingtonFirst Branch Premier Washington, DC area franchise founded in 2004 Full service commercial bank headquartered in Reston, VA, with 18 branches in Northern Virginia, Maryland and the District of Columbia Strong market position • 7th
Slide 4: Our Strategy
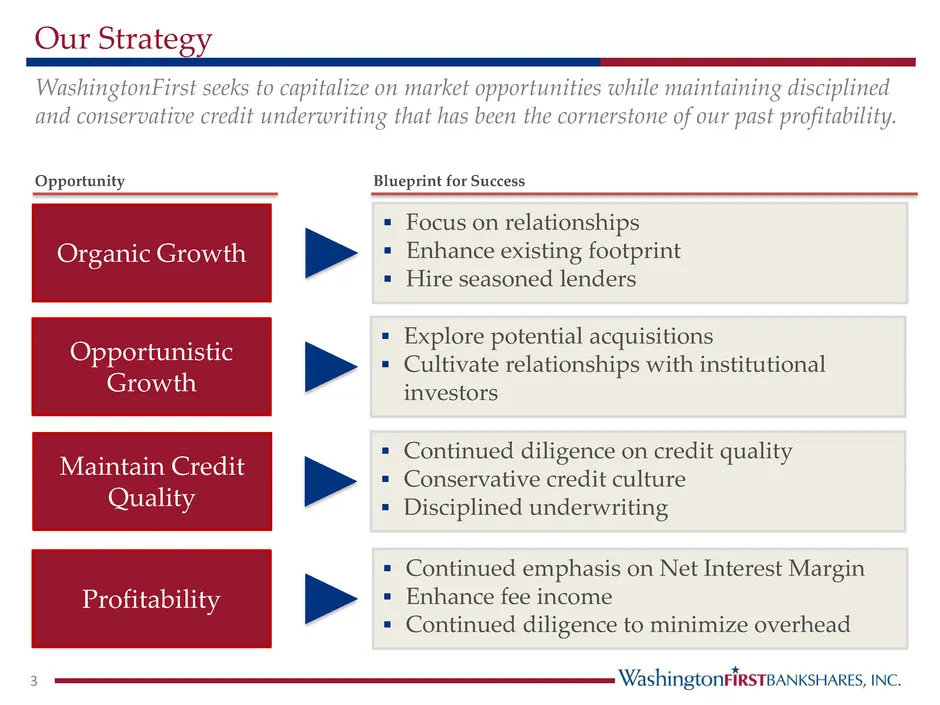
Our Strategy WashingtonFirst seeks to capitalize on market opportunities while maintaining disciplined and conservative credit underwriting that has been the cornerstone of our past profitability. Opportunity Organic Growth Focus on relationships Enhance existing footprint Hire seasoned lender
Slide 5: Board of Directors
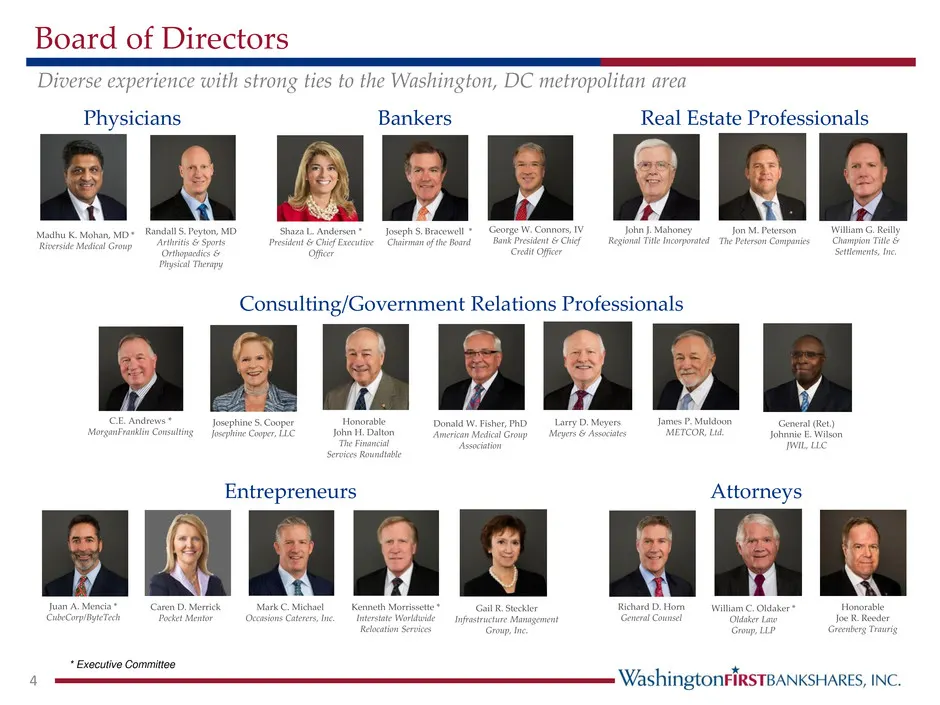
Board of Directors Physicians Attorneys Consulting/Government Relations Professionals Real Estate Professionals Entrepreneurs Joseph S. Bracewell * Chairman of the Board William C. Oldaker * Oldaker Law Group, LLP Honorable Joe R. Reeder Greenberg Traurig Josephine S. Cooper Josephine Cooper, LLC Ho
Slide 6: Senior Leadership Overview
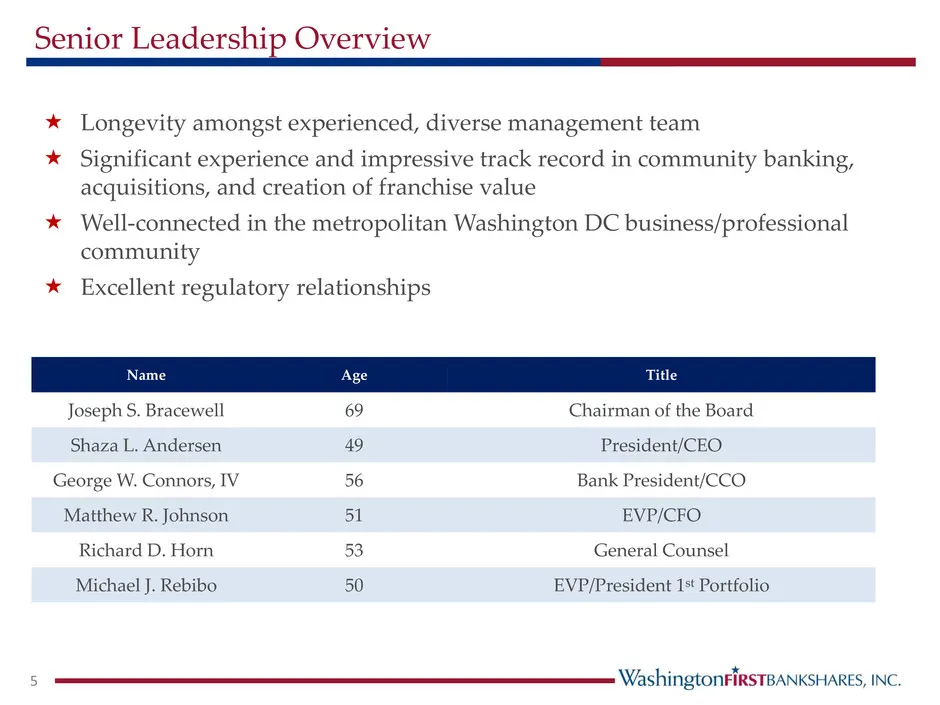
Senior Leadership Overview Longevity amongst experienced, diverse management team Significant experience and impressive track record in community banking, acquisitions, and creation of franchise value Well-connected in the metropolitan Washington DC business/professional community Excellent
Slide 7: Senior Management Team
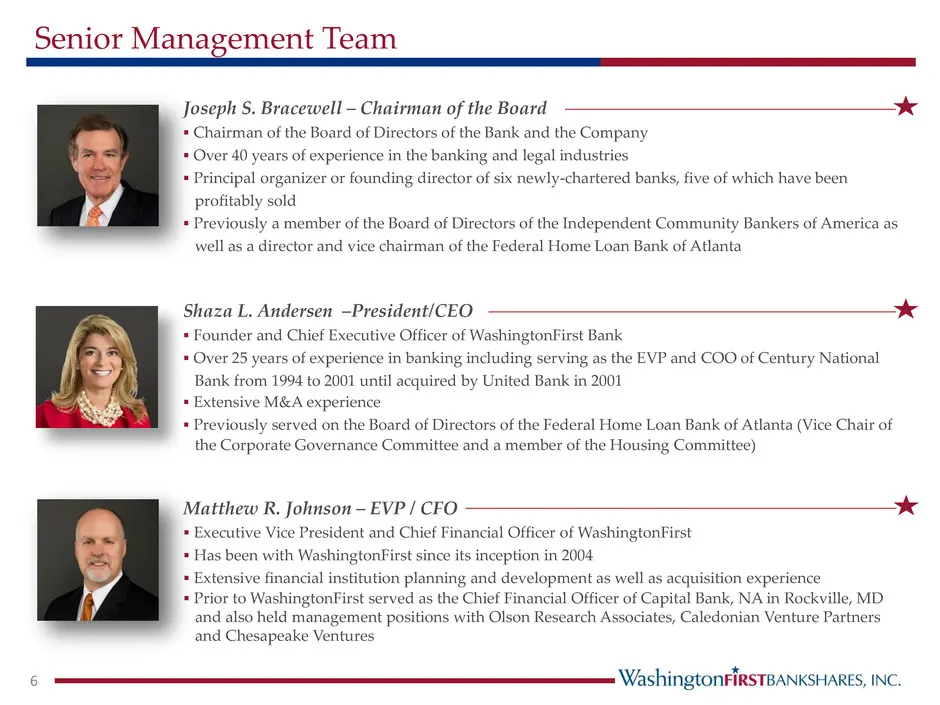
Senior Management Team Joseph S. Bracewell – Chairman of the Board Chairman of the Board of Directors of the Bank and the Company Over 40 years of experience in the banking and legal industries Principal organizer or founding director of six newly-chartered banks, five of which have been profi
Slide 8: Senior Management Team
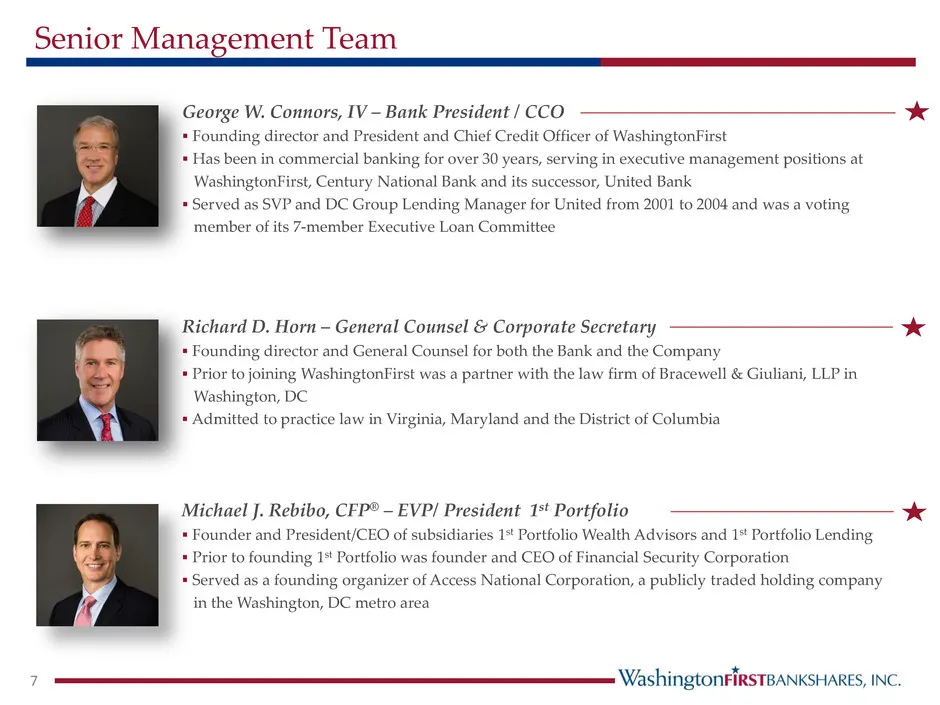
Senior Management Team Richard D. Horn – General Counsel & Corporate Secretary Founding director and General Counsel for both the Bank and the Company Prior to joining WashingtonFirst was a partner with the law firm of Bracewell & Giuliani, LLP in Washington, DC Admitted to practice law in Vir
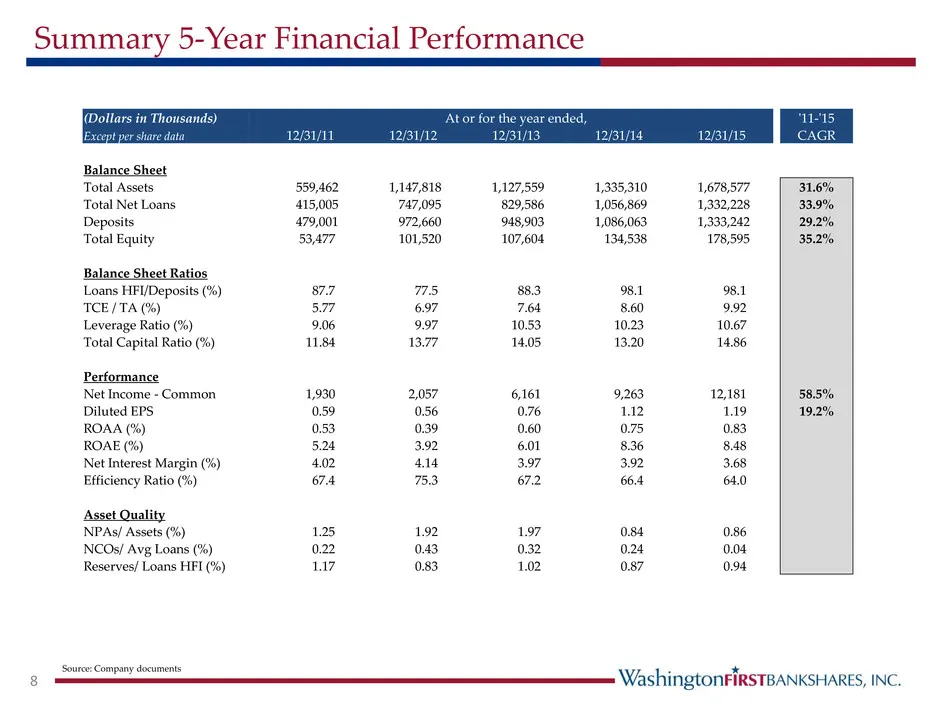
Slide 9: Summary 5-Year Financial Performance
Summary 5-Year Financial Performance 8 Source: Company documents (Dollars in Thousands) At or for the year ended, '11-'15 Except per share data 12/31/11 12/31/12 12/31/13 12/31/14 12/31/15 CAGR Balance Sheet Total Assets 559,462 1,147,818 1,127,559 1,335,310 1,678,577 31.6% Total Net Loans 415,005 7
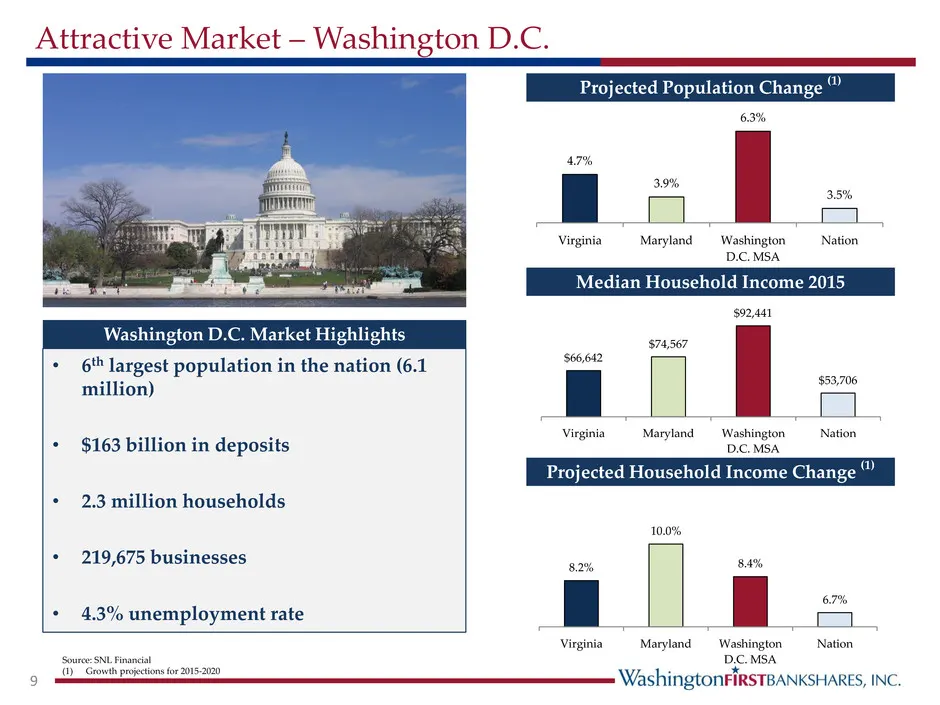
Slide 10: Attractive Market – Washington D.C.
$66,642 $74,567 $92,441 $53,706 Virginia Maryland Washington D.C. MSA Nation Attractive Market – Washington D.C. 9 Washington D.C. Market Highlights Median Household Income 2015 Projected Population Change (1) Projected Household Income Change (1) 4.7% 3.9% 6.3% 3.5% Virginia Maryland Washington D.C
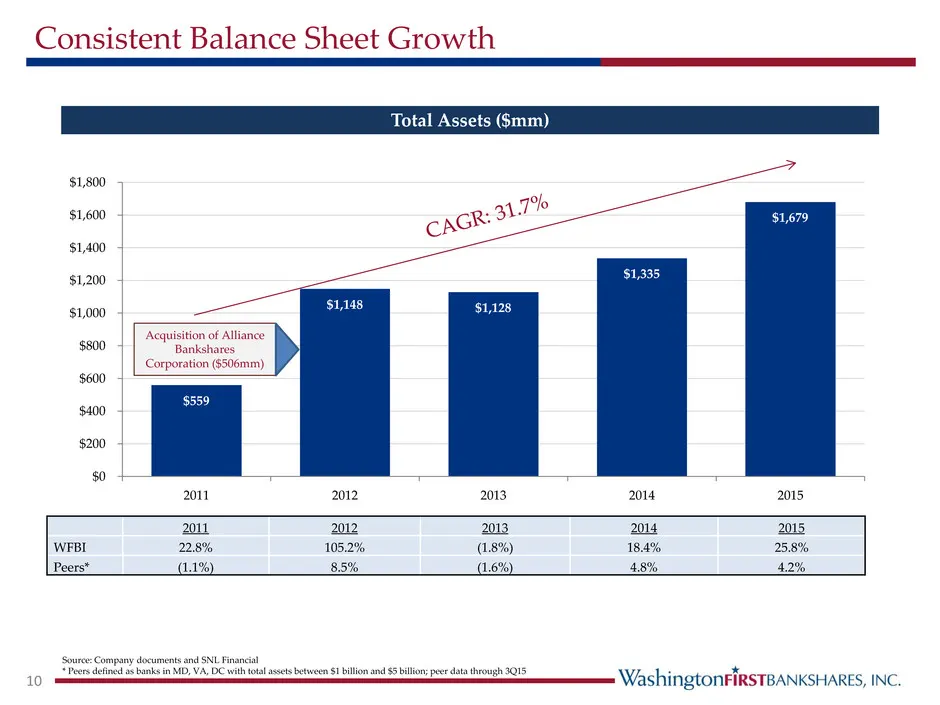
Slide 11: Consistent Balance Sheet Growth
Consistent Balance Sheet Growth 10 Total Assets ($mm) Source: Company documents and SNL Financial * Peers defined as banks in MD, VA, DC with total assets between $1 billion and $5 billion; peer data through 3Q15 $559 $1,148 $1,128 $1,335 $1,679 $0 $200 $400 $600 $800 $1,000 $1,200 $1,400 $1,600 $1,
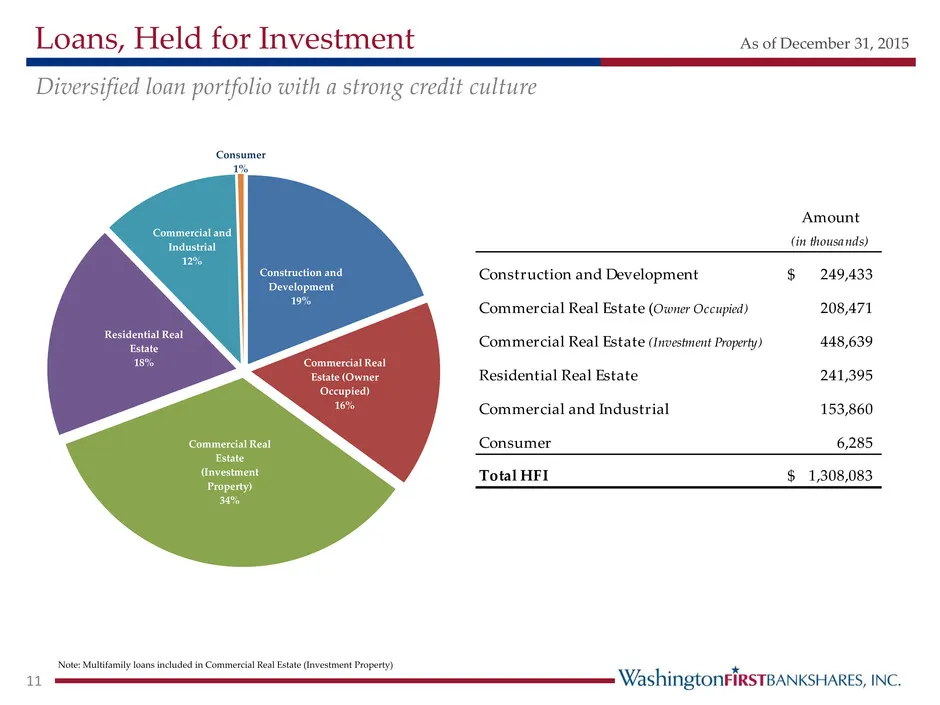
Slide 12: Loans, Held for Investment
Loans, Held for Investment As of December 31, 2015 11 Diversified loan portfolio with a strong credit culture Amount (in thousands) Construction and Development 249,433$ Commercial Real Estate (Owner Occupied) 208,471 Commercial Real Estate (Investment Property) 448,639 Residential Real Estate 241,3
Slide 13: Asset Quality
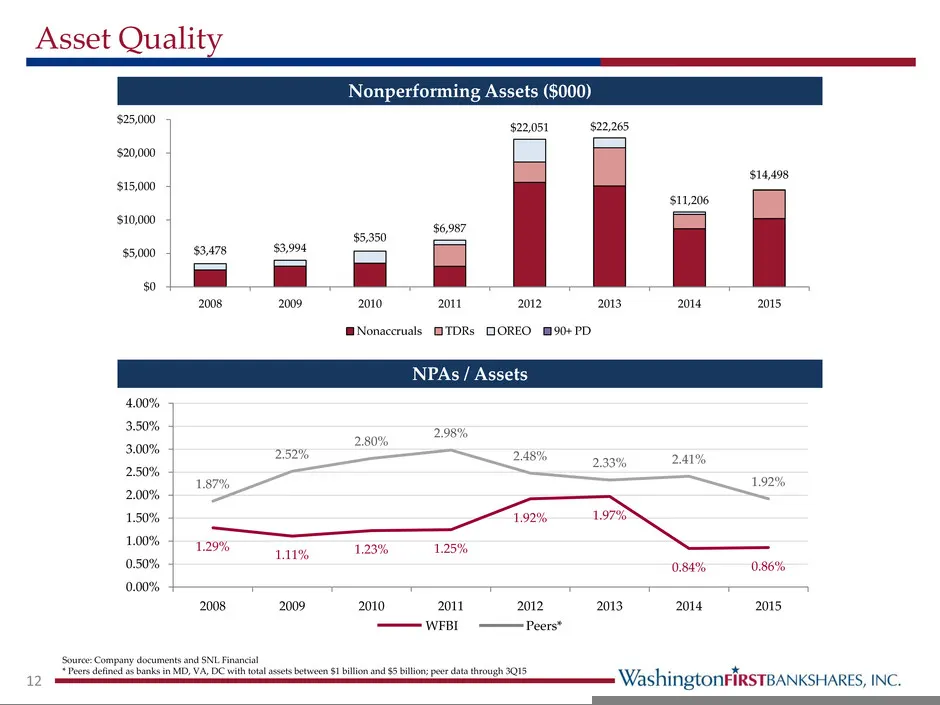
Asset Quality 12 Nonperforming Assets ($000) NPAs / Assets Source: Company documents and SNL Financial * Peers defined as banks in MD, VA, DC with total assets between $1 billion and $5 billion; peer data through 3Q15 1.29% 1.11% 1.23% 1.25% 1.92% 1.97% 0.84% 0.86% 1.87% 2.52% 2.80% 2.98% 2.48% 2.33
Slide 14: Our Credit Culture
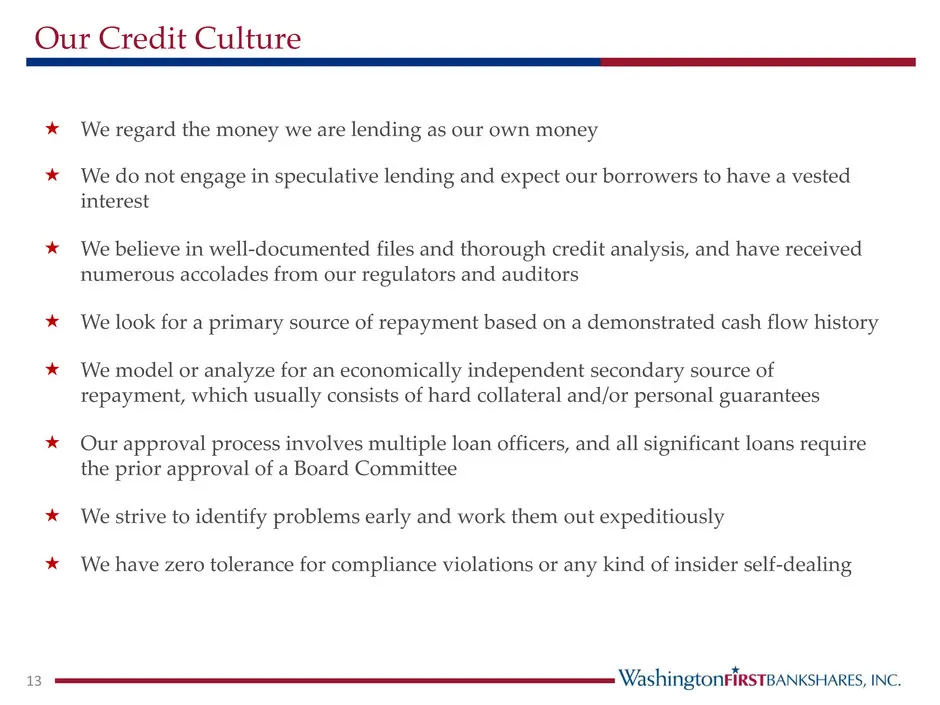
Our Credit Culture We regard the money we are lending as our own money We do not engage in speculative lending and expect our borrowers to have a vested interest We believe in well-documented files and thorough credit analysis, and have received numerous accolades from our regulators and audit
Slide 15: Strong Core Deposit Base
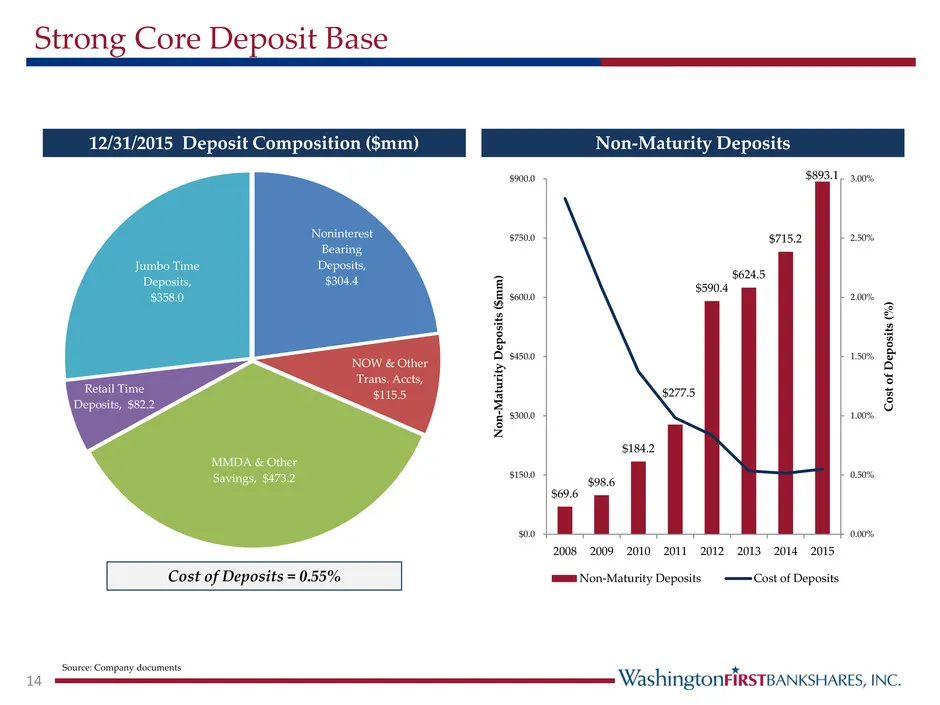
Strong Core Deposit Base 14 12/31/2015 Deposit Composition ($mm) Non-Maturity Deposits Cost of Deposits = 0.55% Source: Company documents Noninterest Bearing Deposits, $304.4 NOW & Other Trans. Accts, $115.5 MMDA & Other Savings, $473.2 Retail Time Deposits, $82.2 Jumbo Time Deposits, $358.0 $69.6 $
Slide 16: Earnings Growth
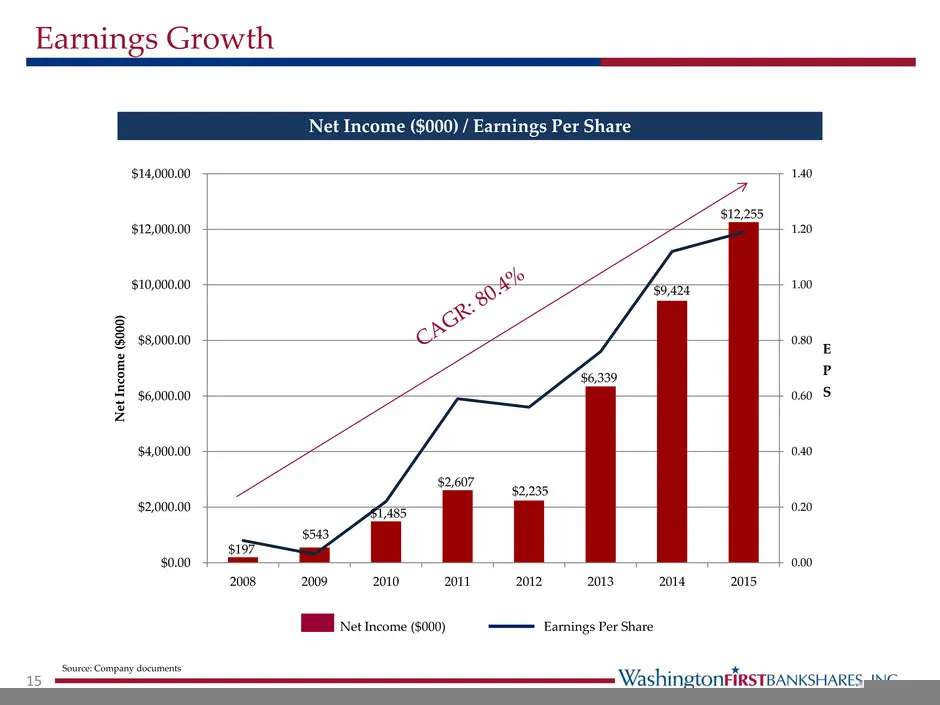
$197 $543 $1,485 $2,607 $2,235 $6,339 $9,424 $12,255 0.00 0.20 0.40 0.60 0.80 1.00 1.20 1.40 $0.00 $2,000.00 $4,000.00 $6,000.00 $8,000.00 $10,000.00 $12,000.00 $14,000.00 2008 2009 2010 2011 2012 2013 2014 2015 E P S N e t In com e ( $ 0 0 0 ) Earnings Growth 15 Net Income ($000) / Earnings Per Sha
Slide 17: Recent Financial Performance
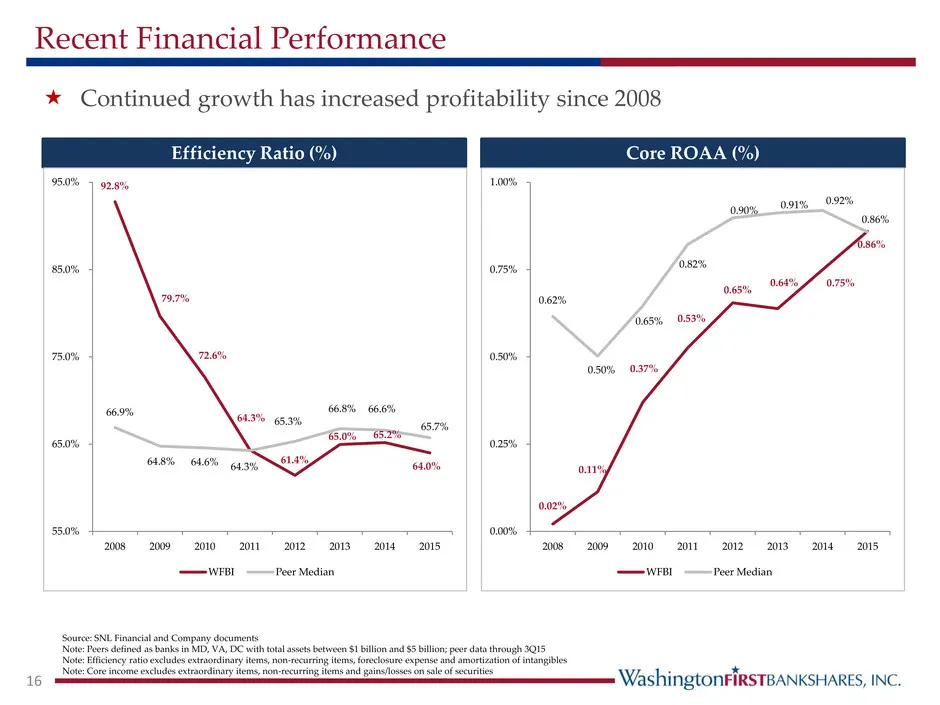
Recent Financial Performance 16 Continued growth has increased profitability since 2008 Efficiency Ratio (%) Core ROAA (%) Source: SNL Financial and Company documents Note: Peers defined as banks in MD, VA, DC with total assets between $1 billion and $5 billion; peer data through 3Q15 Note: Effici
Slide 18: Net Interest Margin
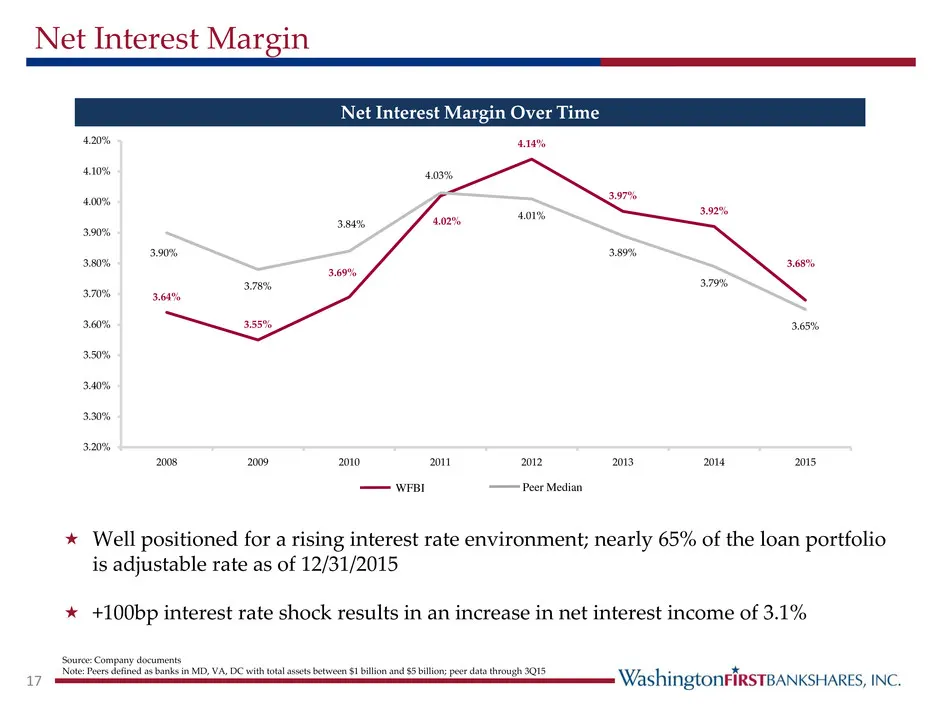
17 Net Interest Margin Net Interest Margin Over Time Well positioned for a rising interest rate environment; nearly 65% of the loan portfolio is adjustable rate as of 12/31/2015 +100bp interest rate shock results in an increase in net interest income of 3.1% Source: Company documents Note: Peers
Slide 19: Current Capital Position
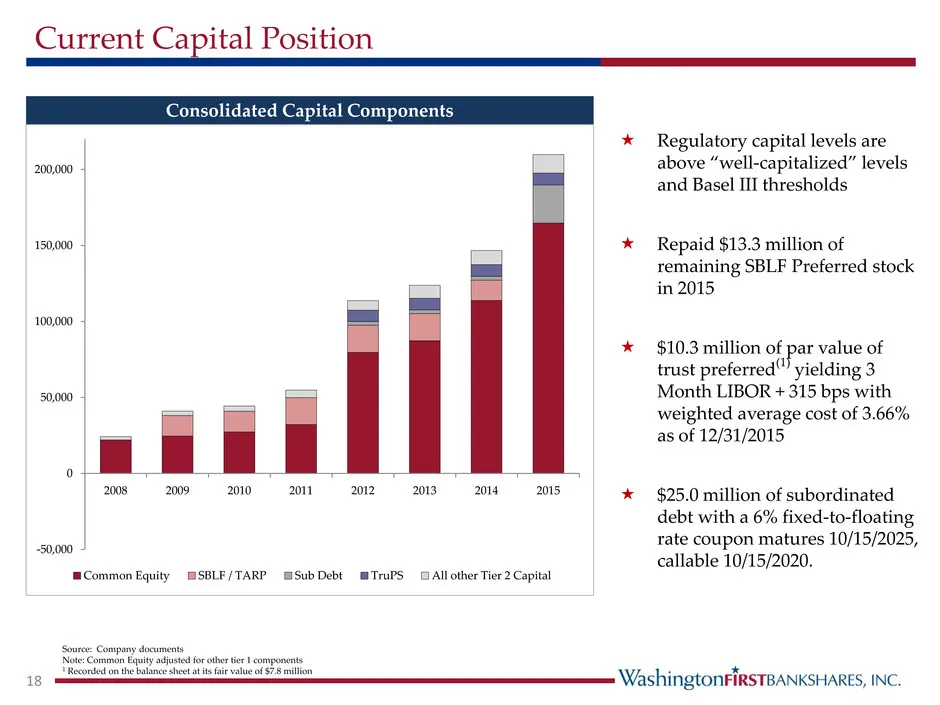
Current Capital Position 18 Consolidated Capital Components Source: Company documents Note: Common Equity adjusted for other tier 1 components 1 Recorded on the balance sheet at its fair value of $7.8 million Regulatory capital levels are above “well-capitalized” levels and Basel III thresholds
Slide 20: Facts About Our Common Stock
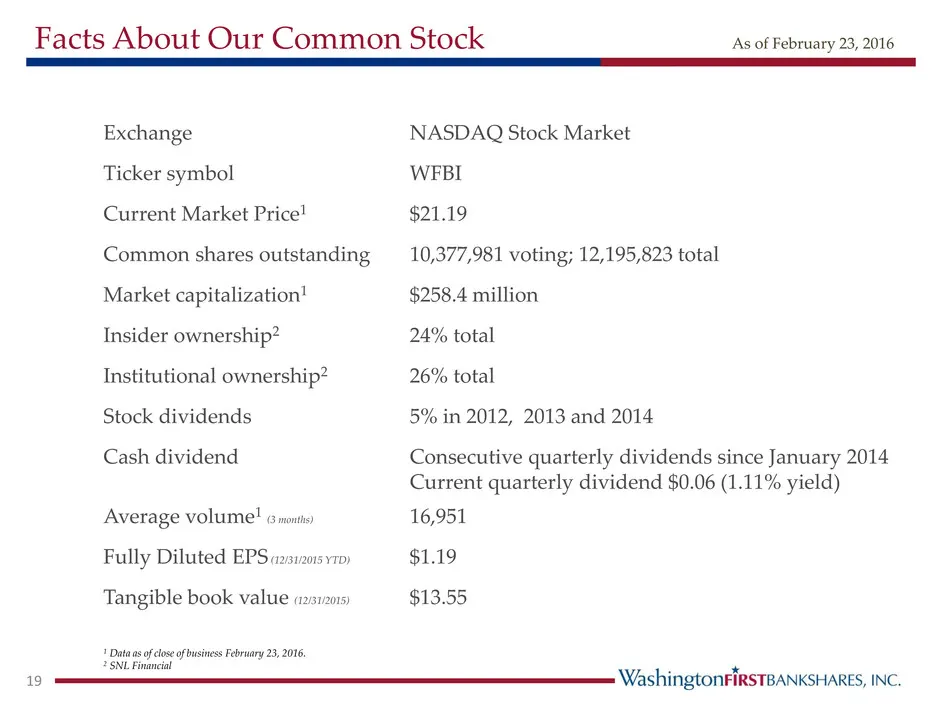
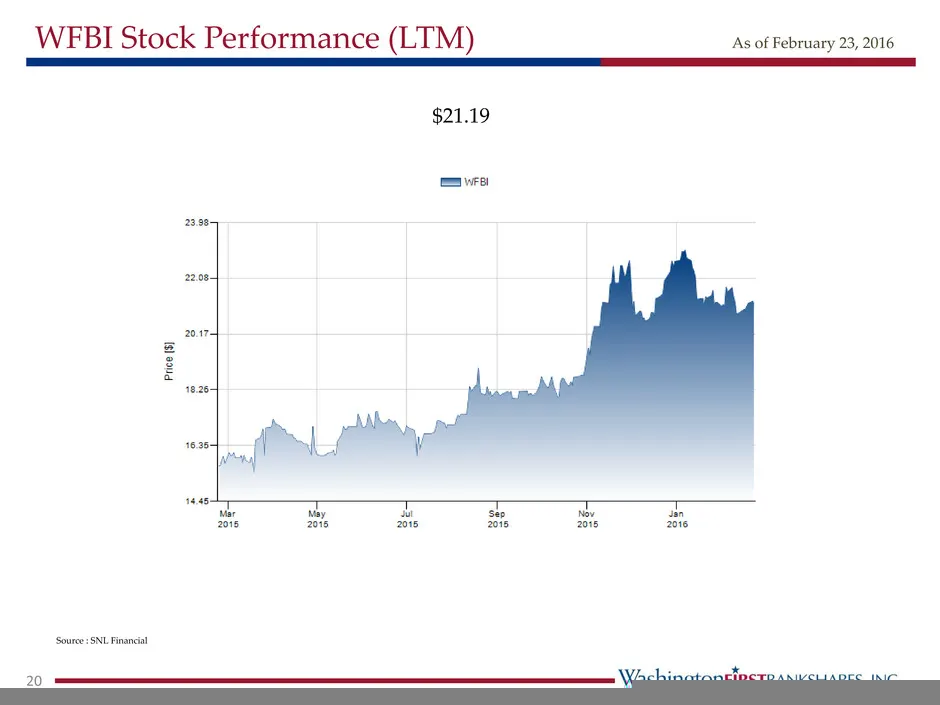
Facts About Our Common Stock As of February 23, 2016 19 Exchange NASDAQ Stock Market Ticker symbol WFBI Current Market Price1 $21.19 Common shares outstanding 10,377,981 voting; 12,195,823 total Market capitalization1 $258.4 million Insider ownership2 24% total Institutional ownership2 26% total Sto
Slide 21: WFBI Stock Performance (LTM)
WFBI Stock Performance (LTM) As of February 23, 2016 20 Source : SNL Financial $21.19
Slide 22: M&A Track Record
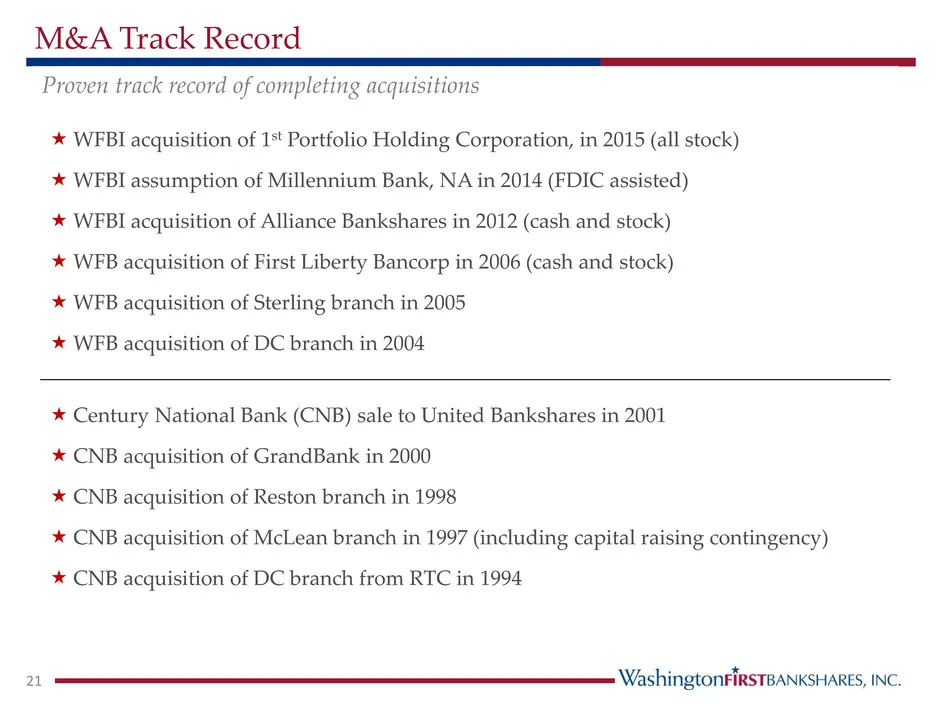
M&A Track Record 21 Proven track record of completing acquisitions WFBI acquisition of 1st Portfolio Holding Corporation, in 2015 (all stock) WFBI assumption of Millennium Bank, NA in 2014 (FDIC assisted) WFBI acquisition of Alliance Bankshares in 2012 (cash and stock) WFB acquisition of Fir
Slide 23: Concluding Remarks
Strong management team Proven track record of quality growth Demographically attractive market area Profitability now in line with peer metrics Excellent asset quality and risk management Insider ownership aligns management and stakeholder interests Concluding Remarks 22
Slide 24: Appendix
Appendix 23
Slide 25: Capital Strength
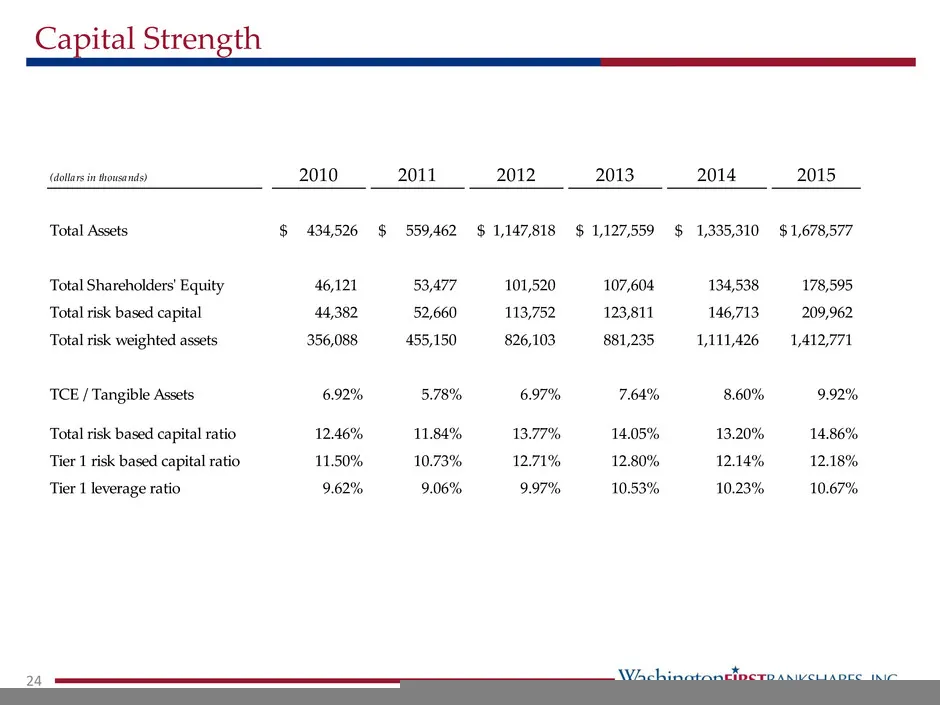
Capital Strength 24 (dollars in thousands) 2010 2011 2012 2013 2014 2015 Total Assets 434,526$ 559,462$ 1,147,818$ 1,127,559$ 1,335,310$ 1,678,577$ Total Shareholders' Equity 46,121 53,477 101,520 107,604 134,538 178,595 Total risk based capital 44,382 52,660 113,752 123,811 146,713 209,962 Total ri
Slide 26: Historical Balance Sheet
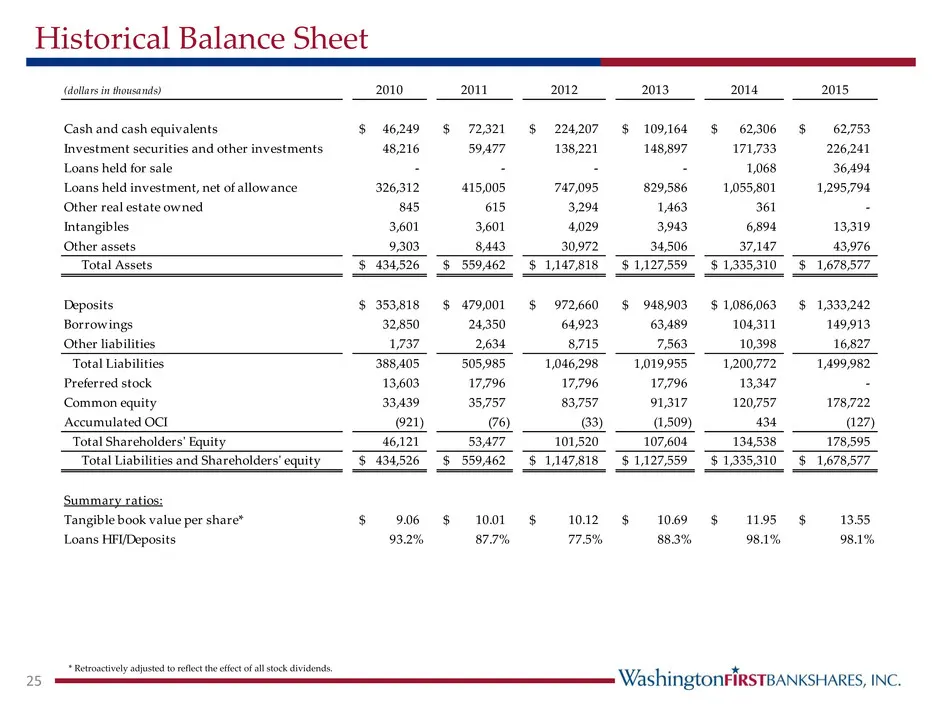
Historical Balance Sheet 25 * Retroactively adjusted to reflect the effect of all stock dividends. (dollars in thousands) 2010 2011 2012 2013 2014 2015 Cash and cash equivalents 46,249$ 72,321$ 224,207$ 109,164$ 62,306$ 62,753$ Investment securities and other investments 48,216 59,477 138,221 148,89
Slide 27: Historical Income Statement
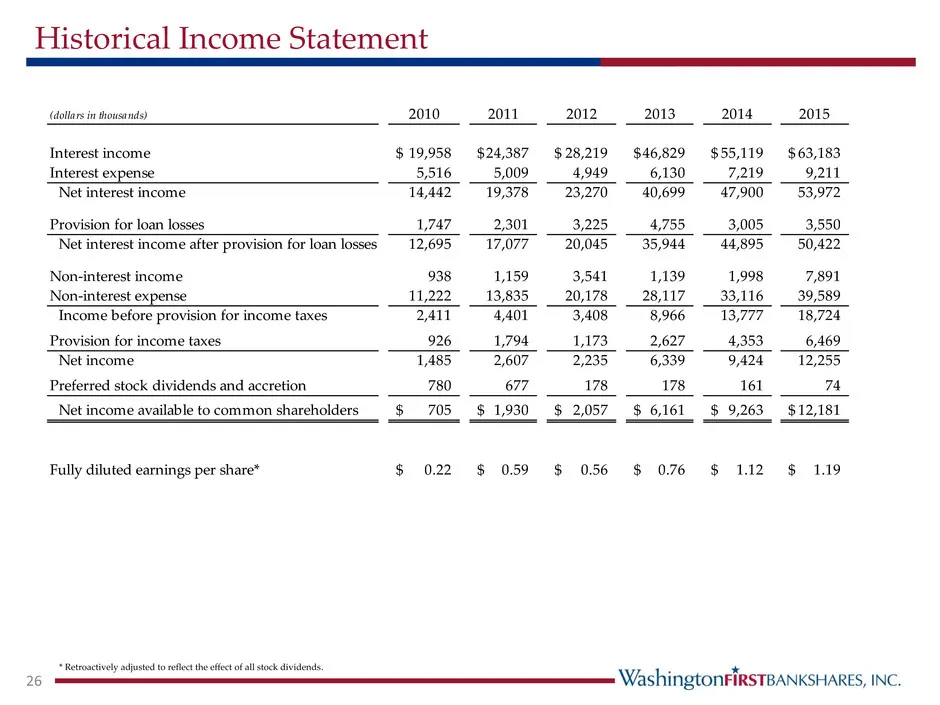
Historical Income Statement 26 * Retroactively adjusted to reflect the effect of all stock dividends. (dollars in thousands) 2010 2011 2012 2013 2014 2015 Interest income 19,958$ 24,387$ 28,219$ 46,829$ 55,119$ 63,183$ Interest expense 5,516 5,009 4,949 6,130 7,219 9,211 Net interest income 14,442 1
Slide 28: Credit Composition and Quality
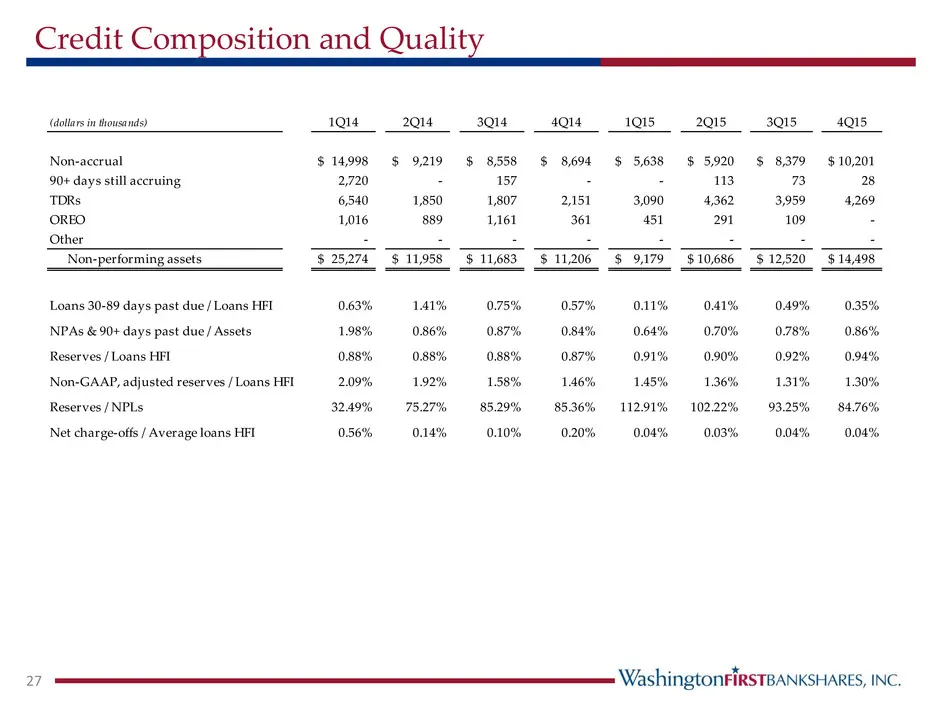
Credit Composition and Quality 27 (dollars in thousands) 1Q14 2Q14 3Q14 4Q14 1Q15 2Q15 3Q15 4Q15 Non-accrual 14,998$ 9,219$ 8,558$ 8,694$ 5,638$ 5,920$ 8,379$ 10,201$ 90+ days still accruing 2,720 - 157 - - 113 73 28 TDRs 6,540 1,850 1,807 2,151 3,090 4,362 3,959 4,269 OREO 1,016 889 1,161 361 451 2
Slide 29: Thank you
NASDAQ: WFBI www.wfbi.com Thank you
Source: SEC EDGAR · 8-K filed Feb 25, 2016
More decks from WashingtonFirst Bankshares Inc
 KBW 2017 Community Bank Investor Conference43 slides · Jul 31, 2017
 Merger or Acquisition (May 2017)15 slides · May 16, 2017
 Shareholder Meeting (April 2017)21 slides · Apr 26, 2017
 Investor Presentation (February 2017)37 slides · Feb 10, 2017
 Investor Presentation (September 2016)31 slides · Sep 6, 2016
 Investor Presentation (August 2016)31 slides · Aug 17, 2016