Covanta — R.W. Baird's 2013 Industrial Conference
39 slides from Covanta's conference presentation, Nov 4, 2013
Slide 1: Covanta Holding Corp. R.W. Baird's 2013 Industrial Conference
November 4, 2013 Covanta Holding Corp. R.W. Baird's 2013 Industrial Conference NYSE: CVA
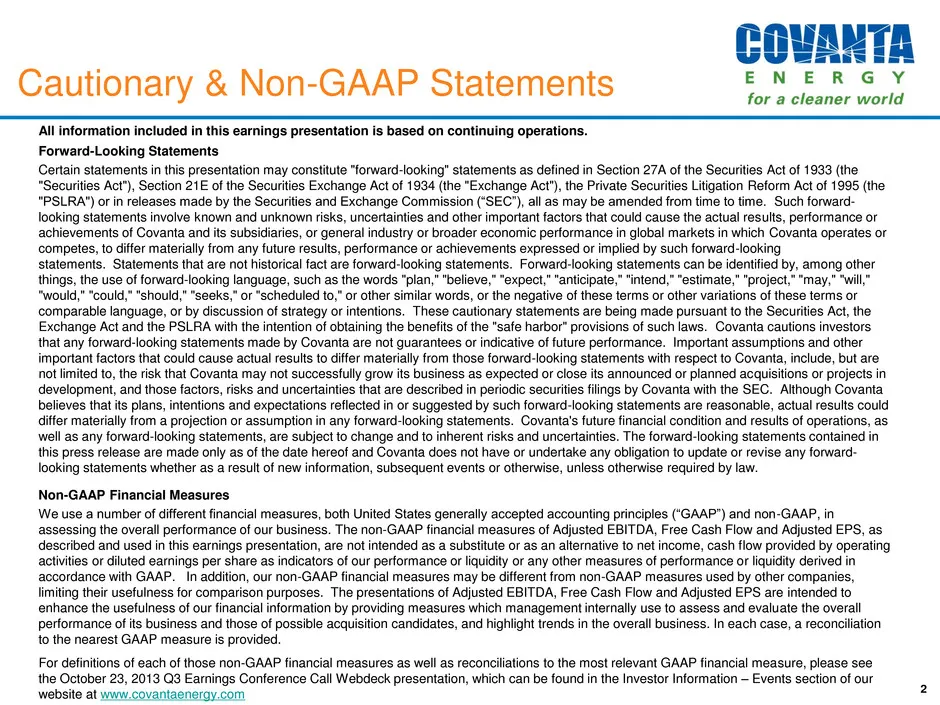
Slide 2: Cautionary & Non-GAAP Statements
Cautionary & Non-GAAP Statements 2 All information included in this earnings presentation is based on continuing operations. Forward-Looking Statements Certain statements in this presentation may constitute "forward-looking" statements as defined in Section 27A of the Securities Act of 1933 (the "Se
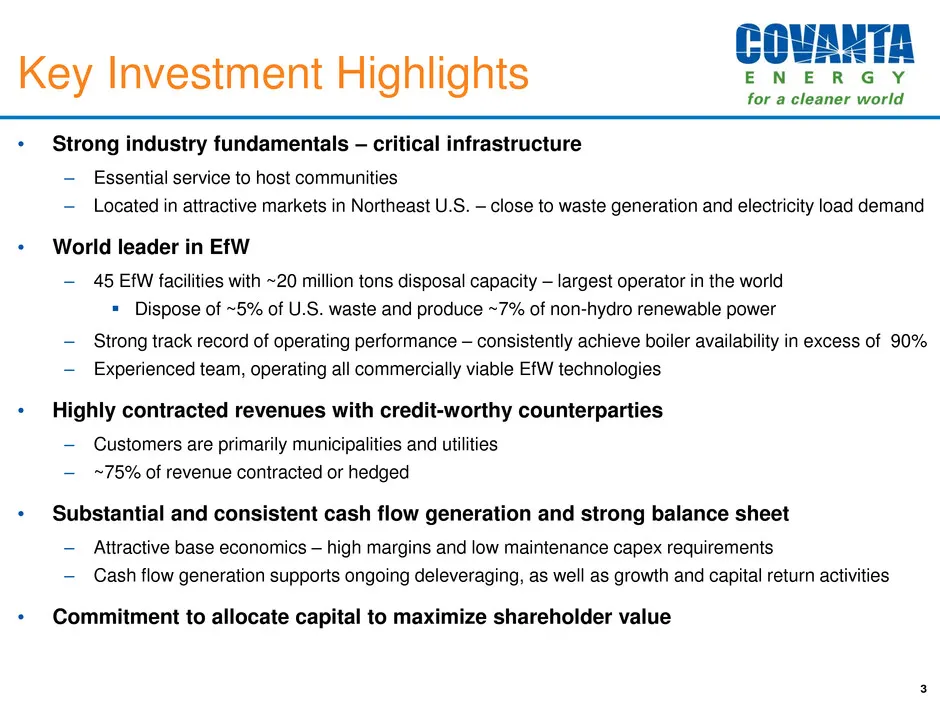
Slide 3: Key Investment Highlights
Key Investment Highlights • Strong industry fundamentals – critical infrastructure – Essential service to host communities – Located in attractive markets in Northeast U.S. – close to waste generation and electricity load demand • World leader in EfW – 45 EfW facilities with ~20 million tons disposa
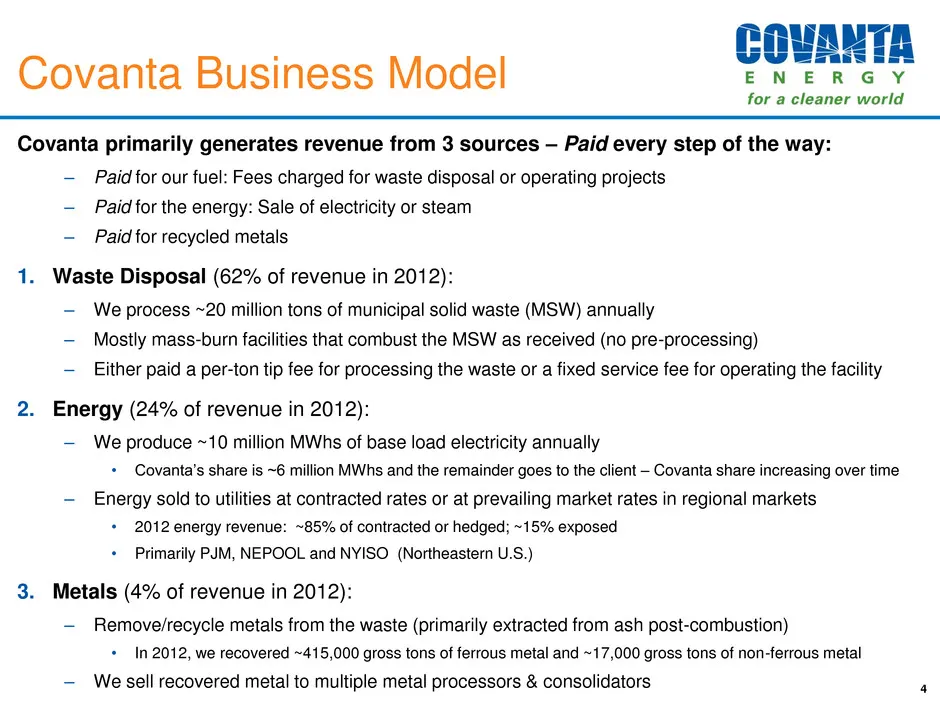
Slide 4: Covanta Business Model
Covanta Business Model Covanta primarily generates revenue from 3 sources – Paid every step of the way: – Paid for our fuel: Fees charged for waste disposal or operating projects – Paid for the energy: Sale of electricity or steam – Paid for recycled metals 1. Waste Disposal (62% of revenue in 2012)
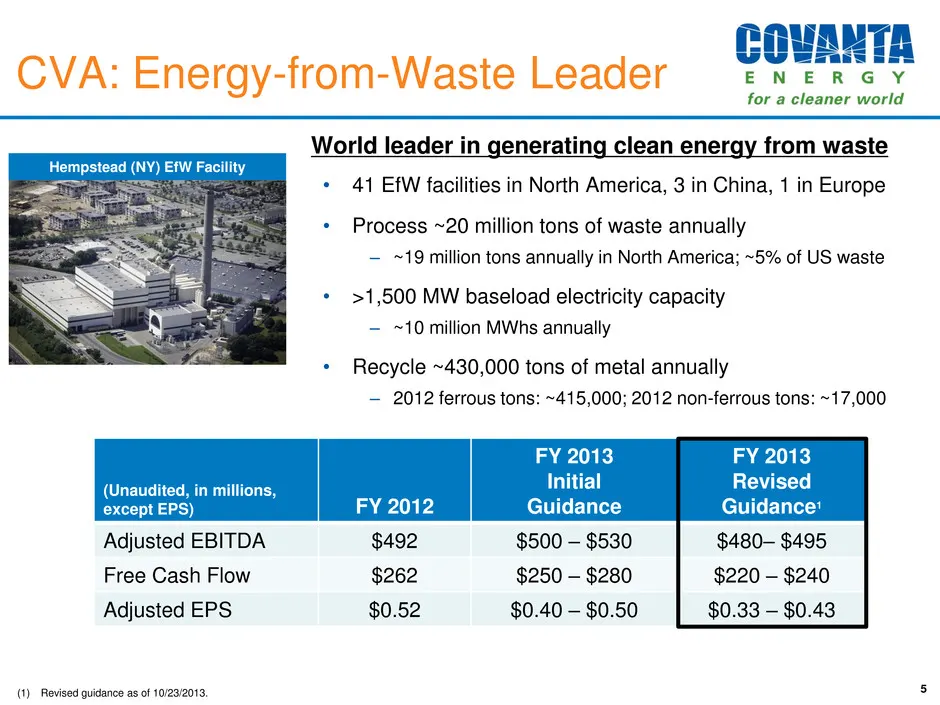
Slide 5: CVA: Energy-from-Waste Leader
(Unaudited, in millions, except EPS) FY 2012 FY 2013 Initial Guidance FY 2013 Revised Guidance1 Adjusted EBITDA $492 $500 – $530 $480– $495 Free Cash Flow $262 $250 – $280 $220 – $240 Adjusted EPS $0.52 $0.40 – $0.50 $0.33 – $0.43 5 CVA: Energy-from-Waste Leader (1) Revised guidance as of 10/23/2013
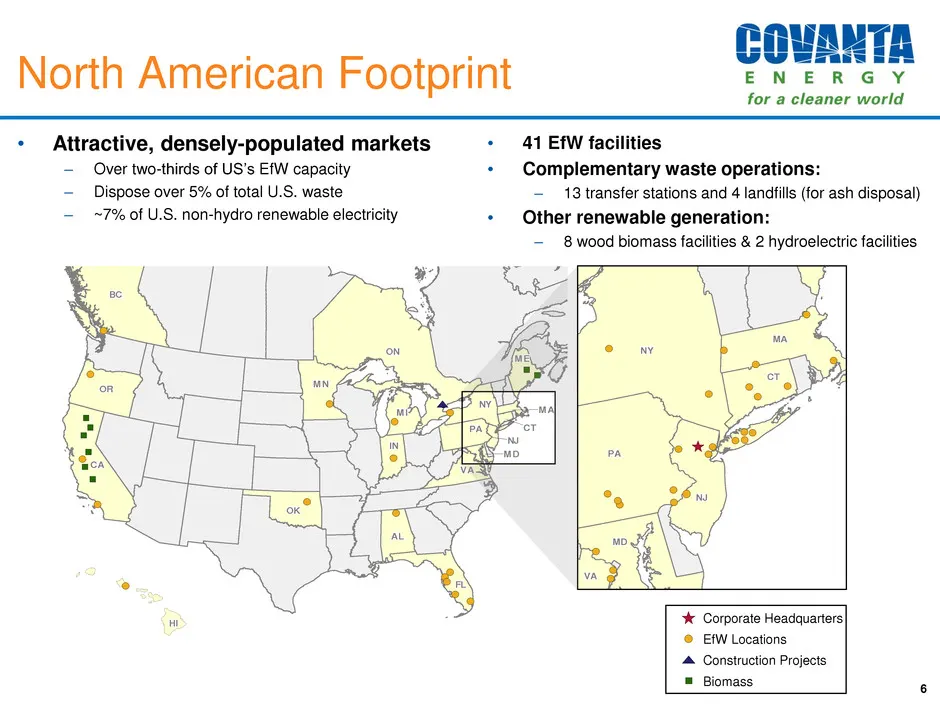
Slide 6: North American Footprint
North American Footprint • Attractive, densely-populated markets – Over two-thirds of US’s EfW capacity – Dispose over 5% of total U.S. waste – ~7% of U.S. non-hydro renewable electricity • 41 EfW facilities • Complementary waste operations: – 13 transfer stations and 4 landfills (for ash disposal)
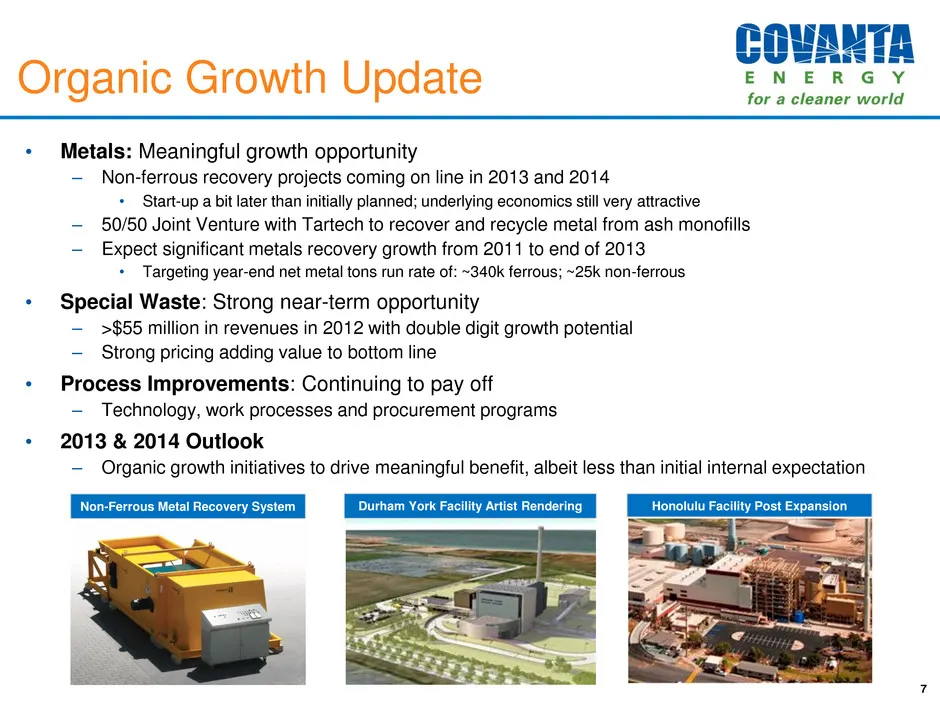
Slide 7: Organic Growth Update
Organic Growth Update 7 • Metals: Meaningful growth opportunity – Non-ferrous recovery projects coming on line in 2013 and 2014 • Start-up a bit later than initially planned; underlying economics still very attractive – 50/50 Joint Venture with Tartech to recover and recycle metal from ash monofills
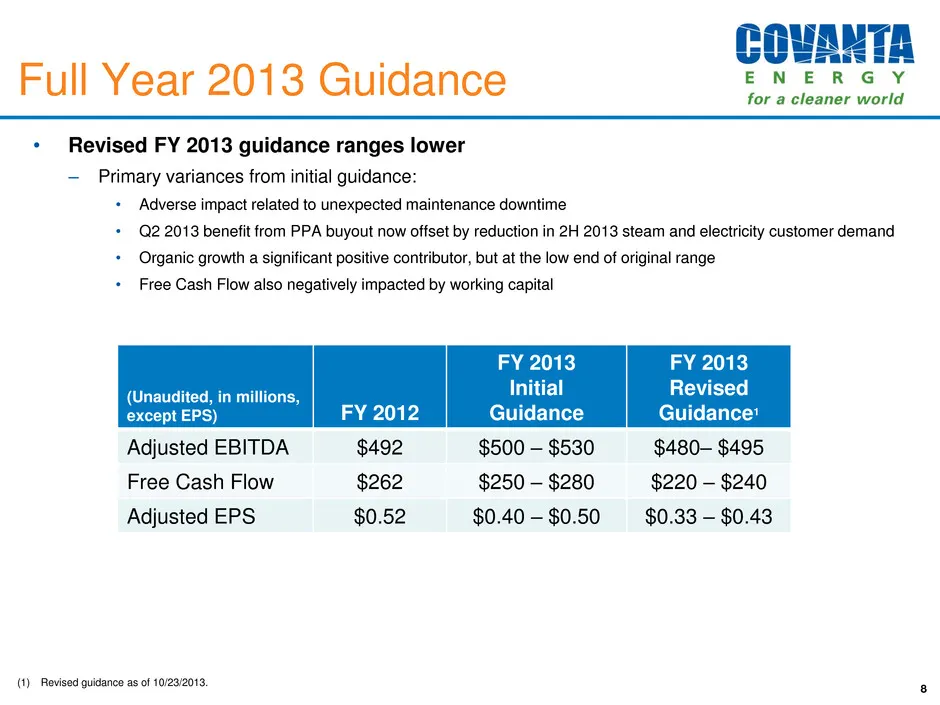
Slide 8: Full Year 2013 Guidance
• Revised FY 2013 guidance ranges lower – Primary variances from initial guidance: • Adverse impact related to unexpected maintenance downtime • Q2 2013 benefit from PPA buyout now offset by reduction in 2H 2013 steam and electricity customer demand • Organic growth a significant positive contributo
Slide 9: Business Update
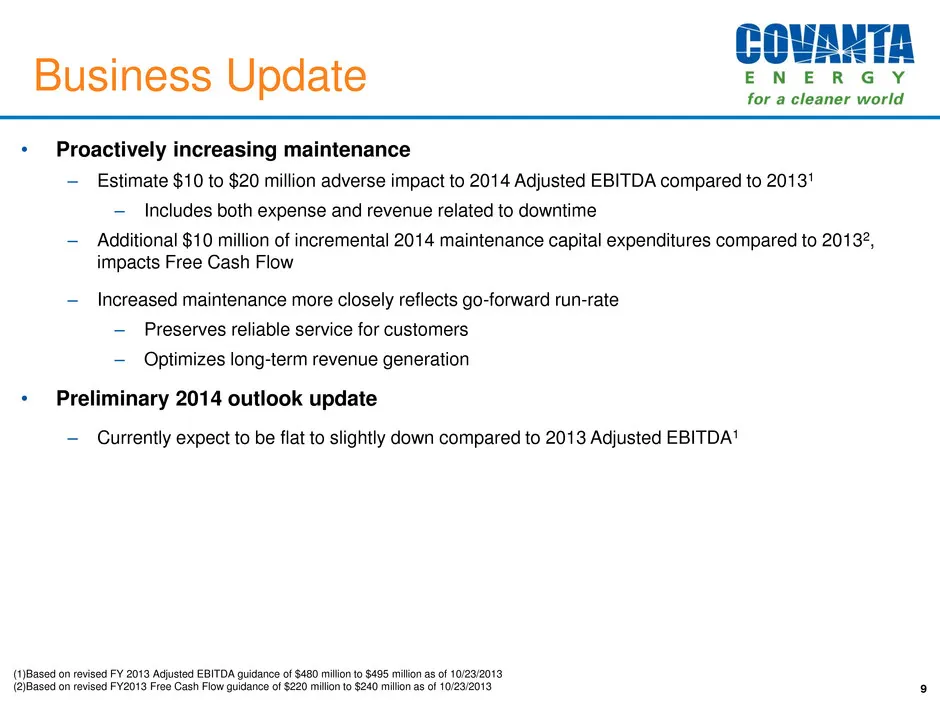
• Proactively increasing maintenance – Estimate $10 to $20 million adverse impact to 2014 Adjusted EBITDA compared to 20131 – Includes both expense and revenue related to downtime – Additional $10 million of incremental 2014 maintenance capital expenditures compared to 20132, impacts Free Cash Flow
Slide 10: Key Investment Highlights
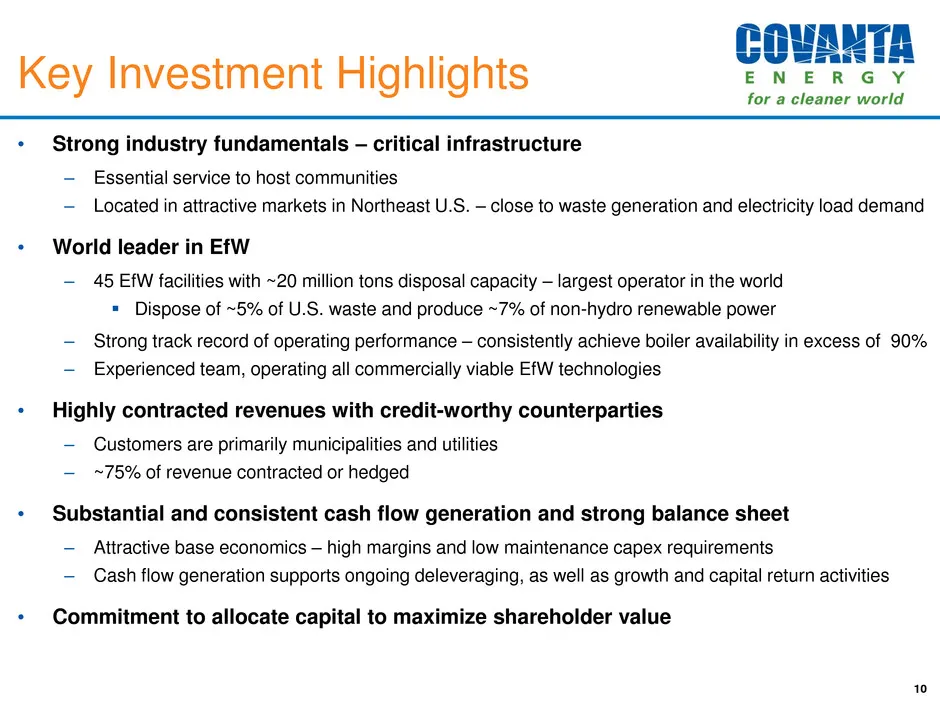
Key Investment Highlights • Strong industry fundamentals – critical infrastructure – Essential service to host communities – Located in attractive markets in Northeast U.S. – close to waste generation and electricity load demand • World leader in EfW – 45 EfW facilities with ~20 million tons disposa
Slide 11: Covanta Holding Corp. Appendix November 2013
Covanta Holding Corp. Investor Presentation NYSE: CVA Appendix 11 November 2013
Slide 12: Energy-from-Waste Process
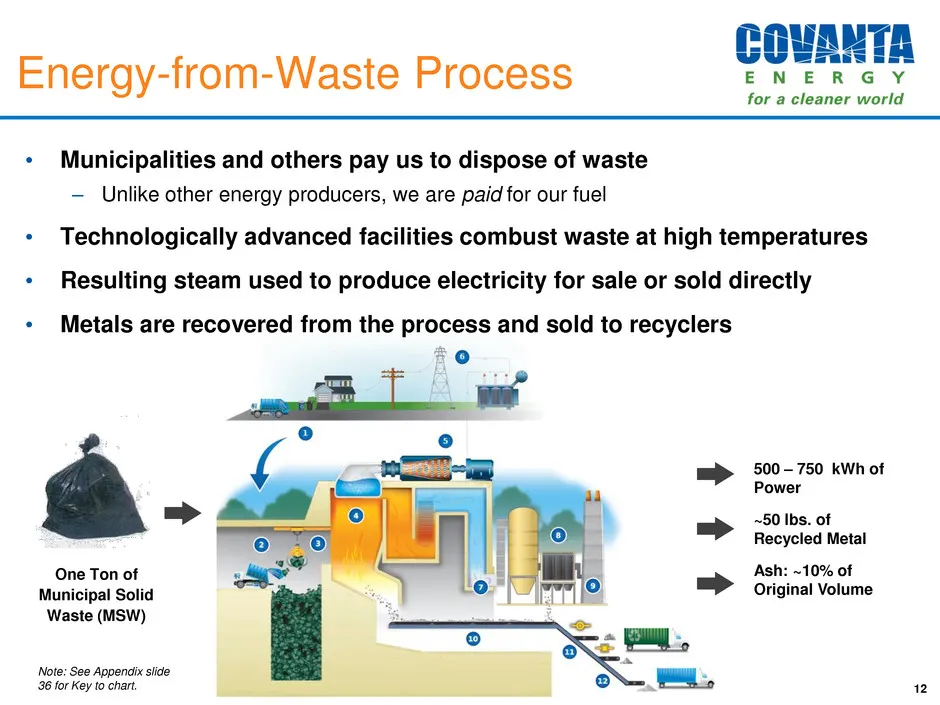
Energy-from-Waste Process 500 – 750 kWh of Power ~50 lbs. of Recycled Metal Ash: ~10% of Original Volume One Ton of Municipal Solid Waste (MSW) • Municipalities and others pay us to dispose of waste – Unlike other energy producers, we are paid for our fuel • Technologically advanced facilities combu
Slide 13: EfW Project Structures
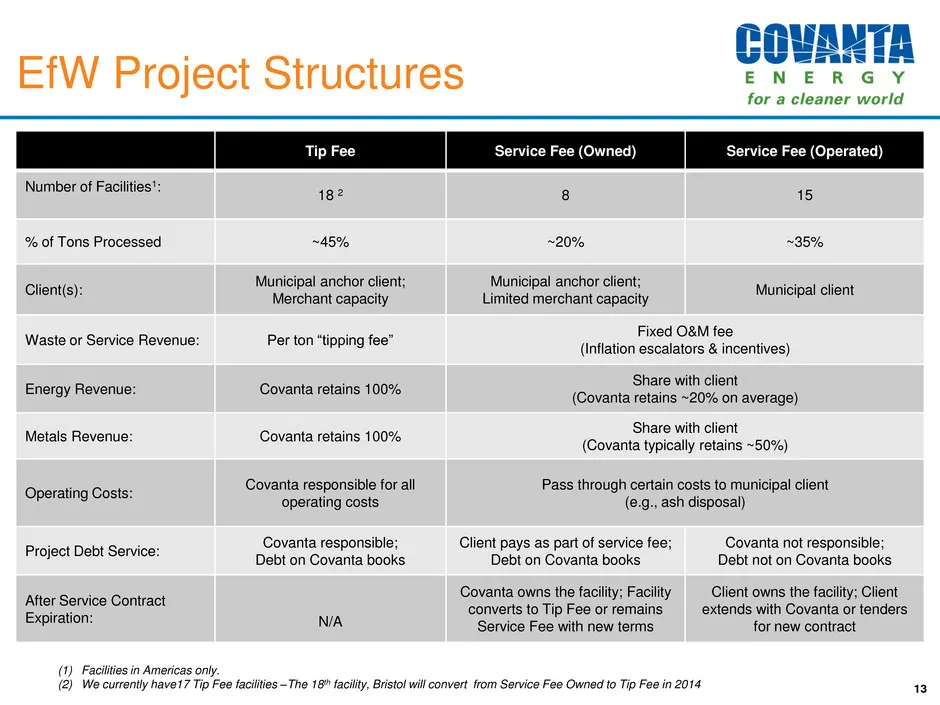
EfW Project Structures 13 Tip Fee Service Fee (Owned) Service Fee (Operated) Number of Facilities1: 18 2 8 15 % of Tons Processed ~45% ~20% ~35% Client(s): Municipal anchor client; Merchant capacity Municipal anchor client; Limited merchant capacity Municipal client Waste or Service Revenue: Per ton
Slide 14: Highly Contracted Revenue
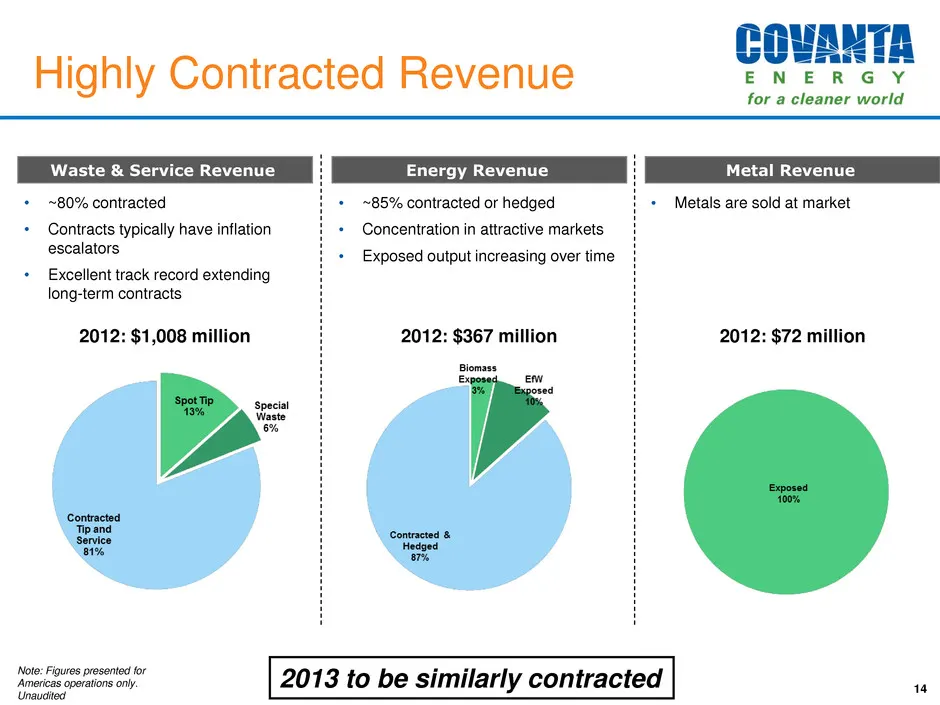
2012: $1,008 million Highly Contracted Revenue • ~80% contracted • Contracts typically have inflation escalators • Excellent track record extending long-term contracts 14 Waste & Service Revenue 2012: $367 million Note: Figures presented for Americas operations only. Unaudited Energy Revenue • ~85%
Slide 15: Business Drivers
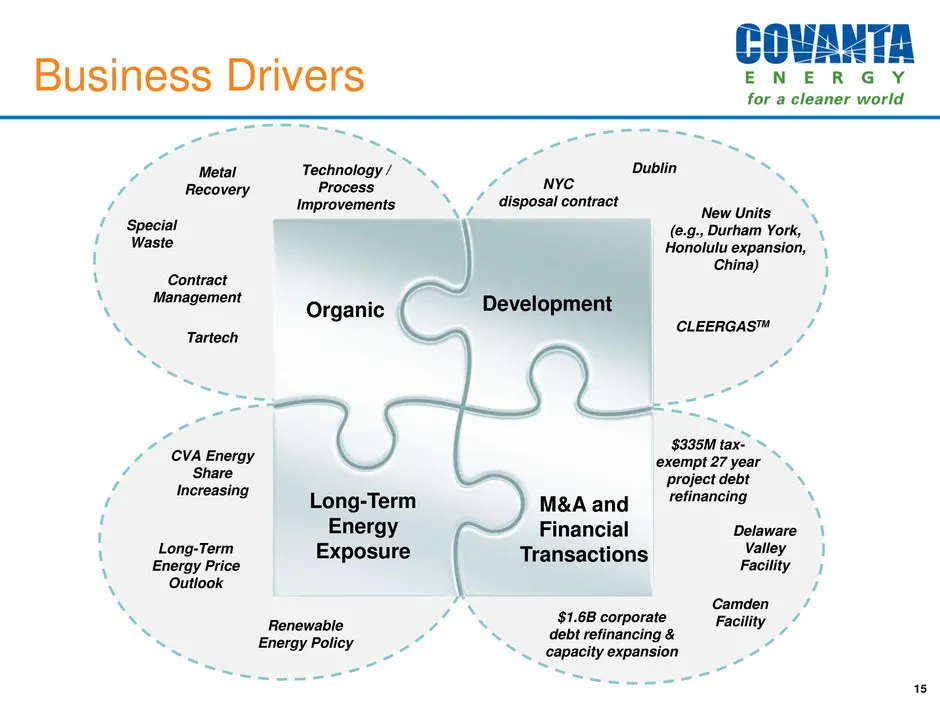
Business Drivers 15 Organic Development Long-Term Energy Exposure M&A and Financial Transactions Metal Recovery Special Waste Technology / Process Improvements Contract Management Dublin New Units (e.g., Durham York, Honolulu expansion, China) Delaware Valley Facility CVA Energy Share Increasing Lon
Slide 16: Major Municipal Waste Contract Transitions from 2008 - 2020
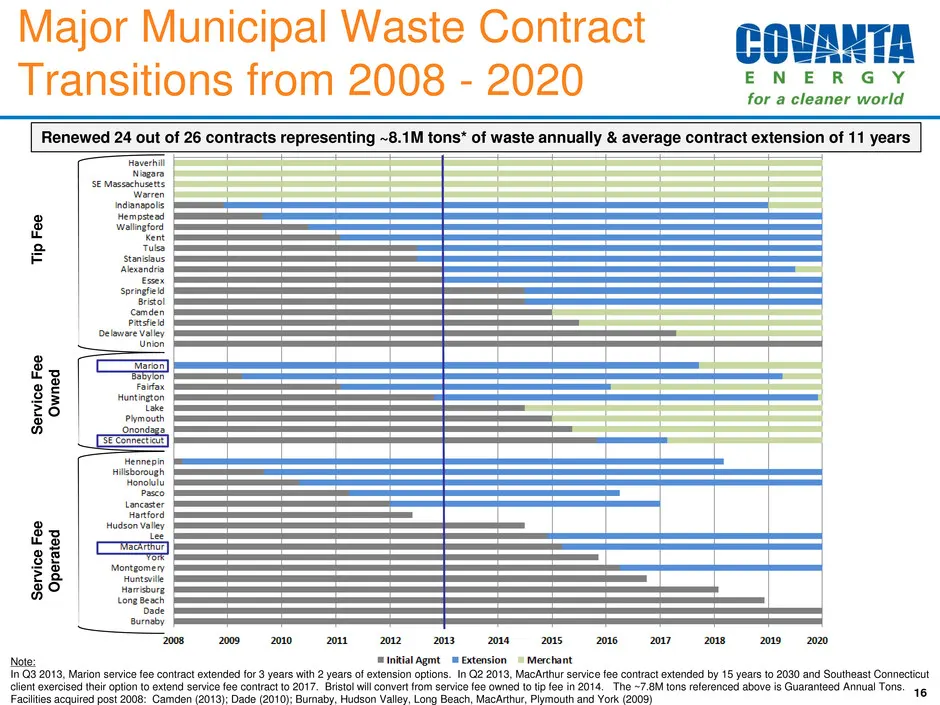
T ip F e e S er v ic e F e e O w n e d S er v ic e F e e O p e ra te d Major Municipal Waste Contract Transitions from 2008 - 2020 16 Renewed 24 out of 26 contracts representing ~8.1M tons* of waste annually & average contract extension of 11 years Note: In Q3 2013, Marion service fee contract exten
Slide 17: Updated Energy Portfolio Outlook
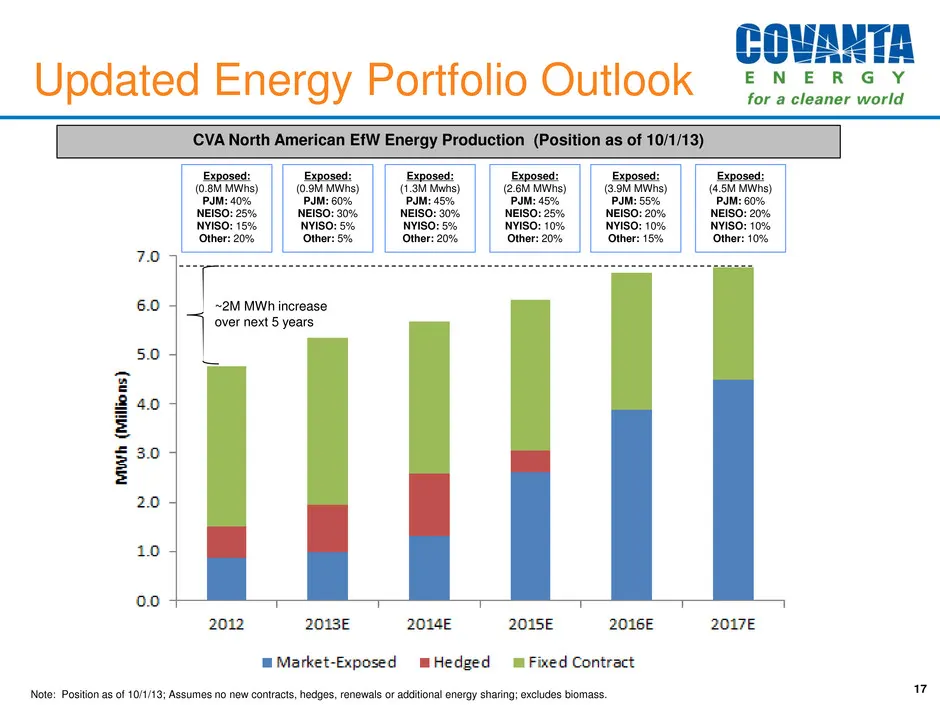
Updated Energy Portfolio Outlook 17 Note: Position as of 10/1/13; Assumes no new contracts, hedges, renewals or additional energy sharing; excludes biomass. CVA North American EfW Energy Production (Position as of 10/1/13) ~2M MWh increase over next 5 years Exposed: (0.8M MWhs) PJM: 40% NEISO: 25% N
Slide 18: New York City Waste Agreement
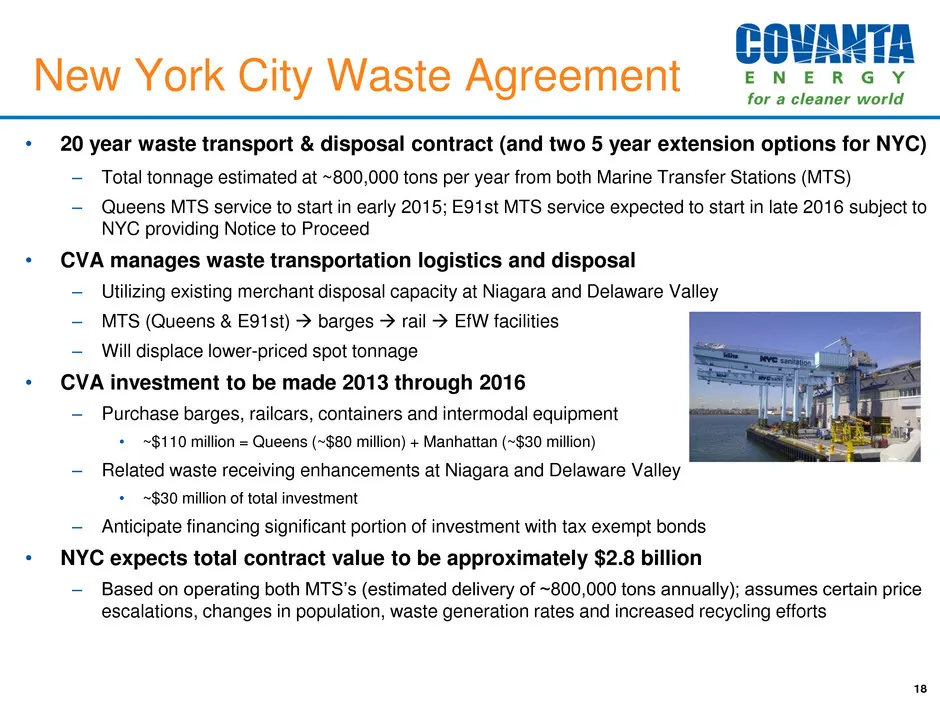
New York City Waste Agreement • 20 year waste transport & disposal contract (and two 5 year extension options for NYC) – Total tonnage estimated at ~800,000 tons per year from both Marine Transfer Stations (MTS) – Queens MTS service to start in early 2015; E91st MTS service expected to start in late
Slide 19: Growth Investments
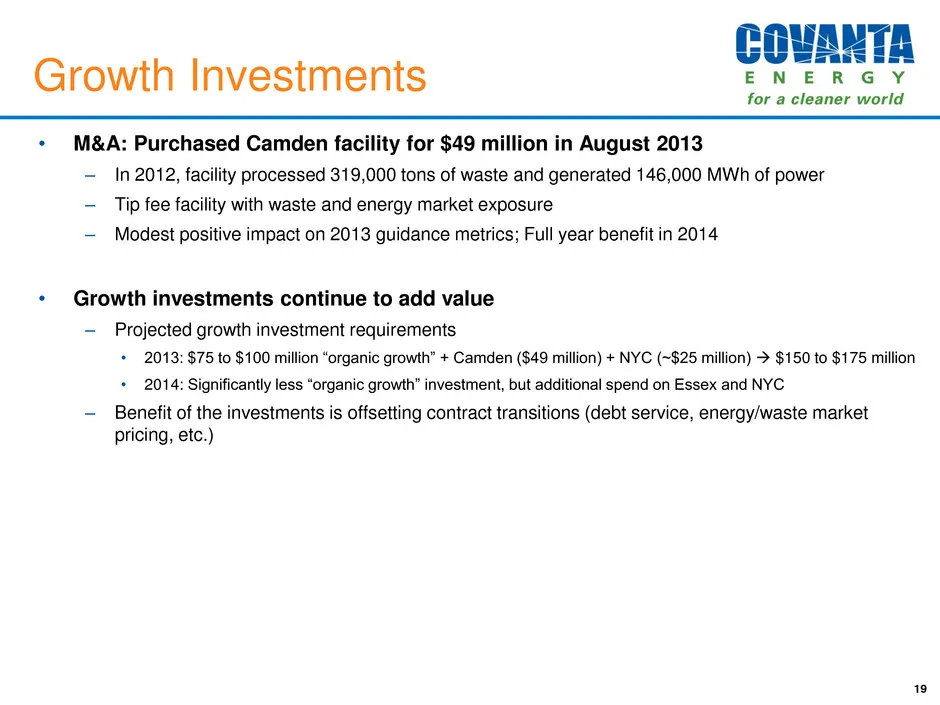
Growth Investments • M&A: Purchased Camden facility for $49 million in August 2013 – In 2012, facility processed 319,000 tons of waste and generated 146,000 MWh of power – Tip fee facility with waste and energy market exposure – Modest positive impact on 2013 guidance metrics; Full year benefit in 2
Slide 20: Growth Investment Outlook
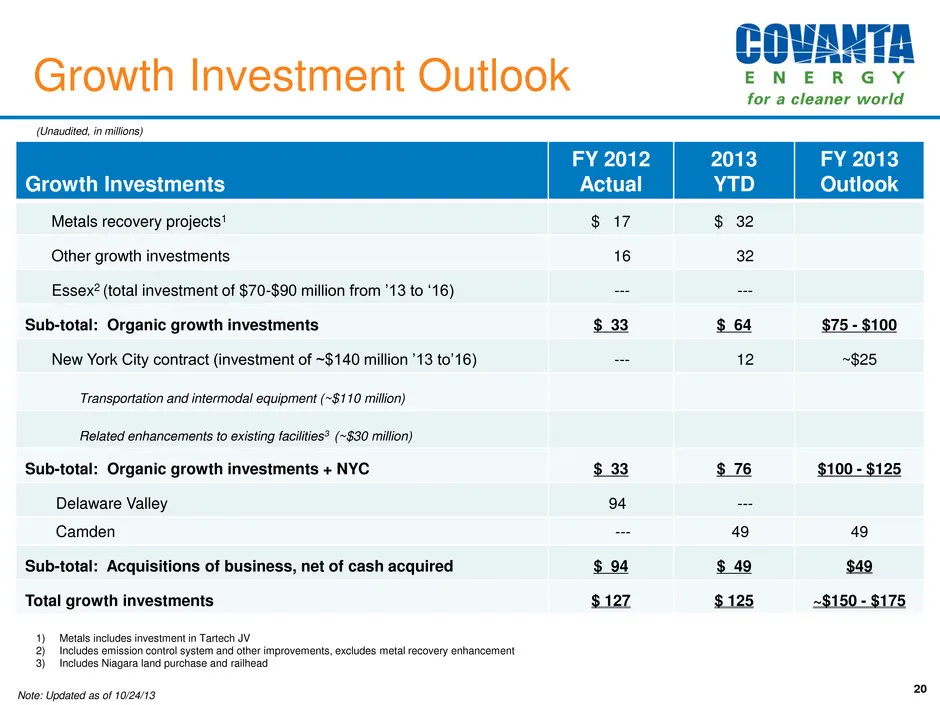
Growth Investment Outlook 20 Growth Investments FY 2012 Actual 2013 YTD FY 2013 Outlook Metals recovery projects1 $ 17 $ 32 Other growth investments 16 32 Essex2 (total investment of $70-$90 million from ’13 to ‘16) --- --- Sub-total: Organic growth investments $ 33 $ 64 $75 - $100 New York City con
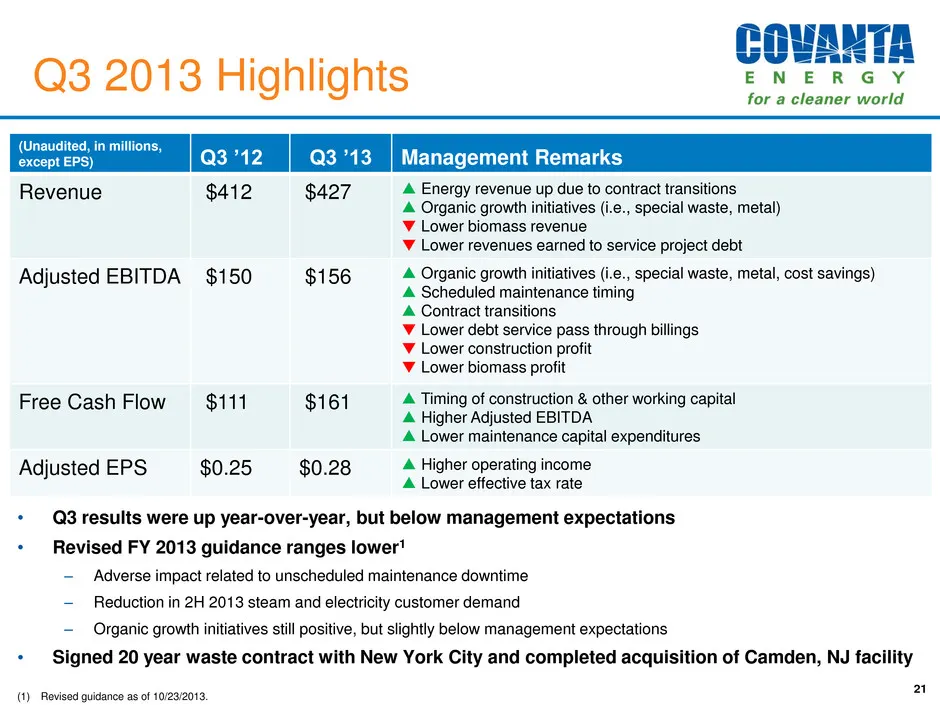
Slide 21: Q3 2013 Highlights
Q3 2013 Highlights 21 • Q3 results were up year-over-year, but below management expectations • Revised FY 2013 guidance ranges lower1 – Adverse impact related to unscheduled maintenance downtime – Reduction in 2H 2013 steam and electricity customer demand – Organic growth initiatives still positive,
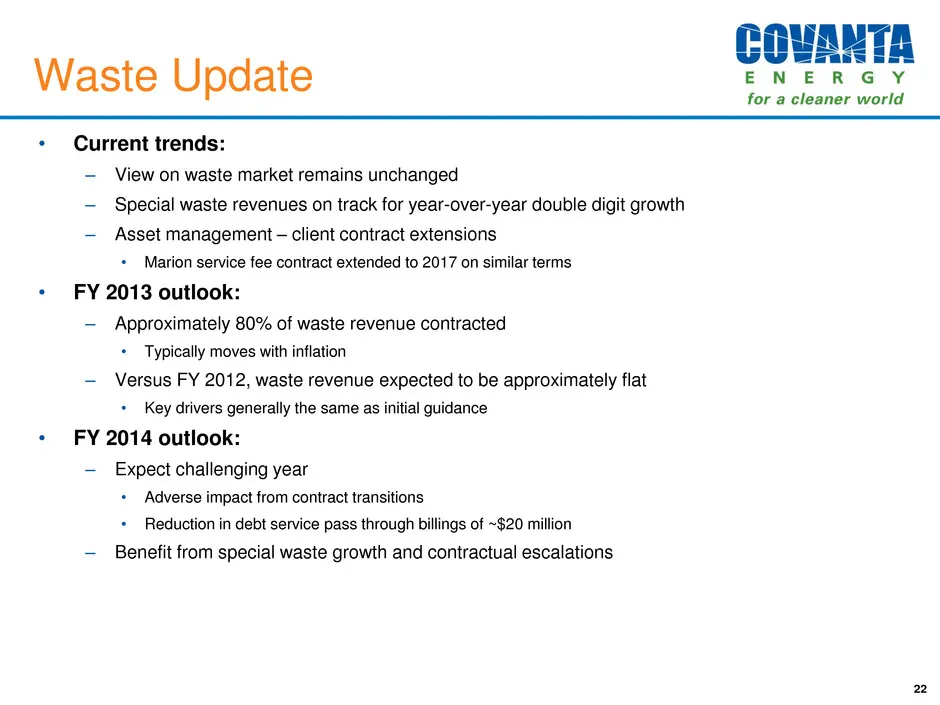
Slide 22: Waste Update
Waste Update • Current trends: – View on waste market remains unchanged – Special waste revenues on track for year-over-year double digit growth – Asset management – client contract extensions • Marion service fee contract extended to 2017 on similar terms • FY 2013 outlook: – Approximately 80% of w
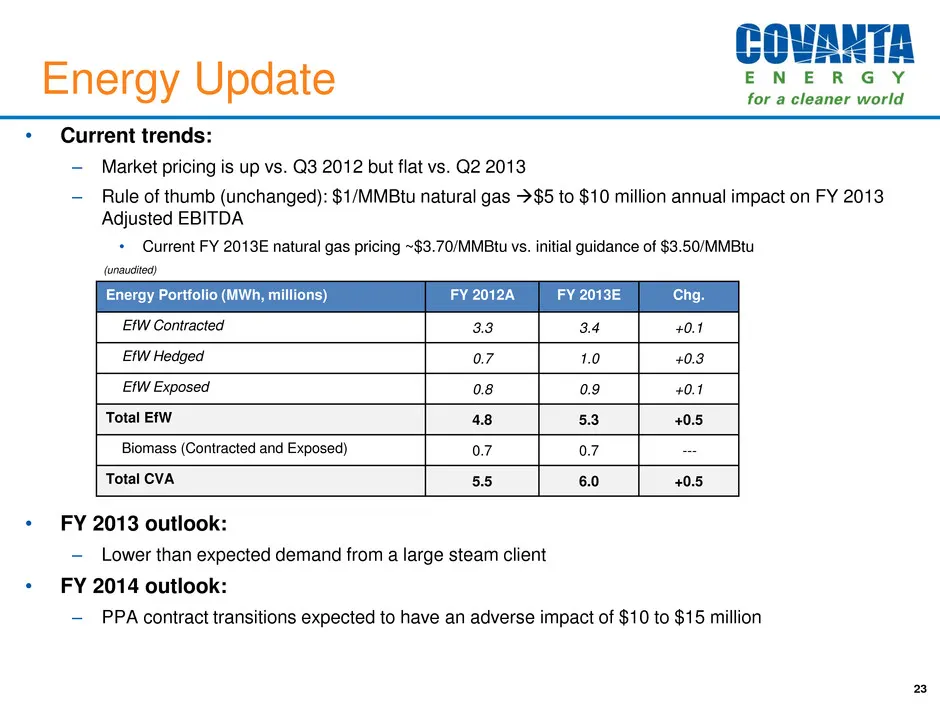
Slide 23: Energy Update
Energy Update • Current trends: – Market pricing is up vs. Q3 2012 but flat vs. Q2 2013 – Rule of thumb (unchanged): $1/MMBtu natural gas $5 to $10 million annual impact on FY 2013 Adjusted EBITDA • Current FY 2013E natural gas pricing ~$3.70/MMBtu vs. initial guidance of $3.50/MMBtu • FY 2013 outl
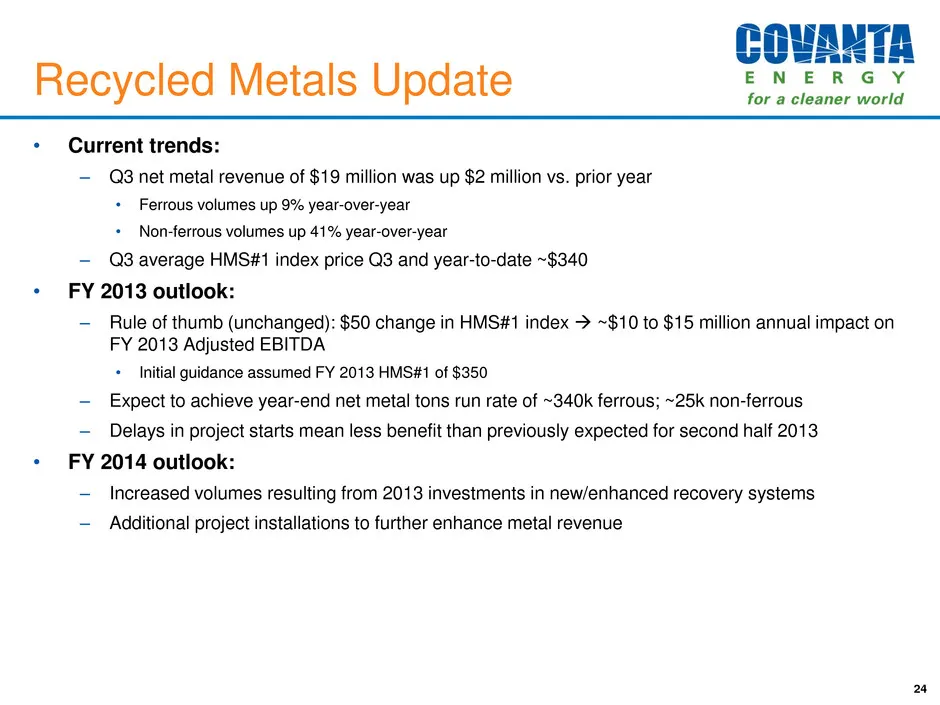
Slide 24: Recycled Metals Update
Recycled Metals Update • Current trends: – Q3 net metal revenue of $19 million was up $2 million vs. prior year • Ferrous volumes up 9% year-over-year • Non-ferrous volumes up 41% year-over-year – Q3 average HMS#1 index price Q3 and year-to-date ~$340 • FY 2013 outlook: – Rule of thumb (unchanged):
Slide 25: Shareholder Returns
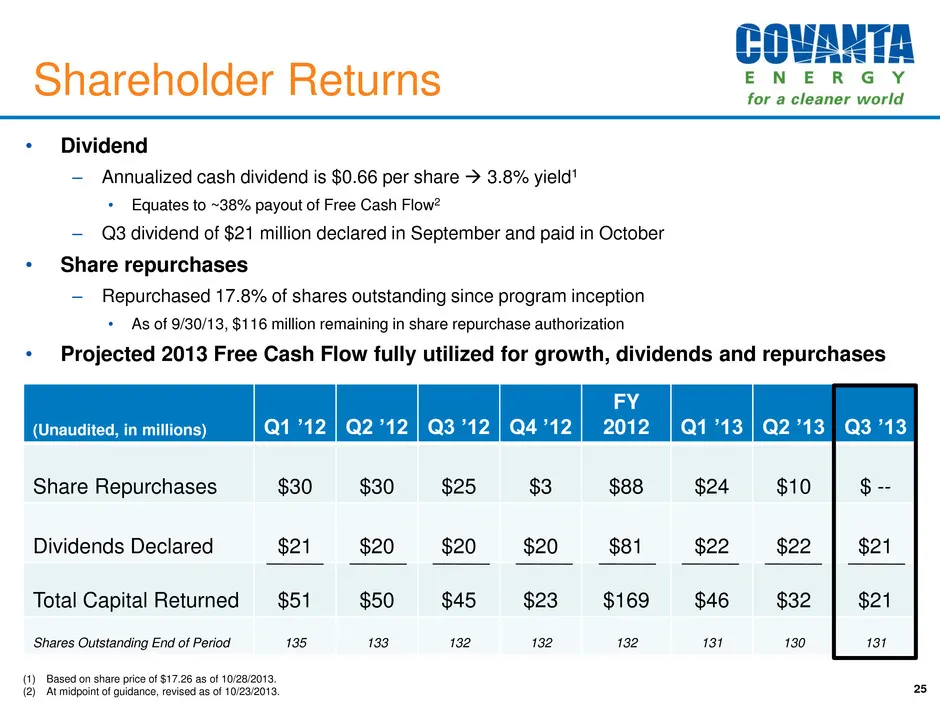
• Dividend – Annualized cash dividend is $0.66 per share 3.8% yield1 • Equates to ~38% payout of Free Cash Flow2 – Q3 dividend of $21 million declared in September and paid in October • Share repurchases – Repurchased 17.8% of shares outstanding since program inception • As of 9/30/13, $116 millio
Slide 26: Q3 2013 Summary Results
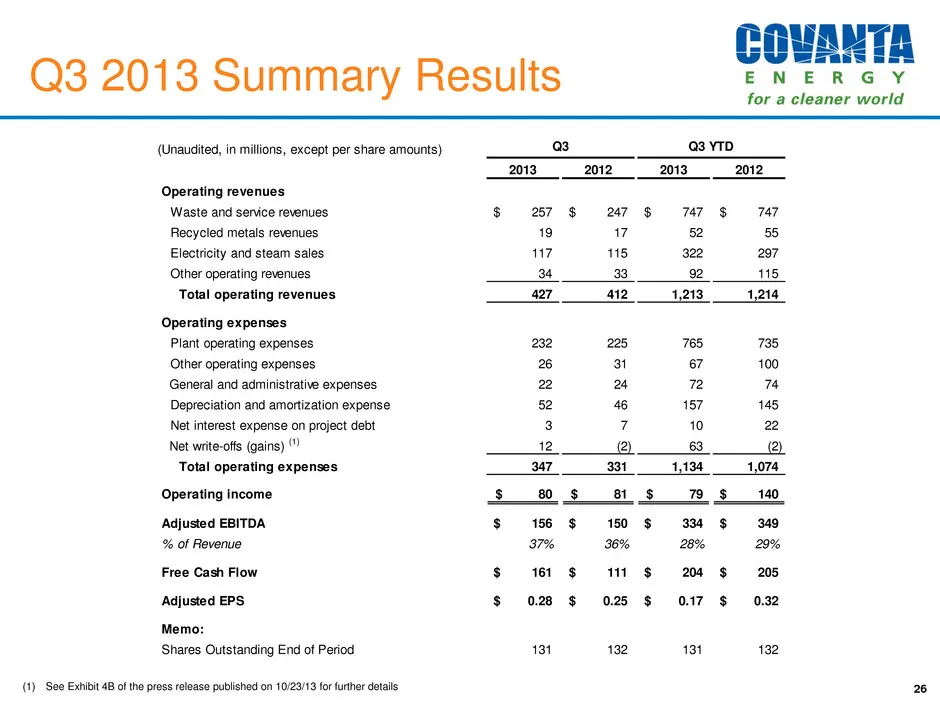
Q3 2013 Summary Results 26 (1) See Exhibit 4B of the press release published on 10/23/13 for further details (Unaudited, in millions, except per share amounts) Q3 Q3 YTD 2013 2012 2013 2012 Operating revenues Waste and service revenues 257$ 247$ 747$ 747$ Recycled metals revenues 19 17 52 55 Electri
Slide 27: Balance Sheet and Leverage
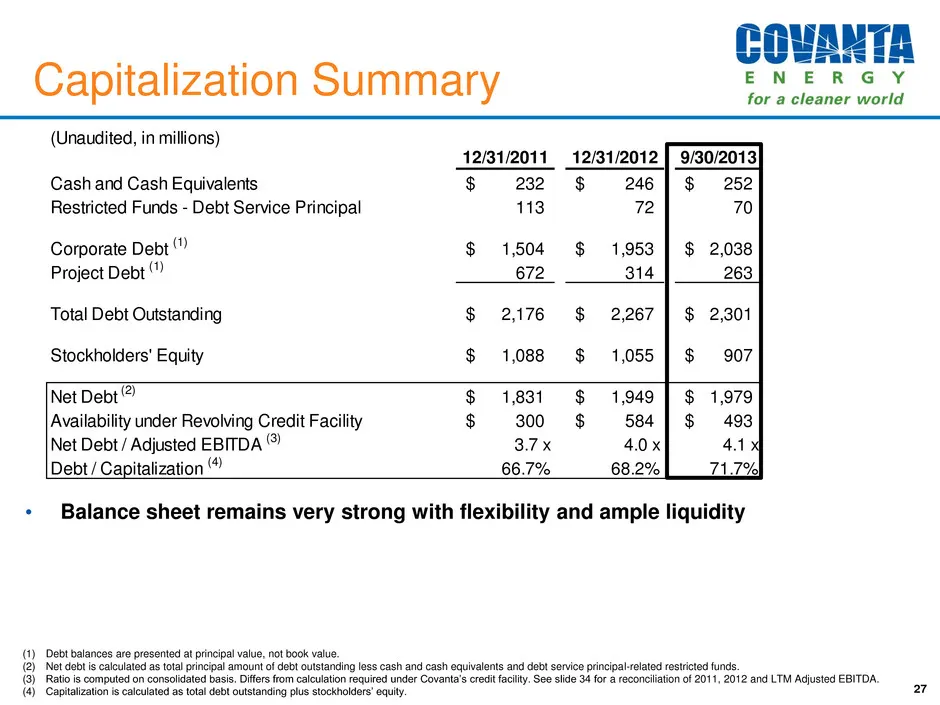
(Unaudited, in millions) 12/31/2011 12/31/2012 9/30/2013 Cash and Cash Equivalents 232$ 246$ 252$ Restricted Funds - Debt Service Principal 113 72 70 Corporate Debt (1) 1,504$ 1,953$ 2,038$ Project Debt (1) 672 314 263 Total Debt Outstanding 2,176$ 2,267$ 2,301$ Stockholders' Equity 1,088$ 1,055$ 90
Slide 28: Debt Structure
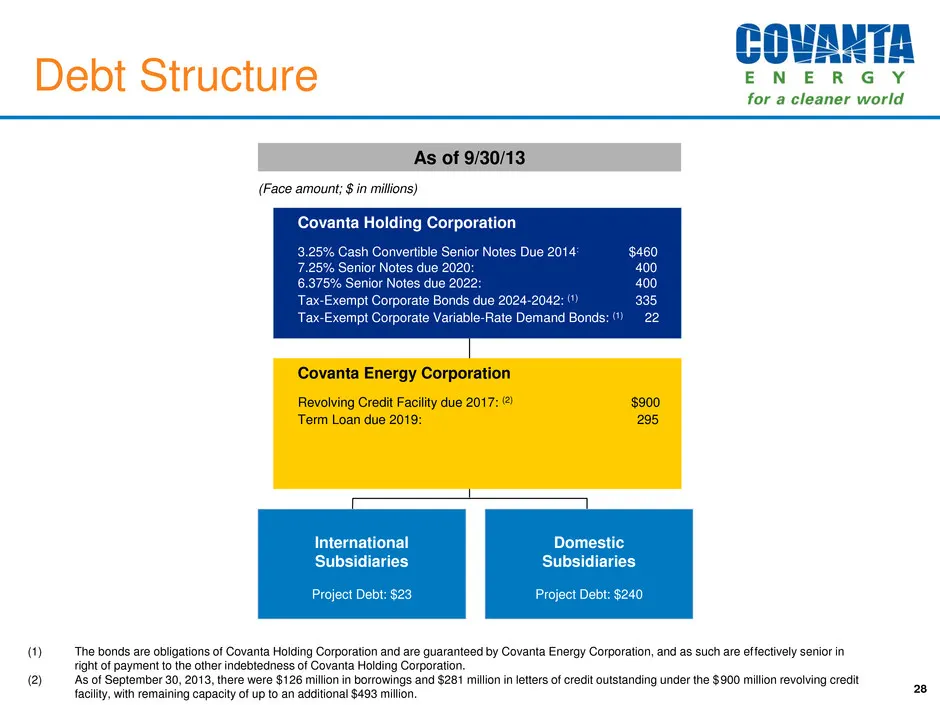
28 Debt Structure (1) The bonds are obligations of Covanta Holding Corporation and are guaranteed by Covanta Energy Corporation, and as such are effectively senior in right of payment to the other indebtedness of Covanta Holding Corporation. (2) As of September 30, 2013, there were $126 million in b
Slide 29: Project Debt Repayment Schedule
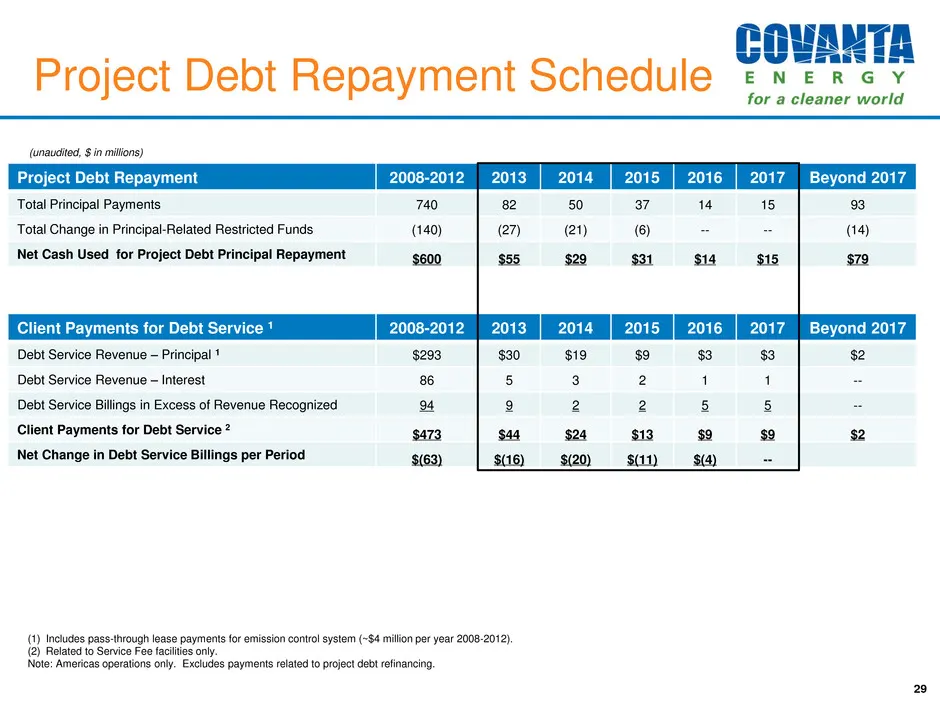
Project Debt Repayment Schedule 29 Project Debt Repayment 2008-2012 2013 2014 2015 2016 2017 Beyond 2017 Total Principal Payments 740 82 50 37 14 15 93 Total Change in Principal-Related Restricted Funds (140) (27) (21) (6) -- -- (14) Net Cash Used for Project Debt Principal Repayment $600 $55 $29 $3
Slide 30: Construction Working Capital
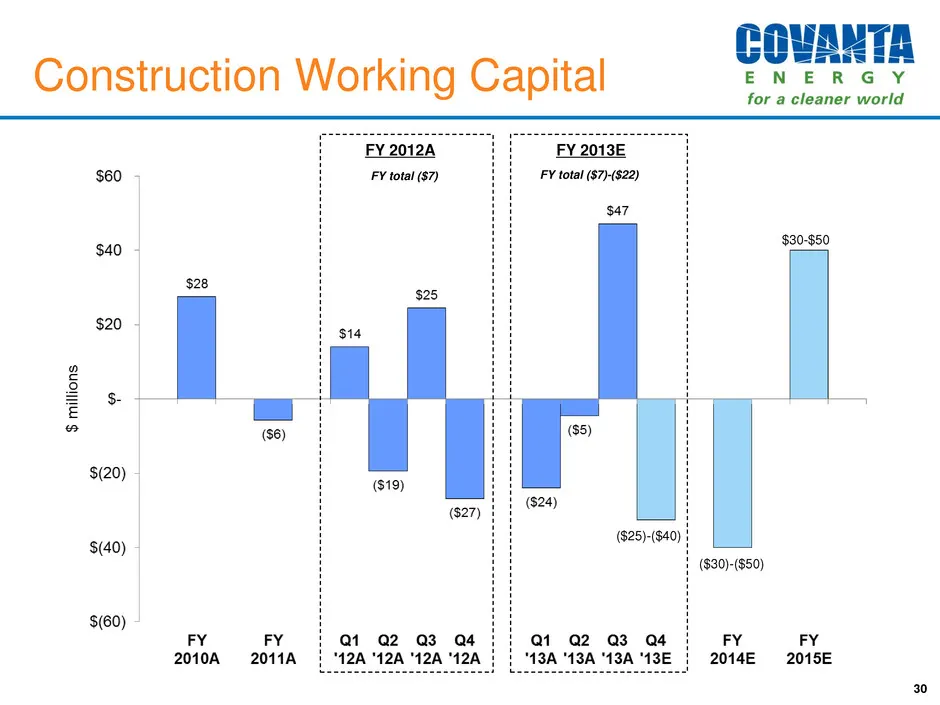
Construction Working Capital 30 FY 2012A FY 2013E ($30)-($50) $30-$50 ($25)-($40) FY total ($7) FY total ($7)-($22)
Slide 31: Tax Outlook
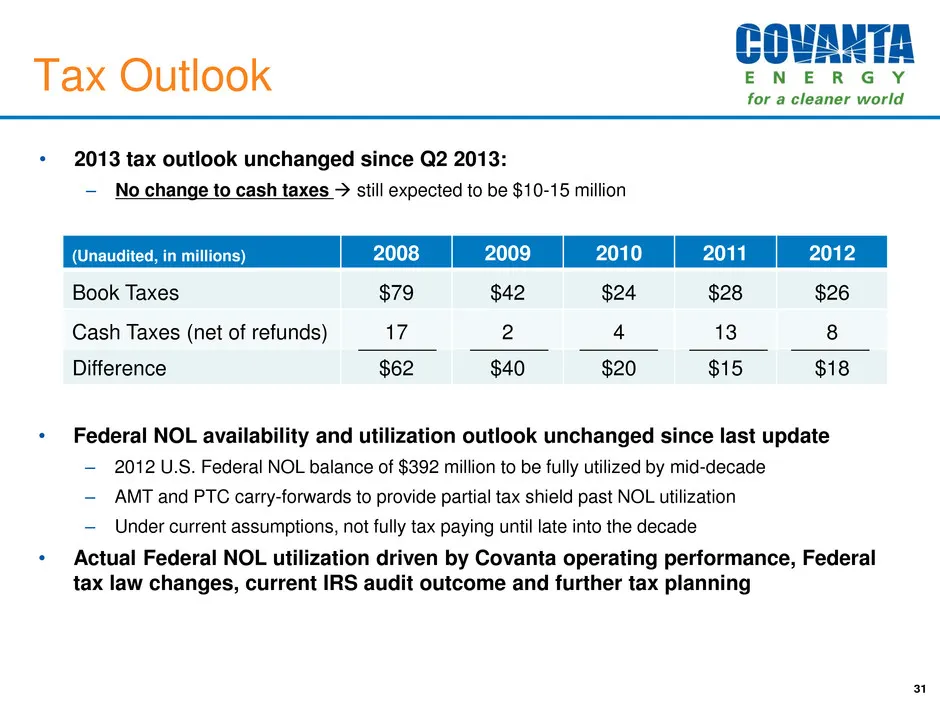
Tax Outlook • 2013 tax outlook unchanged since Q2 2013: – No change to cash taxes still expected to be $10-15 million 31 • Federal NOL availability and utilization outlook unchanged since last update – 2012 U.S. Federal NOL balance of $392 million to be fully utilized by mid-decade – AMT and PTC c
Slide 32: Free Cash Flow vs. Net Income
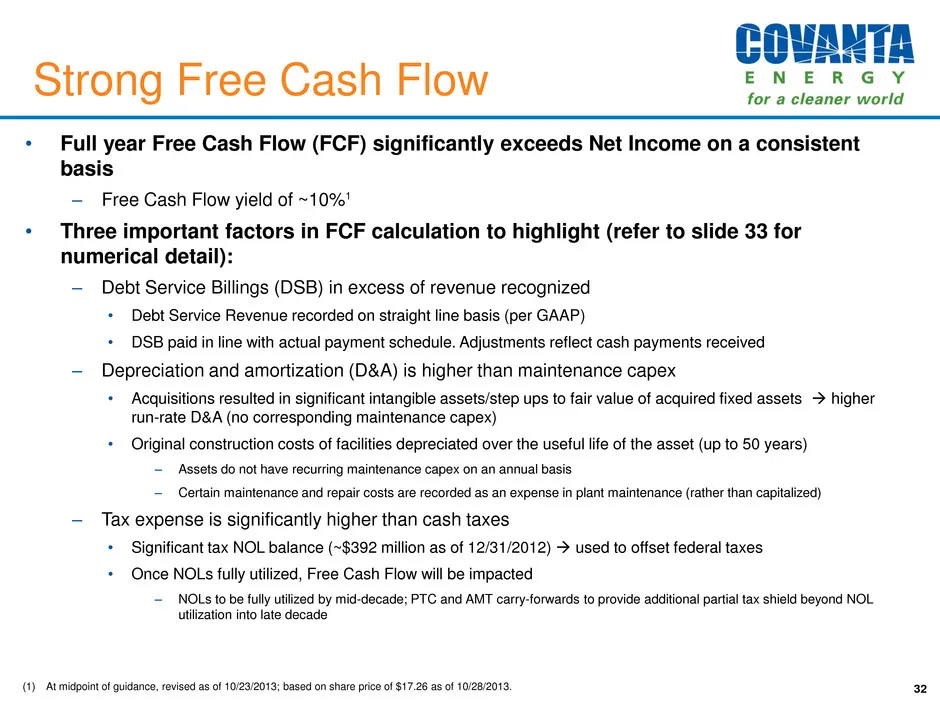
(1) At midpoint of guidance, revised as of 10/23/2013; based on share price of $17.26 as of 10/28/2013. 32 • Full year Free Cash Flow (FCF) significantly exceeds Net Income on a consistent basis – Free Cash Flow yield of ~10%1 • Three important factors in FCF calculation to highlight (refer to slide
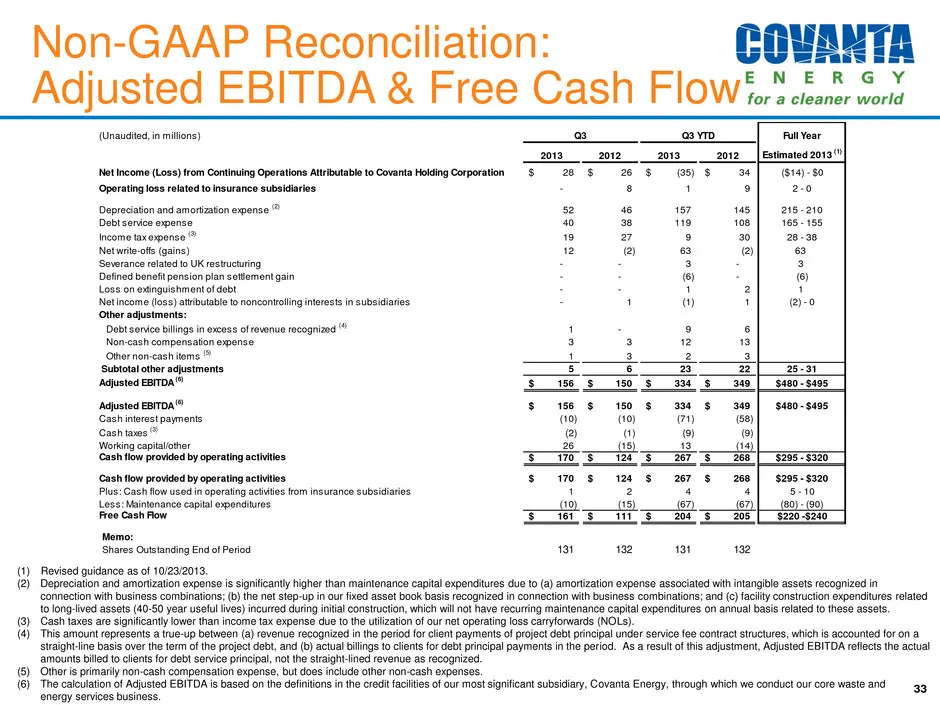
Slide 33: Non-GAAP Reconciliation: Adjusted EBITDA & Free Cash Flow
Non-GAAP Reconciliation: Adjusted EBITDA & Free Cash Flow (1) Revised guidance as of 10/23/2013. (2) Depreciation and amortization expense is significantly higher than maintenance capital expenditures due to (a) amortization expense associated with intangible assets recognized in connection with bus
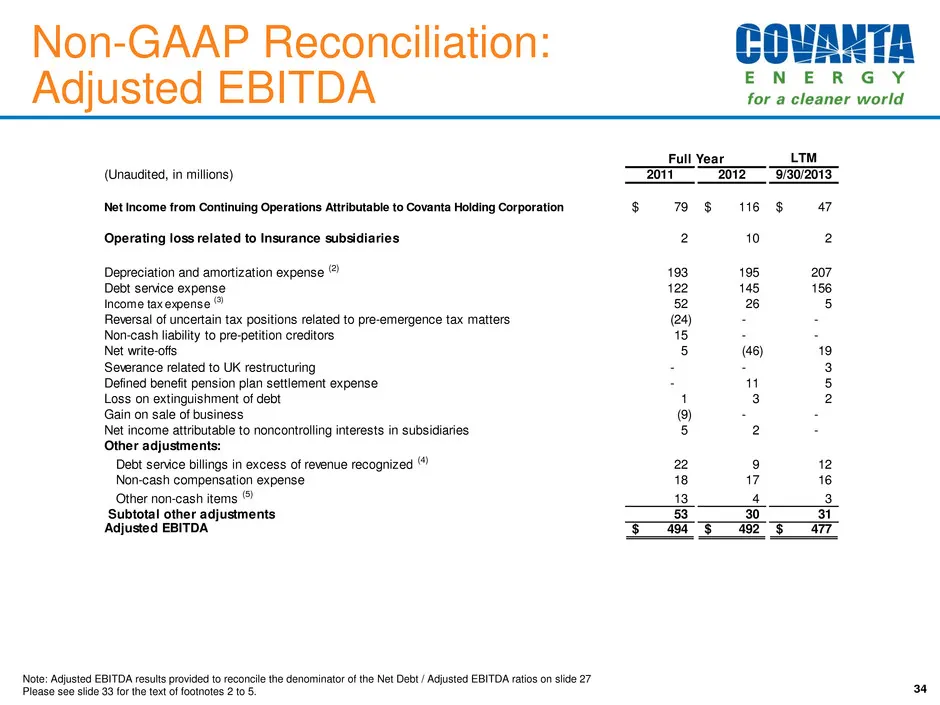
Slide 34: Non-GAAP Reconciliation: Adjusted EBITDA
Non-GAAP Reconciliation: Adjusted EBITDA 34 Note: Adjusted EBITDA results provided to reconcile the denominator of the Net Debt / Adjusted EBITDA ratios on slide 27 Please see slide 33 for the text of footnotes 2 to 5. Full Year LTM (Unaudited, in millions) 2011 2012 9/30/2013 Net Income from Contin
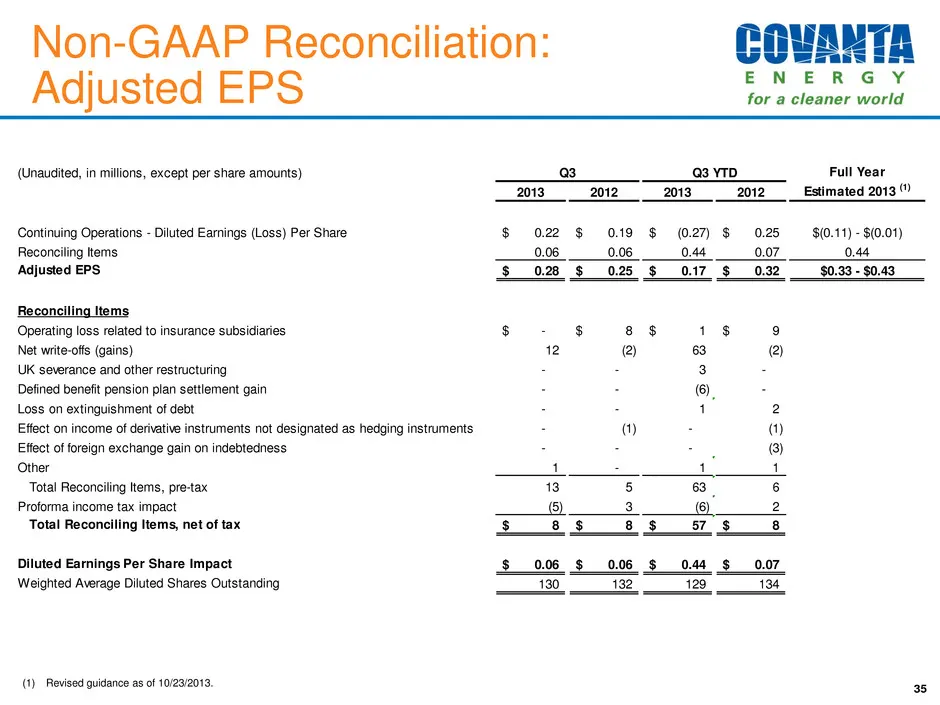
Slide 35: Non-GAAP Reconciliation: Adjusted EPS
35 (1) Revised guidance as of 10/23/2013. Non-GAAP Reconciliation: Adjusted EPS (Unaudited, in millions, except per share amounts) Full Year 2013 2012 2013 2012 Estimated 2013 (1) Continuing Operations - Diluted Earnings (Loss) Per Share 0.22$ 0.19$ (0.27)$ 0.25$ $(0.11) - $(0.01) Reconciling Items
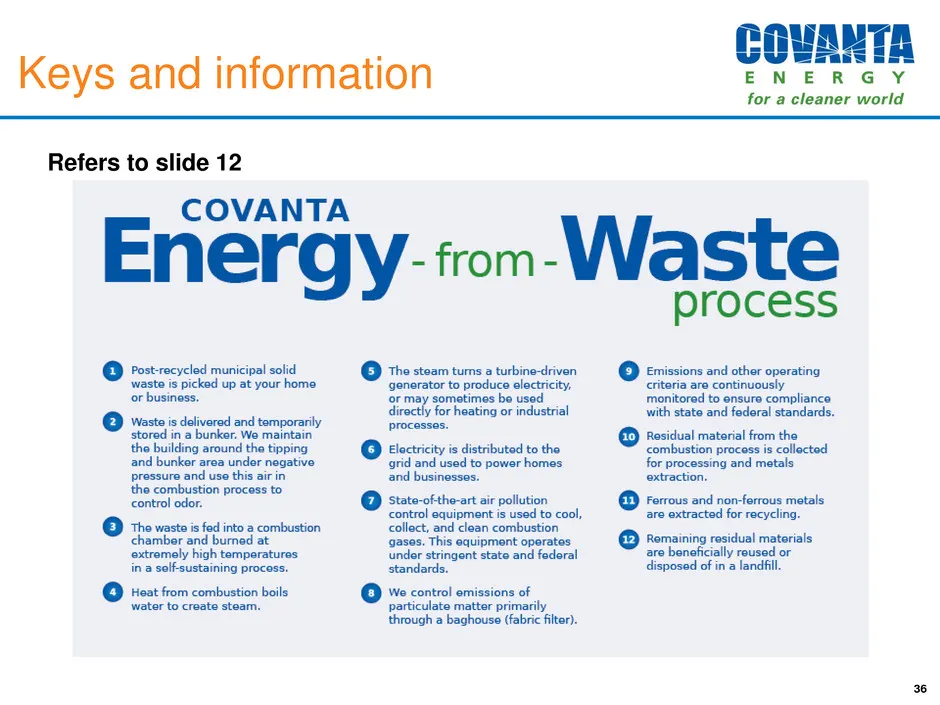
Slide 36: Keys and information
Keys and information 36 Refers to slide 12
Slide 37: EfW Plant / Facility Detail
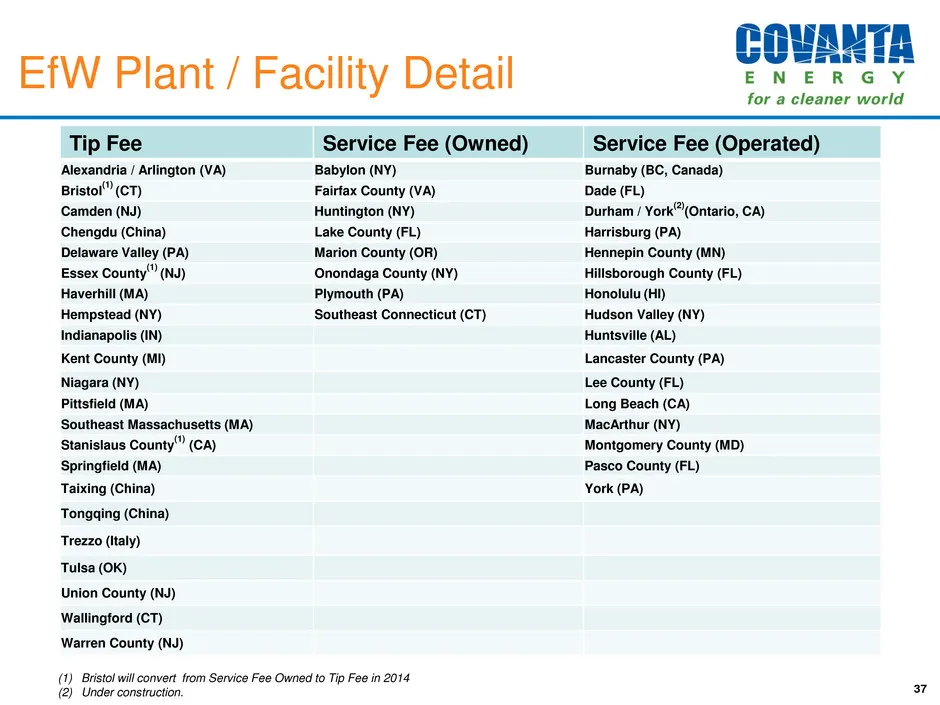
EfW Plant / Facility Detail 37 Tip Fee Service Fee (Owned) Service Fee (Operated) Alexandria / Arlington (VA) Babylon (NY) Burnaby (BC, Canada) Bristol (1) (CT) Fairfax County (VA) Dade (FL) Camden (NJ) Huntington (NY) Durham / York (2) (Ontario, CA) Chengdu (China) Lake County (FL) Harrisburg (PA)
Slide 38: Free Cash Flow
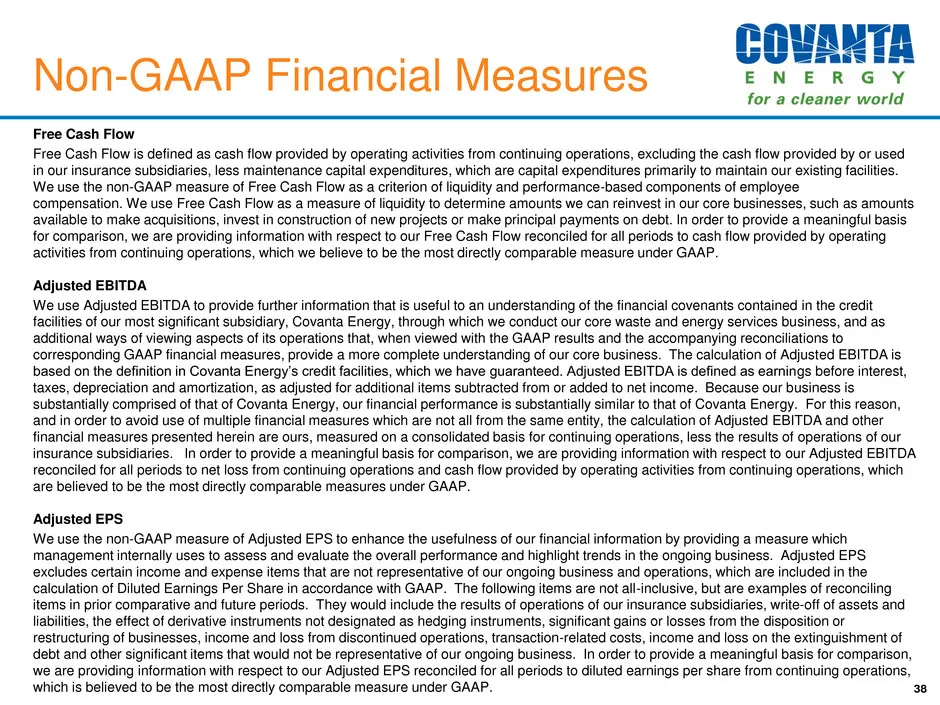
Free Cash Flow Free Cash Flow is defined as cash flow provided by operating activities from continuing operations, excluding the cash flow provided by or used in our insurance subsidiaries, less maintenance capital expenditures, which are capital expenditures primarily to maintain our existing facil
Slide 39: Covanta Holding Corp Investor Relations
Covanta Holding Corp NYSE: CVA Investor Relations: 445 South Street Morristown, NJ 07960 (862)345-5456 IR@covantaenergy.com 39
Source: SEC EDGAR · 8-K filed Nov 4, 2013
More decks from Covanta Holding Corporation
 Q1 2021 Earnings Presentation19 slides · Apr 29, 2021
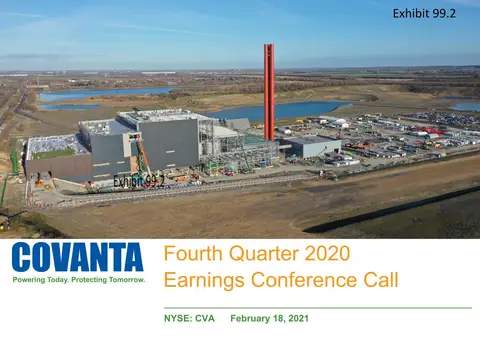 Q4 2020 Earnings Presentation22 slides · Feb 18, 2021
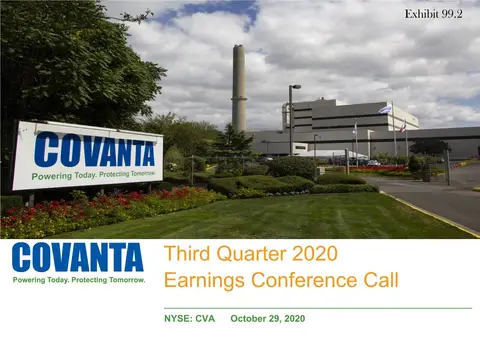 Q3 2020 Earnings Presentation17 slides · Oct 29, 2020
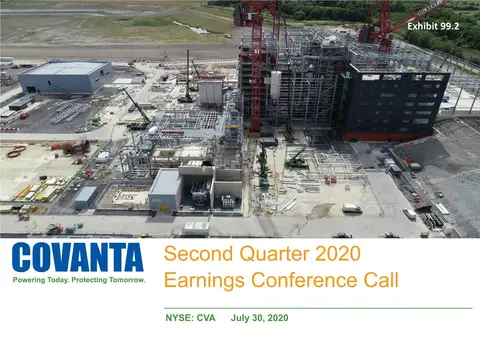 Q2 2020 Earnings Presentation18 slides · Jul 30, 2020
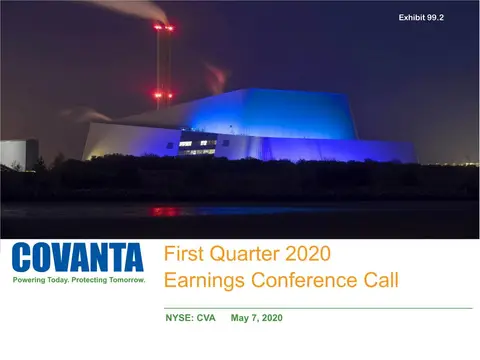 Q1 2020 Earnings Presentation20 slides · May 7, 2020
 Q4 2019 Earnings Presentation21 slides · Feb 20, 2020