Durr AG · XETR:DUE
Durr — Dürr Aktiengesellschaft — FY2007 Earnings Presentation
31 slides from Durr's earnings presentation, Mar 20, 2008
Slide 1: Analyst Conference Dürr Aktiengesellschaft
Analyst Conference Dürr Aktiengesellschaft Fiscal Year 2007 Ralf Dieter, CEO Ralph Heuwing, CFO Frankfurt, March 20, 2008
Slide 2: Disclaimer
Disclaimer This presentation has been prepared independently by Dürr AG (“Dürr”). The presentation contains statements which address such key issues as Dürr´s strategy, future financial results, market positions and product development. Such statements should be carefully considered, and it should b
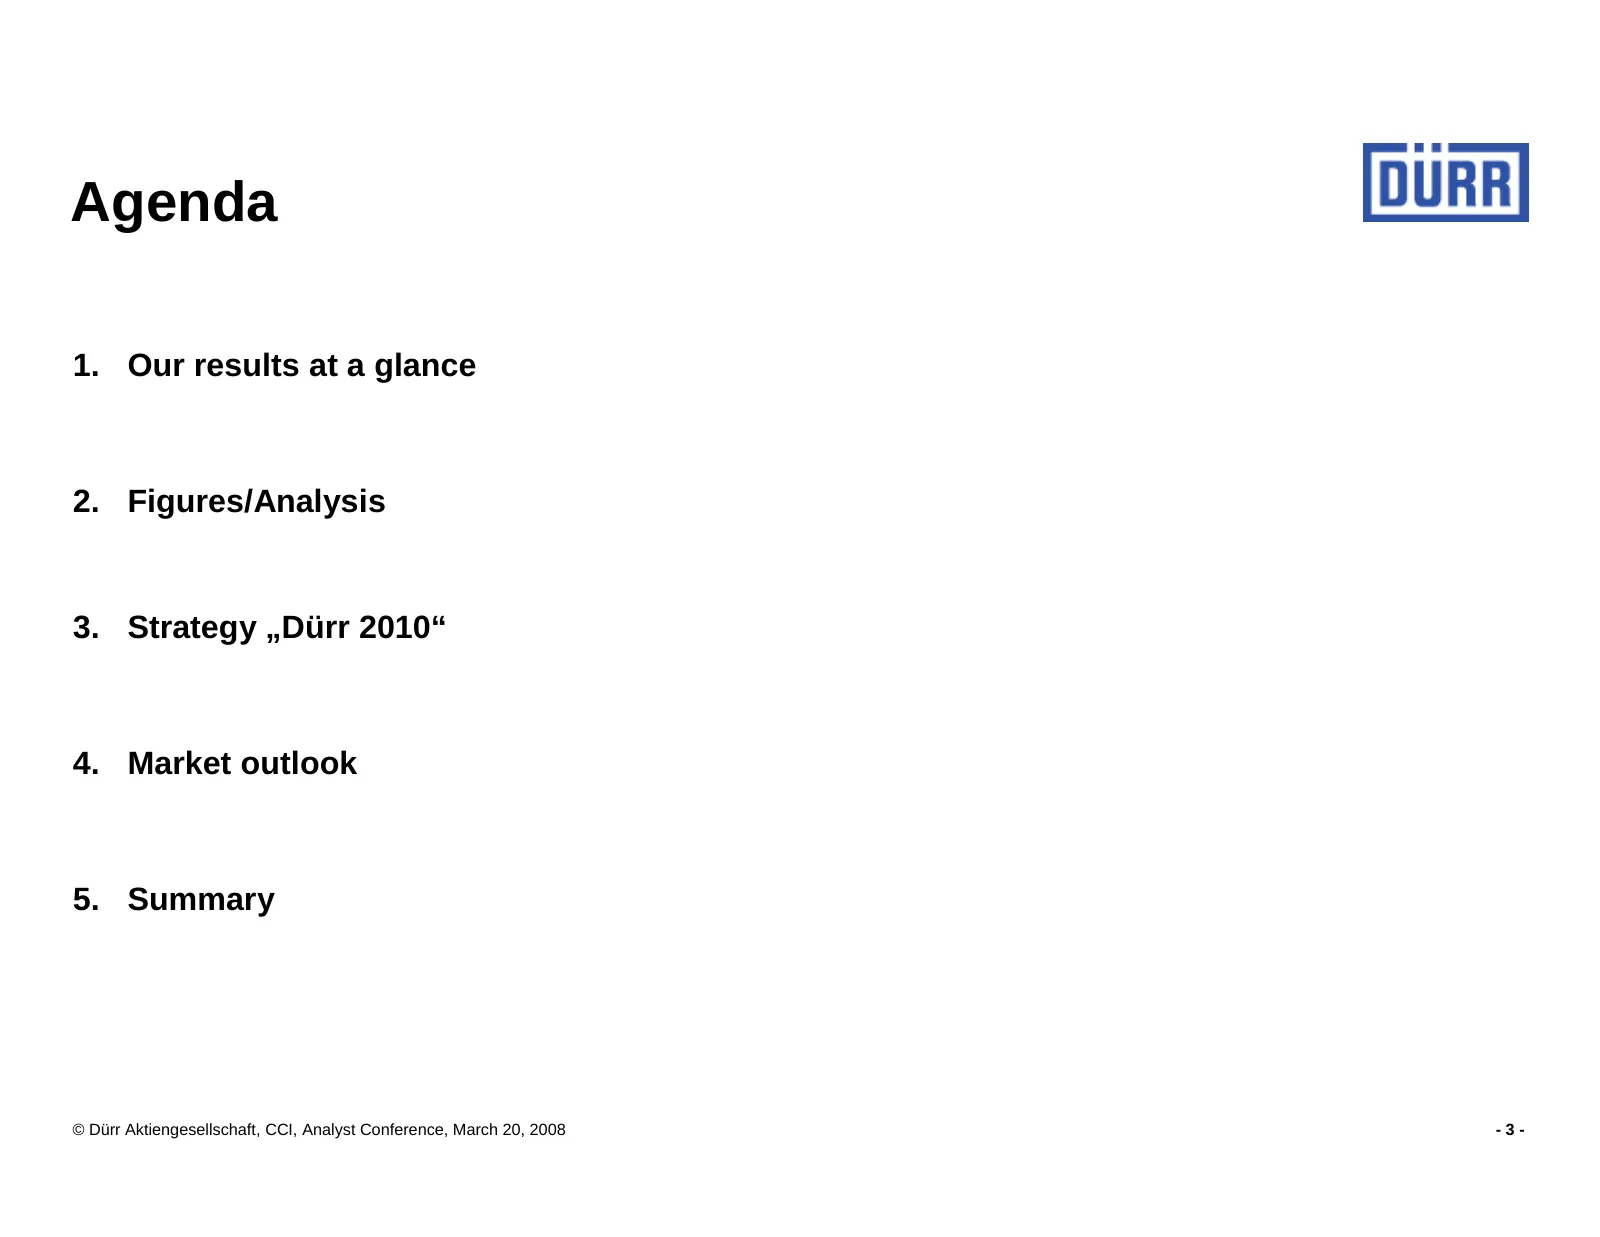
Slide 3: Agenda
Agenda 1. Our results at a glance 2. Figures/Analysis 3. Strategy „Dürr 2010“ 4. Market outlook 5. Summary © Dürr Aktiengesellschaft, CCI, Analyst Conference, March 20, 2008 -3-
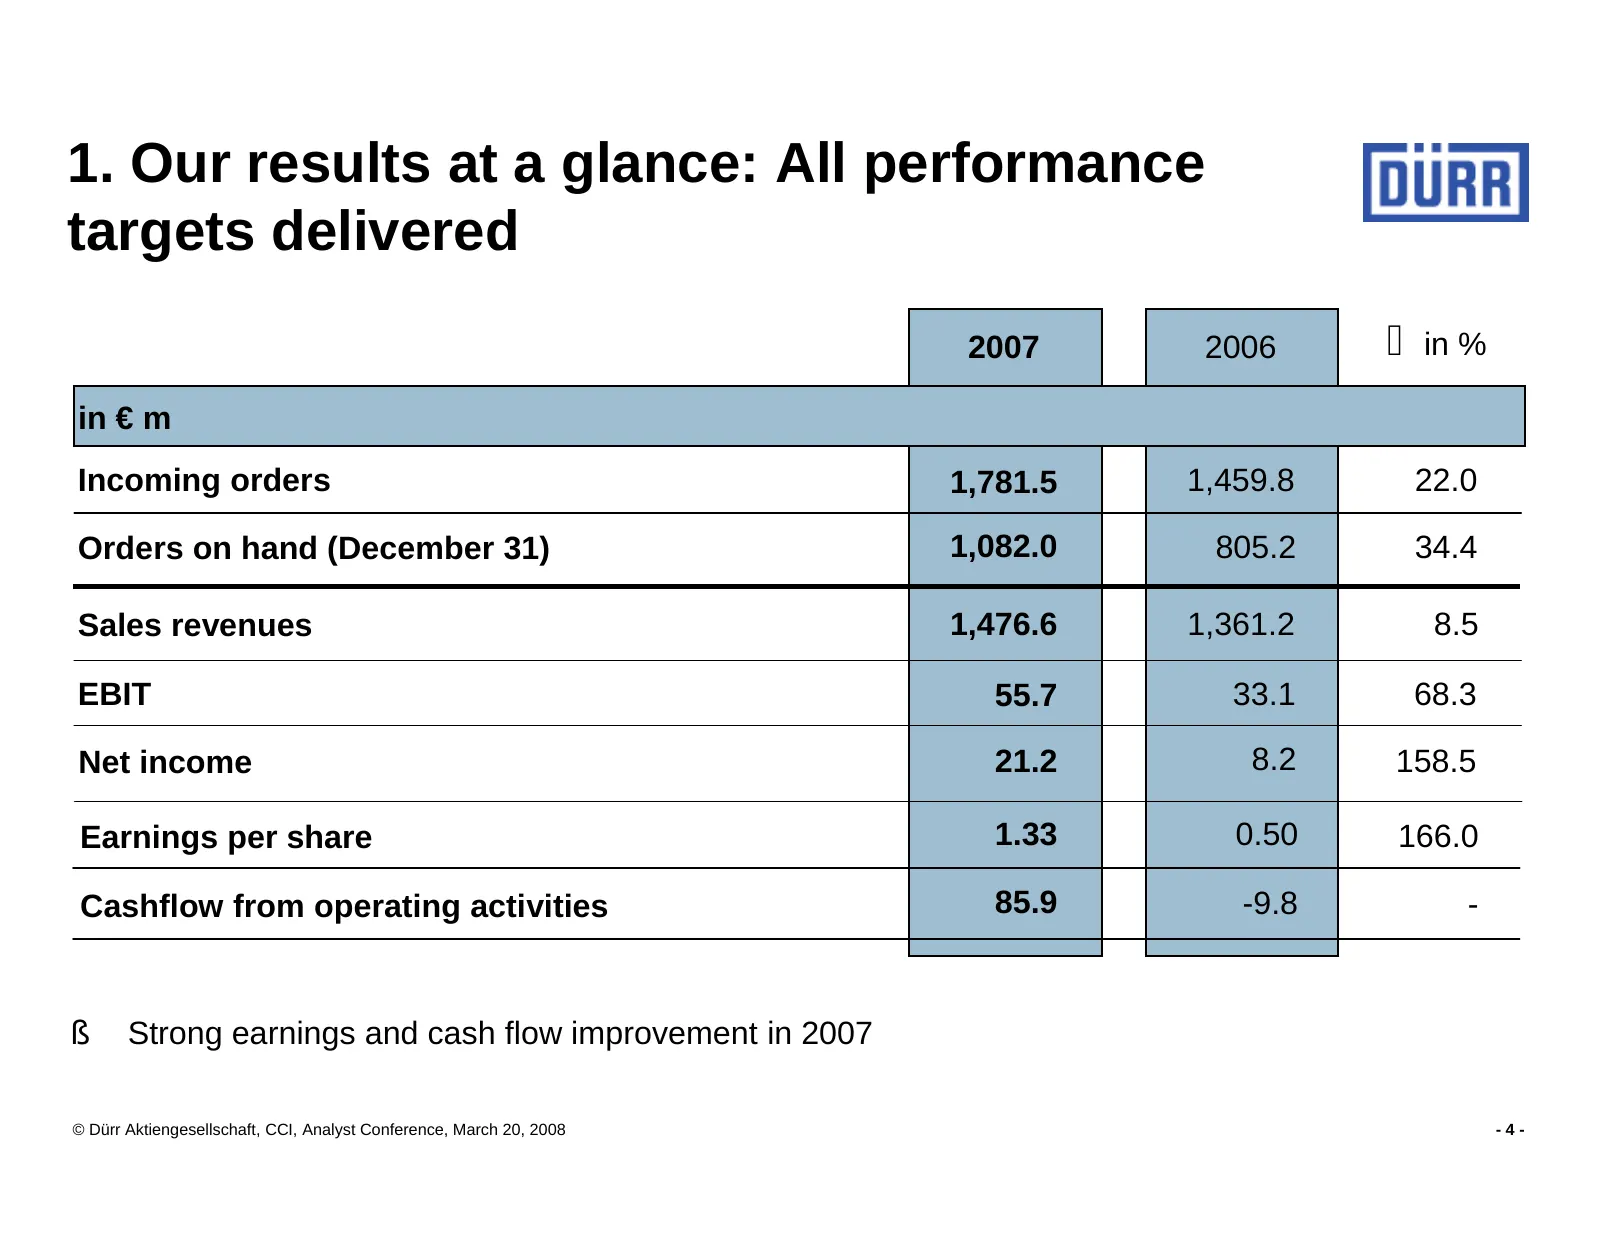
Slide 4: Our results at a glance: All performance targets delivered
1. Our results at a glance: All performance targets delivered 2007 2006 ∆ in % in € m Incoming orders 1,781.5 1,459.8 22.0 Orders on hand (December 31) 1,082.0 805.2 34.4 Sales revenues 1,476.6 1,361.2 8.5 EBIT 55.7 33.1 68.3 Net income 21.2 8.2 158.5 Earnings per share 1.33 0.50 166.0 Cashflow from
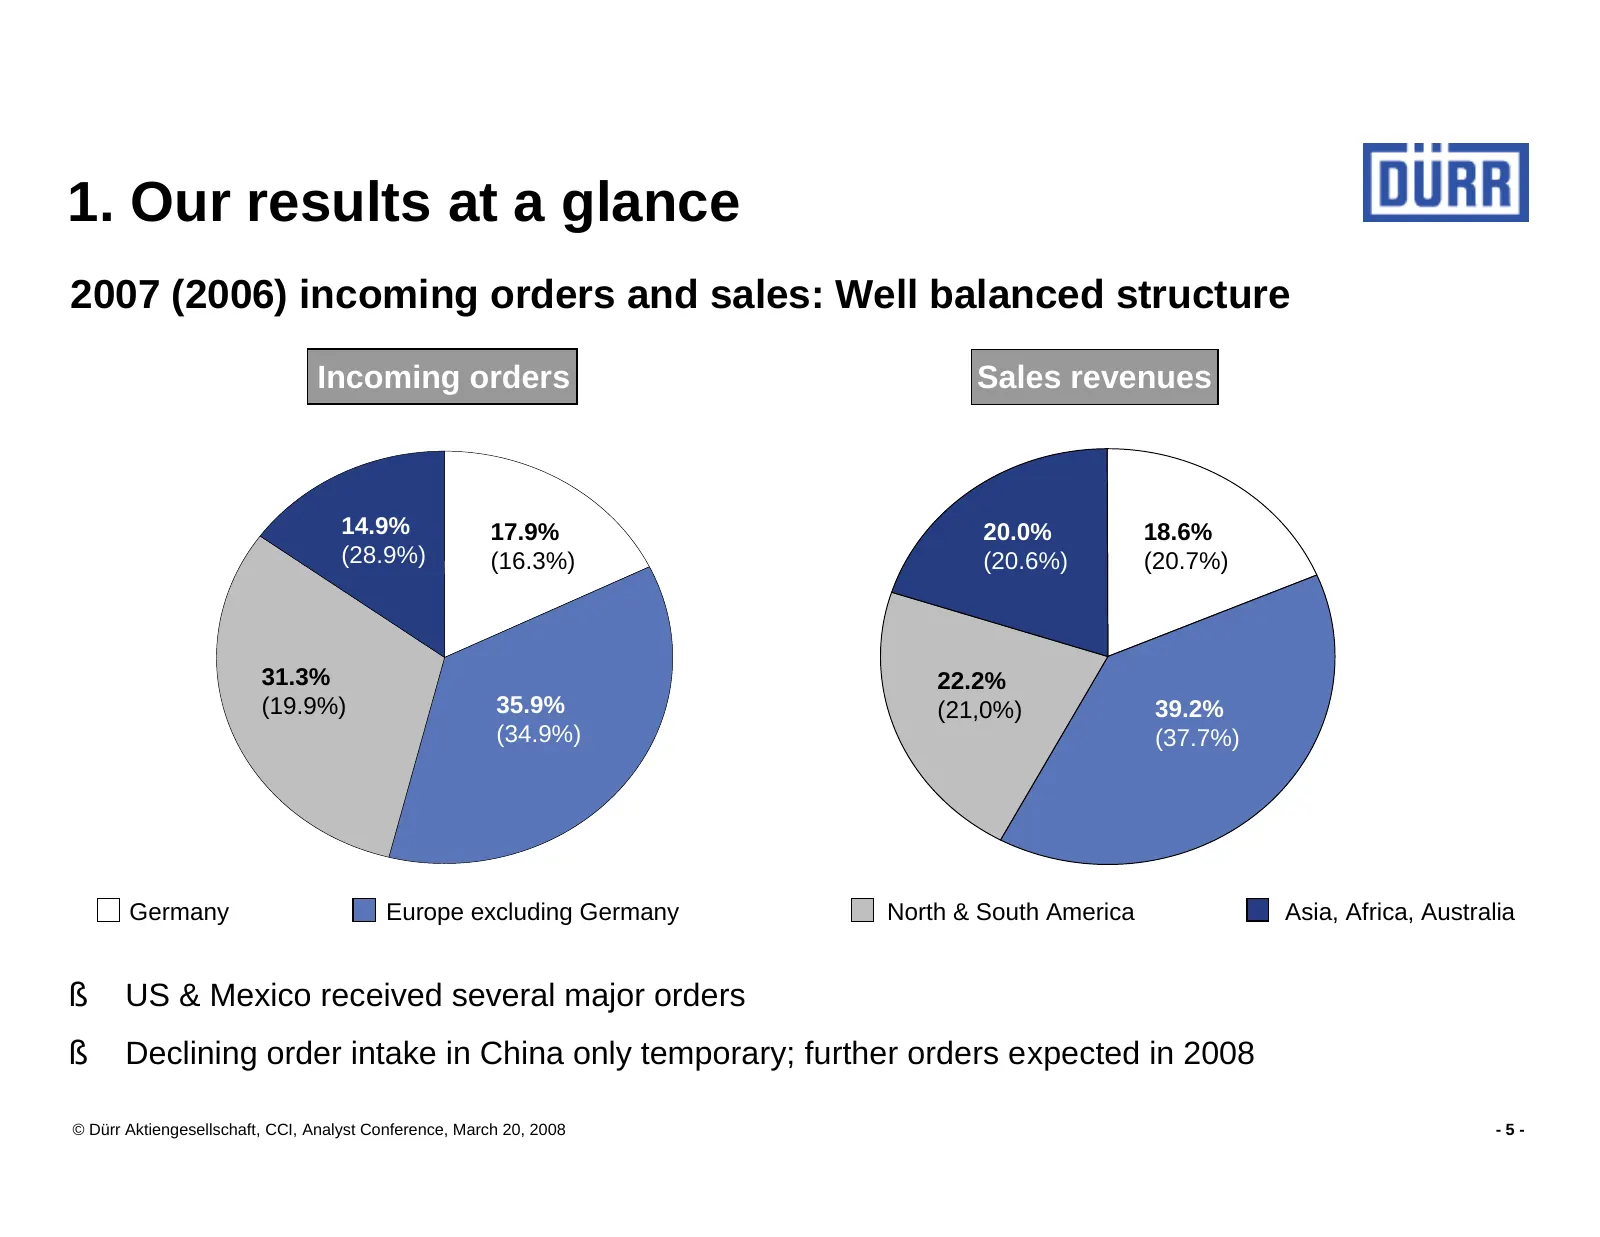
Slide 5: Incoming orders and sales: Well balanced structure
1. Our results at a glance 2007 (2006) incoming orders and sales: Well balanced structure Incoming orders Sales revenues 14.9% 17.9% 20.0% 18.6% (28.9%) (16.3%) (20.6%) (20.7%) 31.3% 22.2% (19.9%) 35.9% (21,0%) 39.2% (34.9%) (37.7%) Germany Europe excluding Germany North & South America Asia, Africa
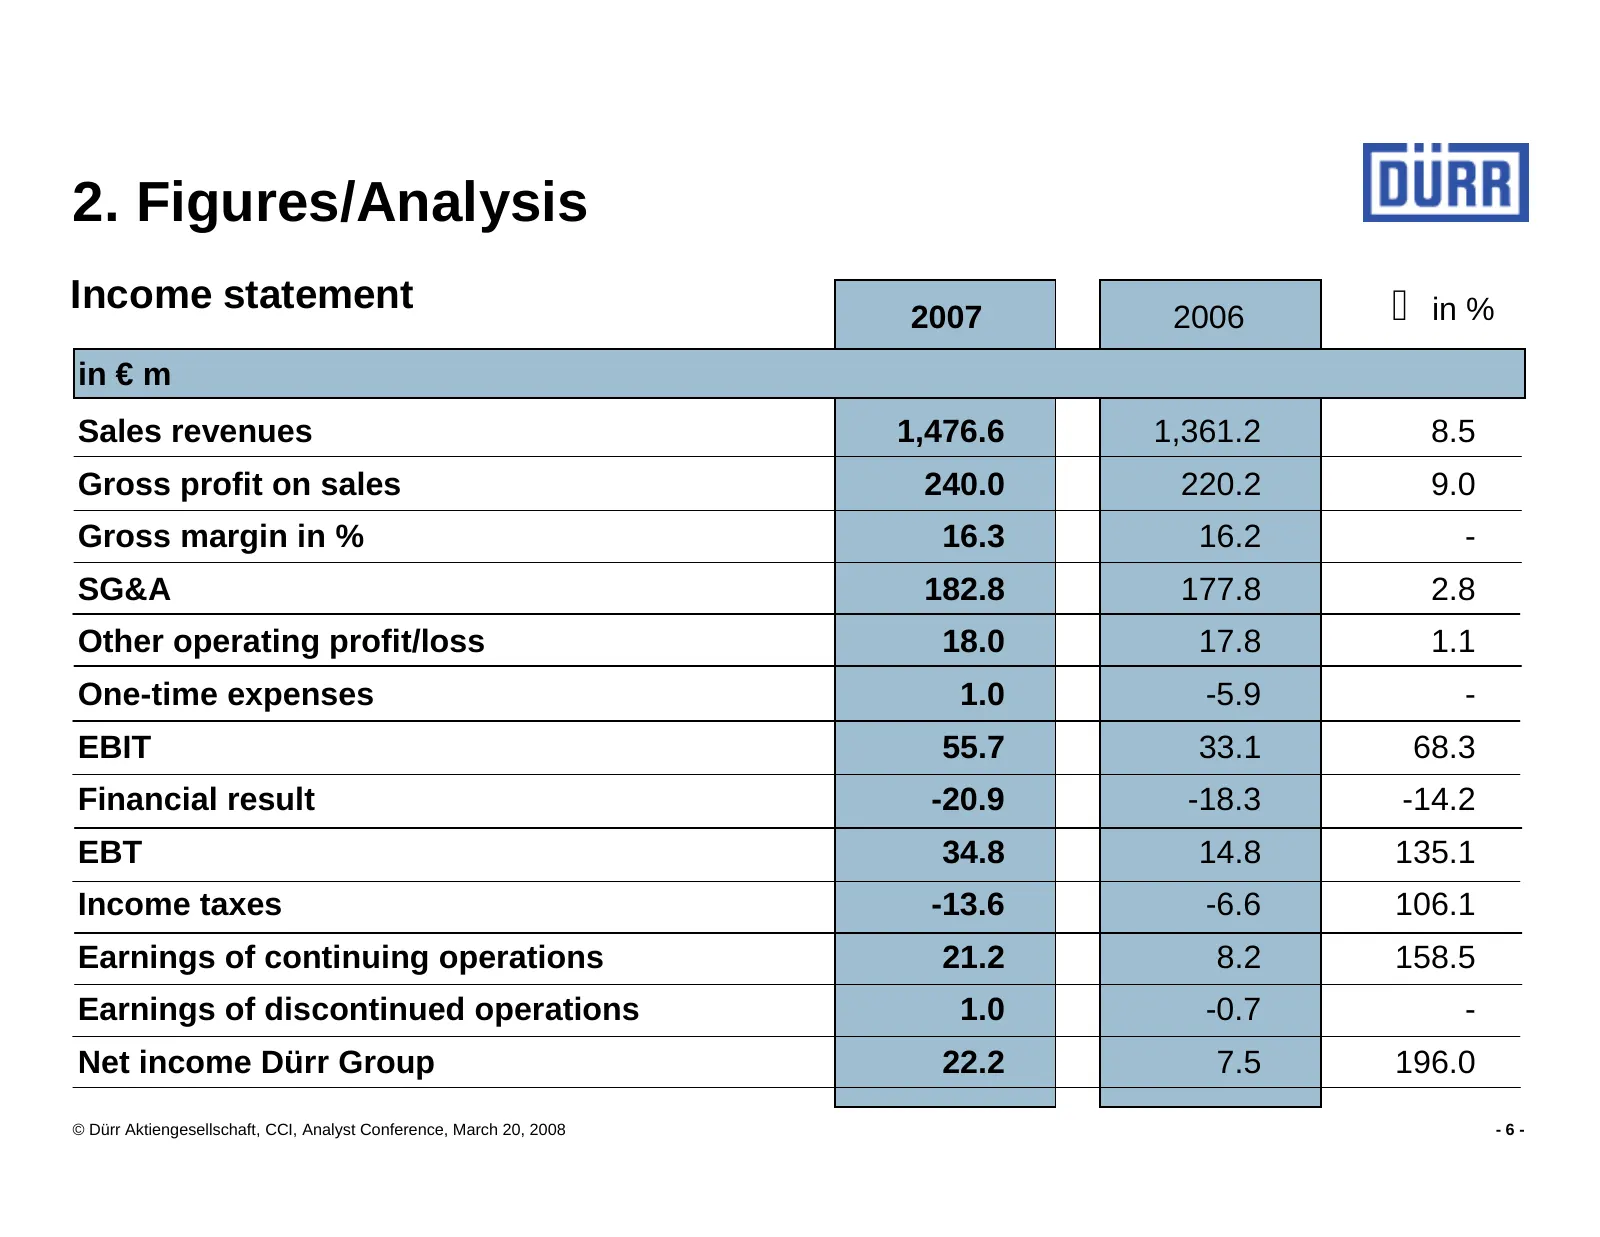
Slide 6: Income statement
2. Figures/Analysis Income statement 2007 2006 ∆ in % in € m Sales revenues 1,476.6 1,361.2 8.5 Gross profit on sales 240.0 220.2 9.0 Gross margin in % 16.3 16.2 - SG&A 182.8 177.8 2.8 Other operating profit/loss 18.0 17.8 1.1 One-time expenses 1.0 -5.9 - EBIT 55.7 33.1 68.3 Financial result -20.9 -
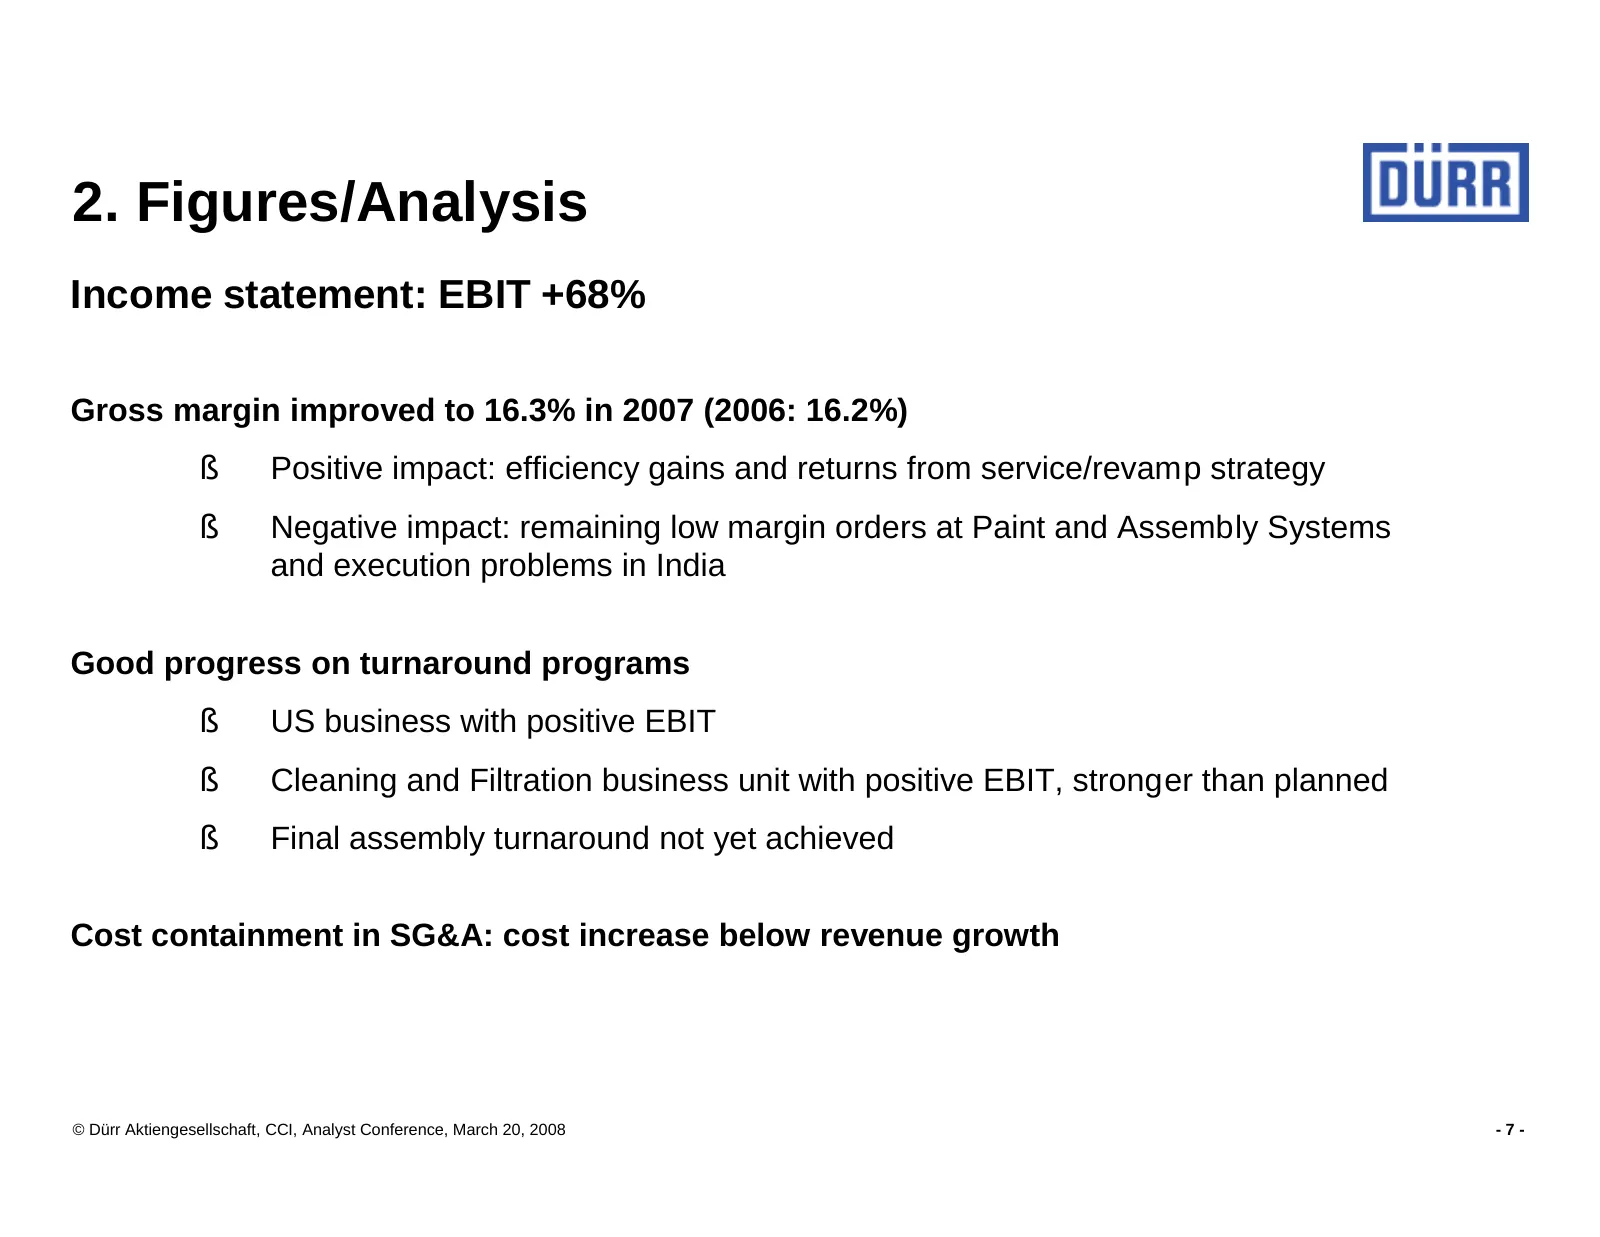
Slide 7: Income statement: EBIT +68%
2. Figures/Analysis Income statement: EBIT +68% Gross margin improved to 16.3% in 2007 (2006: 16.2%) § Positive impact: efficiency gains and returns from service/revamp strategy § Negative impact: remaining low margin orders at Paint and Assembly Systems and execution problems in India Good progress
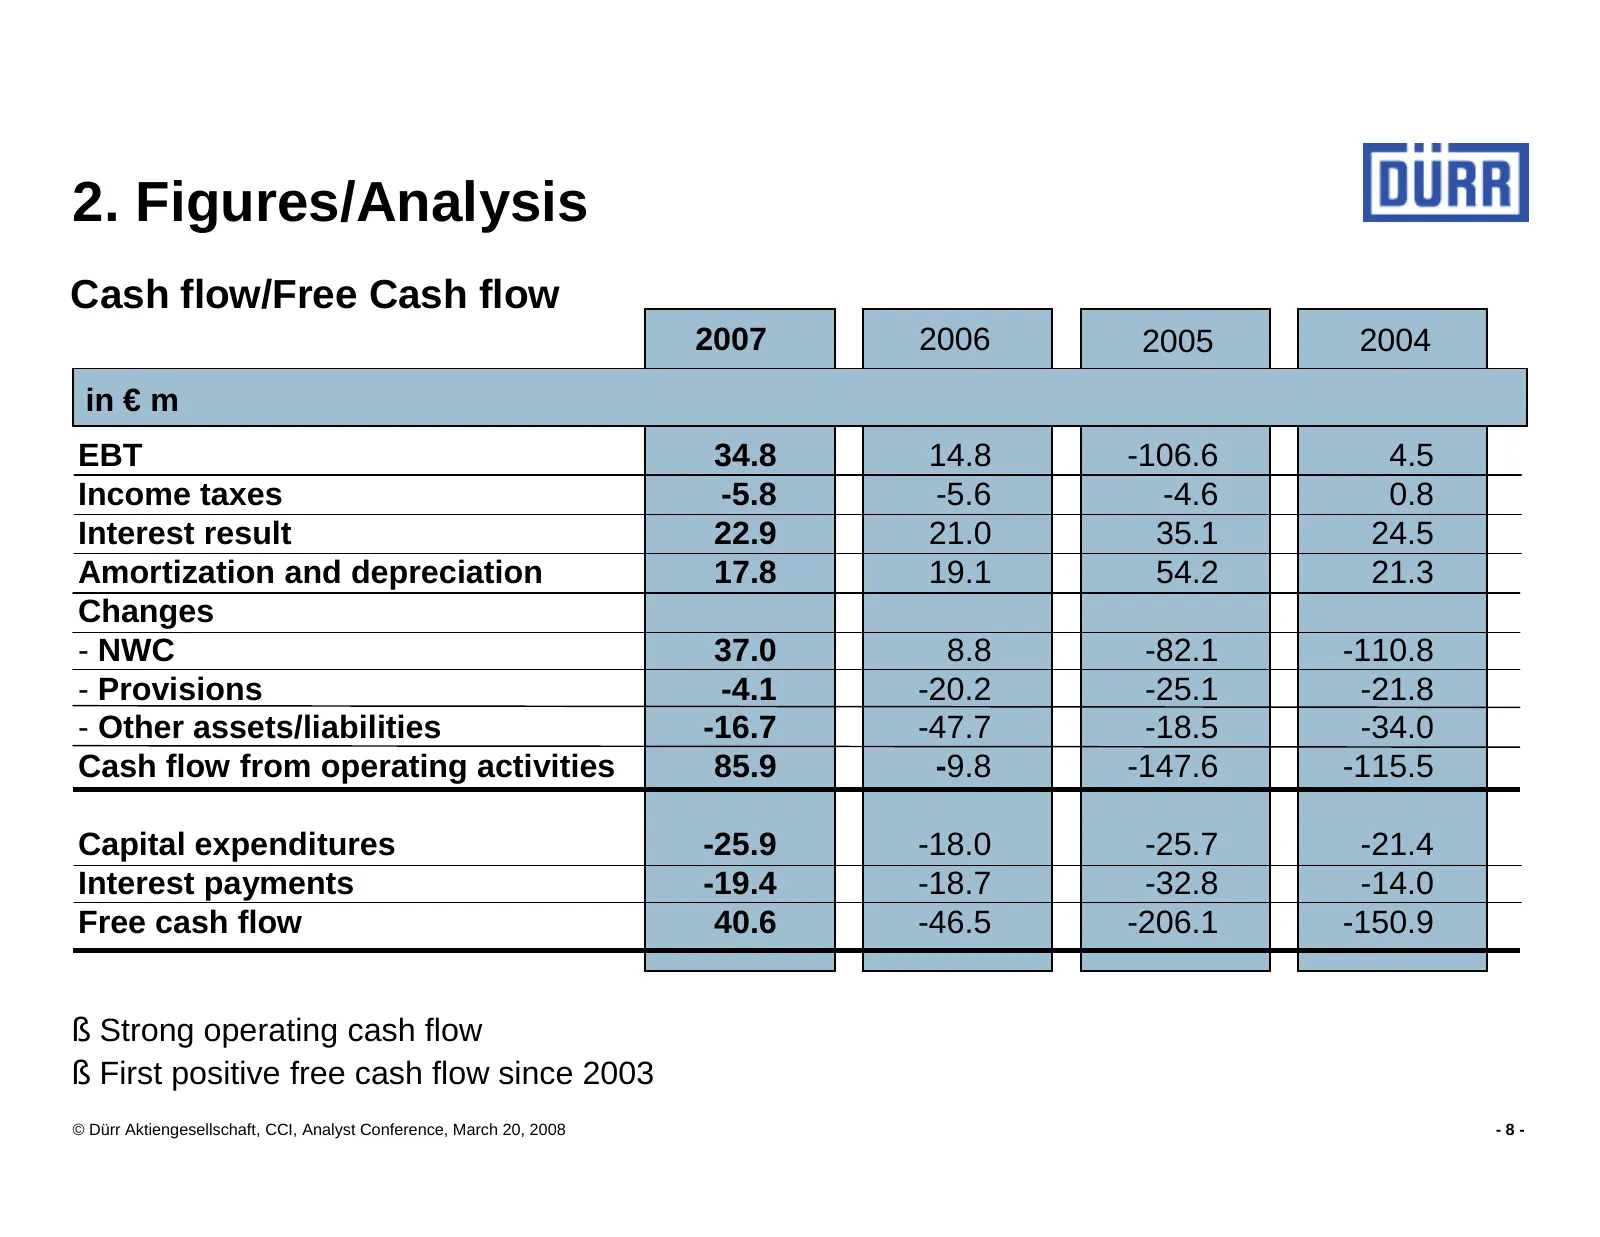
Slide 8: Cash flow/Free Cash flow
2. Figures/Analysis Cash flow/Free Cash flow 2007 2006 2005 2004 in € m 2005 2005 2004 2004 EBT 34.8 14.8 -106.6 4.5 Income taxes -5.8 -5.6 -4.6 0.8 Interest result 22.9 21.0 35.1 24.5 Amortization and depreciation 17.8 19.1 54.2 21.3 Changes - NWC 37.0 8.8 -82.1 -110.8 - Provisions -4.1 -20.2 -25.1
Slide 9: Figures/Analysis: Balance sheet key figures
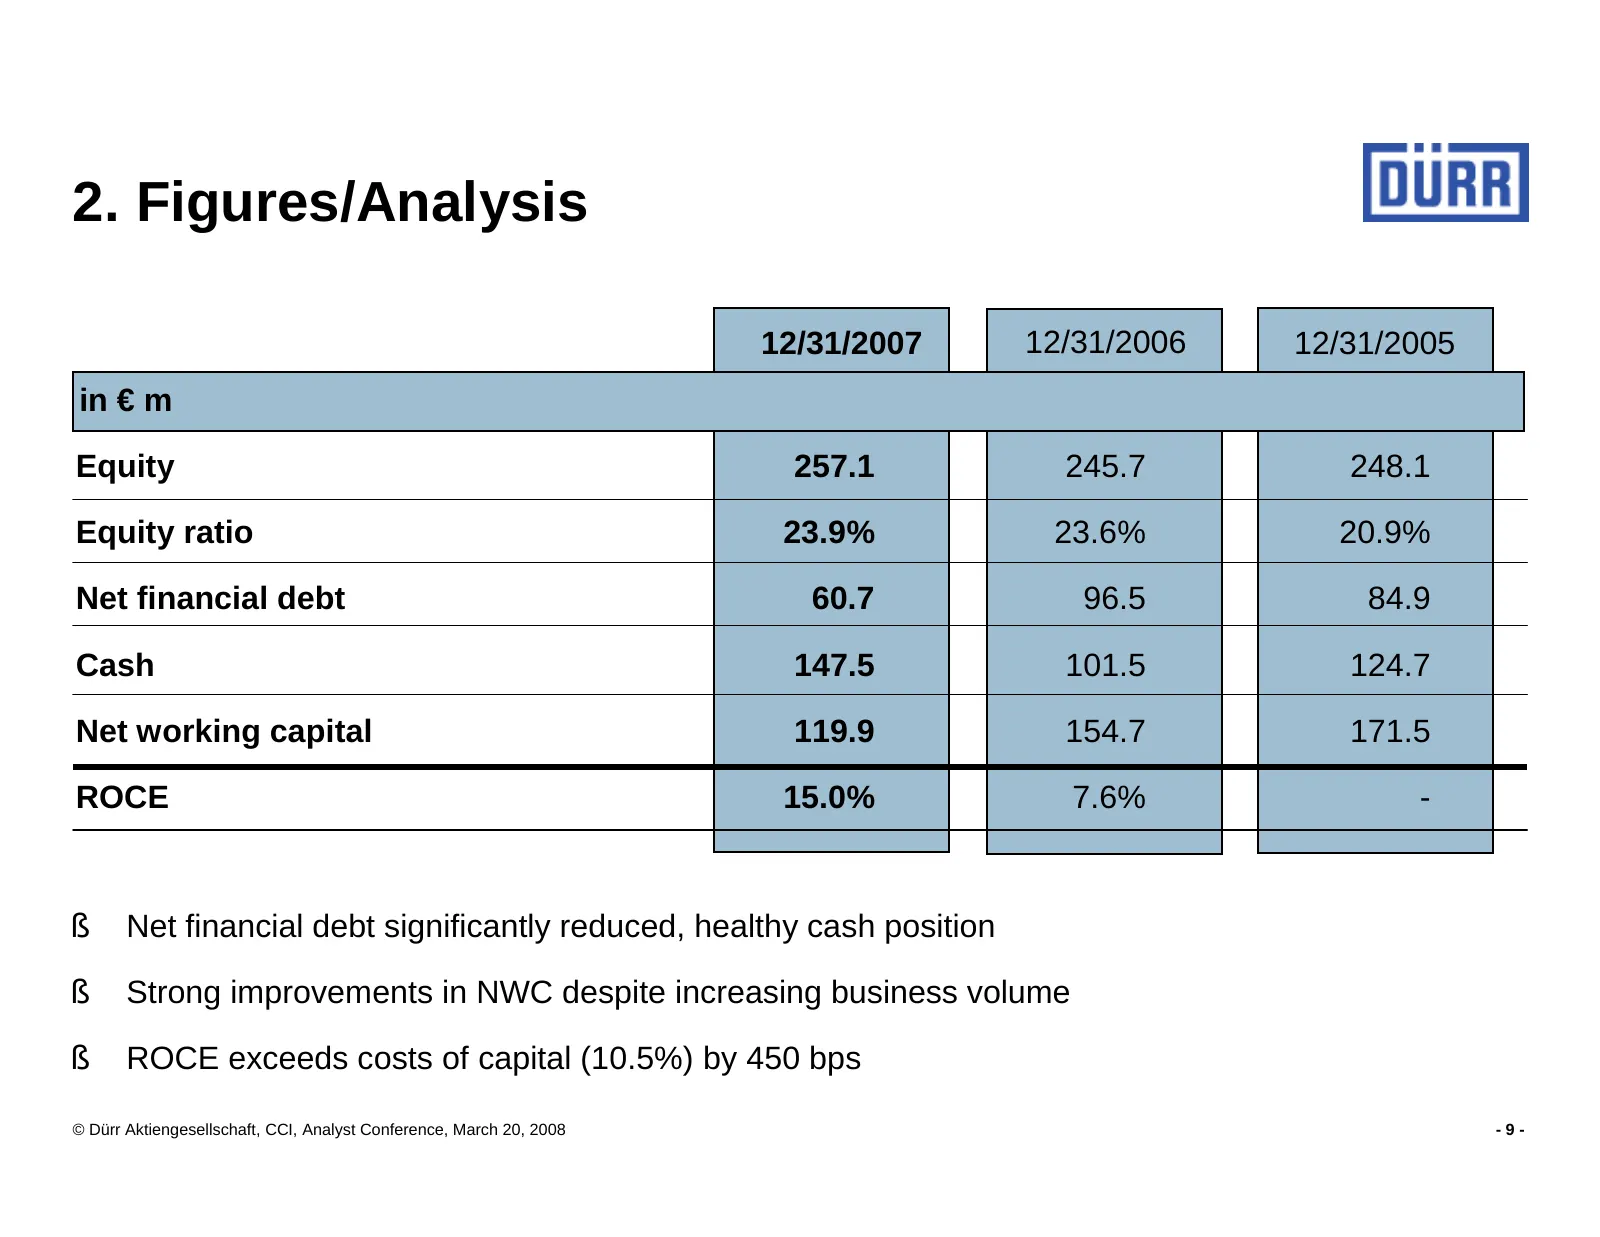
2. Figures/Analysis 12/31/2007 12/31/2006 12/31/2005 in € m Equity 257.1 245.7 248.1 Equity ratio 23.9% 23.6% 20.9% Net financial debt 60.7 96.5 84.9 Cash 147.5 101.5 124.7 Net working capital 119.9 154.7 171.5 ROCE 15.0% 7.6% - § Net financial debt significantly reduced, healthy cash position § Str
Slide 10: NWC: Significant progress
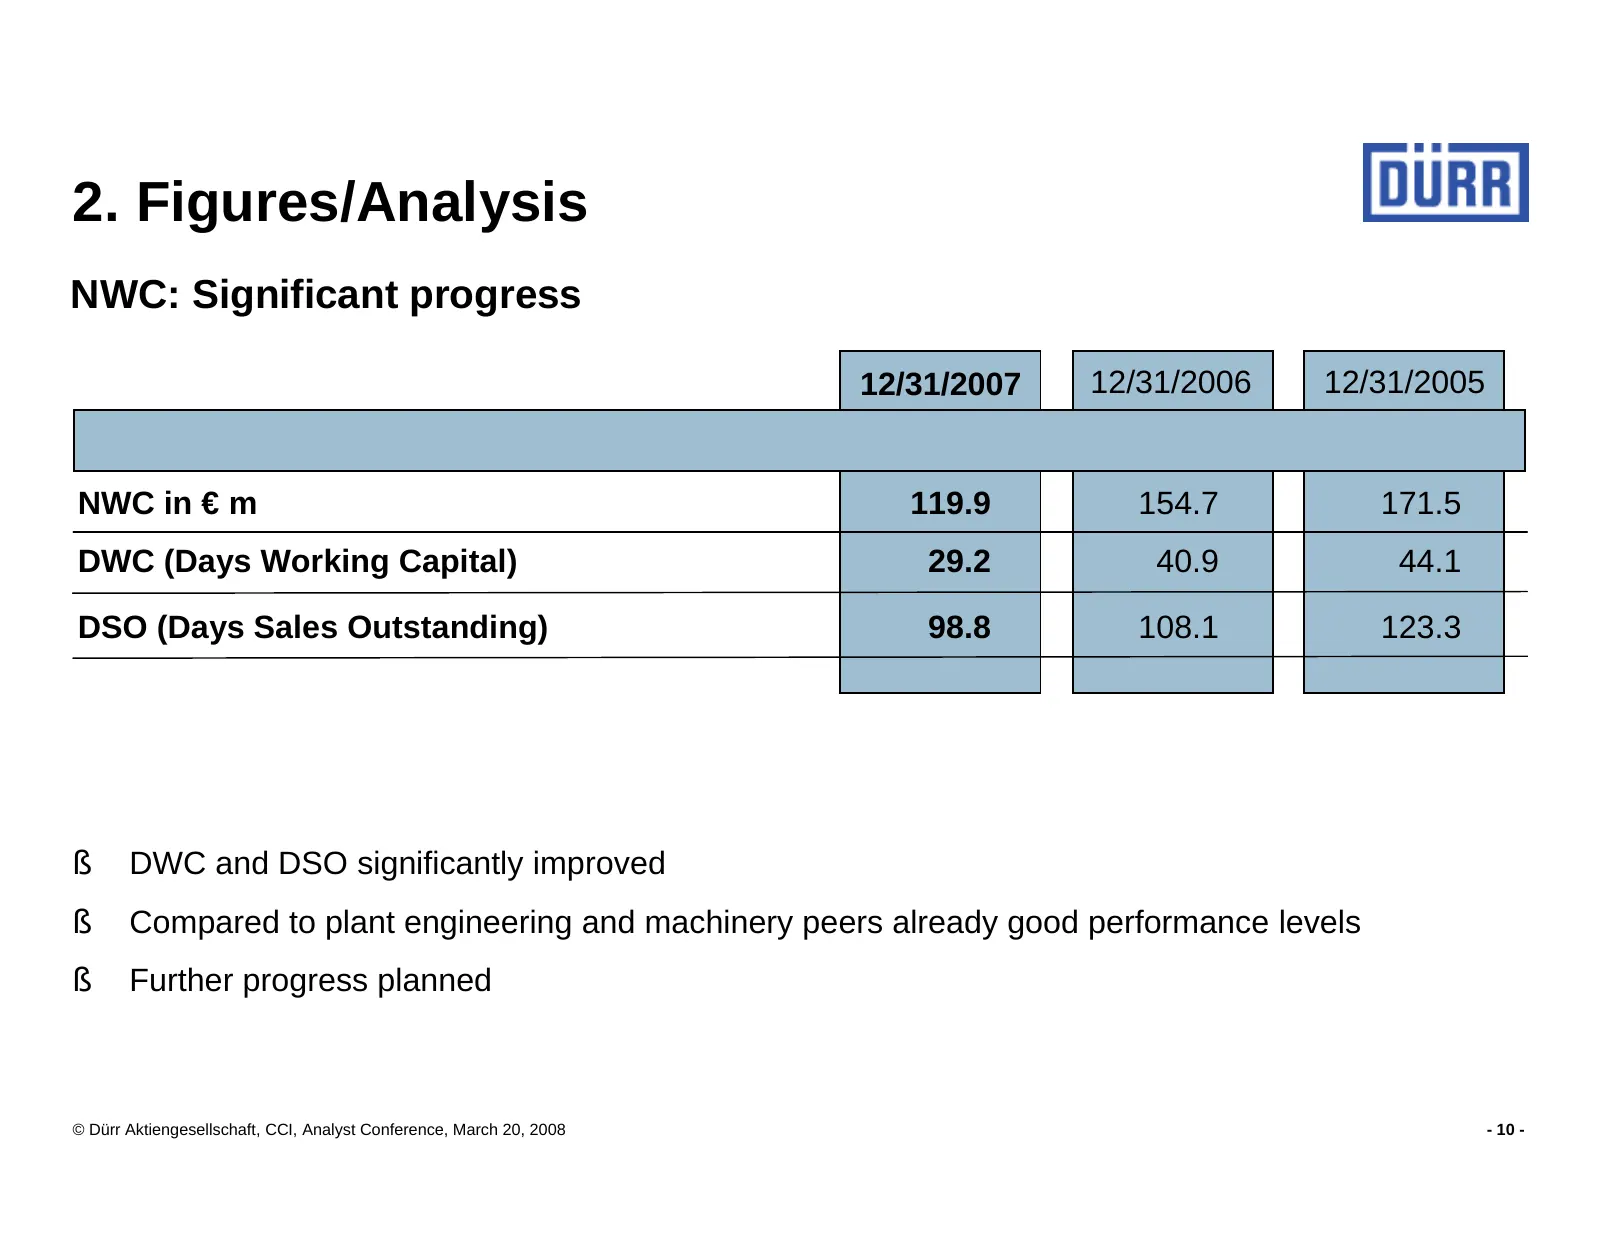
2. Figures/Analysis NWC: Significant progress 12/31/2007 12/31/2006 12/31/2005 NWC in € m 119.9 154.7 171.5 DWC (Days Working Capital) 29.2 40.9 44.1 DSO (Days Sales Outstanding) 98.8 108.1 123.3 § DWC and DSO significantly improved § Compared to plant engineering and machinery peers already good pe
Slide 11: Prepayments from customers stabilized
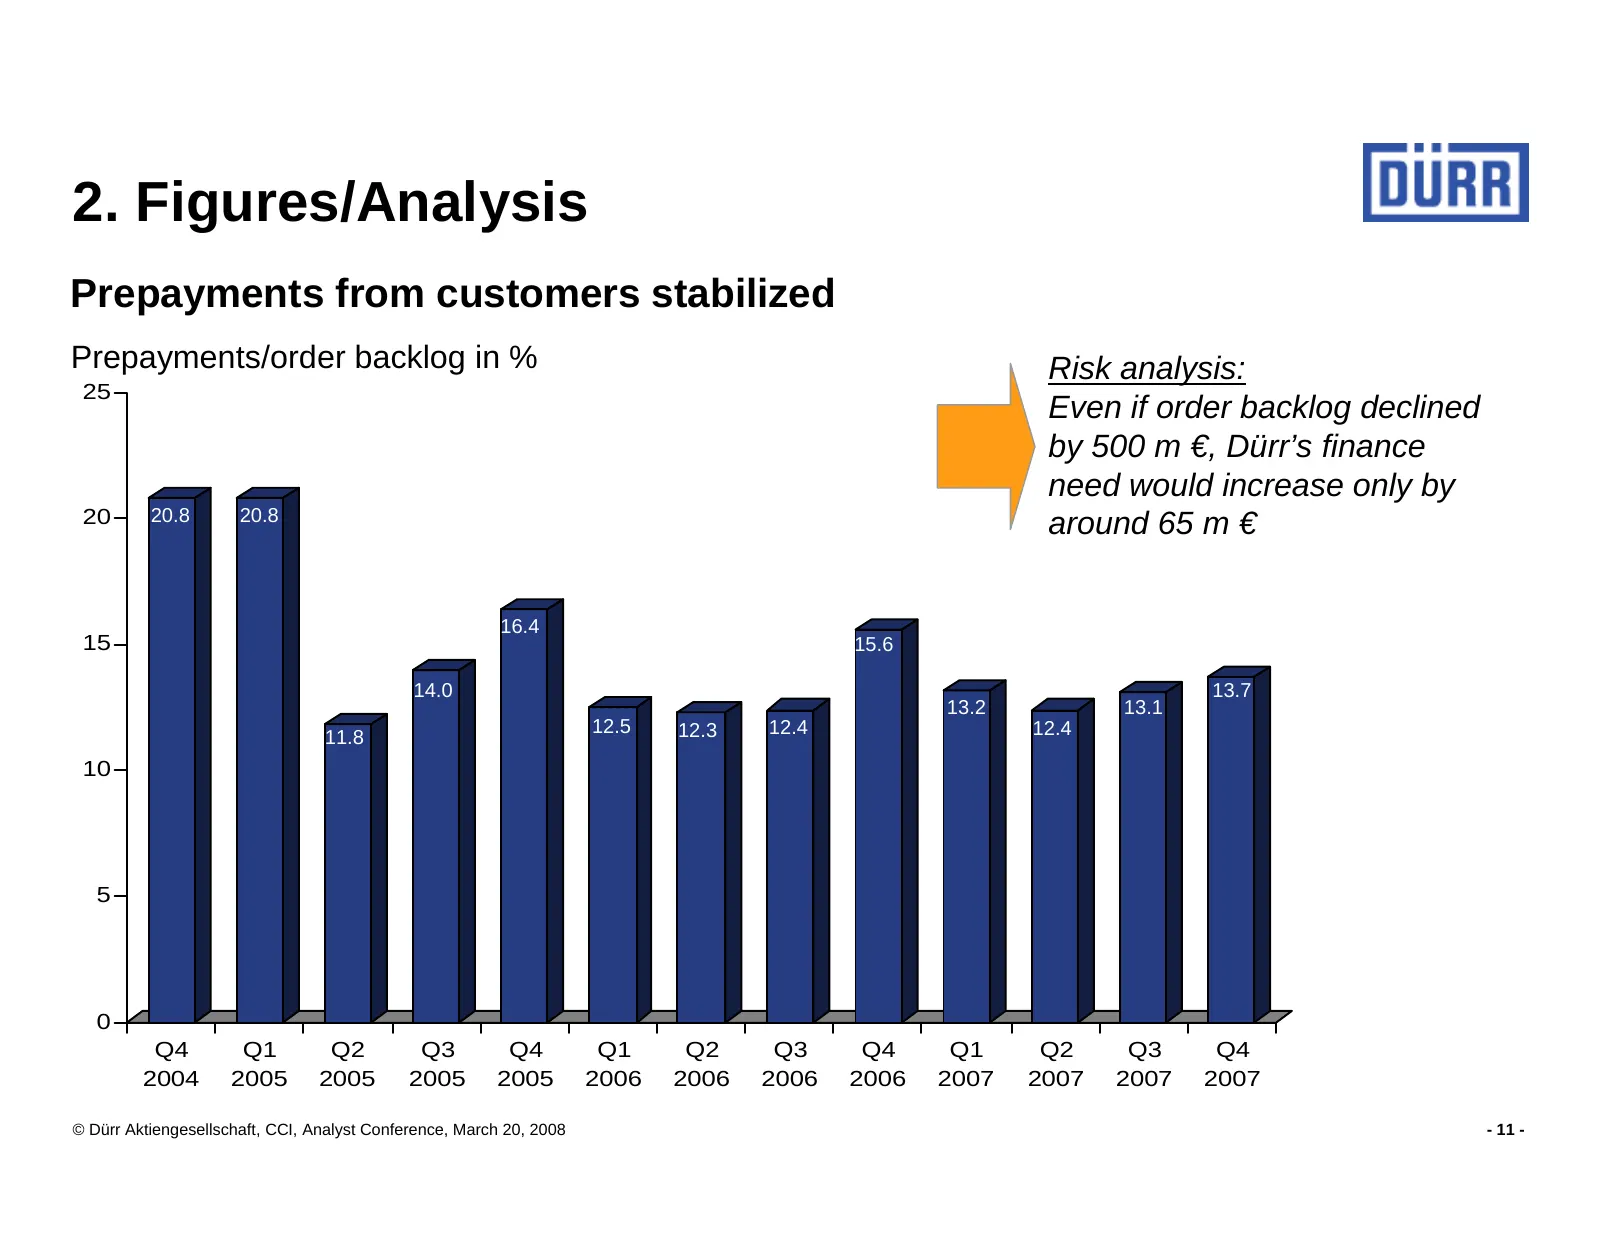
2. Figures/Analysis Prepayments from customers stabilized Prepayments/order backlog in % Risk analysis: 25 Even if order backlog declined by 500 m €, Dürr’s finance need would increase only by 20 20.8 20.8 around 65 m € 16.4 15 15.6 14.0 13.7 13.2 13.1 12.5 12.3 12.4 12.4 11.8 10 5 0 Q4 Q1 Q2 Q3 Q4
Slide 12: Strategy Dürr 2010
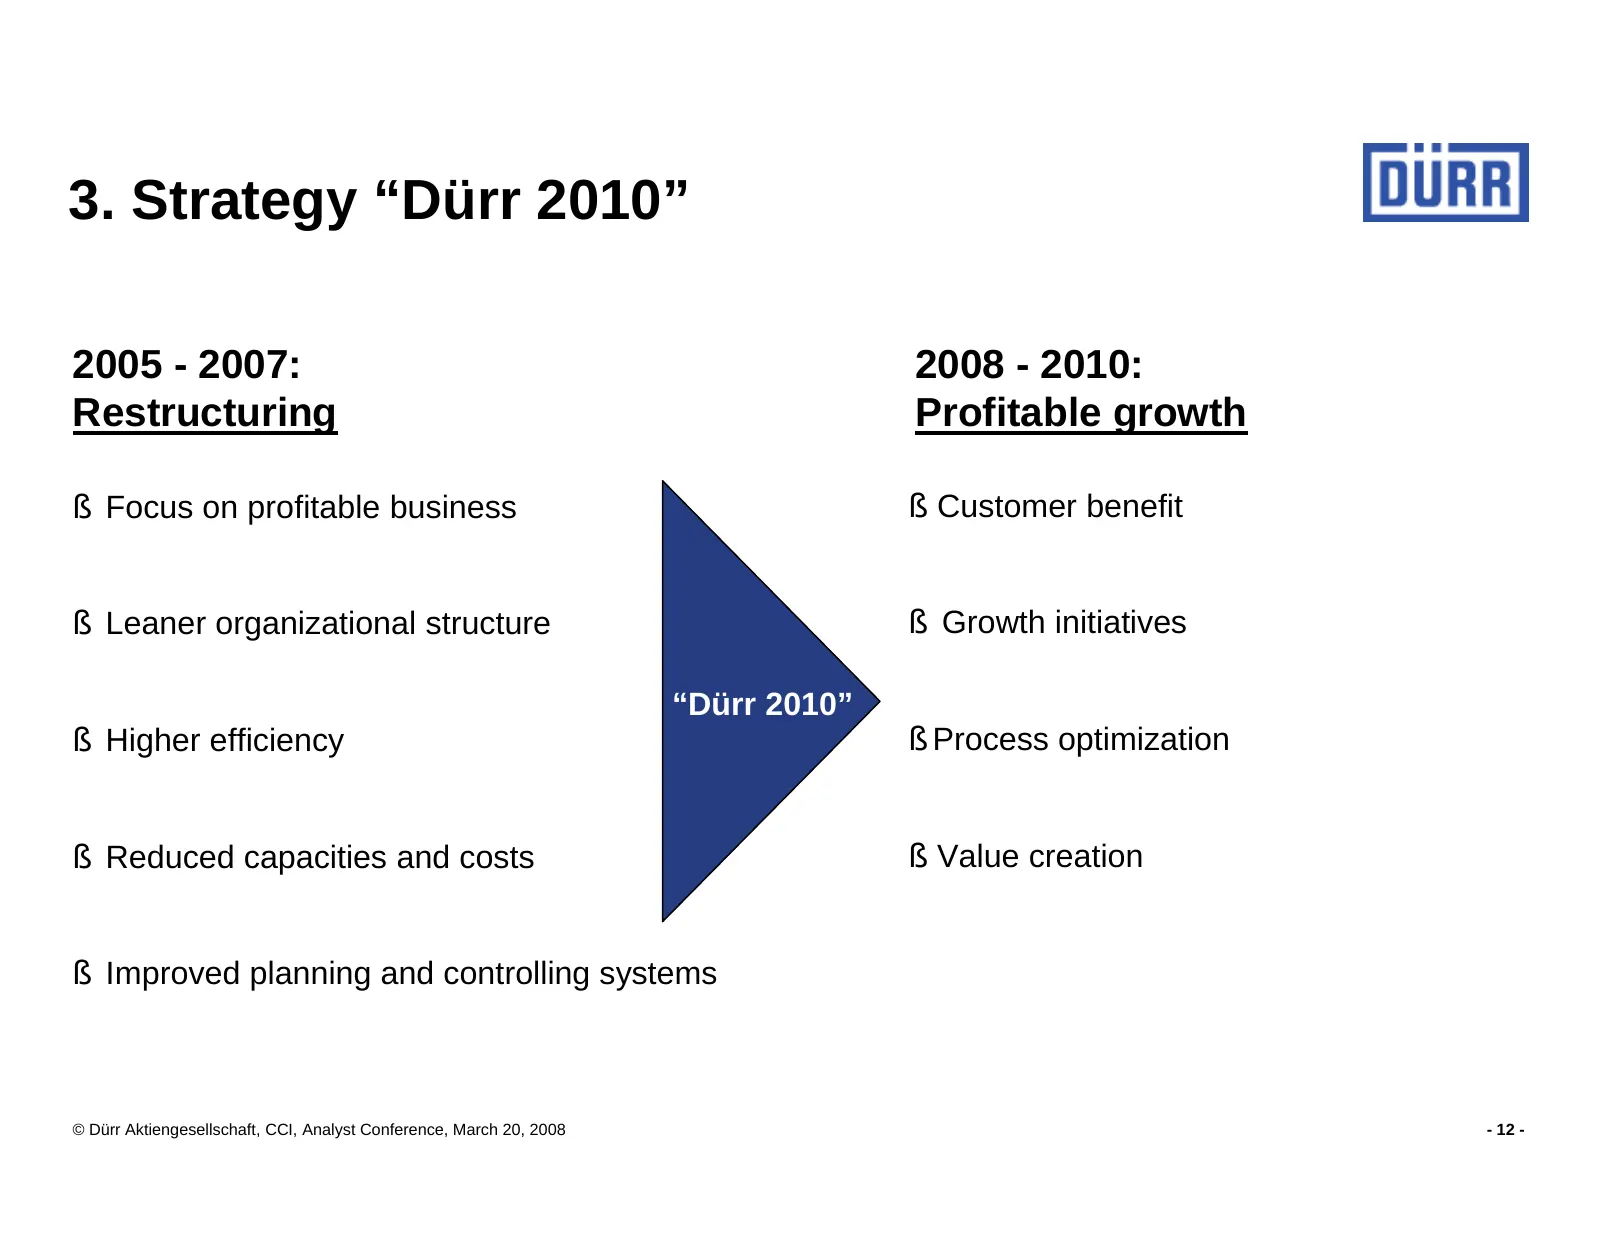
3. Strategy “Dürr 2010” 2005 - 2007: 2008 - 2010: Restructuring Profitable growth § Focus on profitable business § Customer benefit § Leaner organizational structure § Growth initiatives “Dürr 2010” § Higher efficiency § Process optimization § Reduced capacities and costs § Value creation § Improved
Slide 13: Strategy Dürr 2010
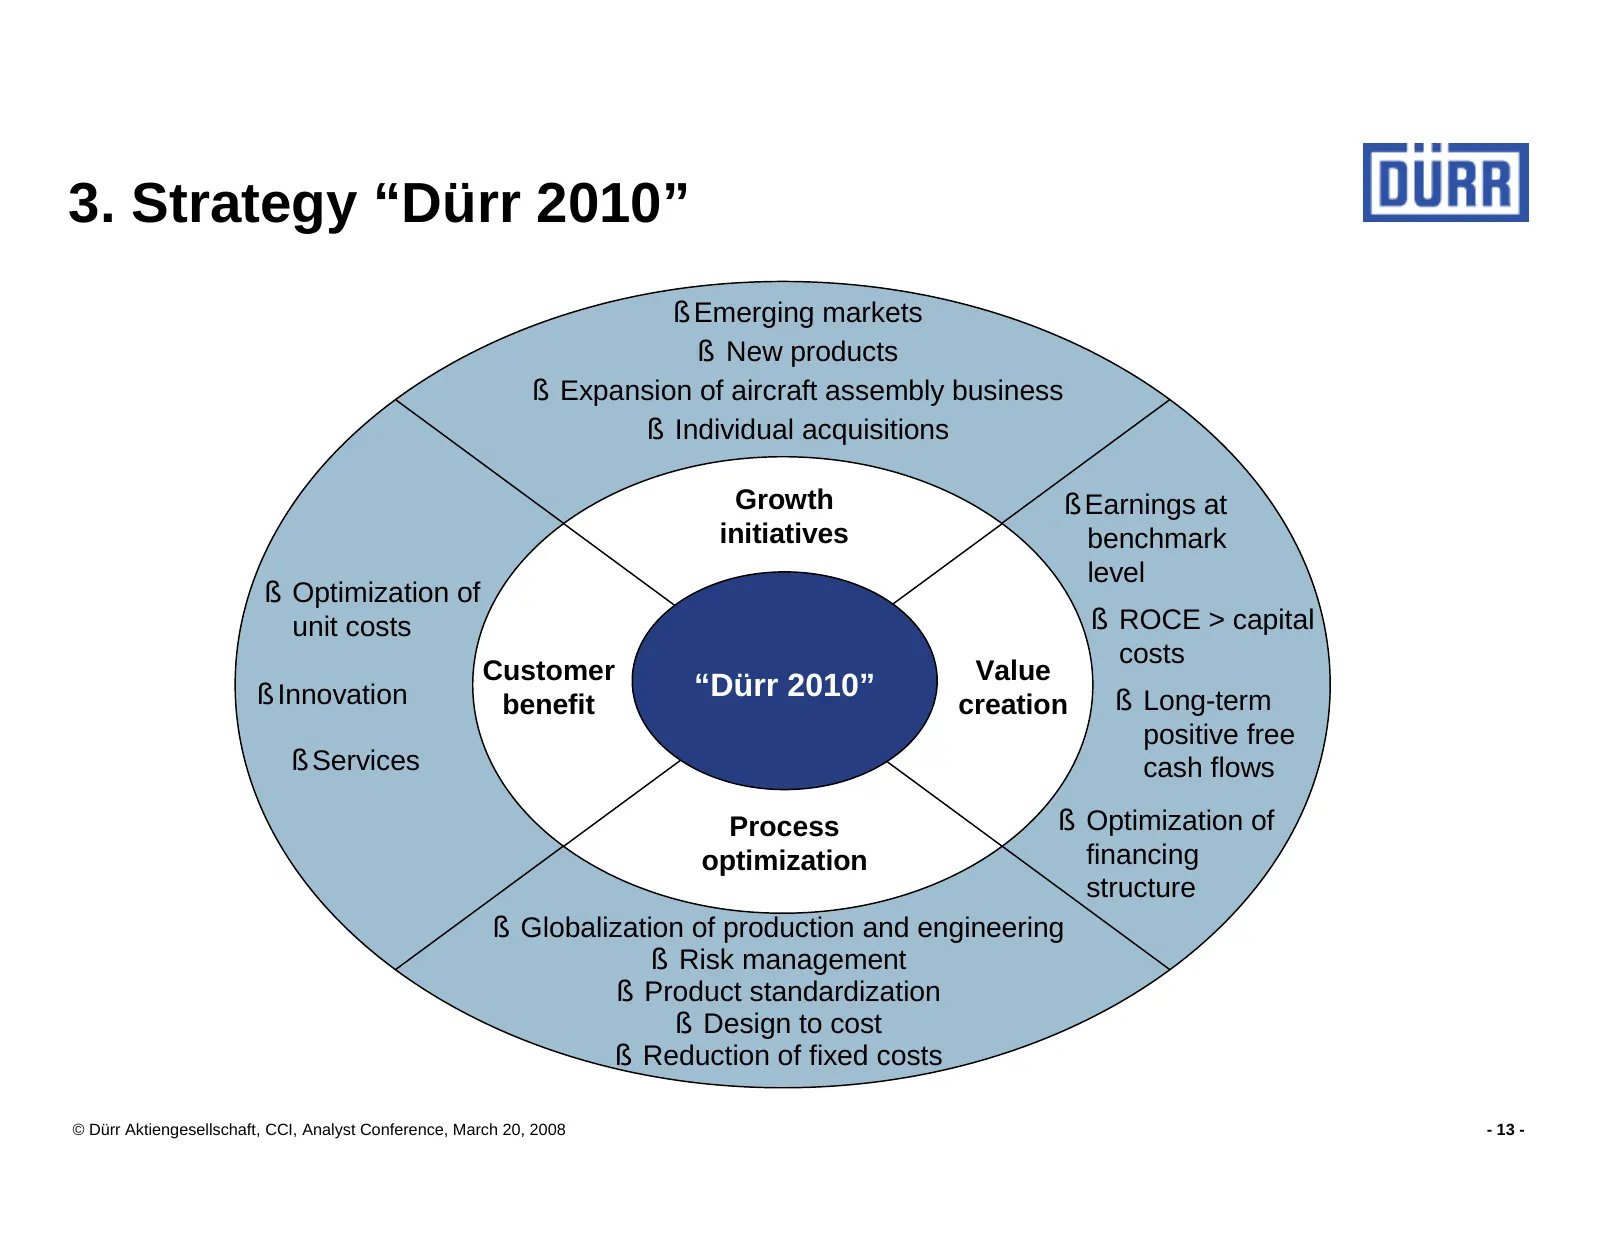
3. Strategy “Dürr 2010” § Emerging markets § New products § Expansion of aircraft assembly business § Individual acquisitions Growth § Earnings at initiatives benchmark level § Optimization of unit costs § ROCE > capital costs Customer Value § Innovation “Dürr 2010” § Long-term benefit creation posi
Slide 14: Customer benefit
3. Strategy “Dürr 2010”: Customer benefit Dürr will leverage its leading technology and market position Cost-per-unit as value proposition (e.g. RoDip IV) § Ensure competitive operating costs for our customers § Provide ROI for investments into Dürr equipment Innovative solutions (e.g. LeanLine for
Slide 15: Cost-per-unit: New rotational painting system RoDip IV
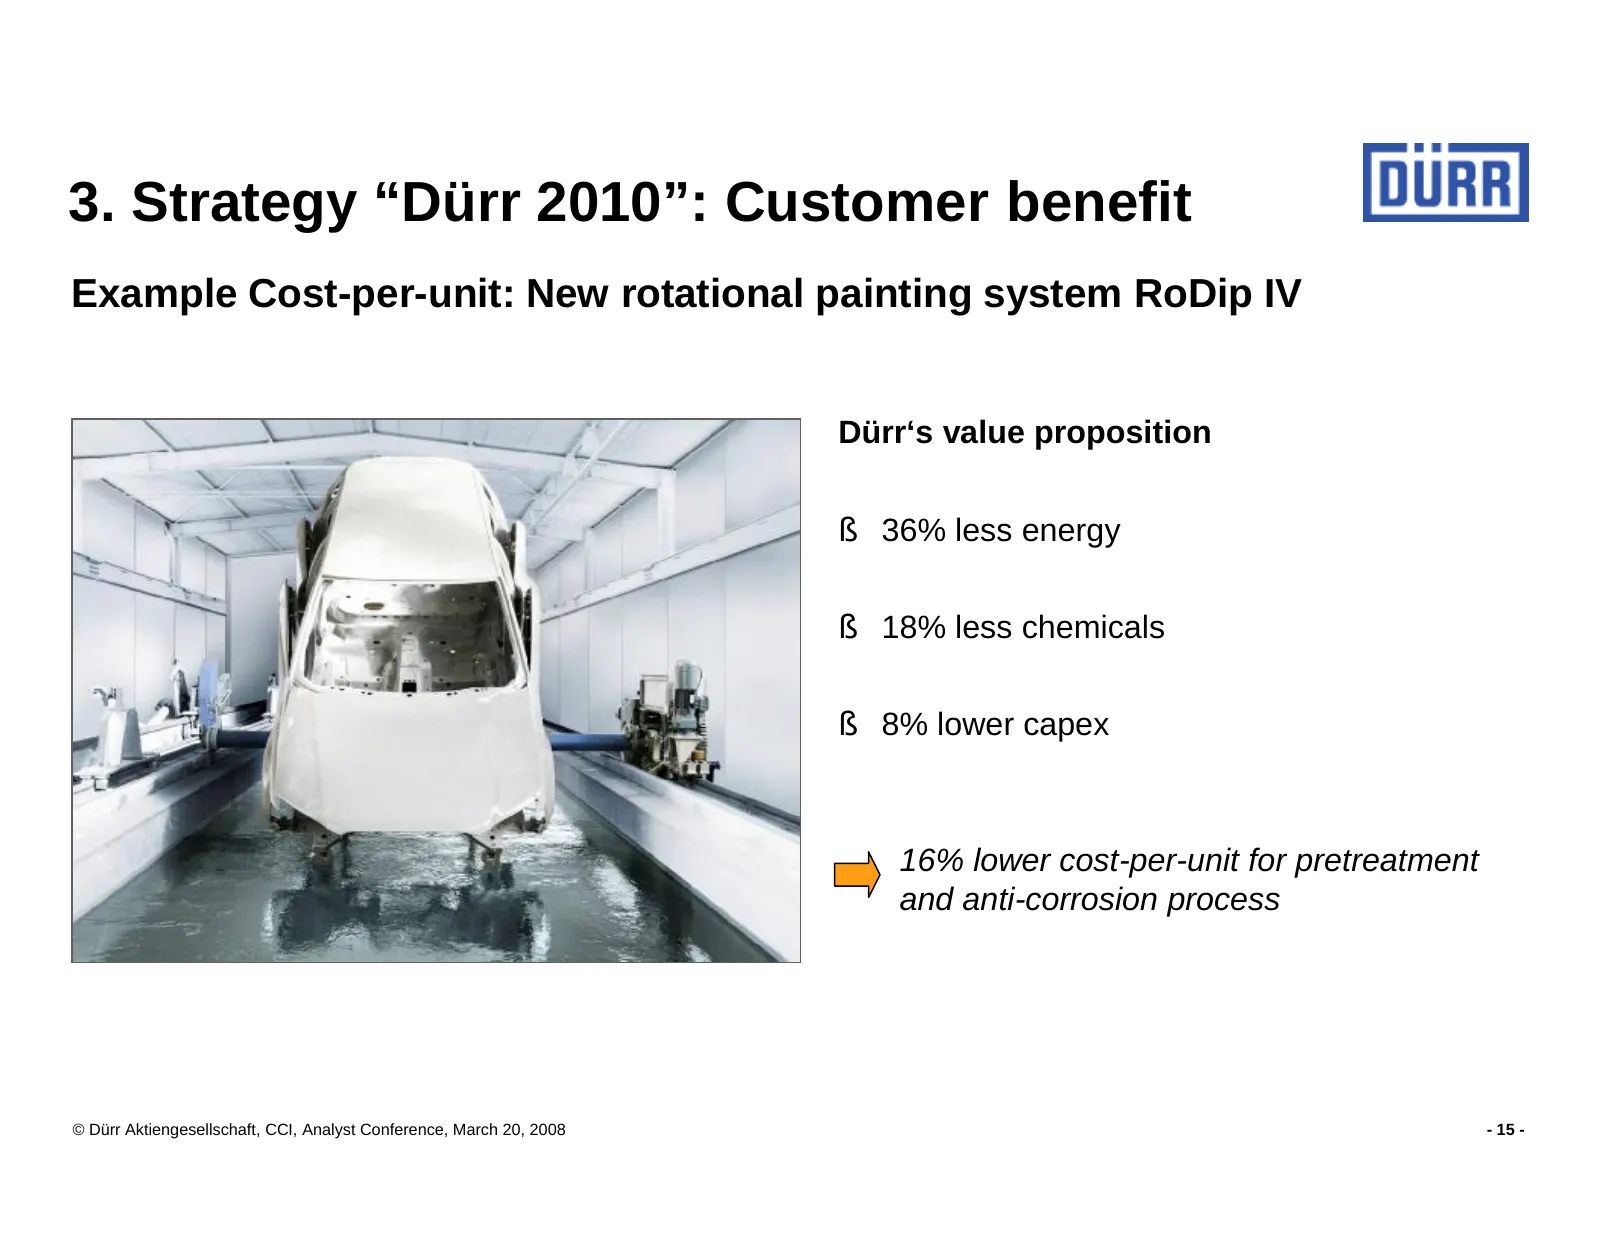
3. Strategy “Dürr 2010”: Customer benefit Example Cost-per-unit: New rotational painting system RoDip IV Dürr‘s value proposition § 36% less energy § 18% less chemicals § 8% lower capex 16% lower cost-per-unit for pretreatment and anti-corrosion process © Dürr Aktiengesellschaft, CCI, Analyst Confer
Slide 16: Innovative solutions: Addressing the mega trend low cost cars
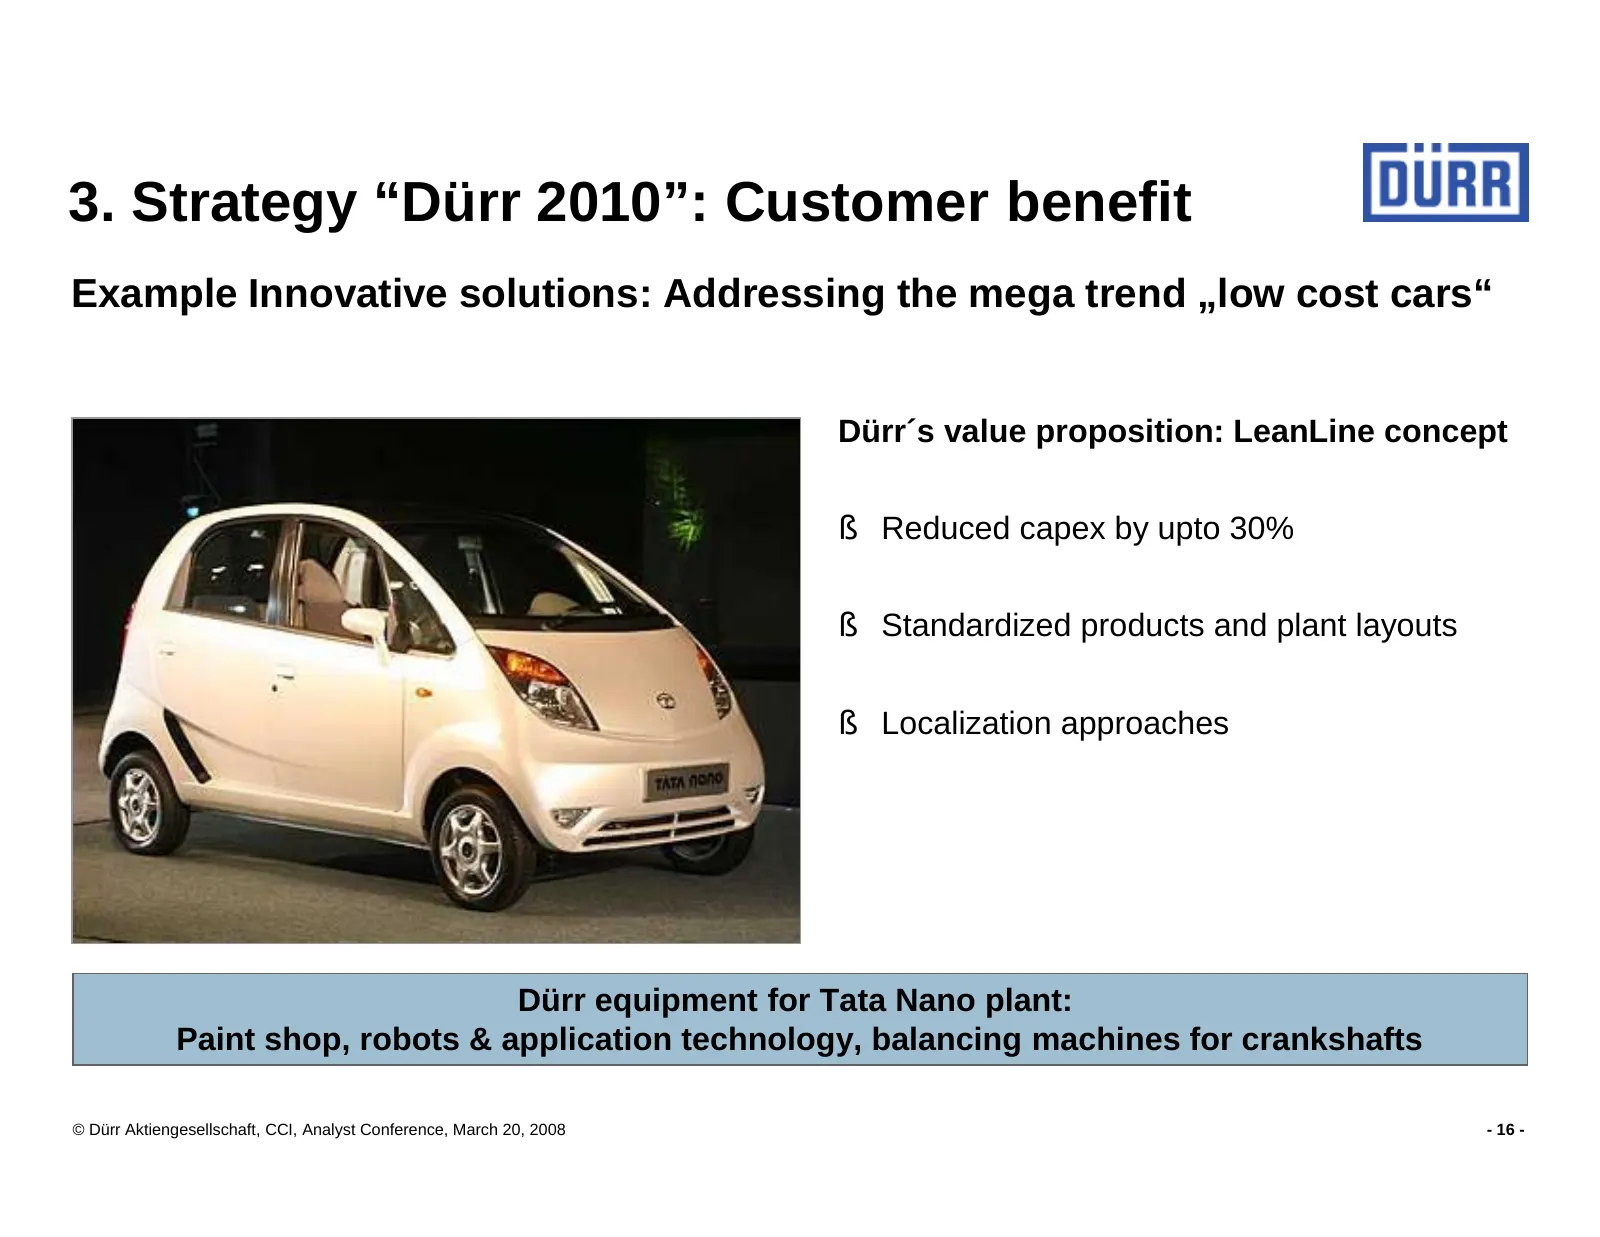
3. Strategy “Dürr 2010”: Customer benefit Example Innovative solutions: Addressing the mega trend „low cost cars“ Dürr´s value proposition: LeanLine concept § Reduced capex by upto 30% § Standardized products and plant layouts § Localization approaches Dürr equipment for Tata Nano plant: Paint shop,
Slide 17: Service: Future potential
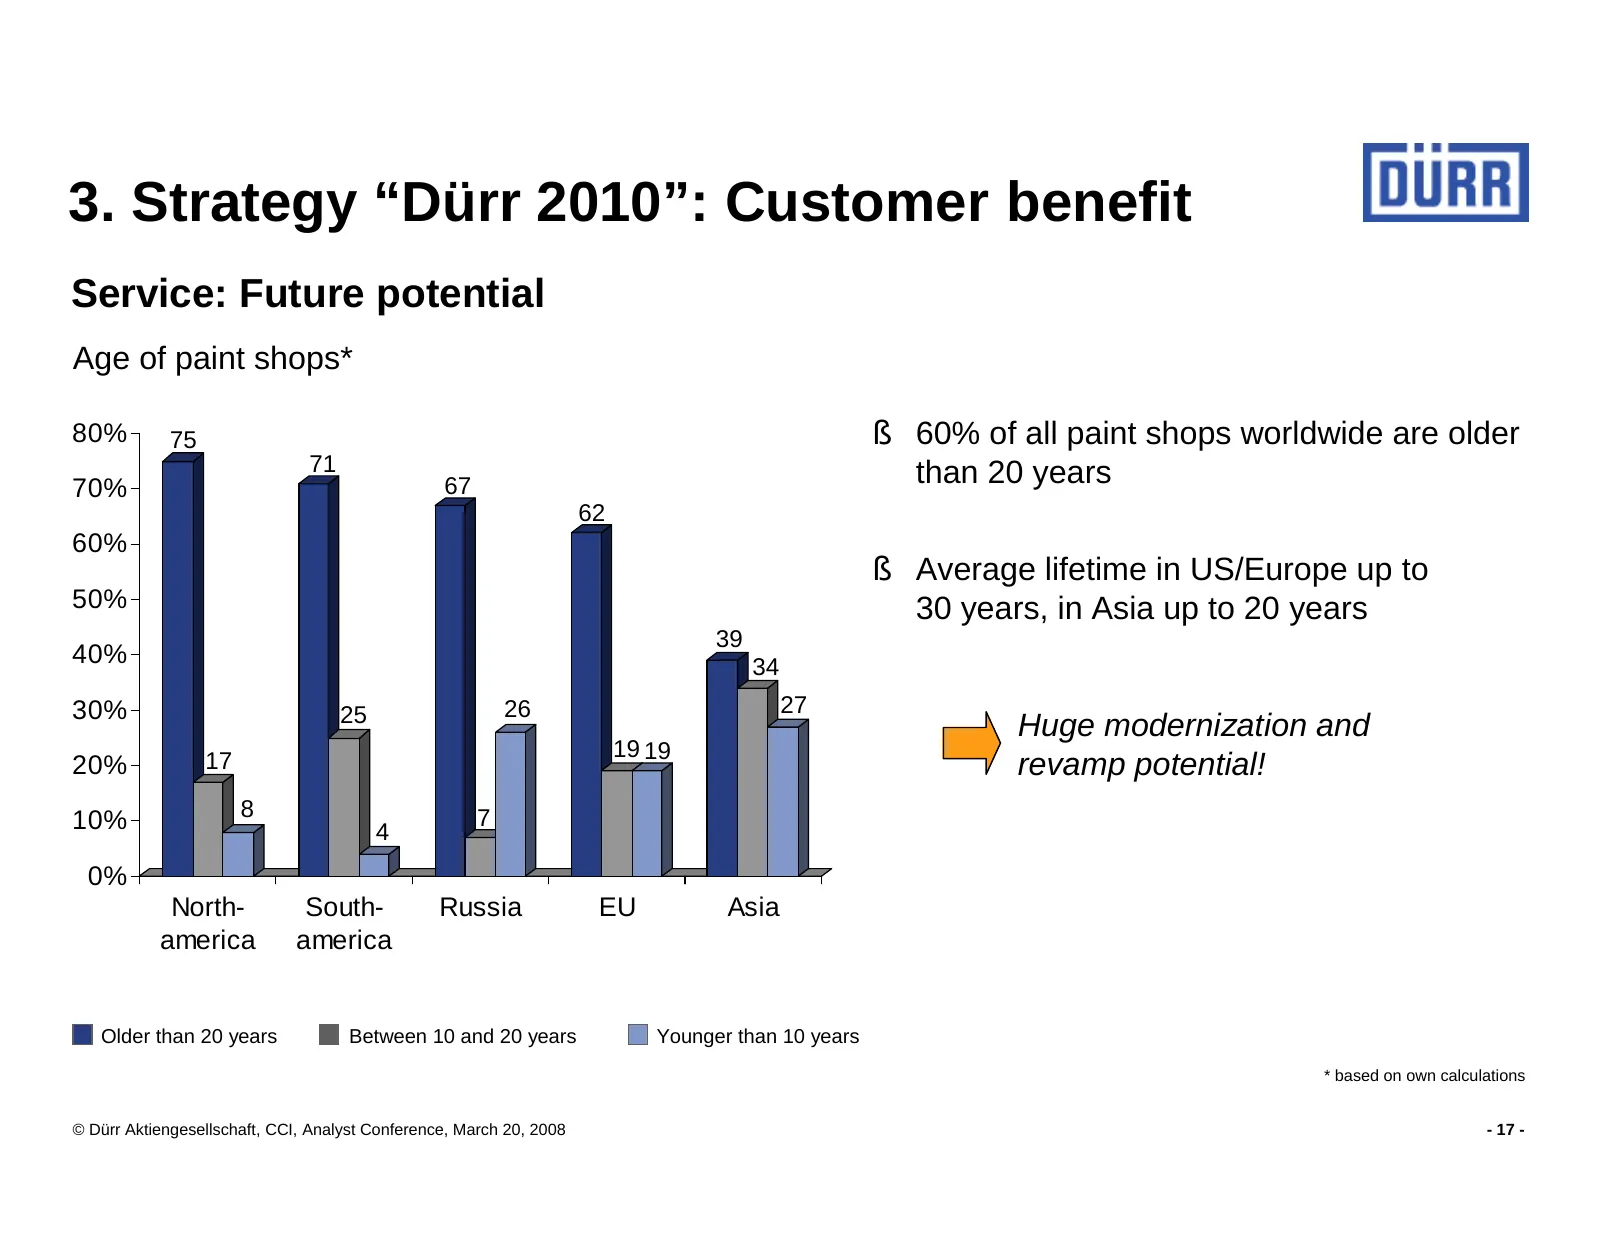
3. Strategy “Dürr 2010”: Customer benefit Service: Future potential Age of paint shops* 80% 75 § 60% of all paint shops worldwide are older 71 than 20 years 70% 67 62 60% § Average lifetime in US/Europe up to 50% 30 years, in Asia up to 20 years 39 40% 34 30% 25 26 27 Huge modernization and 17 19 19
Slide 18: Growth initiatives
3. Strategy “Dürr 2010”: Growth initiatives Dürr will grow above market average by explicit growth initiatives § Further expansion into emerging markets § Aircraft and Technology Systems as new business unit with explicit growth agenda § New products in existing business fields (e.g. consulting, sea
Slide 19: Emerging markets: Leveraging our global footprint
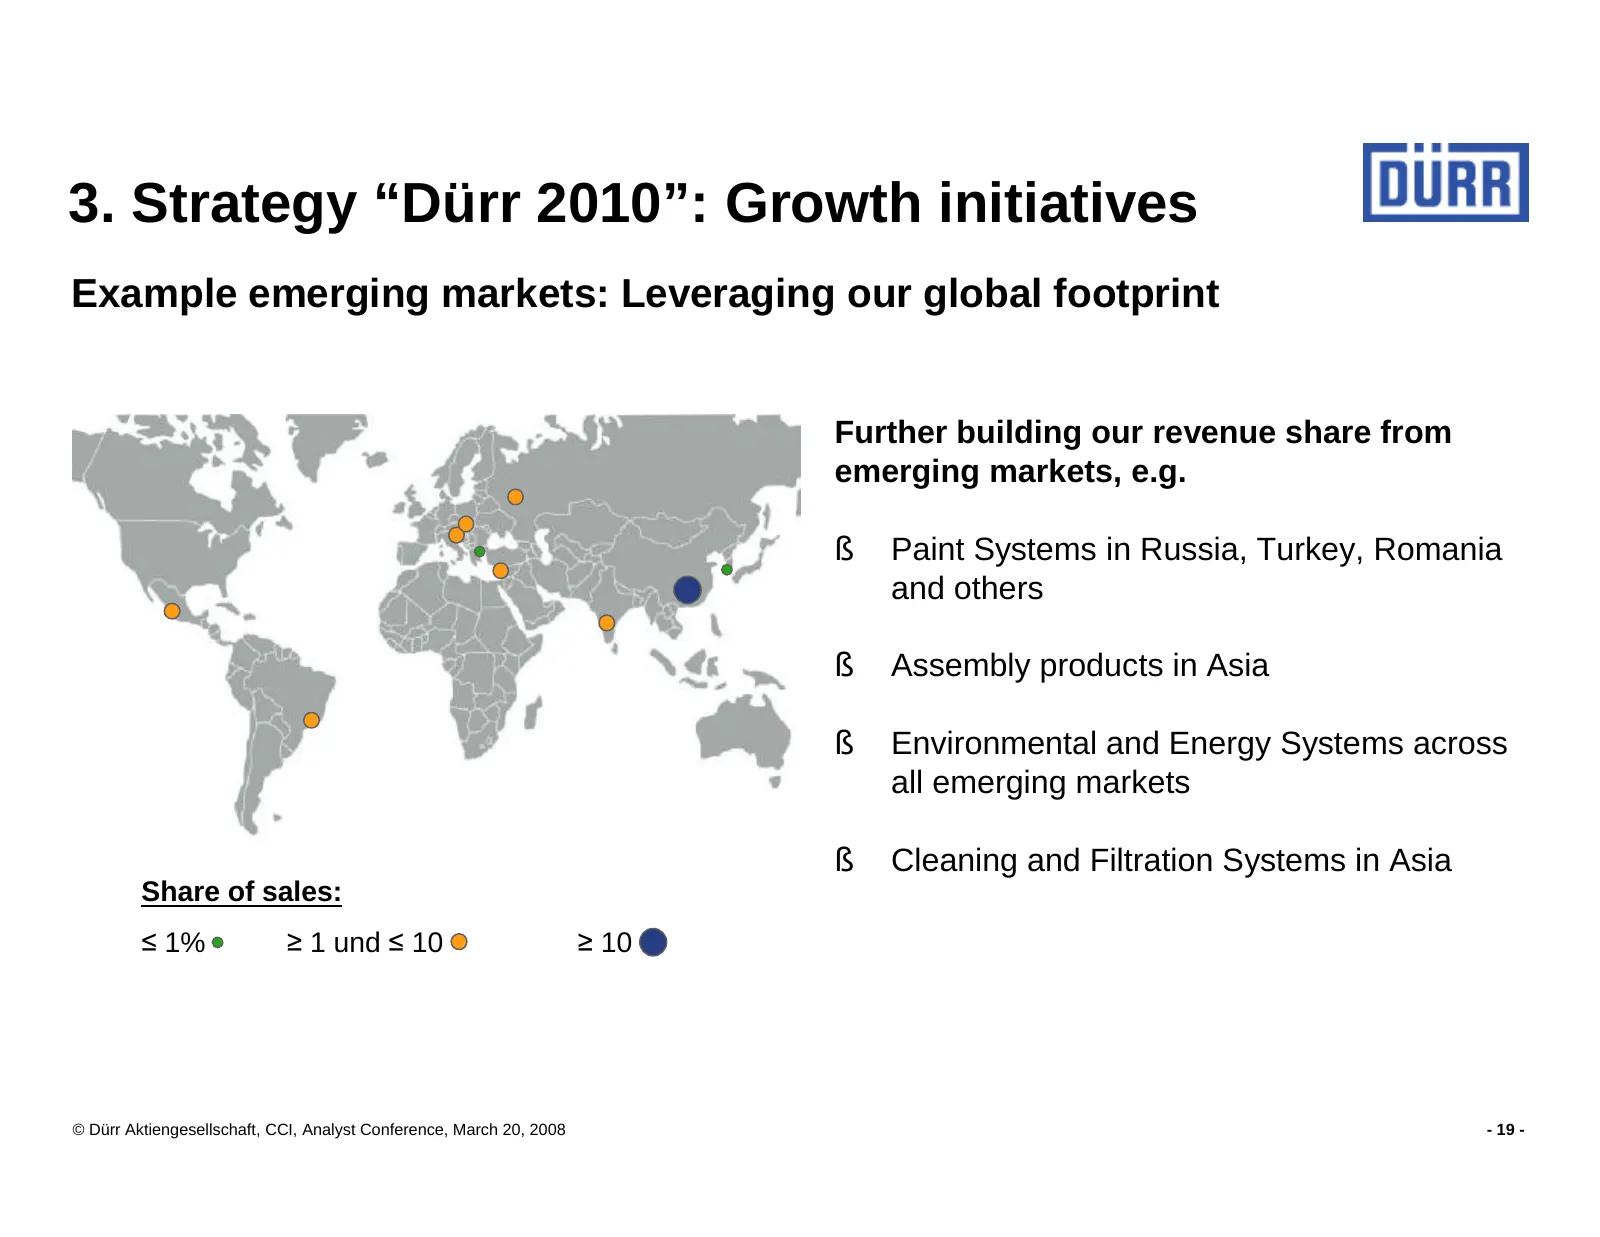
3. Strategy “Dürr 2010”: Growth initiatives Example emerging markets: Leveraging our global footprint Further building our revenue share from emerging markets, e.g. § Paint Systems in Russia, Turkey, Romania and others § Assembly products in Asia § Environmental and Energy Systems across all emergin
Slide 20: Aircraft and Technology Systems: New business unit
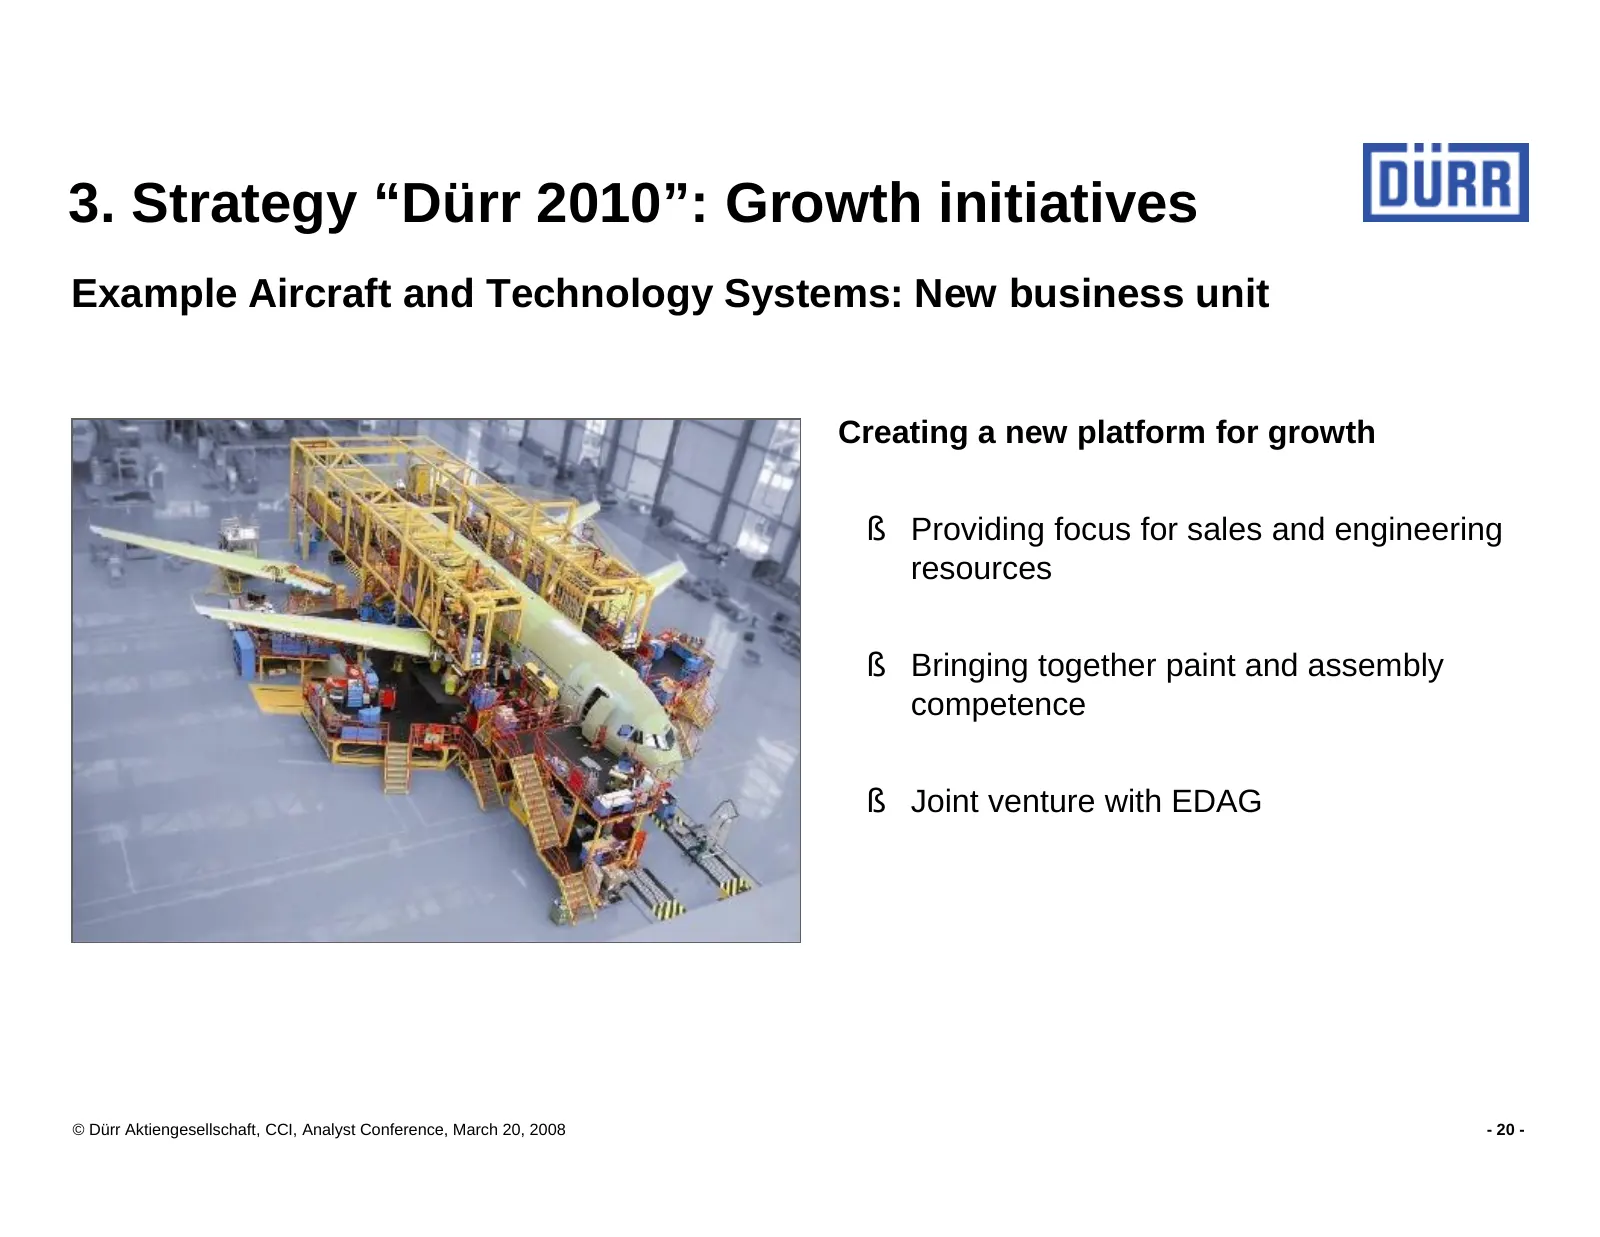
3. Strategy “Dürr 2010”: Growth initiatives Example Aircraft and Technology Systems: New business unit Creating a new platform for growth § Providing focus for sales and engineering resources § Bringing together paint and assembly competence § Joint venture with EDAG © Dürr Aktiengesellschaft, CCI,
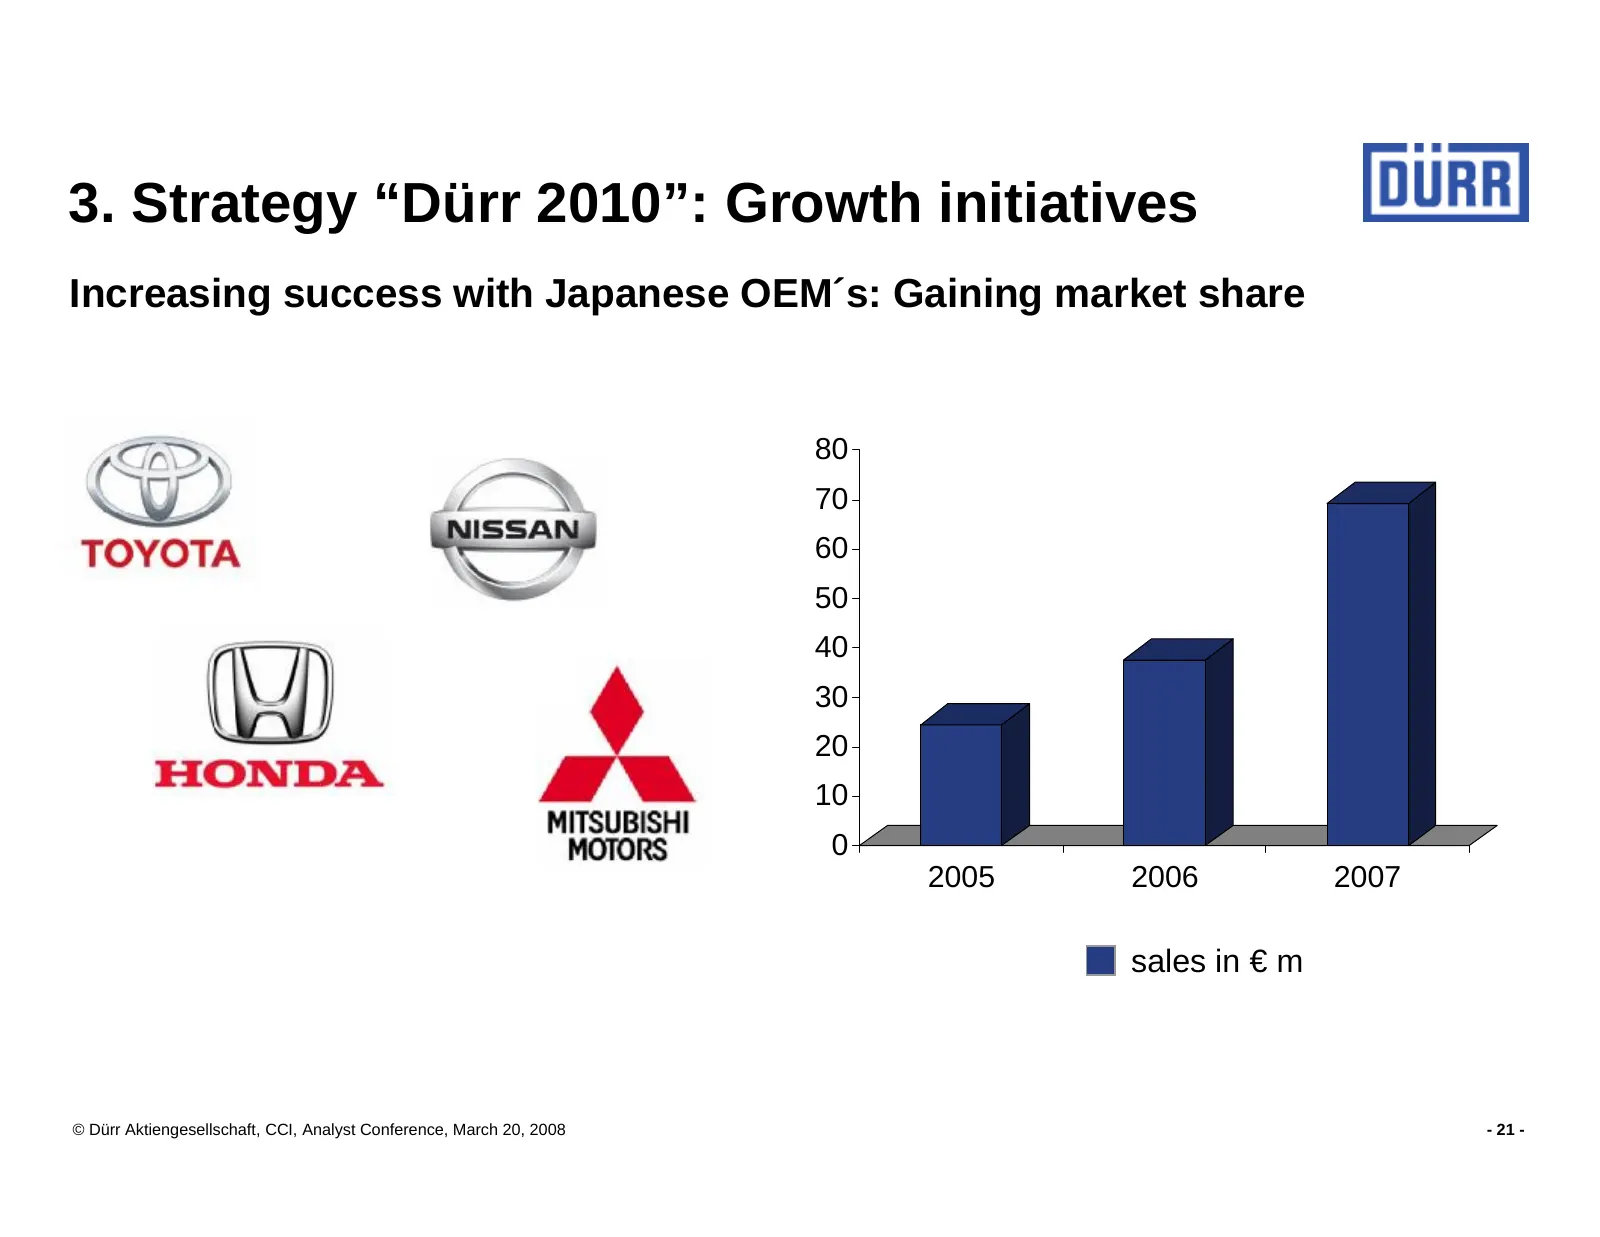
Slide 21: Increasing success with Japanese OEMs: Gaining market share
3. Strategy “Dürr 2010”: Growth initiatives Increasing success with Japanese OEM´s: Gaining market share 80 70 60 50 40 30 20 10 0 2005 2006 2007 sales in € m © Dürr Aktiengesellschaft, CCI, Analyst Conference, March 20, 2008 - 21 -
Slide 22: Process optimization
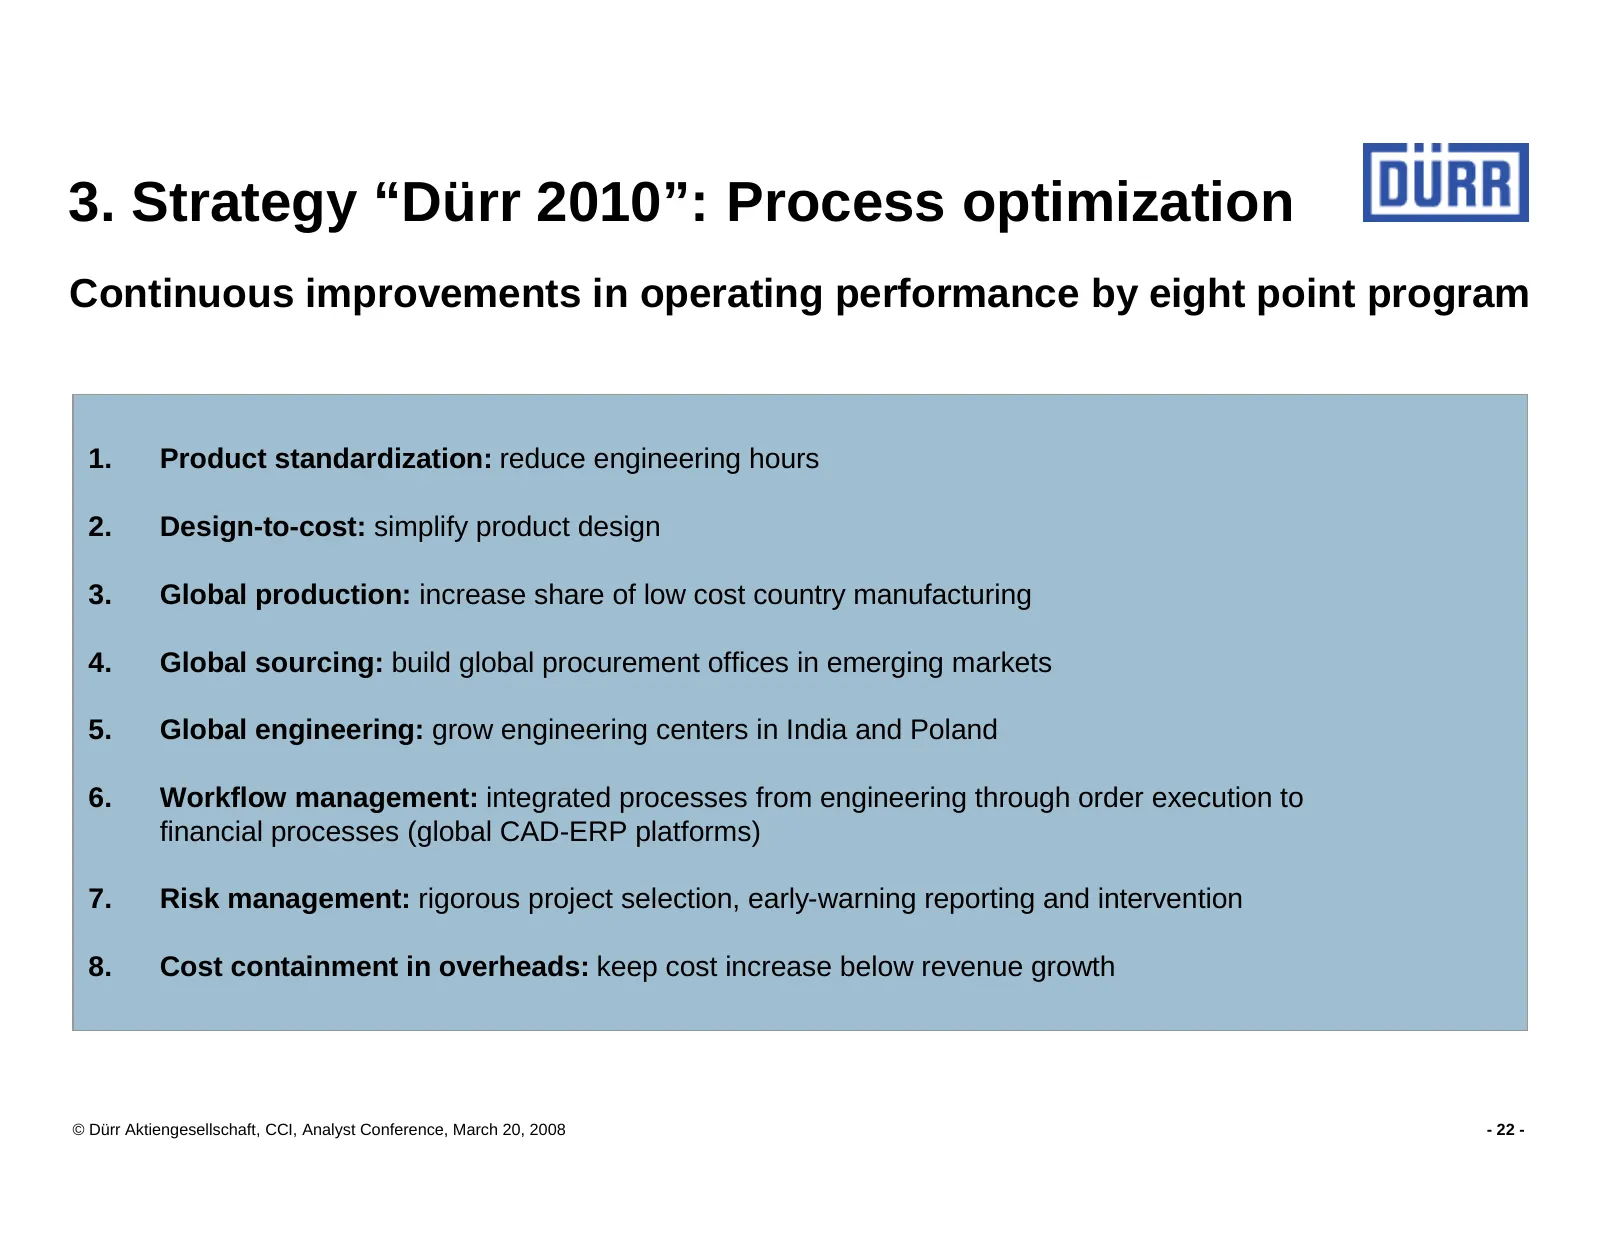
3. Strategy “Dürr 2010”: Process optimization Continuous improvements in operating performance by eight point program 1. Product standardization: reduce engineering hours 2. Design-to-cost: simplify product design 3. Global production: increase share of low cost country manufacturing 4. Global sourc
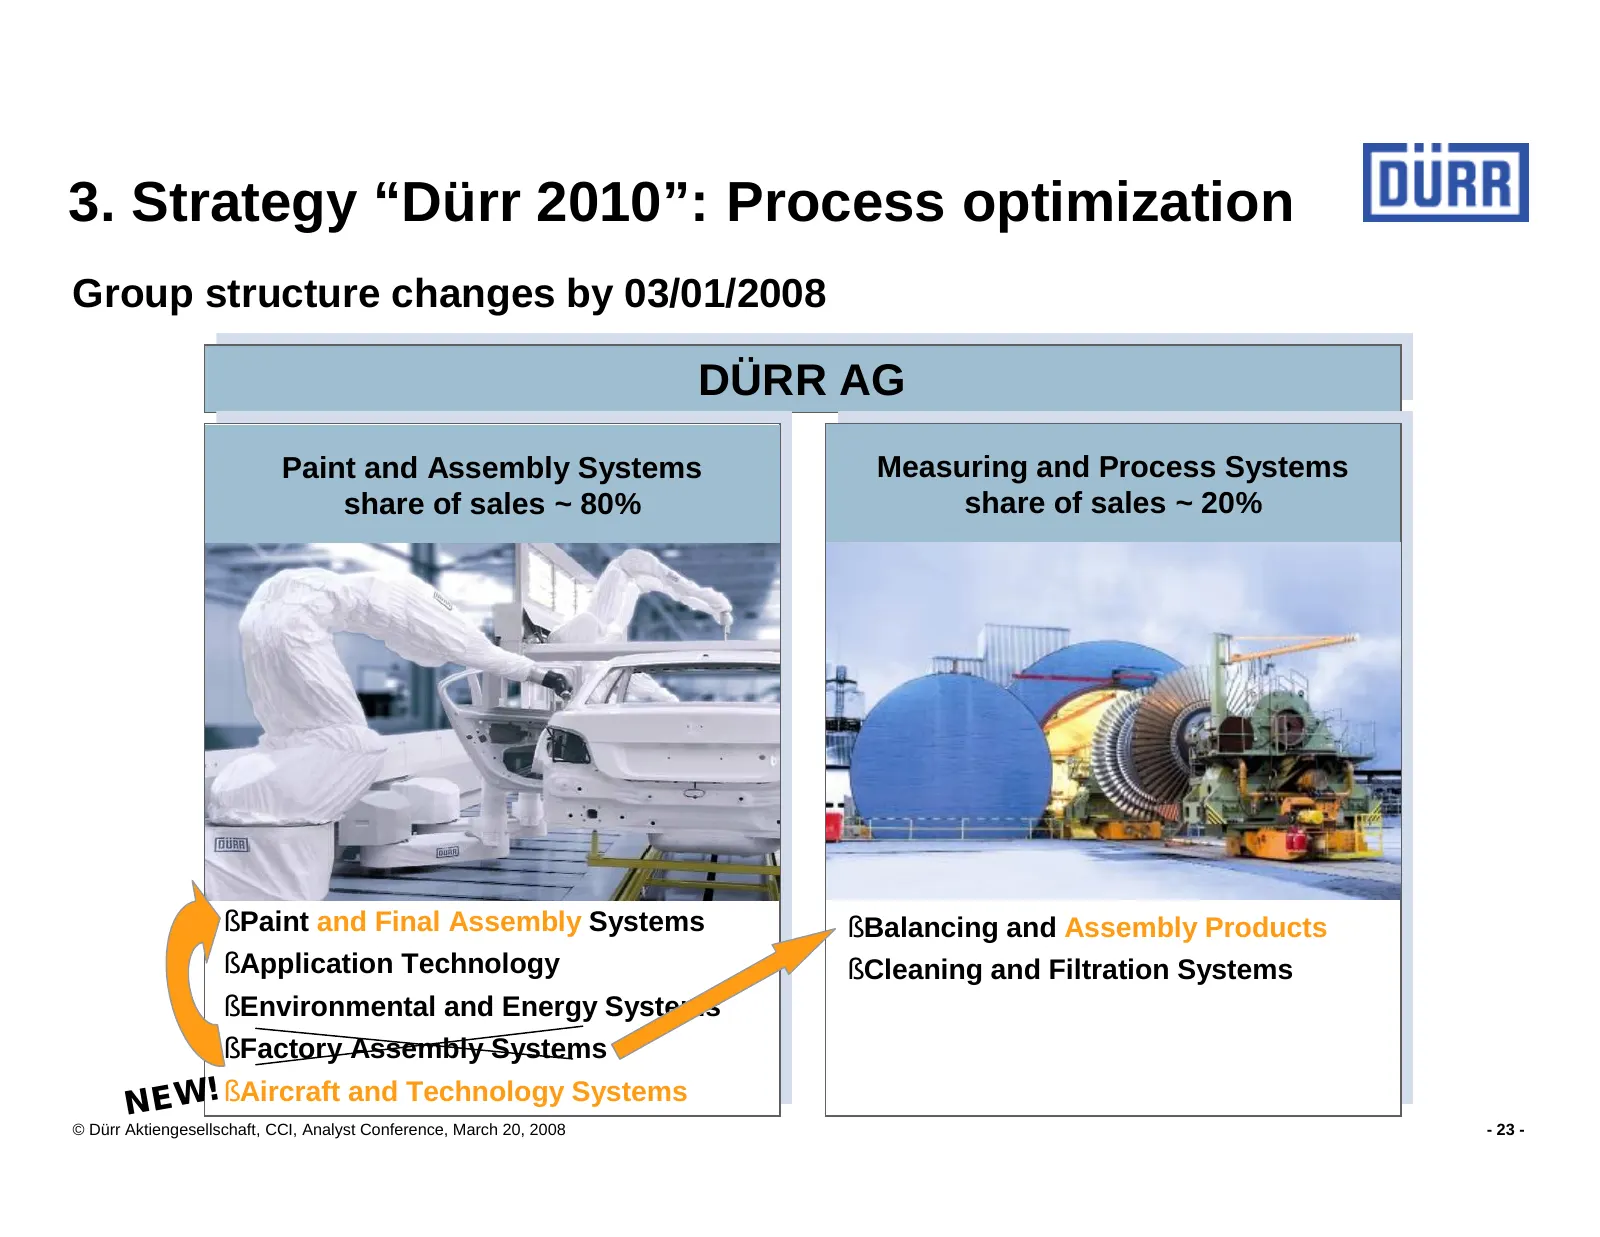
Slide 23: Group structure changes by 03/01/2008
3. Strategy “Dürr 2010”: Process optimization Group structure changes by 03/01/2008 DÜRRAG DÜRR AG Paint and Assembly Systems Measuring and Process Systems share of sales ~ 80% share of sales ~ 20% Paint Systems § Paint and Final Assembly Systems § Balancing and Assembly Products § Application Techn
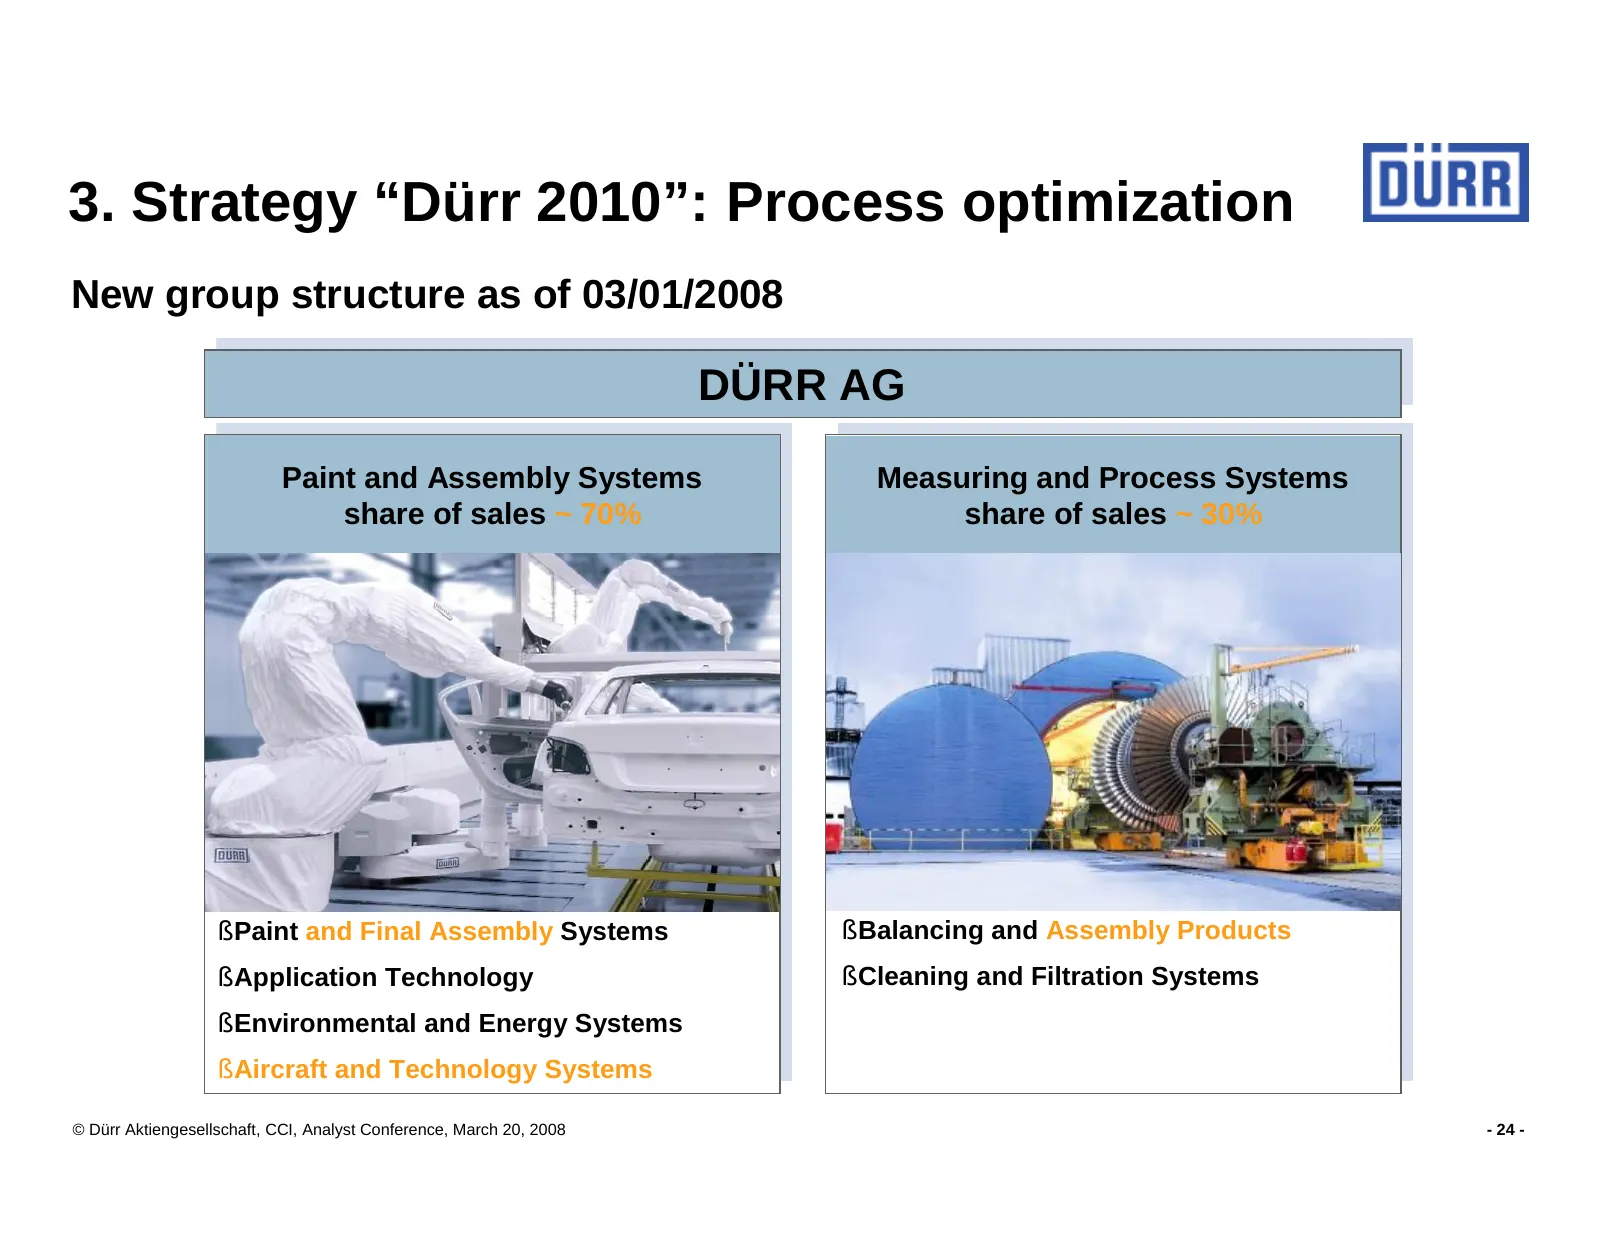
Slide 24: New group structure as of 03/01/2008
3. Strategy “Dürr 2010”: Process optimization New group structure as of 03/01/2008 DÜRRAG DÜRR AG Paint and Assembly Systems Measuring and Process Systems share of sales ~ 70% share of sales ~ 30% § Paint and Final Assembly Systems § Balancing and Assembly Products § Application Technology § Cleanin
Slide 25: Operational excellence
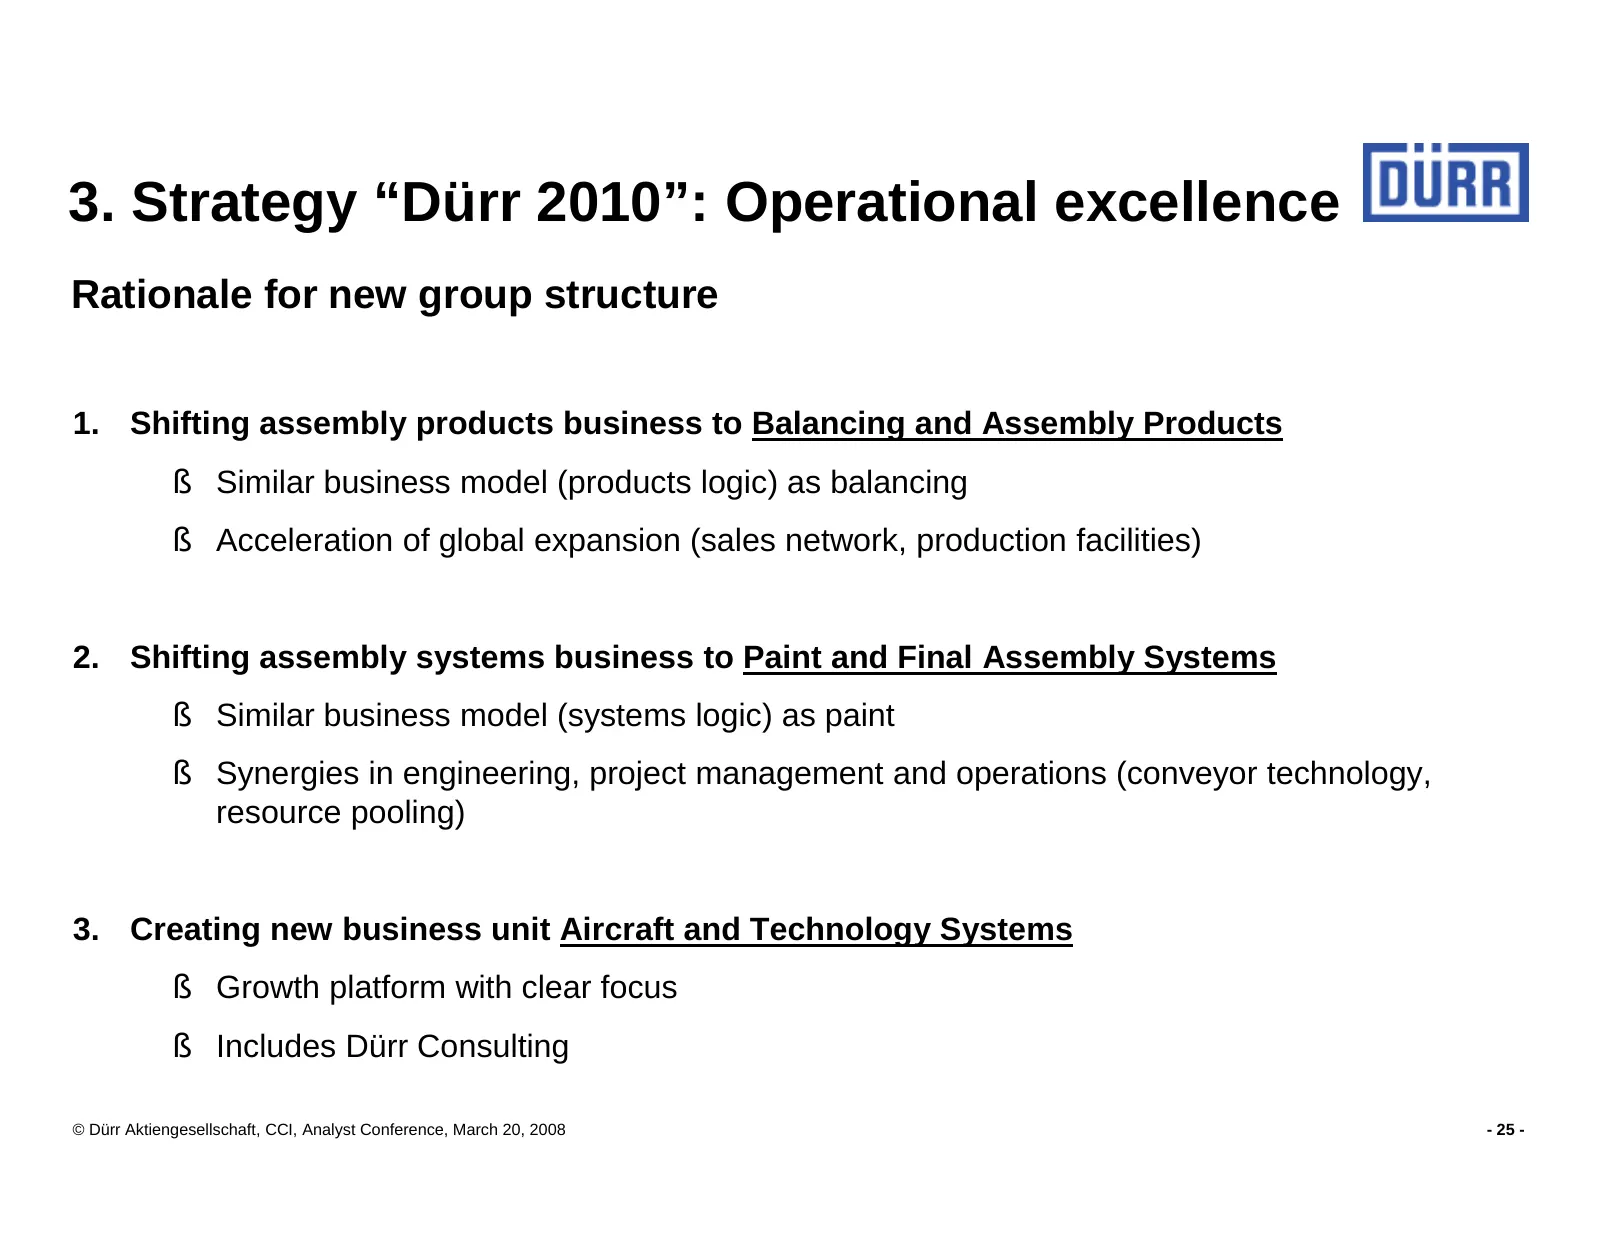
3. Strategy “Dürr 2010”: Operational excellence Rationale for new group structure 1. Shifting assembly products business to Balancing and Assembly Products § Similar business model (products logic) as balancing § Acceleration of global expansion (sales network, production facilities) 2. Shifting ass
Slide 26: Value creation
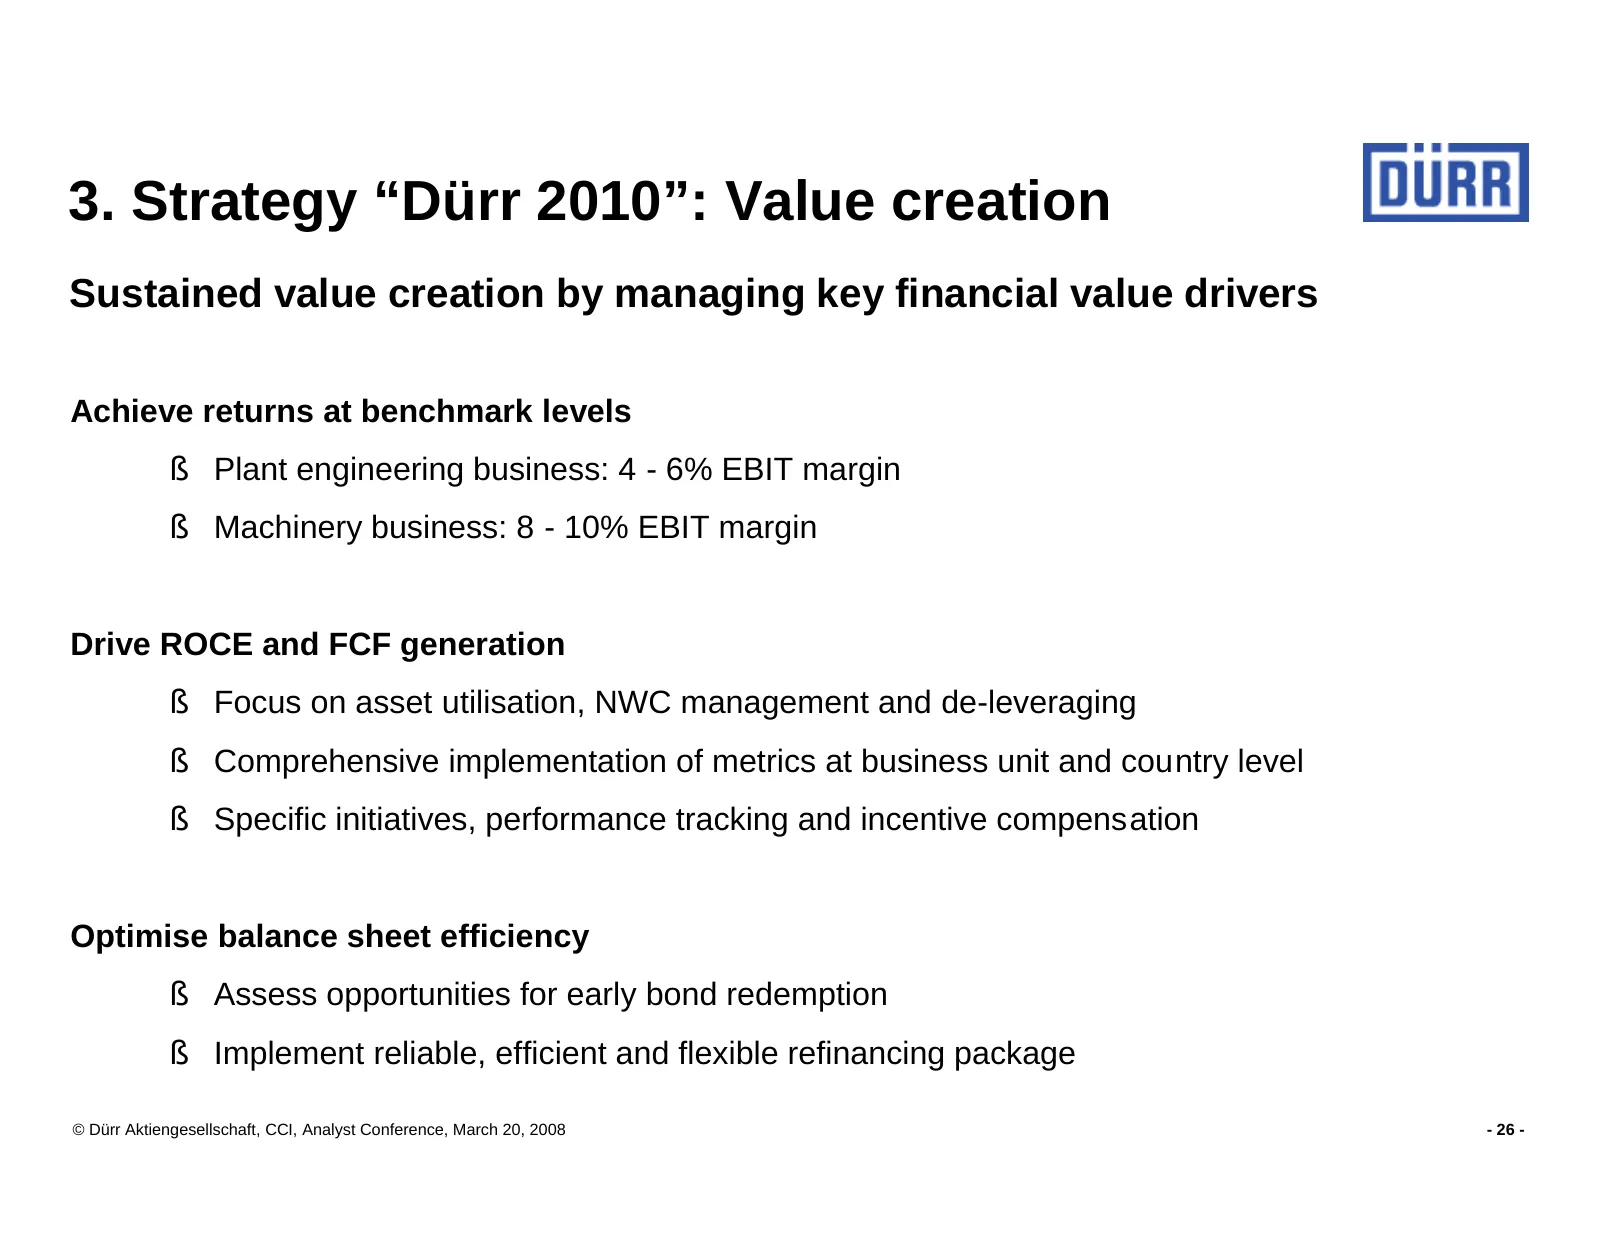
3. Strategy “Dürr 2010”: Value creation Sustained value creation by managing key financial value drivers Achieve returns at benchmark levels § Plant engineering business: 4 - 6% EBIT margin § Machinery business: 8 - 10% EBIT margin Drive ROCE and FCF generation § Focus on asset utilisation, NWC mana
Slide 27: Goals for 2010
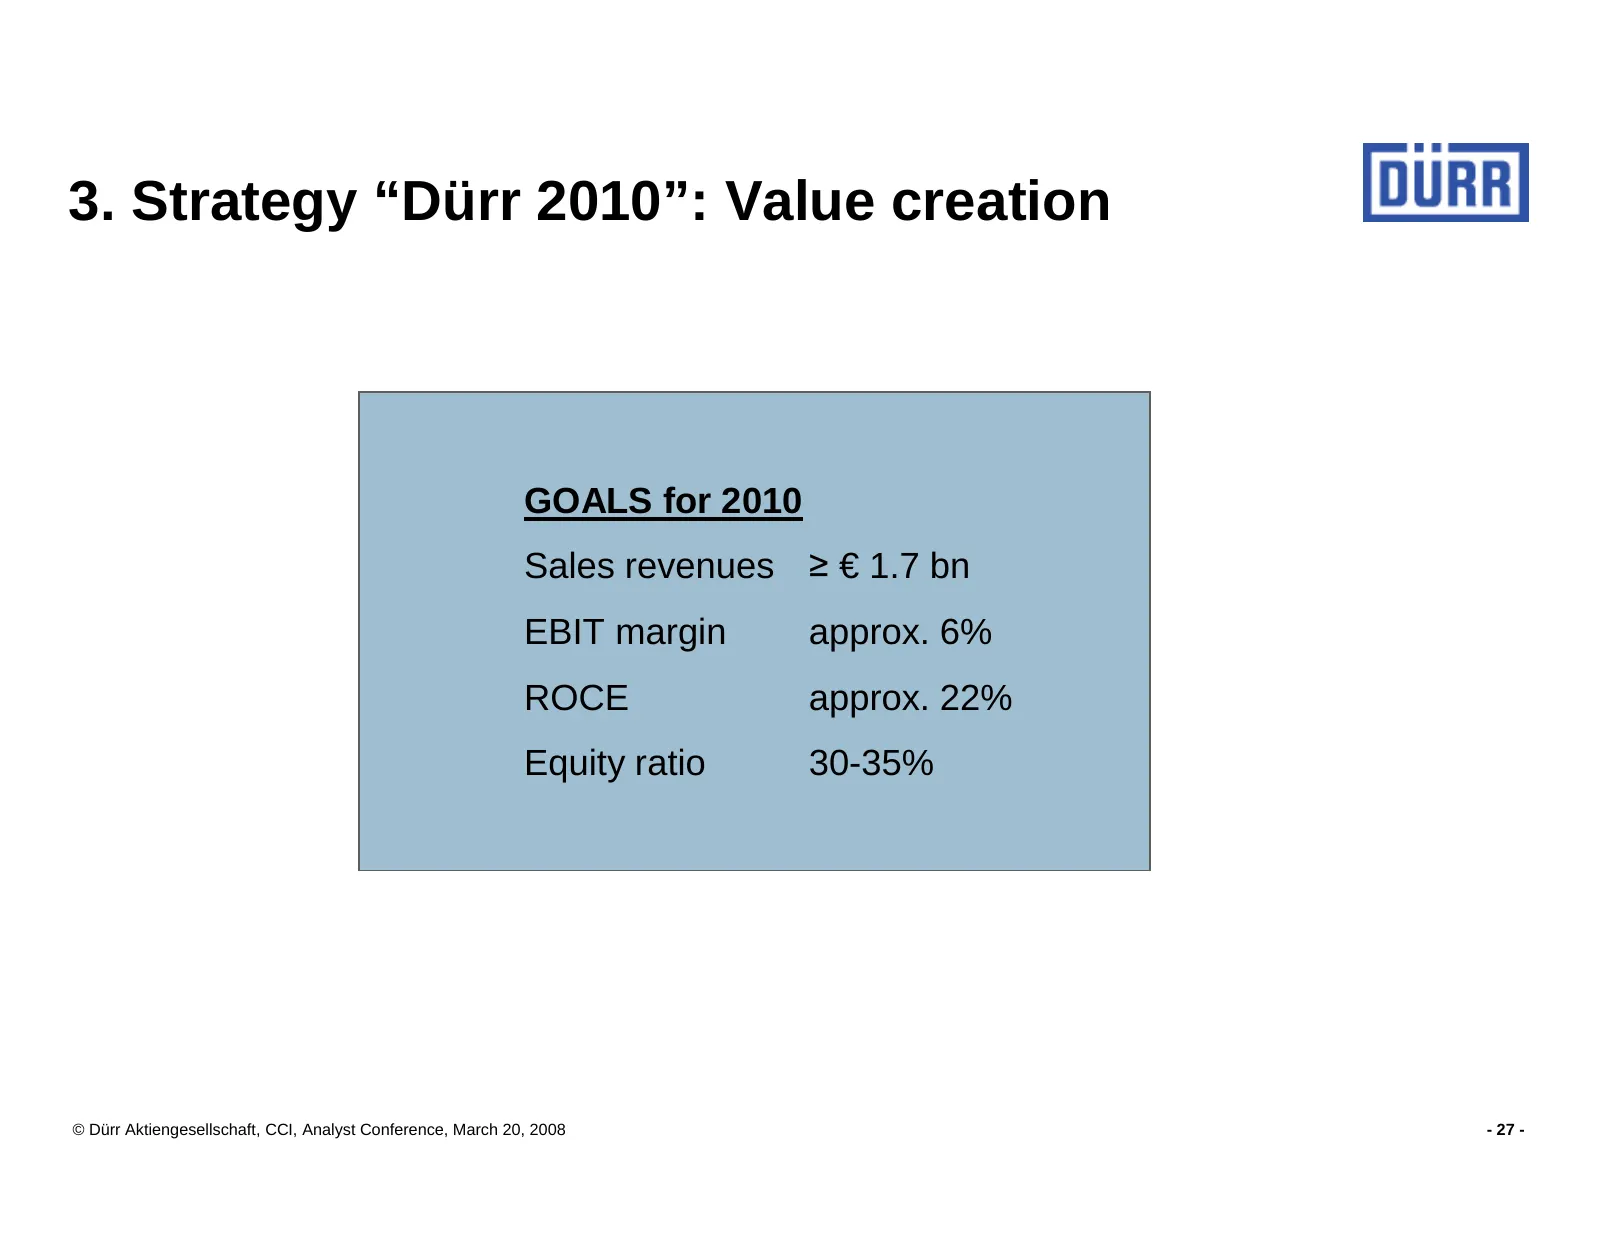
3. Strategy “Dürr 2010”: Value creation GOALS for 2010 Sales revenues ≥ € 1.7 bn EBIT margin approx. 6% ROCE approx. 22% Equity ratio 30-35% © Dürr Aktiengesellschaft, CCI, Analyst Conference, March 20, 2008 - 27 -
Slide 28: Market outlook
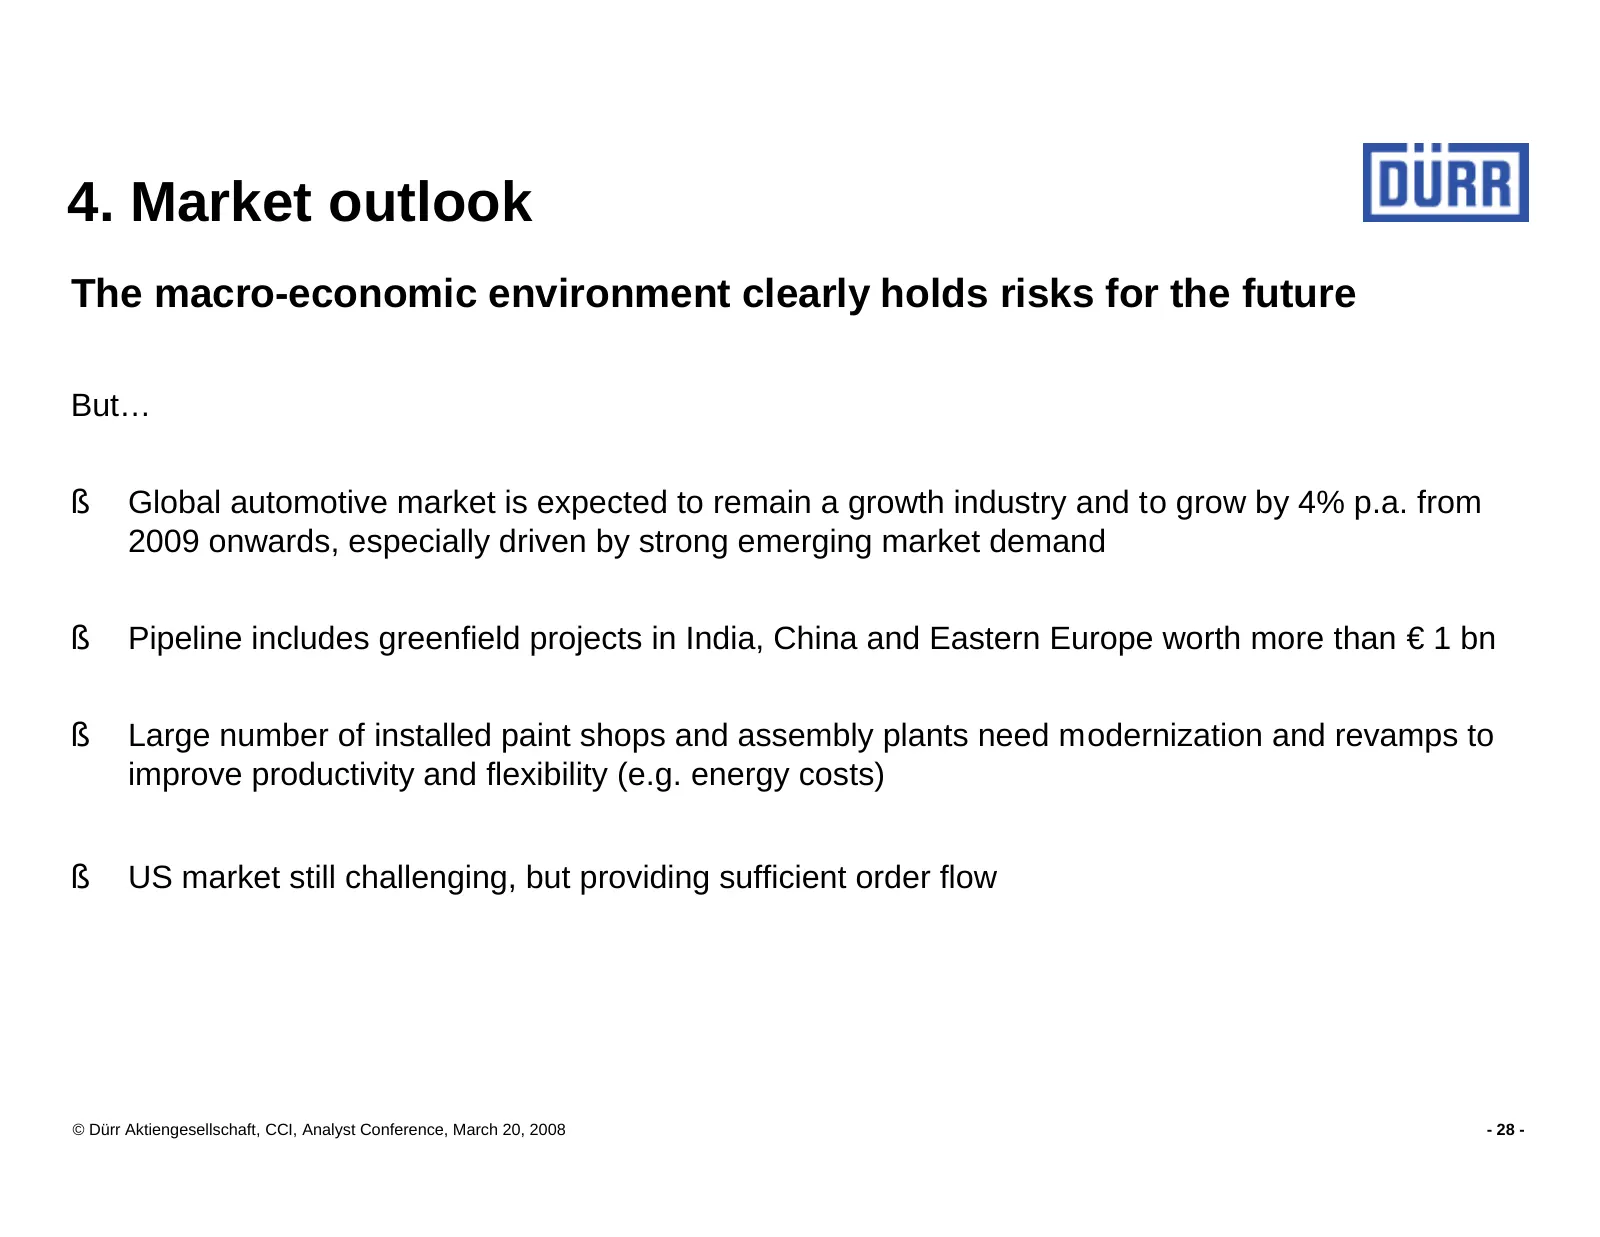
4. Market outlook The macro-economic environment clearly holds risks for the future But… § Global automotive market is expected to remain a growth industry and to grow by 4% p.a. from 2009 onwards, especially driven by strong emerging market demand § Pipeline includes greenfield projects in India, C
Slide 29: Summary: Profitable growth
5. Summary: Profitable growth § 2007: Performance targets delivered § 2008: Sales growth between 5 and 10% § 2008: Strong earnings growth to achieve 5% EBIT margin (up from 3.8% in 2007) § Healthy order book with good visibility and margin quality § Improved execution processes § Turnaround in final
Slide 30: Financial calendar
Financial calendar 05/02/2008 Annual general meeting 05/08/2008 Interim report January - March 2008 08/07/2008 Interim report half year 2008 11/06/2008 Interim report January - September 2008 Contact: Dürr Aktiengesellschaft Günter Dielmann Corporate Communications & Investor Relations Otto-Dürr-Str
Slide 31: Analyst Conference Dürr Aktiengesellschaft
Analyst Conference Dürr Aktiengesellschaft Fiscal Year 2007 Ralf Dieter, CEO Ralph Heuwing, CFO Frankfurt, March 20, 2008
Source: Internet Archive copy of durr.com
More decks from Durr AG
 Q3 2026 Earnings Presentation33 slides · Nov 12, 2026
 Q2 2026 Earnings Presentation39 slides · Aug 6, 2026
 Q1 2026 Earnings Presentation35 slides · May 12, 2026
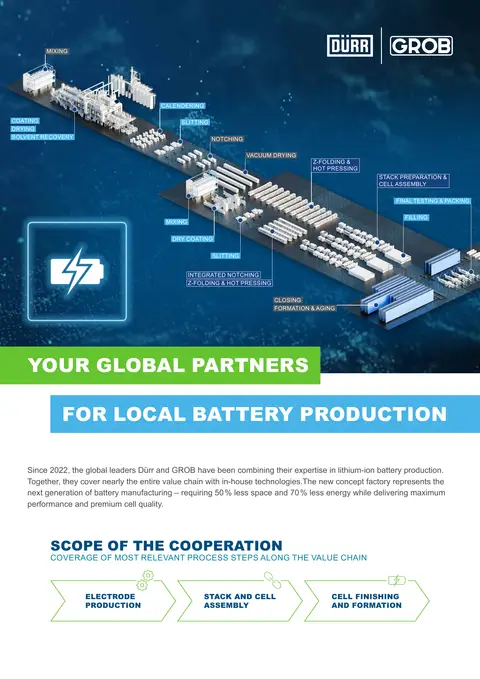 Fact Sheet (2025)2 slides · Dec 2, 2025
 Q3 2025 Earnings Presentation46 slides · Nov 13, 2025
 Q2 2025 Earnings Presentation31 slides · Jul 24, 2025