MB Financial — Investor Presentation (January 2018)
40 slides from MB Financial's investor presentation, Jan 25, 2018
Slide 1: Investor Presentation January 2018
January 2018 NASDAQ: MBFI Investor Presentation EXHIBIT 99.2
Slide 2: Forward-Looking Statements
Forward-Looking Statements 1 When used in this presentation and in reports filed with or furnished to the Securities and Exchange Commission (the "SEC"), in press releases or other public stockholder communications, or in oral statements made with the approval of an authorized executive officer, the
Slide 3: Forward-Looking Statements – continued
Forward-Looking Statements – continued 2 (19) new legislation or regulatory changes, including but not limited to the Dodd-Frank Wall Street Reform and Consumer Protection Act of 2010 (the “Dodd-Frank Act”) and regulations adopted thereunder, changes in capital requirements pursuant to the Dodd-Fran
Slide 4: Table of Contents
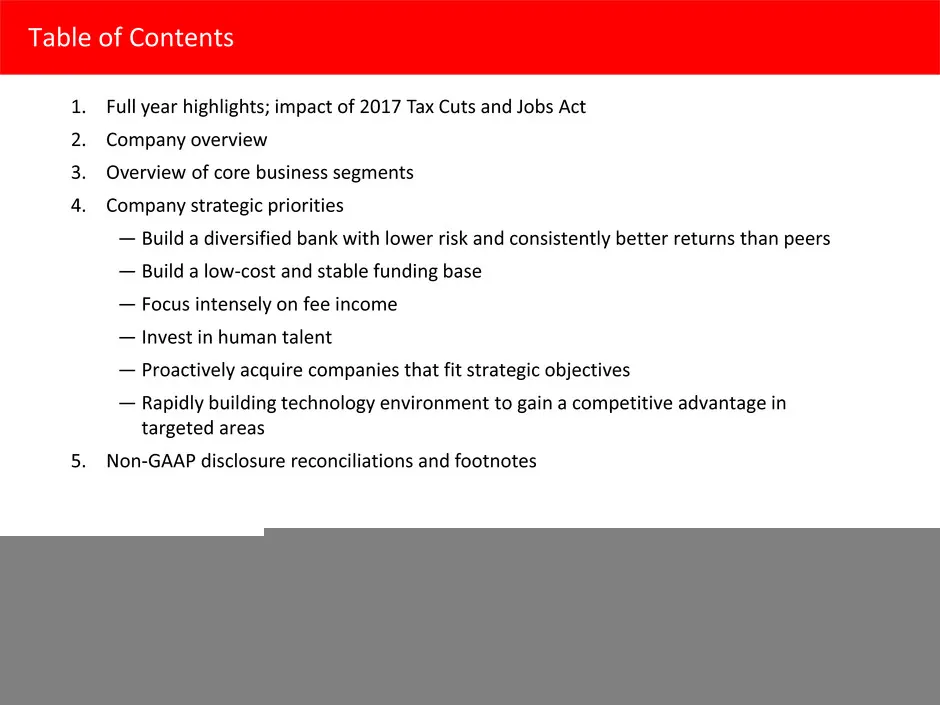
Table of Contents 3 1. Full year highlights; impact of 2017 Tax Cuts and Jobs Act 2. Company overview 3. Overview of core business segments 4. Company strategic priorities ― Build a diversified bank with lower risk and consistently better returns than peers ― Build a low-cost and stable funding base

Slide 5: Full Year Highlights and Impact of 2017 Tax Cuts and Jobs Act
4 Full Year Highlights and Impact of 2017 Tax Cuts and Jobs Act
Slide 6: Full Year Highlights
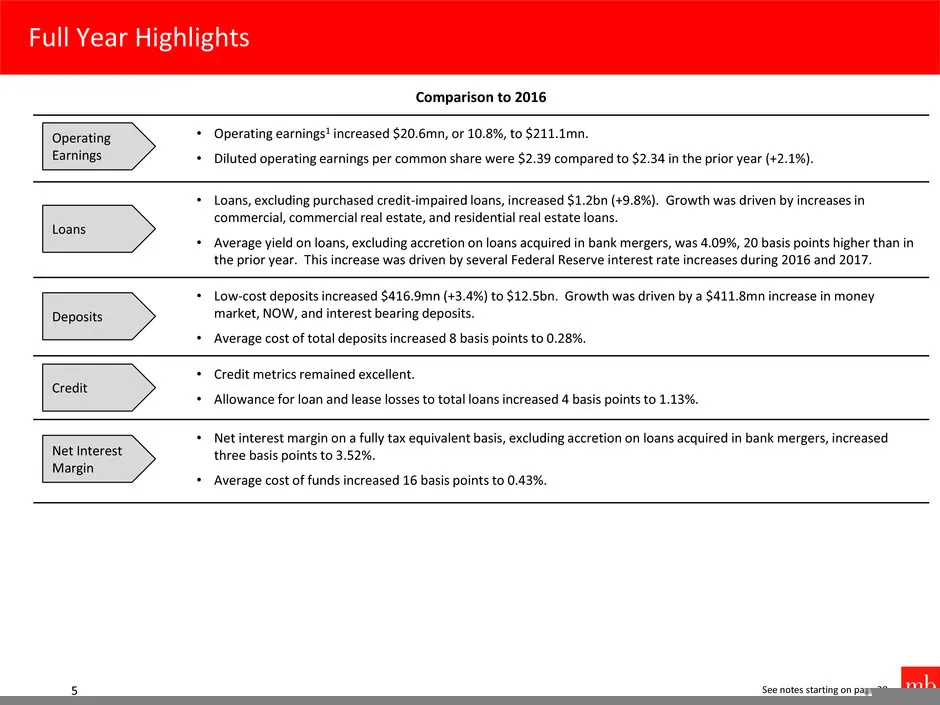
Full Year Highlights 5 See notes starting on page 38. Comparison to 2016 • Operating earnings1 increased $20.6mn, or 10.8%, to $211.1mn. • Diluted operating earnings per common share were $2.39 compared to $2.34 in the prior year (+2.1%). • Loans, excluding purchased credit-impaired loans, increased
Slide 7: 2017 Tax Cuts and Jobs Act Impact
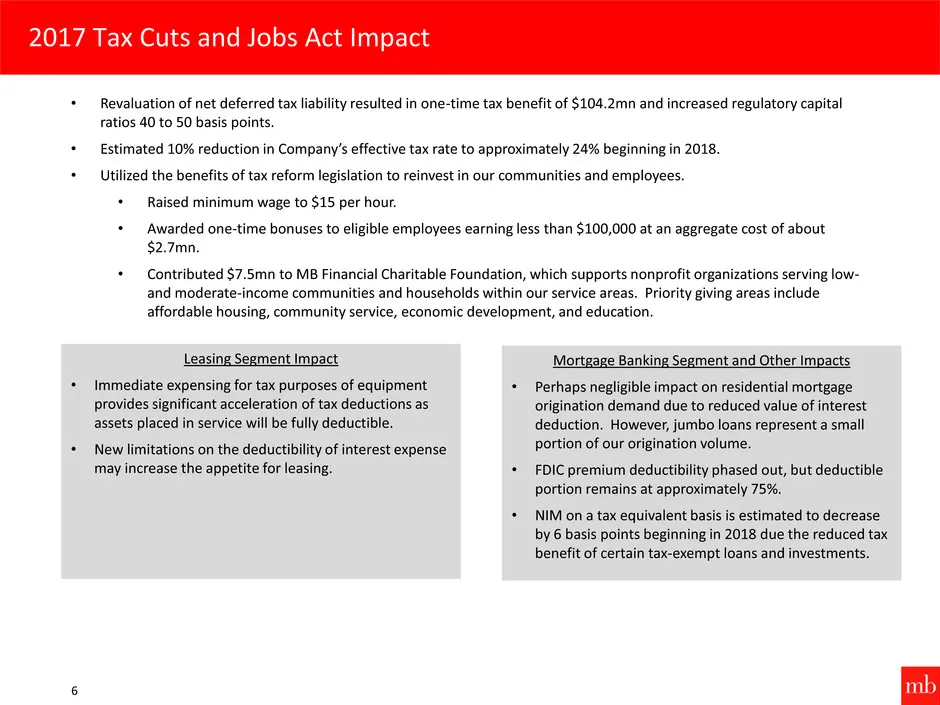
2017 Tax Cuts and Jobs Act Impact 6 • Revaluation of net deferred tax liability resulted in one-time tax benefit of $104.2mn and increased regulatory capital ratios 40 to 50 basis points. • Estimated 10% reduction in Company’s effective tax rate to approximately 24% beginning in 2018. • Utilized the

Slide 8: Company Overview
7 Company Overview
Slide 9: MB Financial Overview
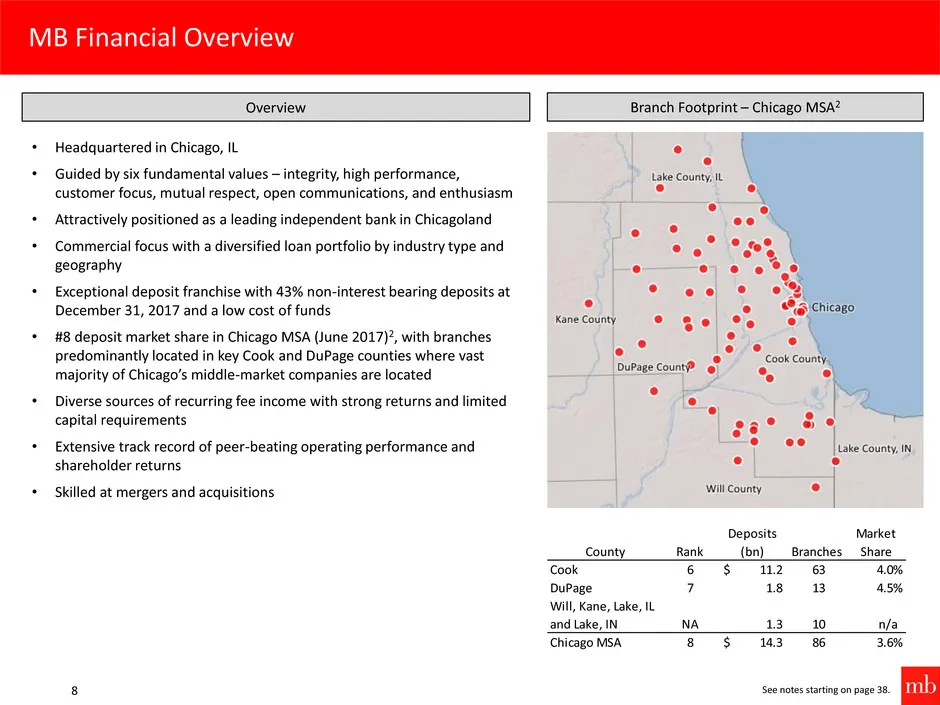
MB Financial Overview 8 See notes starting on page 38. • Headquartered in Chicago, IL • Guided by six fundamental values – integrity, high performance, customer focus, mutual respect, open communications, and enthusiasm • Attractively positioned as a leading independent bank in Chicagoland • Commerc
Slide 10: MB Financial Overview: Financial Highlights
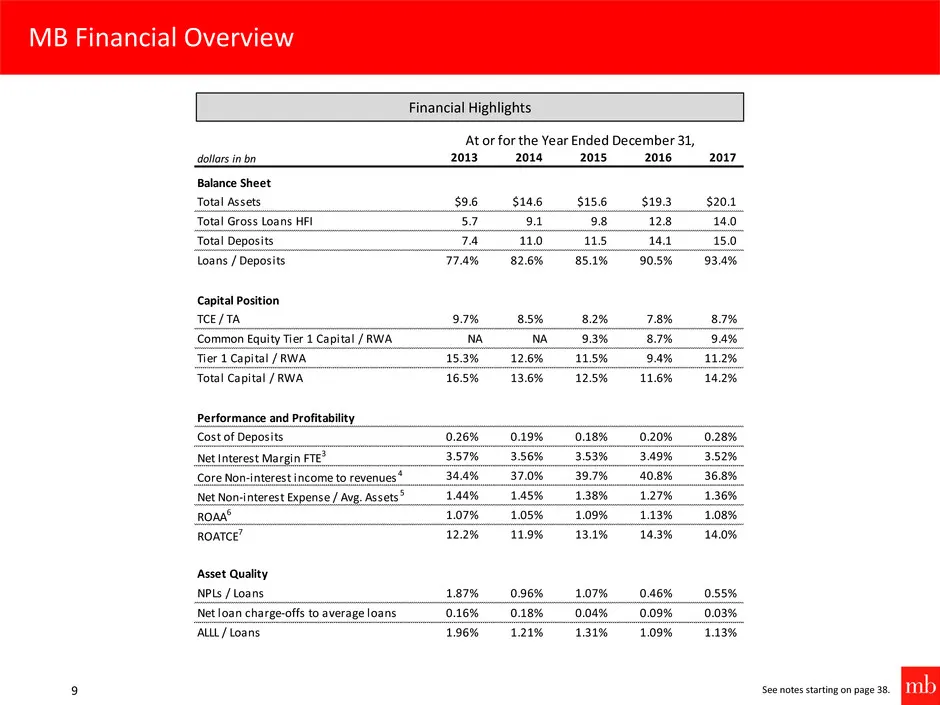
MB Financial Overview 9 See notes starting on page 38. Financial Highlights dollars in bn 2013 2014 2015 2016 2017 Balance Sheet Total Assets $9.6 $14.6 $15.6 $19.3 $20.1 Total Gross Loans HFI 5.7 9.1 9.8 12.8 14.0 Total Deposits 7.4 11.0 11.5 14.1 15.0 Loans / Deposits 77.4% 82.6% 85.1% 90.5% 93.4%

Slide 11: Overview of Core Business Segments
10 Overview of Core Business Segments
Slide 12: Three Core Business Segments
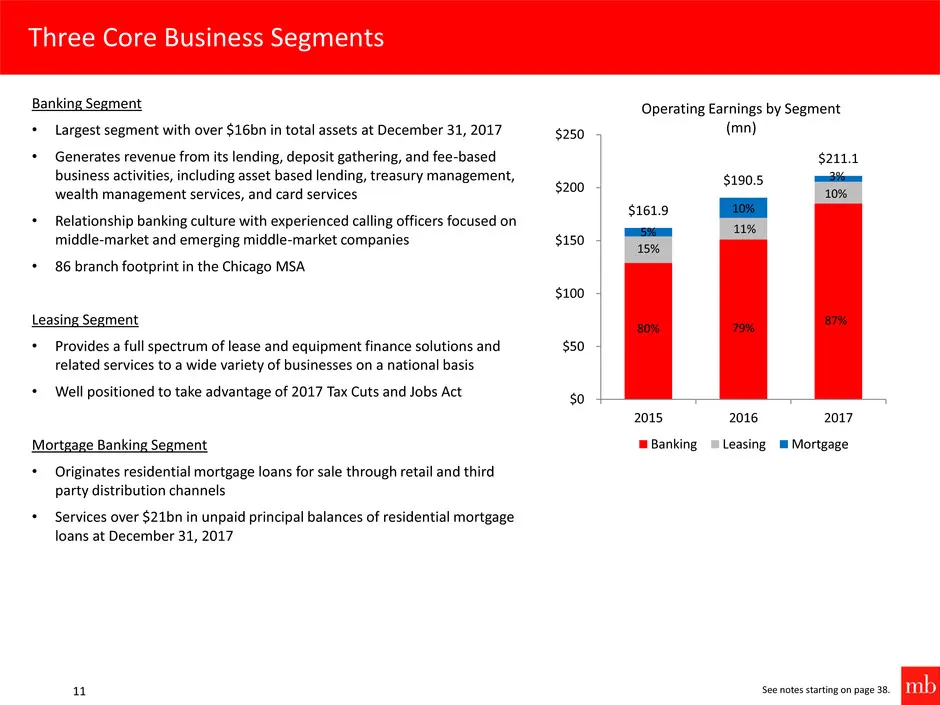
Three Core Business Segments 11 Banking Segment • Largest segment with over $16bn in total assets at December 31, 2017 • Generates revenue from its lending, deposit gathering, and fee-based business activities, including asset based lending, treasury management, wealth management services, and card
Slide 13: Increasing National Presence
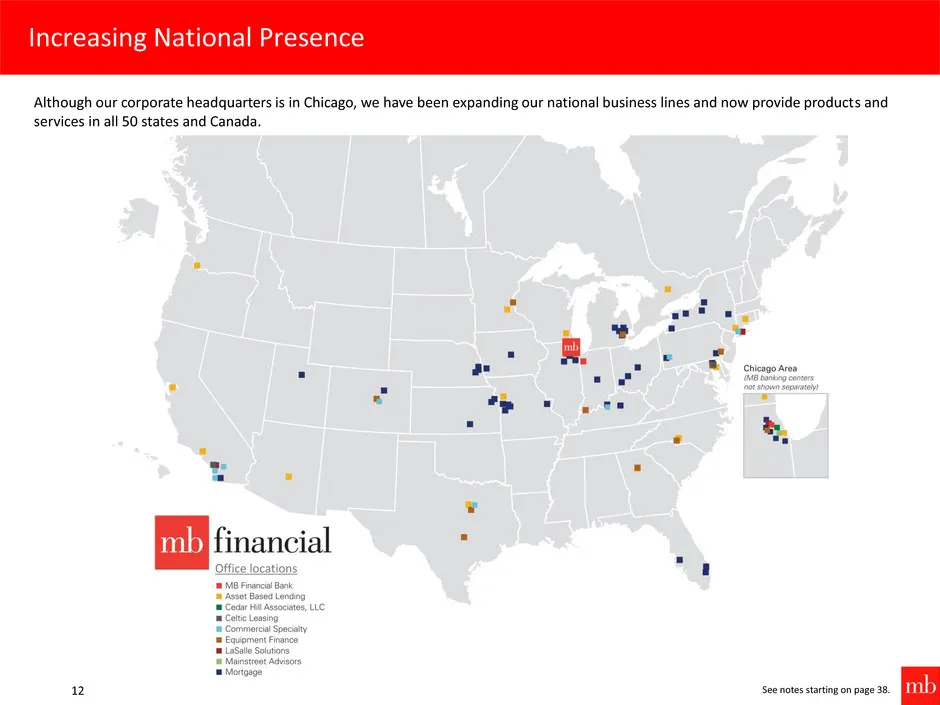
Increasing National Presence 12 See notes starting on page 38. Although our corporate headquarters is in Chicago, we have been expanding our national business lines and now provide products and services in all 50 states and Canada. Office locations
Slide 14: Banking Segment – Commercial Banking
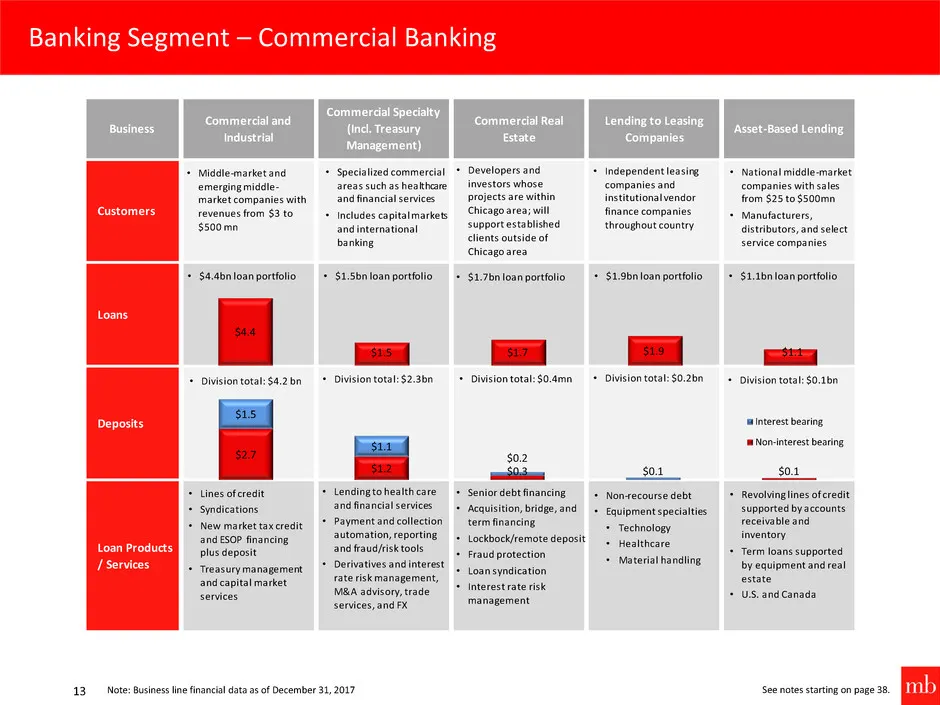
Banking Segment – Commercial Banking 13 See notes starting on page 38. Note: Business line financial data as of December 31, 2017 Business Commercial and Industrial Commercial Specialty (Incl. Treasury Management) Commercial Real Estate Lending to Leasing Companies Asset-Based Lending Customers Loan
Slide 15: Banking Segment – Consumer, Wealth, and Other
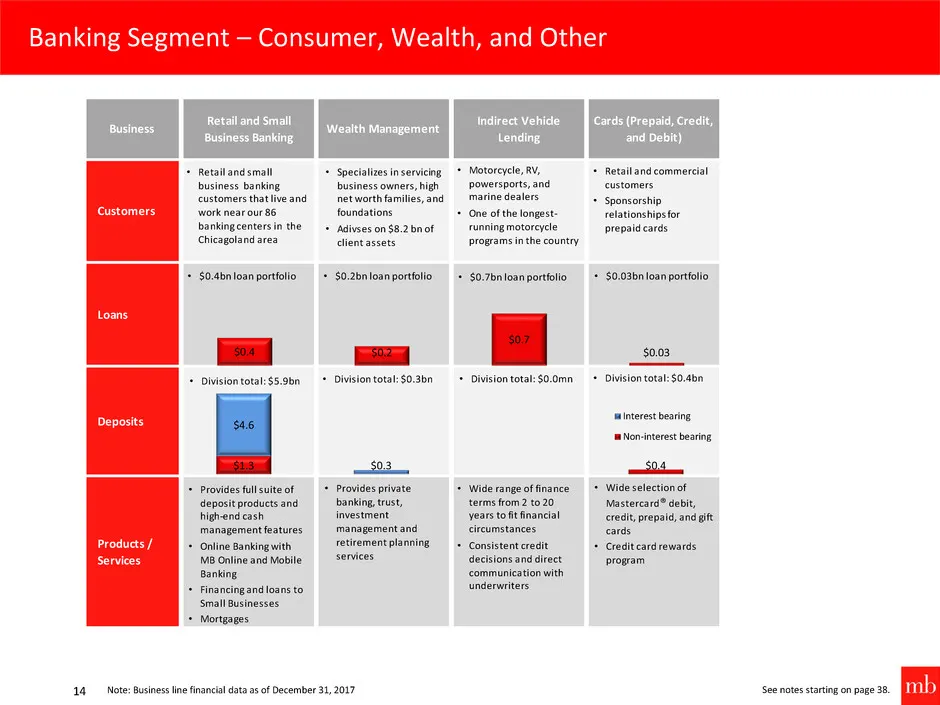
Banking Segment – Consumer, Wealth, and Other 14 See notes starting on page 38. Note: Business line financial data as of December 31, 2017 Business Retail and Small Business Banking Wealth Management Indirect Vehicle Lending Cards (Prepaid, Credit, and Debit) Customers Loans Deposits Products / Serv
Slide 16: Leasing Segment
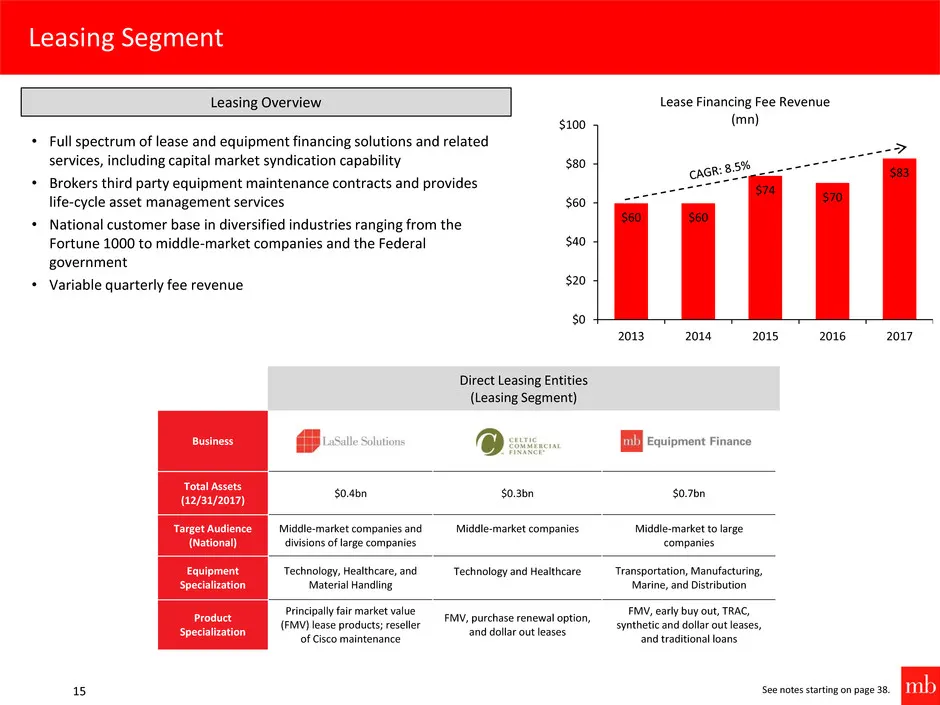
Leasing Segment 15 Business Total Assets (12/31/2017) $0.4bn $0.3bn $0.7bn Target Audience (National) Middle-market companies and divisions of large companies Middle-market companies Middle-market to large companies Equipment Specialization Technology, Healthcare, and Material Handling Technology an
Slide 17: Mortgage Banking Segment
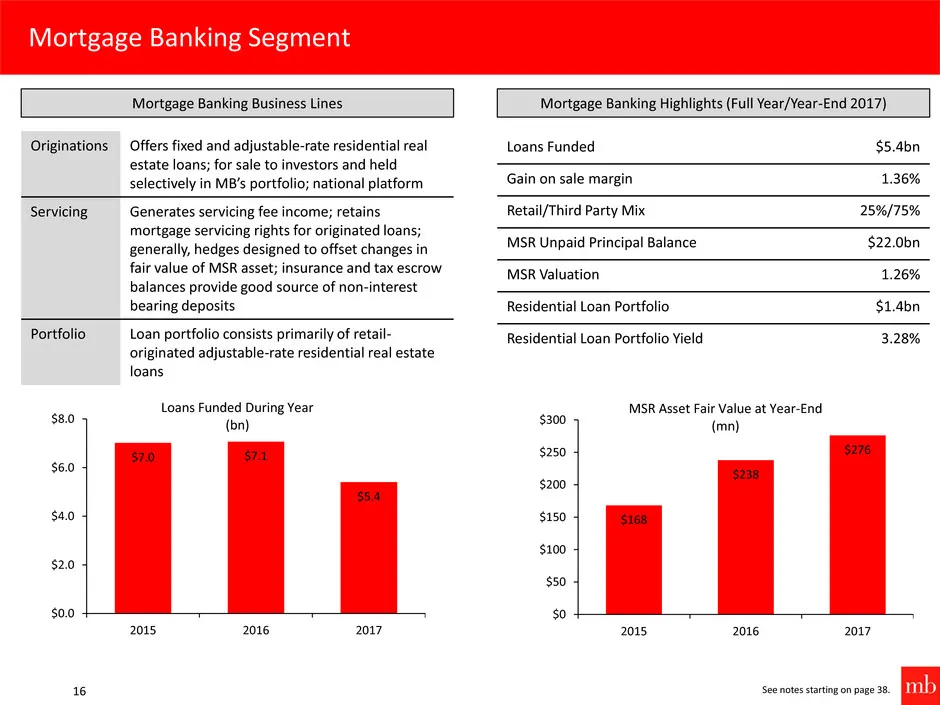
Mortgage Banking Segment 16 See notes starting on page 38. Loans Funded $5.4bn Gain on sale margin 1.36% Retail/Third Party Mix 25%/75% MSR Unpaid Principal Balance $22.0bn MSR Valuation 1.26% Residential Loan Portfolio $1.4bn Residential Loan Portfolio Yield 3.28% Mortgage Banking Highlights (Full

Slide 18: Company Strategic Priorities
17 Company Strategic Priorities
Slide 19: Company Strategic Priorities
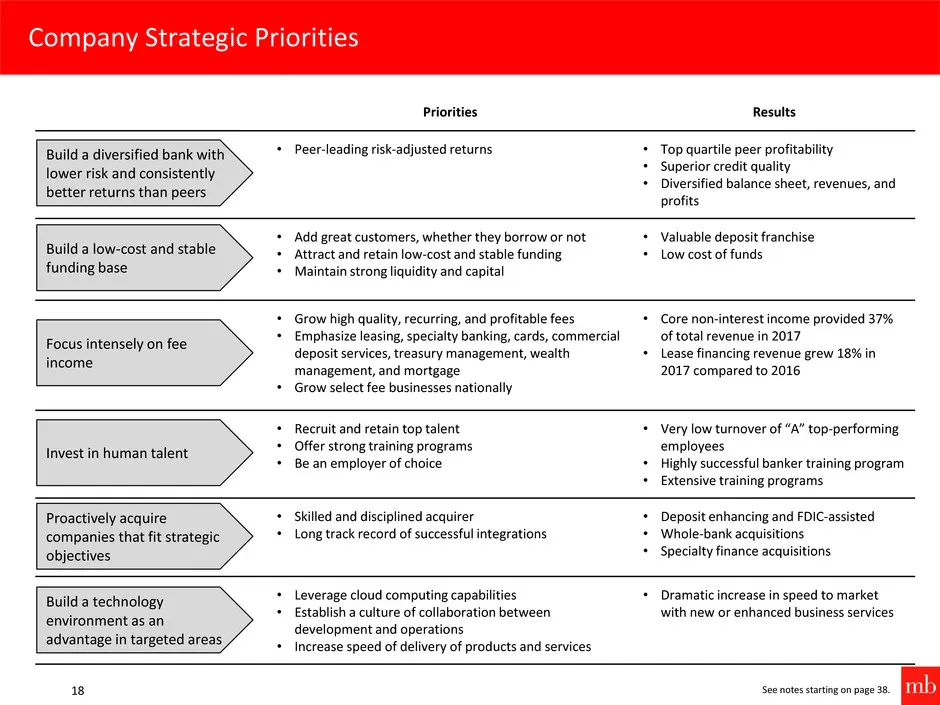
Company Strategic Priorities 18 See notes starting on page 38. Priorities Results • Peer-leading risk-adjusted returns • Top quartile peer profitability • Superior credit quality • Diversified balance sheet, revenues, and profits • Add great customers, whether they borrow or not • Attract and retain
Slide 20: Peer-Beating Operating Performance
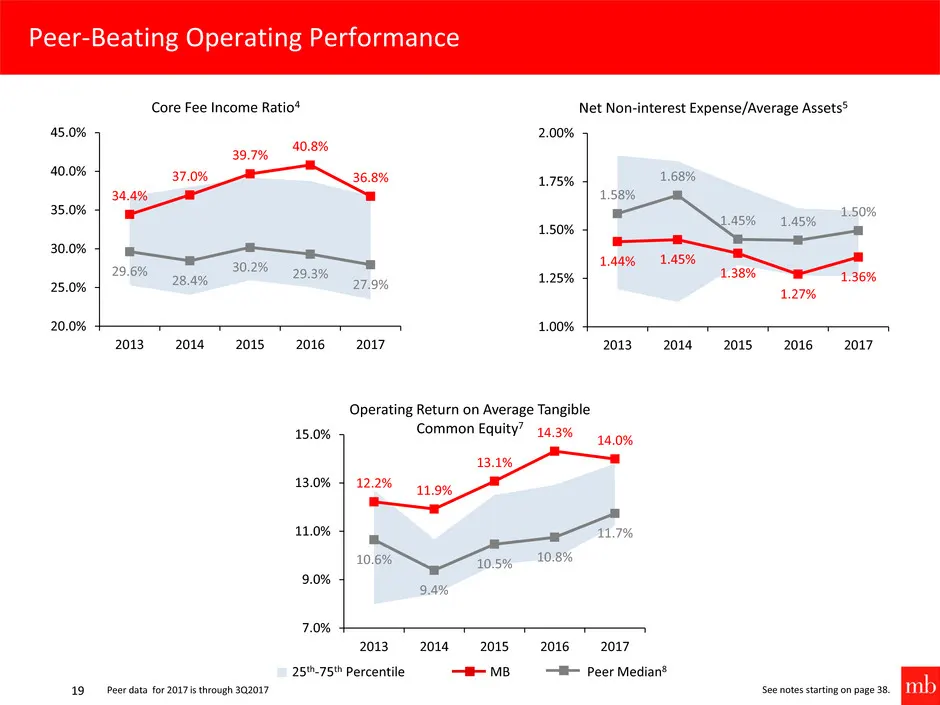
25th-75th Percentile MB Peer Median8 Peer-Beating Operating Performance 19 See notes starting on page 38. 34.4% 37.0% 39.7% 40.8% 36.8% 29.6% 28.4% 30.2% 29.3% 27.9% 20.0% 25.0% 30.0% 35.0% 40.0% 45.0% 2013 2014 2015 2016 2017 Core Fee Income Ratio4 12.2% 11.9% 13.1% 14.3% 14.0% 10.6% 9.4% 10.5% 10.
Slide 21: Strong Credit Performance
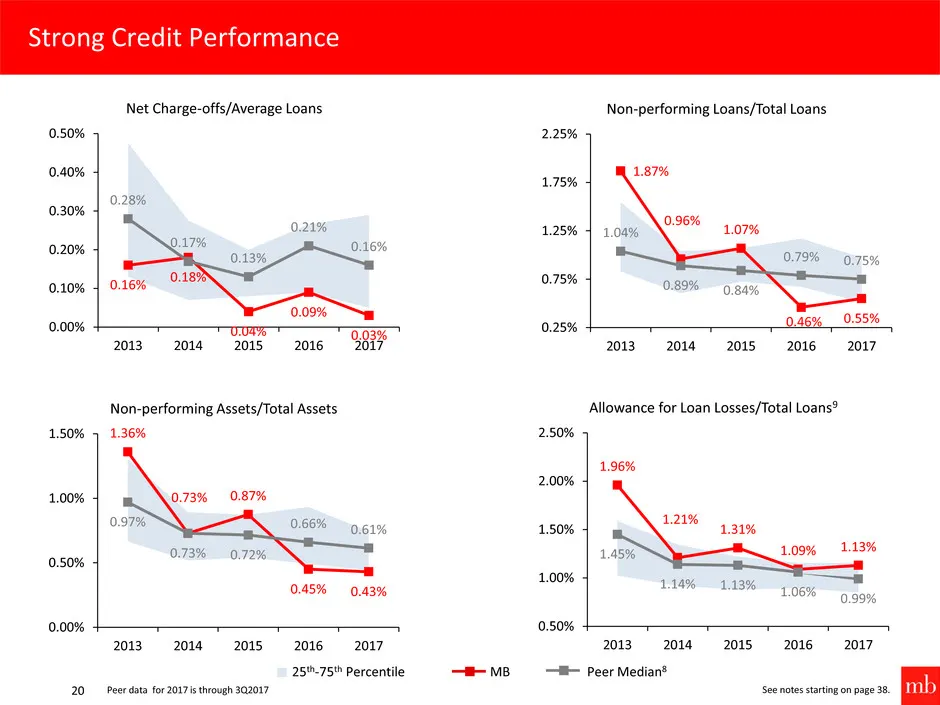
25th-75th Percentile MB Peer Median8 Strong Credit Performance 20 See notes starting on page 38. 1.36% 0.73% 0.87% 0.45% 0.43% 0.97% 0.73% 0.72% 0.66% 0.61% 0.00% 0.50% 1.00% 1.50% 2013 2014 2015 2016 2017 Non-performing Assets/Total Assets 1.87% 0.96% 1.07% 0.46% 0.55% 1.04% 0.89% 0.84% 0.79% 0.75%
Slide 22: Peer-Beating Net Interest Margin
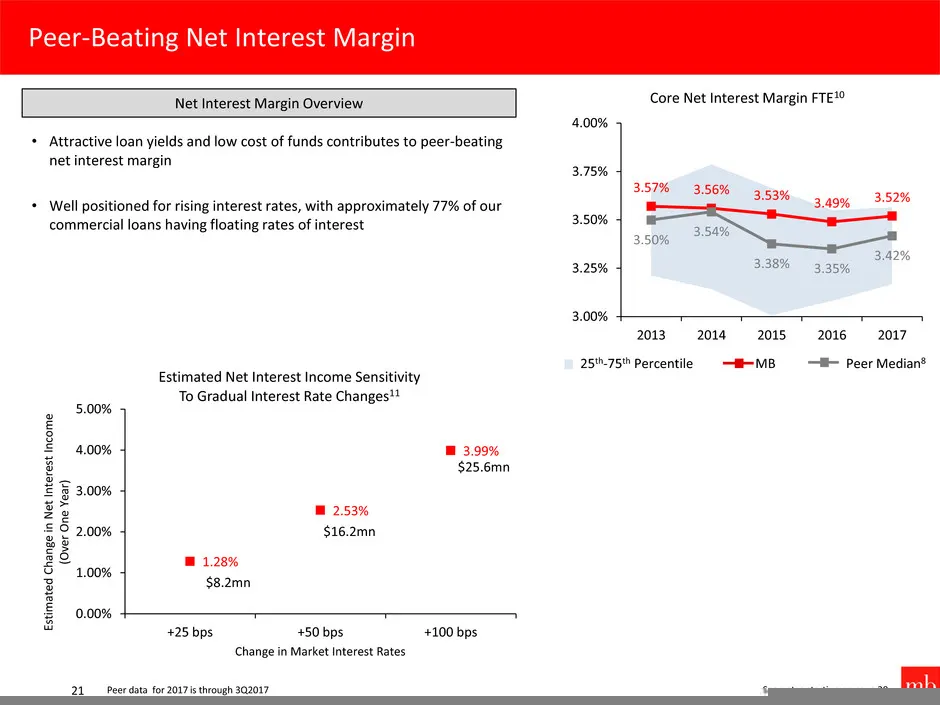
Peer-Beating Net Interest Margin 21 • Attractive loan yields and low cost of funds contributes to peer-beating net interest margin • Well positioned for rising interest rates, with approximately 77% of our commercial loans having floating rates of interest See notes starting on page 38. Net Interest
Slide 23: Diversified Loan Portfolio Across Many Segments
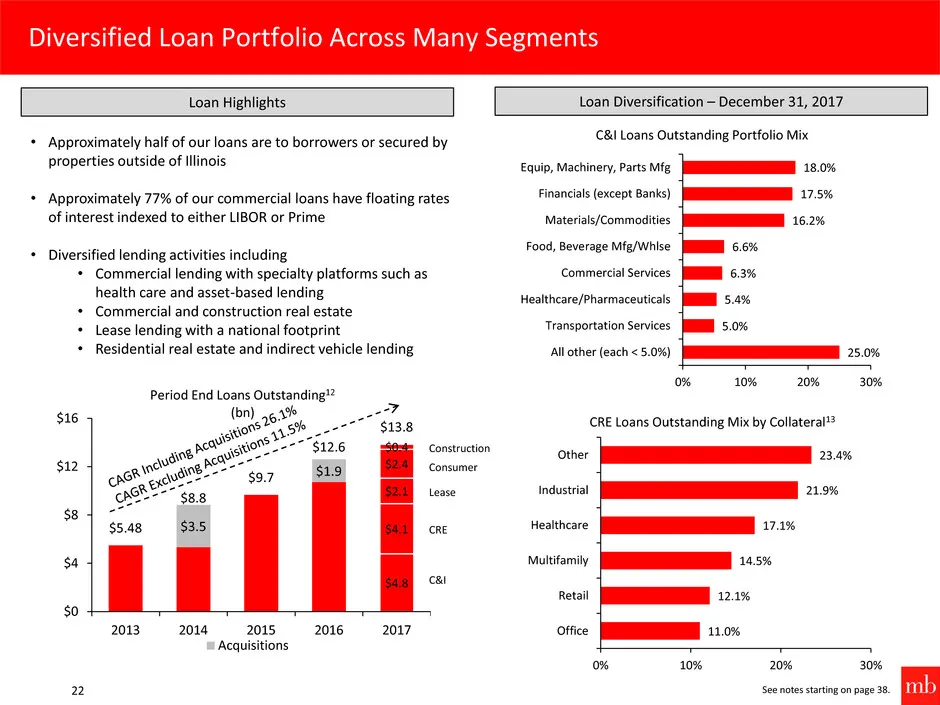
$3.5 $1.9 $4.8 $4.1 $2.1 $2.4 $0.4 $5.48 $8.8 $9.7 $12.6 $13.8 $0 $4 $8 $12 $16 2013 2014 2015 2016 2017 Period End Loans Outstanding12 (bn) Acquisitions Diversified Loan Portfolio Across Many Segments 22 See notes starting on page 38. Loan Highlights Loan Diversification – December 31, 2017 • Appro
Slide 24: Peer-leading Investment Securities Portfolio Returns
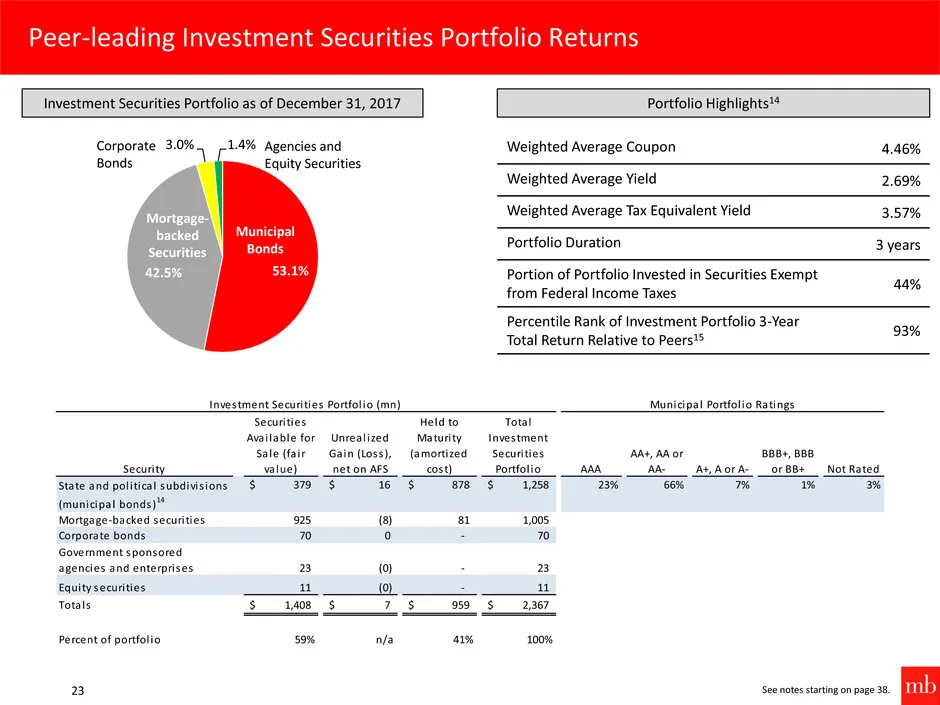
Peer-leading Investment Securities Portfolio Returns 23 See notes starting on page 38. Investment Securities Portfolio as of December 31, 2017 53.1% 42.5% 3.0% 1.4% Mortgage- backed Securities Municipal Bonds Corporate Bonds Agencies and Equity Securities Weighted Average Coupon 4.46% Weighted Avera
Slide 25: Valuable Low Cost Deposit Franchise
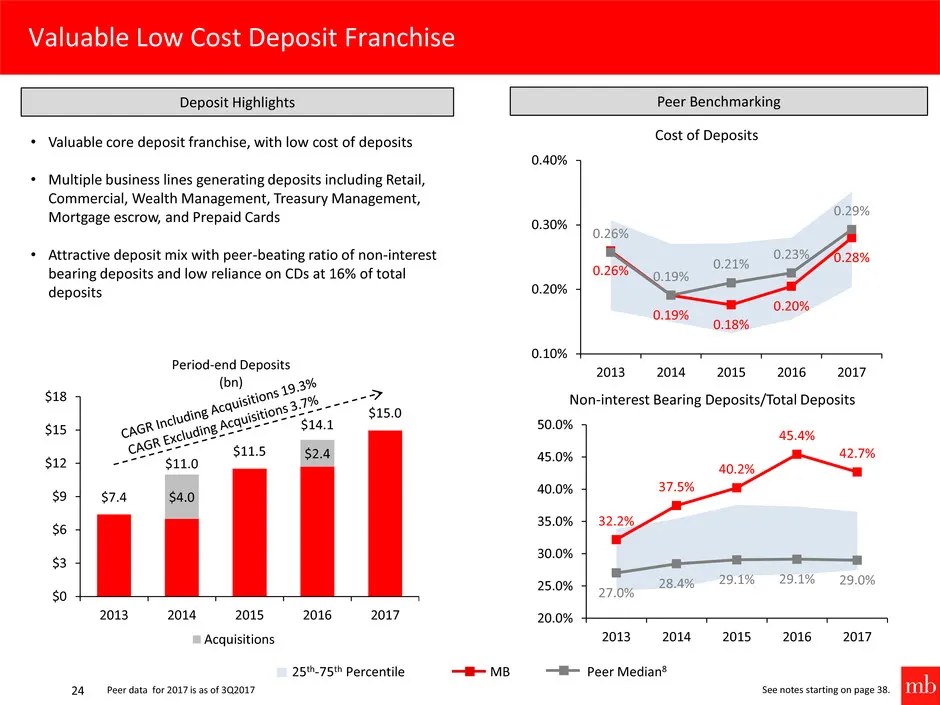
Valuable Low Cost Deposit Franchise 24 See notes starting on page 38. $4.0 $2.4 $7.4 $11.0 $11.5 $14.1 $15.0 $0 $3 $6 $9 $12 $15 $18 2013 2014 2015 2016 2017 Period-end Deposits (bn) Acquisitions Deposit Highlights Peer Benchmarking • Valuable core deposit franchise, with low cost of deposits • Mult
Slide 26: Focus on Fee Income
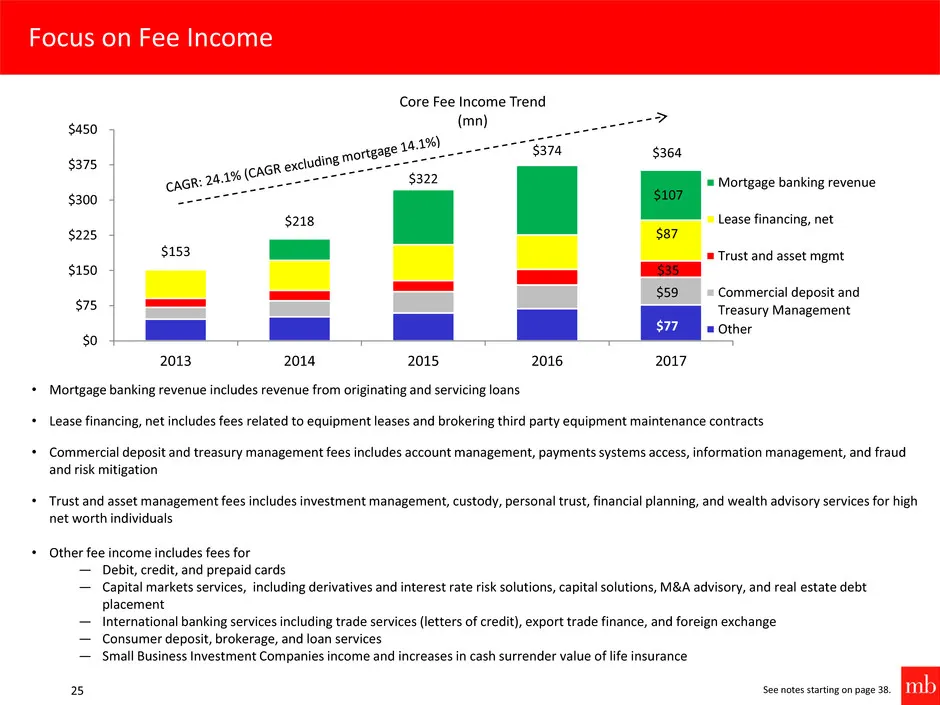
Focus on Fee Income 25 • Mortgage banking revenue includes revenue from originating and servicing loans • Lease financing, net includes fees related to equipment leases and brokering third party equipment maintenance contracts • Commercial deposit and treasury management fees includes account manage
Slide 27: Controlling Non-interest Expenses
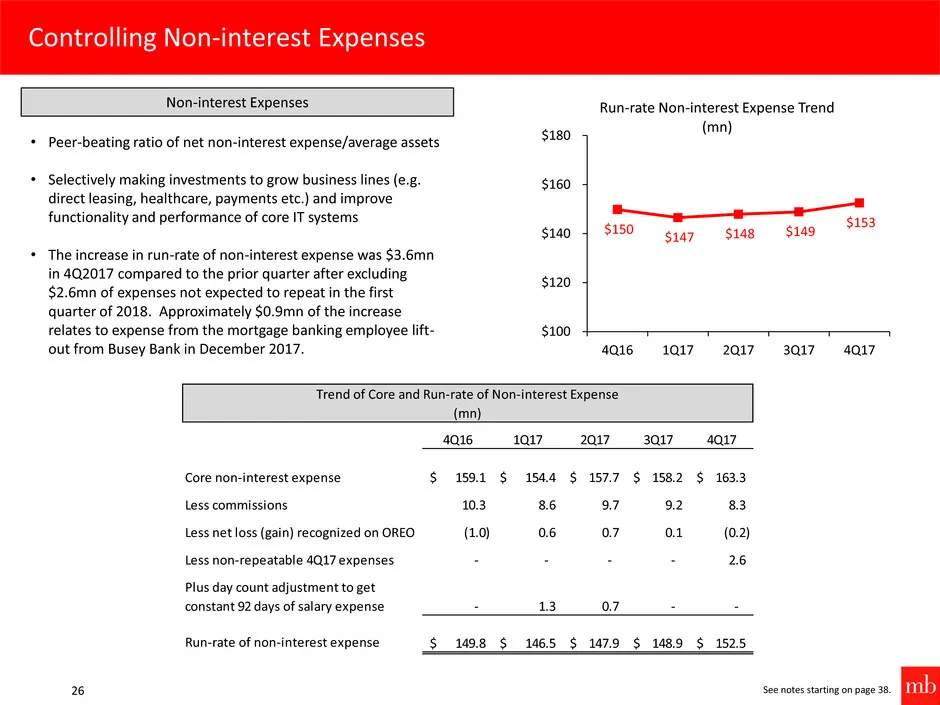
Controlling Non-interest Expenses 26 See notes starting on page 38. 4Q16 1Q17 2Q17 3Q17 4Q17 Core non-interest expense 159.1$ 154.4$ 157.7$ 158.2$ 163.3$ Less commissions 10.3 8.6 9.7 9.2 8.3 Less net loss (gain) recognized on OREO (1.0) 0.6 0.7 0.1 (0.2) Less non-repeatable 4Q17 expenses - - - - 2.
Slide 28: Capital Planning
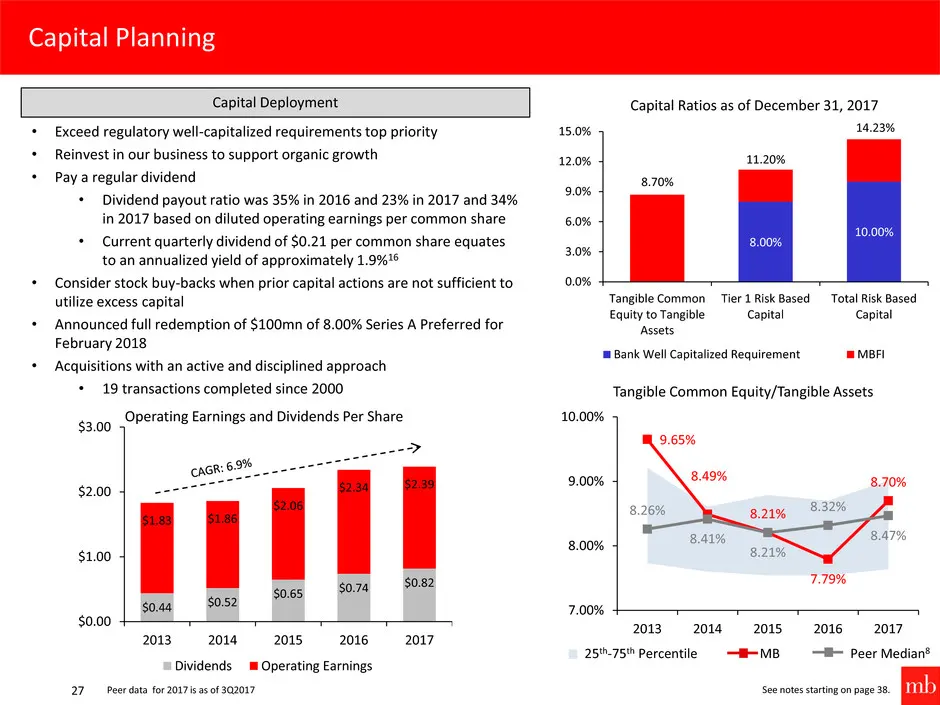
Capital Planning 27 8.00% 10.00% 8.70% 11.20% 14.23% 0.0% 3.0% 6.0% 9.0% 12.0% 15.0% Tangible Common Equity to Tangible Assets Tier 1 Risk Based Capital Total Risk Based Capital Capital Ratios as of December 31, 2017 Bank Well Capitalized Requirement MBFI • Exceed regulatory well-capitalized require
Slide 29: Investing in Human Talent
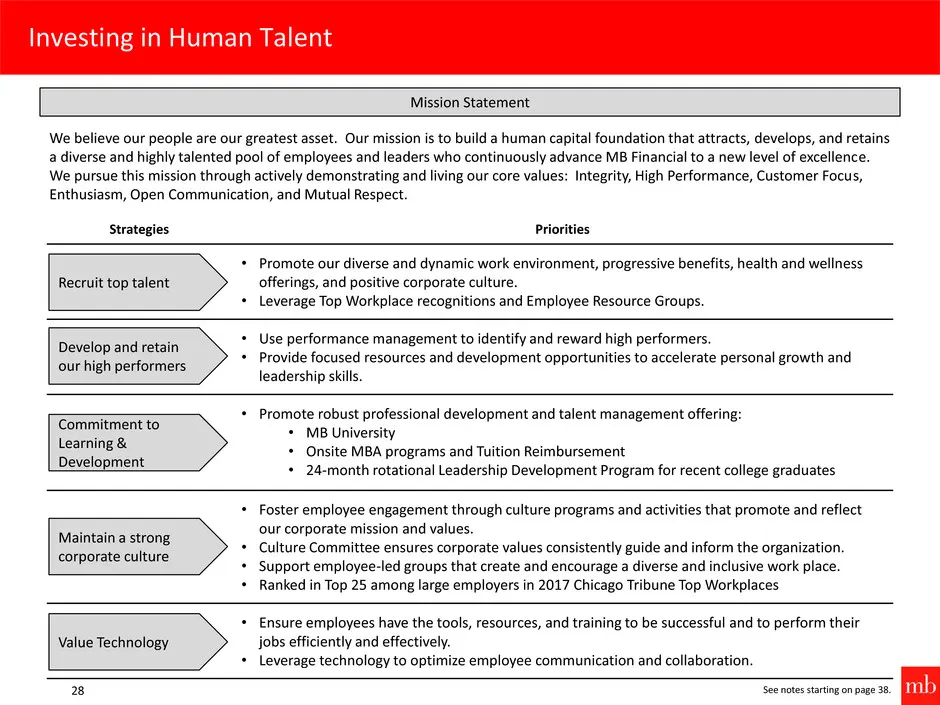
Investing in Human Talent 28 See notes starting on page 38. Strategies Priorities • Promote our diverse and dynamic work environment, progressive benefits, health and wellness offerings, and positive corporate culture. • Leverage Top Workplace recognitions and Employee Resource Groups. • Use perform
Slide 30: Low Risk, Strategically Aligned Acquisition Strategy
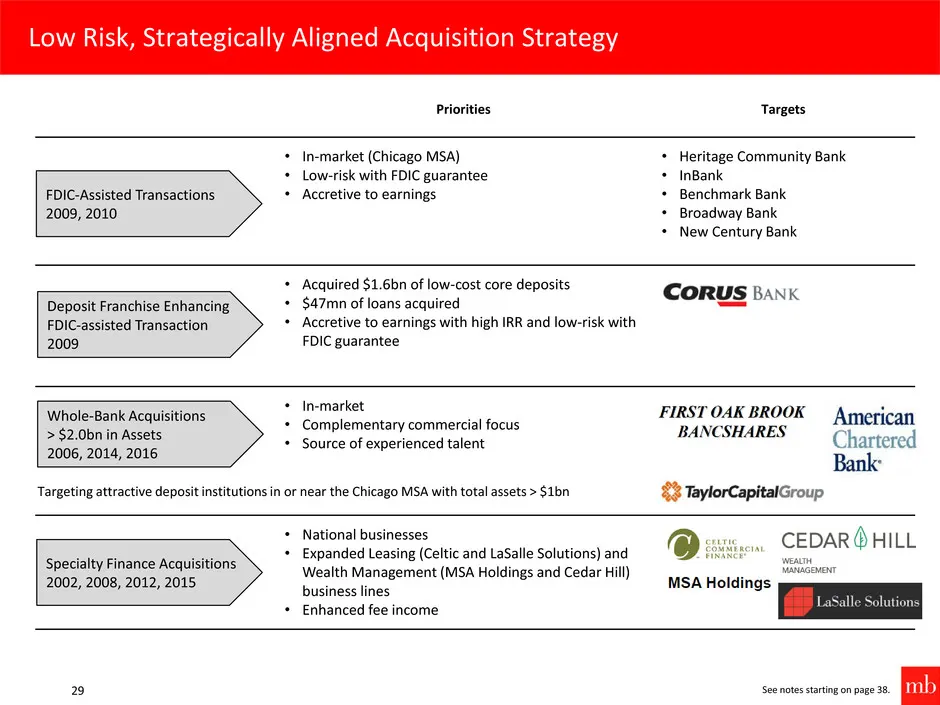
Low Risk, Strategically Aligned Acquisition Strategy 29 See notes starting on page 38. Priorities Targets • In-market (Chicago MSA) • Low-risk with FDIC guarantee • Accretive to earnings • Heritage Community Bank • InBank • Benchmark Bank • Broadway Bank • New Century Bank • Acquired $1.6bn of low-c

Slide 31: Non-GAAP Disclosure Reconciliations and Footnotes
30 Non-GAAP Disclosure Reconciliations and Footnotes
Slide 32: Non-GAAP Disclosure Reconciliations
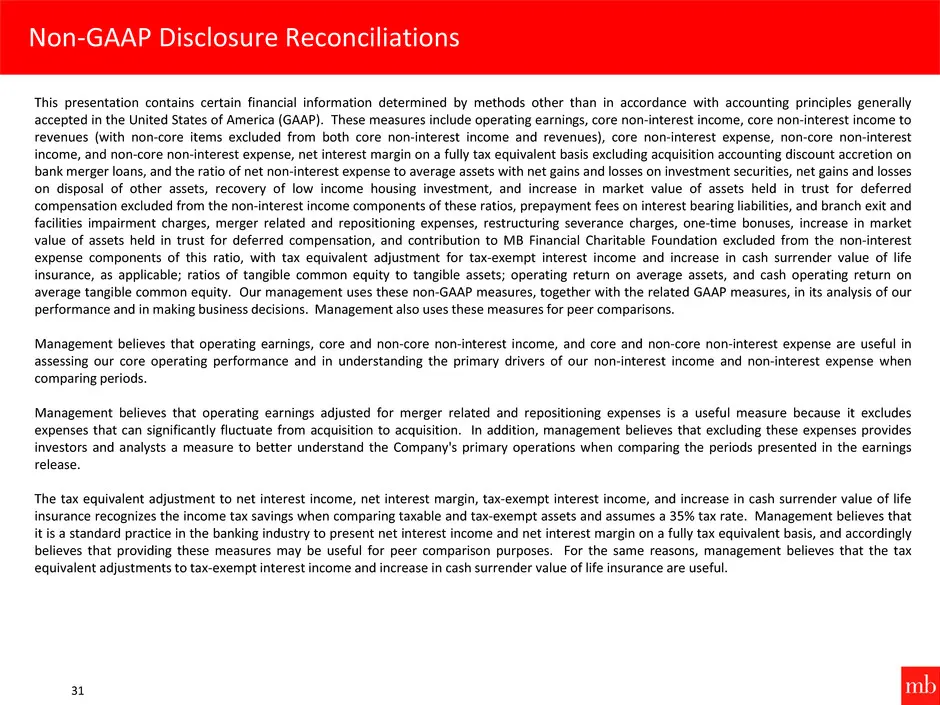
Non-GAAP Disclosure Reconciliations 31 This presentation contains certain financial information determined by methods other than in accordance with accounting principles generally accepted in the United States of America (GAAP). These measures include operating earnings, core non-interest income, co
Slide 33: Non-GAAP Disclosure Reconciliations – continued
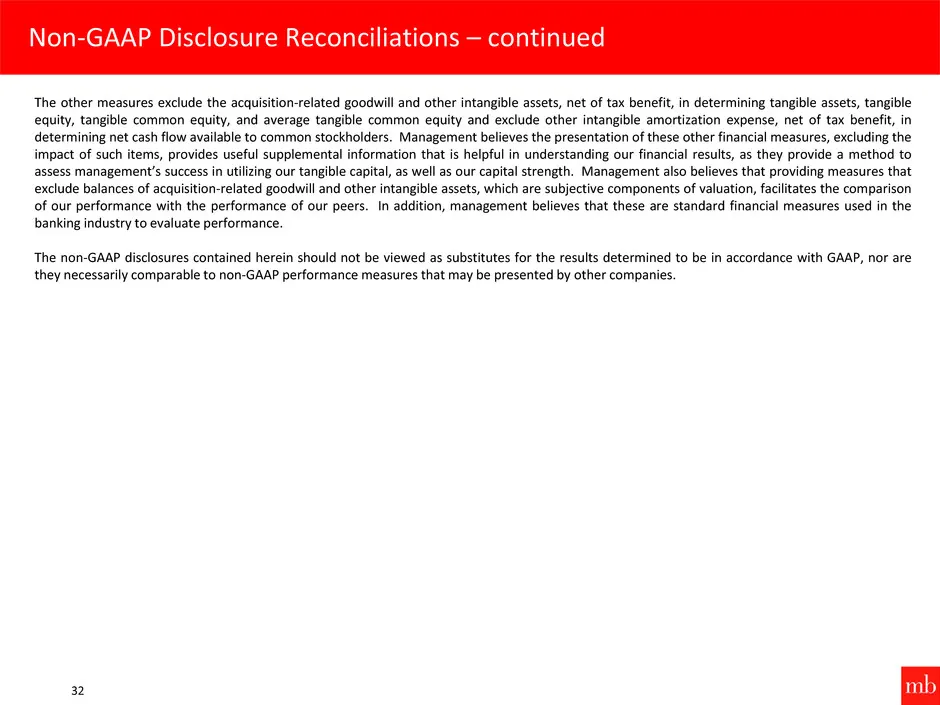
Non-GAAP Disclosure Reconciliations – continued 32 The other measures exclude the acquisition-related goodwill and other intangible assets, net of tax benefit, in determining tangible assets, tangible equity, tangible common equity, and average tangible common equity and exclude other intangible amo
Slide 34: Non-GAAP Disclosure Reconciliations
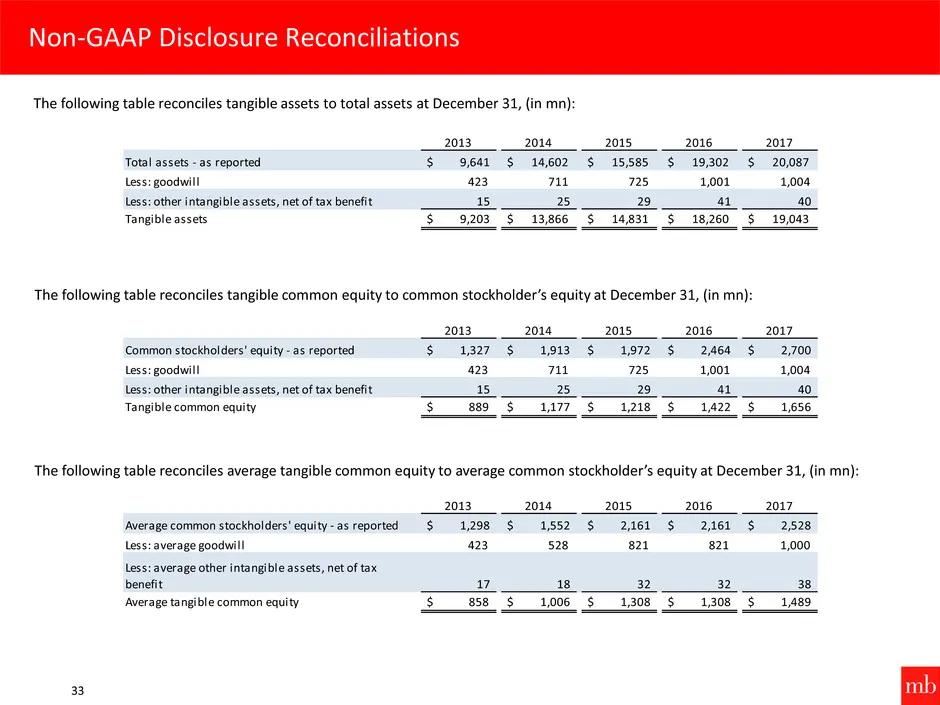
Non-GAAP Disclosure Reconciliations 33 2013 2014 2015 2016 2017 Total assets - as reported $ 9,641 $ 14,602 $ 15,585 $ 19,302 $ 20,087 Less: goodwill 423 711 725 1,001 1,004 Less: other intangible assets, net of tax benefit 15 25 29 41 40 Tangible assets $ 9,203 $ 13,866 $ 14,831 $ 18,260 $ 19,043 T
Slide 35: Non-GAAP Disclosure Reconciliations
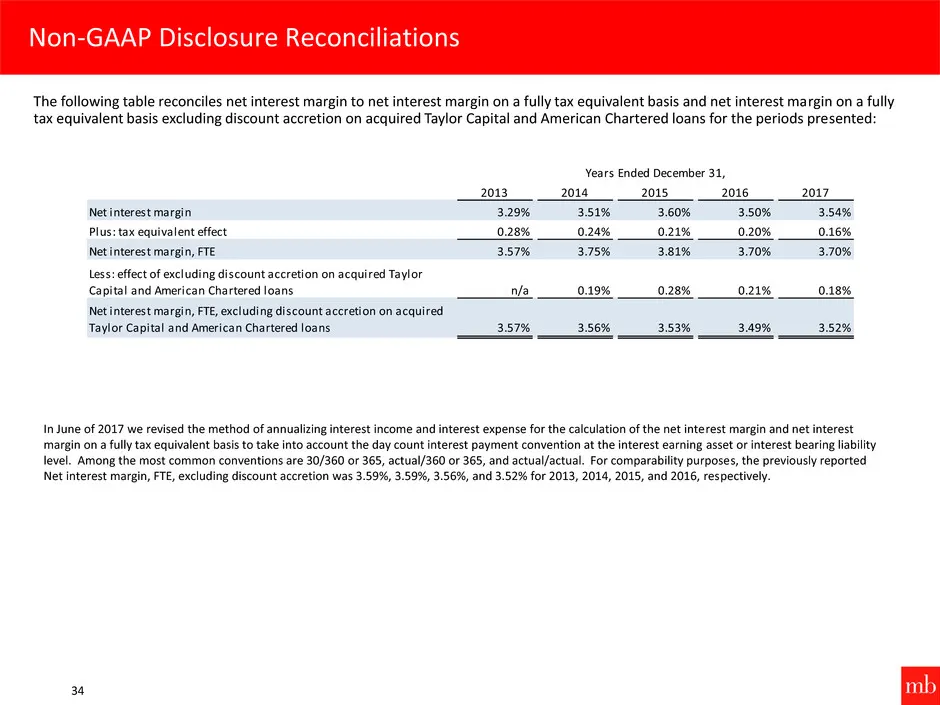
Non-GAAP Disclosure Reconciliations 34 2013 2014 2015 2016 2017 Net interest margin 3.29% 3.51% 3.60% 3.50% 3.54% Plus: tax equivalent effect 0.28% 0.24% 0.21% 0.20% 0.16% Net interest margin, FTE 3.57% 3.75% 3.81% 3.70% 3.70% Less: effect of excluding discount accretion on acquired Taylor Capital a
Slide 36: Non-GAAP Disclosure Reconciliations
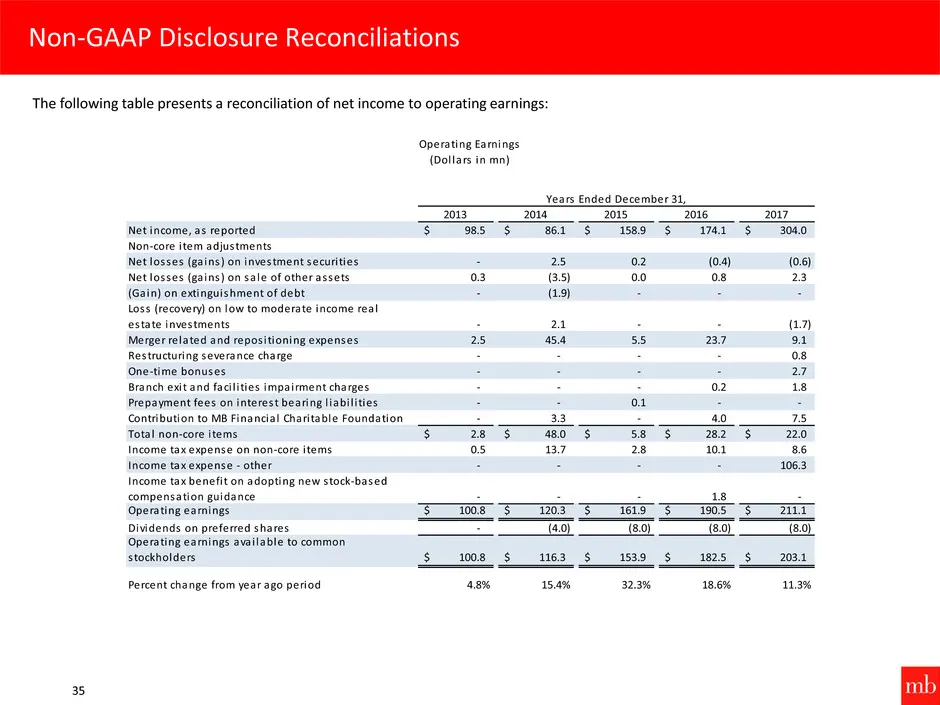
Non-GAAP Disclosure Reconciliations 35 2013 2014 2015 2016 2017 Net income, as reported $ 98.5 $ 86.1 $ 158.9 $ 174.1 $ 304.0 Non-core i tem adjustments Net losses (ga ins ) on investment securi ties - 2.5 0.2 (0.4) (0.6) Net losses (ga ins ) on sa le of other assets 0.3 (3.5) 0.0 0.8 2.3 (Gain) on
Slide 37: Non-GAAP Disclosure Reconciliations
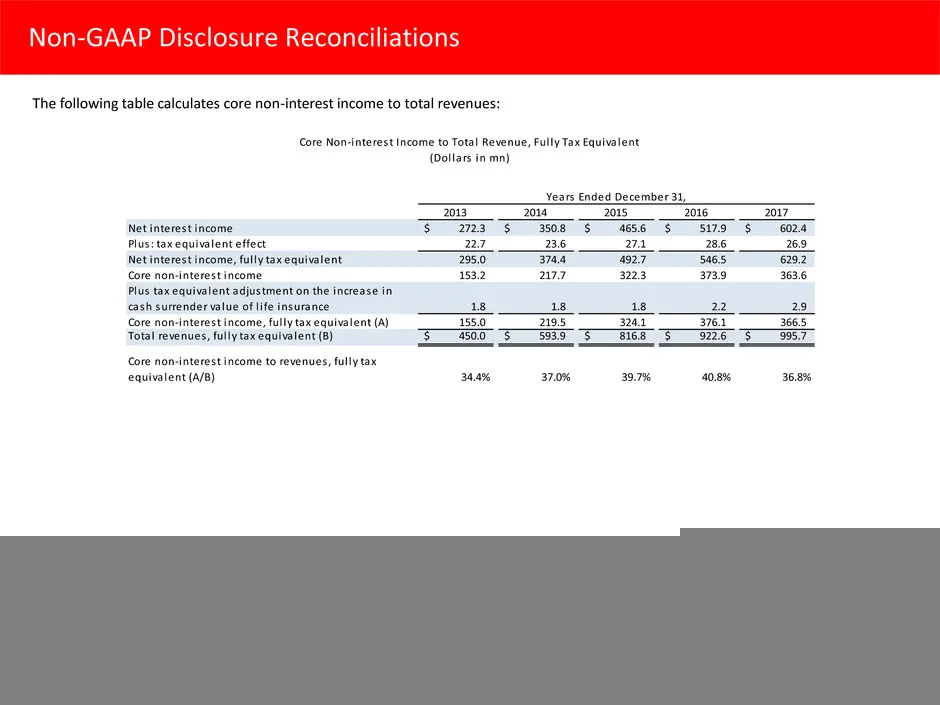
Non-GAAP Disclosure Reconciliations 36 2013 2014 2015 2016 2017 Net interest income $ 272.3 $ 350.8 $ 465.6 $ 517.9 $ 602.4 Plus : tax equiva lent effect 22.7 23.6 27.1 28.6 26.9 Net interest income, ful ly tax equiva lent 295.0 374.4 492.7 546.5 629.2 Core non-interest income 153.2 217.7 322.3 373.
Slide 38: Non-GAAP Disclosure Reconciliations
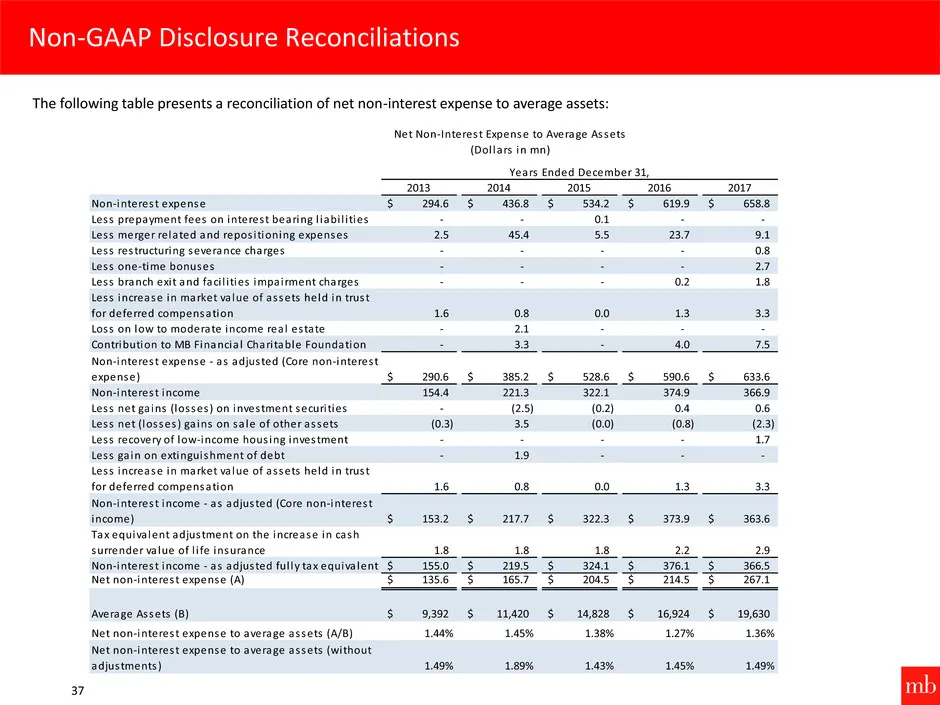
Non-GAAP Disclosure Reconciliations 37 2013 2014 2015 2016 2017 Non-interest expense $ 294.6 $ 436.8 $ 534.2 $ 619.9 $ 658.8 Less prepayment fees on interest bearing l iabi l i ties - - 0.1 - - Less merger related and repos i tioning expenses 2.5 45.4 5.5 23.7 9.1 Less restructuring severance charge
Slide 39: Footnotes
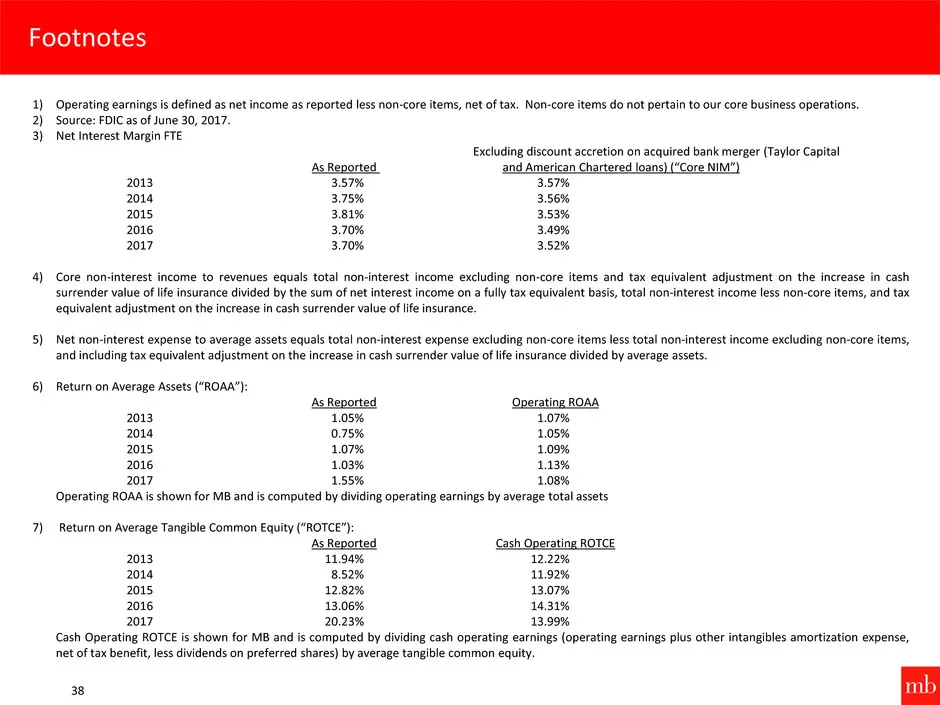
Footnotes 38 1) Operating earnings is defined as net income as reported less non-core items, net of tax. Non-core items do not pertain to our core business operations. 2) Source: FDIC as of June 30, 2017. 3) Net Interest Margin FTE Excluding discount accretion on acquired bank merger (Taylor Capital
Slide 40: Footnotes – continued
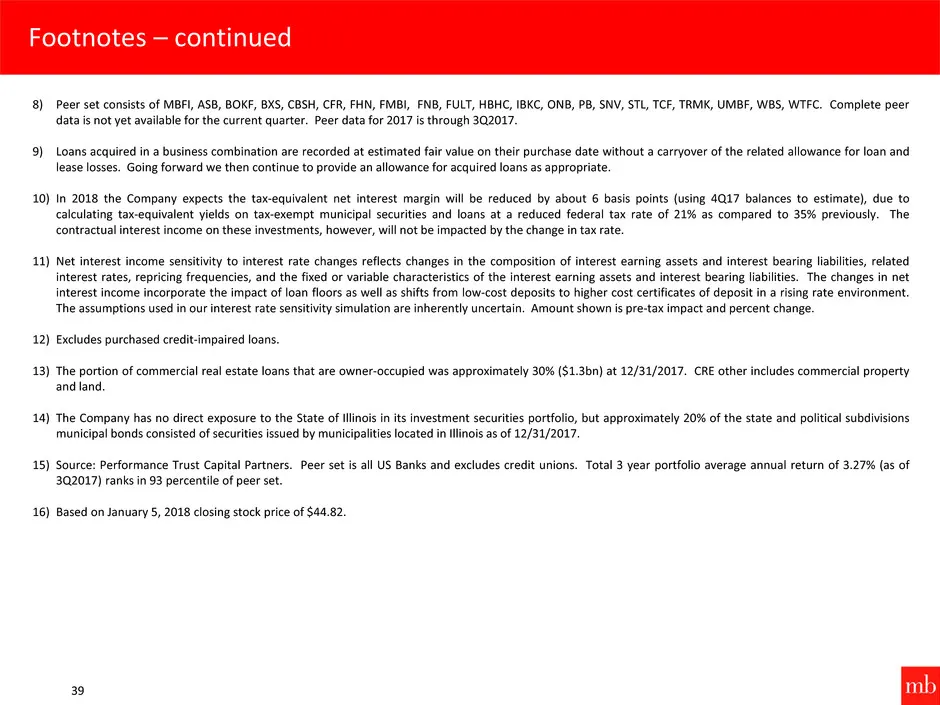
Footnotes – continued 39 8) Peer set consists of MBFI, ASB, BOKF, BXS, CBSH, CFR, FHN, FMBI, FNB, FULT, HBHC, IBKC, ONB, PB, SNV, STL, TCF, TRMK, UMBF, WBS, WTFC. Complete peer data is not yet available for the current quarter. Peer data for 2017 is through 3Q2017. 9) Loans acquired in a business co
Source: SEC EDGAR · 8-K filed Jan 25, 2018
More decks from MB Financial Inc
 RBC Capital Markets Financial Institutions Conference 201914 slides · Mar 12, 2019
 Q4 2018 Earnings Presentation23 slides · Jan 22, 2019
 Goldman Sachs U.S. Financial Services Conference 201815 slides · Dec 4, 2018
 BancAnalysts Association of Boston Conference 201817 slides · Nov 8, 2018
 Q3 2018 Earnings Presentation24 slides · Oct 23, 2018
 Barclays Global Financial Services Conference 201816 slides · Sep 12, 2018