PT Bank Negara Indonesia (Persero) Tbk Class B · IDX:BBNI
PT Bank Negara Indonesia (Persero) Tbk Class B — Q3 2022 Earnings Presentation
70 slides from PT Bank Negara Indonesia (Persero) Tbk Class B's earnings presentation, Oct 24, 2022
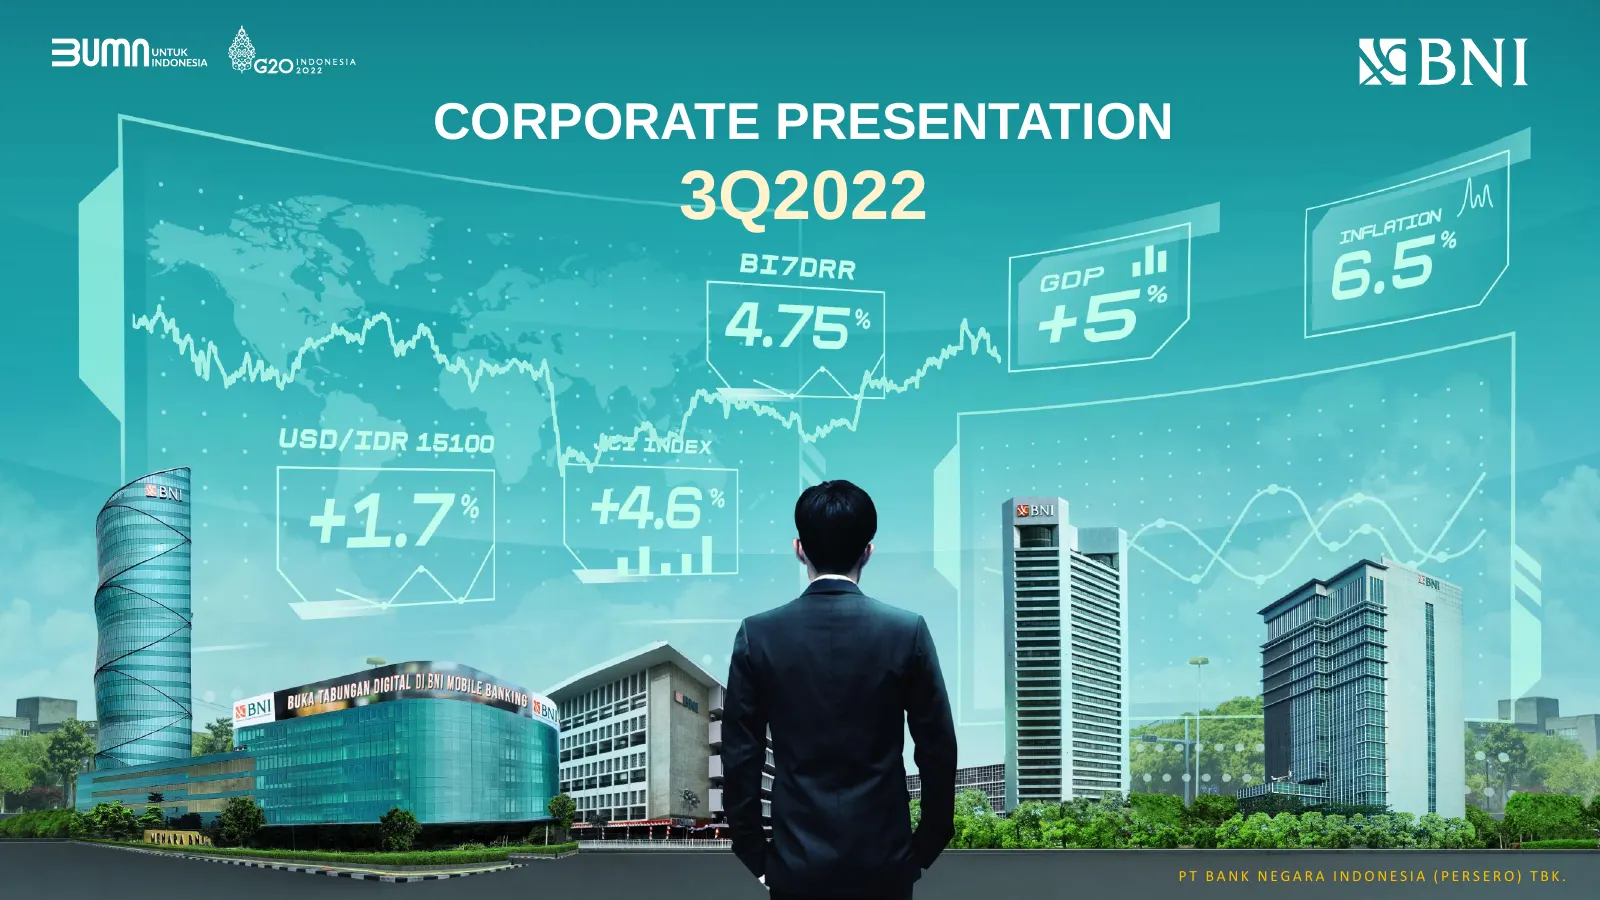
Slide 1: Corporate Presentation 3Q2022
CORPORATE PRESENTATION 3Q2022 PT BANK NEGARA INDONESIA (PERSERO) TBK.
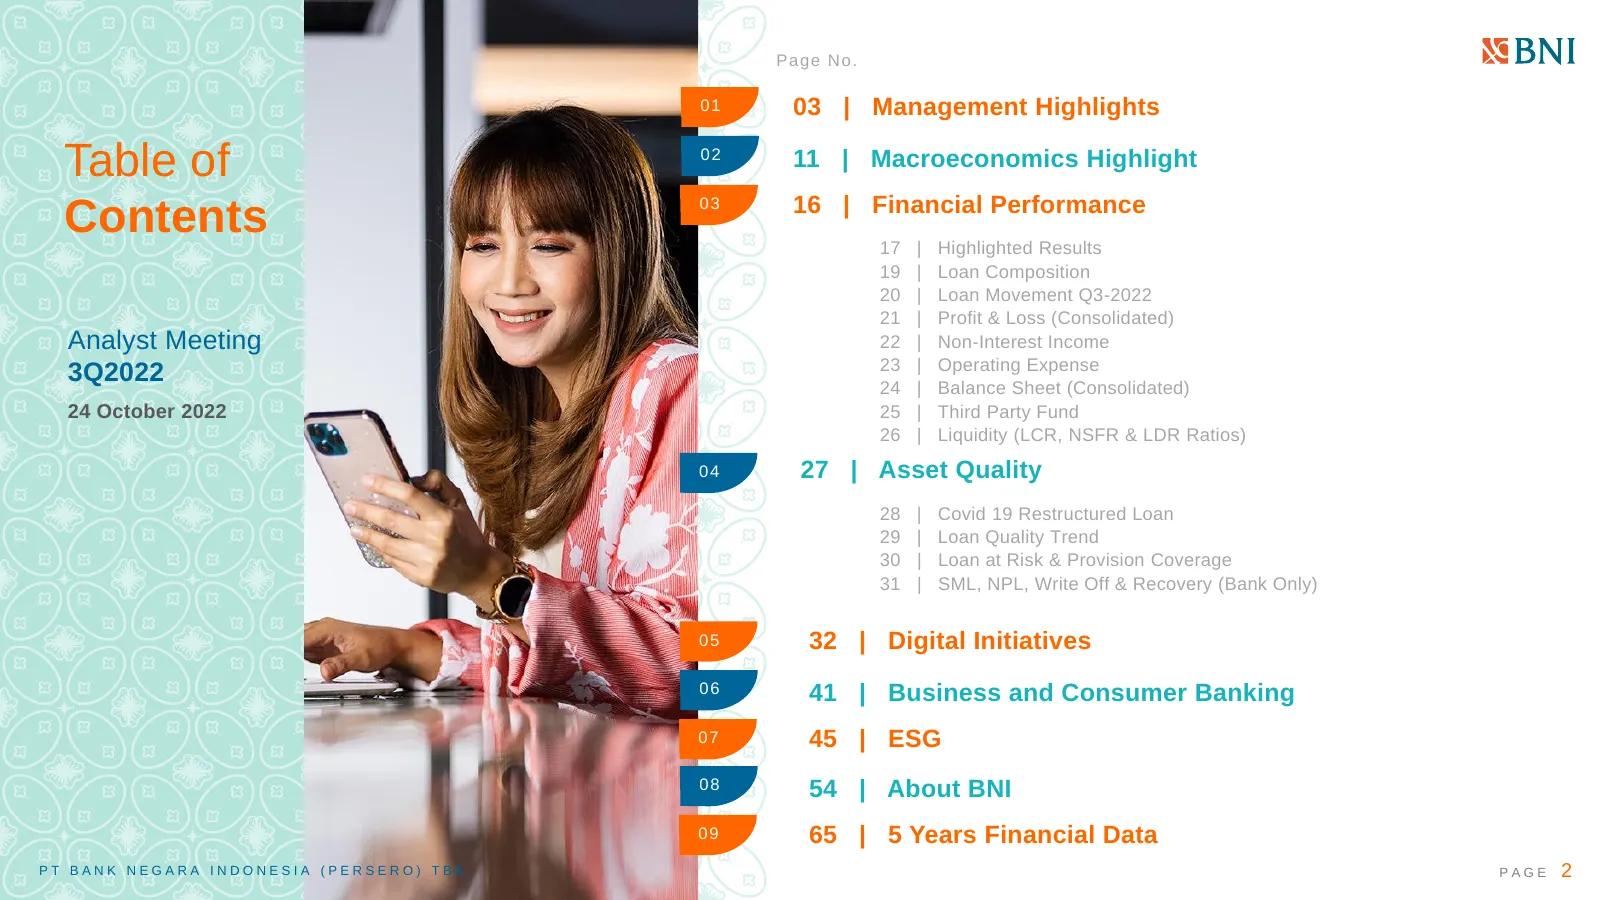
Slide 2: Table of Contents
Q12022 Pa ge N o . 01 03 | Management Highlights Table of 02 11 | Macroeconomics Highlight 03 16 | Financial Performance Contents 17 | Highlighted Results 19 | Loan Composition 20 | Loan Movement Q3-2022 21 | Profit & Loss (Consolidated) Analyst Meeting 22 | Non-Interest Income 23 | Operating Expens
Slide 3: Management Highlight
3Q2022 Management Highlight PT BANK NEGARA INDONESIA (PERSERO) TBK. PAGE 3
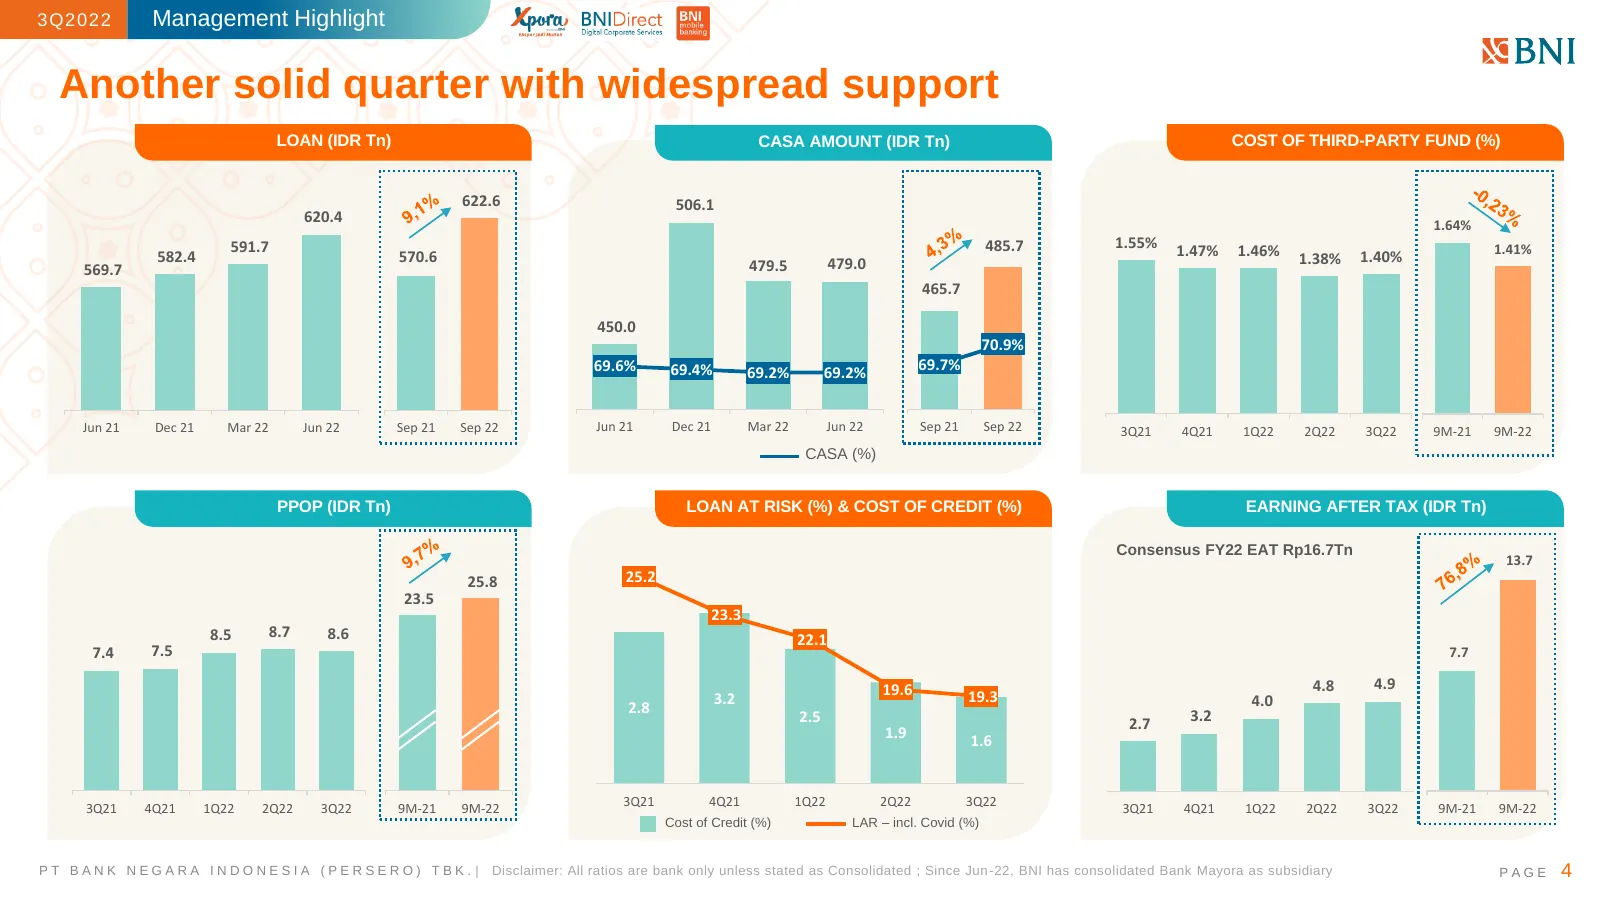
Slide 4: Another solid quarter with widespread support
3Q2022 Management Highlight Another solid quarter with widespread support LOAN (IDR Tn) CASA AMOUNT (IDR Tn) COST OF THIRD-PARTY FUND (%) 622.6 506.1 620.4 1.64% 591.7 485.7 1.55% 1.47% 1.41% 582.4 570.6 1.46% 1.38% 1.40% 569.7 479.5 479.0 465.7 450.0 70.9% 69.6% 69.4% 69.2% 69.2% 69.7% Jun 21 Dec 2
Slide 5: Well prepared for global economic turbulence
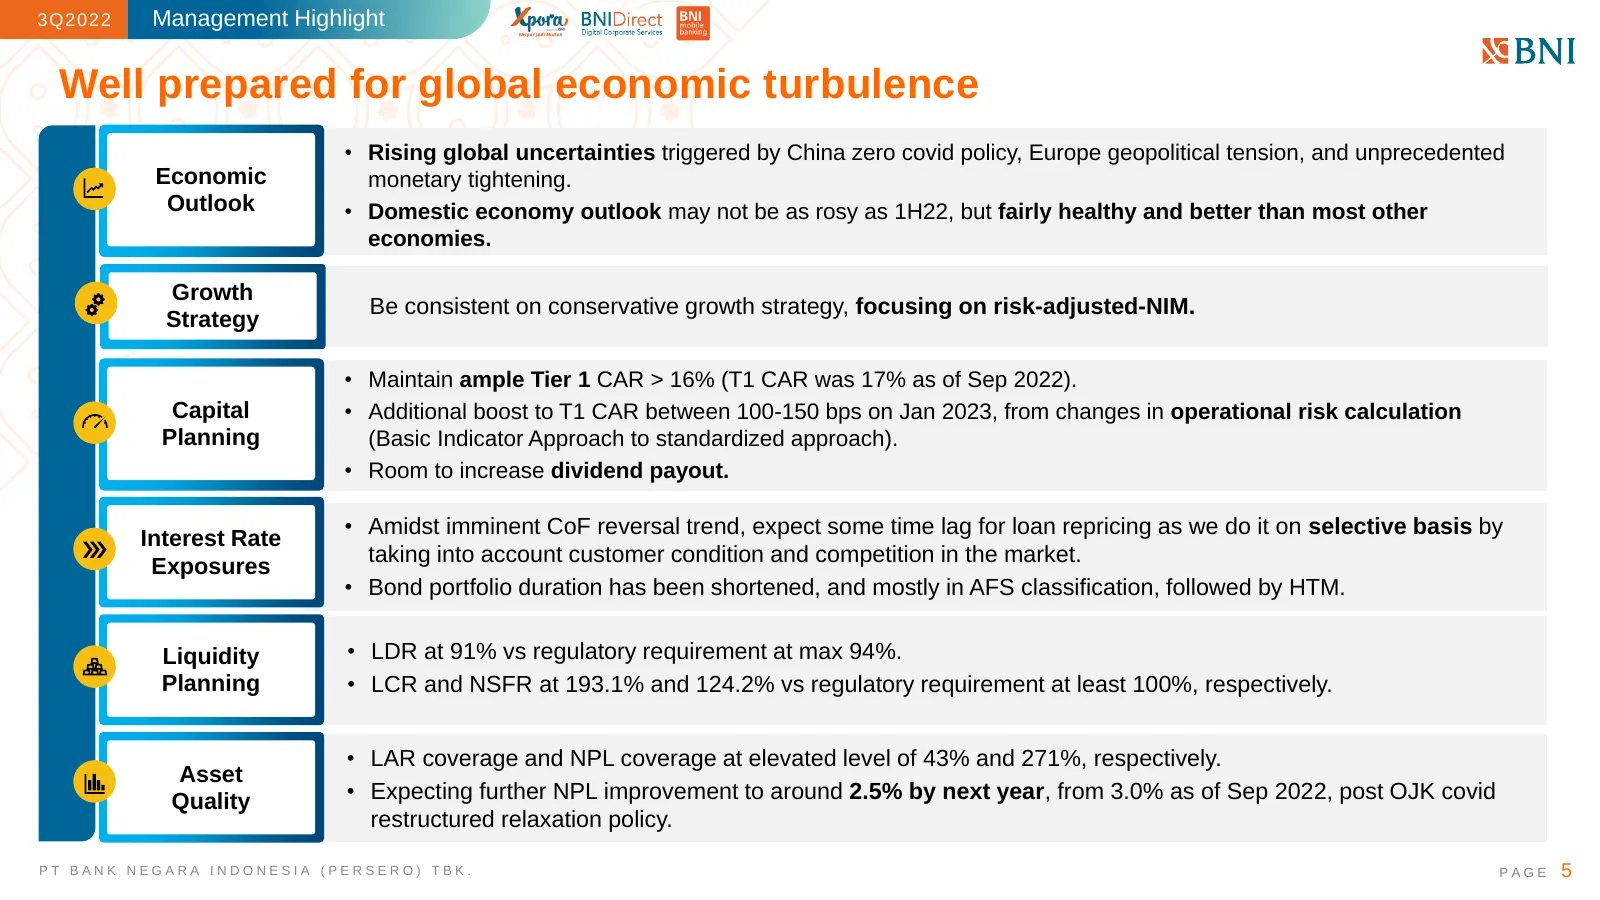
3Q2022 Management Highlight Well prepared for global economic turbulence • Rising global uncertainties triggered by China zero covid policy, Europe geopolitical tension, and unprecedented Economic monetary tightening. Outlook • Domestic economy outlook may not be as rosy as 1H22, but fairly healthy
Slide 6: Indonesia economy is still resilient
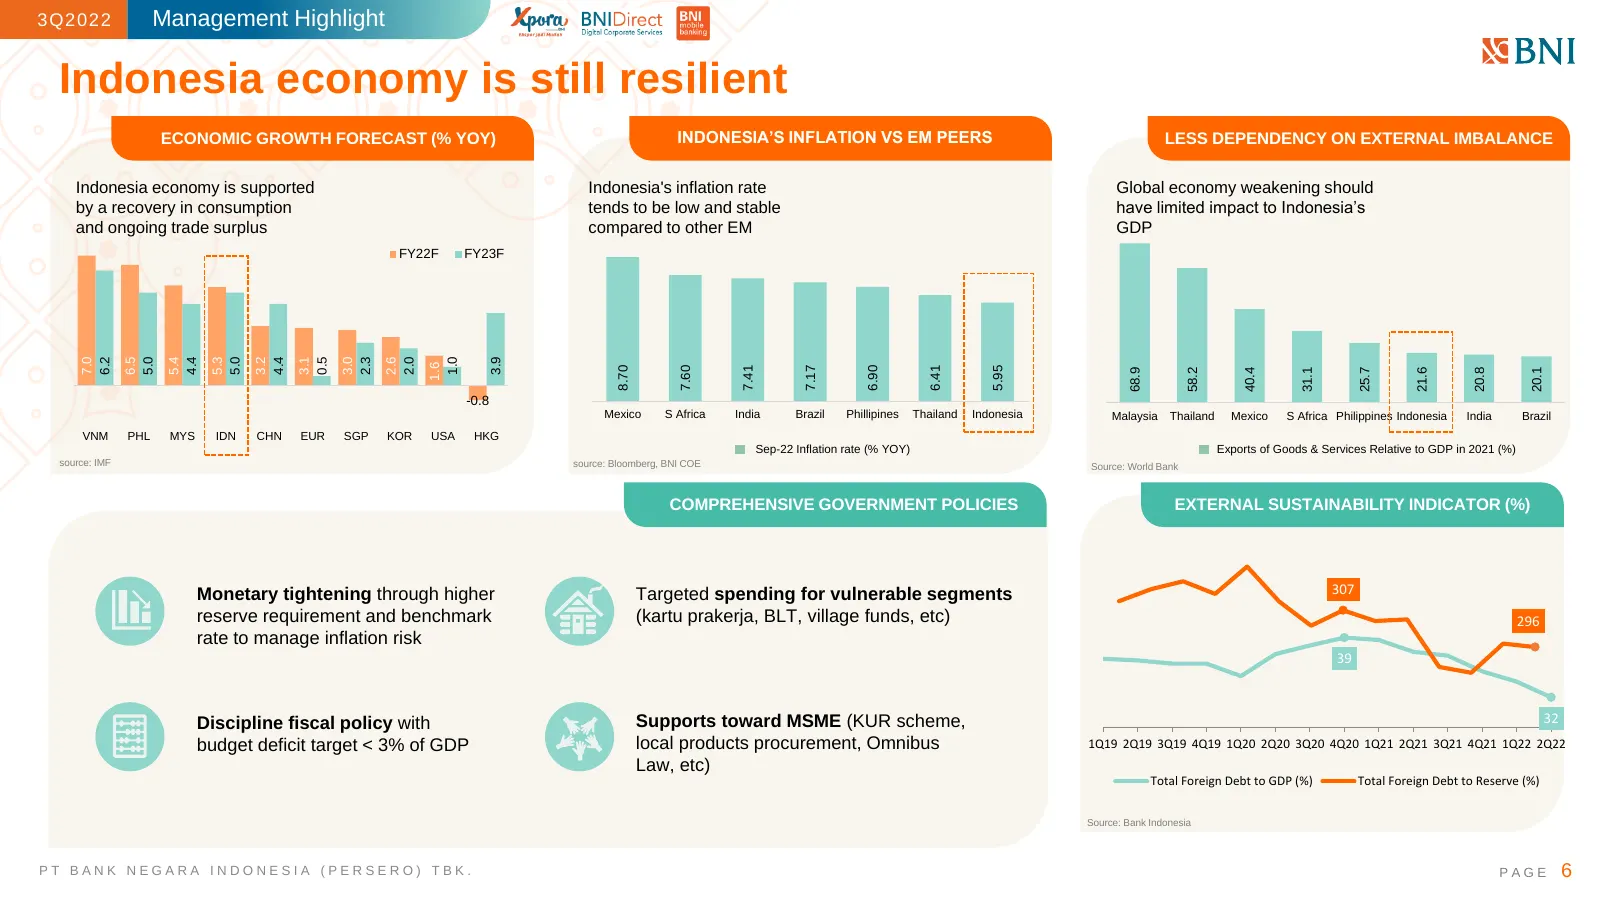
3Q2022 Management Highlight Indonesia economy is still resilient ECONOMIC GROWTH FORECAST (% YOY) INDONESIA’S INFLATION VS EM PEERS LESS DEPENDENCY ON EXTERNAL IMBALANCE Indonesia economy is supported Indonesia's inflation rate Global economy weakening should by a recovery in consumption tends to be
Slide 7: Growth strategy focusing on Risk-Adjusted-NIM
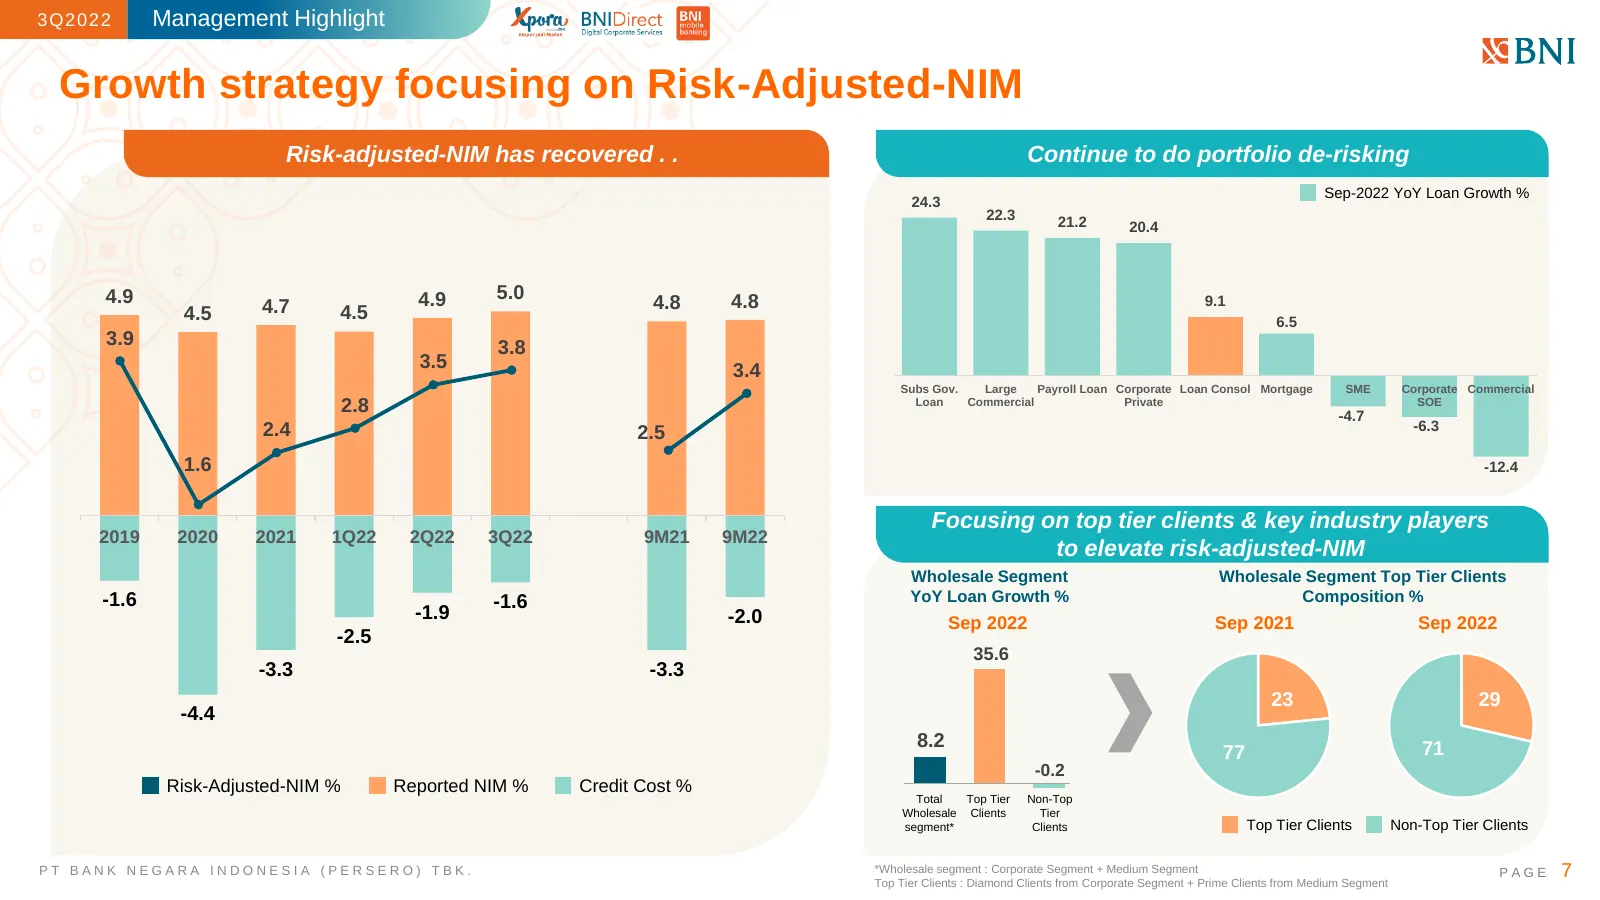
3Q2022 Management Highlight Growth strategy focusing on Risk-Adjusted-NIM Risk-adjusted-NIM has recovered . . Continue to do portfolio de-risking Sep-2022 YoY Loan Growth % 24.3 22.3 21.2 20.4 4.9 4.9 5.0 4.8 9.1 4.7 4.8 4.5 4.5 6.5 3.9 3.8 3.5 3.4 Subs Gov. Large Payroll Loan Corporate Loan Consol
Slide 8: LAR improvement; not only in size, but also in asset yield
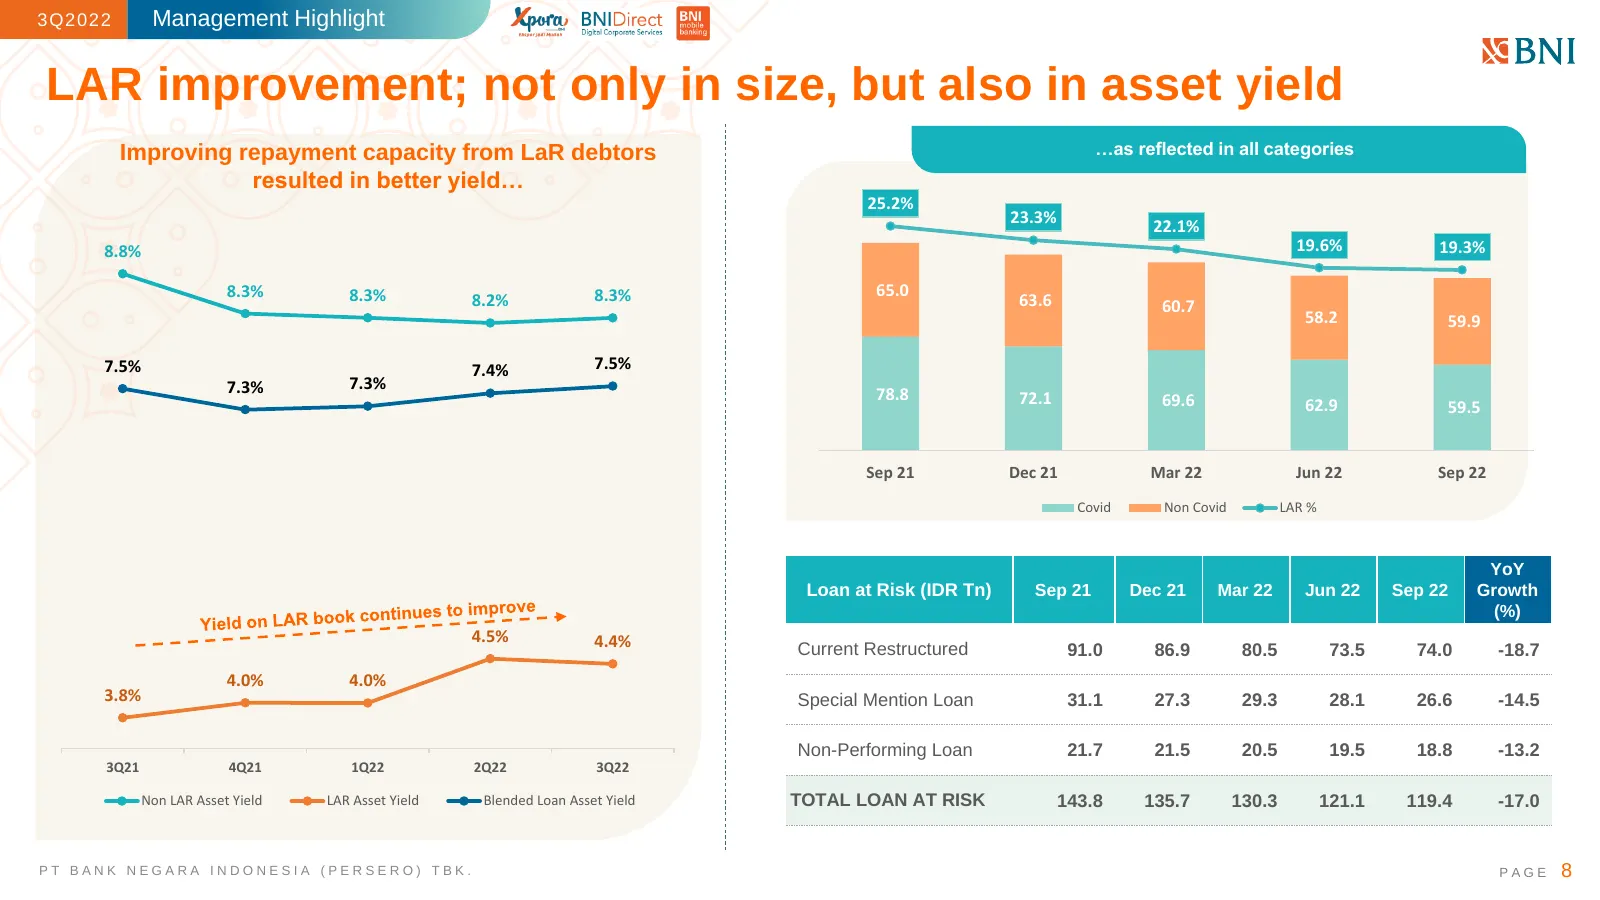
3Q2022 Management Highlight LAR improvement; not only in size, but also in asset yield Improving repayment capacity from LaR debtors …as reflected in all categories resulted in better yield… 25.2% 23.3% 22.1% 8.8% 19.6% 19.3% 8.3% 8.3% 8.3% 65.0 8.2% 63.6 60.7 58.2 59.9 7.5% 7.4% 7.5% 7.3% 7.3% 78.8
Slide 9: Reinforcing Foundations, Building New Strengths
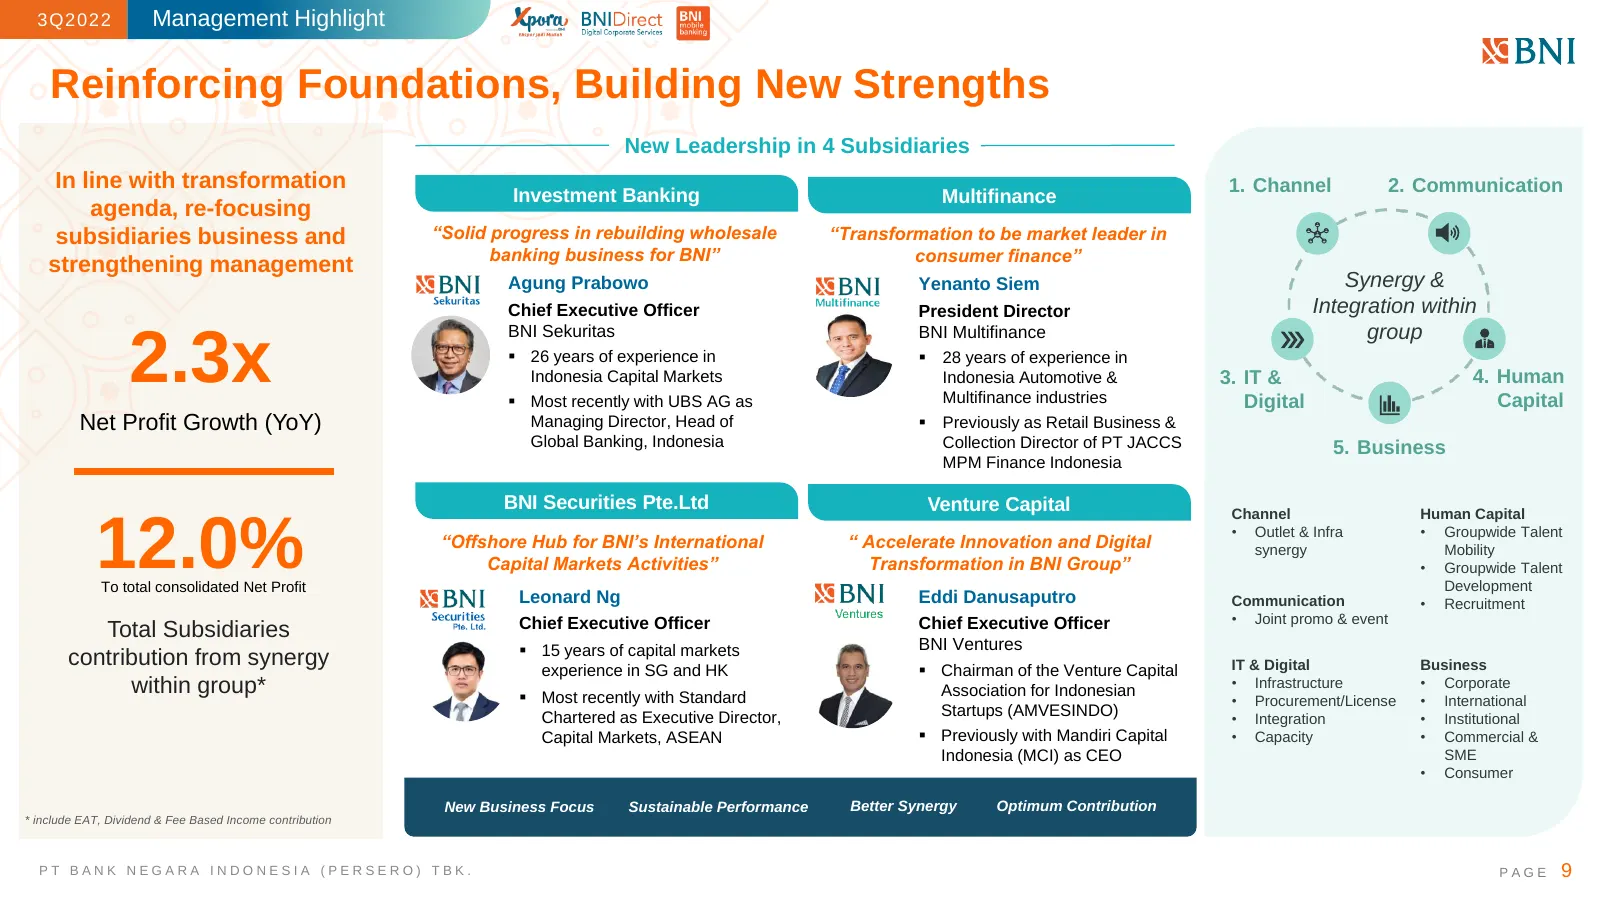
3Q2022 Management Highlight Reinforcing Foundations, Building New Strengths New Leadership in 4 Subsidiaries In line with transformation 1. Channel 2. Communication Investment Banking Multifinance agenda, re-focusing subsidiaries business and “Solid progress in rebuilding wholesale “Transformation t
Slide 10: Corporate Guidance for FY 2023
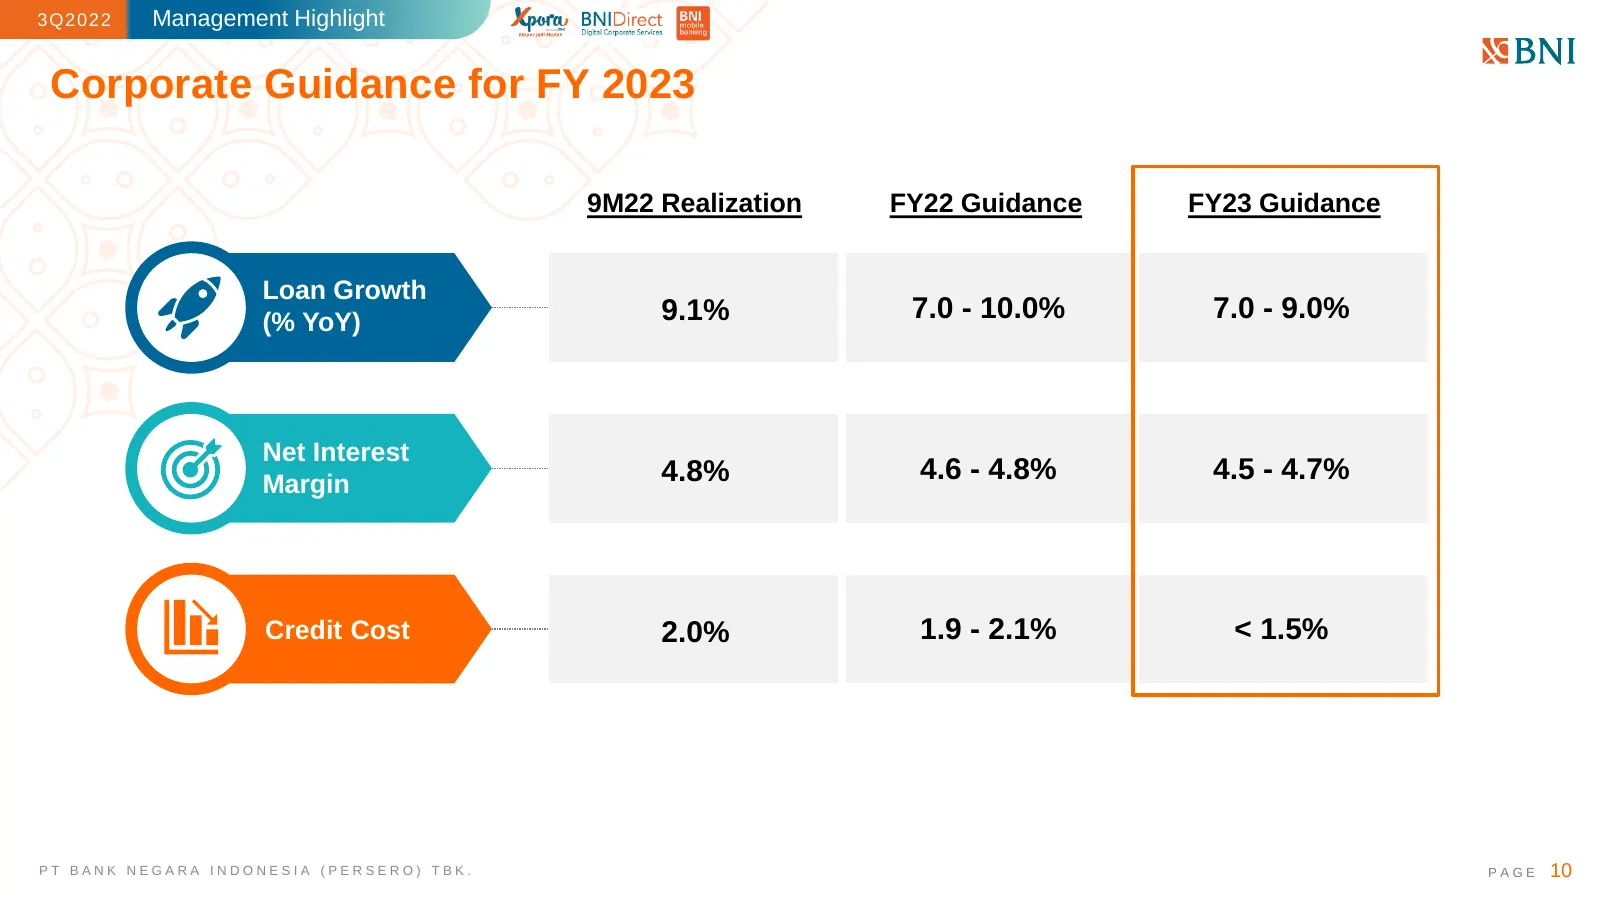
3Q2022 Management Highlight Corporate Guidance for FY 2023 9M22 Realization FY22 Guidance FY23 Guidance Loan Growth (% YoY) 9.1% 7.0 - 10.0% 7.0 - 9.0% Net Interest Margin 4.8% 4.6 - 4.8% 4.5 - 4.7% Credit Cost 2.0% 1.9 - 2.1% < 1.5% PT BANK NEGARA INDONESIA (PERSERO) TBK. PAGE 10

Slide 11: Macroeconomics Highlight
3Q2022 Macroeconomics Highlight PT BANK NEGARA INDONESIA (PERSERO) TBK. PAGE 11
Slide 12: Interest rates hike along with high global inflation
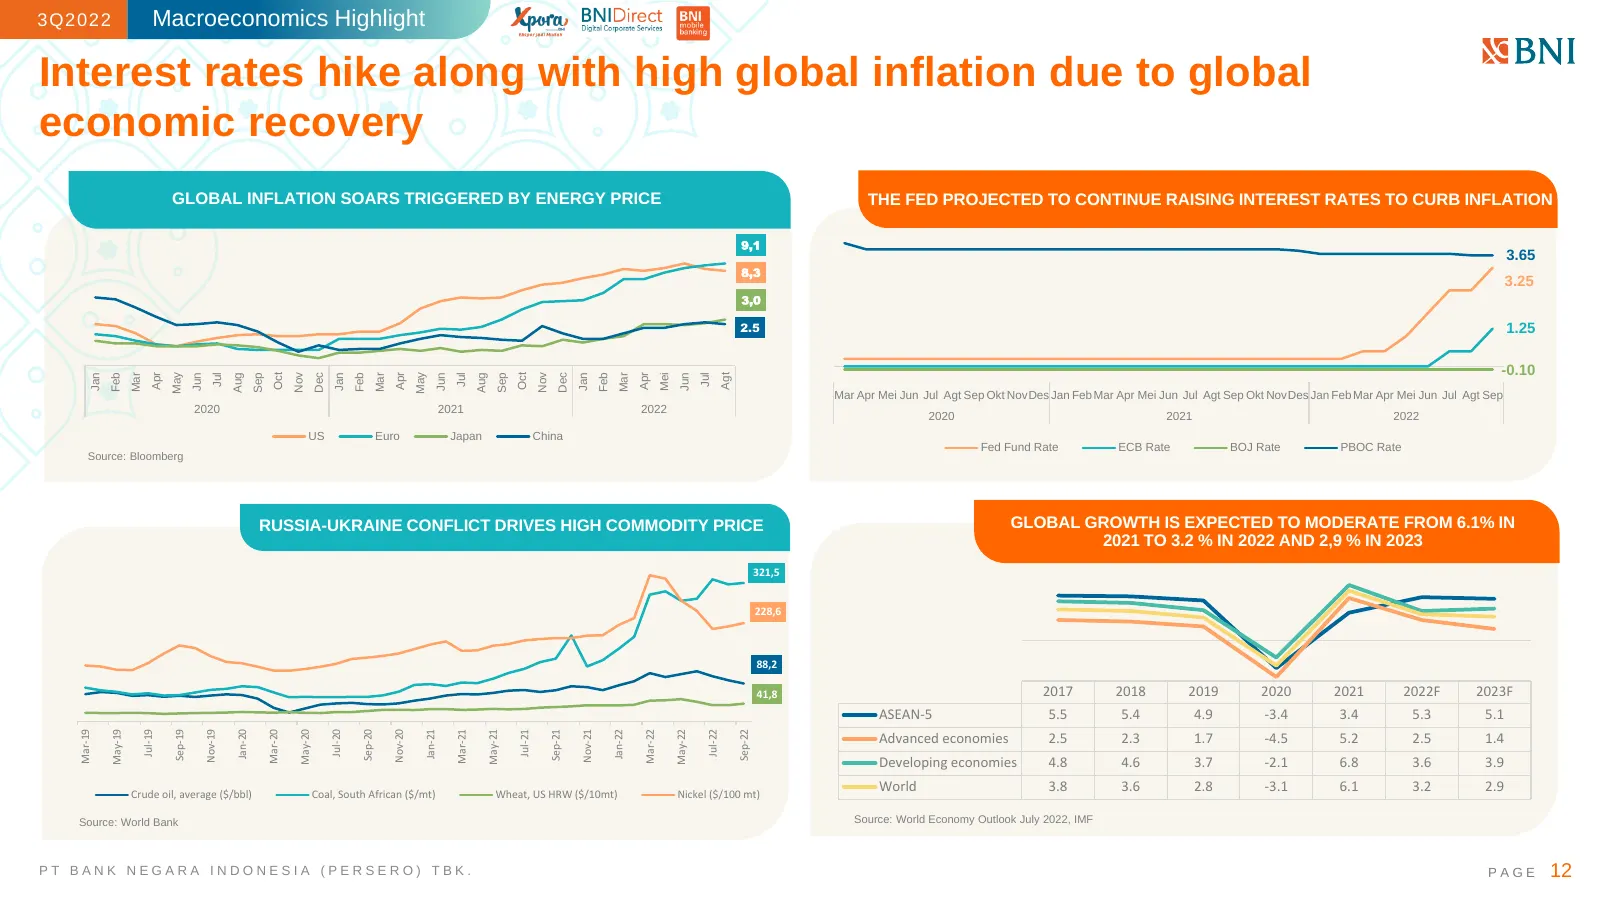
3Q2022 Macroeconomics Highlight Interest rates hike along with high global inflation due to global economic recovery GLOBAL INFLATION SOARS TRIGGERED BY ENERGY PRICE THE FED PROJECTED TO CONTINUE RAISING INTEREST RATES TO CURB INFLATION 9,1 3.65 8,3 3.25 3,0 2.5 1.25 -0.10 Apr Aug Sep Apr Aug Sep Ap
Slide 13: Macroeconomics highlight
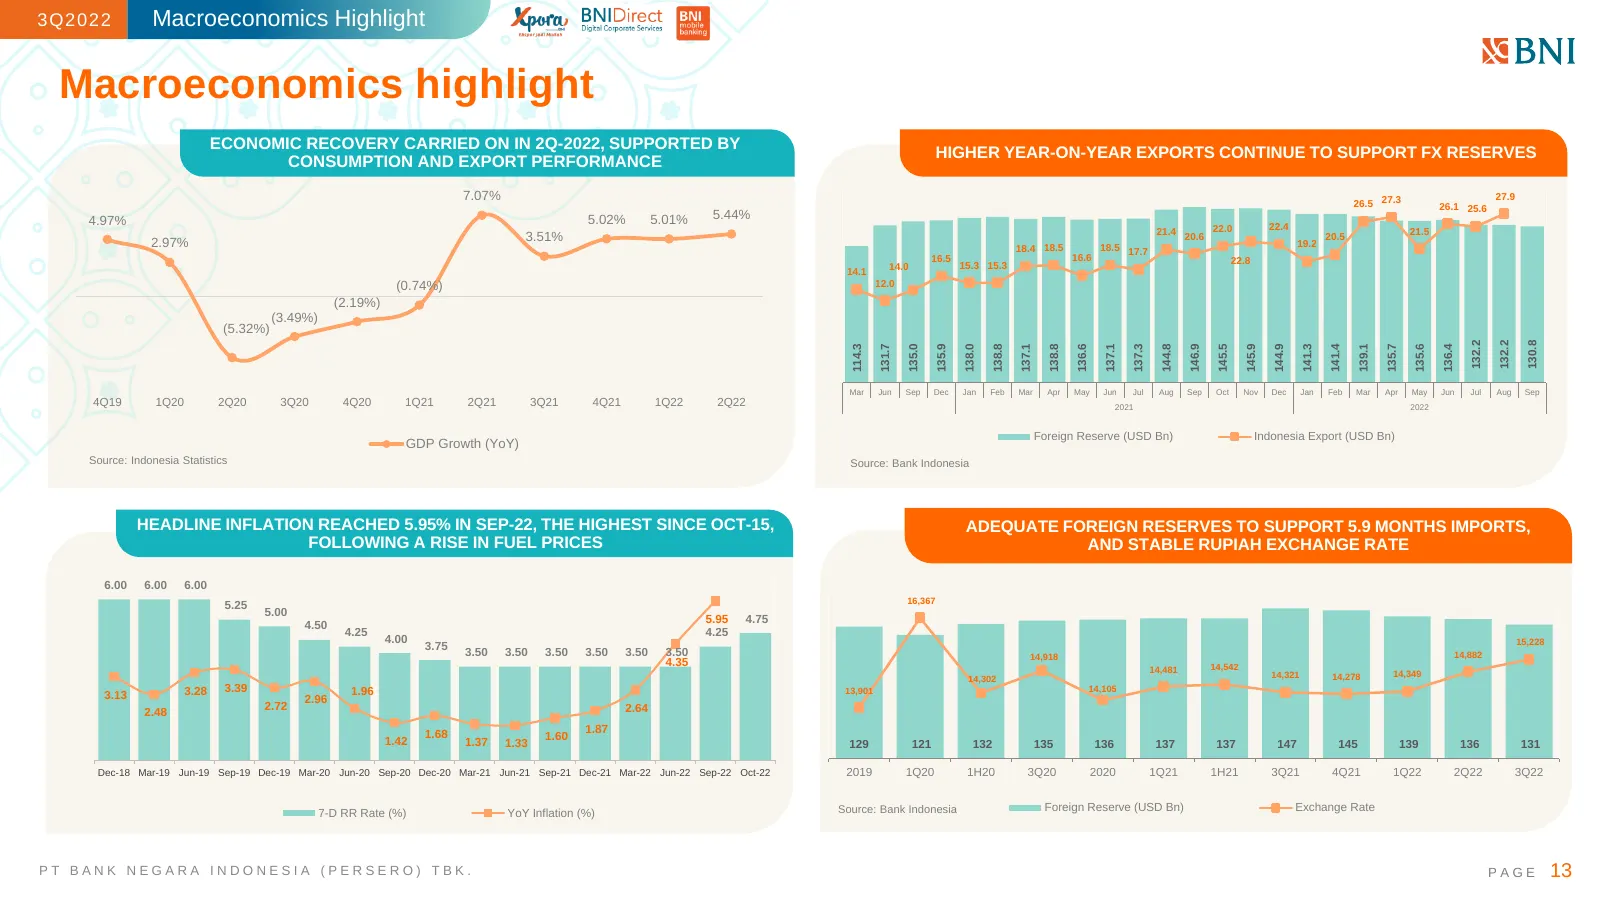
3Q2022 Macroeconomics Highlight Macroeconomics highlight ECONOMIC RECOVERY CARRIED ON IN 2Q-2022, SUPPORTED BY HIGHER YEAR-ON-YEAR EXPORTS CONTINUE TO SUPPORT FX RESERVES CONSUMPTION AND EXPORT PERFORMANCE 7.07% 27.9 26.5 27.3 26.1 25.6 4.97% 5.02% 5.01% 5.44% 22.4 21.4 20.6 22.0 21.5 2.97% 3.51% 19
Slide 14: Leading economic indicators continue to show a strong performance
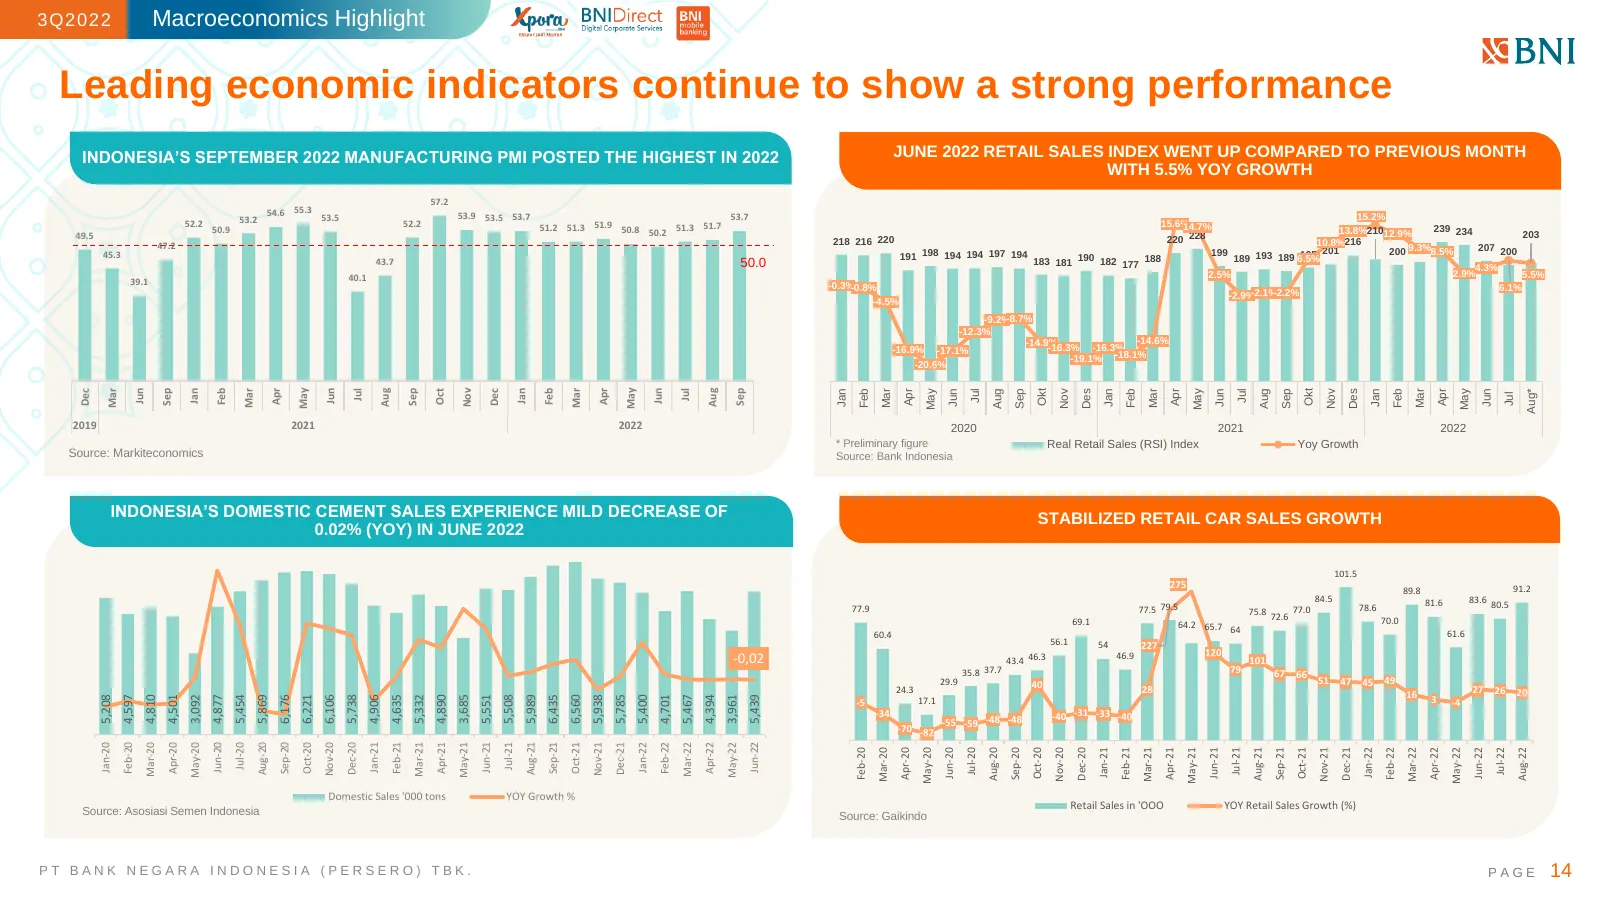
3Q2022 Macroeconomics Highlight Leading economic indicators continue to show a strong performance INDONESIA’S SEPTEMBER 2022 MANUFACTURING PMI POSTED THE HIGHEST IN 2022 JUNE 2022 RETAIL SALES INDEX WENT UP COMPARED TO PREVIOUS MONTH WITH 5.5% YOY GROWTH 57.2 300 20.0% 54.6 55.3 53.5 53.9 53.5 53.7
Slide 15: Macroeconomic Projection
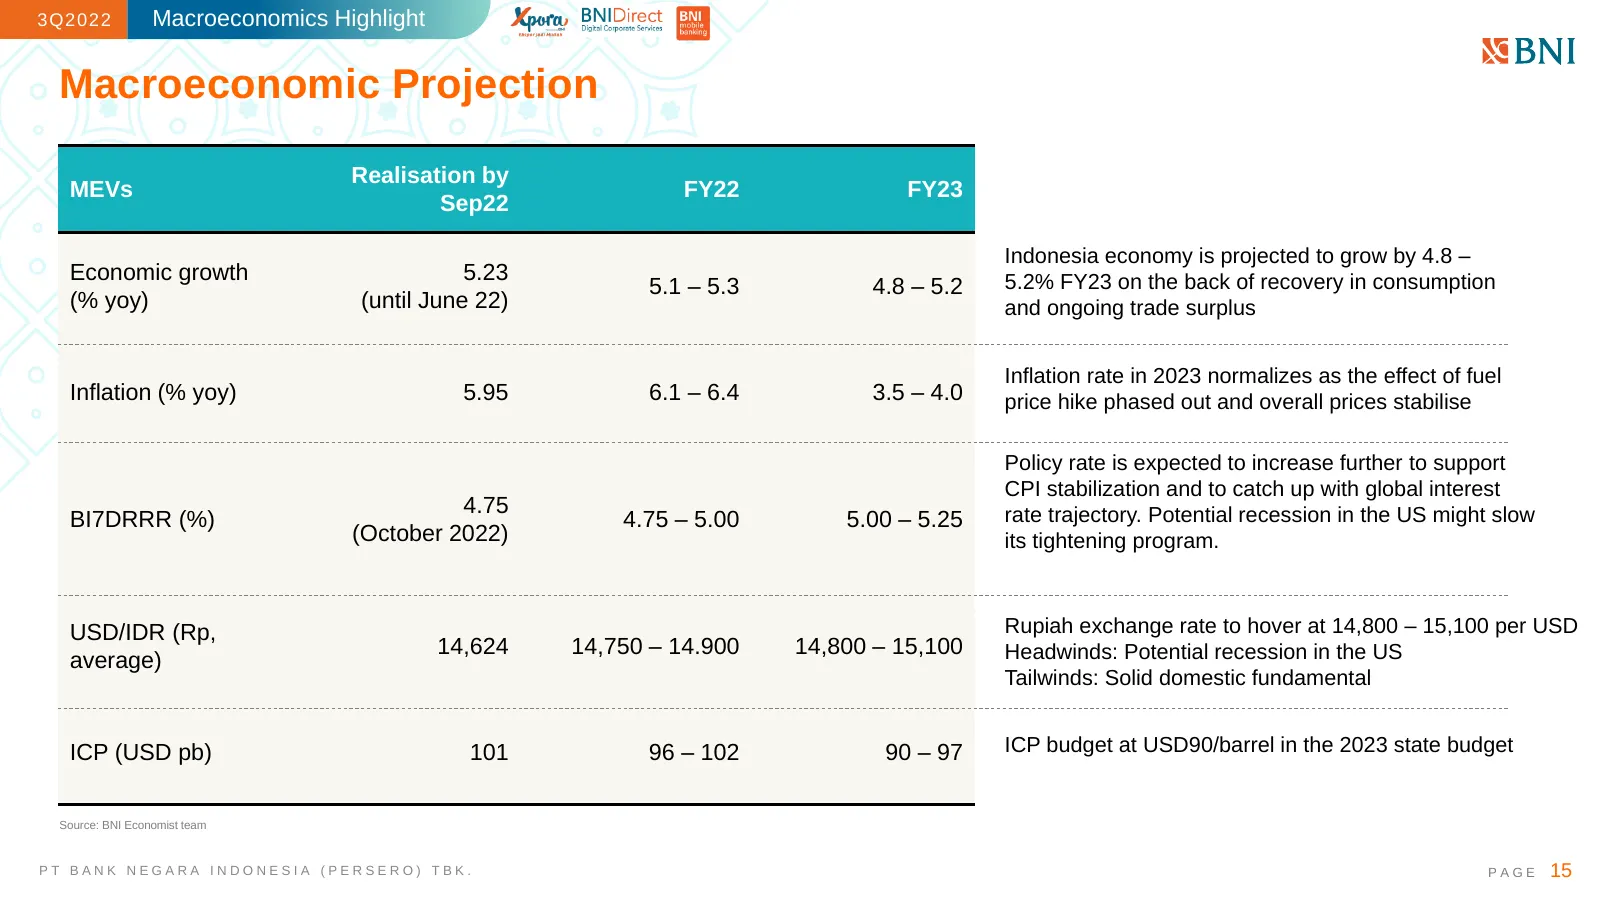
3Q2022 Macroeconomics Highlight Macroeconomic Projection Realisation by MEVs FY22 FY23 Sep22 Indonesia economy is projected to grow by 4.8 – Economic growth 5.23 5.1 – 5.3 4.8 – 5.2 5.2% FY23 on the back of recovery in consumption (% yoy) (until June 22) and ongoing trade surplus Inflation rate in 2
Slide 16: Financial Performance
3Q2022 Financial Performance PT BANK NEGARA INDONESIA (PERSERO) TBK. PAGE 16
Slide 17: Highlighted results
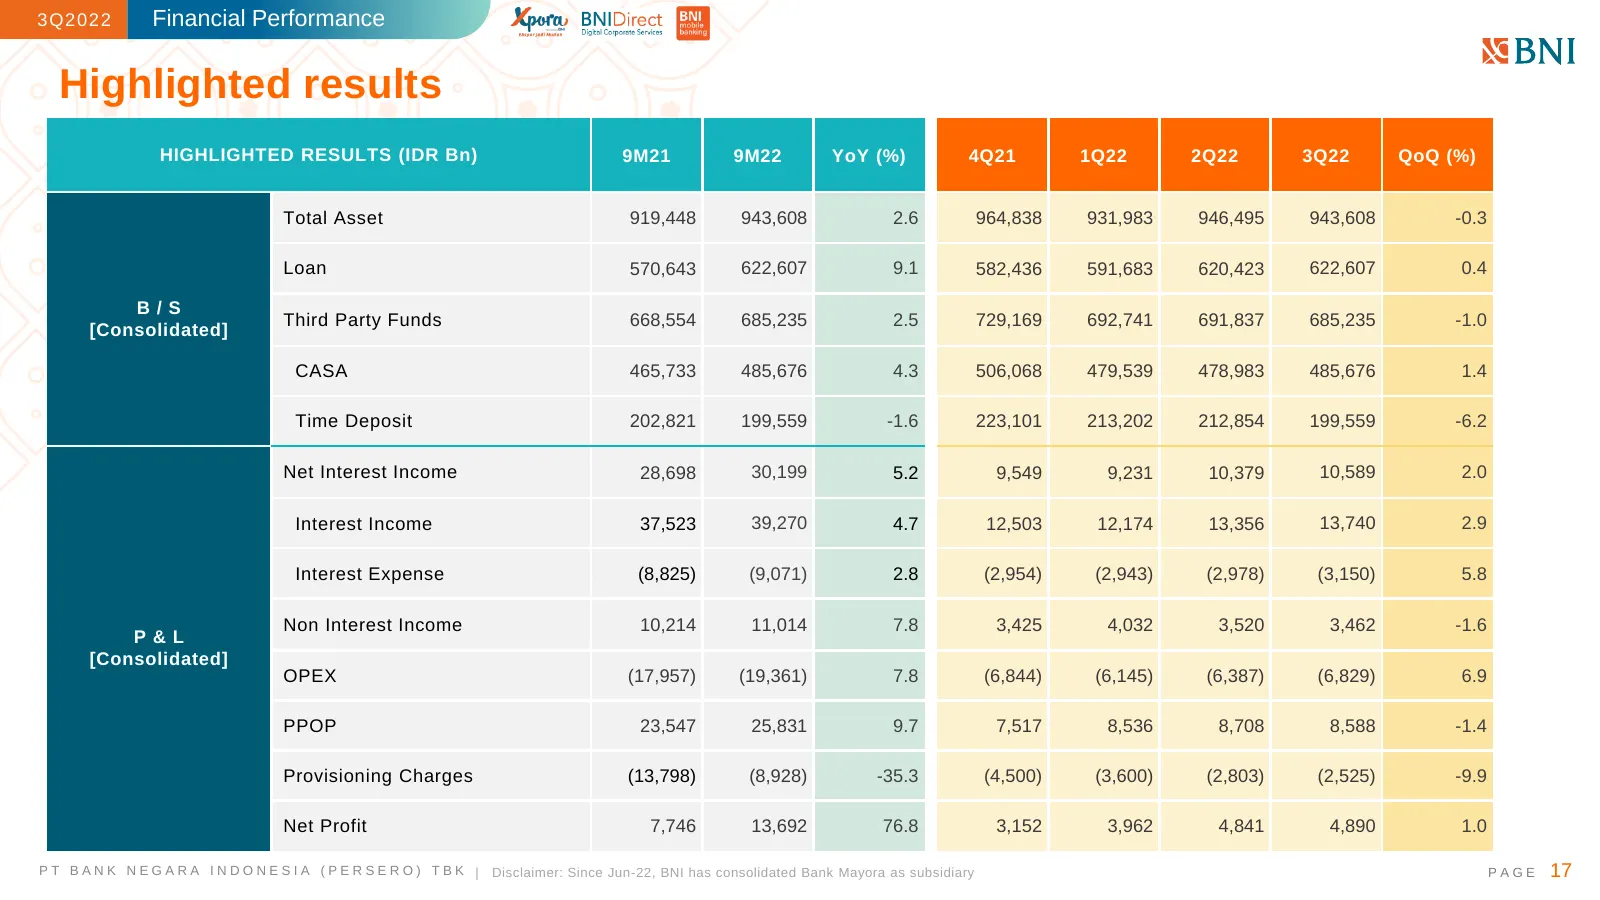
3Q2022 Financial Performance Highlighted results HIGHLIGHTED RESULTS (IDR Bn) 9M21 9M22 YoY (%) 4Q21 1Q22 2Q22 3Q22 QoQ (%) Total Asset 919,448 943,608 2.6 964,838 931,983 946,495 943,608 -0.3 Loan 570,643 622,607 9.1 582,436 591,683 620,423 622,607 0.4 B/S Third Party Funds 668,554 685,235 2.5 729,
Slide 18: Key ratios – solid performances across major metrics
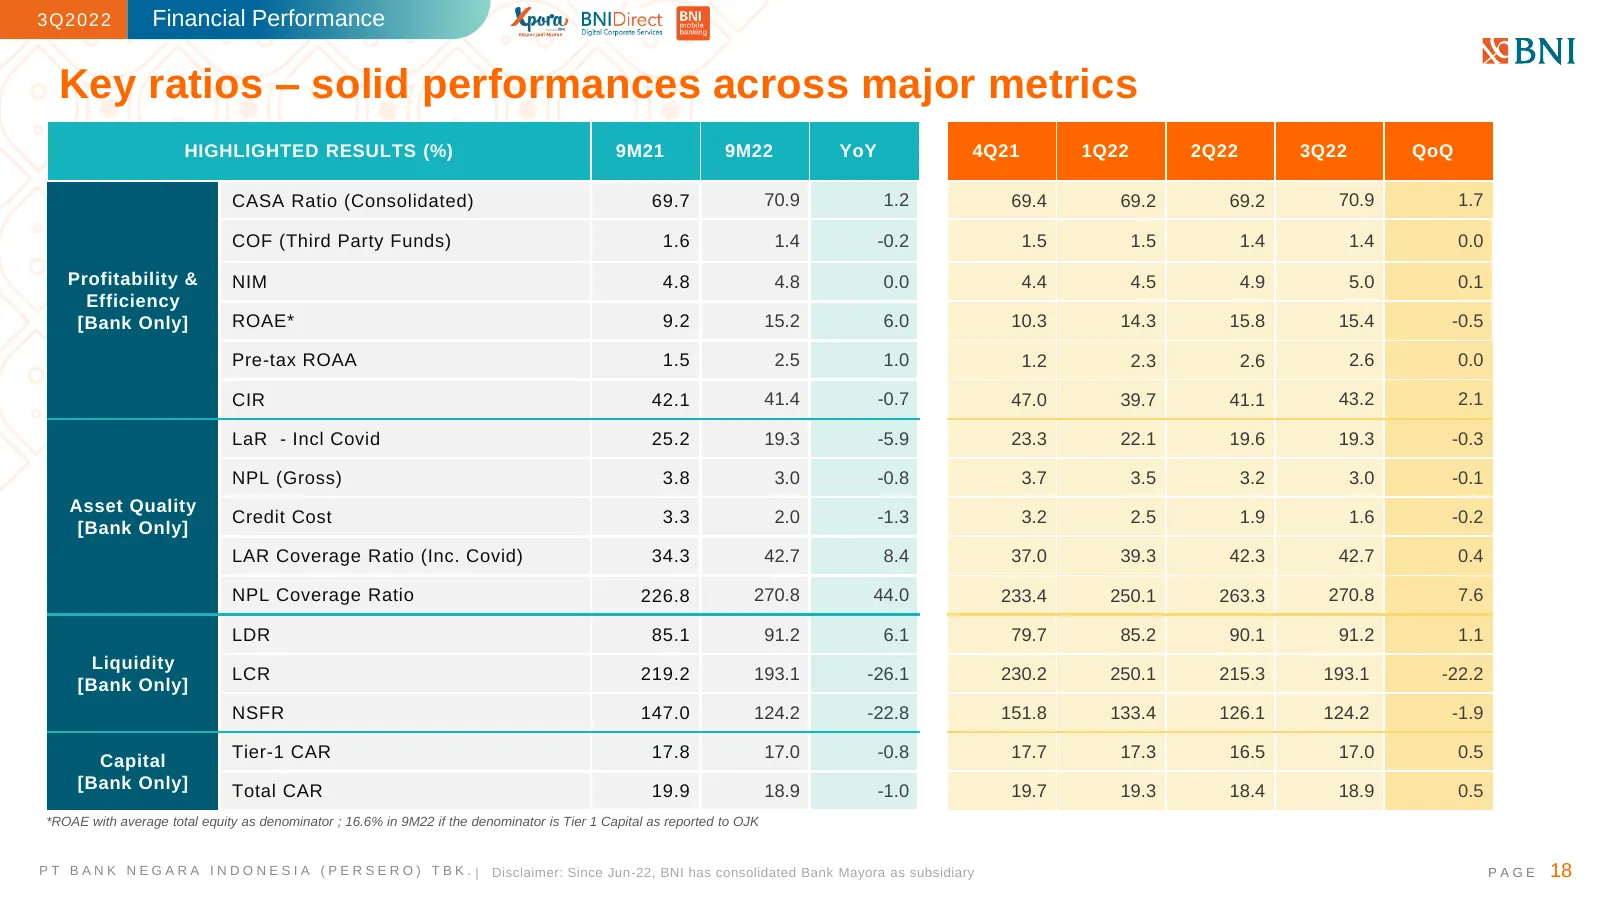
3Q2022 Financial Performance Key ratios – solid performances across major metrics HIGHLIGHTED RESULTS (%) 9M21 9M22 YoY 4Q21 1Q22 2Q22 3Q22 QoQ CASA Ratio (Consolidated) 69.7 70.9 1.2 69.4 69.2 69.2 70.9 1.7 COF (Third Party Funds) 1.6 1.4 -0.2 1.5 1.5 1.4 1.4 0.0 Profitability & NIM 4.8 4.8 0.0 4.4
Slide 19: Healthy growth from lower risk segments
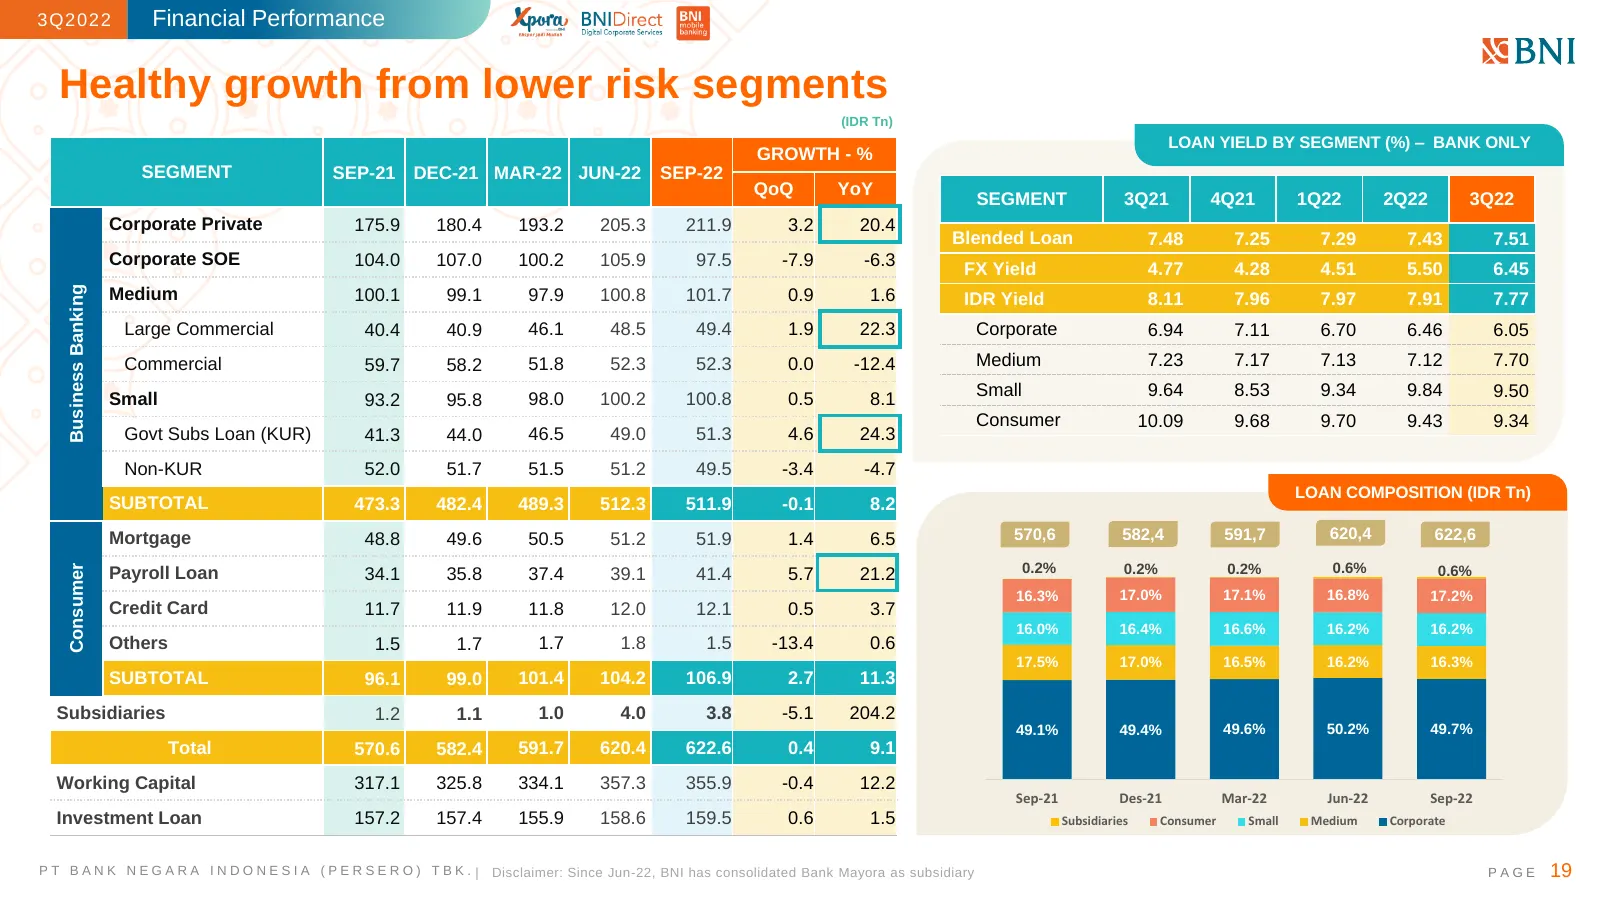
3Q2022 Financial Performance Healthy growth from lower risk segments (IDR Tn) LOAN YIELD BY SEGMENT (%) – BANK ONLY GROWTH - % SEGMENT SEP-21 DEC-21 MAR-22 JUN-22 SEP-22 QoQ YoY SEGMENT 3Q21 4Q21 1Q22 2Q22 3Q22 Corporate Private 175.9 180.4 193.2 205.3 211.9 3.2 20.4 Blended Loan 7.48 7.25 7.29 7.43
Slide 20: Rp70.0 trillion loans disbursed in Q3-2022
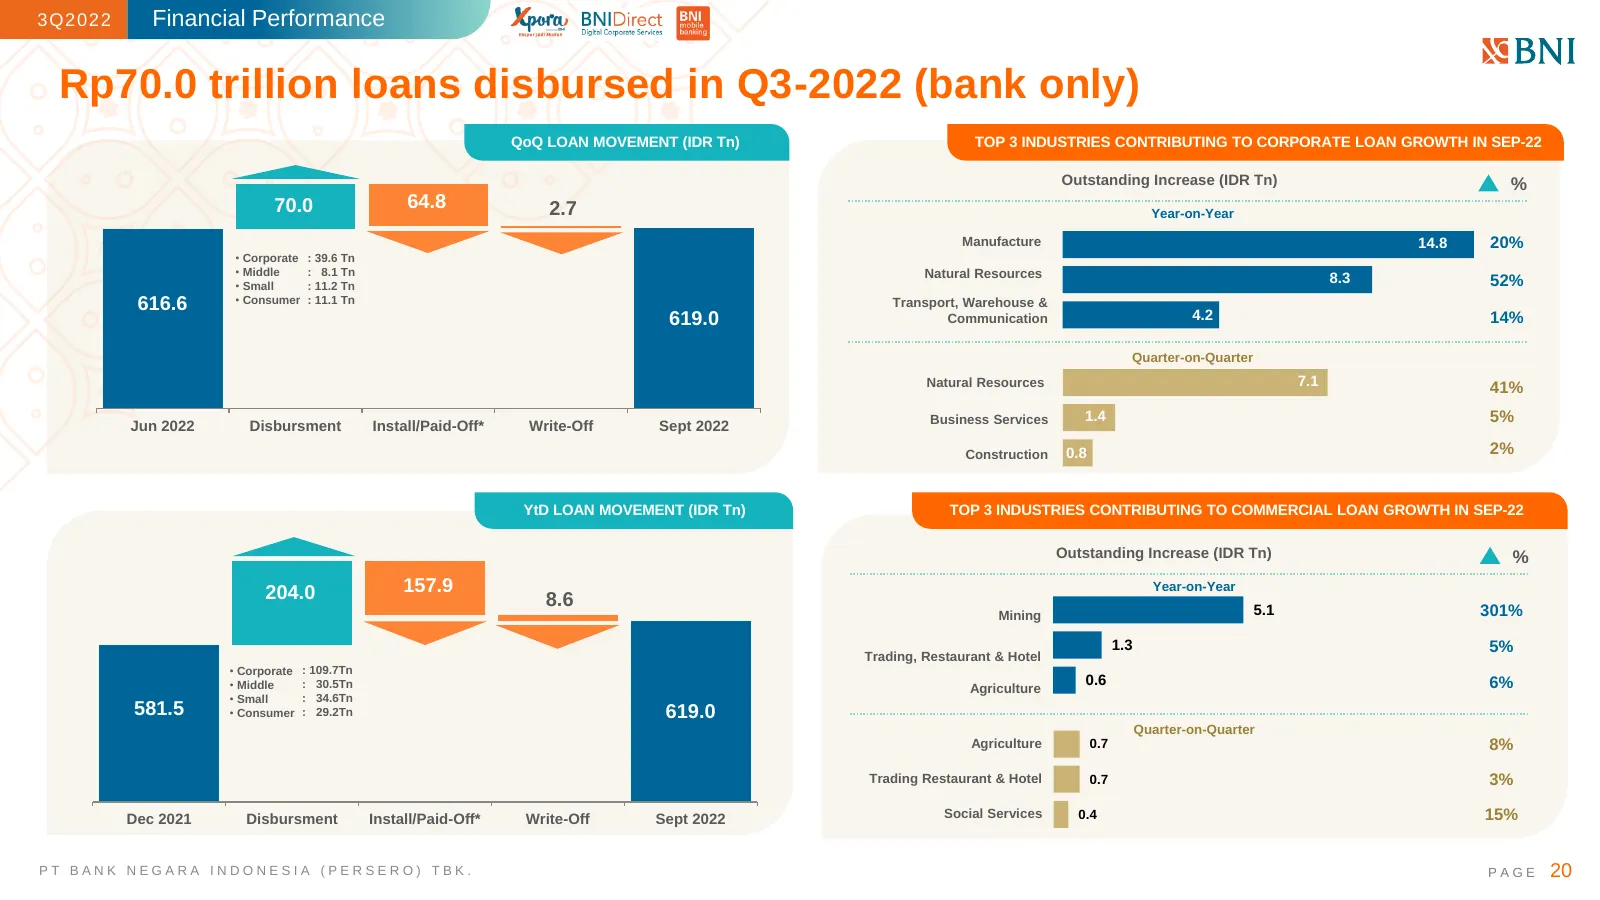
3Q2022 Financial Performance Rp70.0 trillion loans disbursed in Q3-2022 (bank only) QoQ LOAN MOVEMENT (IDR Tn) TOP 3 INDUSTRIES CONTRIBUTING TO CORPORATE LOAN GROWTH IN SEP-22 Outstanding Increase (IDR Tn) % 70.0 64.8 2.7 Year-on-Year Manufacture 14.8 20% • Corporate : 39.6 Tn • Middle : 8.1 Tn Natu
Slide 21: Solid PPOP coupled by smaller Loan Loss Provision
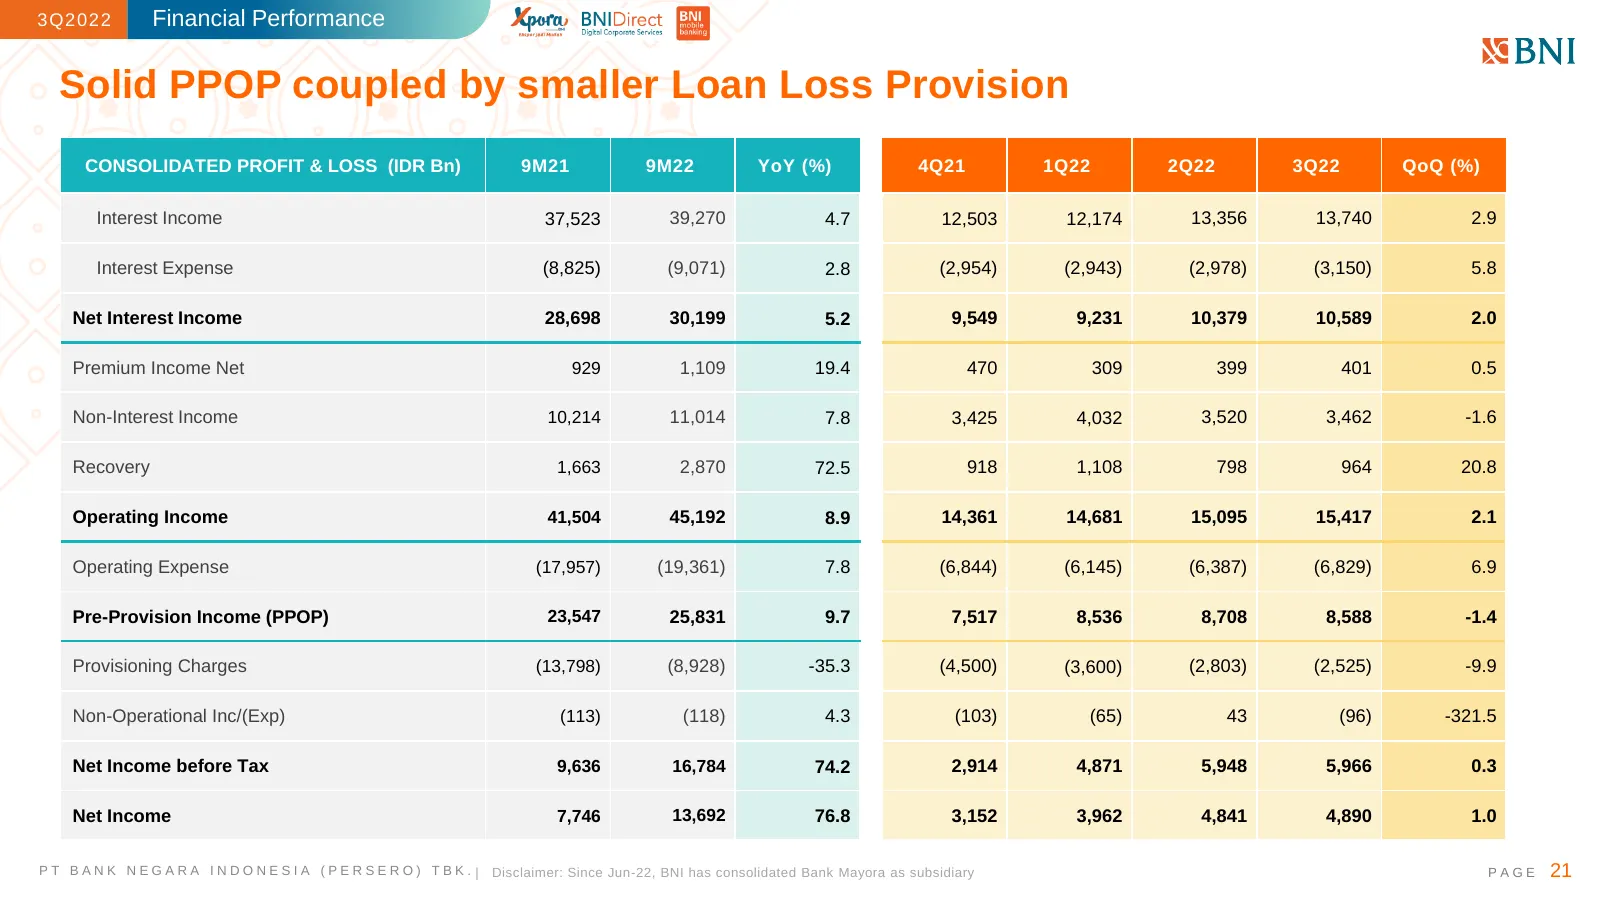
3Q2022 Financial Performance Solid PPOP coupled by smaller Loan Loss Provision CONSOLIDATED PROFIT & LOSS (IDR Bn) 9M21 9M22 YoY (%) 4Q21 1Q22 2Q22 3Q22 QoQ (%) Interest Income 37,523 39,270 4.7 12,503 12,174 13,356 13,740 2.9 Interest Expense (8,825) (9,071) 2.8 (2,954) (2,943) (2,978) (3,150) 5.8
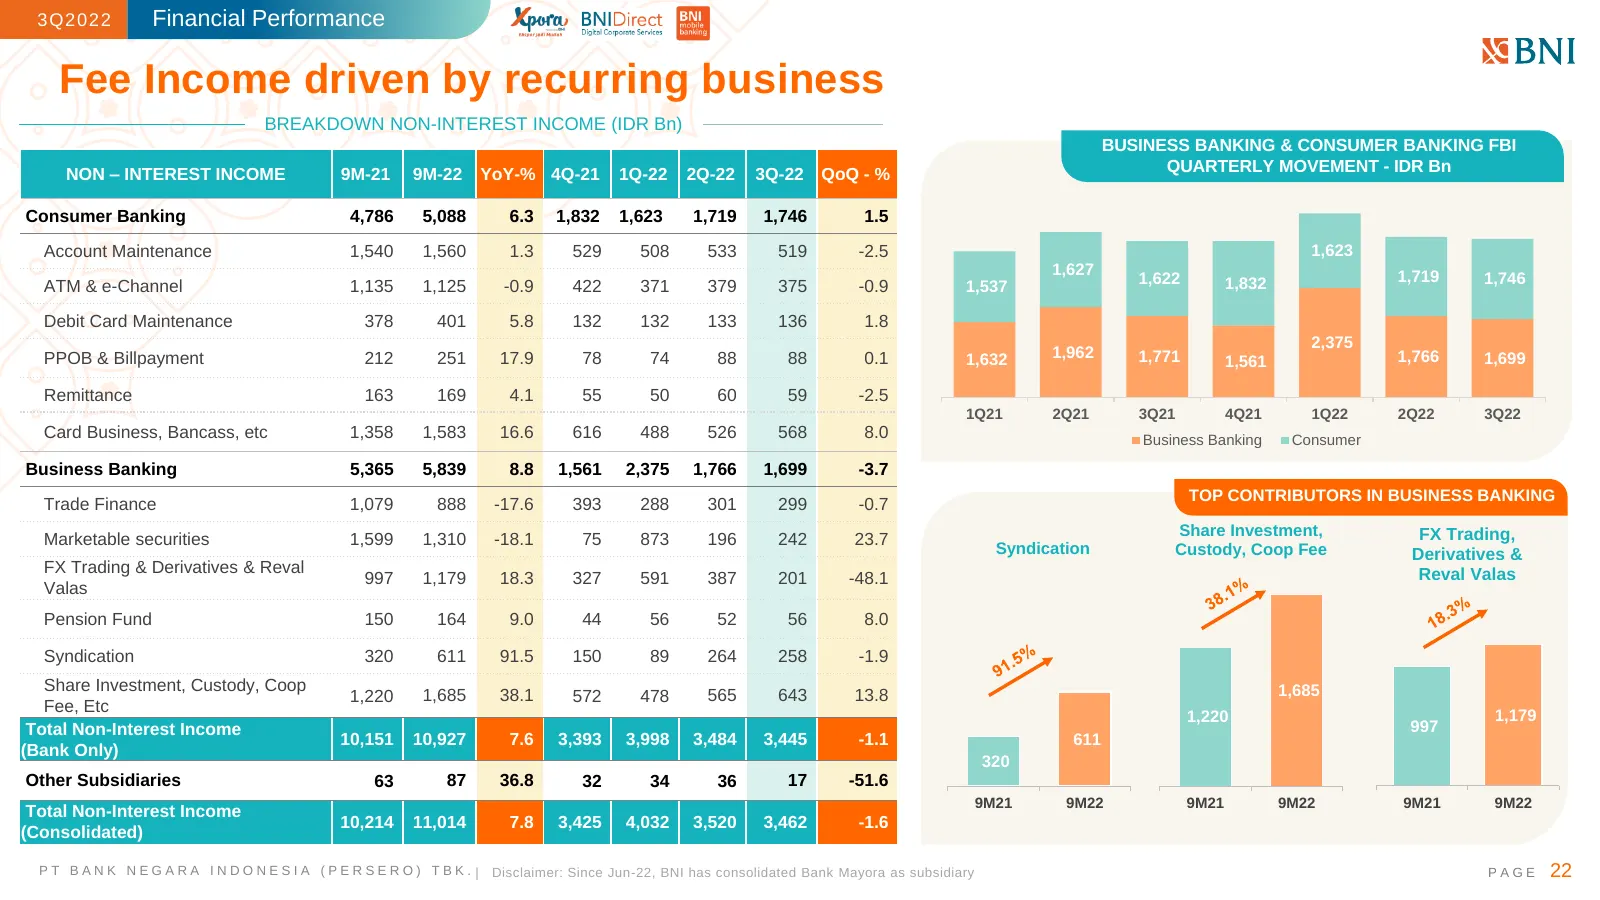
Slide 22: Fee Income driven by recurring business
3Q2022 Financial Performance Fee Income driven by recurring business BREAKDOWN NON-INTEREST INCOME (IDR Bn) BUSINESS BANKING & CONSUMER BANKING FBI NON – INTEREST INCOME 9M-21 9M-22 YoY-% 4Q-21 1Q-22 2Q-22 3Q-22 QoQ - % QUARTERLY MOVEMENT - IDR Bn Consumer Banking 4,786 5,088 6.3 1,832 1,623 1,719 1
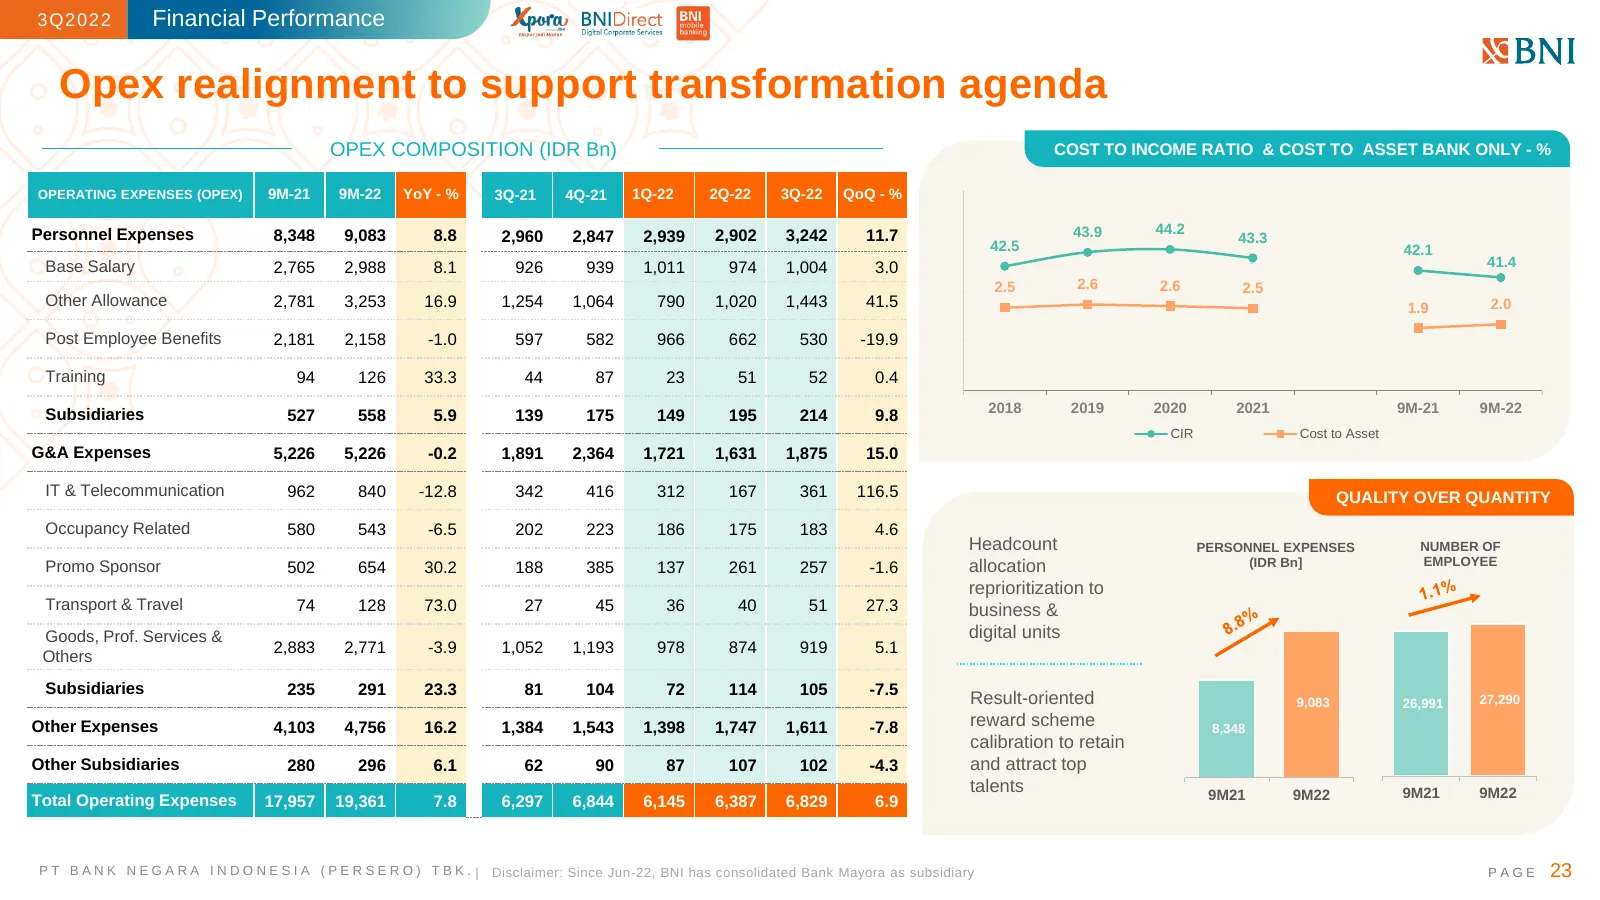
Slide 23: Opex realignment to support transformation agenda
3Q2022 Financial Performance Opex realignment to support transformation agenda OPEX COMPOSITION (IDR Bn) COST TO INCOME RATIO & COST TO ASSET BANK ONLY - % OPERATING EXPENSES (OPEX) 9M-21 9M-22 YoY - % 3Q-21 4Q-21 1Q-22 2Q-22 3Q-22 QoQ - % Personnel Expenses 8,348 9,083 8.8 2,960 2,847 2,939 2,902 3
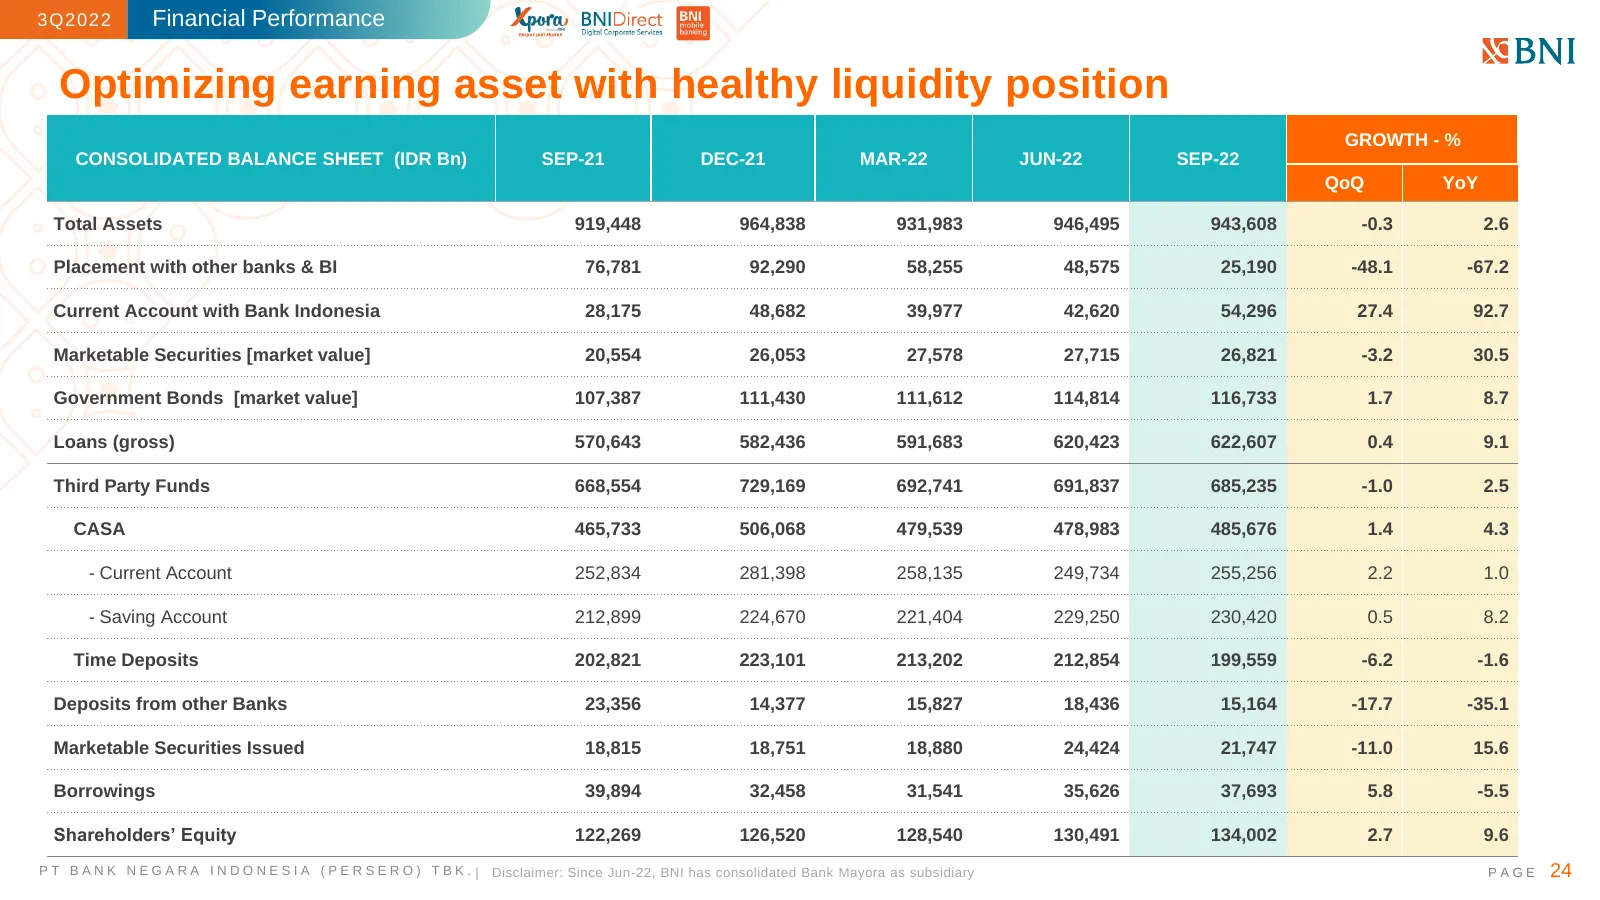
Slide 24: Optimizing earning asset with healthy liquidity position
3Q2022 Financial Performance Optimizing earning asset with healthy liquidity position GROWTH - % CONSOLIDATED BALANCE SHEET (IDR Bn) SEP-21 DEC-21 MAR-22 JUN-22 SEP-22 QoQ YoY Total Assets 919,448 964,838 931,983 946,495 943,608 -0.3 2.6 Placement with other banks & BI 76,781 92,290 58,255 48,575 25
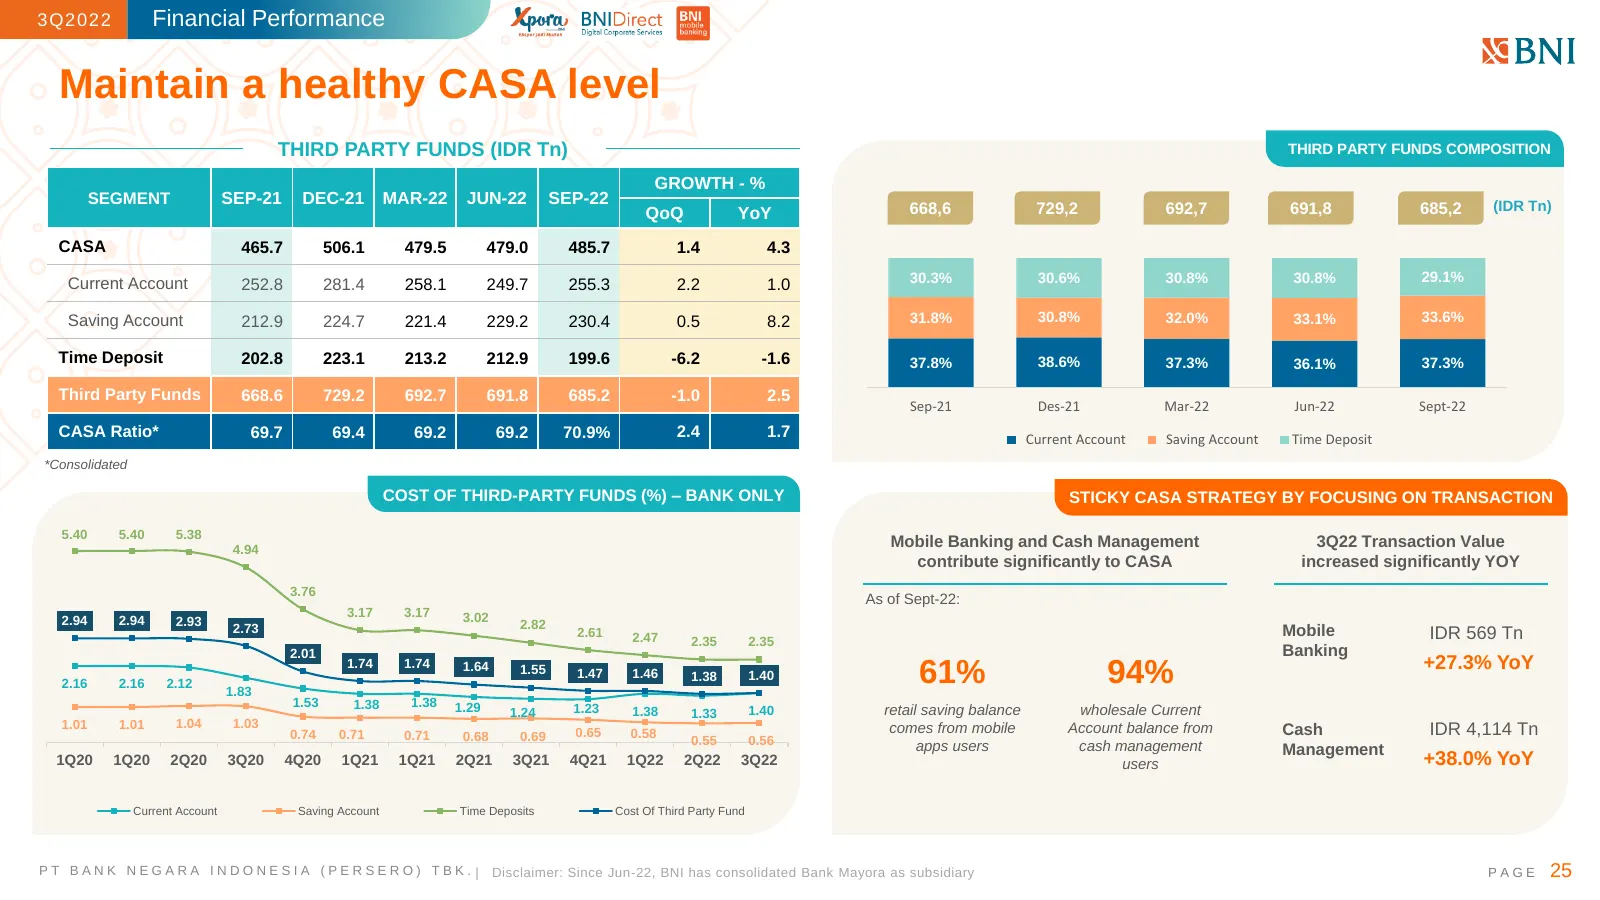
Slide 25: Maintain a healthy CASA level
3Q2022 Financial Performance Maintain a healthy CASA level THIRD PARTY FUNDS (IDR Tn) THIRD PARTY FUNDS COMPOSITION GROWTH - % SEGMENT SEP-21 DEC-21 MAR-22 JUN-22 SEP-22 (IDR Tn) QoQ YoY 668,6 729,2 692,7 691,8 685,2 120.0% 815.0 CASA 465.7 506.1 479.5 479.0 485.7 1.4 4.3 100.0% 715.0 615.0 Current
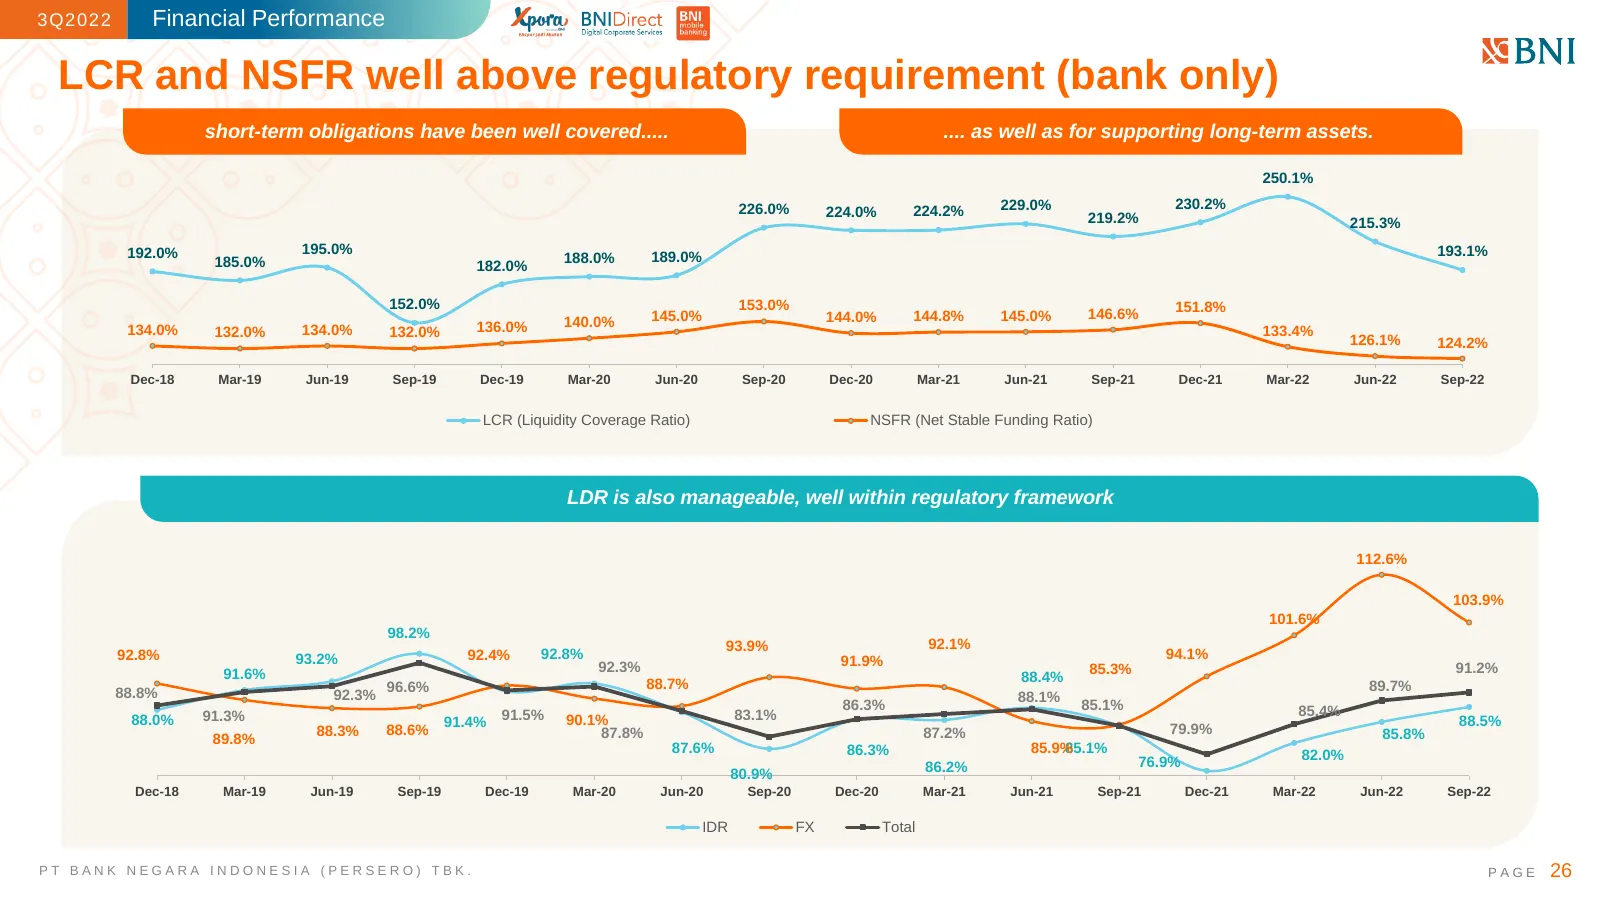
Slide 26: LCR and NSFR well above regulatory requirement
3Q2022 Financial Performance LCR and NSFR well above regulatory requirement (bank only) short-term obligations have been well covered..... .... as well as for supporting long-term assets. 250.1% 226.0% 229.0% 230.2% 224.0% 224.2% 219.2% 215.3% 192.0% 195.0% 193.1% 185.0% 188.0% 189.0% 182.0% 152.0%
Slide 27: Asset Quality
3Q2022 Asset Quality PT BANK NEGARA INDONESIA (PERSERO) TBK. PAGE 27
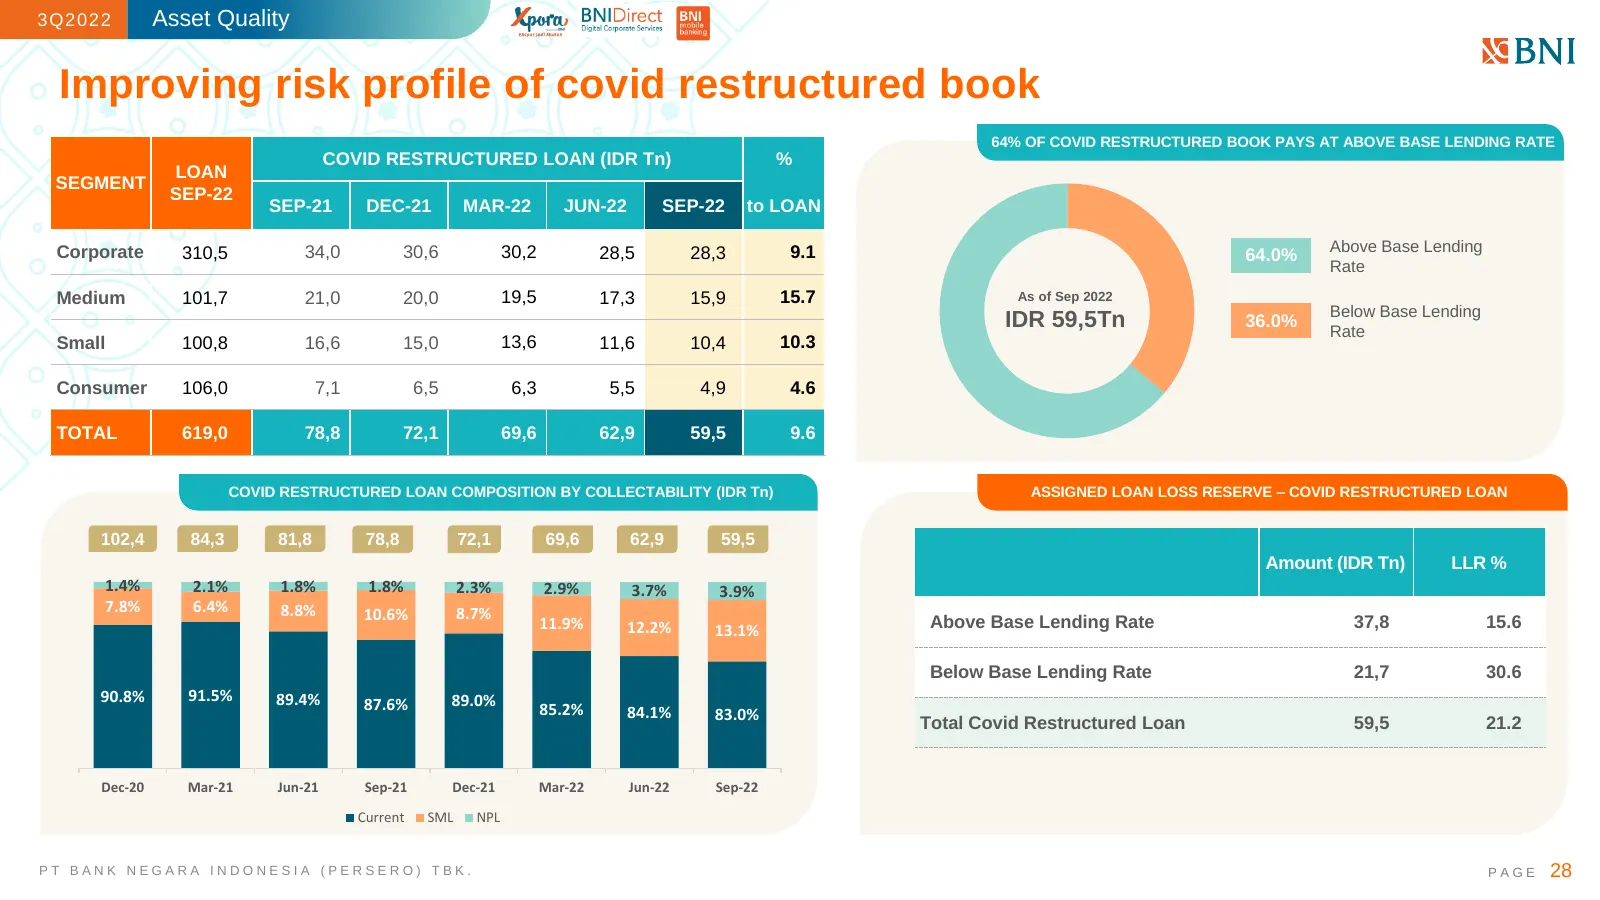
Slide 28: Improving risk profile of covid restructured book
3Q2022 Asset Quality Improving risk profile of covid restructured book 64% OF COVID RESTRUCTURED BOOK PAYS AT ABOVE BASE LENDING RATE COVID RESTRUCTURED LOAN (IDR Tn) % LOAN SEGMENT SEP-22 SEP-21 DEC-21 MAR-22 JUN-22 SEP-22 to LOAN Corporate 310,5 34,0 30,6 30,2 28,5 28,3 9.1 Above Base Lending 64.0
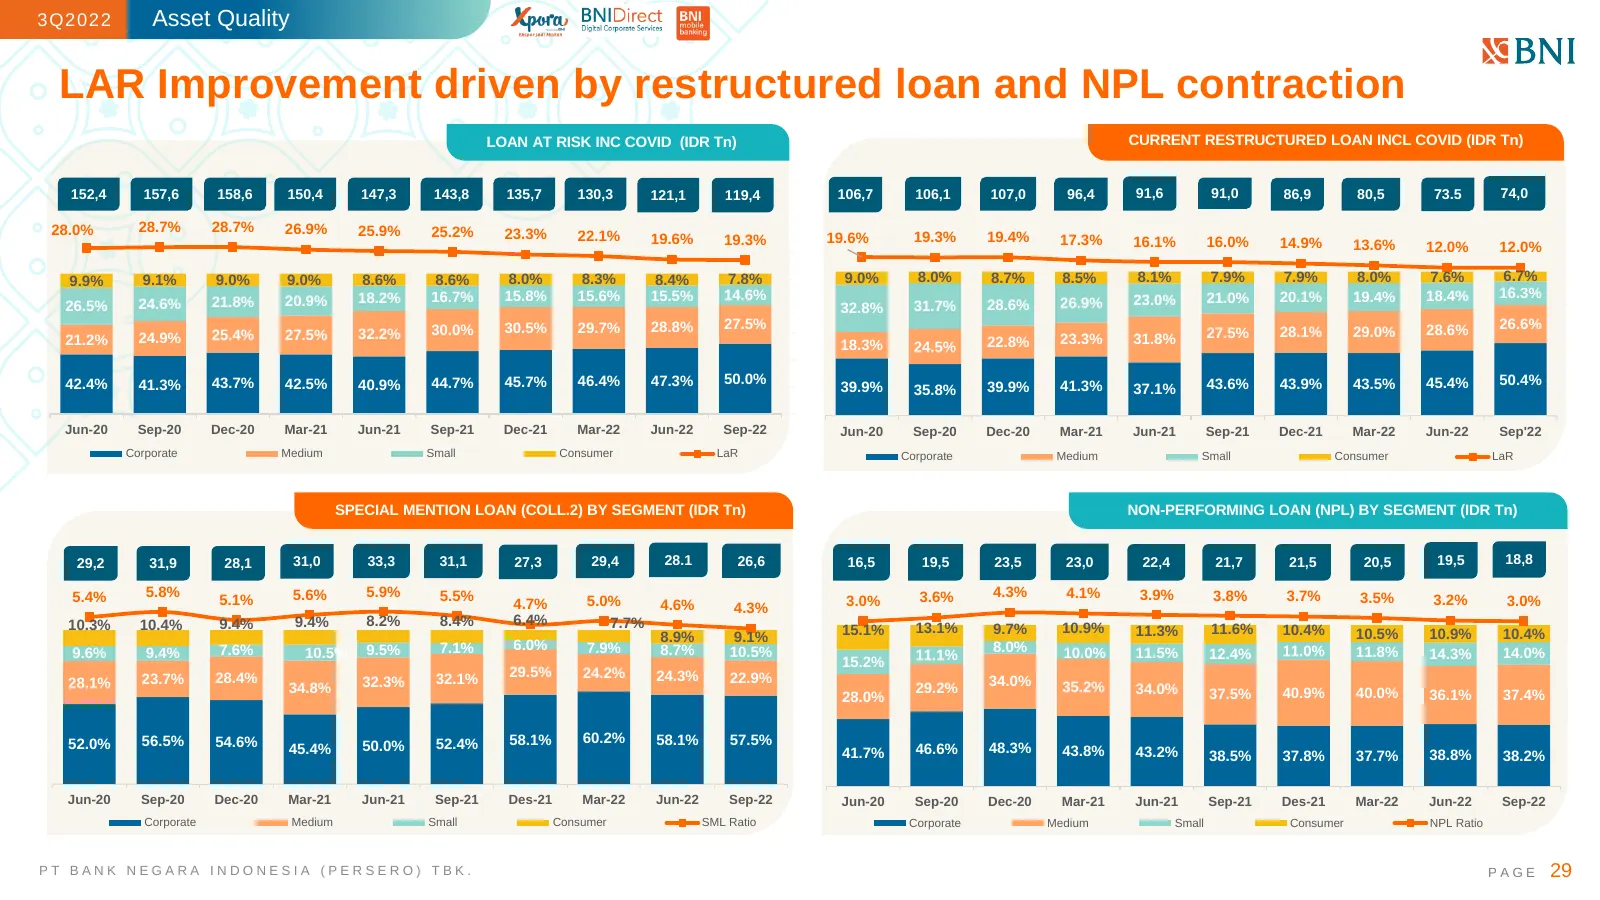
Slide 29: LAR Improvement driven by restructured loan and NPL contraction
3Q2022 Asset Quality LAR Improvement driven by restructured loan and NPL contraction LOAN AT RISK INC COVID (IDR Tn) CURRENT RESTRUCTURED LOAN INCL COVID (IDR Tn) 152,4 157,6 158,6 150,4 147,3 143,8 135,7 130,3 121,1 119,4 106,7 106,1 107,0 96,4 91,6 91,0 86,9 80,5 73.5 74,0 28.0% 28.7% 28.7% 26.9%
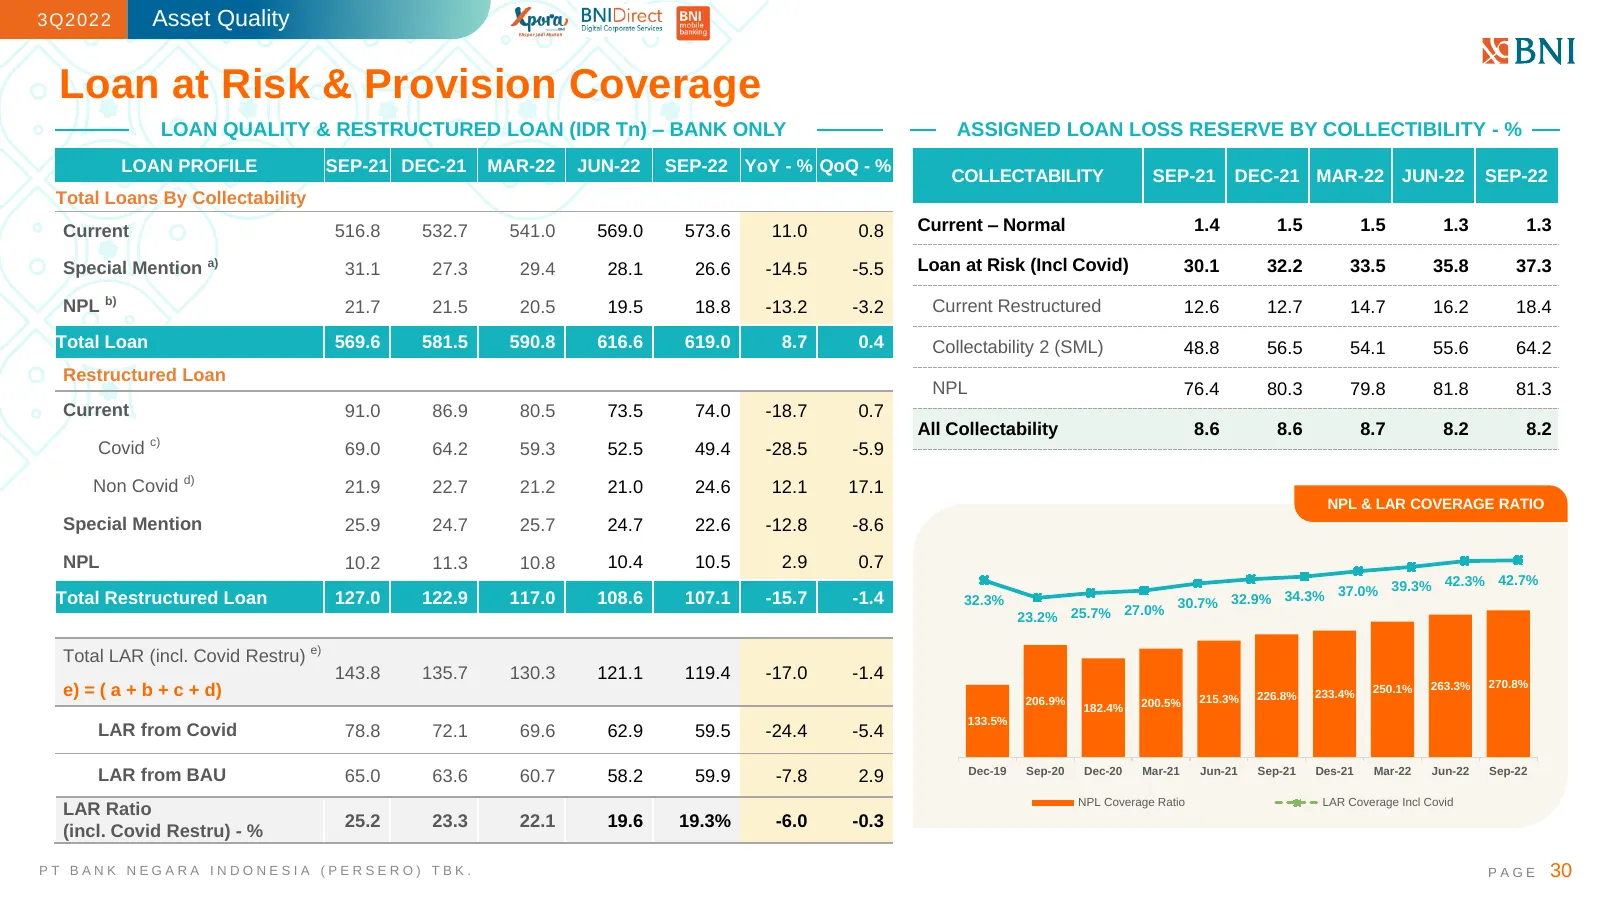
Slide 30: Loan at Risk & Provision Coverage
3Q2022 Asset Quality Loan at Risk & Provision Coverage LOAN QUALITY & RESTRUCTURED LOAN (IDR Tn) – BANK ONLY ASSIGNED LOAN LOSS RESERVE BY COLLECTIBILITY - % LOAN PROFILE SEP-21 DEC-21 MAR-22 JUN-22 SEP-22 YoY - % QoQ - % COLLECTABILITY SEP-21 DEC-21 MAR-22 JUN-22 SEP-22 Total Loans By Collectabilit
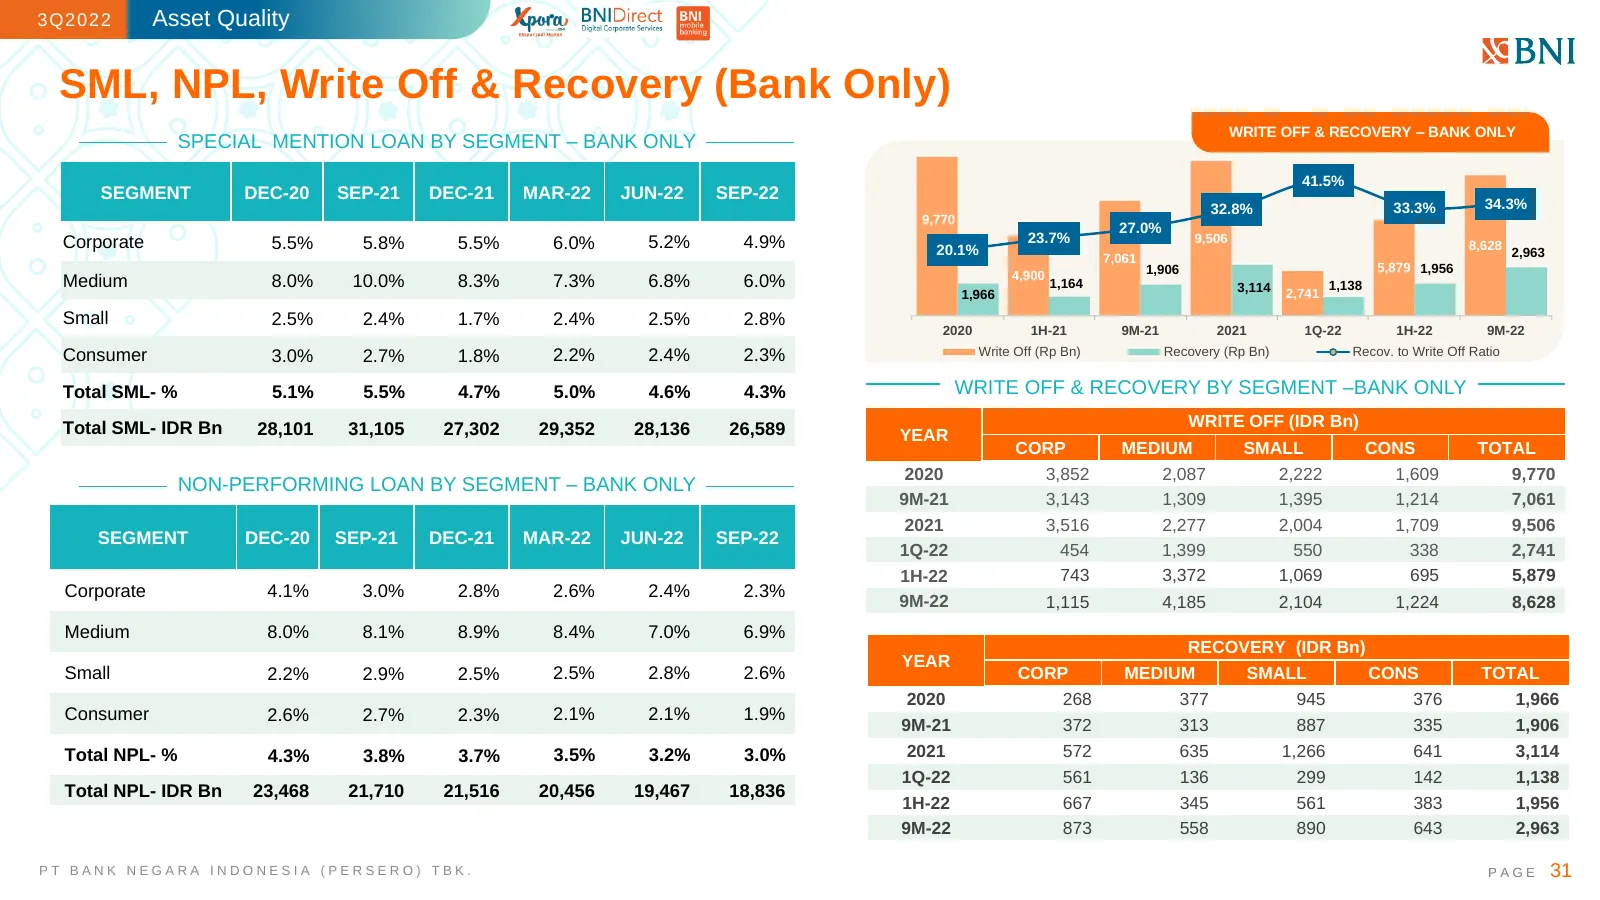
Slide 31: SML, NPL, Write Off & Recovery (Bank Only)
3Q2022 Asset Quality SML, NPL, Write Off & Recovery (Bank Only) WRITE OFF & RECOVERY – BANK ONLY SPECIAL MENTION LOAN BY SEGMENT – BANK ONLY 41.5% SEGMENT DEC-20 SEP-21 DEC-21 MAR-22 JUN-22 SEP-22 32.8% 33.3% 34.3% 9,770 27.0% Corporate 5.5% 5.8% 5.5% 6.0% 5.2% 4.9% 23.7% 9,506 8,628 20.1% 7,061 2,9
Slide 32: Digital Initiatives
3Q2022 Digital Initiatives PT BANK NEGARA INDONESIA (PERSERO) TBK. PAGE 32
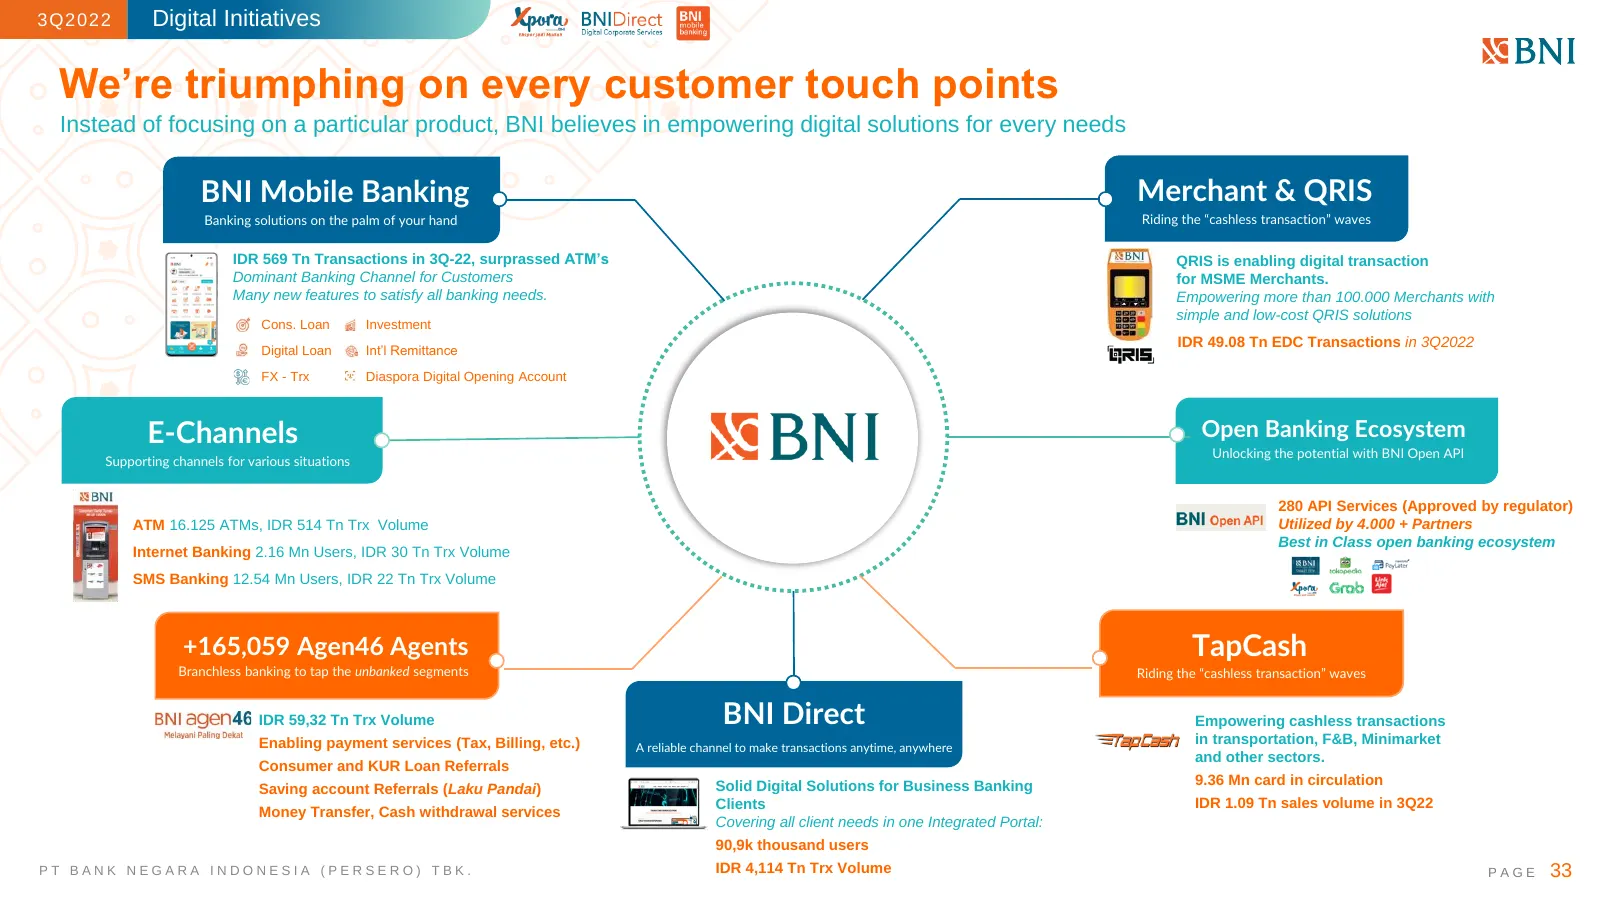
Slide 33: We're triumphing on every customer touch points
3Q2022 Digital Initiatives We’re triumphing on every customer touch points Instead of focusing on a particular product, BNI believes in empowering digital solutions for every needs BNI Mobile Banking Merchant & QRIS Banking solutions on the palm of your hand Riding the “cashless transaction” waves I
Slide 34: Poised to be the main banking channel for customers
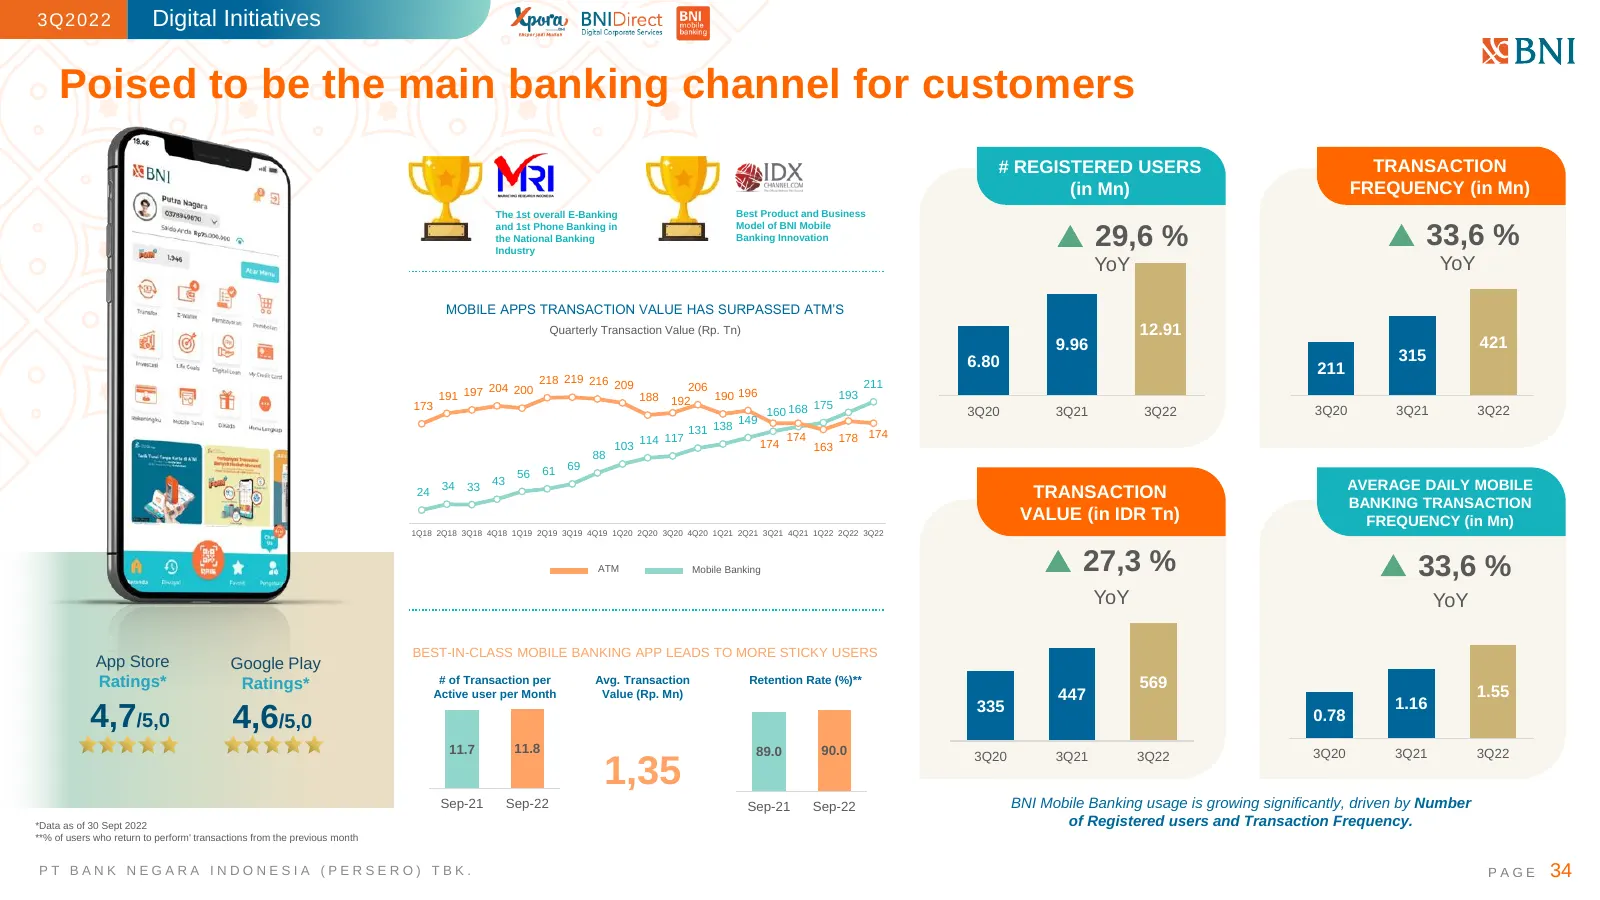
3Q2022 Digital Initiatives Poised to be the main banking channel for customers # REGISTERED USERS TRANSACTION (in Mn) FREQUENCY (in Mn) The 1st overall E-Banking Best Product and Business and 1st Phone Banking in Model of BNI Mobile the National Banking Industry Banking Innovation 29,6 % 33,6 % YoY
Slide 35: BNI Mobile Banking Super Apps Ecosystem
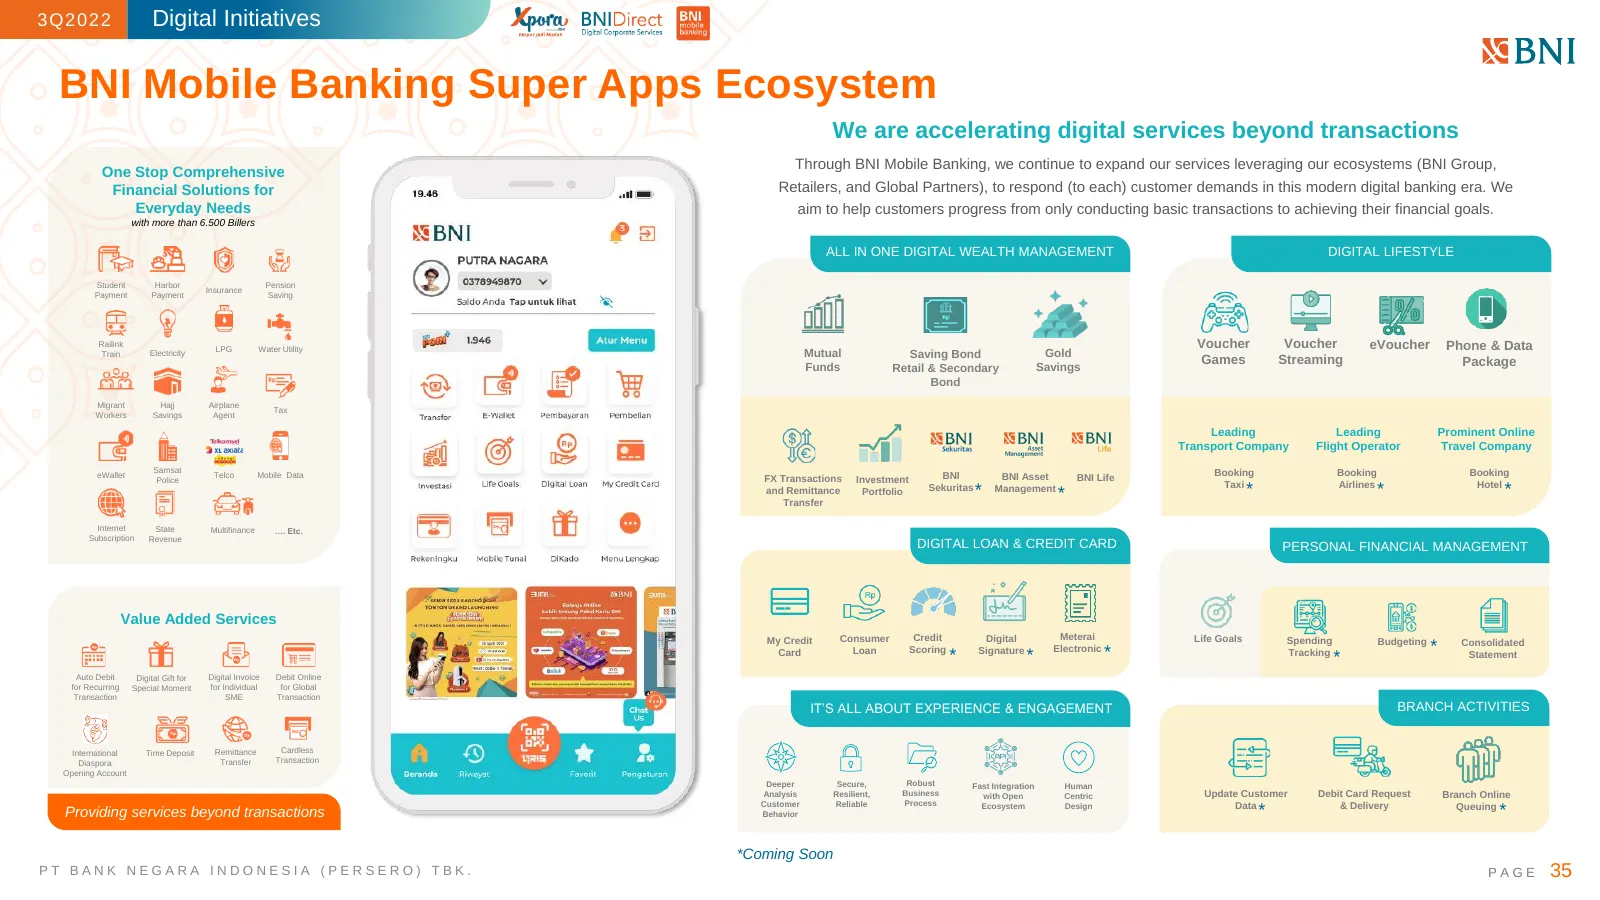
3Q2022 Digital Initiatives BNI Mobile Banking Super Apps Ecosystem We are accelerating digital services beyond transactions Through BNI Mobile Banking, we continue to expand our services leveraging our ecosystems (BNI Group, One Stop Comprehensive Financial Solutions for Retailers, and Global Partne
Slide 36: Branchless Banking
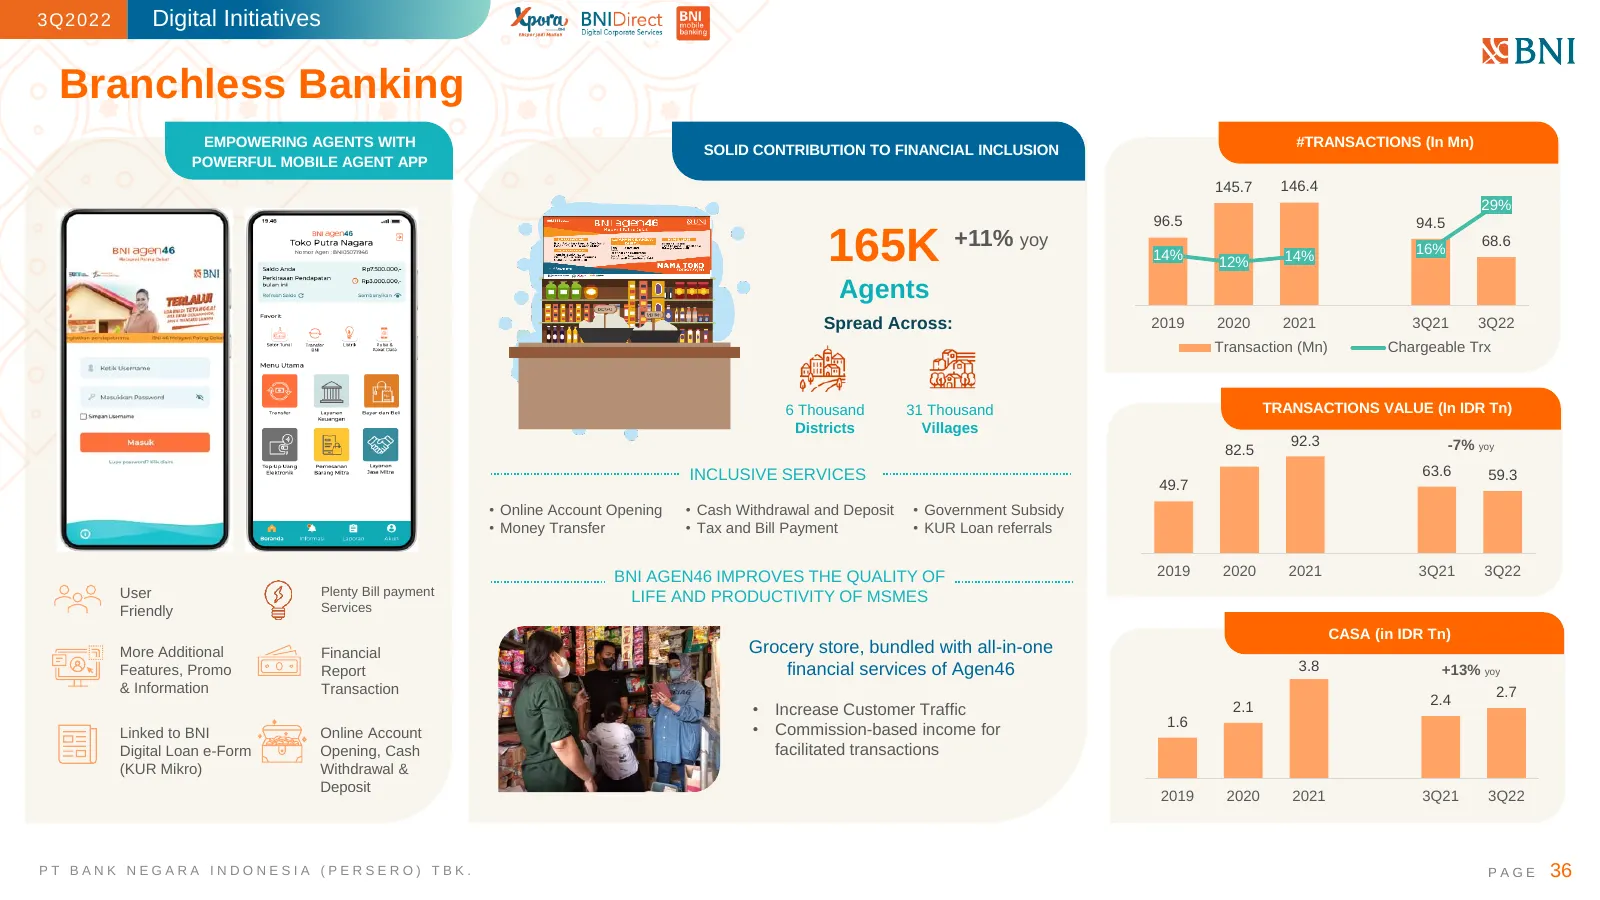
3Q2022 Digital Initiatives Branchless Banking EMPOWERING AGENTS WITH #TRANSACTIONS (In Mn) SOLID CONTRIBUTION TO FINANCIAL INCLUSION POWERFUL MOBILE AGENT APP 145.7 146.4 29% 96.5 94.5 165K +11% yoy 14% 12% 14% 16% 68.6 Agents Spread Across: 2019 2020 2021 3Q21 3Q22 Transaction (Mn) Chargeable Trx 6
Slide 37: Harnessing the power of open banking
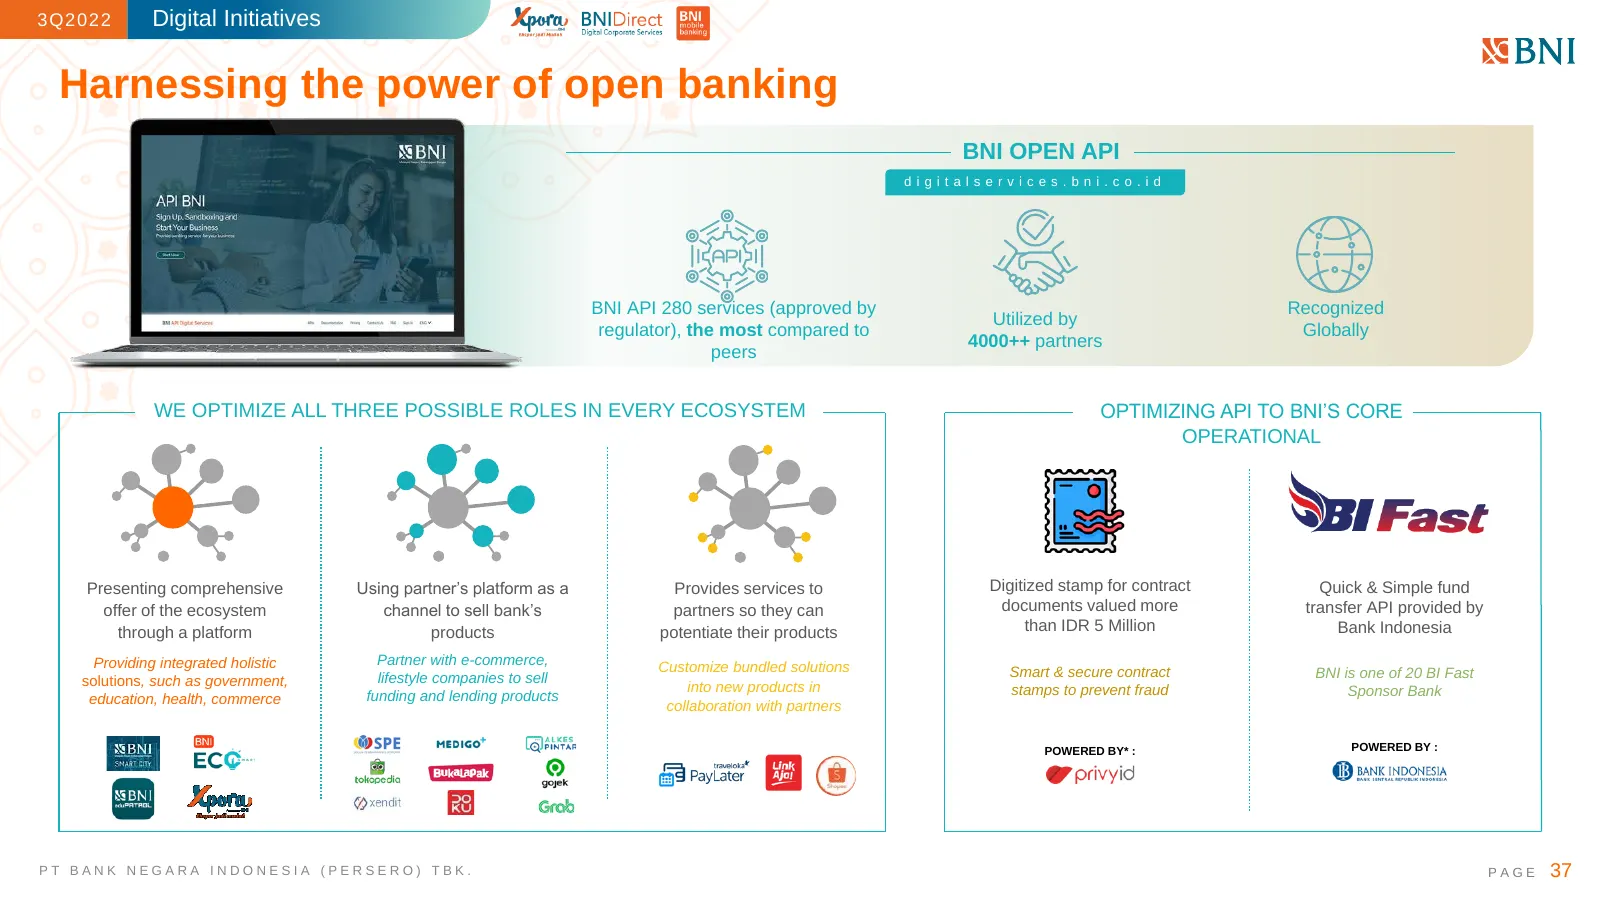
3Q2022 Digital Initiatives Harnessing the power of open banking BNI OPEN API digitalservices.bni.co.id BNI API 280 services (approved by Recognized Utilized by regulator), the most compared to Globally 4000++ partners peers WE OPTIMIZE ALL THREE POSSIBLE ROLES IN EVERY ECOSYSTEM OPTIMIZING API TO BN
Slide 38: Solid Digital Solutions for Business Banking Clients
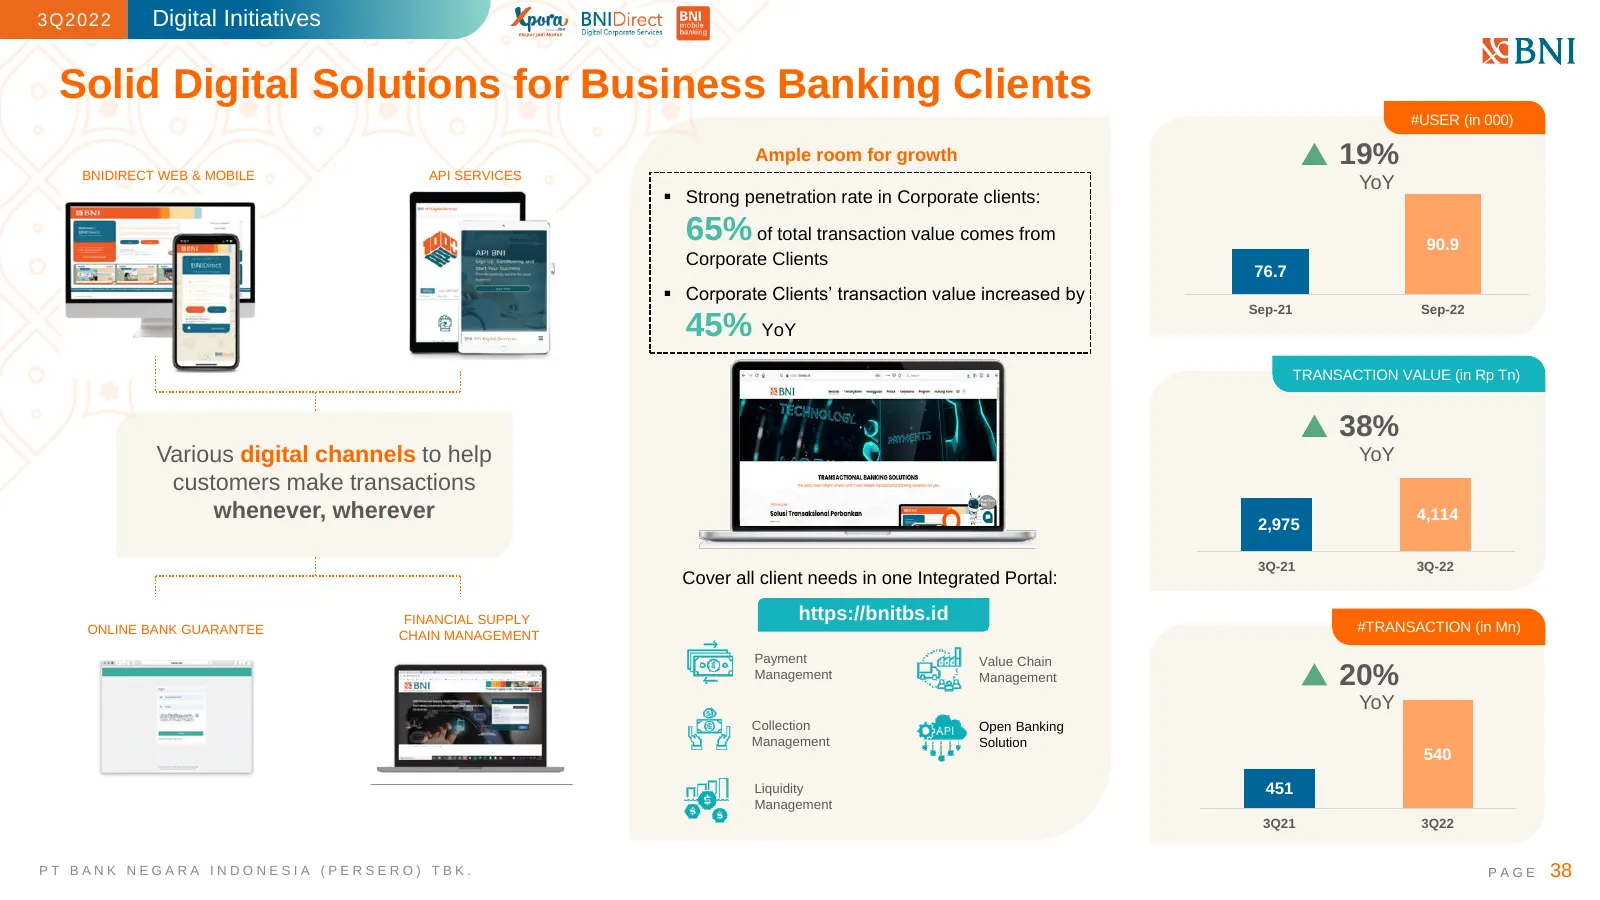
3Q2022 Digital Initiatives Solid Digital Solutions for Business Banking Clients #USER (in 000) Ample room for growth 19% BNIDIRECT WEB & MOBILE API SERVICES YoY ▪ Strong penetration rate in Corporate clients: 65% of total transaction value comes from 90.9 Corporate Clients 76.7 ▪ Corporate Clients’
Slide 39: Riding The Wave of E-commerce & Fintech Boom
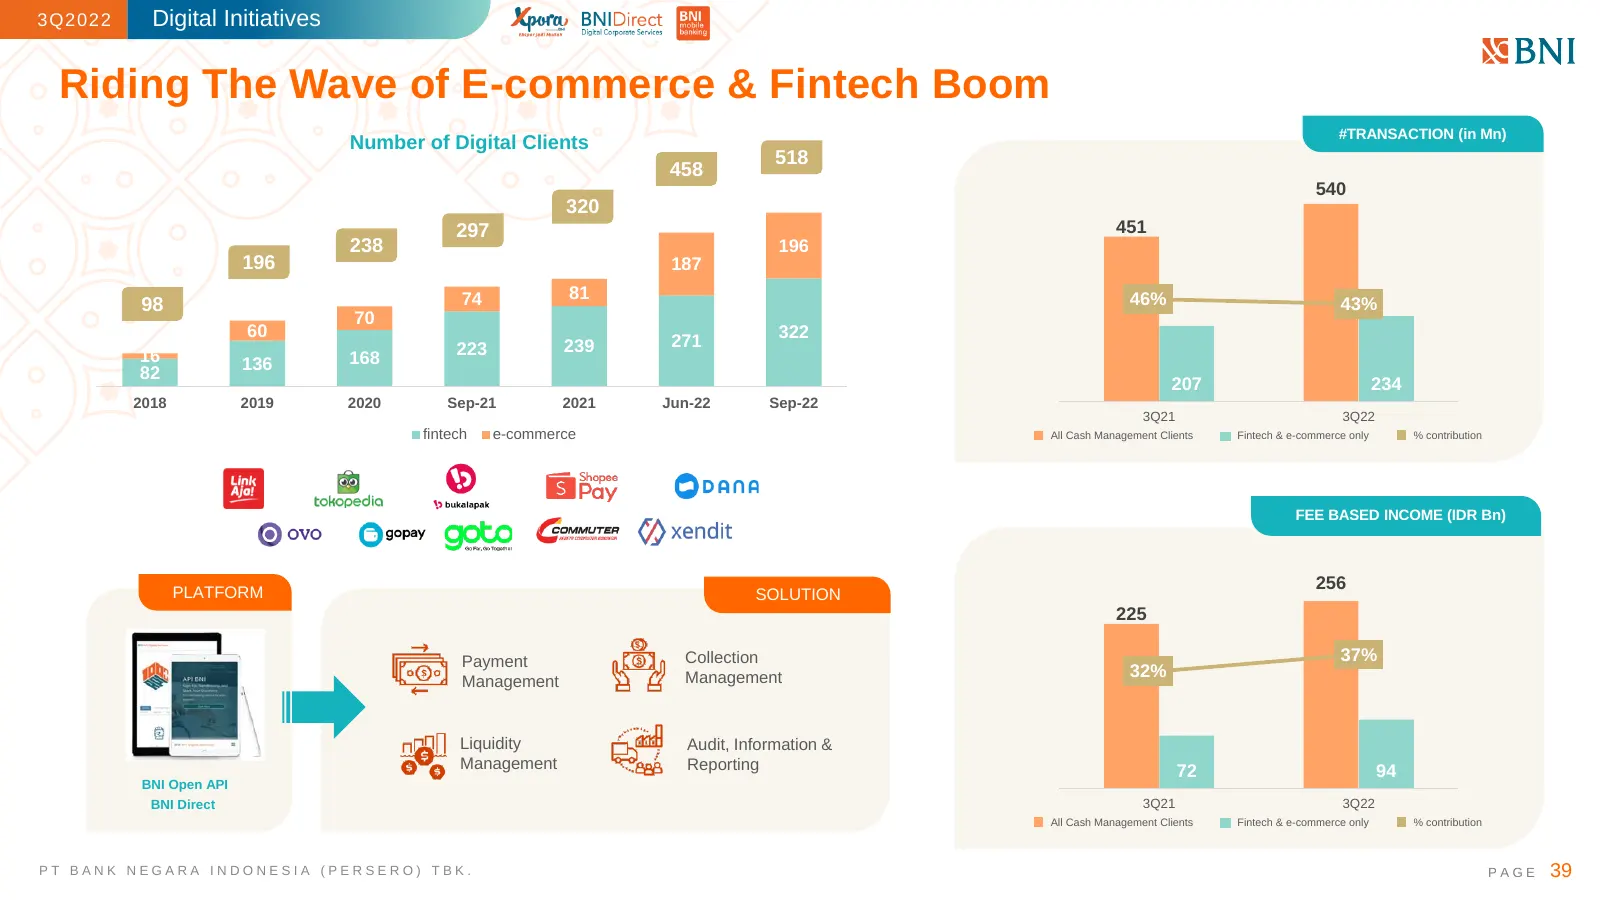
3Q2022 Digital Initiatives Riding The Wave of E-commerce & Fintech Boom #TRANSACTION (in Mn) Number of Digital Clients 518 458 540 320 297 451 238 196 196 187 74 81 46% 98 43% 70 60 322 223 239 271 16 136 168 82 207 234 2018 2019 2020 Sep-21 2021 Jun-22 Sep-22 3Q21 3Q22 fintech e-commerce All Cash M
Slide 40: Reliable transaction solution leads to a sticky relationship
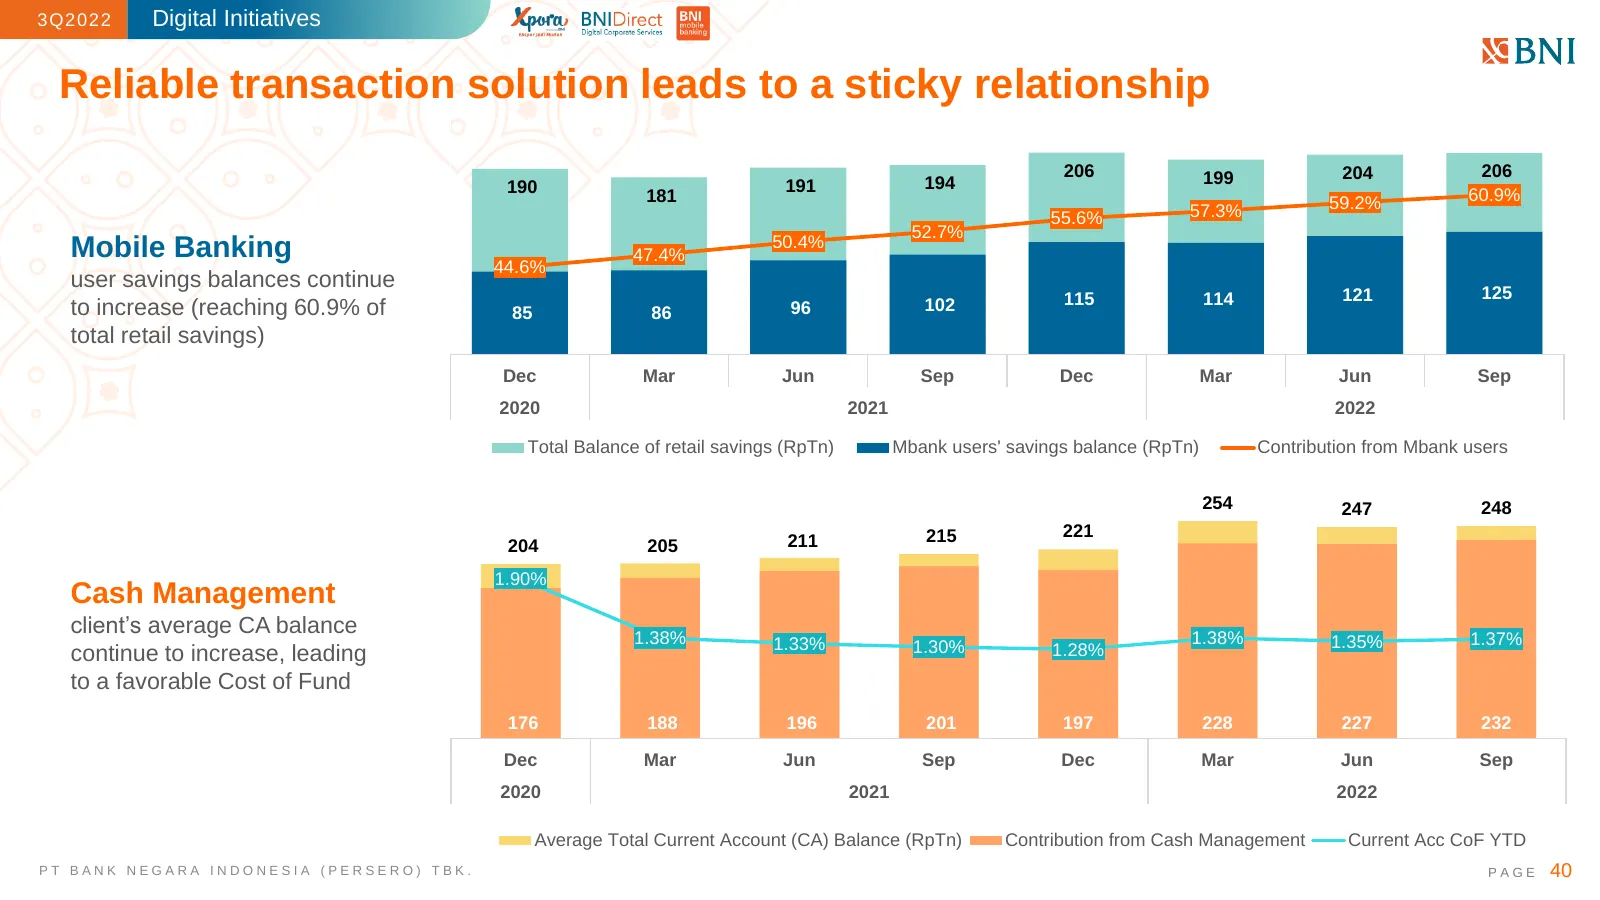
3Q2022 Digital Initiatives Reliable transaction solution leads to a sticky relationship 206 199 204 206 190 191 194 181 59.2% 60.9% 55.6% 57.3% 52.7% 50.4% Mobile Banking 47.4% 44.6% user savings balances continue 115 114 121 125 to increase (reaching 60.9% of 85 86 96 102 total retail savings) Dec
Slide 41: Business and Consumer Banking
3Q2022 Business and Consumer Banking PT BANK NEGARA INDONESIA (PERSERO) TBK. PAGE 41
Slide 42: High quality growth on business banking
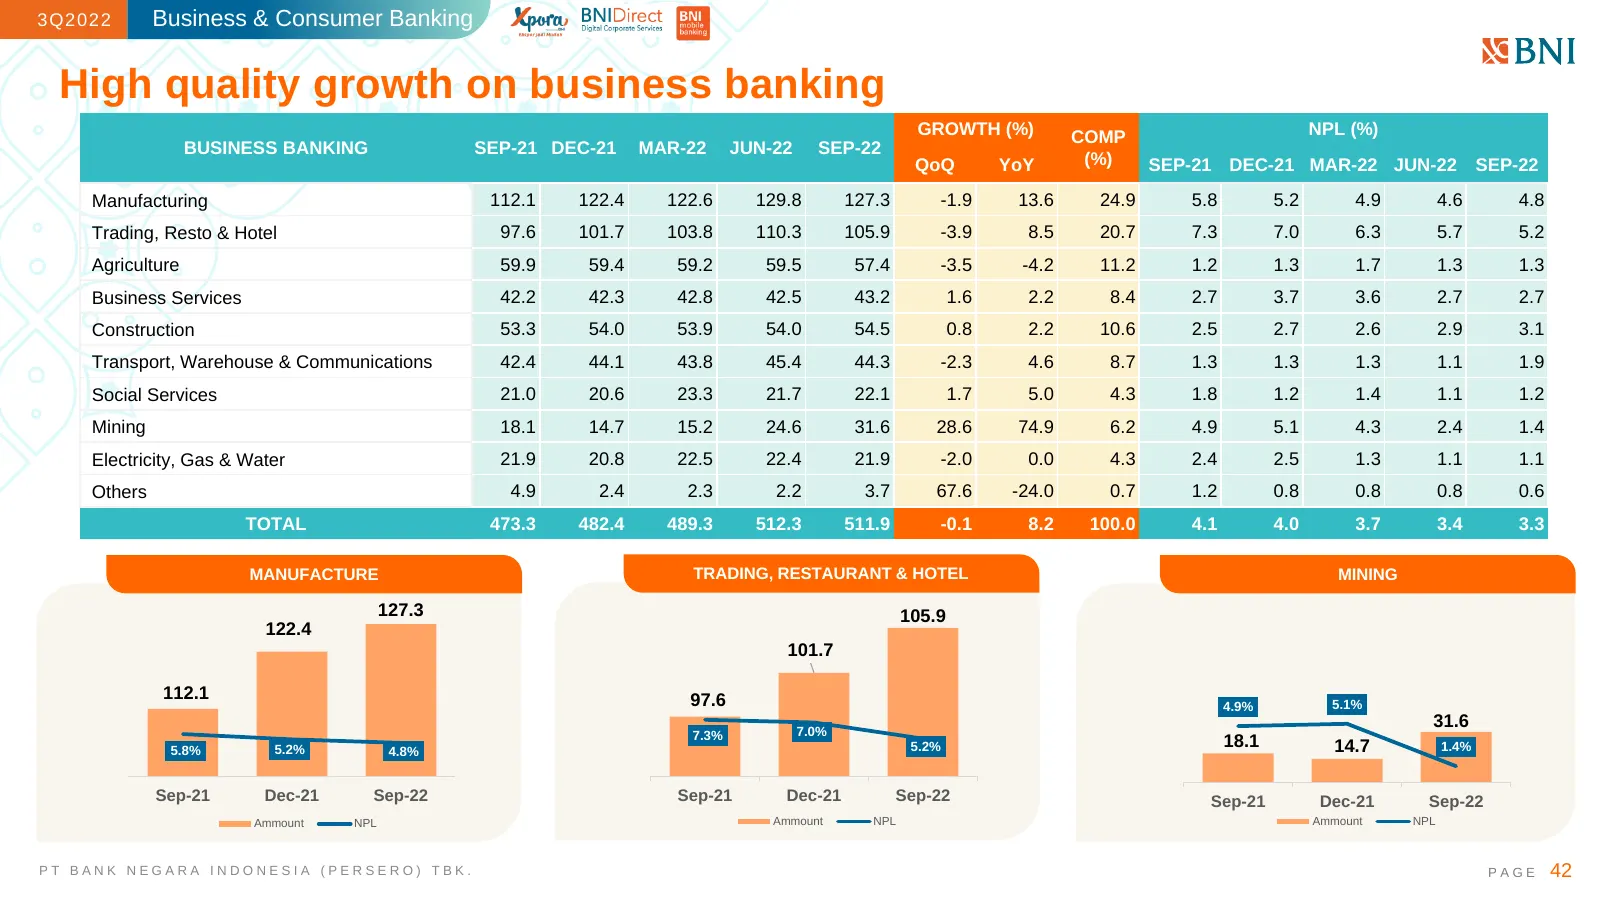
3Q2022 Business & Consumer Banking High quality growth on business banking GROWTH (%) COMP NPL (%) BUSINESS BANKING SEP-21 DEC-21 MAR-22 JUN-22 SEP-22 QoQ YoY (%) SEP-21 DEC-21 MAR-22 JUN-22 SEP-22 Manufacturing 112.1 122.4 122.6 129.8 127.3 -1.9 13.6 24.9 5.8 5.2 4.9 4.6 4.8 Trading, Resto & Hotel
Slide 43: Consumer Business
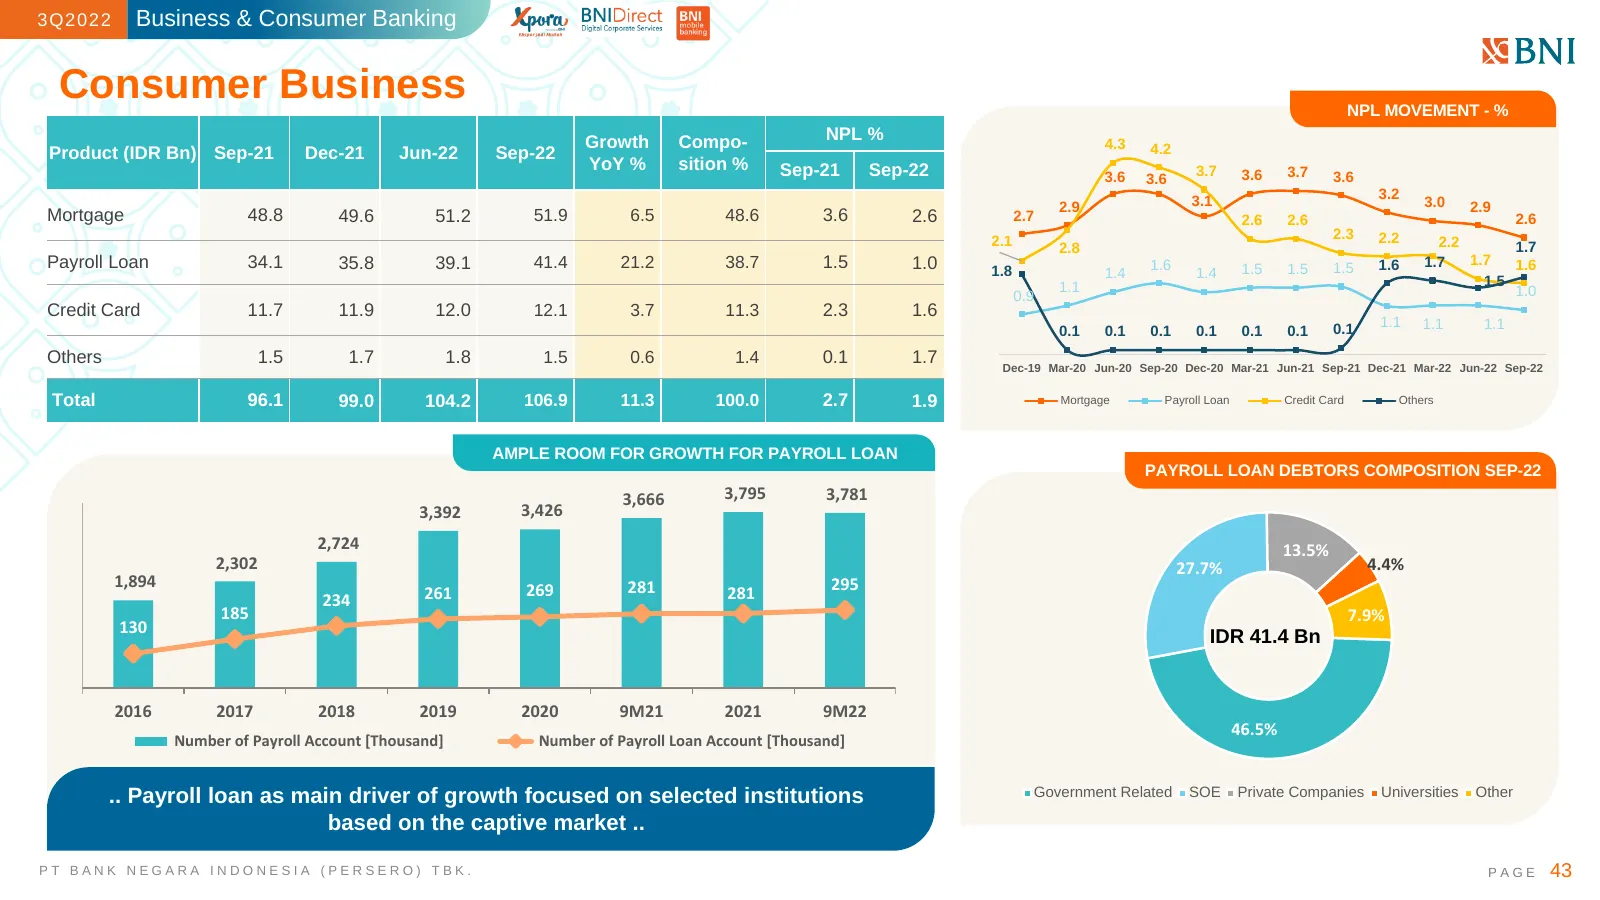
3Q2022 Business & Consumer Banking Consumer Business NPL MOVEMENT - % Growth Compo- NPL % 4.3 4.2 Product (IDR Bn) Sep-21 Dec-21 Jun-22 Sep-22 YoY % sition % Sep-21 Sep-22 3.7 3.7 3.6 3.6 3.6 3.6 3.1 3.2 2.9 3.0 2.9 Mortgage 48.8 49.6 51.2 51.9 6.5 48.6 3.6 2.6 2.7 2.6 2.6 2.6 2.1 2.3 2.2 2.2 2.8 1.
Slide 44: Well-established brand and strong consumer banking franchise
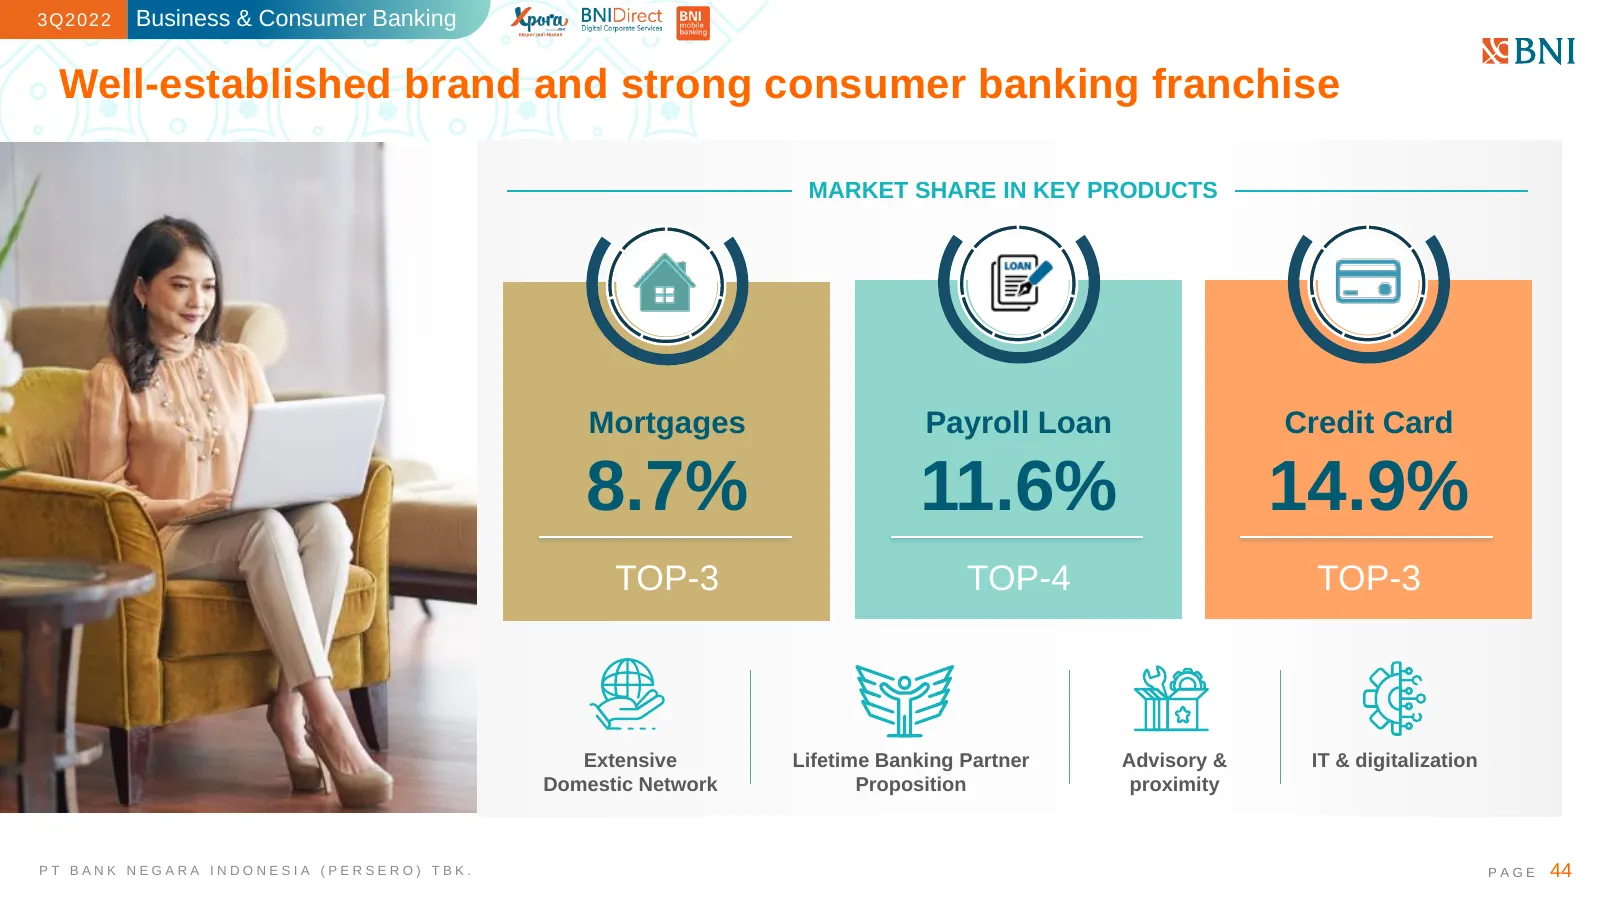
3Q2022 Business & Consumer Banking Well-established brand and strong consumer banking franchise MARKET SHARE IN KEY PRODUCTS Mortgages Payroll Loan Credit Card 8.7% 11.6% 14.9% TOP-3 TOP-4 TOP-3 Extensive Lifetime Banking Partner Advisory & IT & digitalization Domestic Network Proposition proximity

Slide 45: ESG
3Q2022 ESG PT BANK NEGARA INDONESIA (PERSERO) TBK. PAGE 45
Slide 46: Best In Class ESG
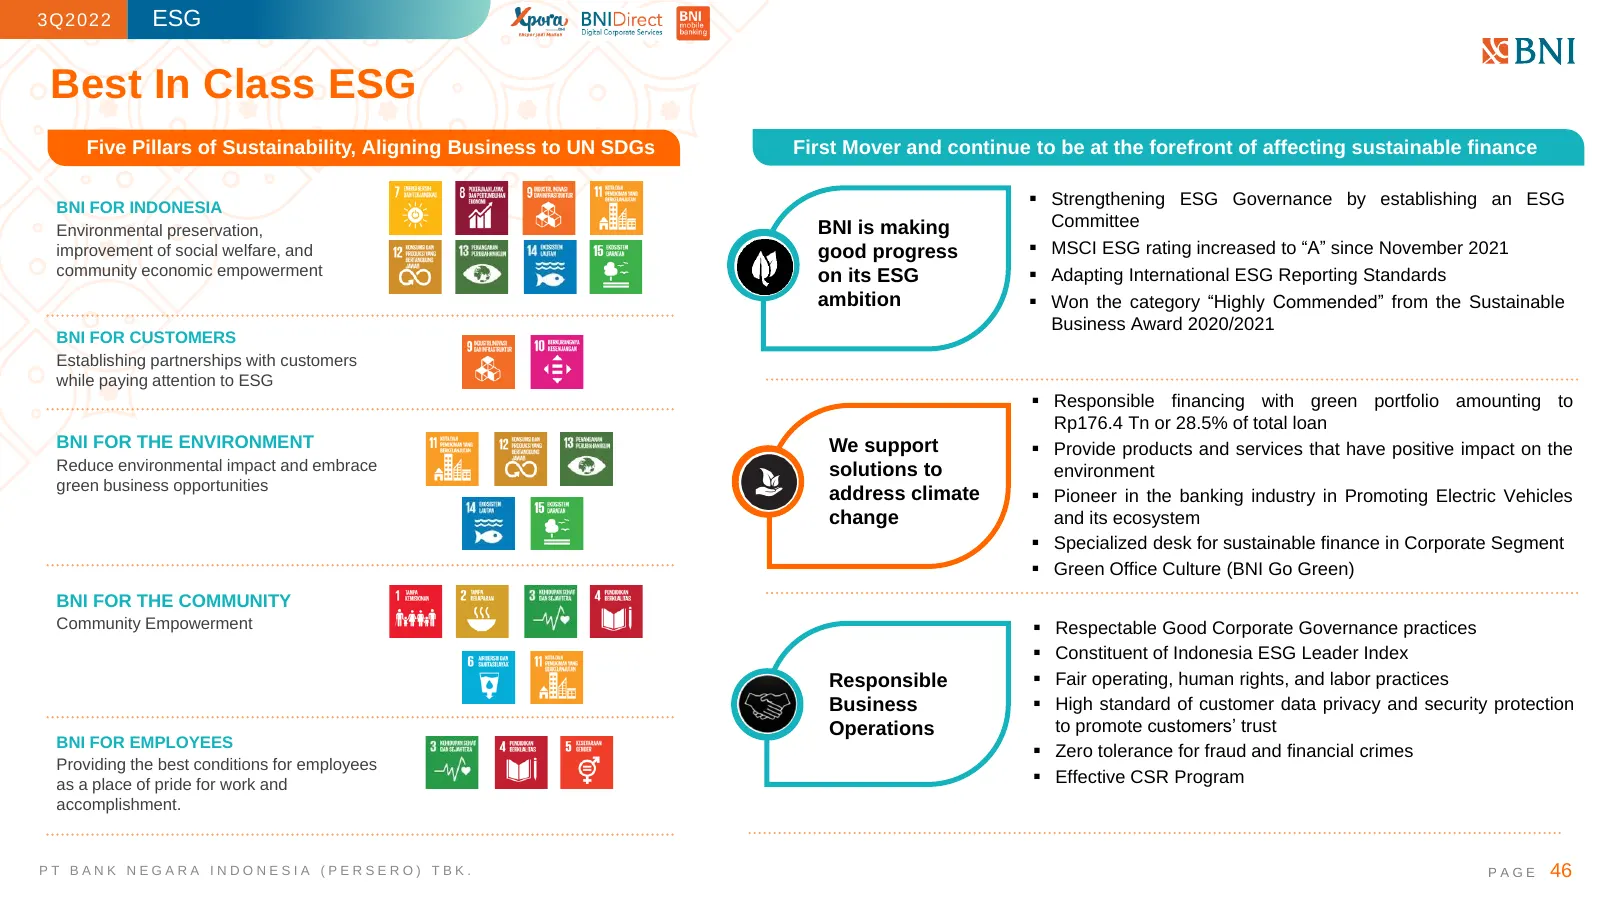
3Q2022 ESG Best In Class ESG Five Pillars of Sustainability, Aligning Business to UN SDGs First Mover and continue to be at the forefront of affecting sustainable finance BNI FOR INDONESIA ▪ Strengthening ESG Governance by establishing an ESG Environmental preservation, BNI is making Committee impro
Slide 47: Pioneer in green banking: first Rupiah green bonds
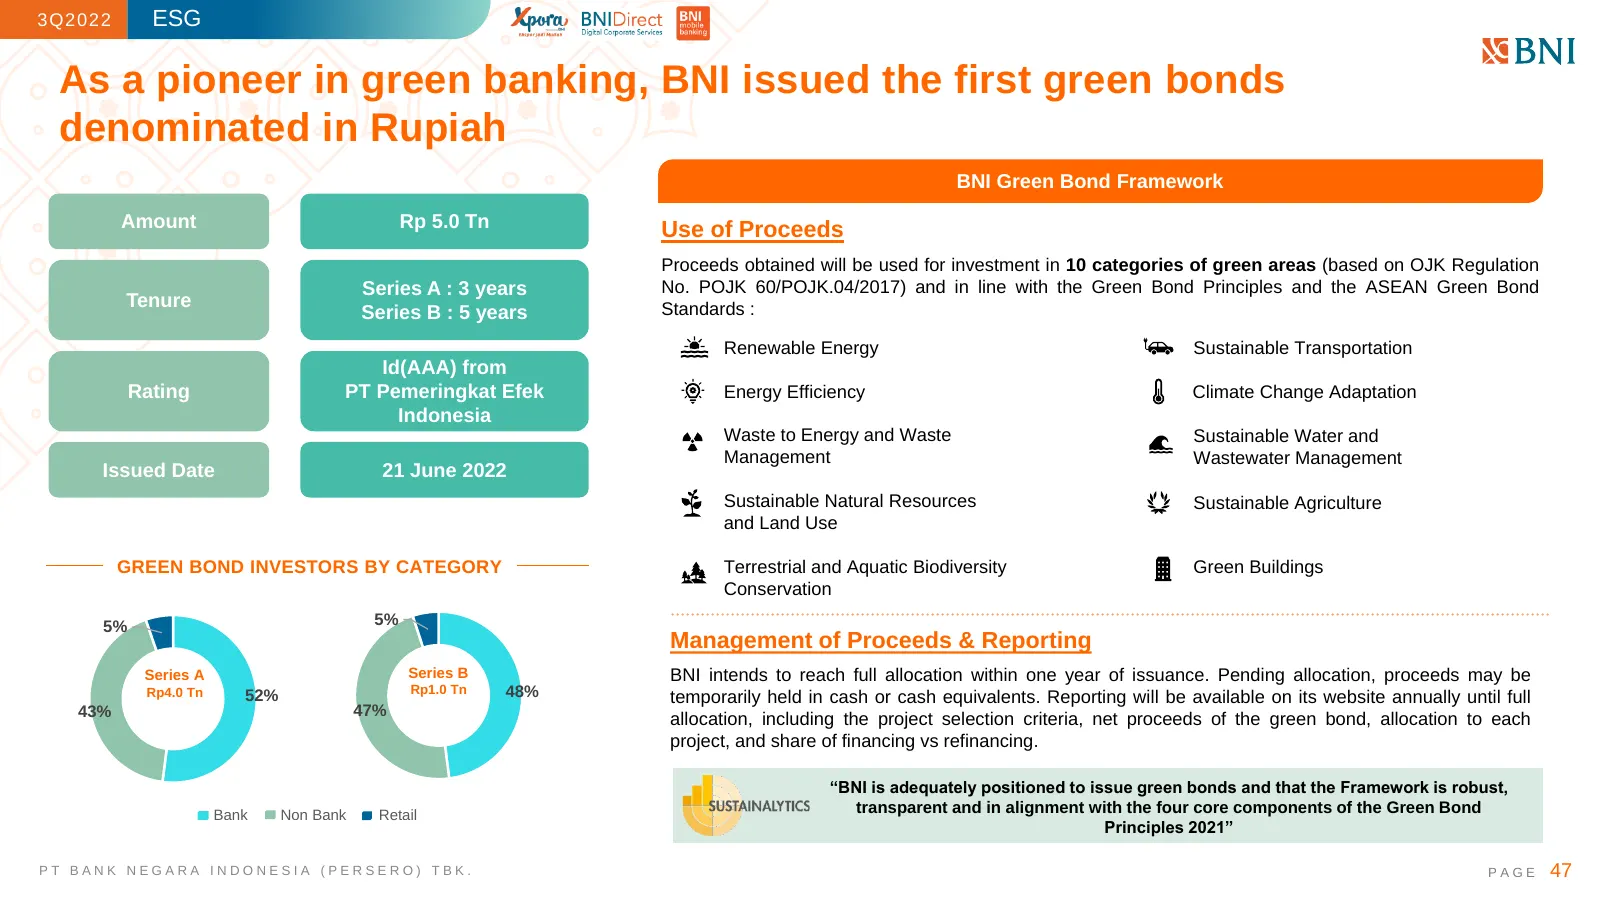
3Q2022 ESG As a pioneer in green banking, BNI issued the first green bonds denominated in Rupiah BNI Green Bond Framework Amount Rp 5.0 Tn Use of Proceeds Proceeds obtained will be used for investment in 10 categories of green areas (based on OJK Regulation Series A : 3 years No. POJK 60/POJK.04/201
Slide 48: Sustainable Portfolio
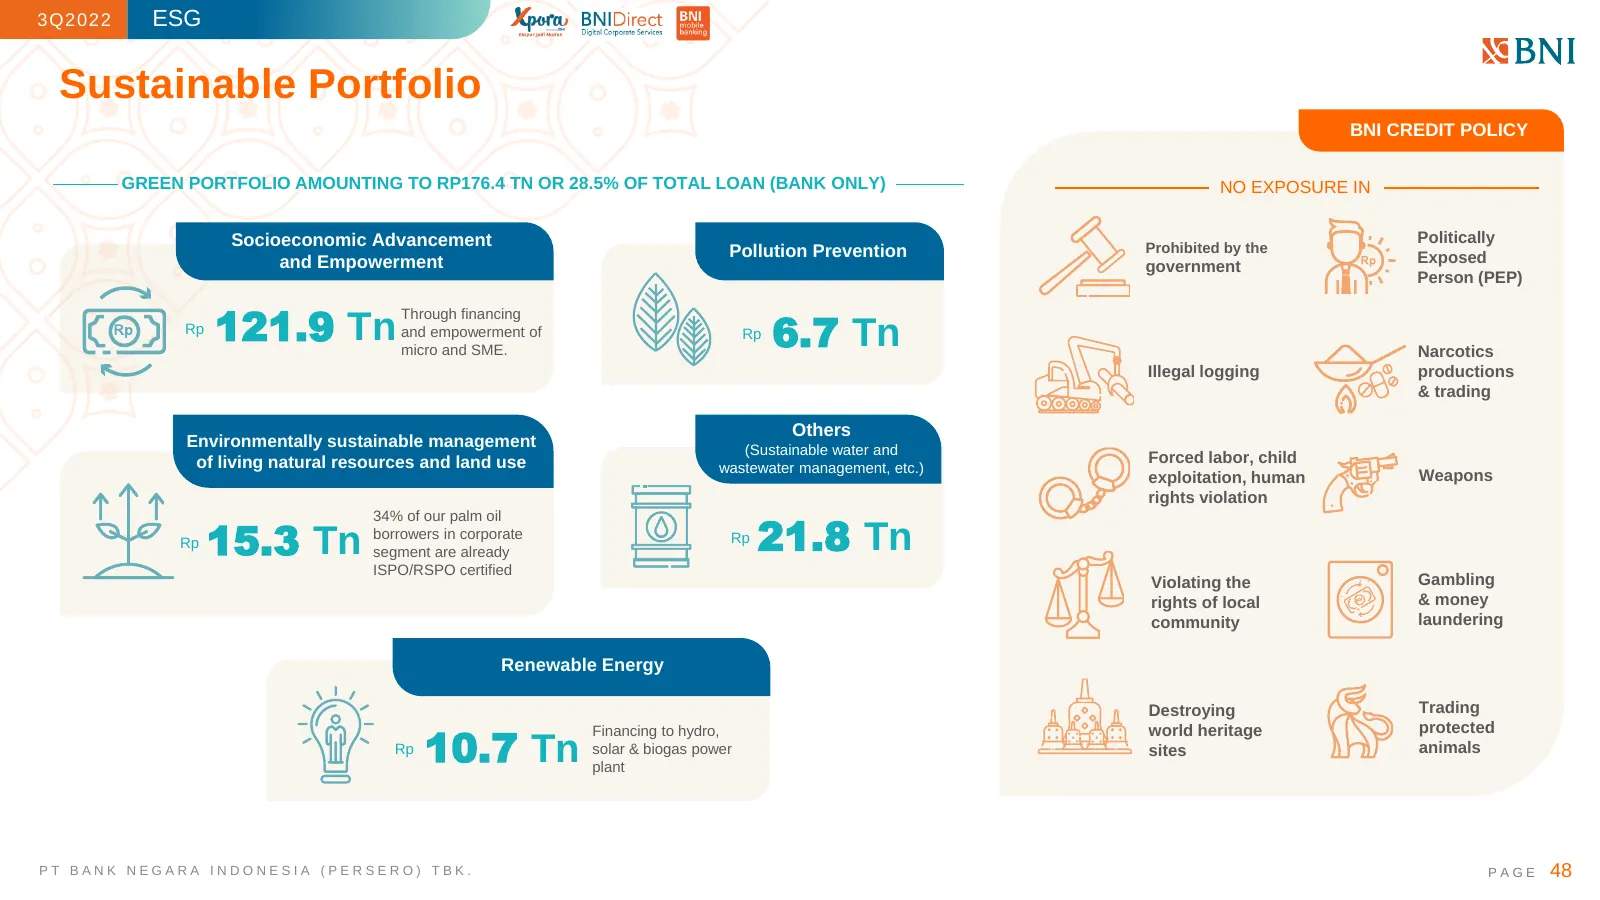
3Q2022 ESG Sustainable Portfolio BNI CREDIT POLICY GREEN PORTFOLIO AMOUNTING TO RP176.4 TN OR 28.5% OF TOTAL LOAN (BANK ONLY) NO EXPOSURE IN Socioeconomic Advancement Politically Pollution Prevention Prohibited by the and Empowerment Exposed government Person (PEP) 121.9 Tn 6.7 Tn Through financing
Slide 49: Sector Guides of Responsible Financing
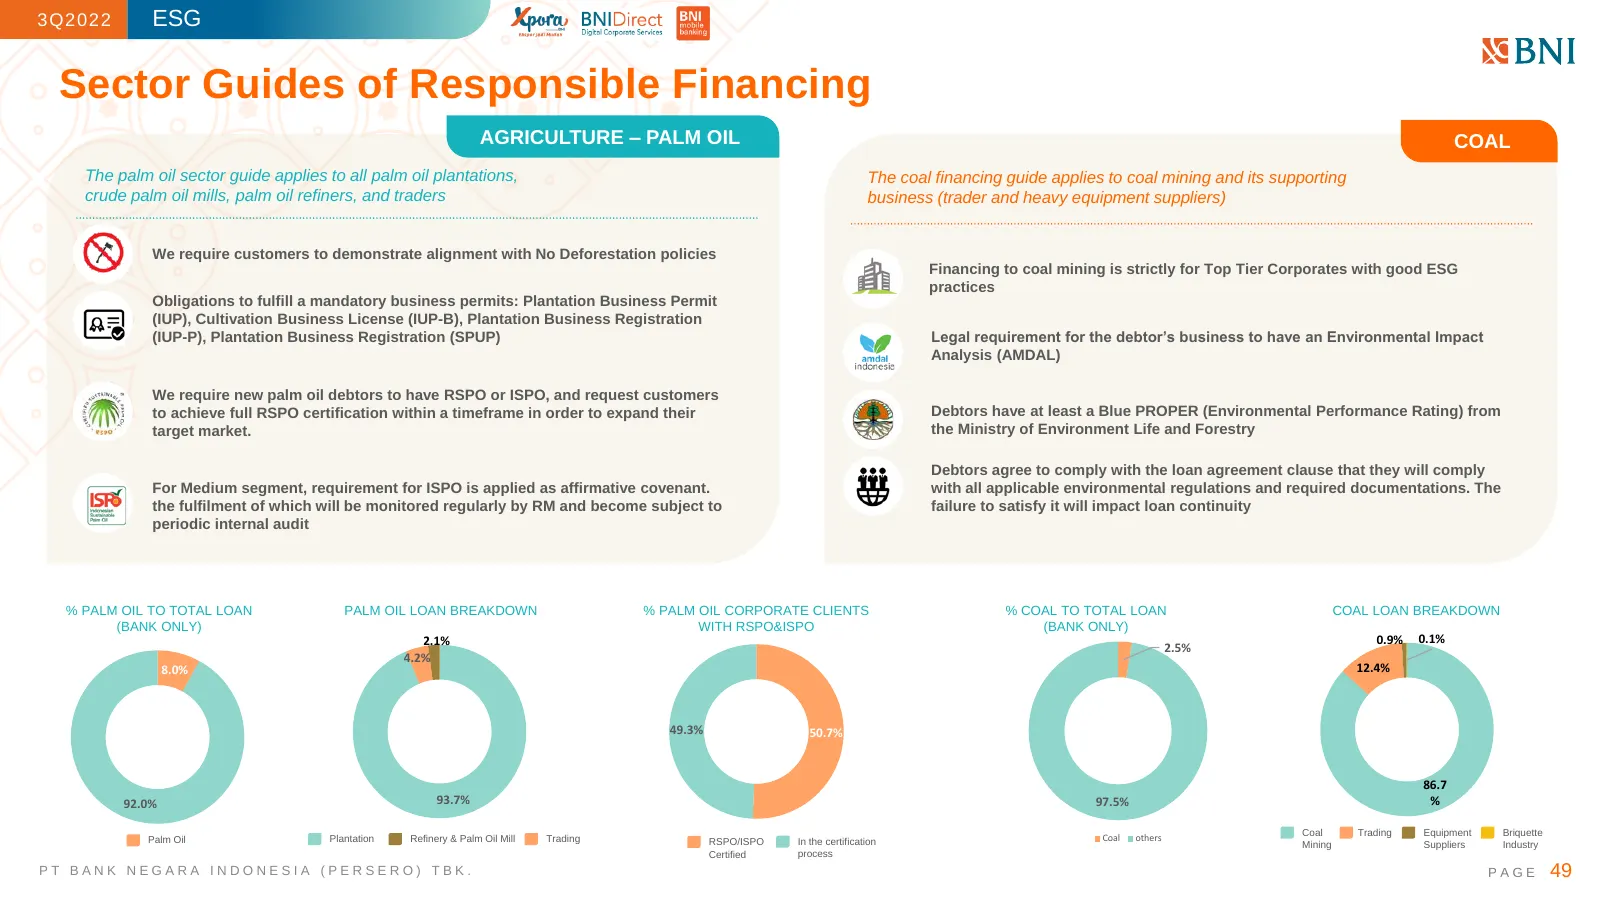
3Q2022 ESG Sector Guides of Responsible Financing AGRICULTURE – PALM OIL COAL The palm oil sector guide applies to all palm oil plantations, The coal financing guide applies to coal mining and its supporting crude palm oil mills, palm oil refiners, and traders business (trader and heavy equipment su
Slide 50: Best-in-class governance is a corporate priority
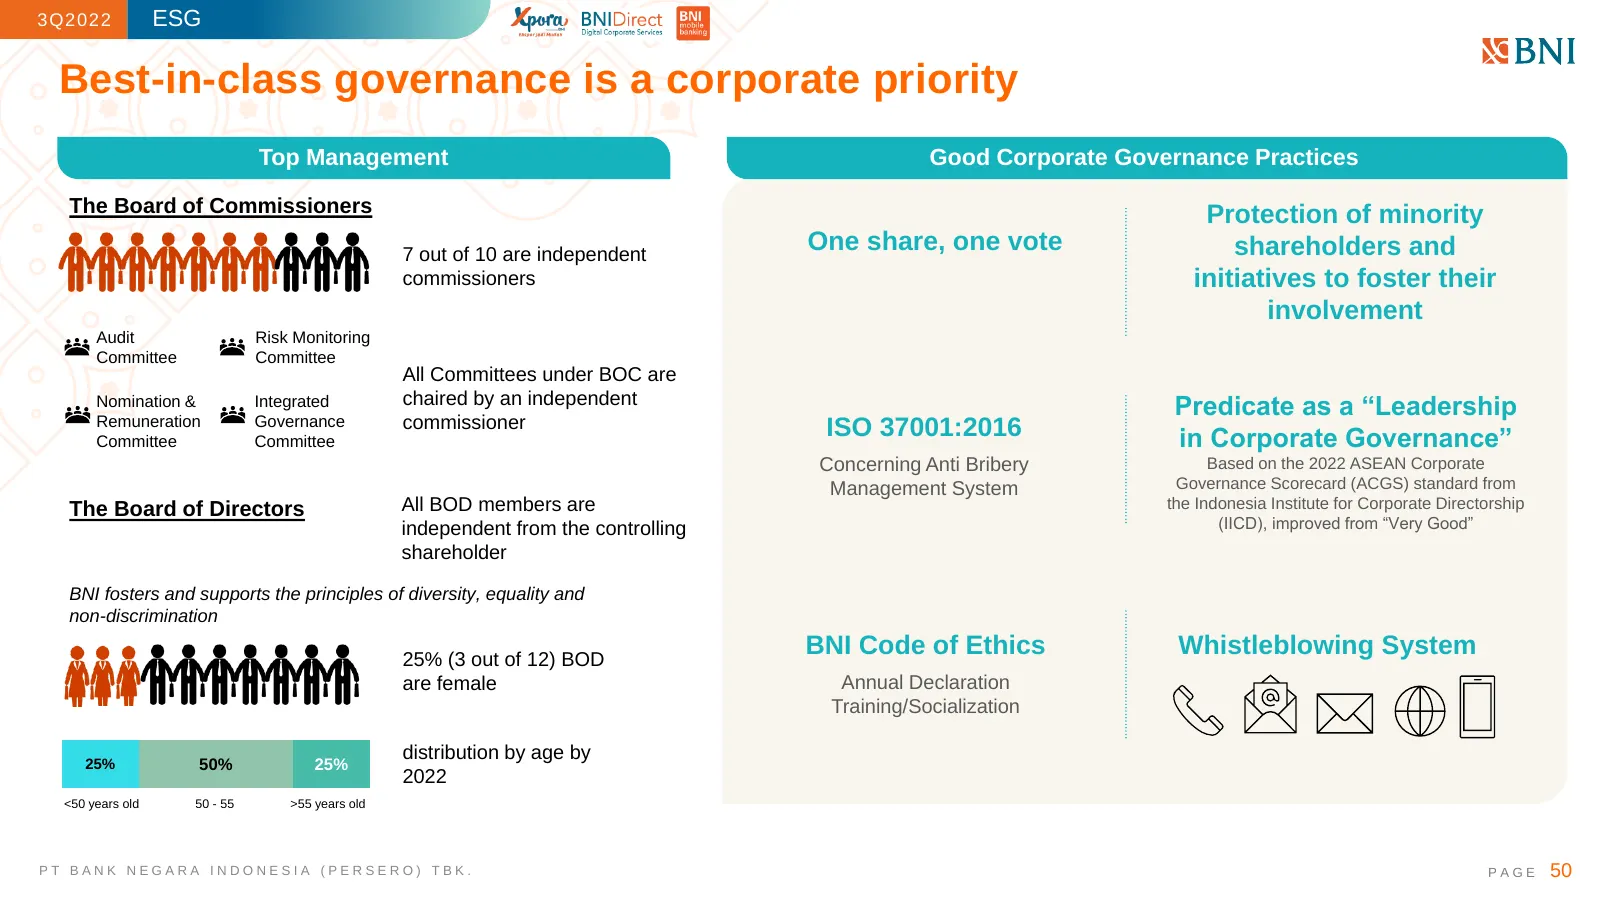
3Q2022 ESG Best-in-class governance is a corporate priority Top Management Good Corporate Governance Practices The Board of Commissioners Protection of minority 7 out of 10 are independent One share, one vote shareholders and commissioners initiatives to foster their involvement Audit Risk Monitorin
Slide 51: Embodying Sustainability Culture
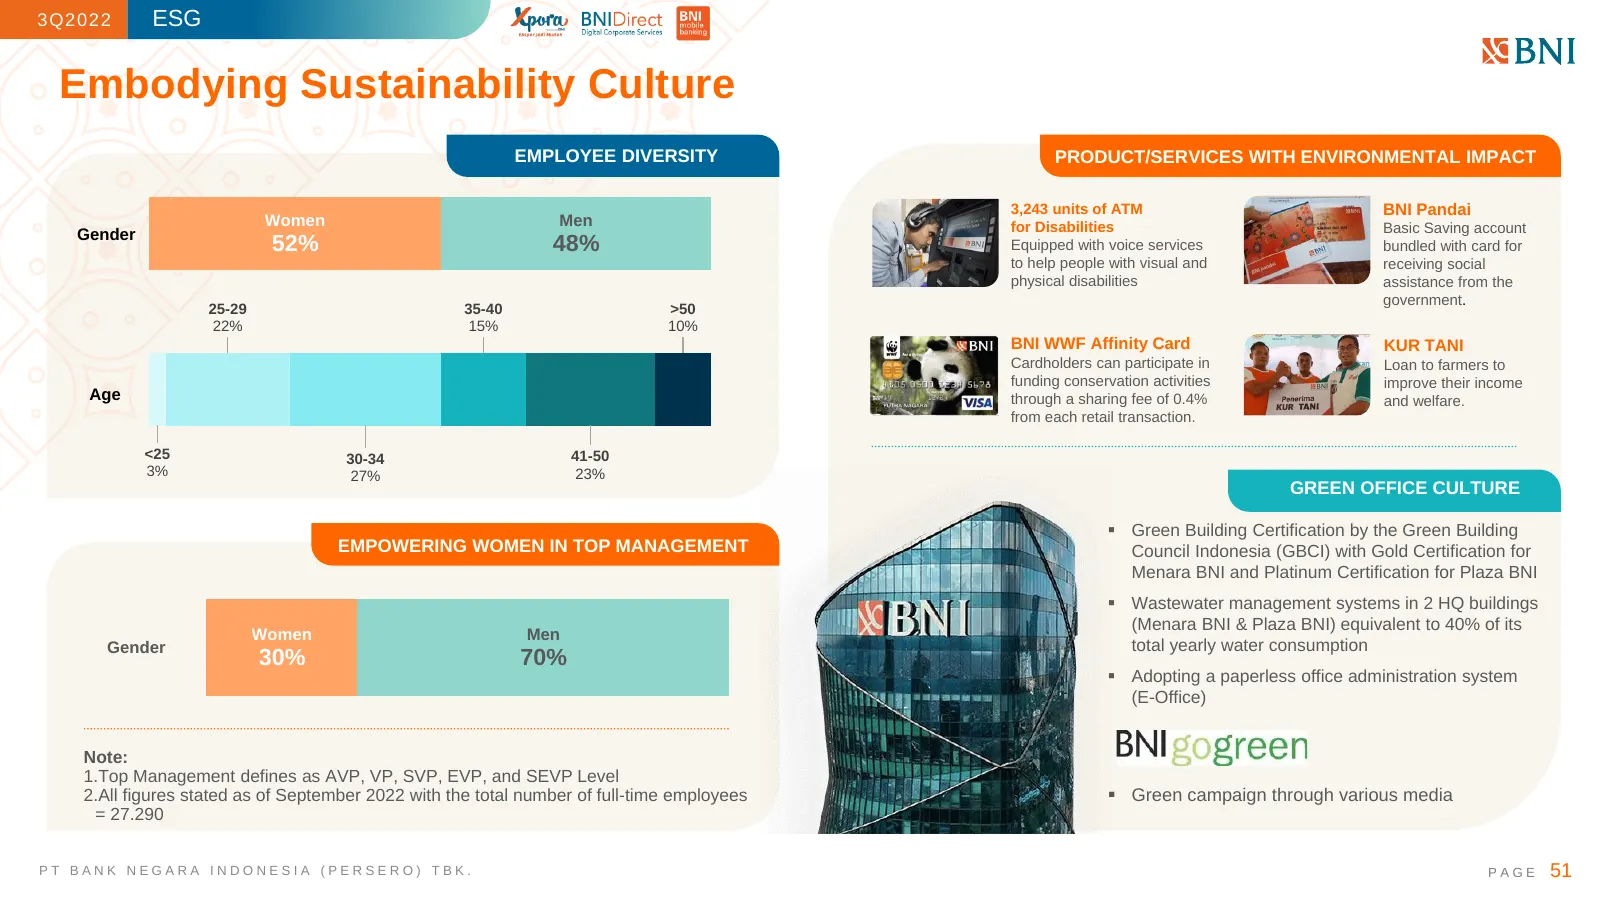
3Q2022 ESG Embodying Sustainability Culture EMPLOYEE DIVERSITY PRODUCT/SERVICES WITH ENVIRONMENTAL IMPACT 3,243 units of ATM BNI Pandai Women Men for Disabilities Basic Saving account Gender 52% 48% Equipped with voice services bundled with card for to help people with visual and receiving social ph
Slide 52: BNI Cybersecurity Framework
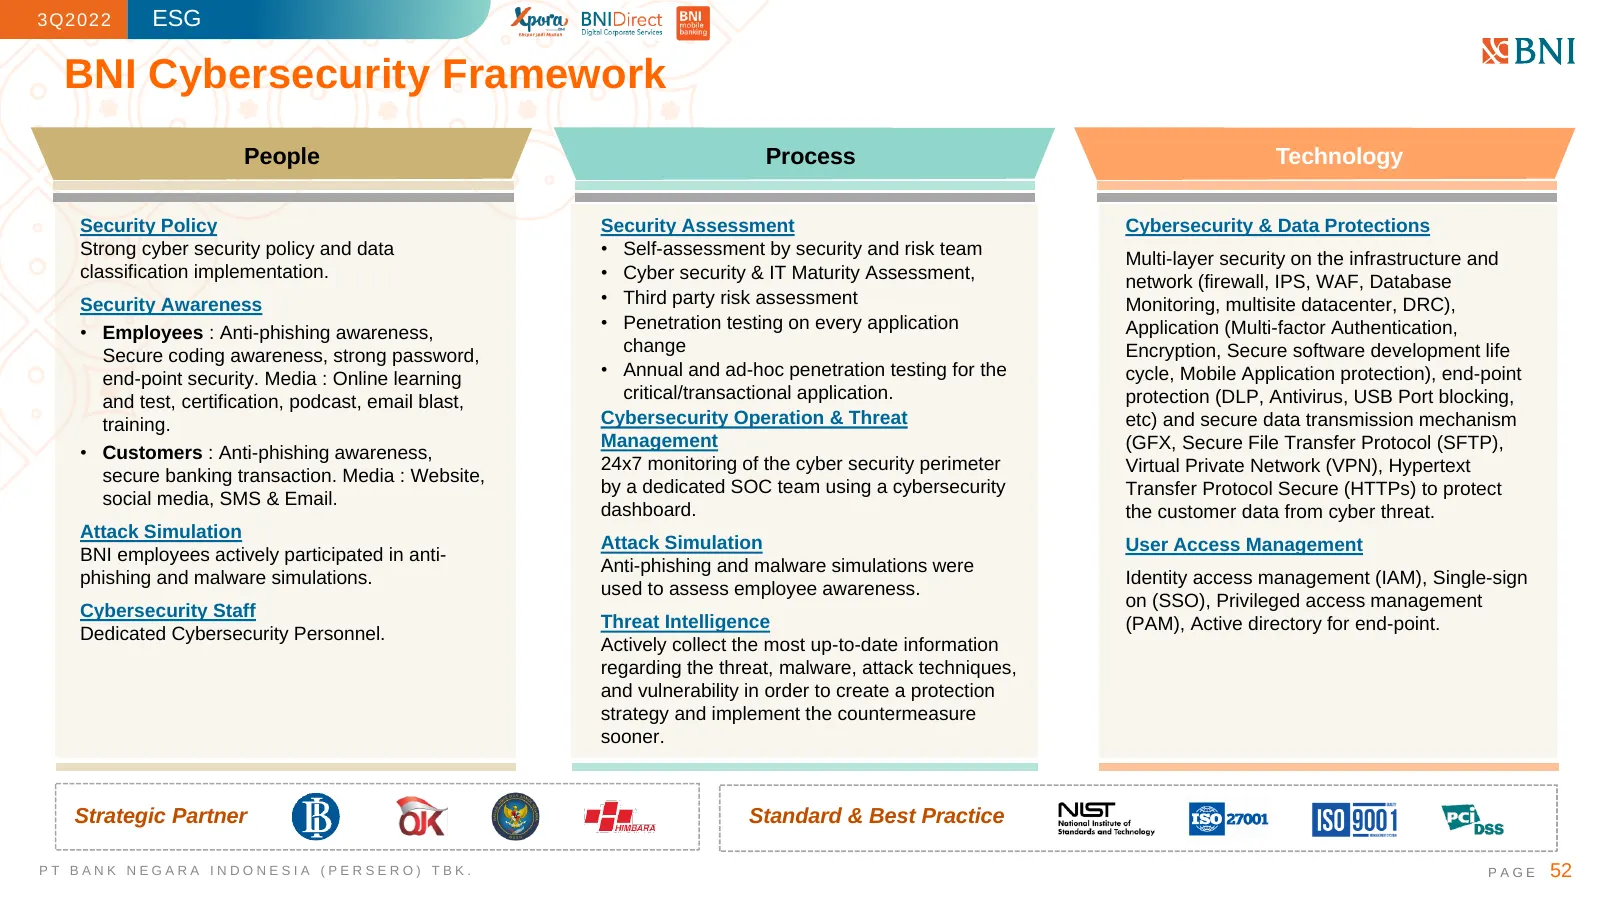
3Q2022 ESG BNI Cybersecurity Framework People Process Technology Security Policy Security Assessment Cybersecurity & Data Protections Strong cyber security policy and data • Self-assessment by security and risk team Multi-layer security on the infrastructure and classification implementation. • Cybe
Slide 53: External Recognition of Our Best-in-Class ESG Practices
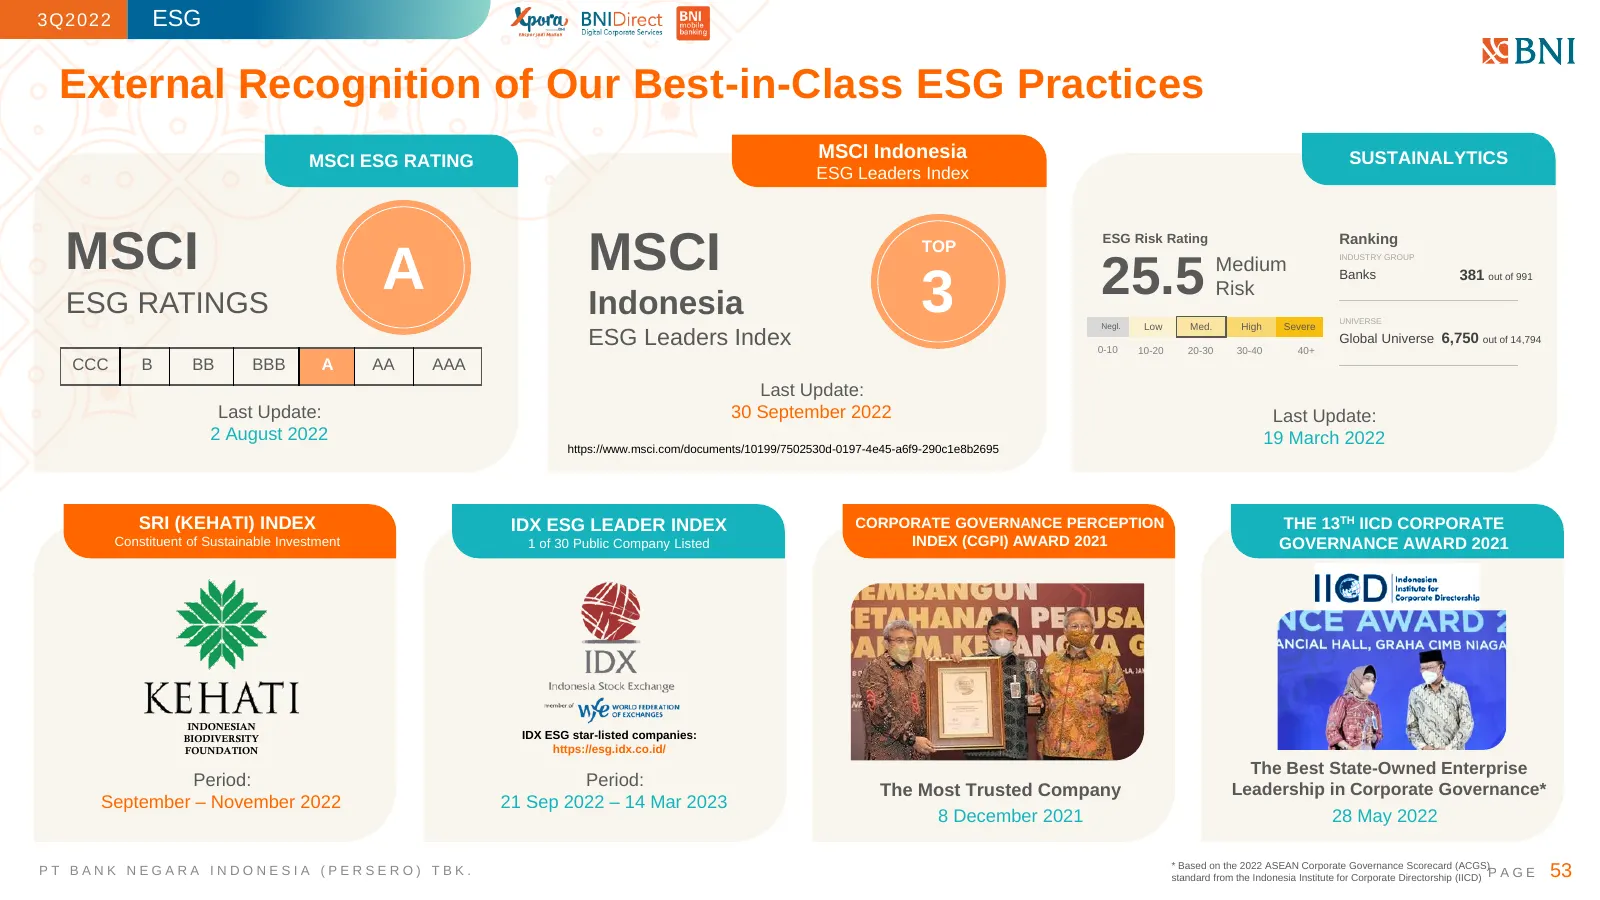
3Q2022 ESG External Recognition of Our Best-in-Class ESG Practices MSCI ESG RATING SUSTAINALYTICS MSCI Indonesia SUSTAINALYTICS ESG Leaders Index MSCI MSCI ESG Risk Rating Ranking TOP ESG RATINGS A Indonesia 3 25.5 Medium Risk INDUSTRY GROUP Banks 381 out of 991 UNIVERSE Negl. Low Med. High Severe E
Slide 54: About BNI
3Q2022 About BNI PT BANK NEGARA INDONESIA (PERSERO) TBK. PAGE 54
Slide 55: Board of Director
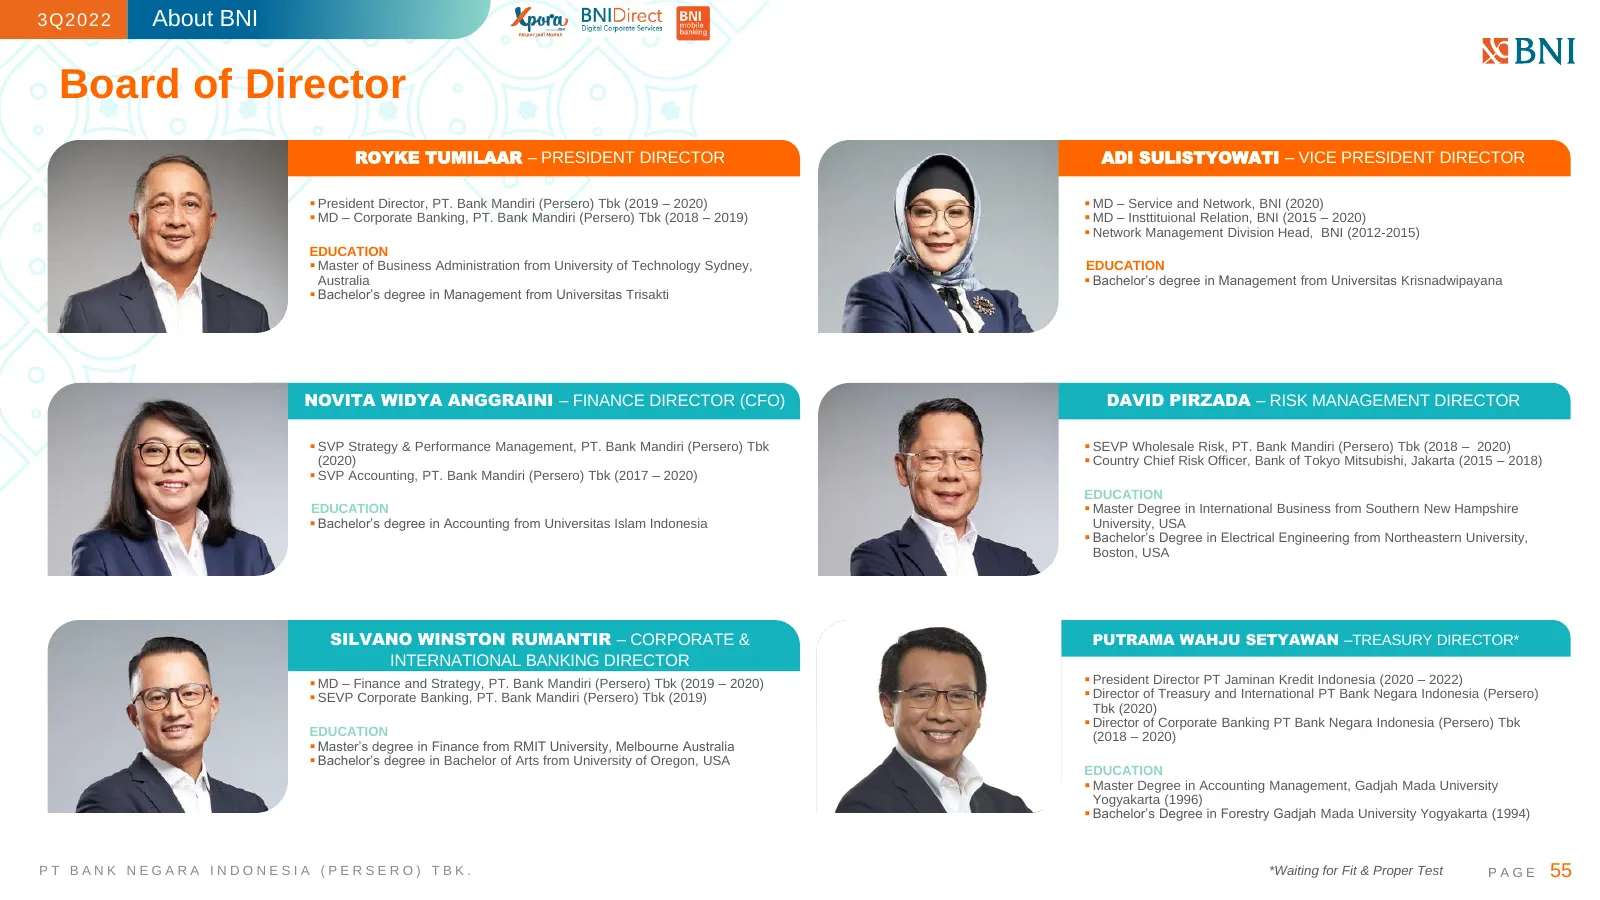
3Q2022 About BNI Board of Director ROYKE TUMILAAR – PRESIDENT DIRECTOR ADI SULISTYOWATI – VICE PRESIDENT DIRECTOR ▪ President Director, PT. Bank Mandiri (Persero) Tbk (2019 – 2020) ▪ MD – Service and Network, BNI (2020) ▪ MD – Corporate Banking, PT. Bank Mandiri (Persero) Tbk (2018 – 2019) ▪ MD – In
Slide 56: Board of Director
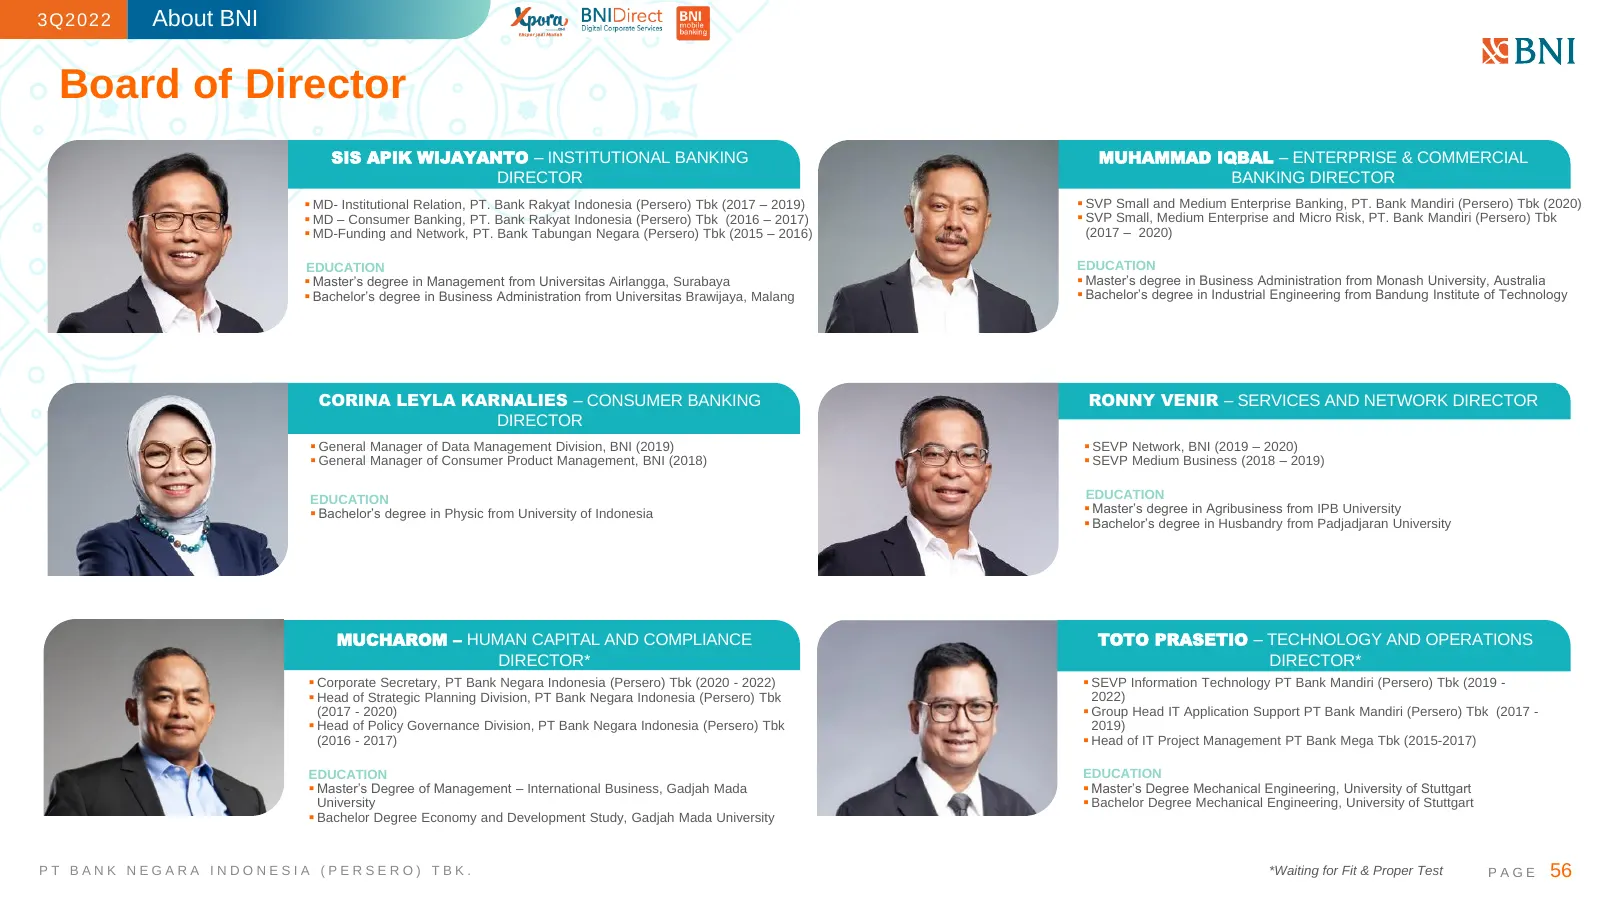
3Q2022 About BNI Board of Director SIS APIK WIJAYANTO – INSTITUTIONAL BANKING MUHAMMAD IQBAL – ENTERPRISE & COMMERCIAL DIRECTOR BANKING DIRECTOR ▪ MD- Institutional Relation, PT. Bank Rakyat Indonesia (Persero) Tbk (2017 – 2019) ▪ SVP Small and Medium Enterprise Banking, PT. Bank Mandiri (Persero) T
Slide 57: Board of Commissioners
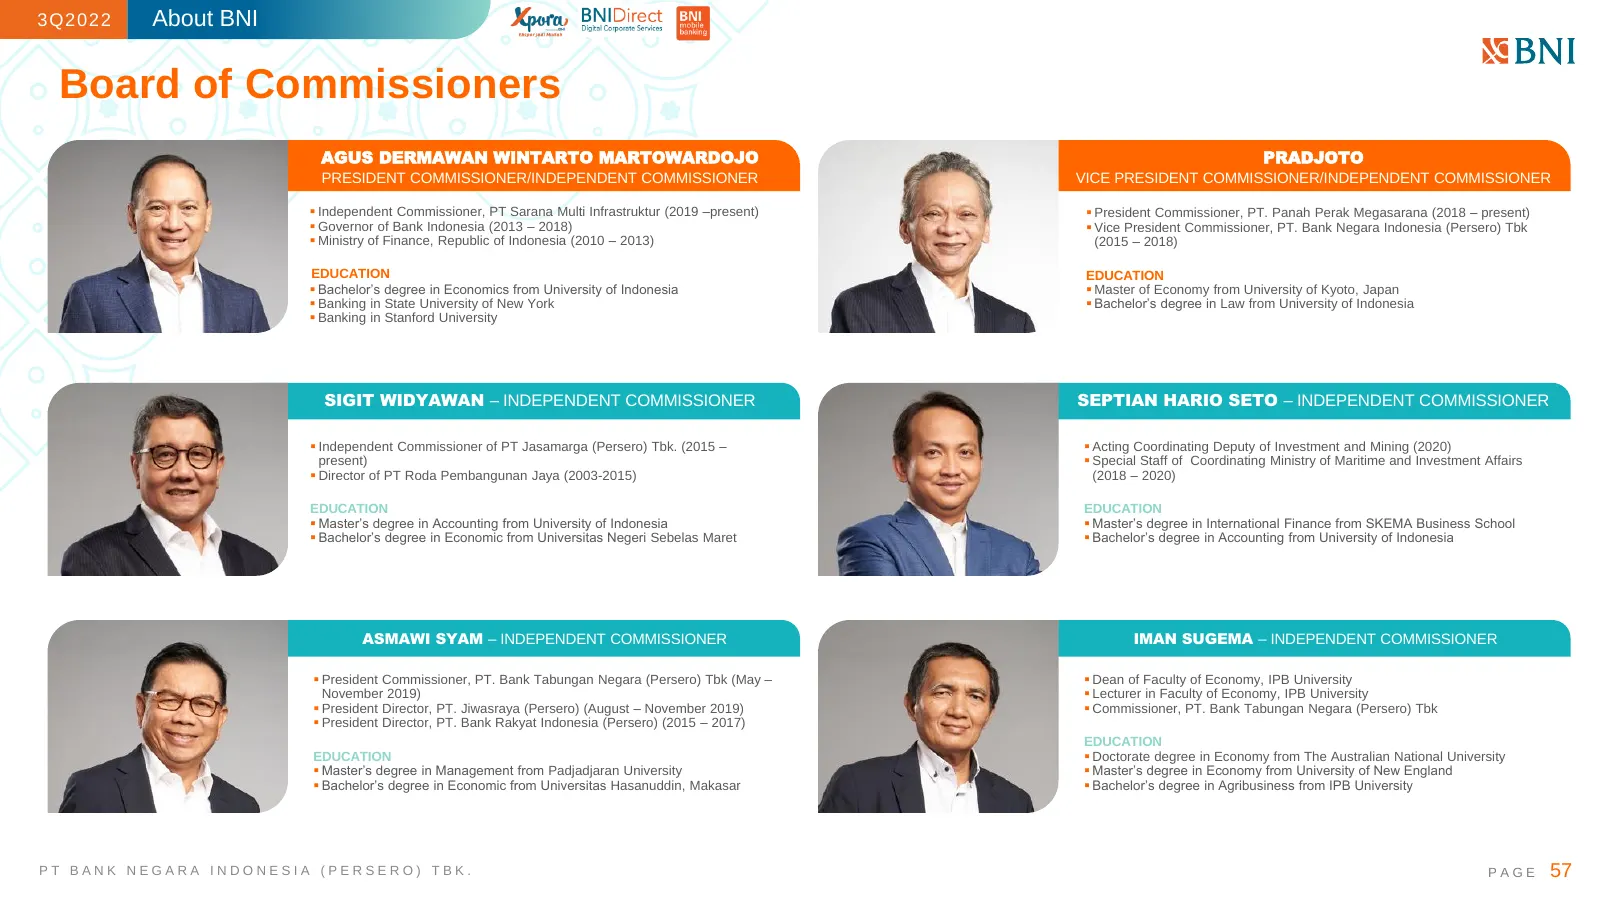
3Q2022 About BNI Board of Commissioners AGUS DERMAWAN WINTARTO MARTOWARDOJO PRADJOTO PRESIDENT COMMISSIONER/INDEPENDENT COMMISSIONER VICE PRESIDENT COMMISSIONER/INDEPENDENT COMMISSIONER ▪ Independent Commissioner, PT Sarana Multi Infrastruktur (2019 –present) ▪ President Commissioner, PT. Panah Pera
Slide 58: Board of Commissioners
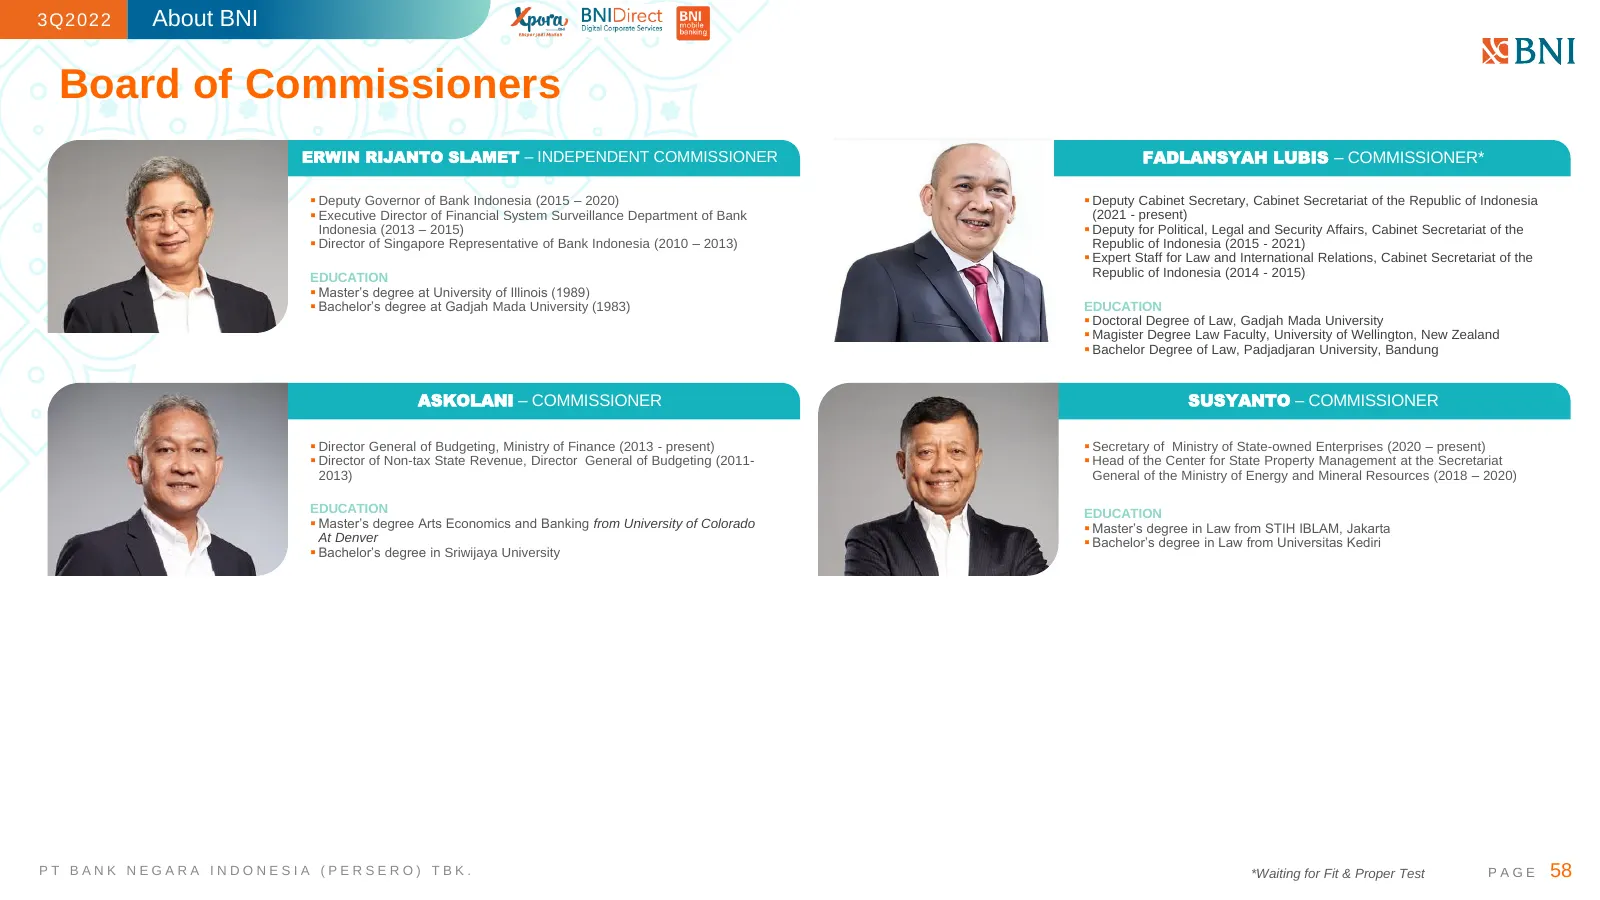
3Q2022 About BNI Board of Commissioners ERWIN RIJANTO SLAMET – INDEPENDENT COMMISSIONER FADLANSYAH LUBIS – COMMISSIONER* ▪ Deputy Governor of Bank Indonesia (2015 – 2020) ▪ Deputy Cabinet Secretary, Cabinet Secretariat of the Republic of Indonesia ▪ Executive Director of Financial System Surveillanc
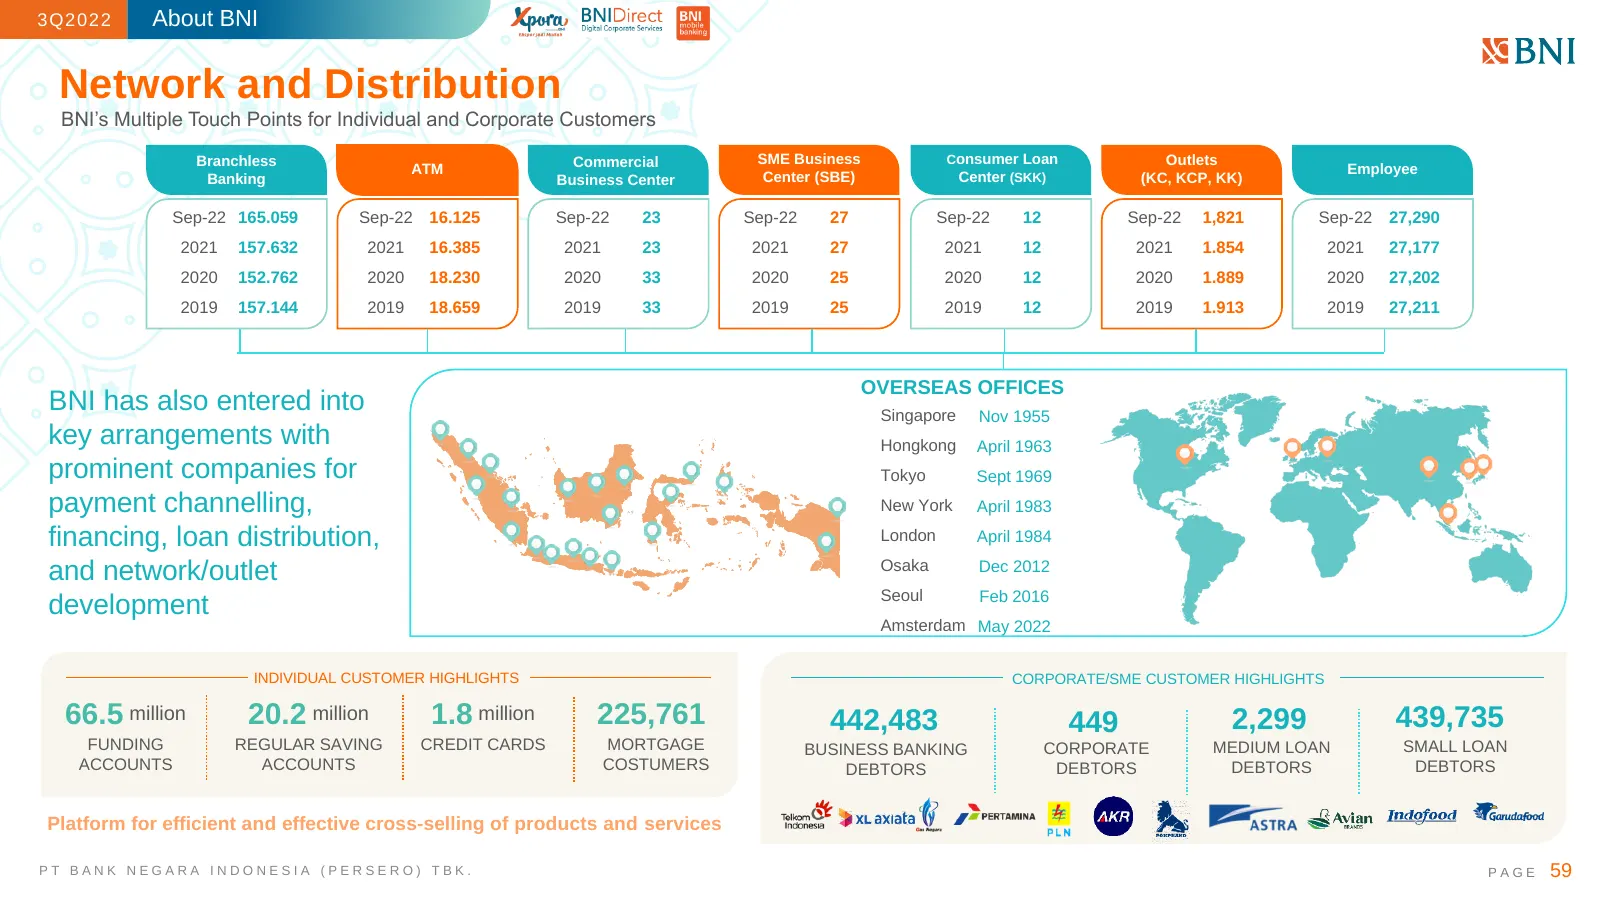
Slide 59: Network and Distribution
3Q2022 About BNI Network and Distribution BNI’s Multiple Touch Points for Individual and Corporate Customers Branchless Commercial SME Business Consumer Loan Outlets ATM Employee Banking Business Center Center (SBE) Center (SKK) (KC, KCP, KK) Sep-22 165.059 Sep-22 16.125 Sep-22 23 Sep-22 27 Sep-22 1
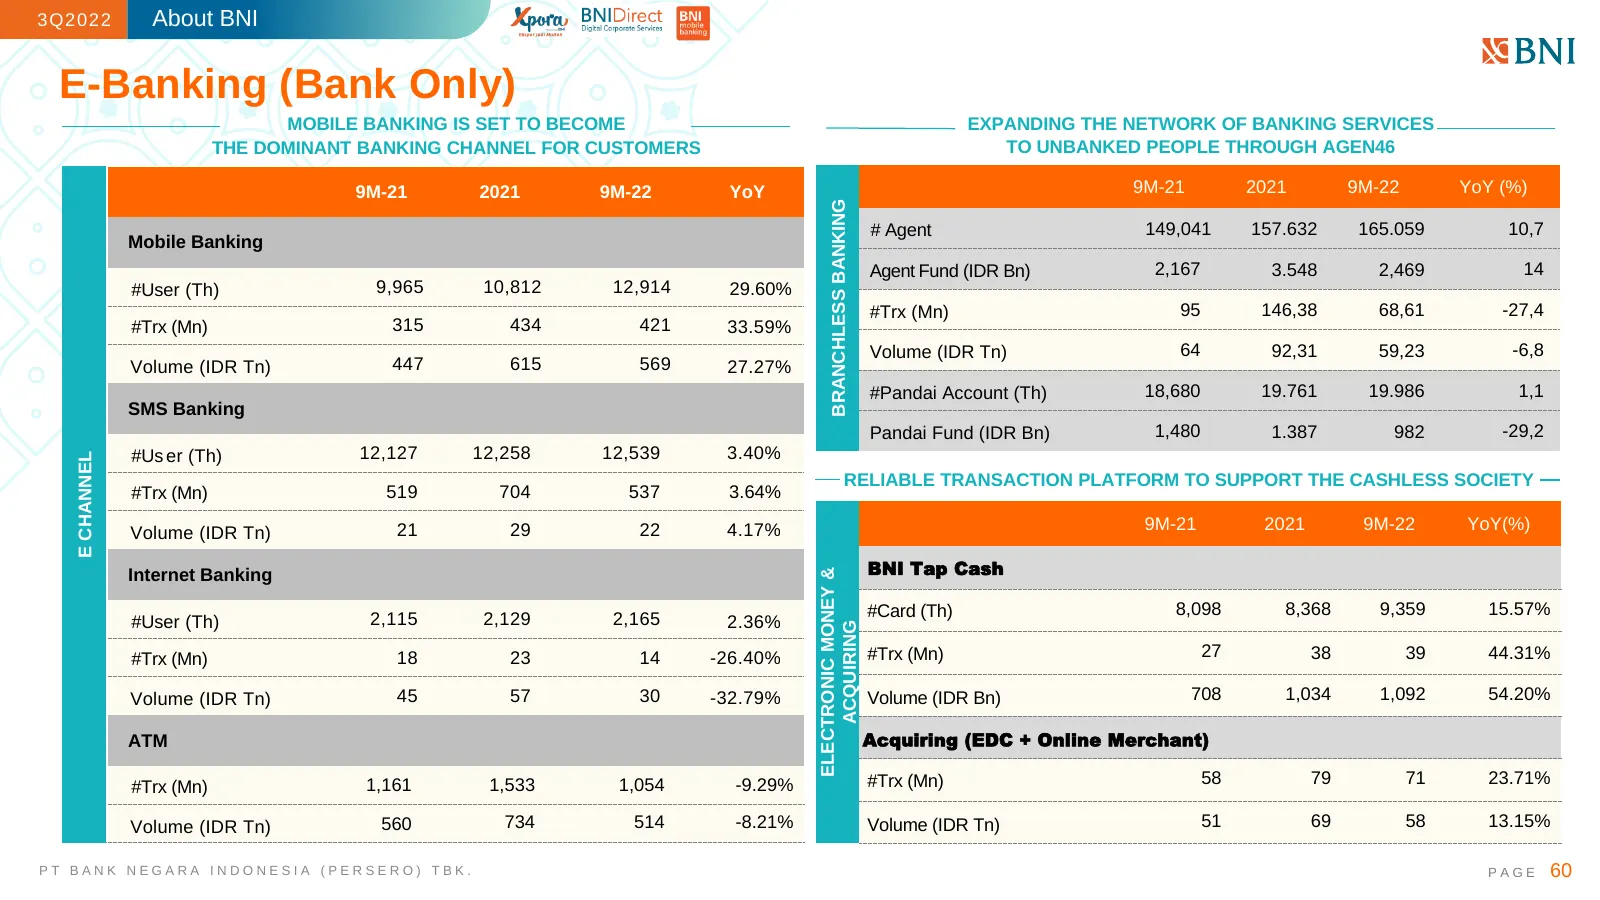
Slide 60: E-Banking (Bank Only)
3Q2022 About BNI E-Banking (Bank Only) MOBILE BANKING IS SET TO BECOME EXPANDING THE NETWORK OF BANKING SERVICES RESTRUCTURING THE DOMINANT BANKING CHANNEL LOAN FORBYCUSTOMERS SECTORS & ITS SCHEME TO UNBANKED PEOPLE THROUGH AGEN46 9M-21 2021 9M-22 YoY 9M-21 2021 9M-22 YoY (%) BRANCHLESS BANKING # Ag
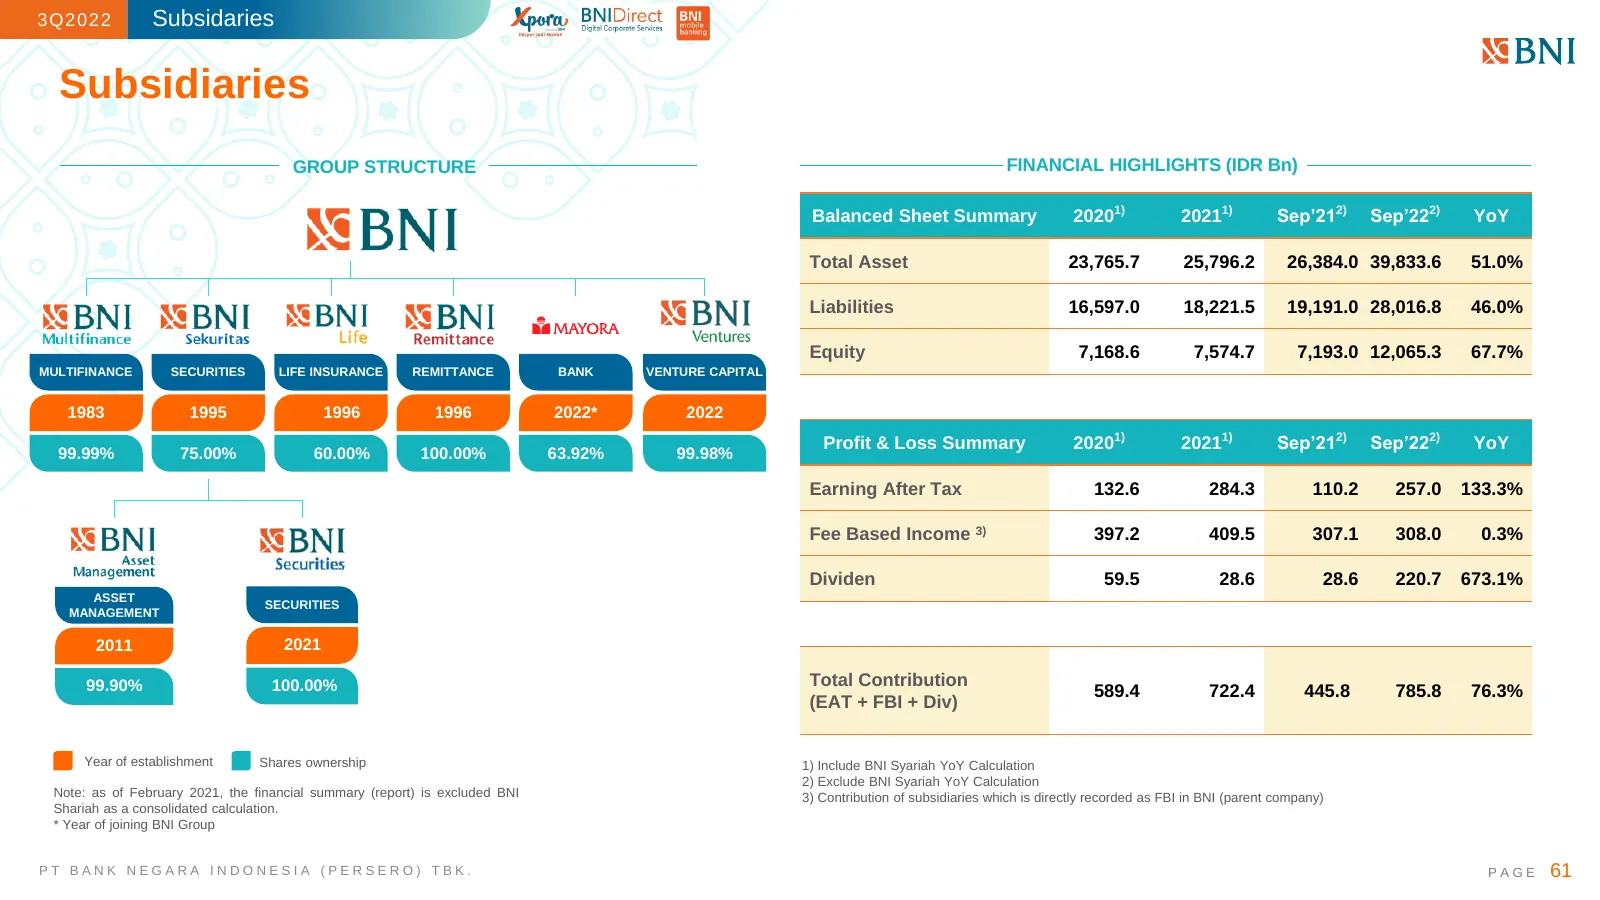
Slide 61: Subsidiaries
3Q2022 Subsidaries Subsidiaries GROUP STRUCTURE FINANCIAL HIGHLIGHTS (IDR Bn) Balanced Sheet Summary 20201) 20211) Sep’212) Sep’222) YoY Total Asset 23,765.7 25,796.2 26,384.0 39,833.6 51.0% Liabilities 16,597.0 18,221.5 19,191.0 28,016.8 46.0% Equity 7,168.6 7,574.7 7,193.0 12,065.3 67.7% MULTIFINA
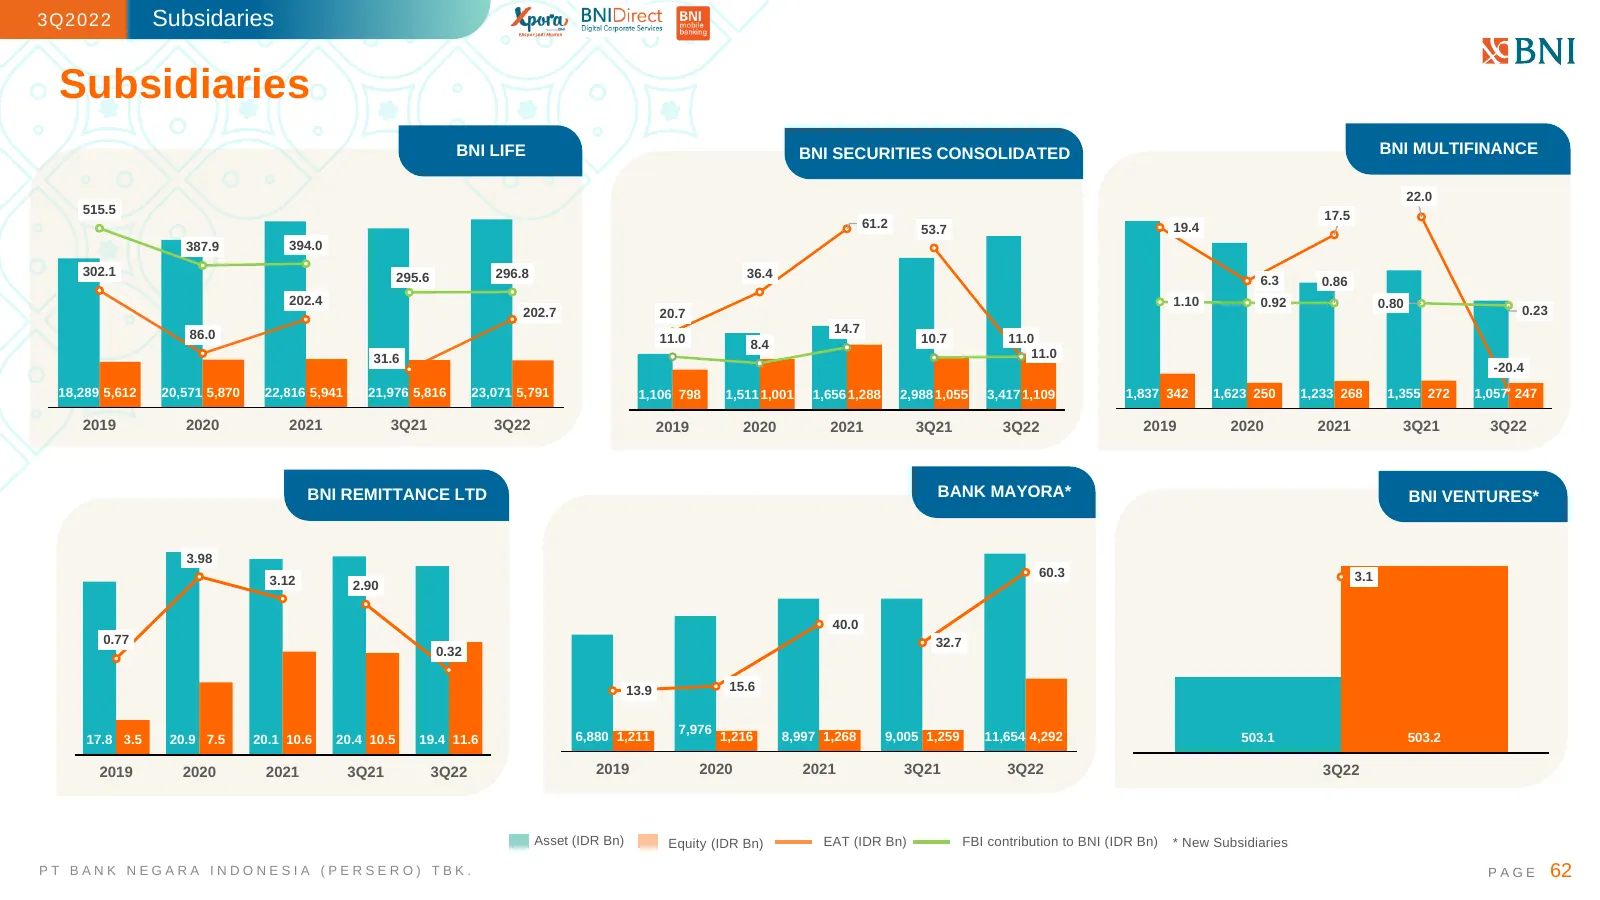
Slide 62: Subsidiaries
3Q2022 Subsidaries Subsidiaries BNI LIFE BNI SECURITIES CONSOLIDATED BNI MULTIFINANCE 22.0 515.5 17.5 61.2 53.7 19.4 387.9 394.0 302.1 295.6 296.8 36.4 6.3 0.86 202.4 1.10 0.92 0.80 202.7 20.7 0.23 86.0 14.7 11.0 8.4 10.7 11.0 31.6 11.0 -20.4 18,289 5,612 20,571 5,870 22,816 5,941 21,976 5,816 23,07
Slide 63: BASEL 3 Capital Requirement and BNI Capital Realization
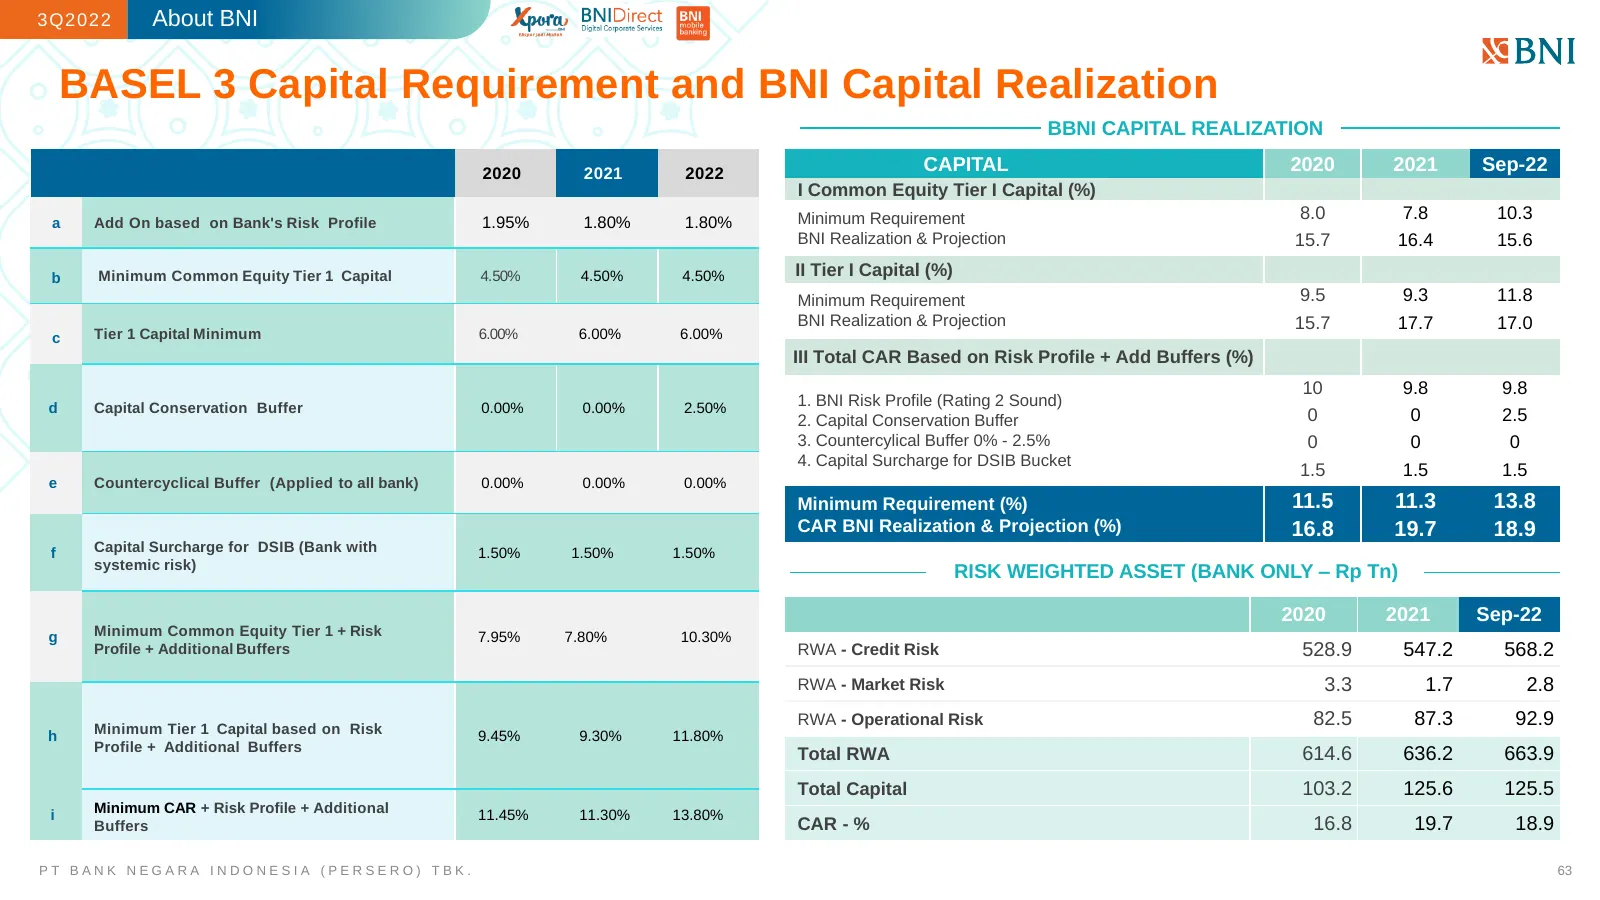
3Q2022 About BNI BASEL 3 Capital Requirement and BNI Capital Realization BBNI CAPITAL REALIZATION 2020 2021 2022 CAPITAL 2020 2021 Sep-22 I Common Equity Tier I Capital (%) Minimum Requirement 8.0 7.8 10.3 a Add On based on Bank's Risk Profile 1.95% 1.80% 1.80% BNI Realization & Projection 15.7 16.4
Slide 64: BNI Shares & Rating
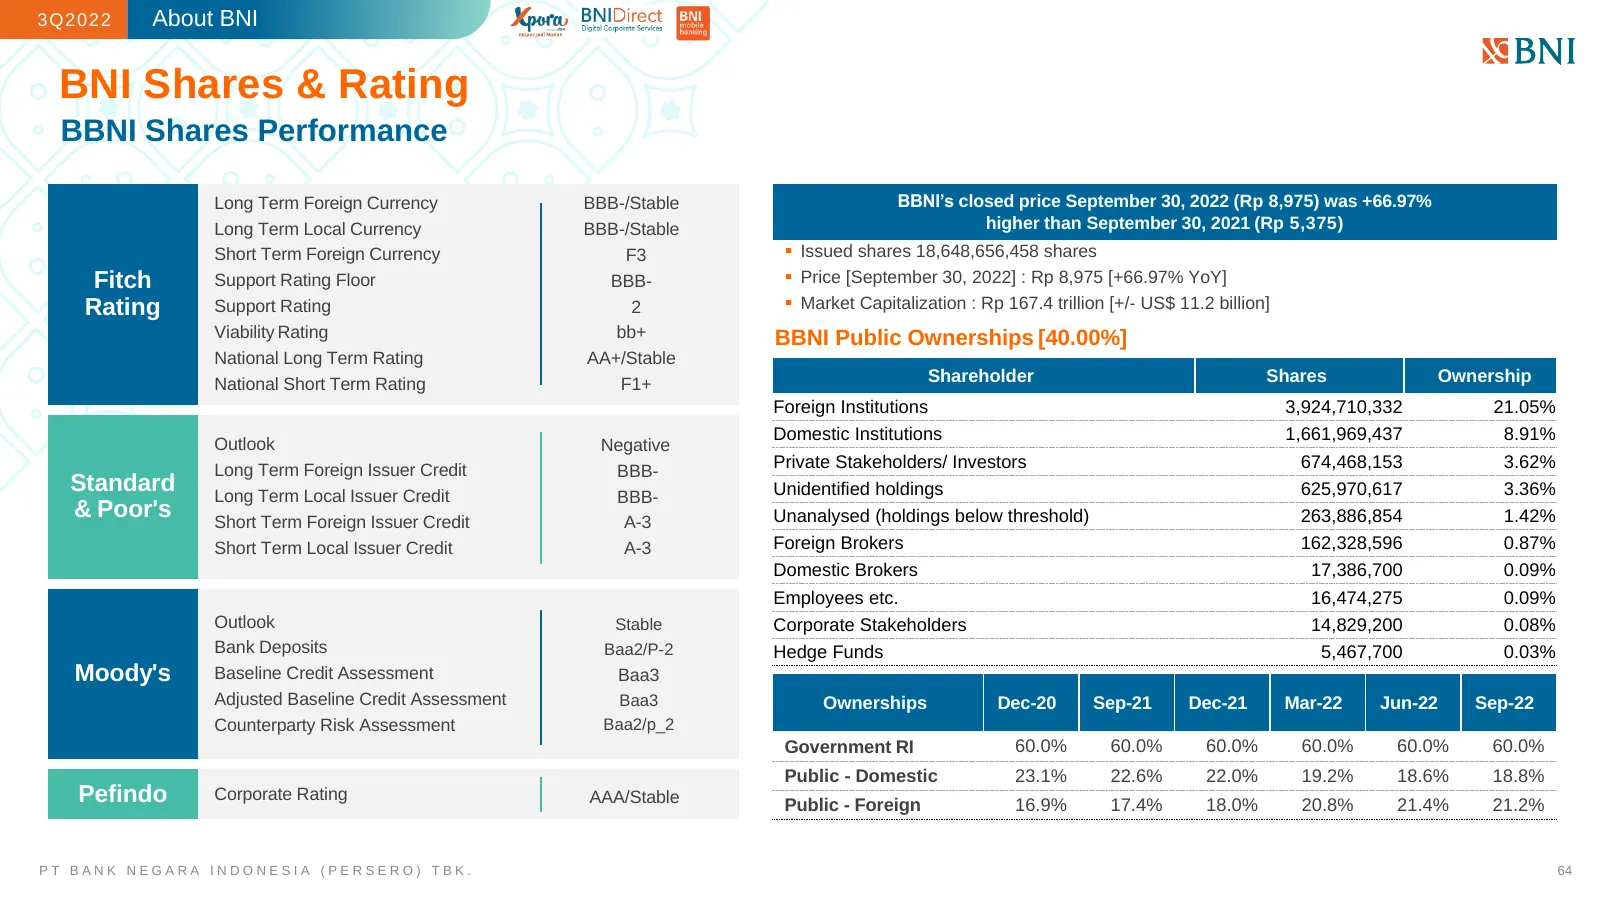
3Q2022 About BNI BNI Shares & Rating BBNI Shares Performance Long Term Foreign Currency BBB-/Stable BBNI’s closed price September 30, 2022 (Rp 8,975) was +66.97% Long Term Local Currency BBB-/Stable higher than September 30, 2021 (Rp 5,375) Short Term Foreign Currency F3 ▪ Issued shares 18,648,656,4
Slide 65: 5 Years Financial Data
3Q2022 5 Years Financial Data PT BANK NEGARA INDONESIA (PERSERO) TBK. PAGE 65
Slide 66: 5 Years Financial Data (1)
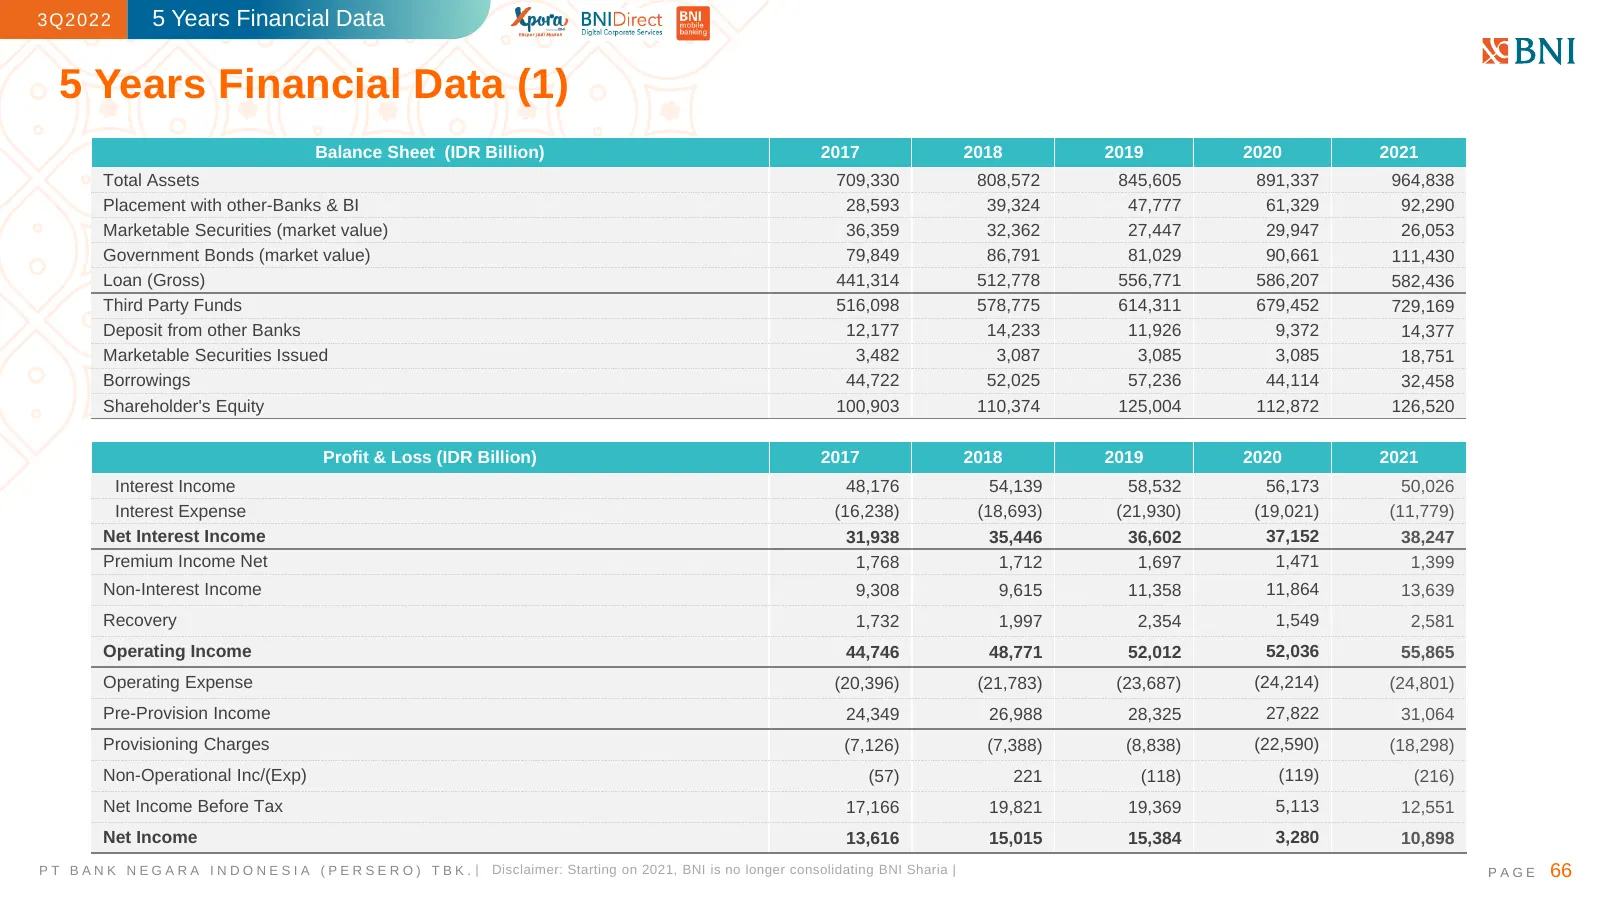
3Q2022 5 Years Financial Data 5 Years Financial Data (1) Balance Sheet (IDR Billion) 2017 2018 2019 2020 2021 Total Assets 709,330 808,572 845,605 891,337 964,838 Placement with other-Banks & BI 28,593 39,324 47,777 61,329 92,290 Marketable Securities (market value) 36,359 32,362 27,447 29,947 26,05
Slide 67: 5 Years Financial Data (2)
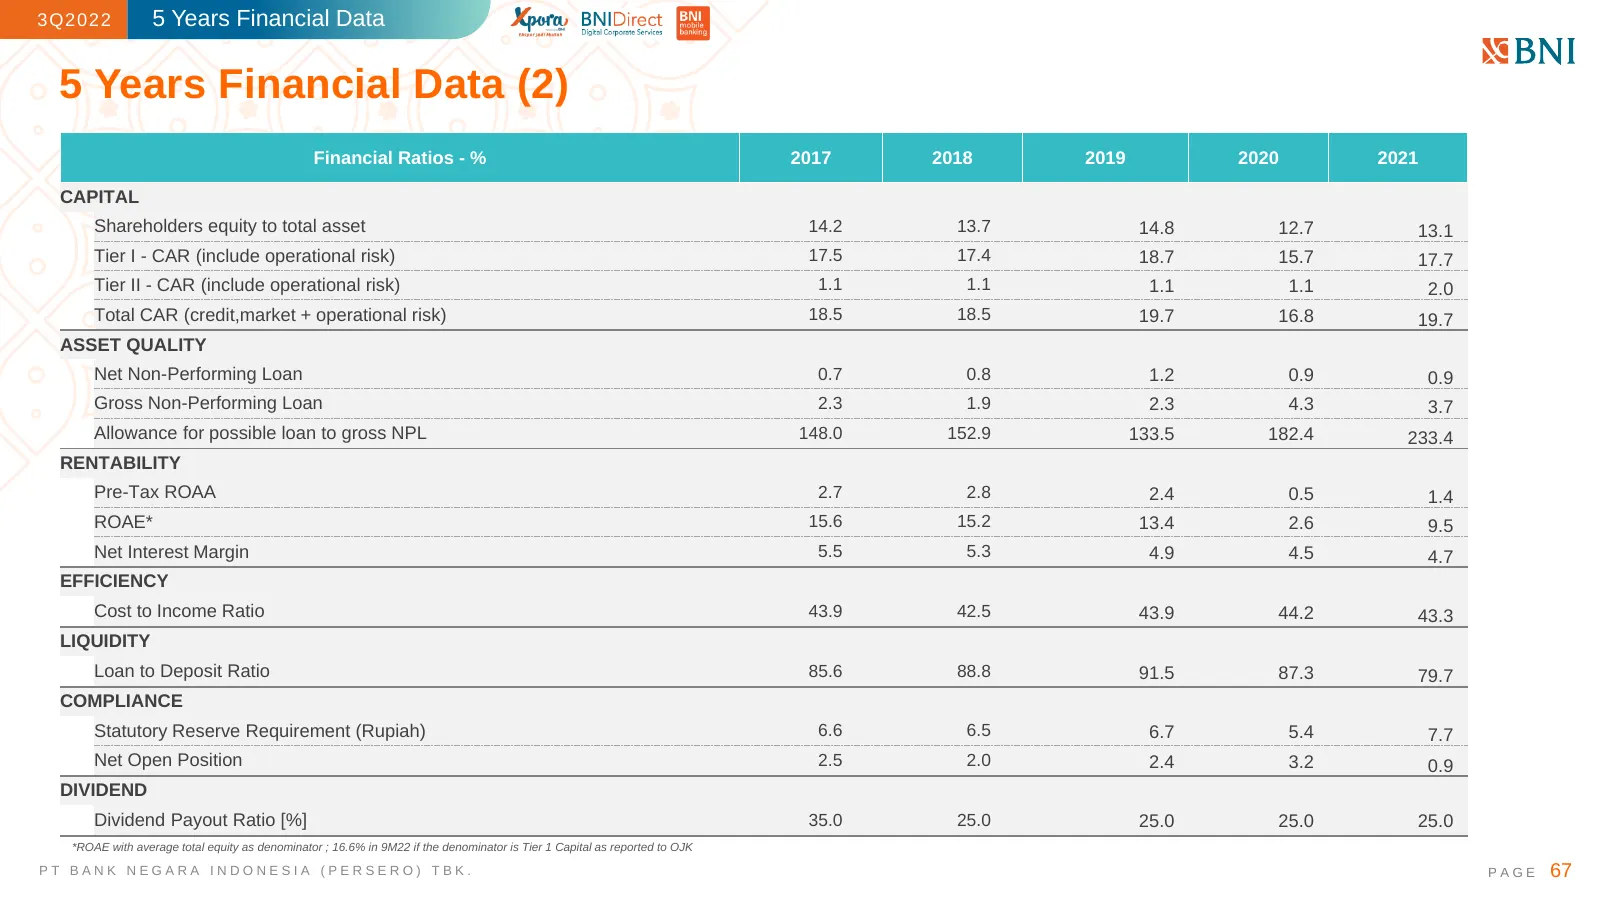
3Q2022 5 Years Financial Data 5 Years Financial Data (2) Financial Ratios - % 2017 2018 2019 2020 2021 CAPITAL Shareholders equity to total asset 14.2 13.7 14.8 12.7 13.1 Tier I - CAR (include operational risk) 17.5 17.4 18.7 15.7 17.7 Tier II - CAR (include operational risk) 1.1 1.1 1.1 1.1 2.0 Tot
Slide 68: Equity Research Contact Details
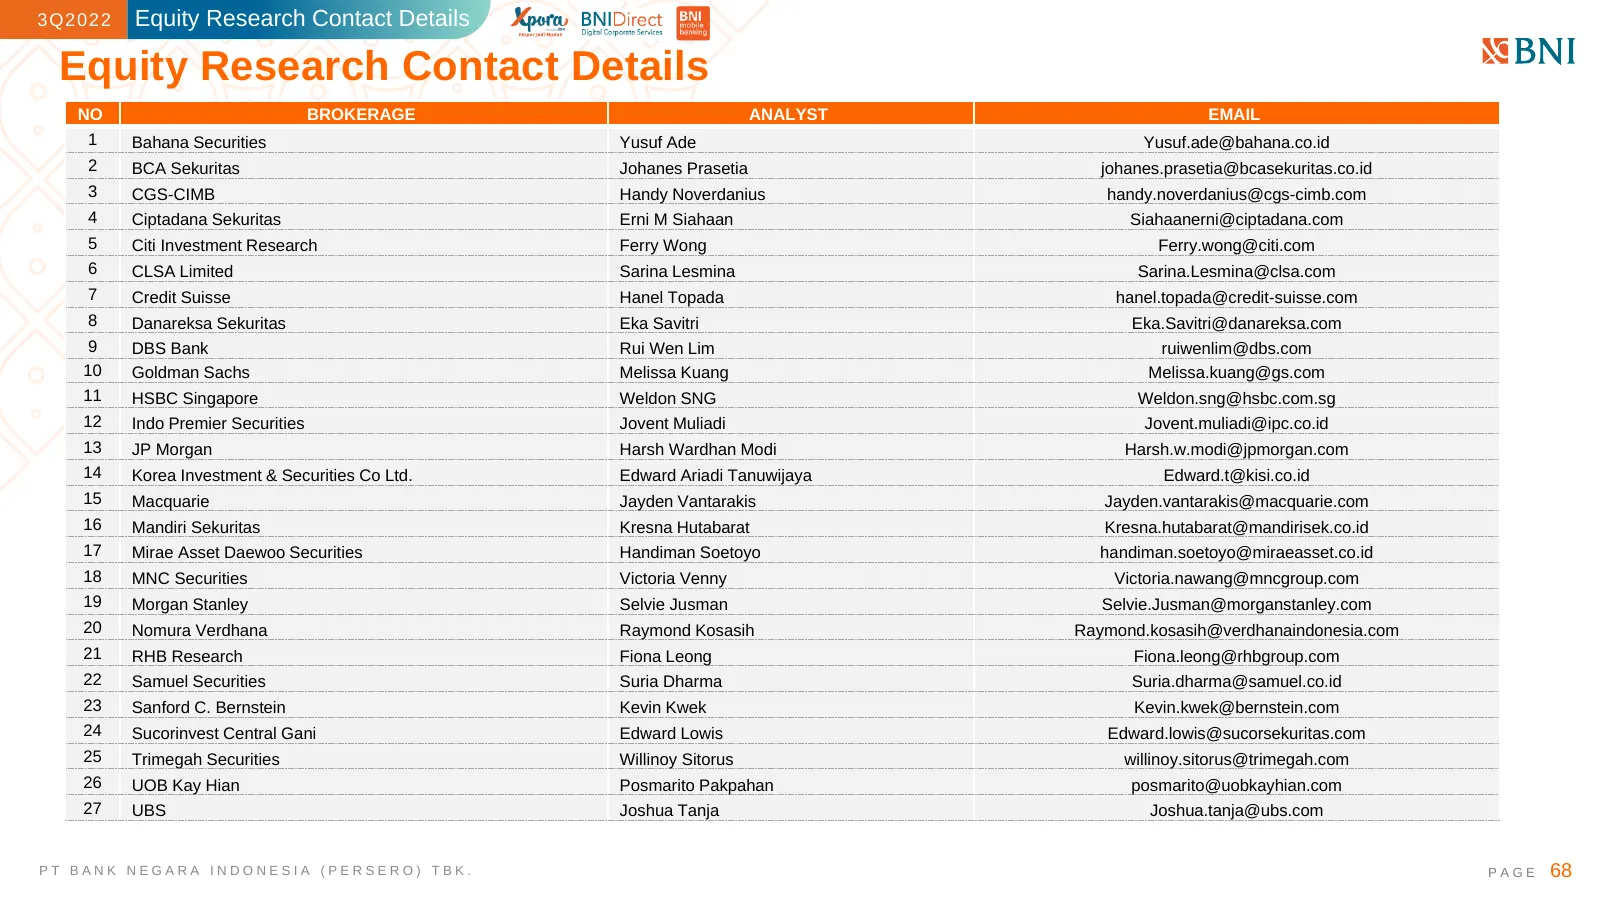
3Q2022 Equity Research Contact Details Equity Research Contact Details NO BROKERAGE ANALYST EMAIL 1 Bahana Securities Yusuf Ade Yusuf.ade@bahana.co.id 2 BCA Sekuritas Johanes Prasetia johanes.prasetia@bcasekuritas.co.id 3 CGS-CIMB Handy Noverdanius handy.noverdanius@cgs-cimb.com 4 Ciptadana Sekurita
Slide 69: Investor Relations Group
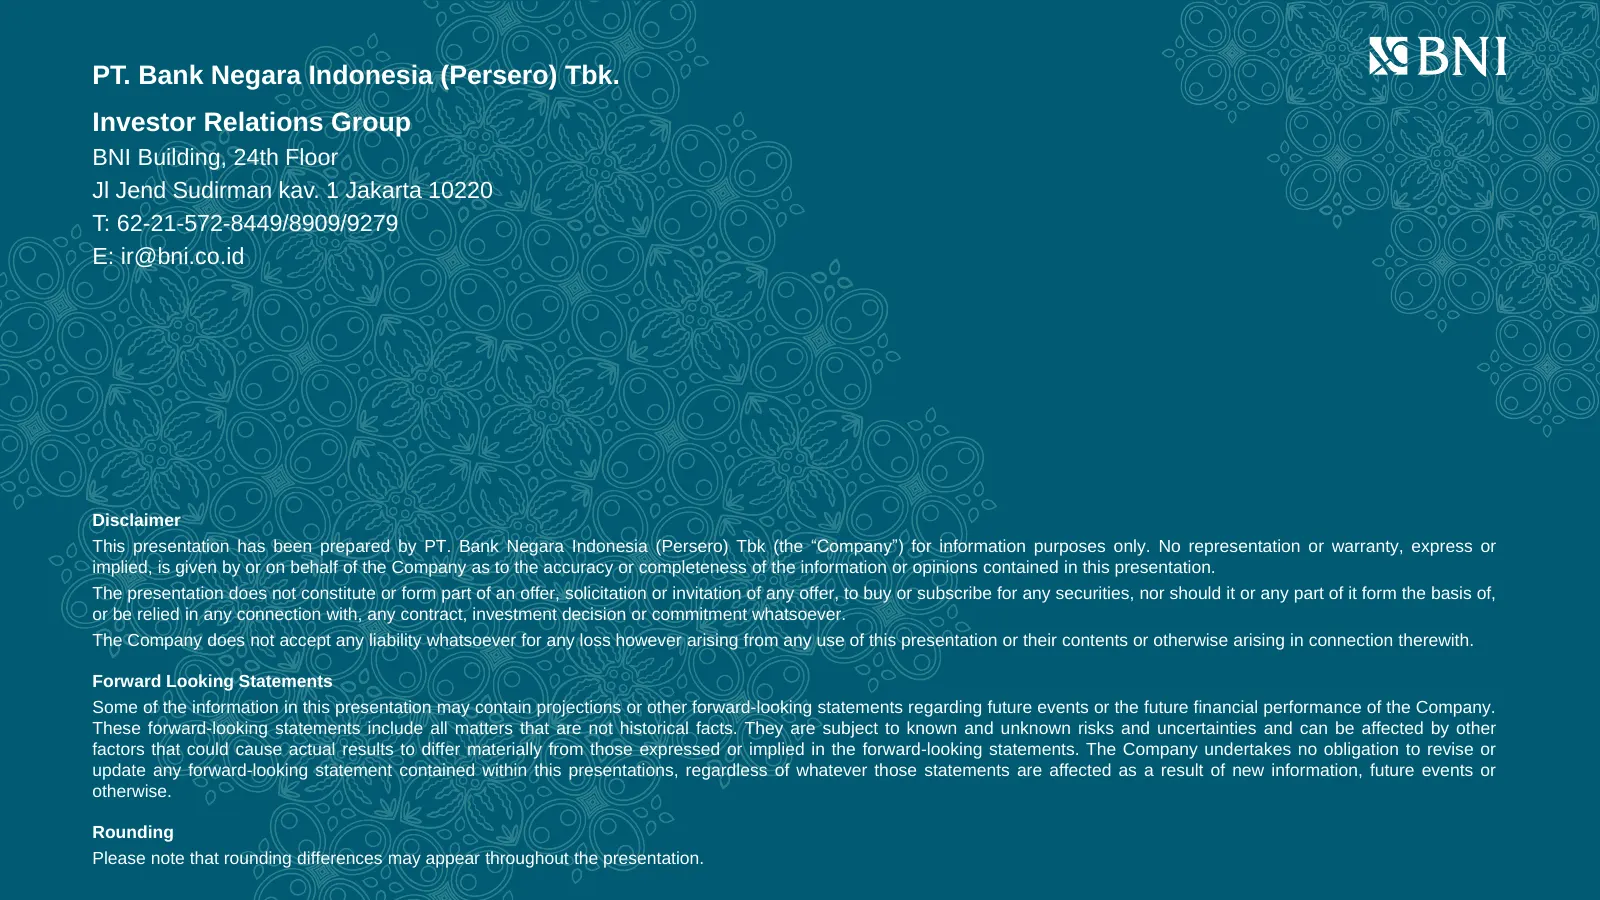
PT. Bank Negara Indonesia (Persero) Tbk. Investor Relations Group BNI Building, 24th Floor Jl Jend Sudirman kav. 1 Jakarta 10220 T: 62-21-572-8449/8909/9279 E: ir@bni.co.id Disclaimer This presentation has been prepared by PT. Bank Negara Indonesia (Persero) Tbk (the “Company”) for information purpo
Slide 70: Thank You
Thank You PT BANK NEGARA INDONESIA (PERSERO) TBK. #BUMNUntukIndonesia
Source: Internet Archive copy of bni.co.id
More decks from PT Bank Negara Indonesia (Persero) Tbk Class B
 Q1 2025 Earnings Presentation68 slides · Apr 28, 2025
 FY2024 Earnings Presentation71 slides · Jan 22, 2025
 Q1 2024 Earnings Presentation72 slides · Apr 29, 2024
 Q3 2023 Earnings Presentation74 slides · Oct 31, 2023
 Q1 2023 Earnings Presentation69 slides · May 18, 2023
 FY2022 Earnings Presentation69 slides · Jan 24, 2023