Durr AG · XETR:DUE
Durr — Q3 2008 Earnings Presentation
26 slides from Durr's earnings presentation, Nov 6, 2008
Slide 1: Welcome to the conference call: Results January - September 2008
Welcome to the conference call Dürr AG Results January - September 2008 Dürr Group Darmstadt, November 6, 2008
Slide 2: Disclaimer
Disclaimer This presentation has been prepared independently by Dürr AG (“Dürr”). The presentation contains statements which address such key issues as Dürr´s strategy, future financial results, market positions, product development, and the effects of continuous improvement processes. Such statemen
Slide 3: Incoming orders improved in Q3
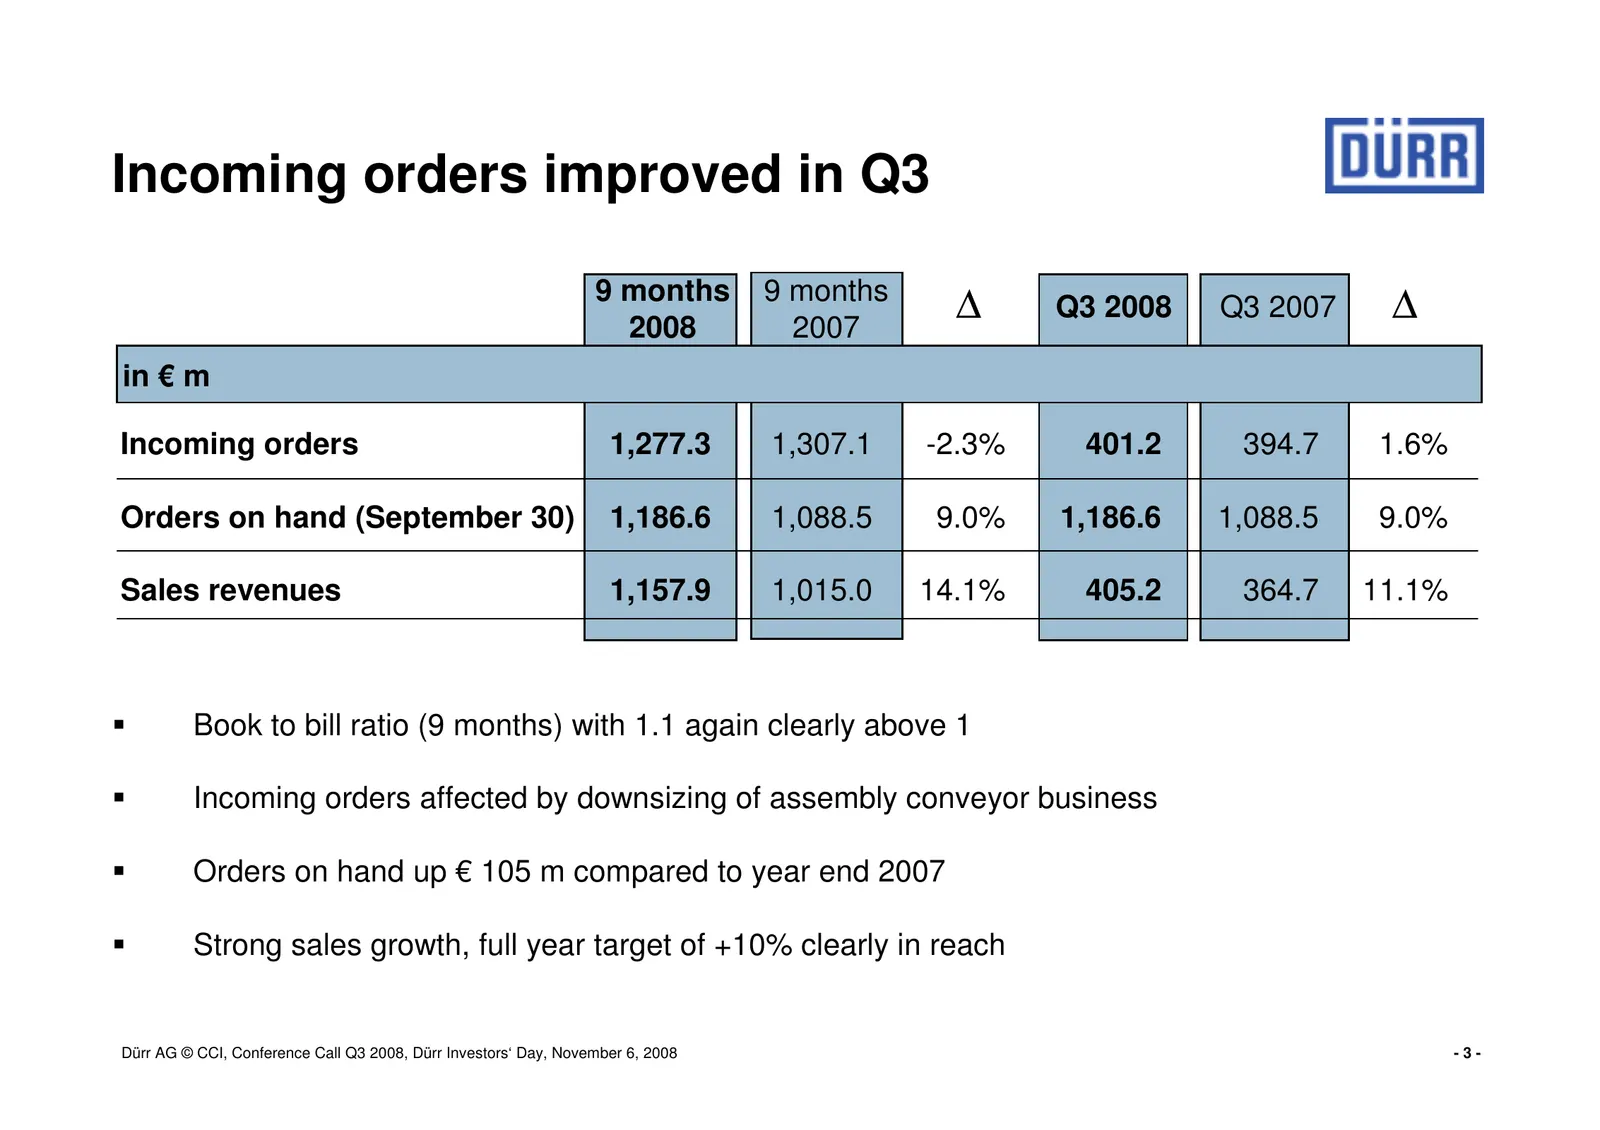
Incoming orders improved in Q3 9 months 9 months 2008 2007 ∆ Q3 2008 Q3 2007 ∆ in € m Incoming orders 1,277.3 1,307.1 -2.3% 401.2 394.7 1.6% Orders on hand (September 30) 1,186.6 1,088.5 9.0% 1,186.6 1,088.5 9.0% Sales revenues 1,157.9 1,015.0 14.1% 405.2 364.7 11.1% Book to bill ratio (9 months) wi
Slide 4: Strong order growth in Asia
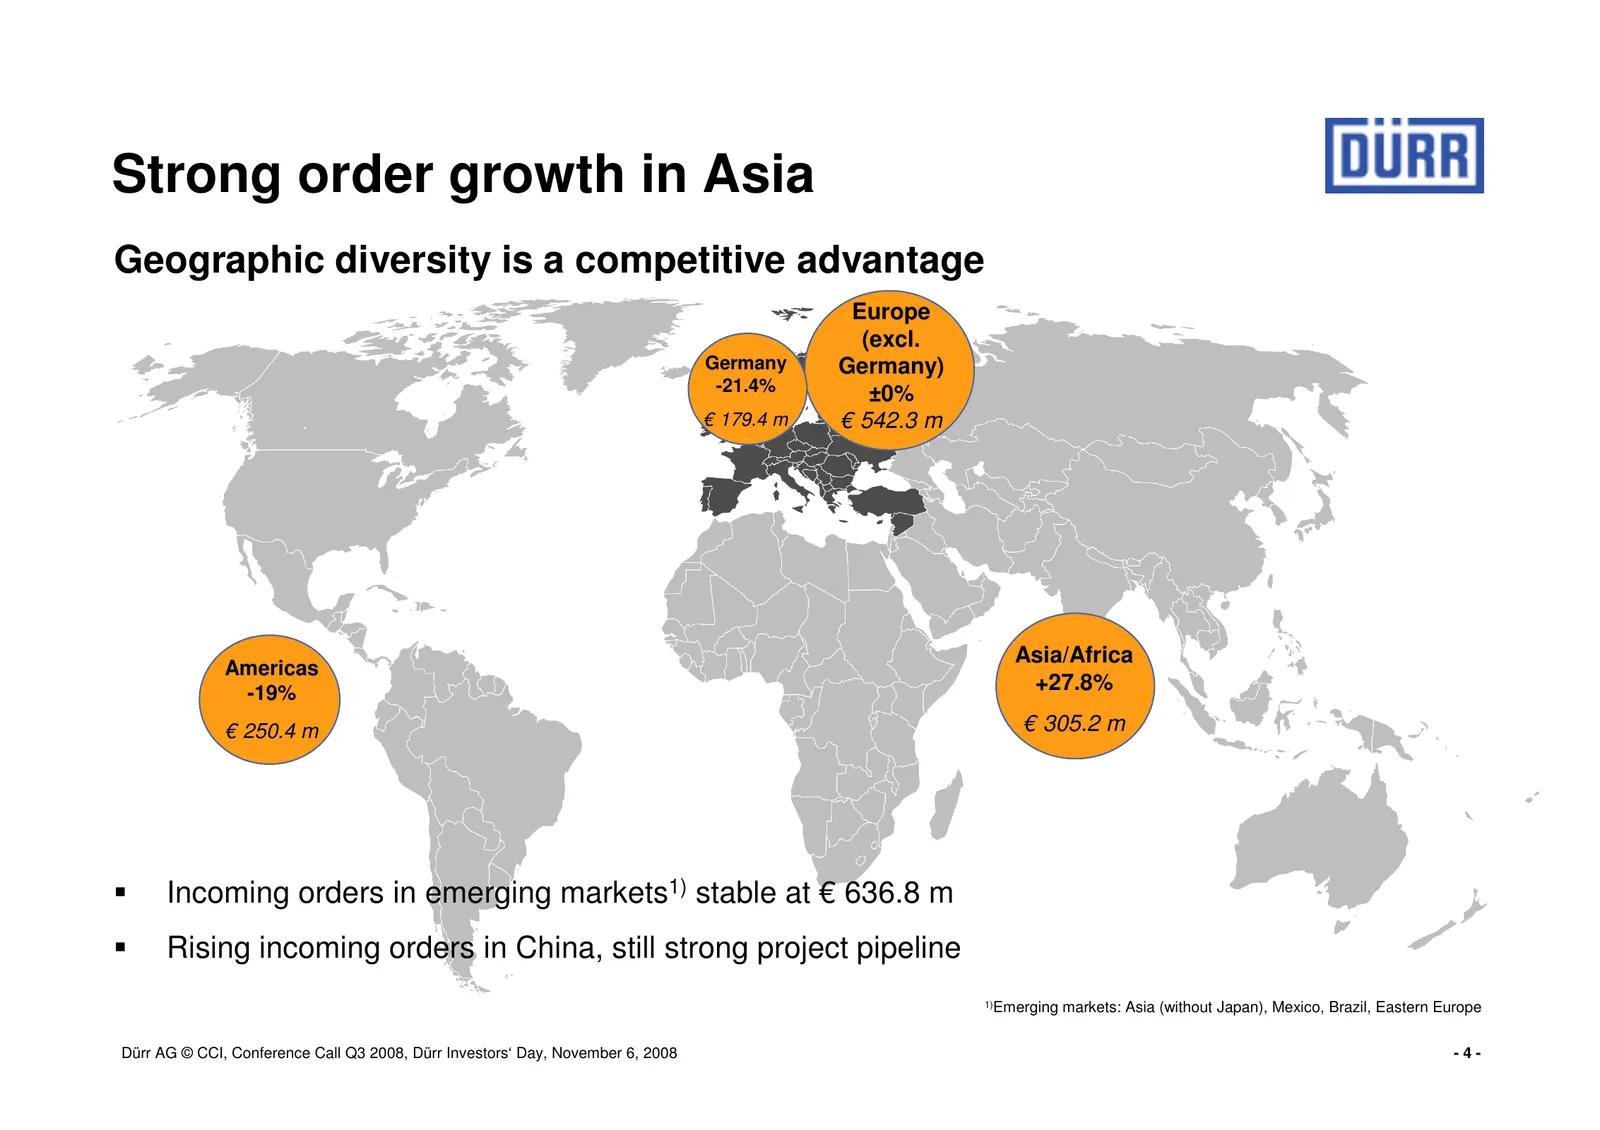
Strong order growth in Asia Geographic diversity is a competitive advantage Europe (excl. Germany Germany) -21.4% ±0% € 179.4 m € 542.3 m Asia/Africa Americas -19% +27.8% € 250.4 m € 305.2 m Incoming orders in emerging markets1) stable at € 636.8 m Rising incoming orders in China, still strong proje
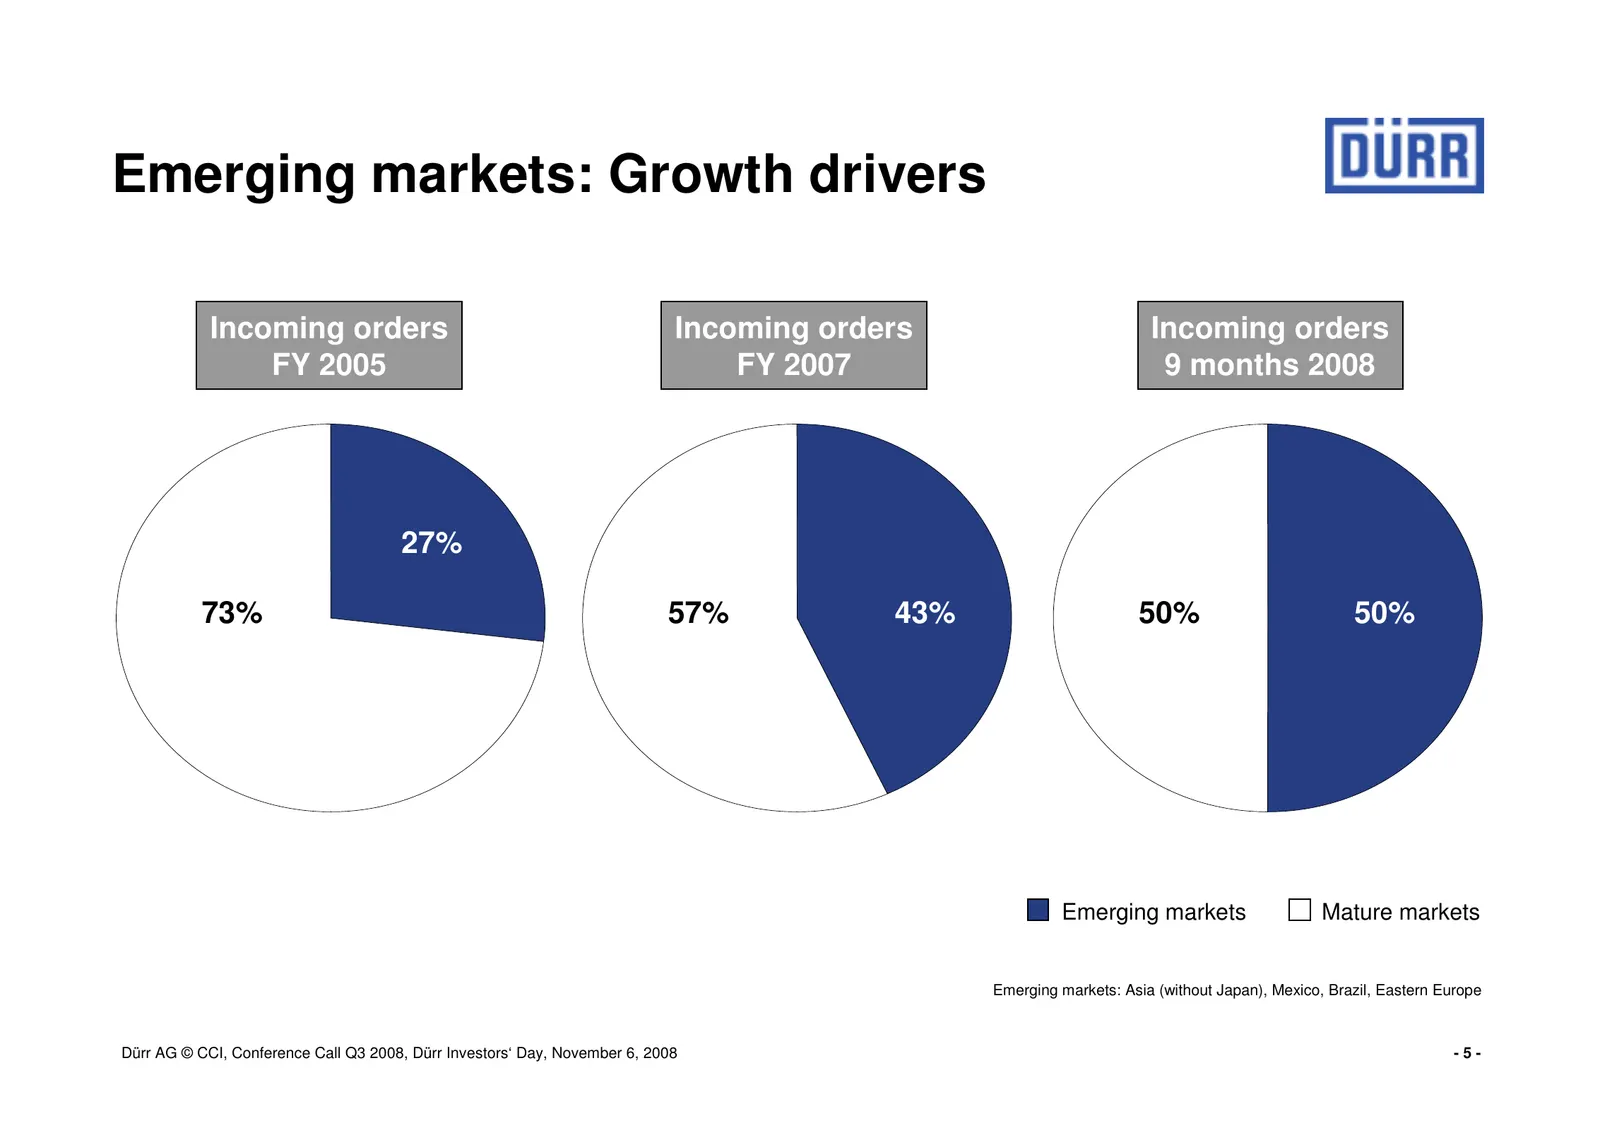
Slide 5: Emerging markets: Growth drivers
Emerging markets: Growth drivers Incoming orders Incoming orders Incoming orders FY 2005 FY 2007 9 months 2008 27% 73% 57% 43% 50% 50% Emerging markets Mature markets Emerging markets: Asia (without Japan), Mexico, Brazil, Eastern Europe Dürr AG © CCI, Conference Call Q3 2008, Dürr Investors‘ Day, N
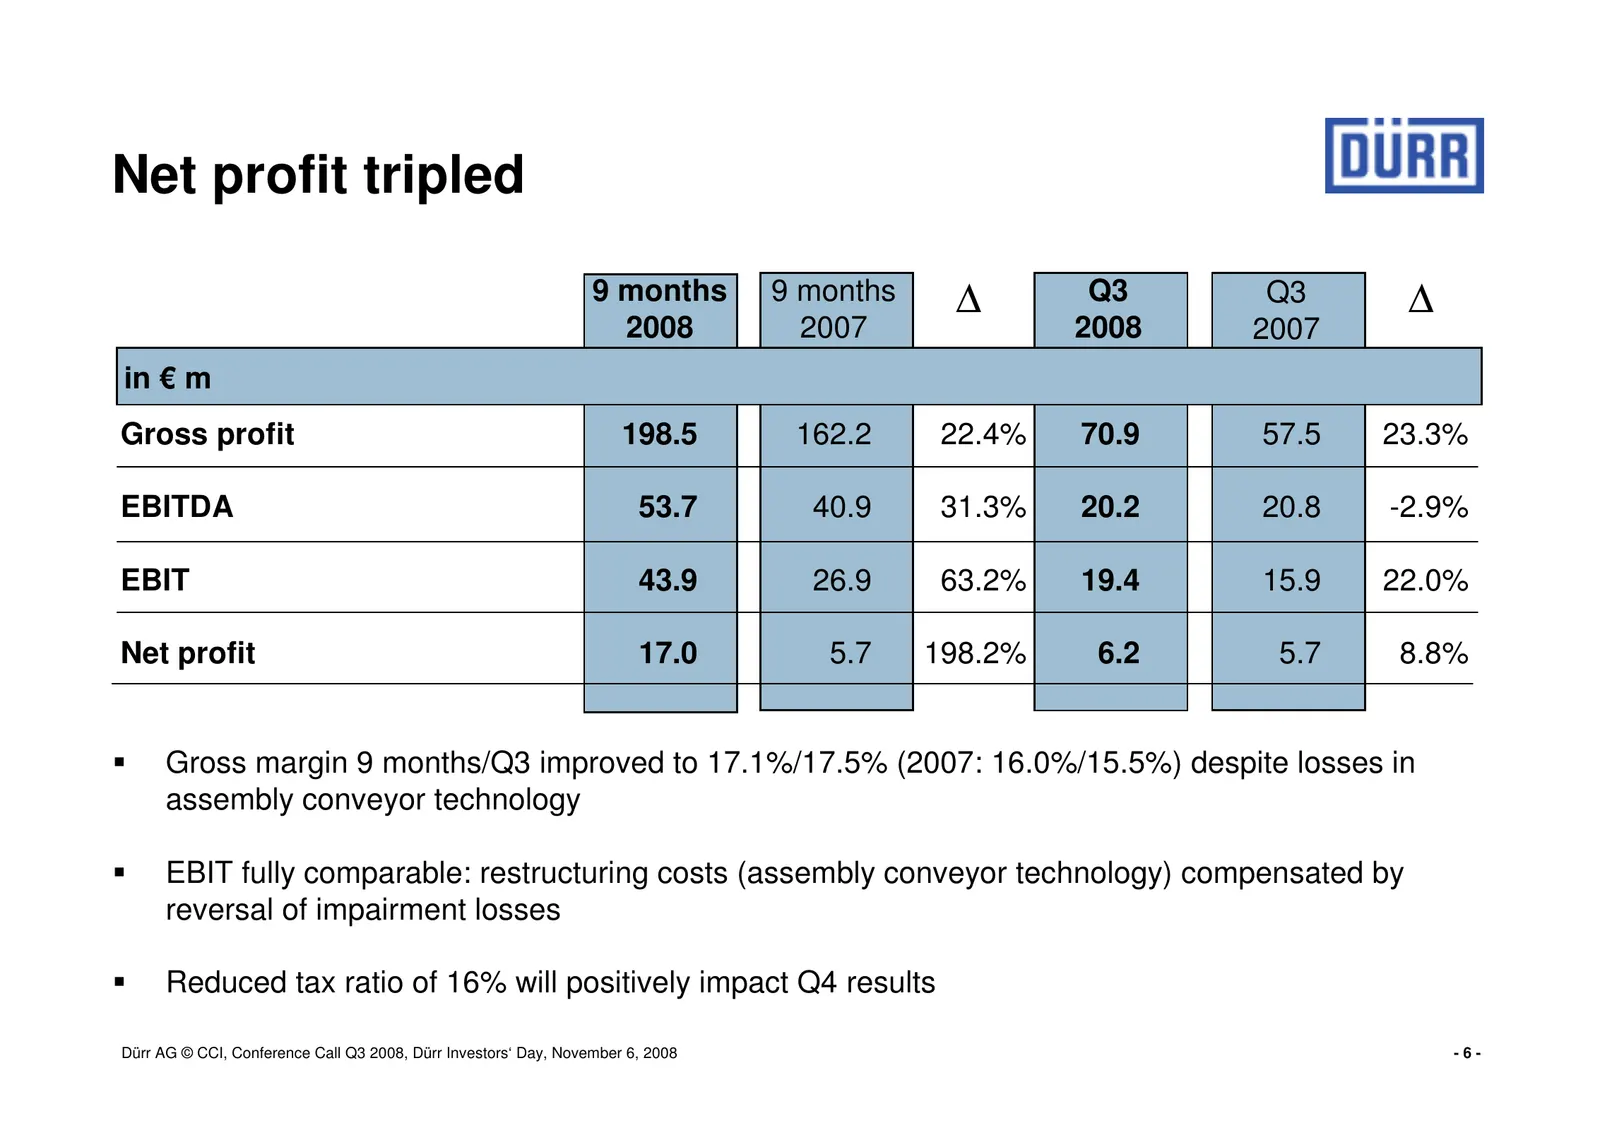
Slide 6: Net profit tripled
Net profit tripled 9 months 9 months ∆ Q3 Q3 ∆ 2008 2007 2008 2007 in € m Gross profit 198.5 162.2 22.4% 70.9 57.5 23.3% EBITDA 53.7 40.9 31.3% 20.2 20.8 -2.9% EBIT 43.9 26.9 63.2% 19.4 15.9 22.0% Net profit 17.0 5.7 198.2% 6.2 5.7 8.8% Gross margin 9 months/Q3 improved to 17.1%/17.5% (2007: 16.0%/1
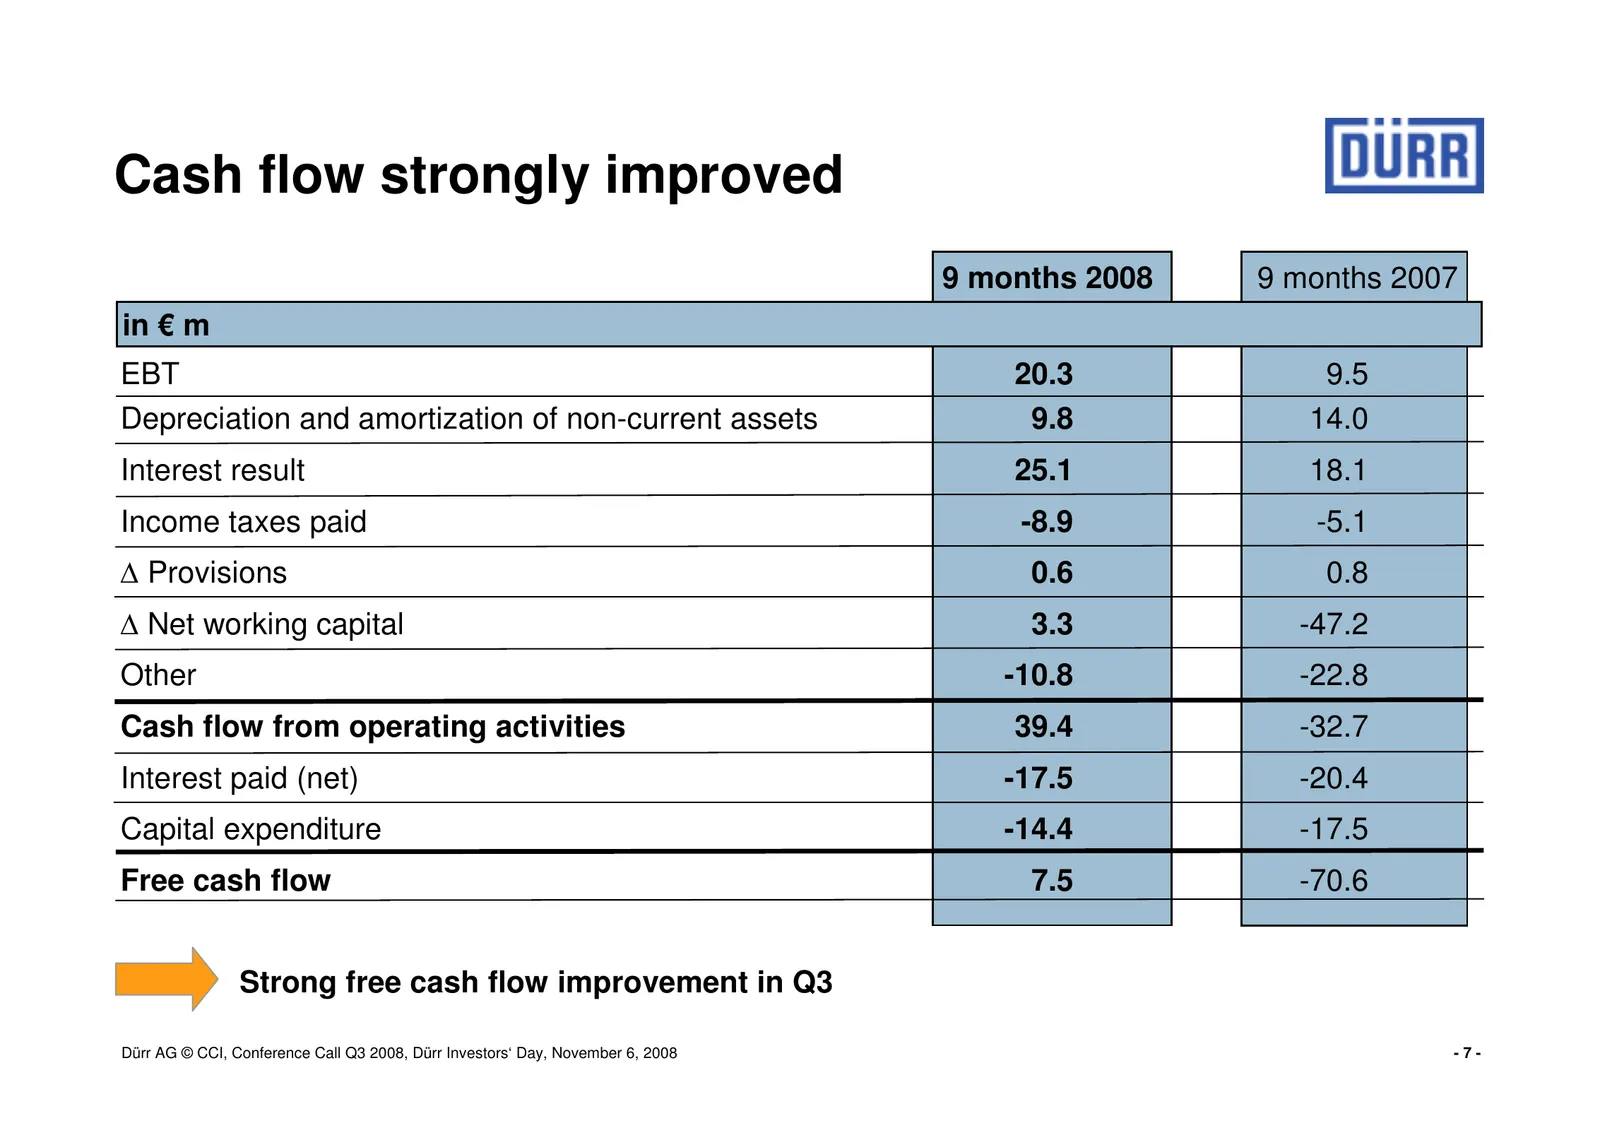
Slide 7: Cash flow strongly improved
Cash flow strongly improved 9 months 2008 9 months 2007 in € m EBT 20.3 9.5 Depreciation and amortization of non-current assets 9.8 14.0 Interest result 25.1 18.1 Income taxes paid -8.9 -5.1 ∆ Provisions 0.6 0.8 ∆ Net working capital 3.3 -47.2 Other -10.8 -22.8 Cash flow from operating activities 39
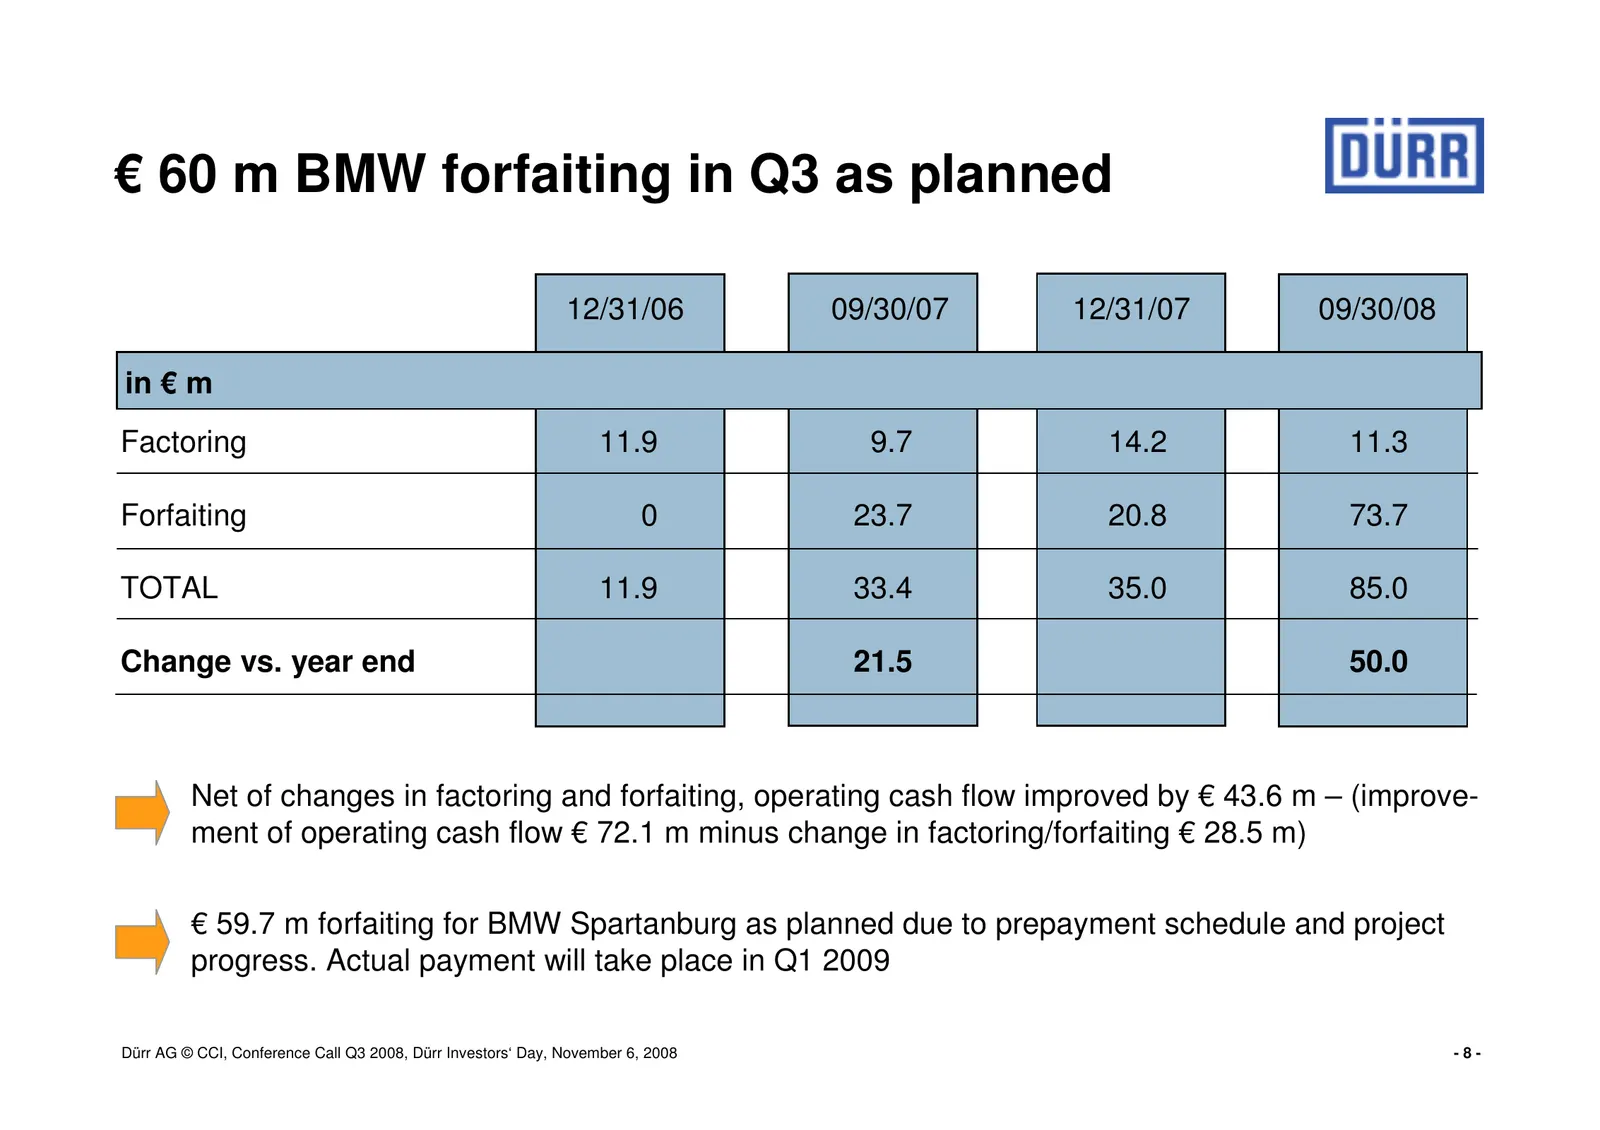
Slide 8: € 60 m BMW forfaiting in Q3 as planned
€ 60 m BMW forfaiting in Q3 as planned 12/31/06 09/30/07 12/31/07 09/30/08 in € m Factoring 11.9 9.7 14.2 11.3 Forfaiting 0 23.7 20.8 73.7 TOTAL 11.9 33.4 35.0 85.0 Change vs. year end 21.5 50.0 Net of changes in factoring and forfaiting, operating cash flow improved by € 43.6 m – (improve- ment of
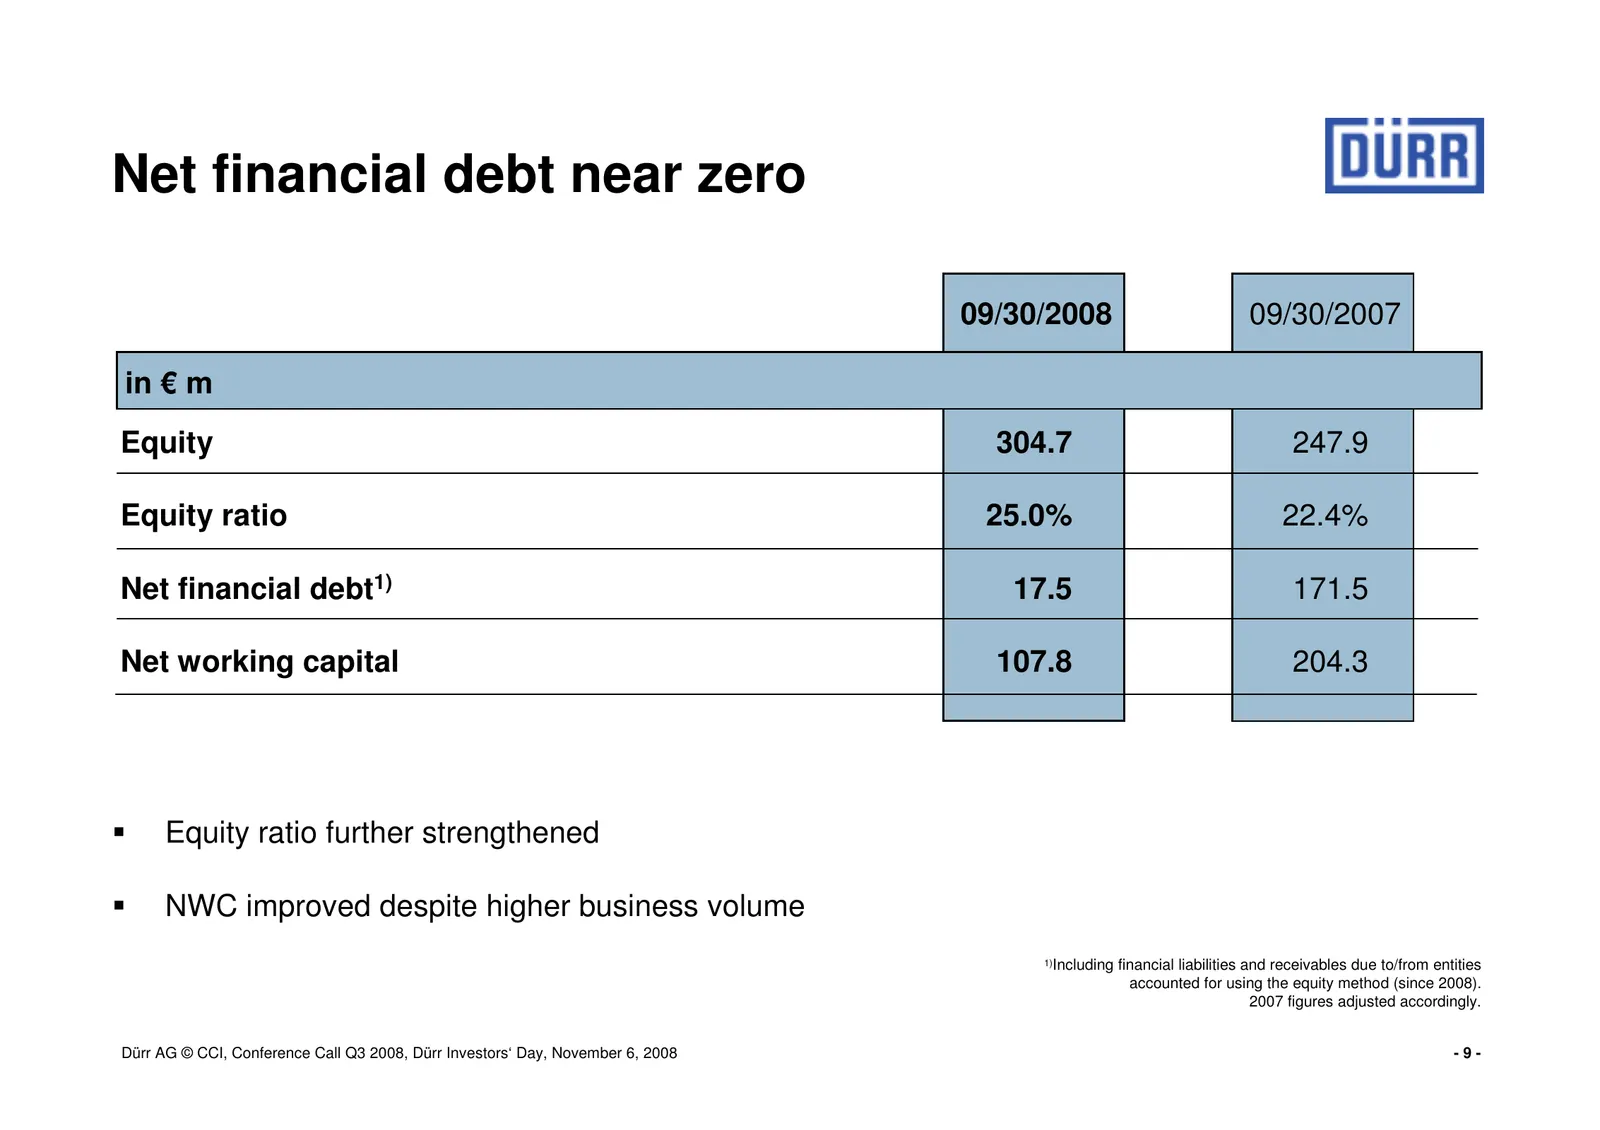
Slide 9: Net financial debt near zero
Net financial debt near zero 09/30/2008 09/30/2007 in € m Equity 304.7 247.9 Equity ratio 25.0% 22.4% Net financial debt1) 17.5 171.5 Net working capital 107.8 204.3 Equity ratio further strengthened NWC improved despite higher business volume 1)Including financial liabilities and receivables due to
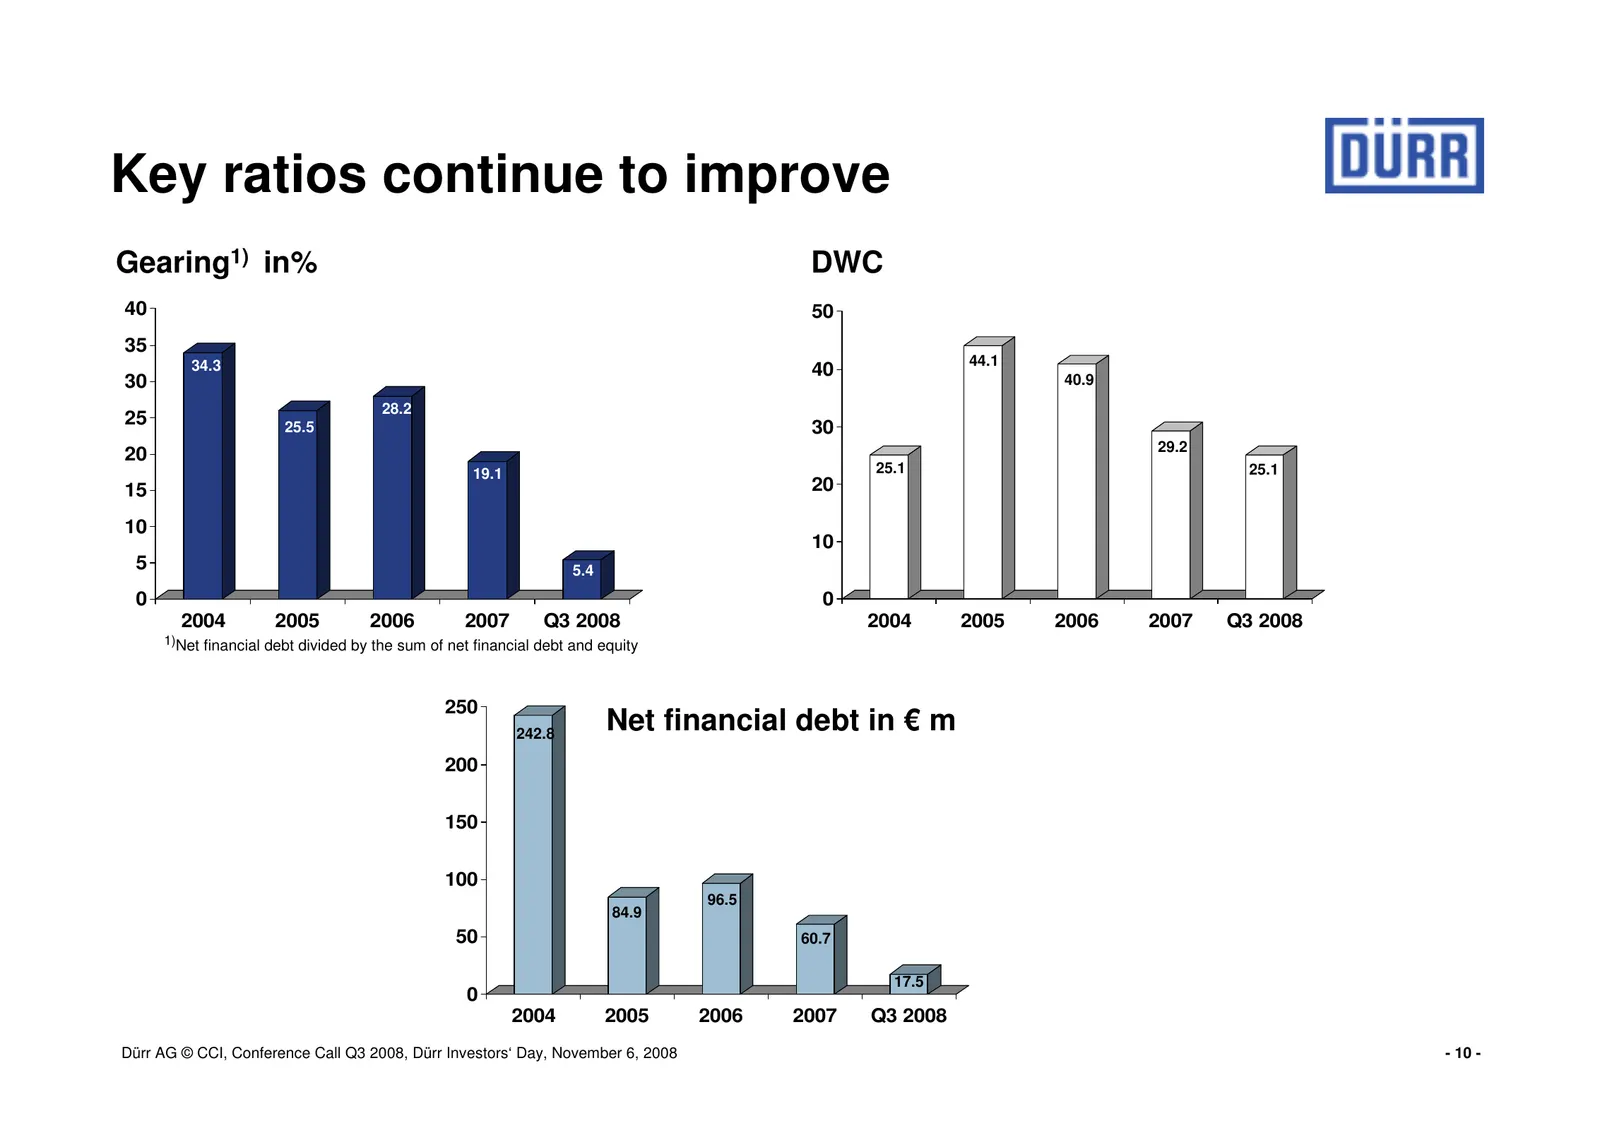
Slide 10: Key ratios continue to improve
Key ratios continue to improve Gearing1) in% DWC 40 50 35 34.3 44.1 40 40.9 30 28.2 25 25.5 30 29.2 20 19.1 25.1 25.1 15 20 10 10 5 5.4 0 0 2004 2005 2006 2007 Q3 2008 2004 2005 2006 2007 Q3 2008 1)Net financial debt divided by the sum of net financial debt and equity 250 242.8 Net financial debt in
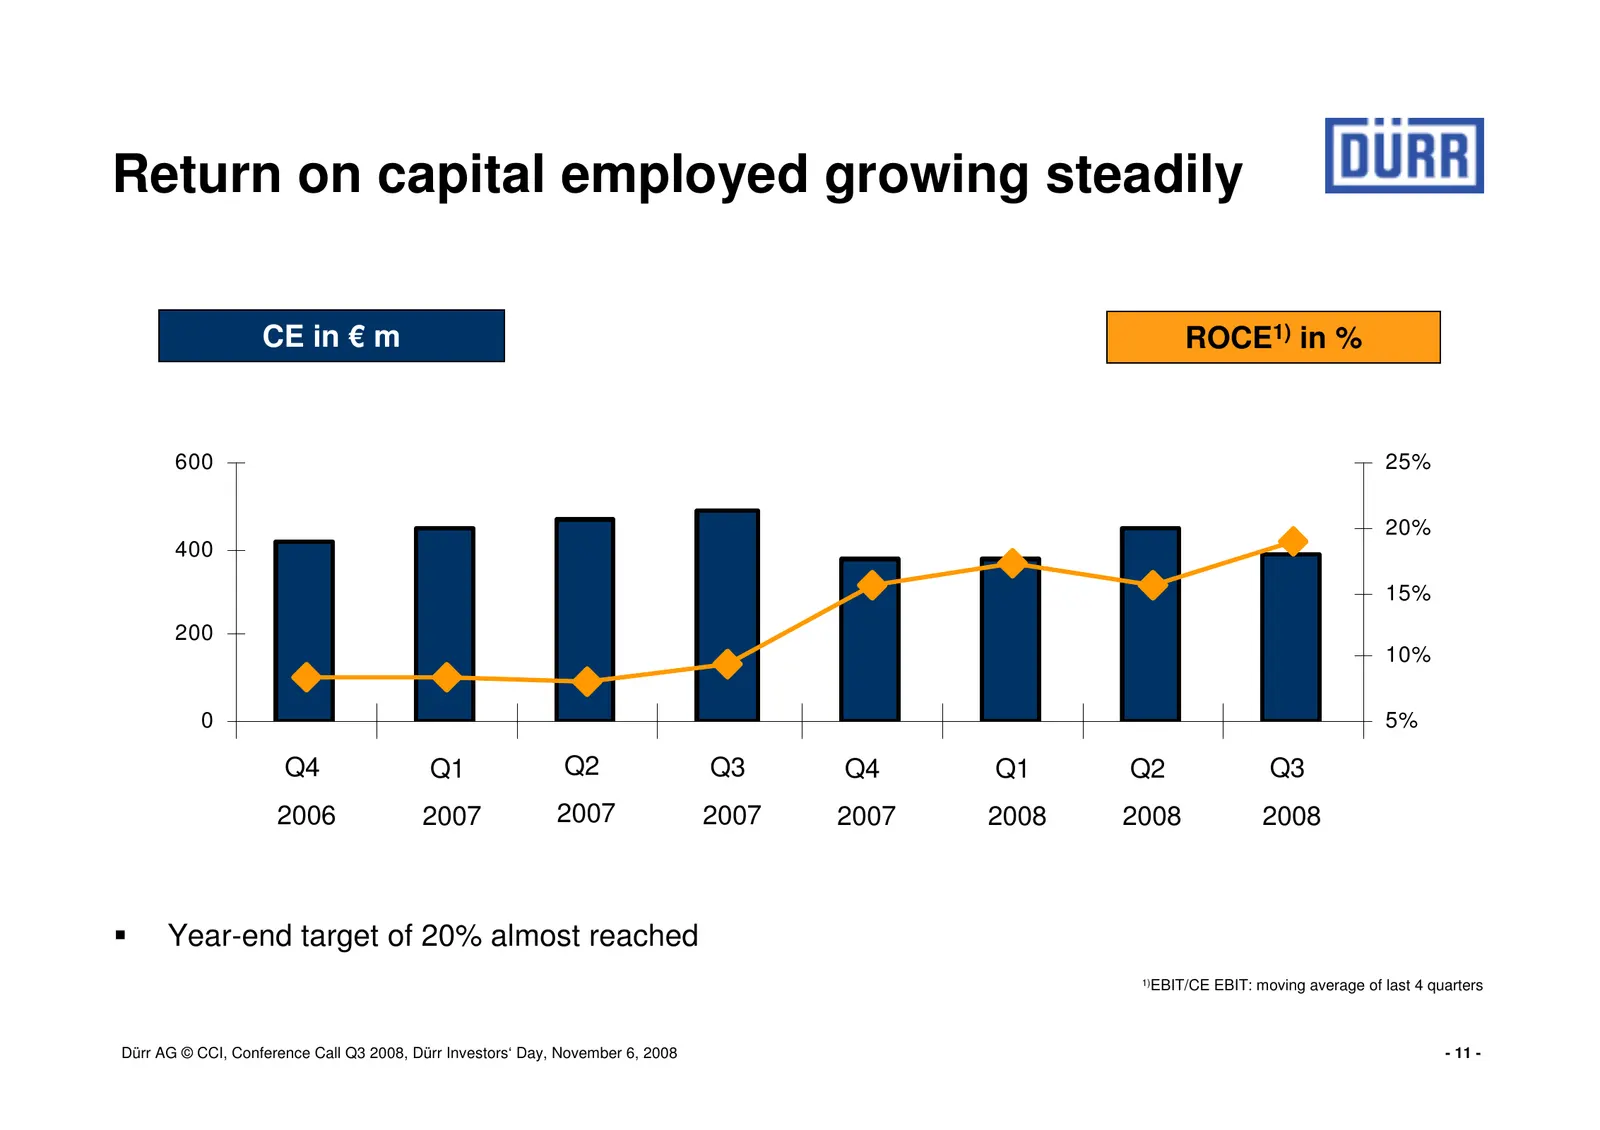
Slide 11: Return on capital employed growing steadily
Return on capital employed growing steadily CE in € m ROCE1) in % 600 25% 20% 400 15% 200 10% 0 5% Q4 Q1 Q2 Q3 Q4 Q1 Q2 Q3 1 2006 2 2007 3 2007 4 2007 5 2007 6 2008 7 2008 8 2008 Year-end target of 20% almost reached 1)EBIT/CE EBIT: moving average of last 4 quarters Dürr AG © CCI, Conference Call Q3
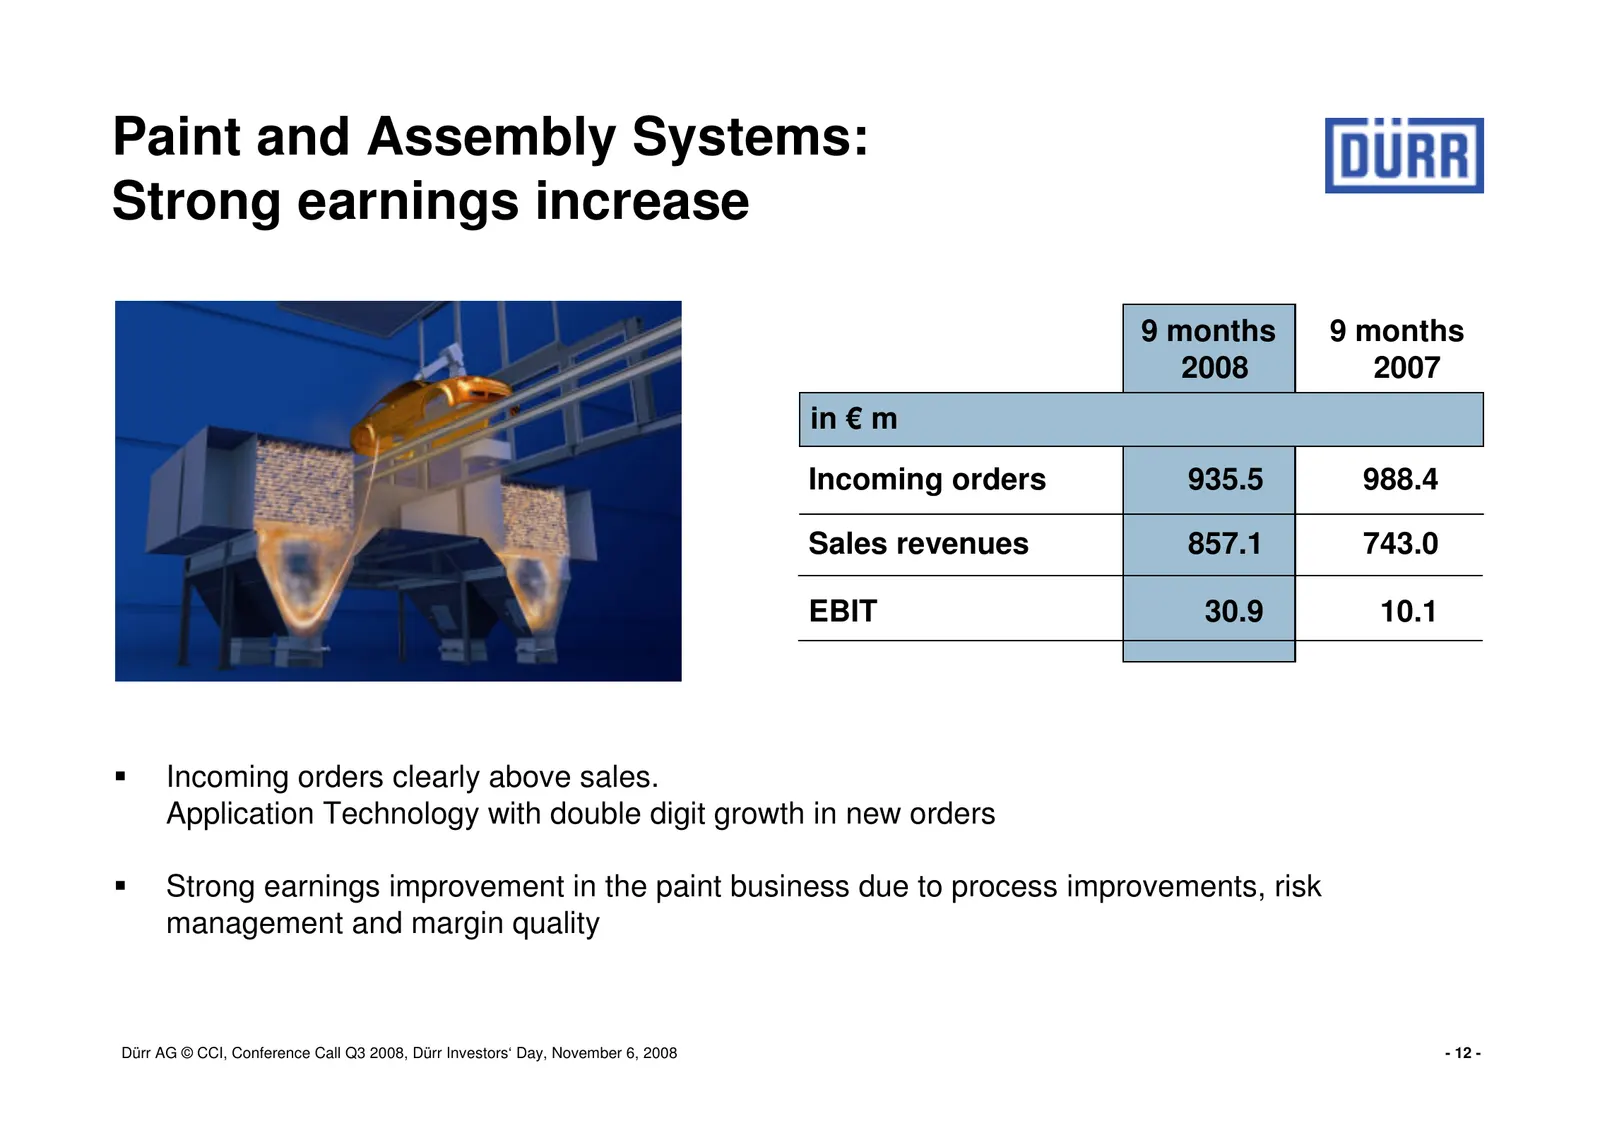
Slide 12: Paint and Assembly Systems: Strong earnings increase
Paint and Assembly Systems: Strong earnings increase 9 months 9 months 2008 2007 in € m Incoming orders 935.5 988.4 Sales revenues 857.1 743.0 EBIT 30.9 10.1 Incoming orders clearly above sales. Application Technology with double digit growth in new orders Strong earnings improvement in the paint bu
Slide 13: Measuring and Process Systems: Strong volume and earnings growth
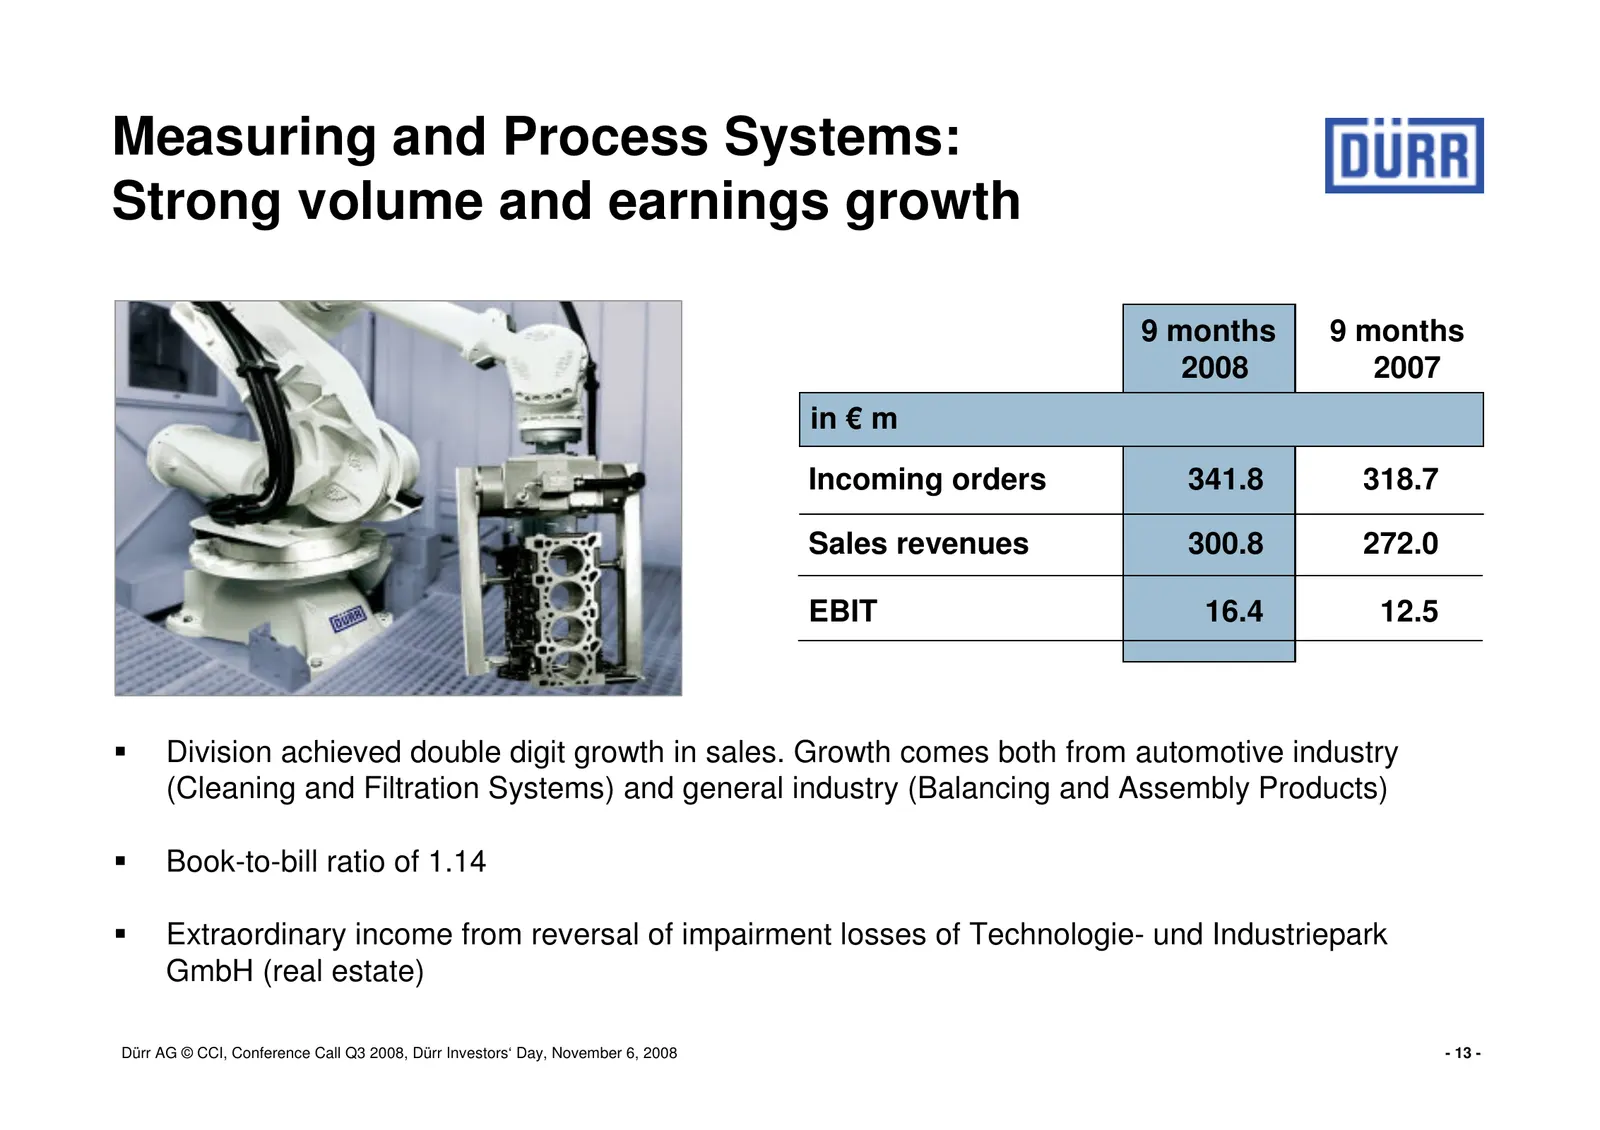
Measuring and Process Systems: Strong volume and earnings growth 9 months 9 months 2008 2007 in € m Incoming orders 341.8 318.7 Sales revenues 300.8 272.0 EBIT 16.4 12.5 Division achieved double digit growth in sales. Growth comes both from automotive industry (Cleaning and Filtration Systems) and g
Slide 14: Outlook: Strong order backlog provides high visibility for 2009
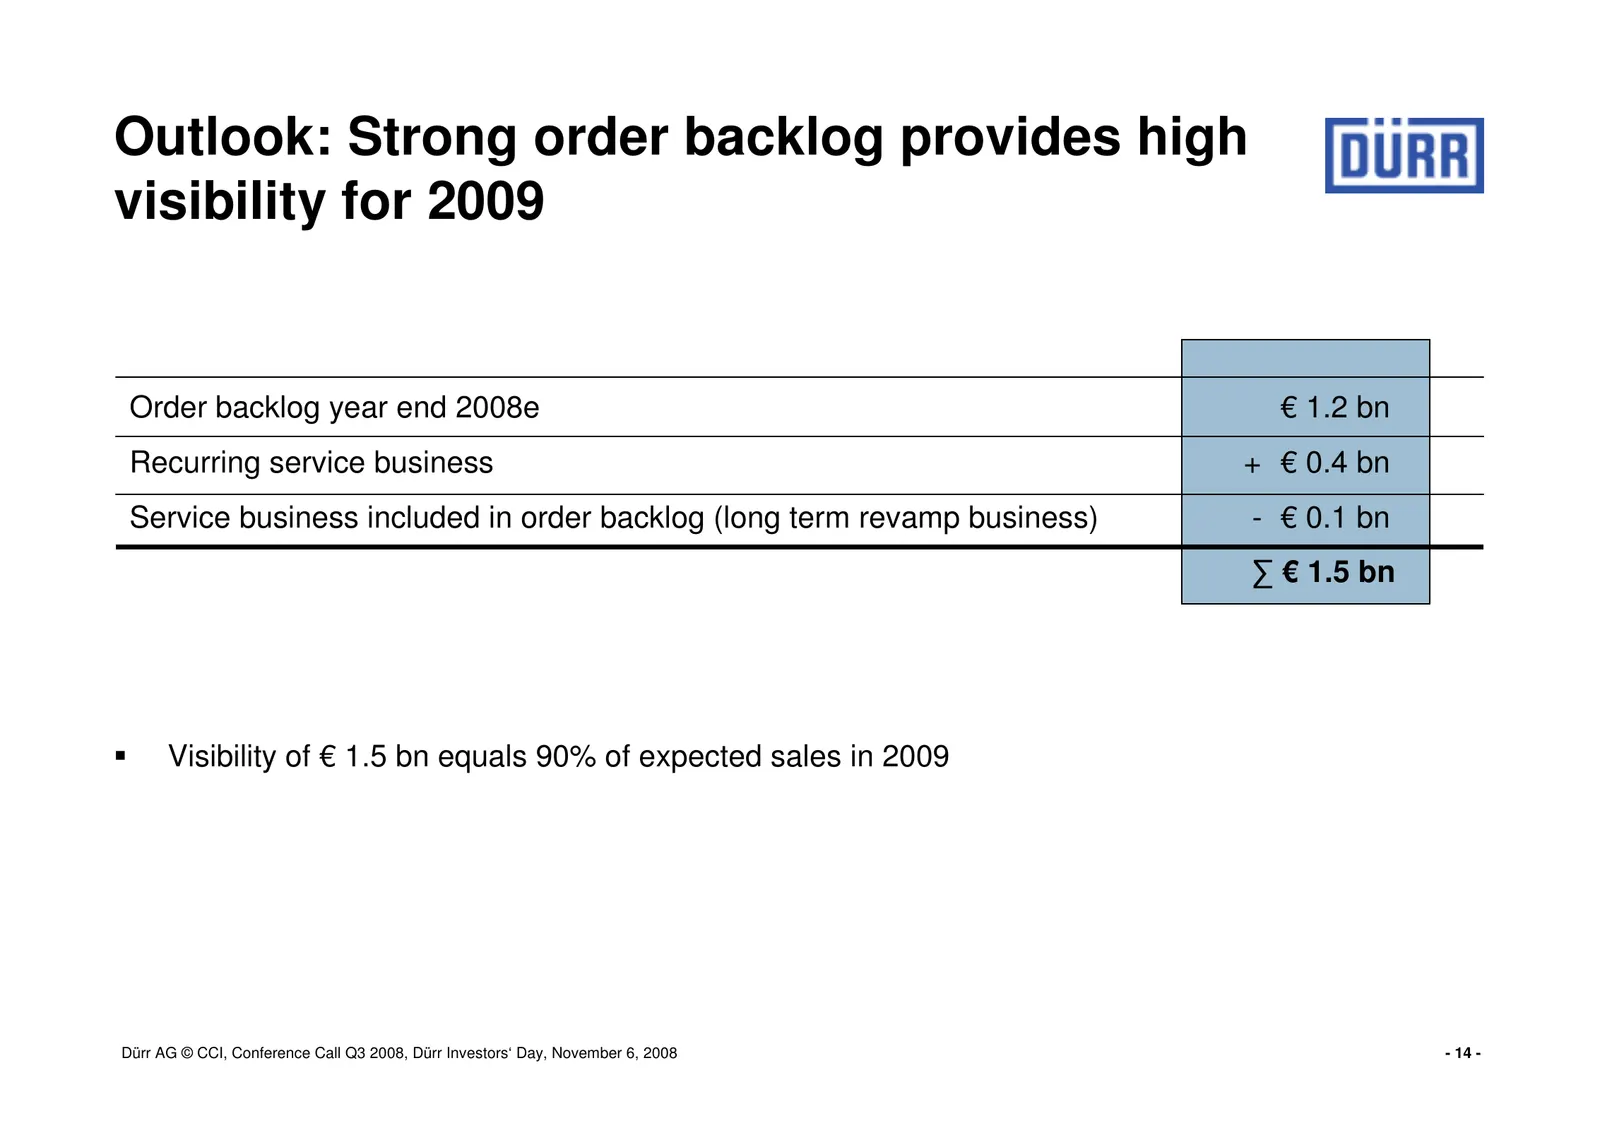
Outlook: Strong order backlog provides high visibility for 2009 Order backlog year end 2008e € 1.2 bn Recurring service business + € 0.4 bn Service business included in order backlog (long term revamp business) - € 0.1 bn ∑ € 1.5 bn Visibility of € 1.5 bn equals 90% of expected sales in 2009 Dürr AG
Slide 15: Drivers for future business growth remain robust
Drivers for future business growth remain robust 1. Volume growth in emerging markets 2. Dürr´s leading technology contributes to CPU reductions (e.g. energy + material consumption) and lower emissions 3. Strong position in small car plant tooling. Small cars are the strongest growing market segment
Slide 16: Small car registrations in Europe
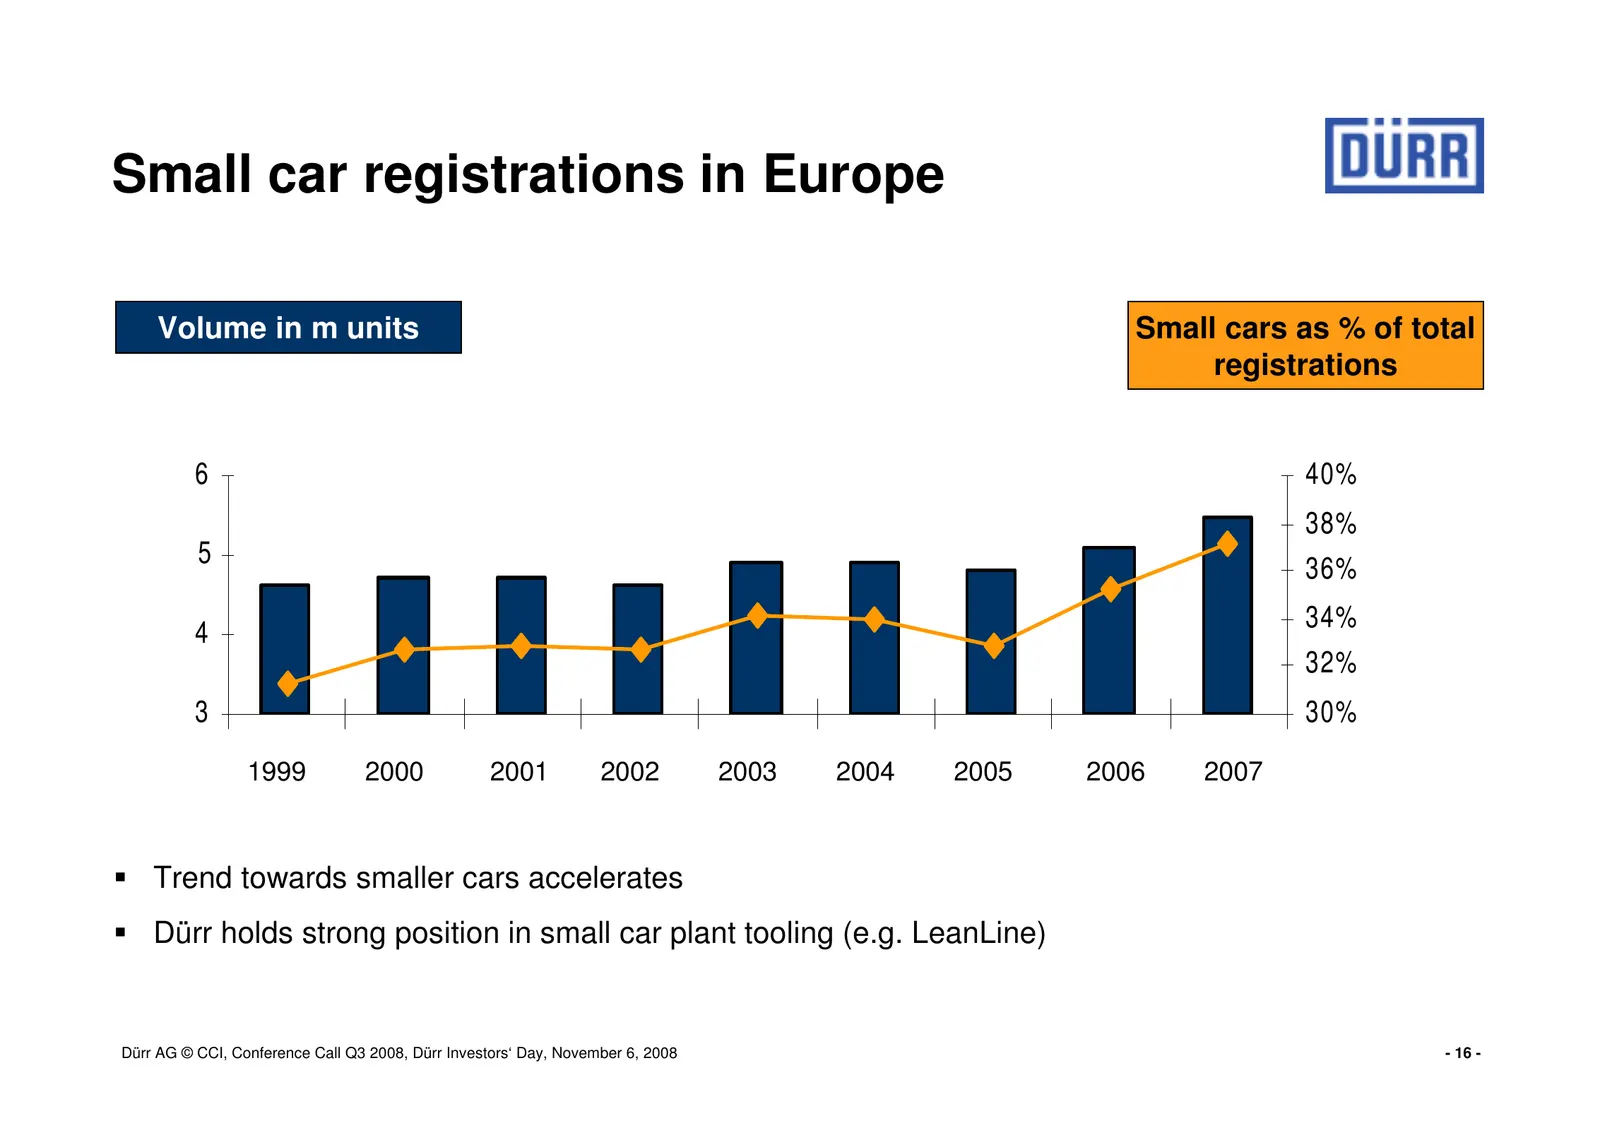
Small car registrations in Europe Volume in m units Small cars as % of total registrations 6 40% 38% 5 36% 34% 4 32% 3 30% 1999 2000 2001 2002 2003 2004 2005 2006 2007 1 2 3 4 5 6 7 8 9 Trend towards smaller cars accelerates Dürr holds strong position in small car plant tooling (e.g. LeanLine) Dürr
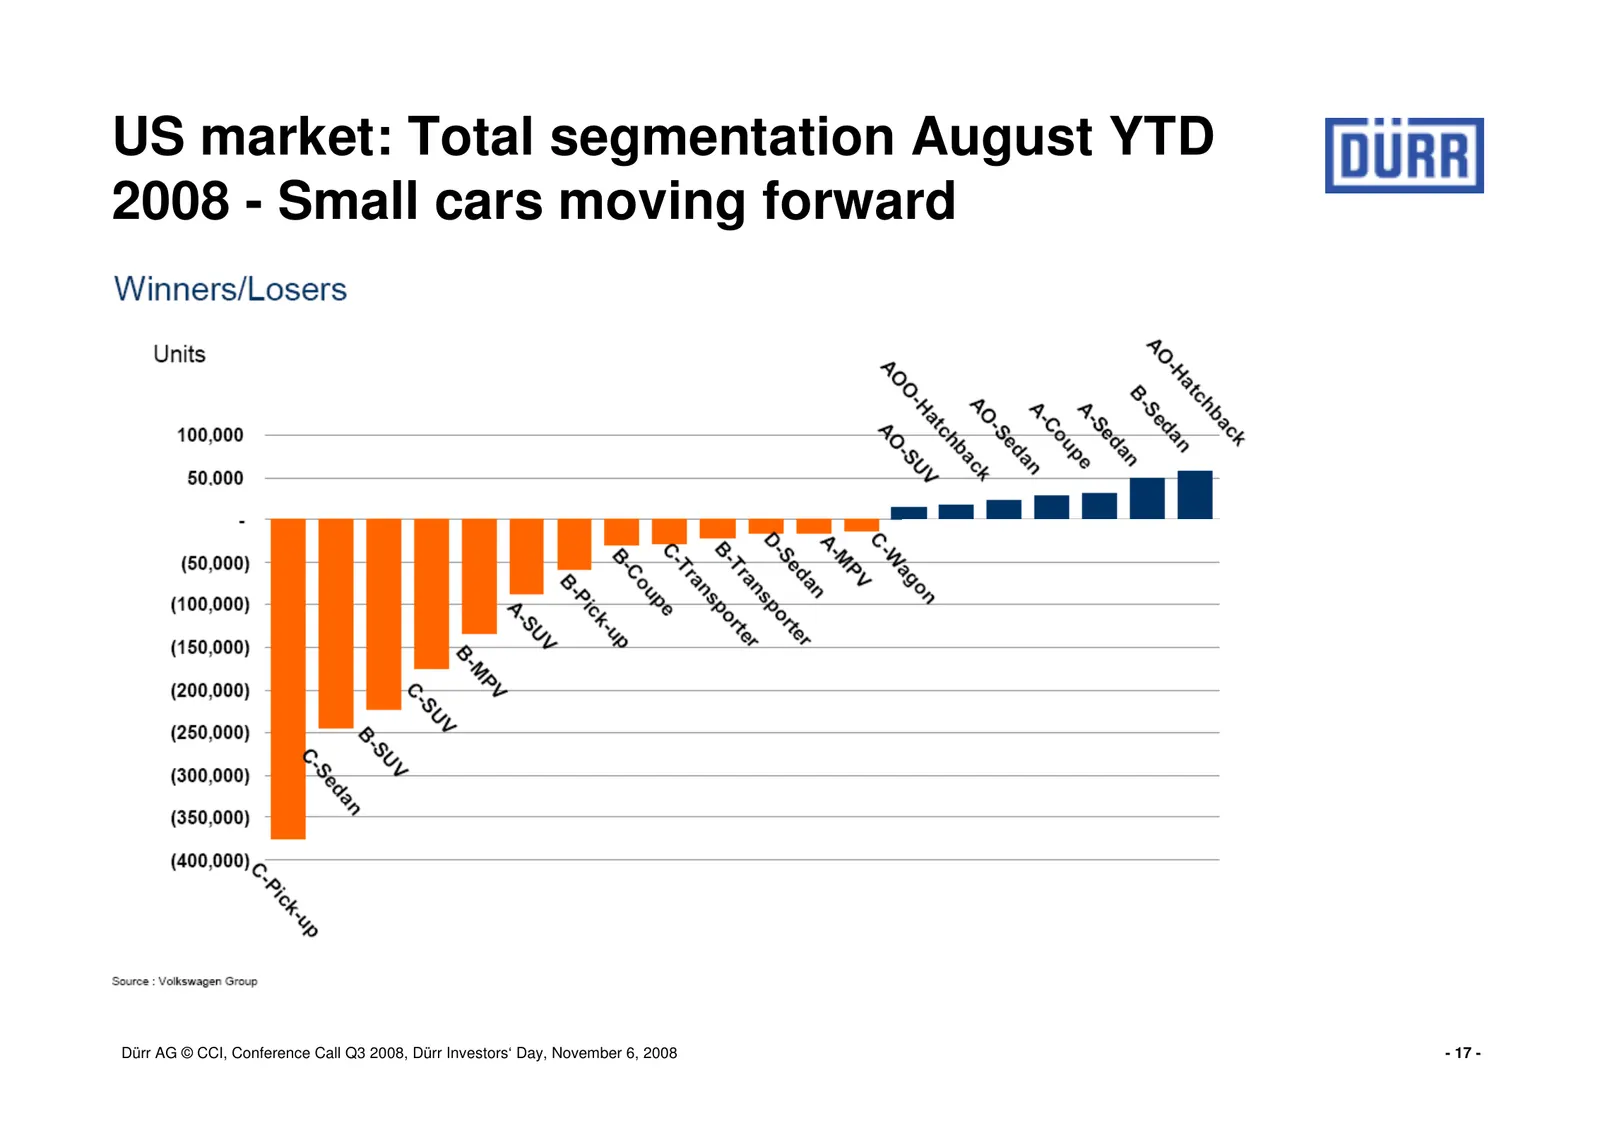
Slide 17: US market: Total segmentation August YTD 2008 - Small cars moving forward
US market: Total segmentation August YTD 2008 - Small cars moving forward Dürr AG © CCI, Conference Call Q3 2008, Dürr Investors‘ Day, November 6, 2008 - 17 -
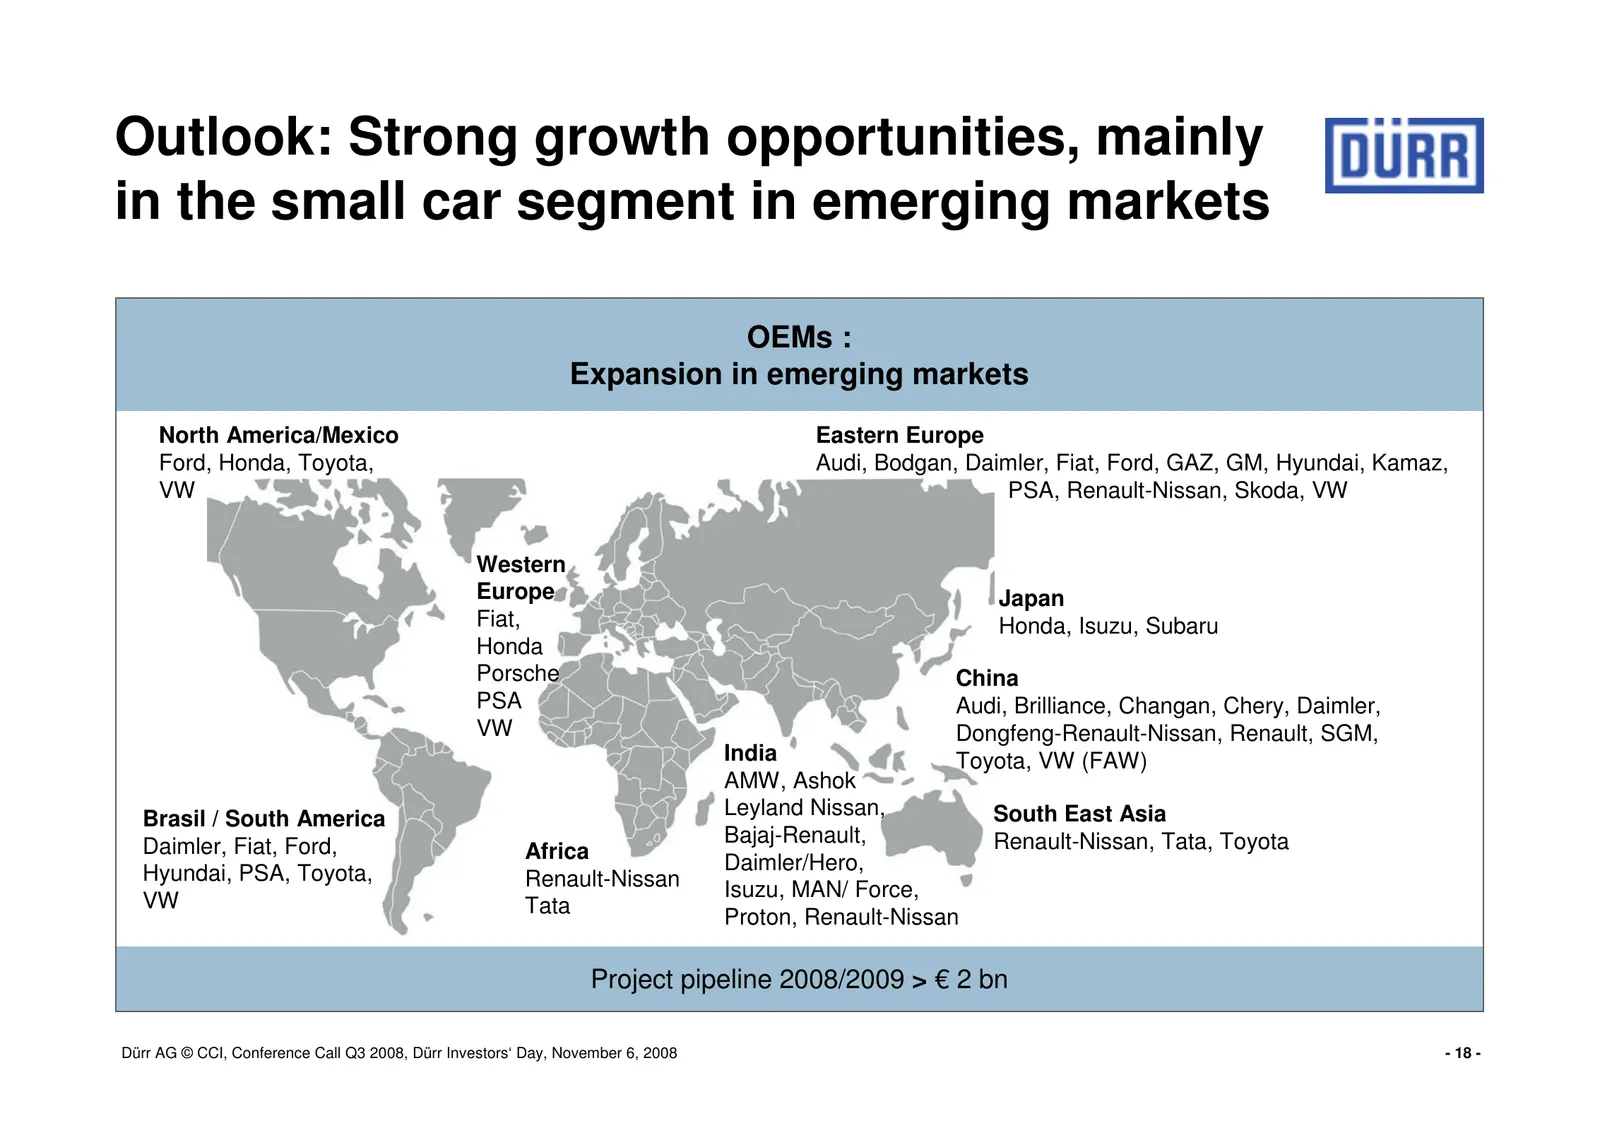
Slide 18: Outlook: Strong growth opportunities, mainly in the small car segment
Outlook: Strong growth opportunities, mainly in the small car segment in emerging markets OEMs : Expansion in emerging markets North America/Mexico Eastern Europe Ford, Honda, Toyota, Audi, Bodgan, Daimler, Fiat, Ford, GAZ, GM, Hyundai, Kamaz, VW PSA, Renault-Nissan, Skoda, VW Western Europe Japan F
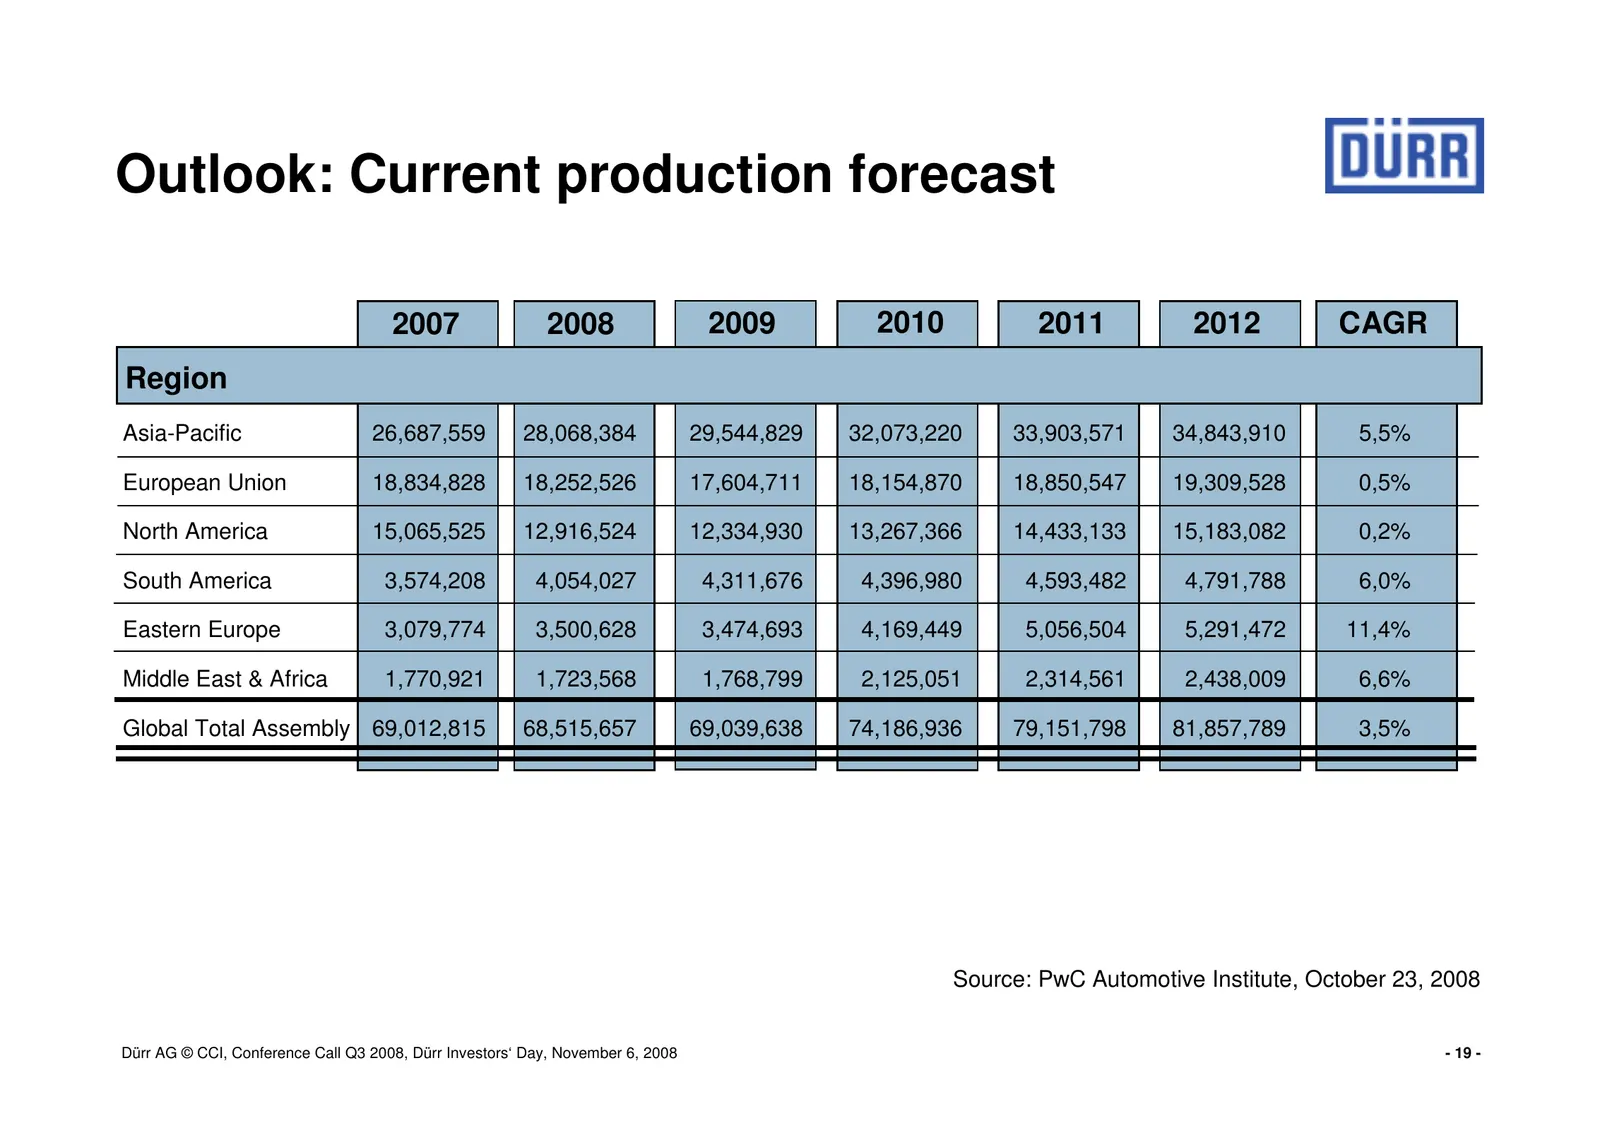
Slide 19: Outlook: Current production forecast
Outlook: Current production forecast 2007 2008 2009 2010 2011 2012 CAGR Region Asia-Pacific 26,687,559 28,068,384 29,544,829 32,073,220 33,903,571 34,843,910 5,5% European Union 18,834,828 18,252,526 17,604,711 18,154,870 18,850,547 19,309,528 0,5% North America 15,065,525 12,916,524 12,334,930 13,2
Slide 20: Well positioned for stormier weather
Well positioned for stormier weather Improved financial structure: - Equity ratio around 30% at year end 2008 - Net cash position at year end 2008; more than € 100 m cash on hand - New syndicated loan contract; unused credit line of € 200 m - Reduced interest burden from 2009 onwards High order back

Slide 21: Financial calendar
Financial calendar 11/07/2008 Berenberg Bank, Brocket Hall Conference, UK 11/11/2008 German Equity Forum, Frankfurt/M. 12/03/2008 LBBW German Industrials Conference, Zurich February 2009 Preliminary figures 2008 03/18/2009 Annual press conference & analysts’ conference 04/30/2009 Annual shareholders
Slide 22: Dürr AG © CCI, Conference Call Q3 2008, Dürr Investors‘ Day, November 6, 2008
Dürr AG © CCI, Conference Call Q3 2008, Dürr Investors‘ Day, November 6, 2008 - 22 -
Slide 23: Adjusted divisional figures 2007
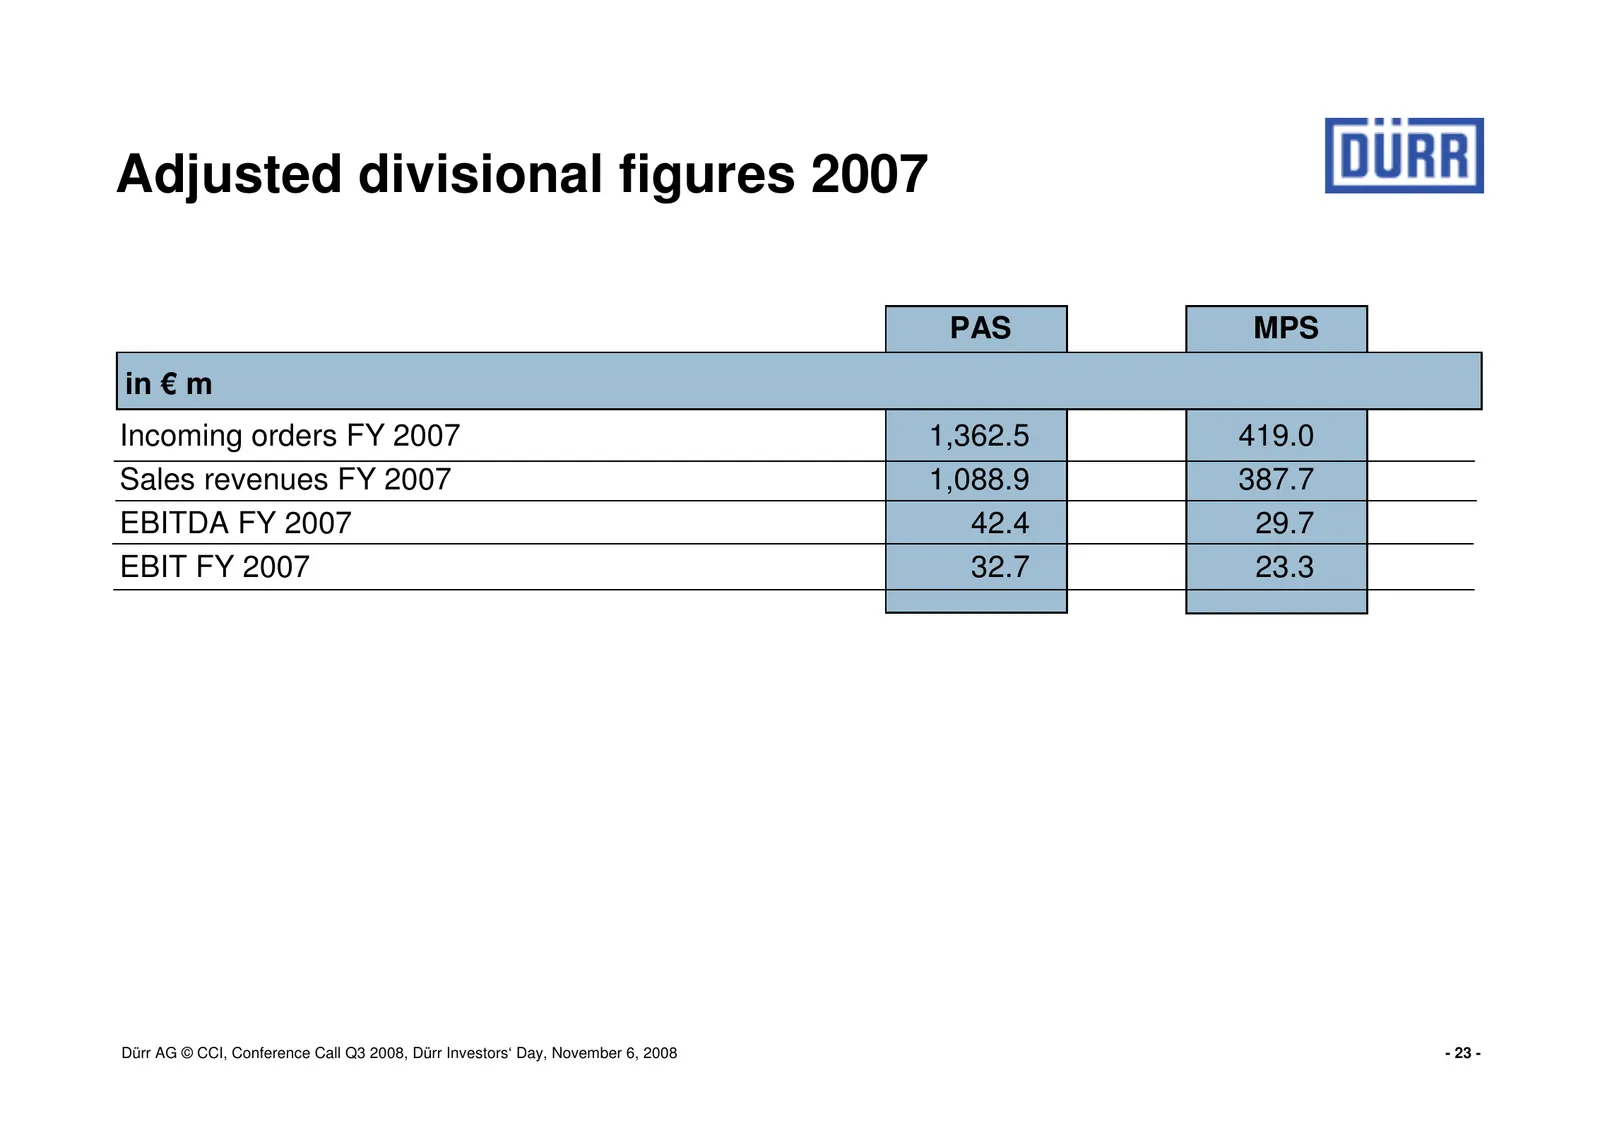
Adjusted divisional figures 2007 PAS MPS in € m Incoming orders FY 2007 1,362.5 419.0 Sales revenues FY 2007 1,088.9 387.7 EBITDA FY 2007 42.4 29.7 EBIT FY 2007 32.7 23.3 Dürr AG © CCI, Conference Call Q3 2008, Dürr Investors‘ Day, November 6, 2008 - 23 -
Slide 24: Shareholder structure as of November 1, 2008
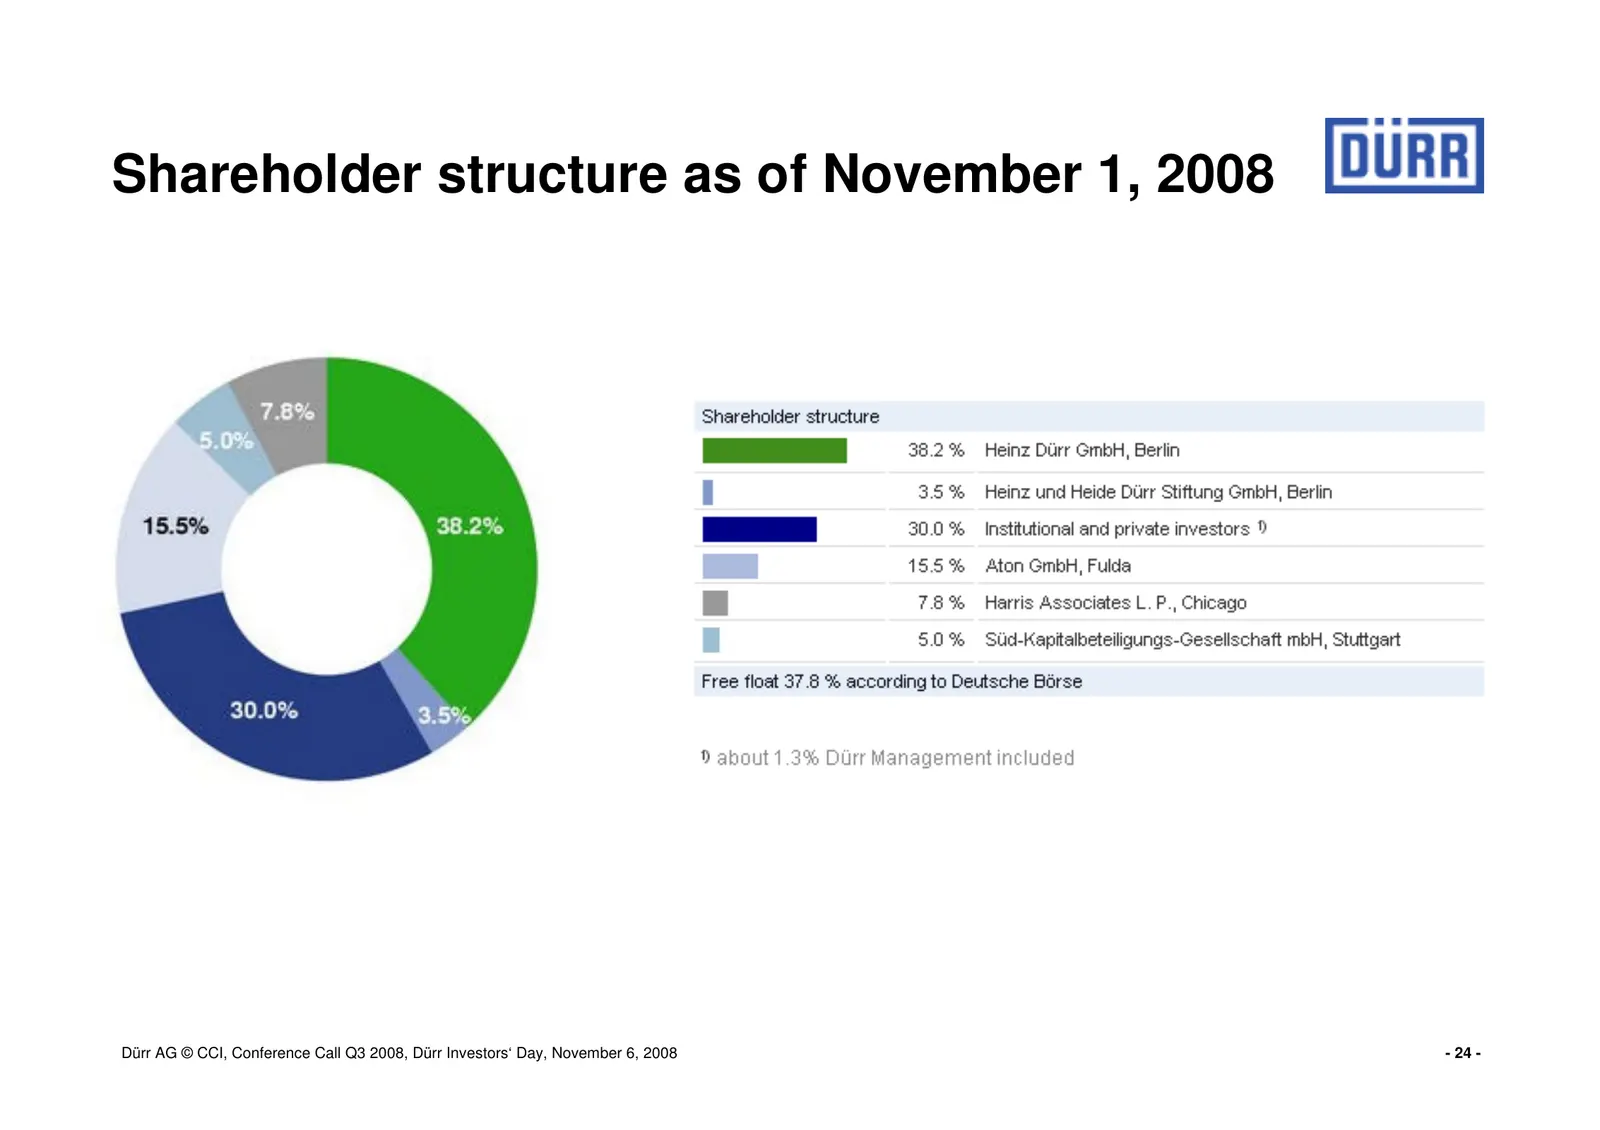
Shareholder structure as of November 1, 2008 Dürr AG © CCI, Conference Call Q3 2008, Dürr Investors‘ Day, November 6, 2008 - 24 -
Slide 25: Work in process and progress billings (prepayments)
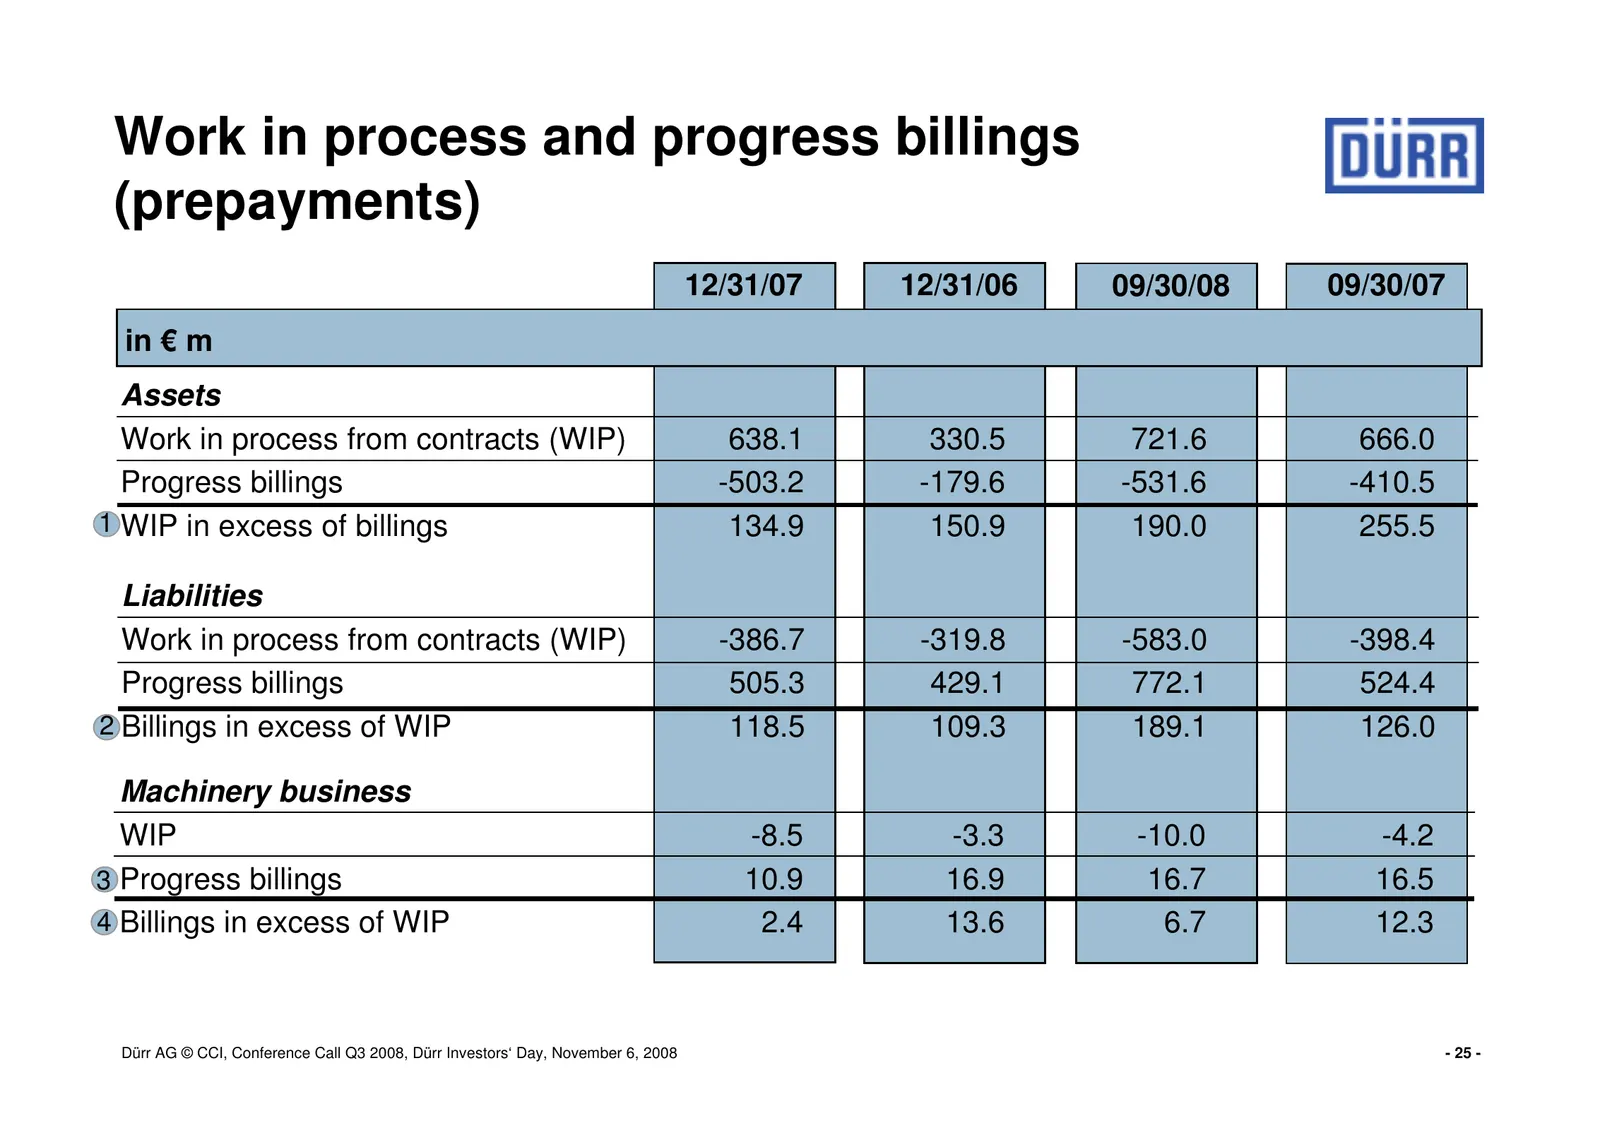
Work in process and progress billings (prepayments) 12/31/07 12/31/06 09/30/08 09/30/07 in € m Assets Work in process from contracts (WIP) 638.1 330.5 721.6 666.0 Progress billings -503.2 -179.6 -531.6 -410.5 1 WIP in excess of billings 134.9 150.9 190.0 255.5 Liabilities Work in process from contra
Slide 26: Work in process and progress billings (prepayments)
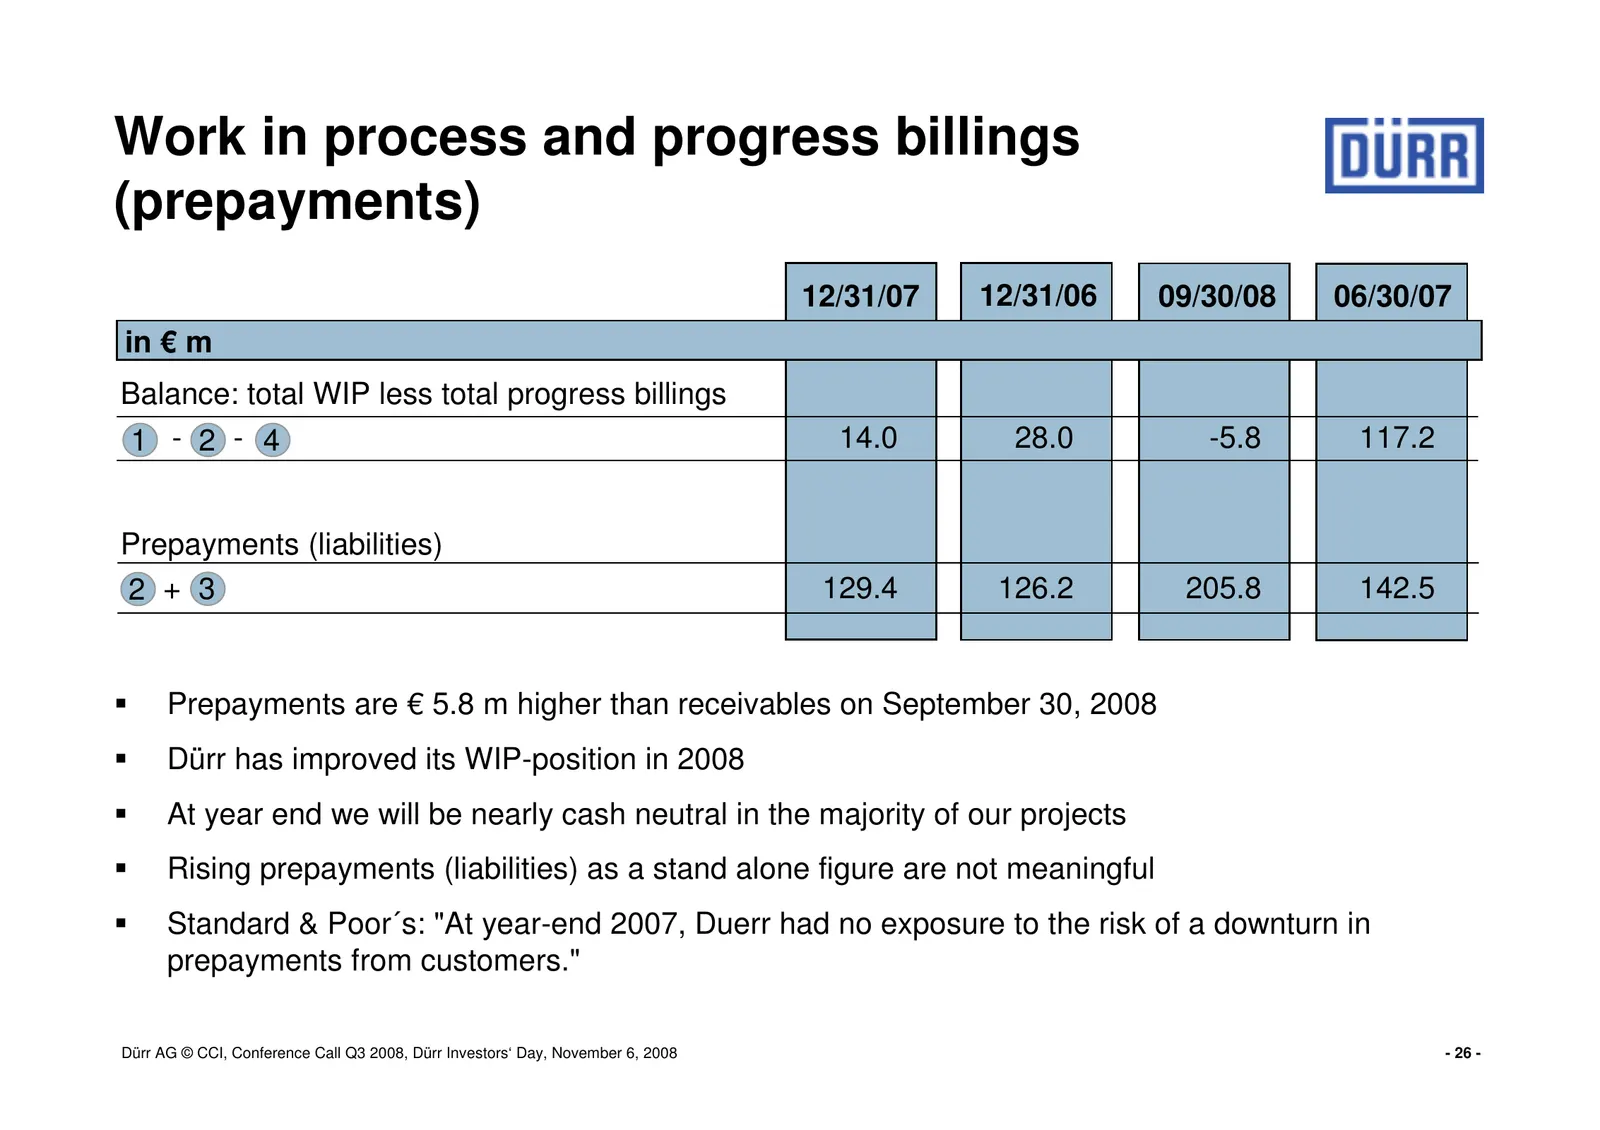
Work in process and progress billings (prepayments) 12/31/07 12/31/06 09/30/08 06/30/07 in € m Balance: total WIP less total progress billings 1 - 2 - 4 14.0 28.0 -5.8 117.2 Prepayments (liabilities) 2 + 3 129.4 126.2 205.8 142.5 Prepayments are € 5.8 m higher than receivables on September 30, 2008
Source: Internet Archive copy of durr.com
More decks from Durr AG
 Q3 2026 Earnings Presentation33 slides · Nov 12, 2026
 Q2 2026 Earnings Presentation39 slides · Aug 6, 2026
 Q1 2026 Earnings Presentation35 slides · May 12, 2026
 Fact Sheet (2025)2 slides · Dec 2, 2025
 Q3 2025 Earnings Presentation46 slides · Nov 13, 2025
 Q2 2025 Earnings Presentation31 slides · Jul 24, 2025