Atlas Financial — Q1 2014 Earnings Presentation
17 slides from Atlas Financial's earnings presentation, May 7, 2014
Slide 1: First Quarter 2014 Conference Call
First Quarter 2014 Conference Call May 8, 2014 1
Slide 2: Safe Harbor / Atlas Snapshot
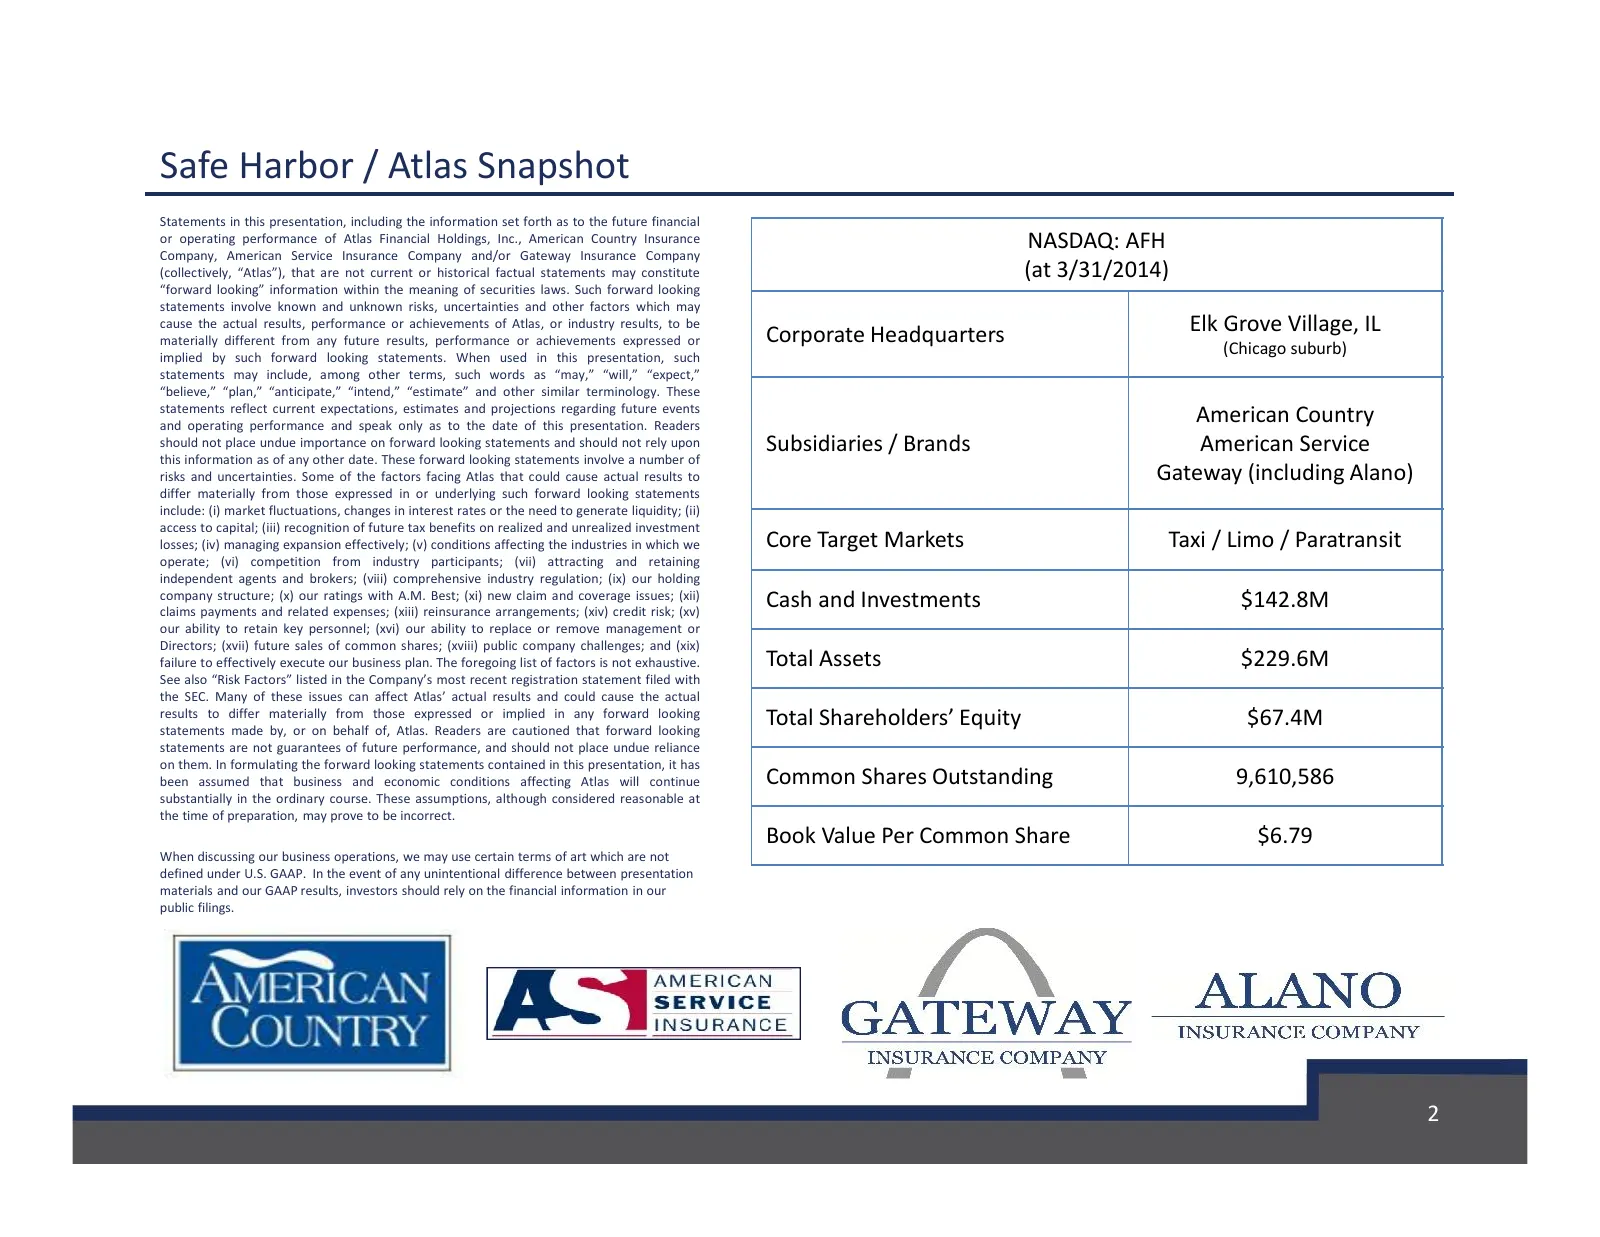
Safe Harbor / Atlas Snapshot Statements in this presentation, including the information set forth as to the future financial or operating performance of Atlas Financial Holdings, Inc., American Country Insurance NASDAQ: AFH Company, American Service Insurance Company and/or Gateway Insurance Company
Slide 3: 2014 First Quarter Underwriting Highlights
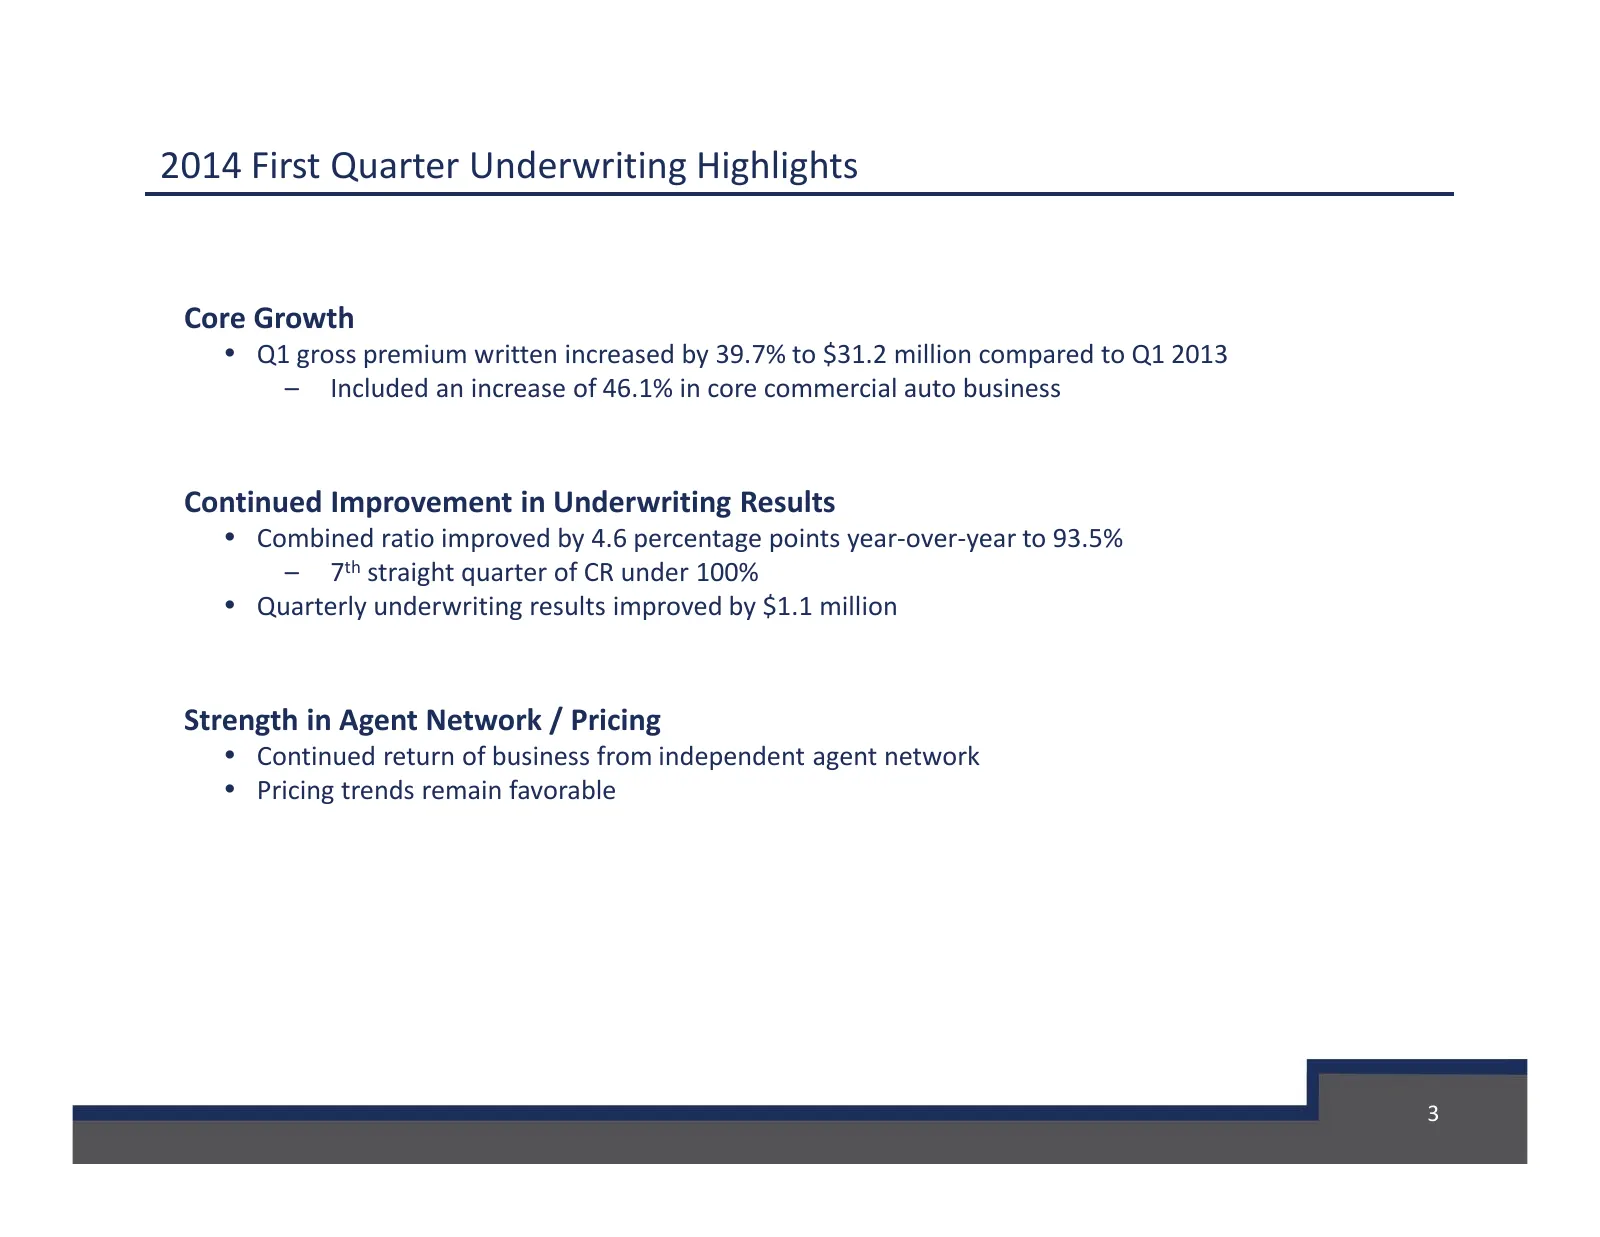
2014 First Quarter Underwriting Highlights Core Growth • Q1 gross premium written increased by 39.7% to $31.2 million compared to Q1 2013 – Included an increase of 46.1% in core commercial auto business Continued Improvement in Underwriting Results • Combined ratio improved by 4.6 percentage points
Slide 4: Geographic Expansion
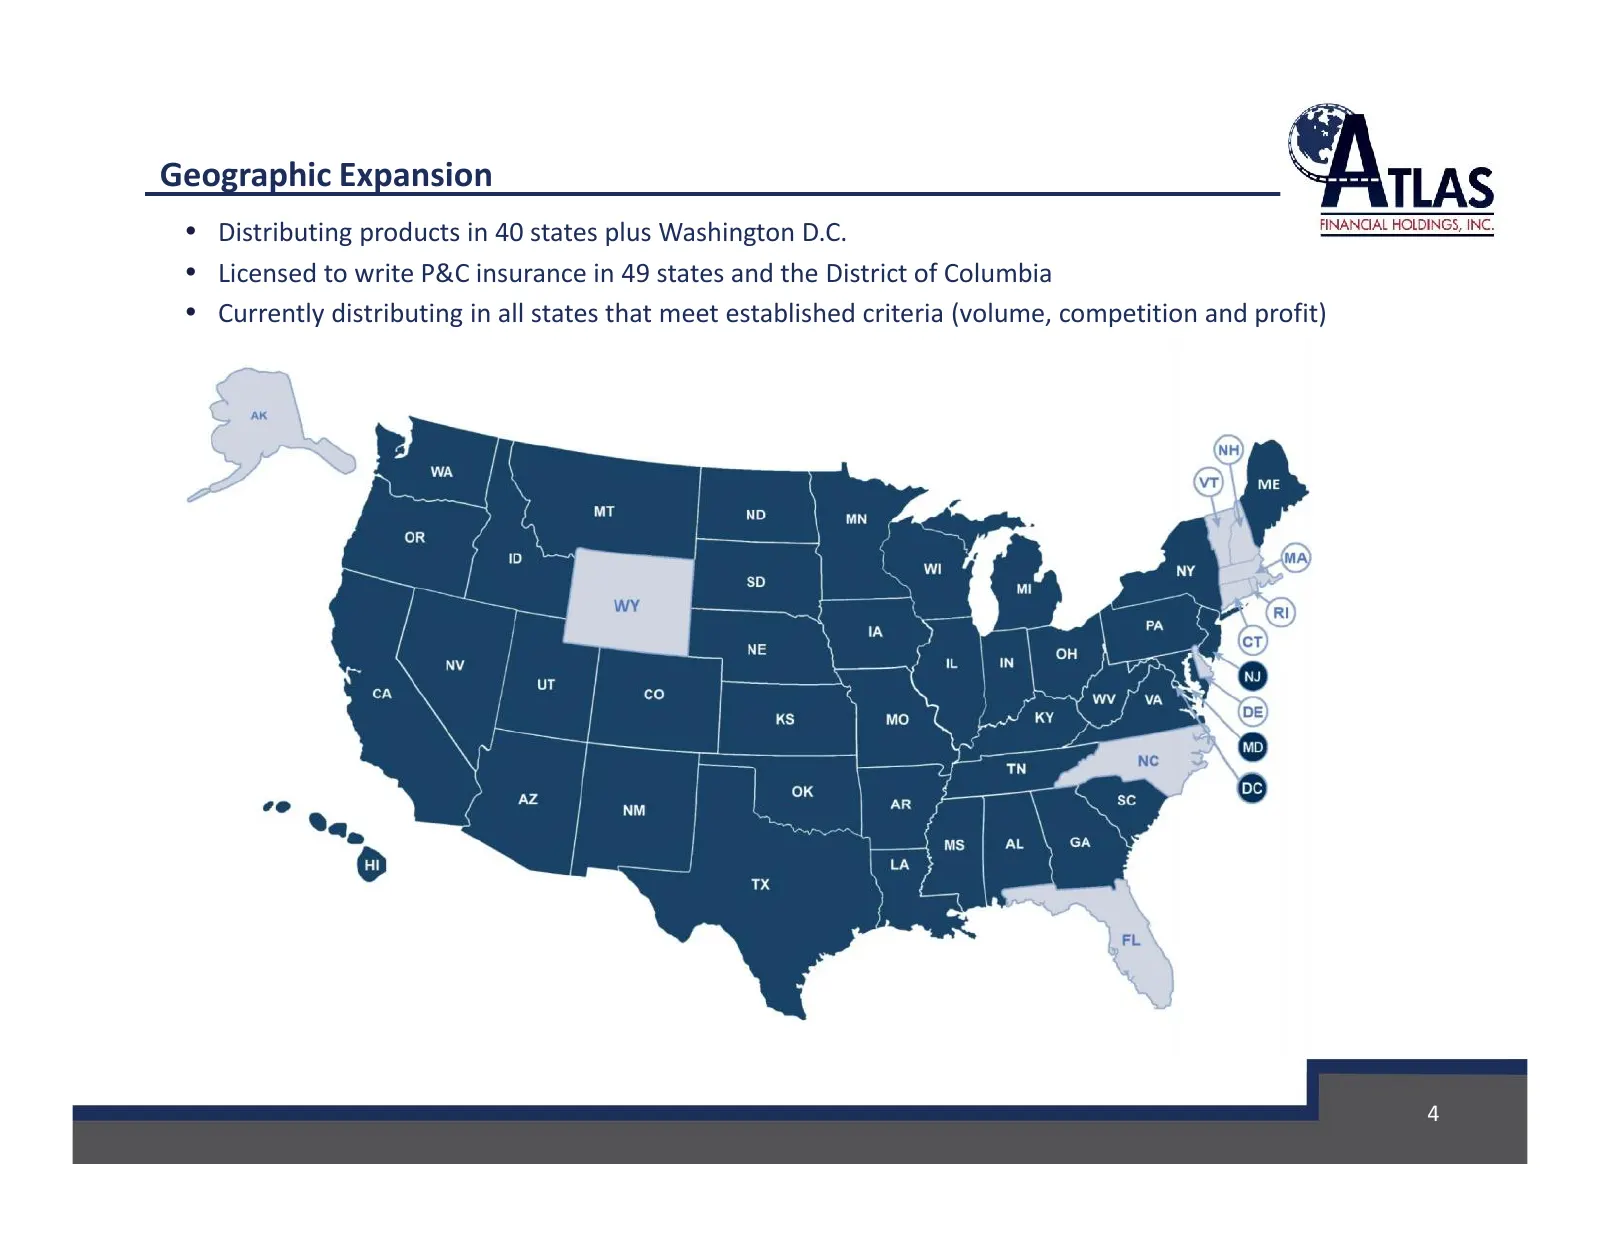
Geographic Expansion • Distributing products in 40 states plus Washington D.C. • Licensed to write P&C insurance in 49 states and the District of Columbia • Currently distributing in all states that meet established criteria (volume, competition and profit) 4
Slide 5: Agent Trends / Geographic Diversification
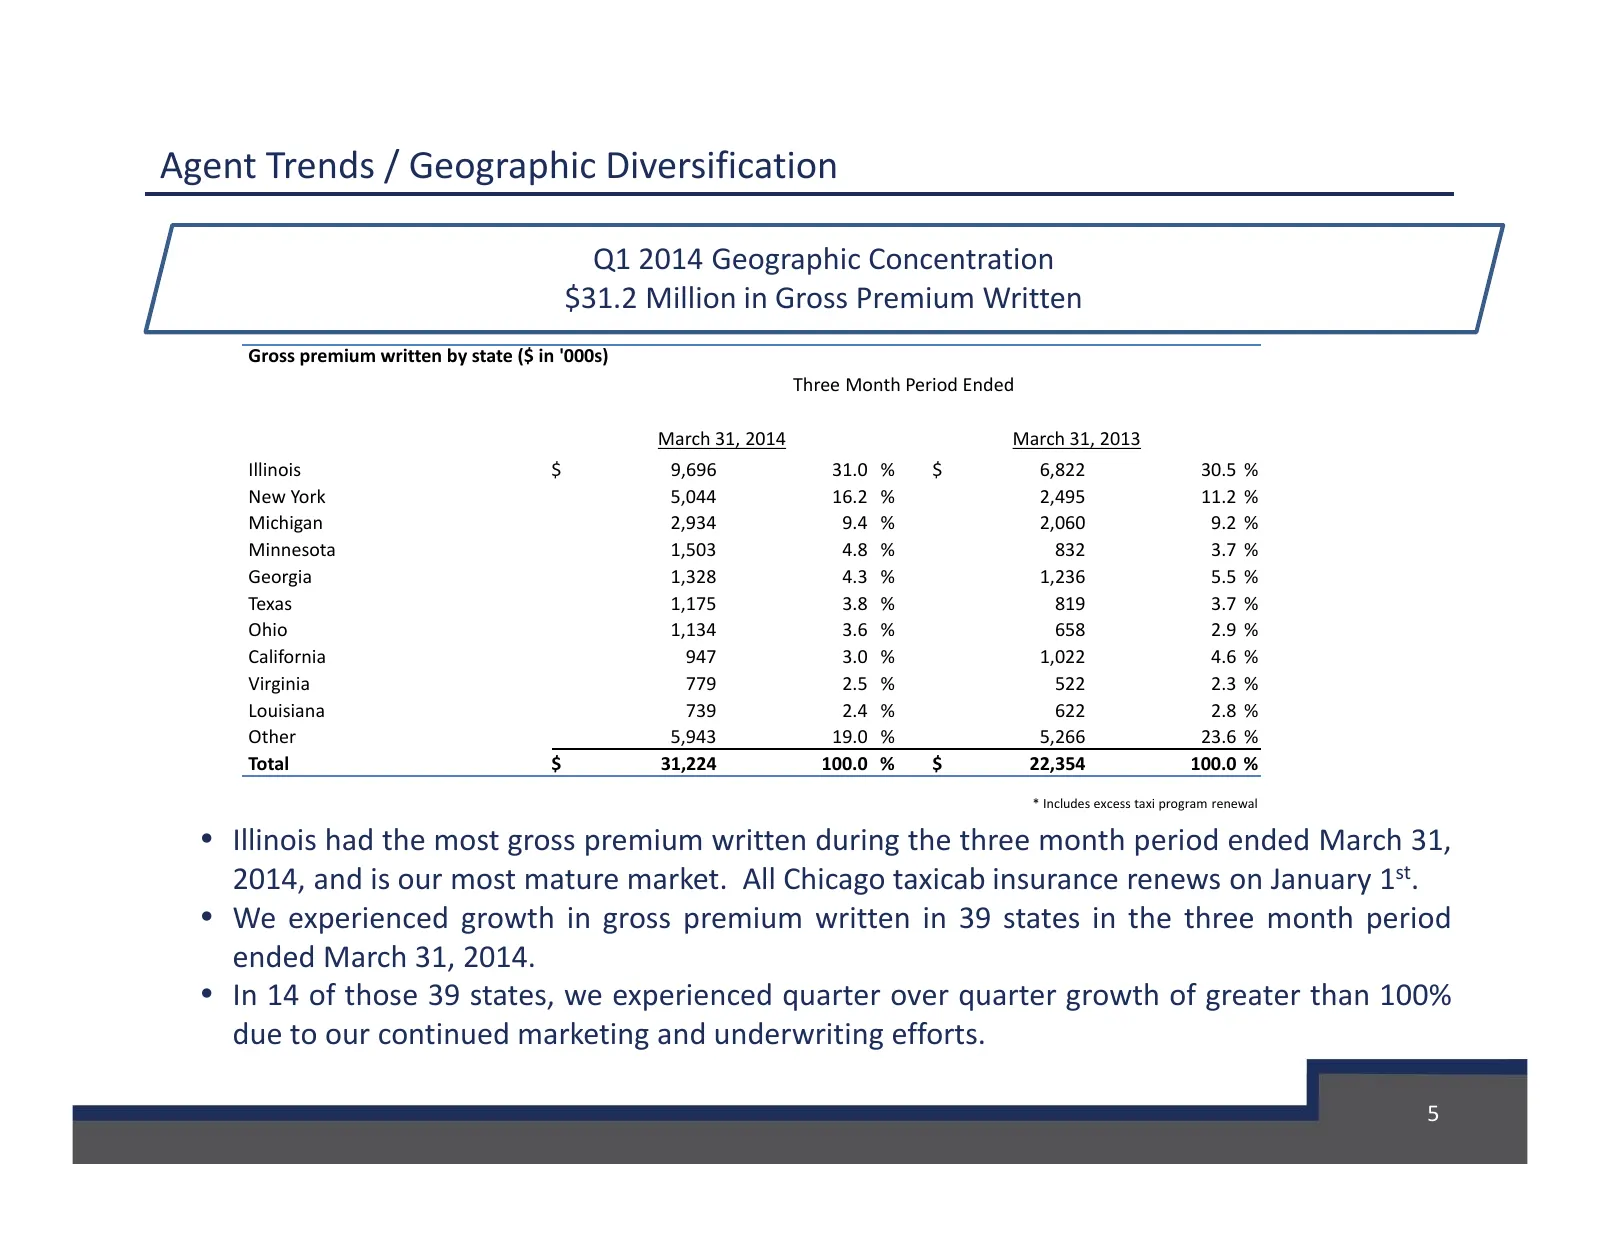
Agent Trends / Geographic Diversification Q1 2014 Geographic Concentration $31.2 Million in Gross Premium Written Gross premium written by state ($ in '000s) Three Month Period Ended March 31, 2014 March 31, 2013 Illinois $ 9,696 31.0 % $ 6,822 30.5 % New York 5,044 16.2 % 2,495 11.2 % Michigan 2,93
Slide 6: Considerable Financial Improvement Since 2010 Realignment – Focus on Core
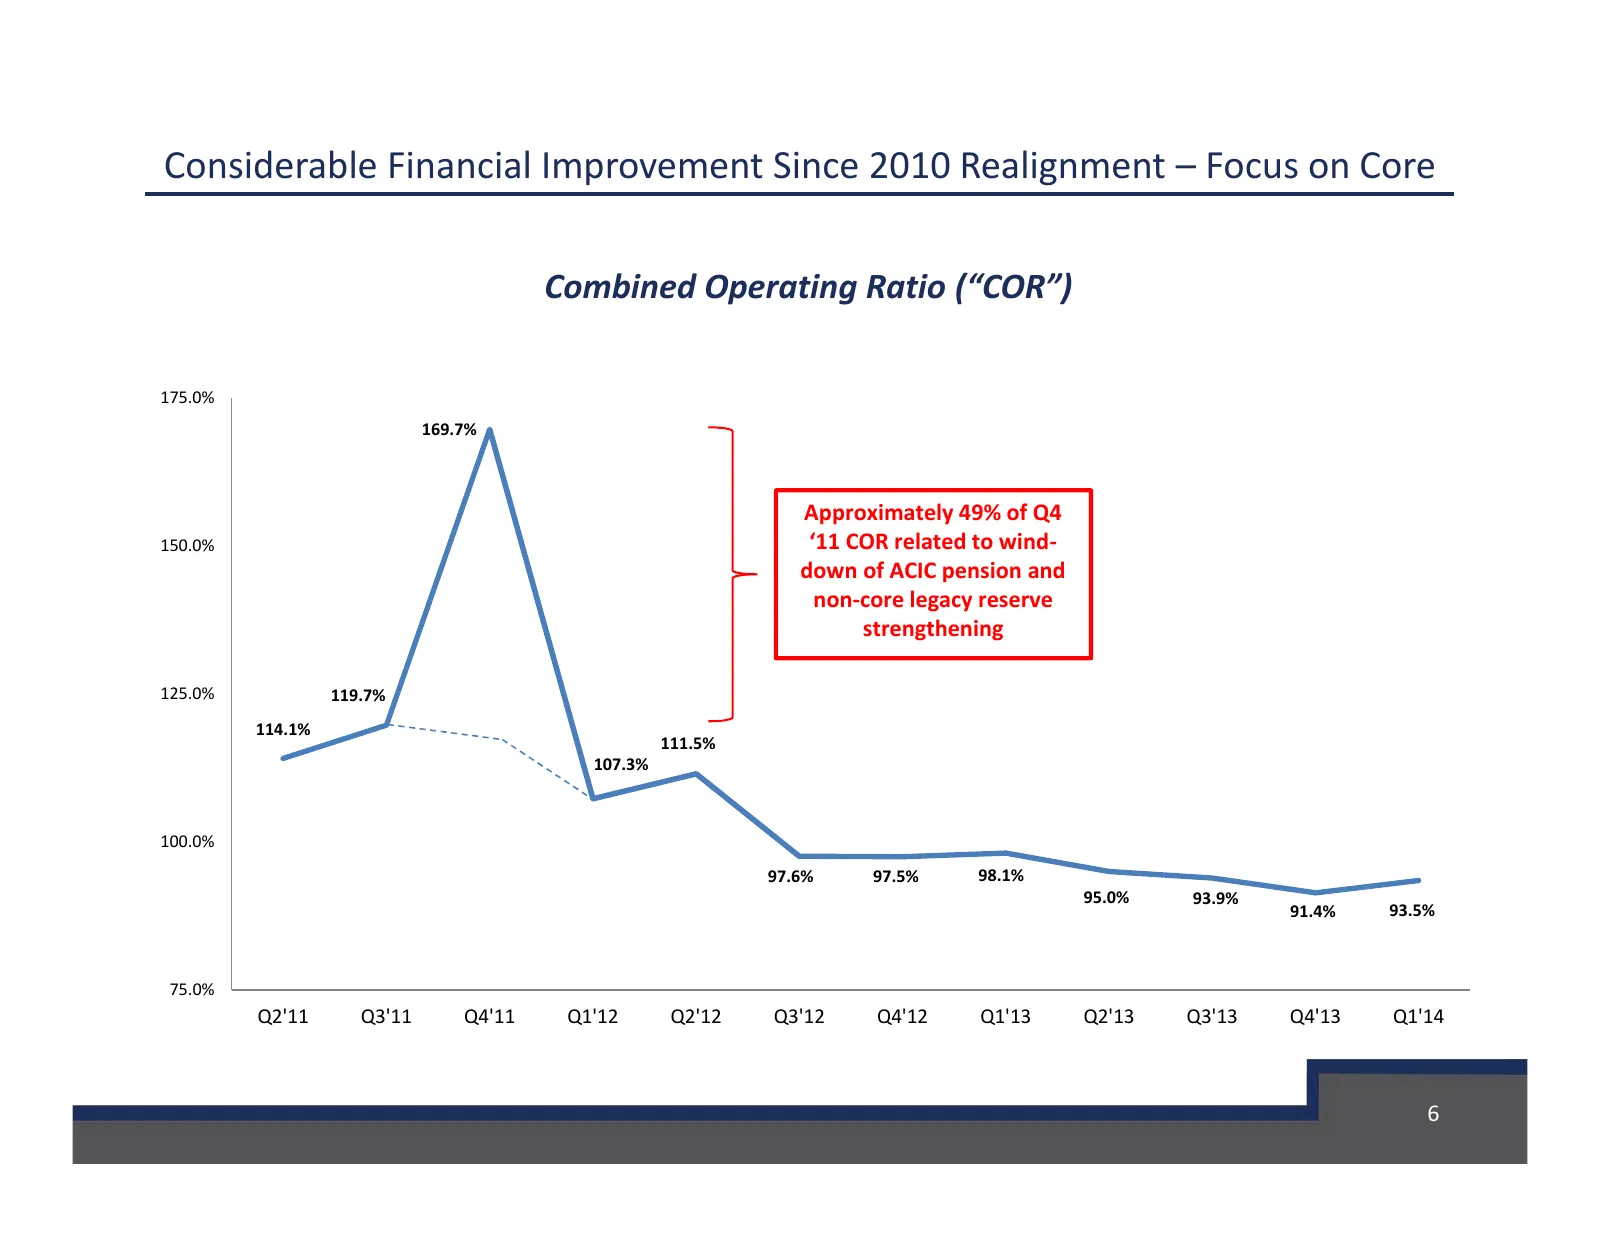
Considerable Financial Improvement Since 2010 Realignment – Focus on Core Combined Operating Ratio (“COR”) 175.0% 169.7% Approximately 49% of Q4 150.0% ‘11 COR related to wind- down of ACIC pension and non-core legacy reserve strengthening 125.0% 119.7% 114.1% 111.5% 107.3% 100.0% 97.6% 97.5% 98.1%
Slide 7: Focus on Core Underwriting
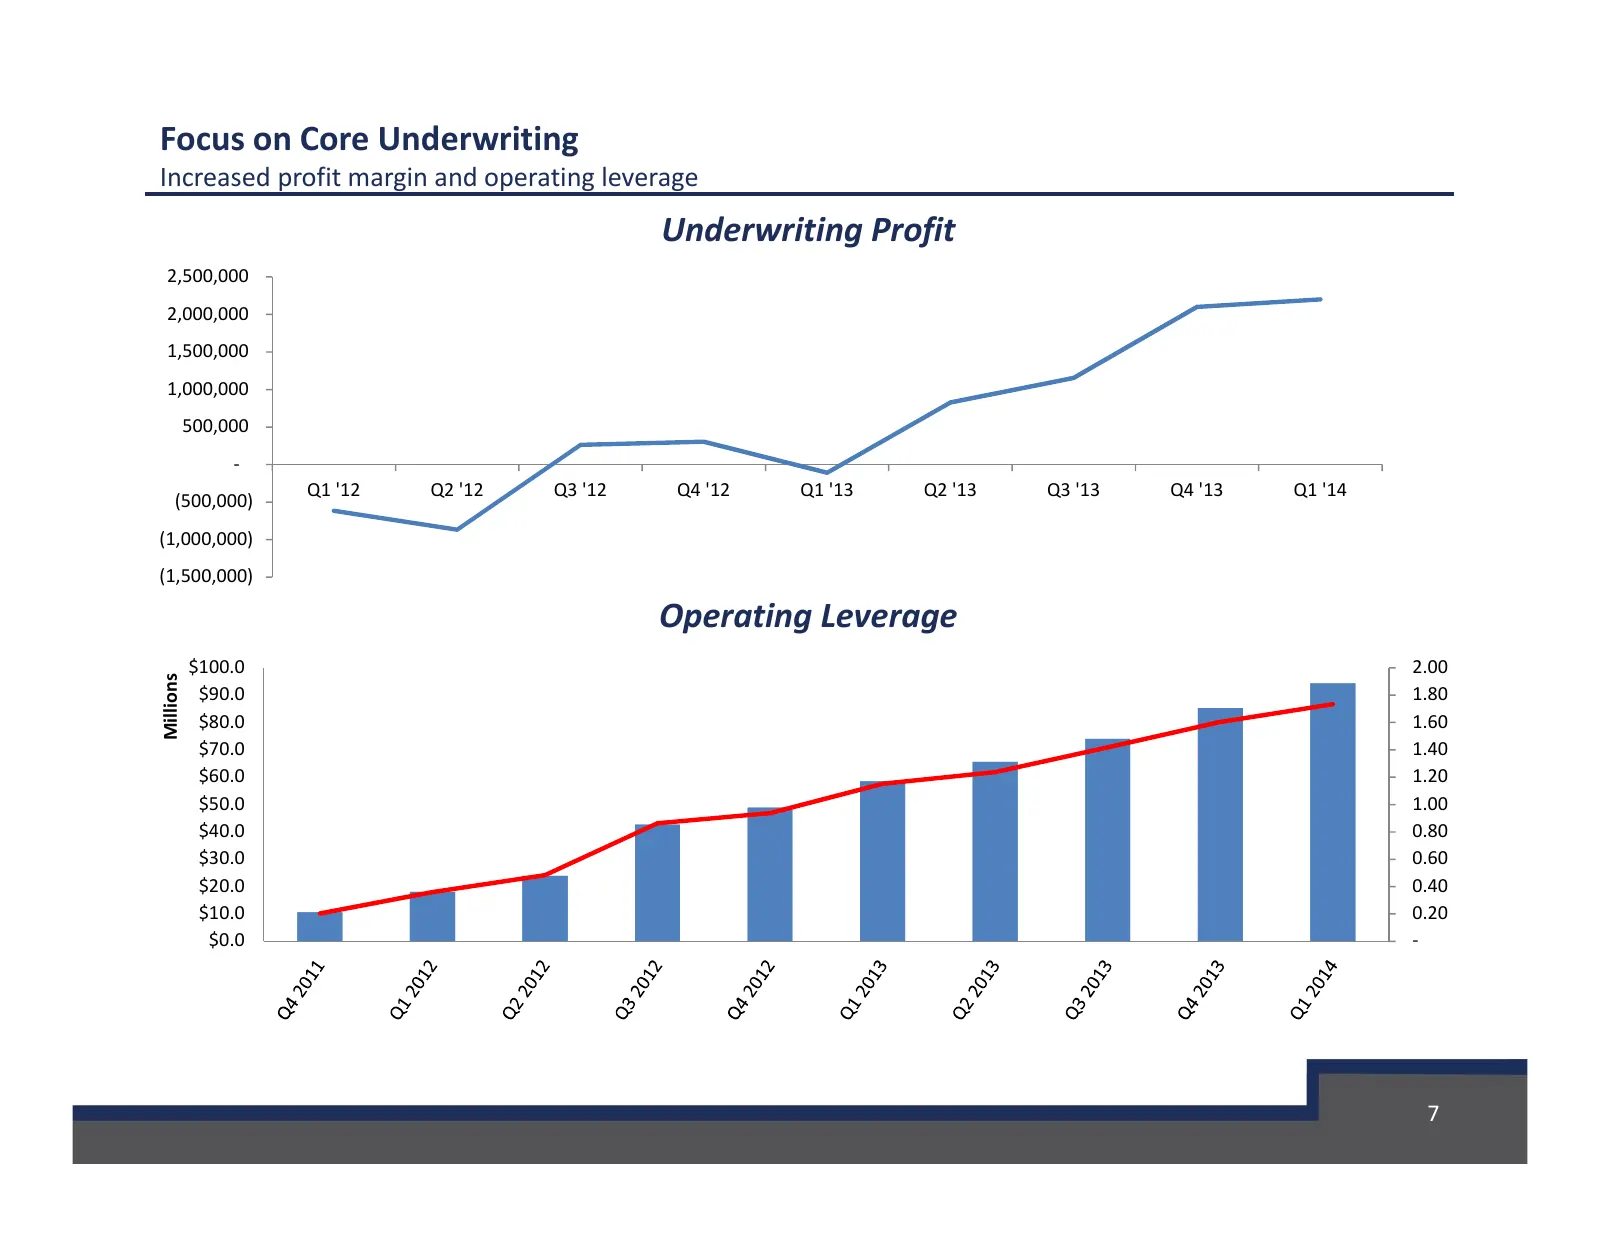
Focus on Core Underwriting Increased profit margin and operating leverage Underwriting Profit 2,500,000 2,000,000 1,500,000 1,000,000 500,000 - Q1 '12 Q2 '12 Q3 '12 Q4 '12 Q1 '13 Q2 '13 Q3 '13 Q4 '13 Q1 '14 (500,000) (1,000,000) (1,500,000) Operating Leverage $100.0 2.00 Millions $90.0 1.80 $80.0 1.
Slide 8: Operating Activities: Underwriting
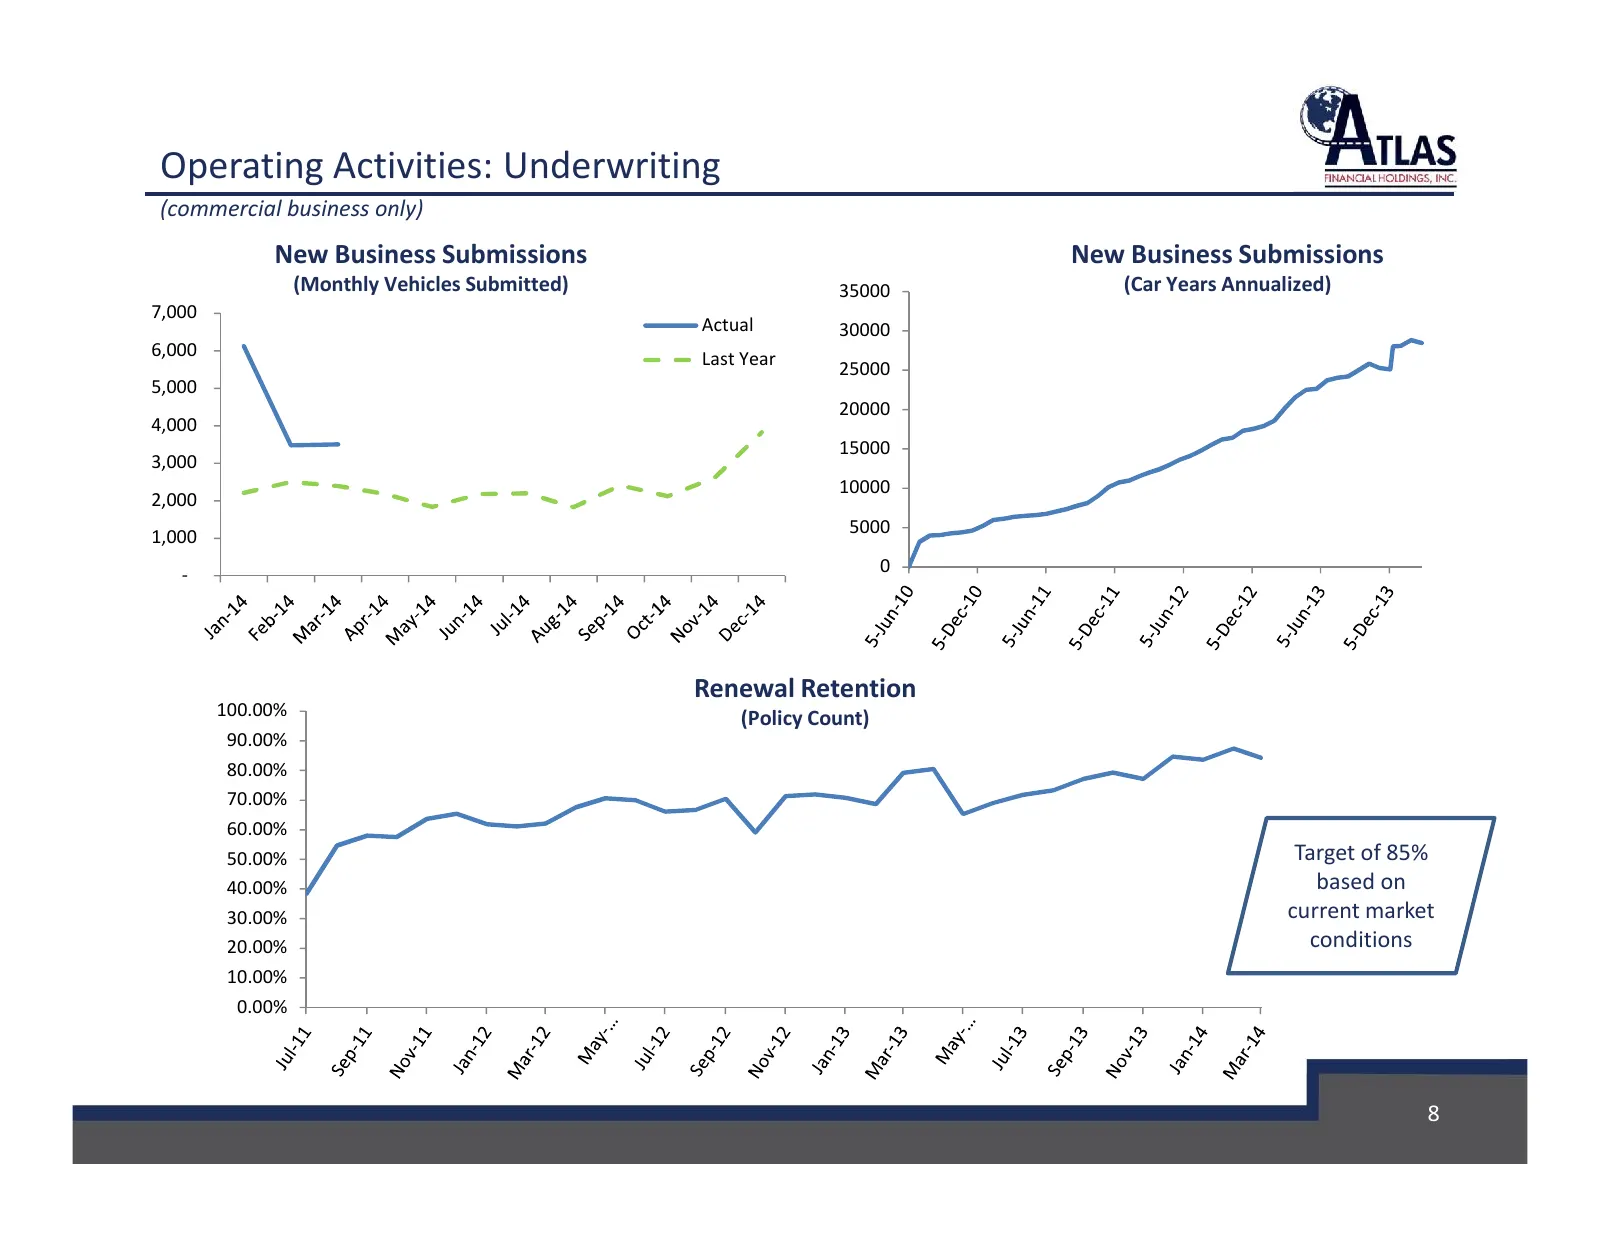
Operating Activities: Underwriting (commercial business only) New Business Submissions New Business Submissions (Monthly Vehicles Submitted) 35000 (Car Years Annualized) 7,000 Actual 30000 6,000 Last Year 25000 5,000 20000 4,000 15000 3,000 10000 2,000 5000 1,000 - 0 Renewal Retention 100.00% (Polic
Slide 9: Operating Activities: Underwriting
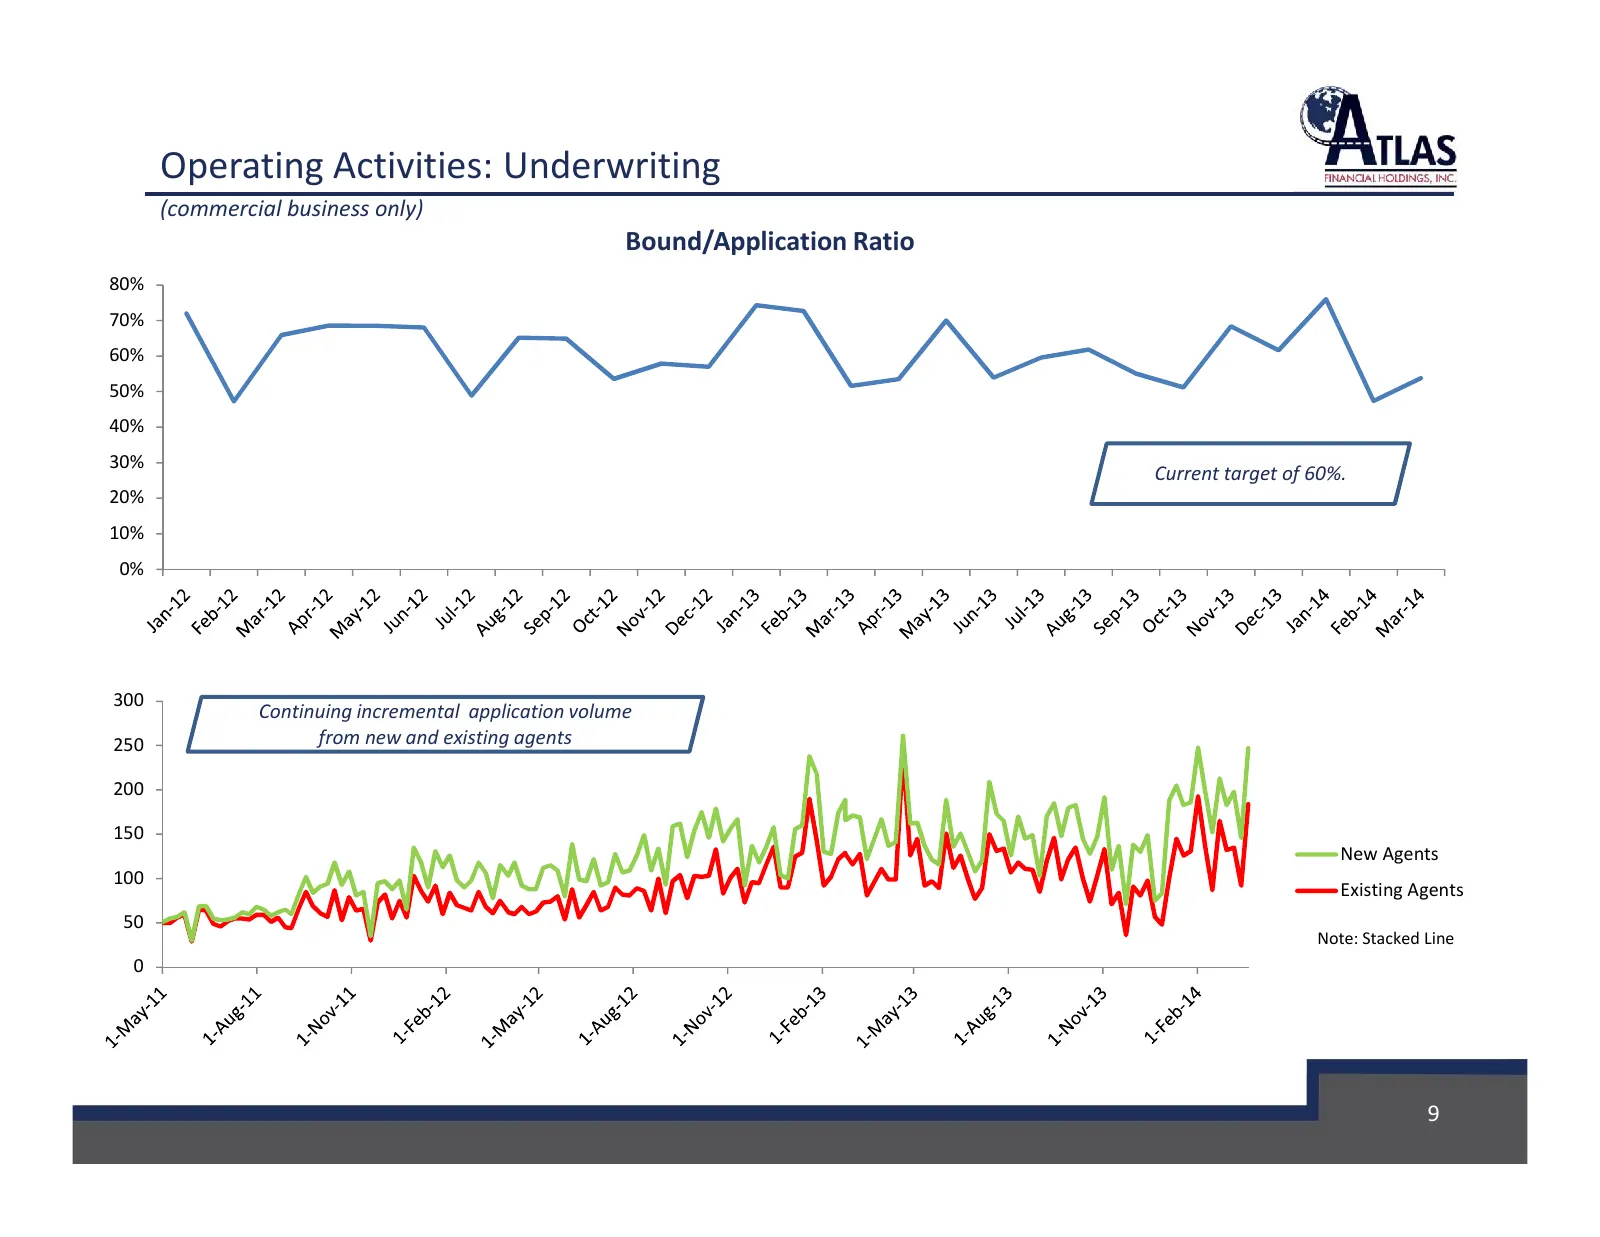
Operating Activities: Underwriting (commercial business only) Bound/Application Ratio 80% 70% 60% 50% 40% 30% Current target of 60%. 20% 10% 0% 300 Continuing incremental application volume 250 from new and existing agents 200 150 New Agents 100 Existing Agents 50 Note: Stacked Line 0 9
Slide 10: Steady Rate Increases In Commercial Auto
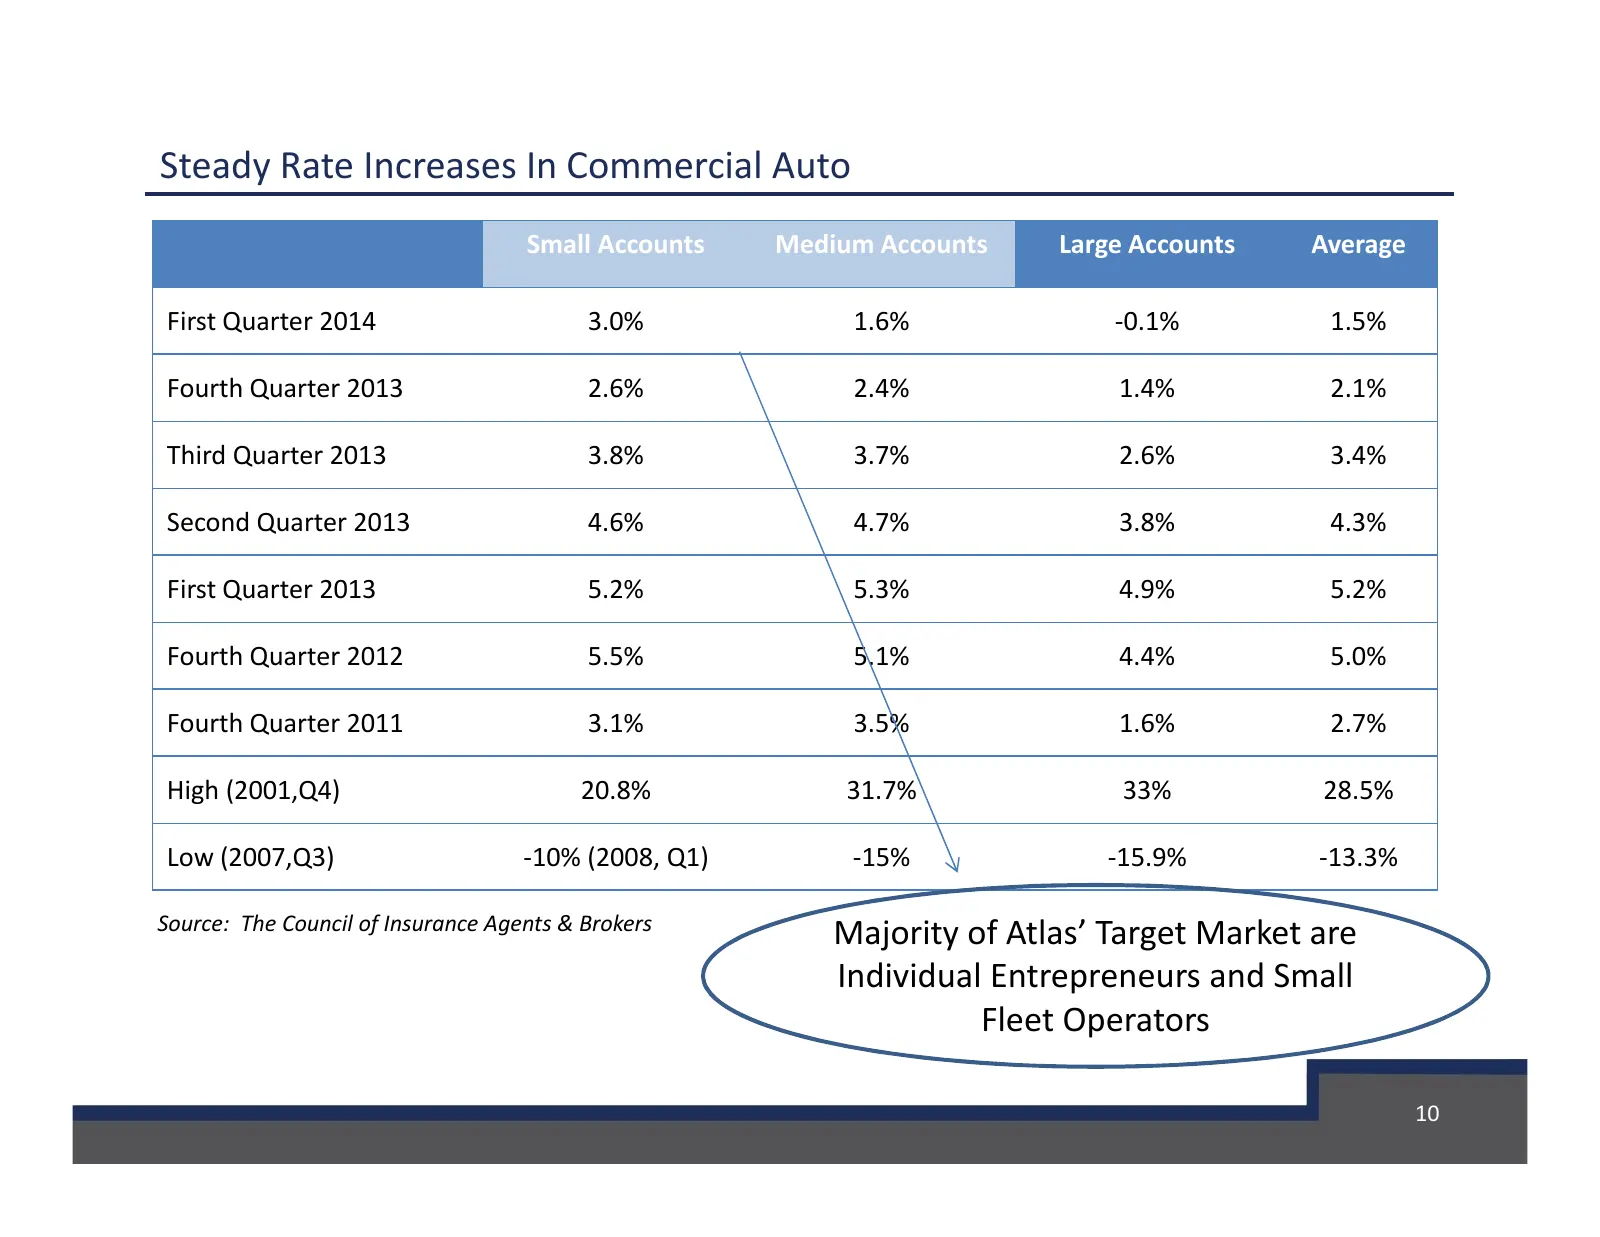
Steady Rate Increases In Commercial Auto Small Accounts Medium Accounts Large Accounts Average First Quarter 2014 3.0% 1.6% -0.1% 1.5% Fourth Quarter 2013 2.6% 2.4% 1.4% 2.1% Third Quarter 2013 3.8% 3.7% 2.6% 3.4% Second Quarter 2013 4.6% 4.7% 3.8% 4.3% First Quarter 2013 5.2% 5.3% 4.9% 5.2% Fourth
Slide 11: Market Cycle
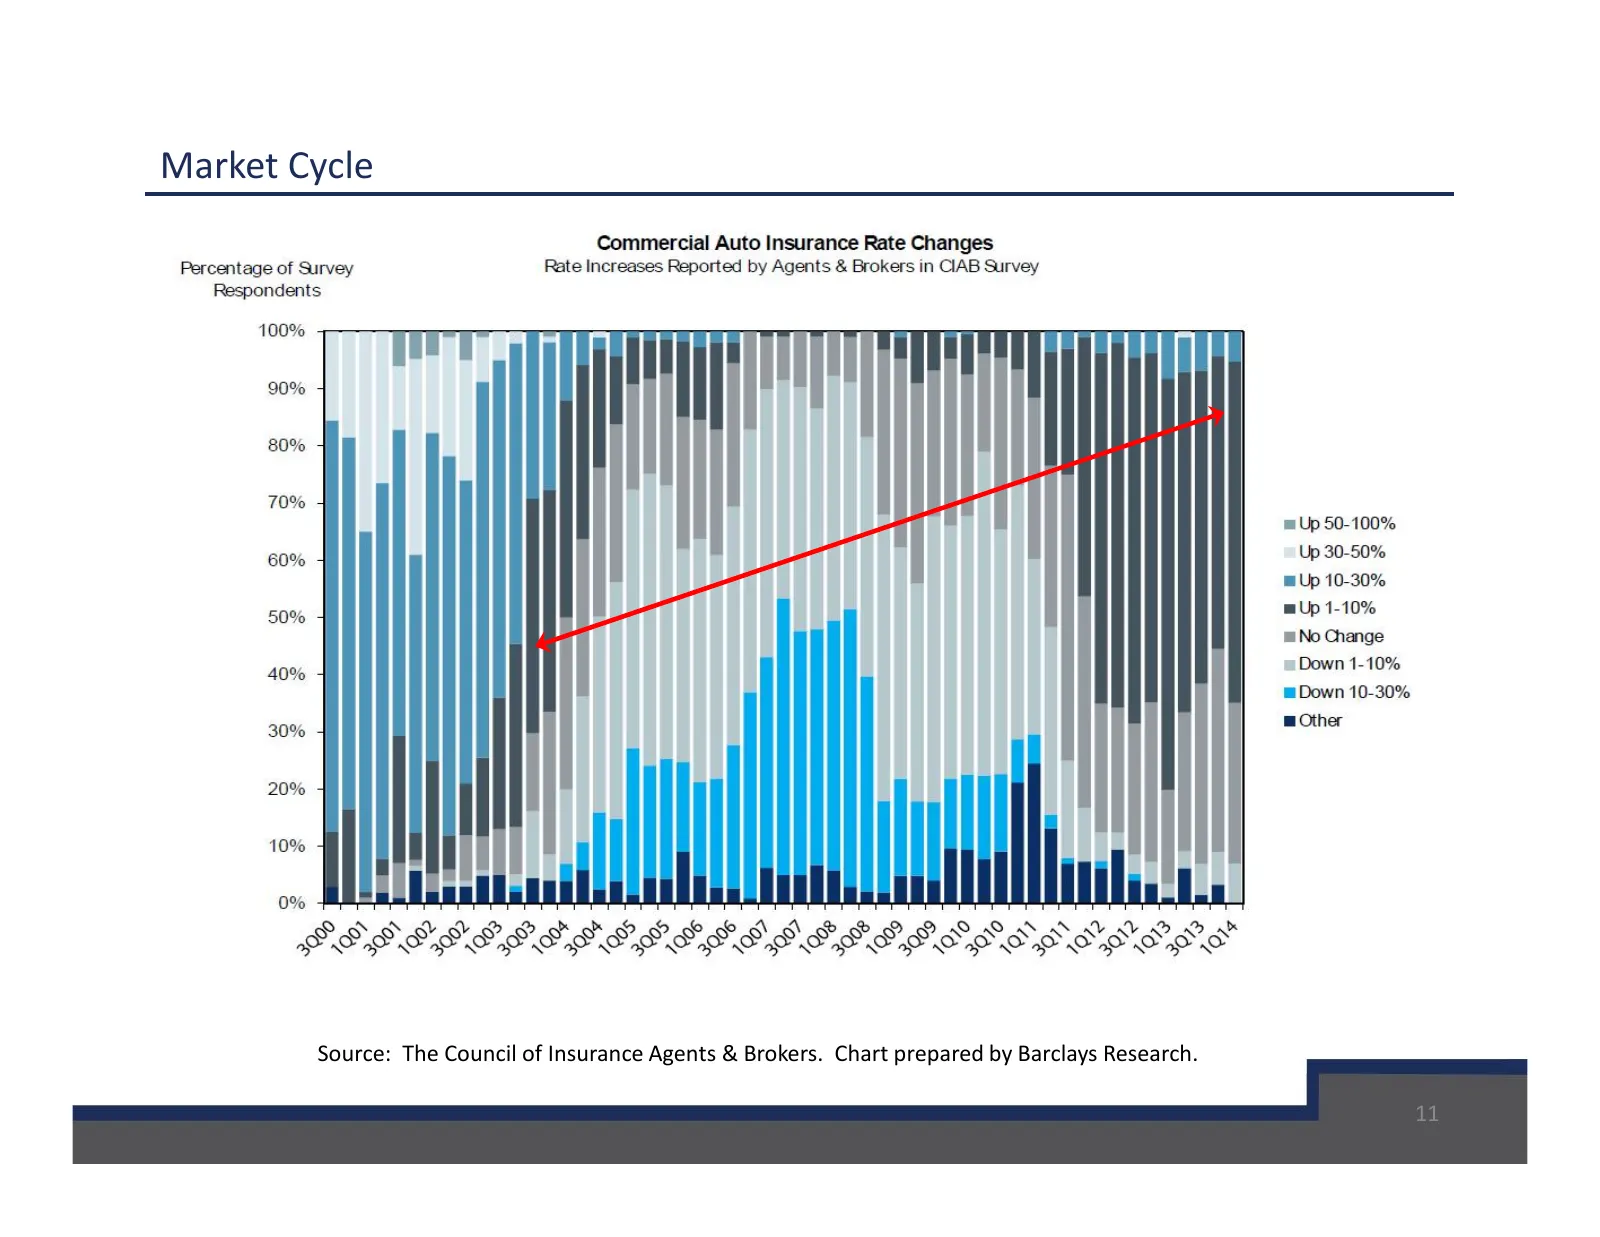
Market Cycle Source: The Council of Insurance Agents & Brokers. Chart prepared by Barclays Research. 11
Slide 12: Financial Highlights
Financial Highlights LN rallAs FINANCIAL HOLDINGS, INC. HOLDINGS, INC.
Slide 13: 2014 Q1 Financial Highlights
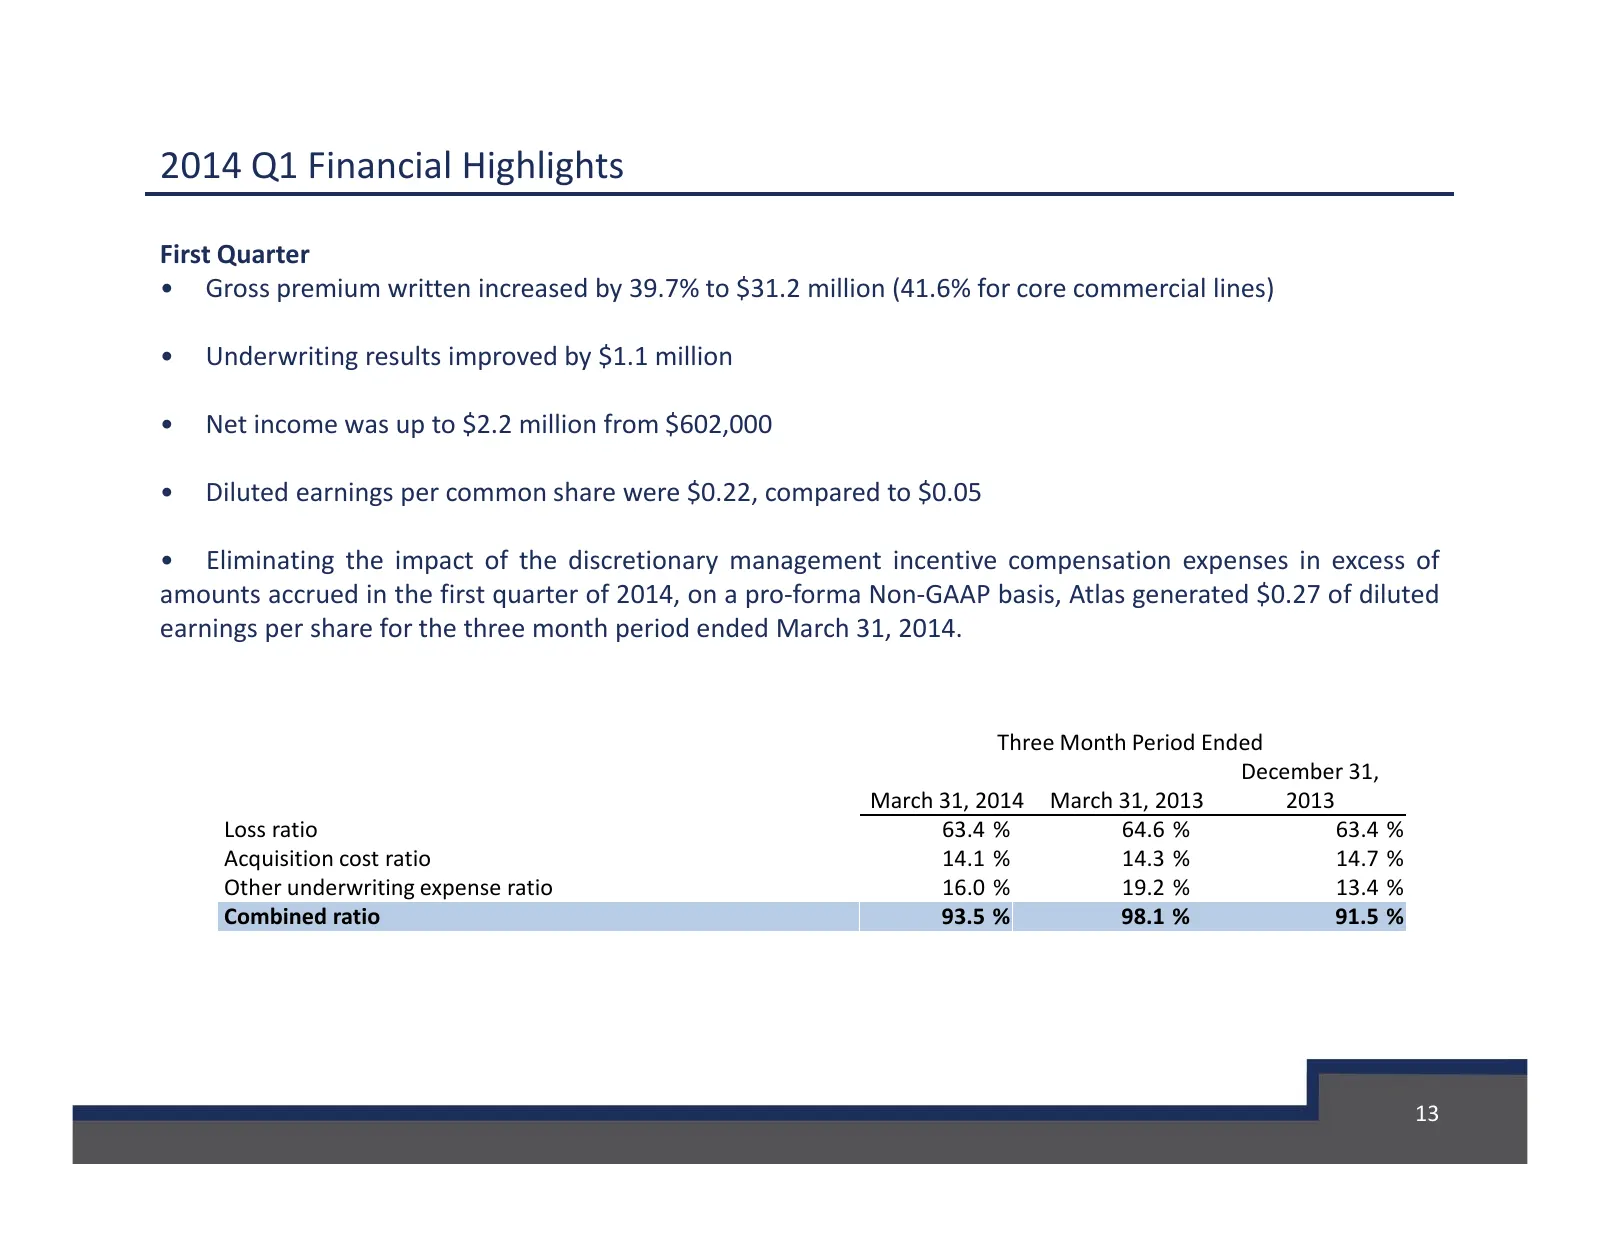
2014 Q1 Financial Highlights First Quarter • Gross premium written increased by 39.7% to $31.2 million (41.6% for core commercial lines) • Underwriting results improved by $1.1 million • Net income was up to $2.2 million from $602,000 • Diluted earnings per common share were $0.22, compared to $0.05
Slide 14: Detailed Impact of Changes to Book Value per Common Share
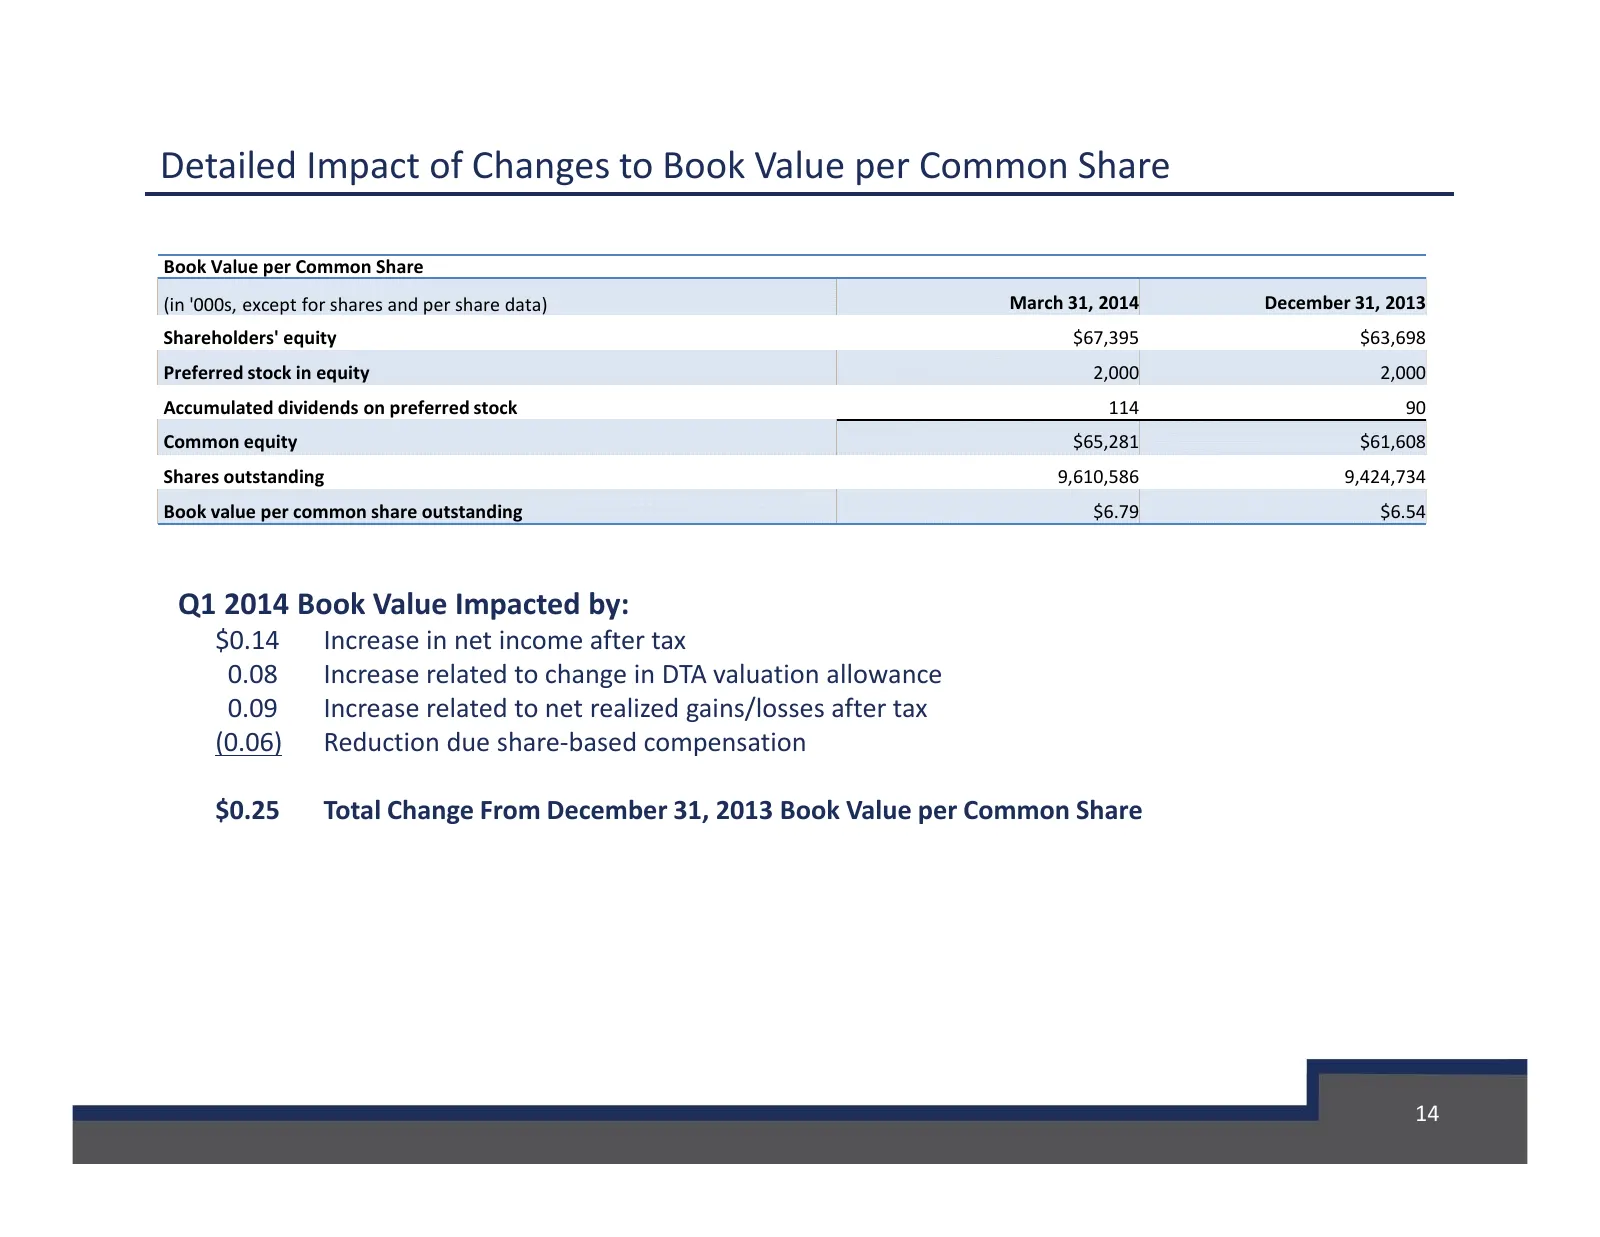
Detailed Impact of Changes to Book Value per Common Share Book Value per Common Share (in '000s, except for shares and per share data) March 31, 2014 December 31, 2013 Shareholders' equity $67,395 $63,698 Preferred stock in equity 2,000 2,000 Accumulated dividends on preferred stock 114 90 Common eq
Slide 15: Strong Balance Sheet
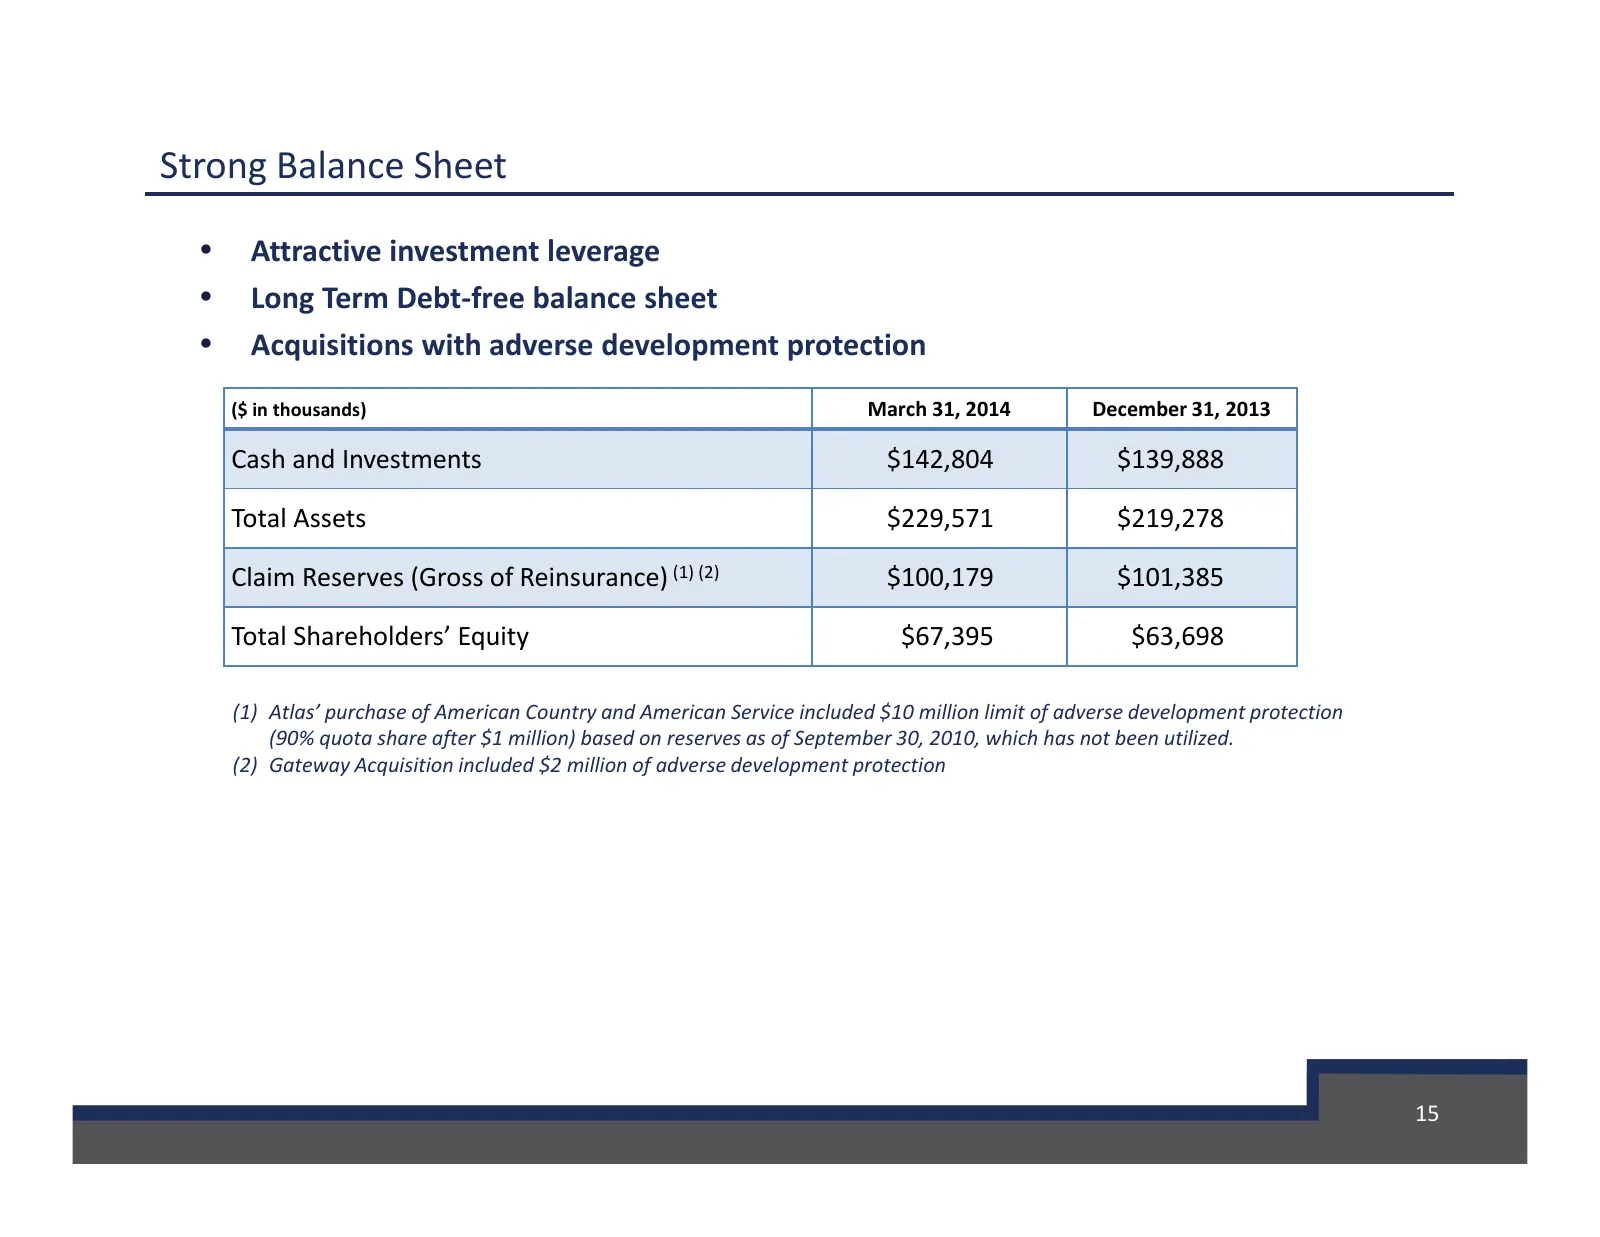
Strong Balance Sheet • Attractive investment leverage • Long Term Debt-free balance sheet • Acquisitions with adverse development protection ($ in thousands) March 31, 2014 December 31, 2013 Cash and Investments $142,804 $139,888 Total Assets $229,571 $219,278 Claim Reserves (Gross of Reinsurance) (
Slide 16: Investment Portfolio
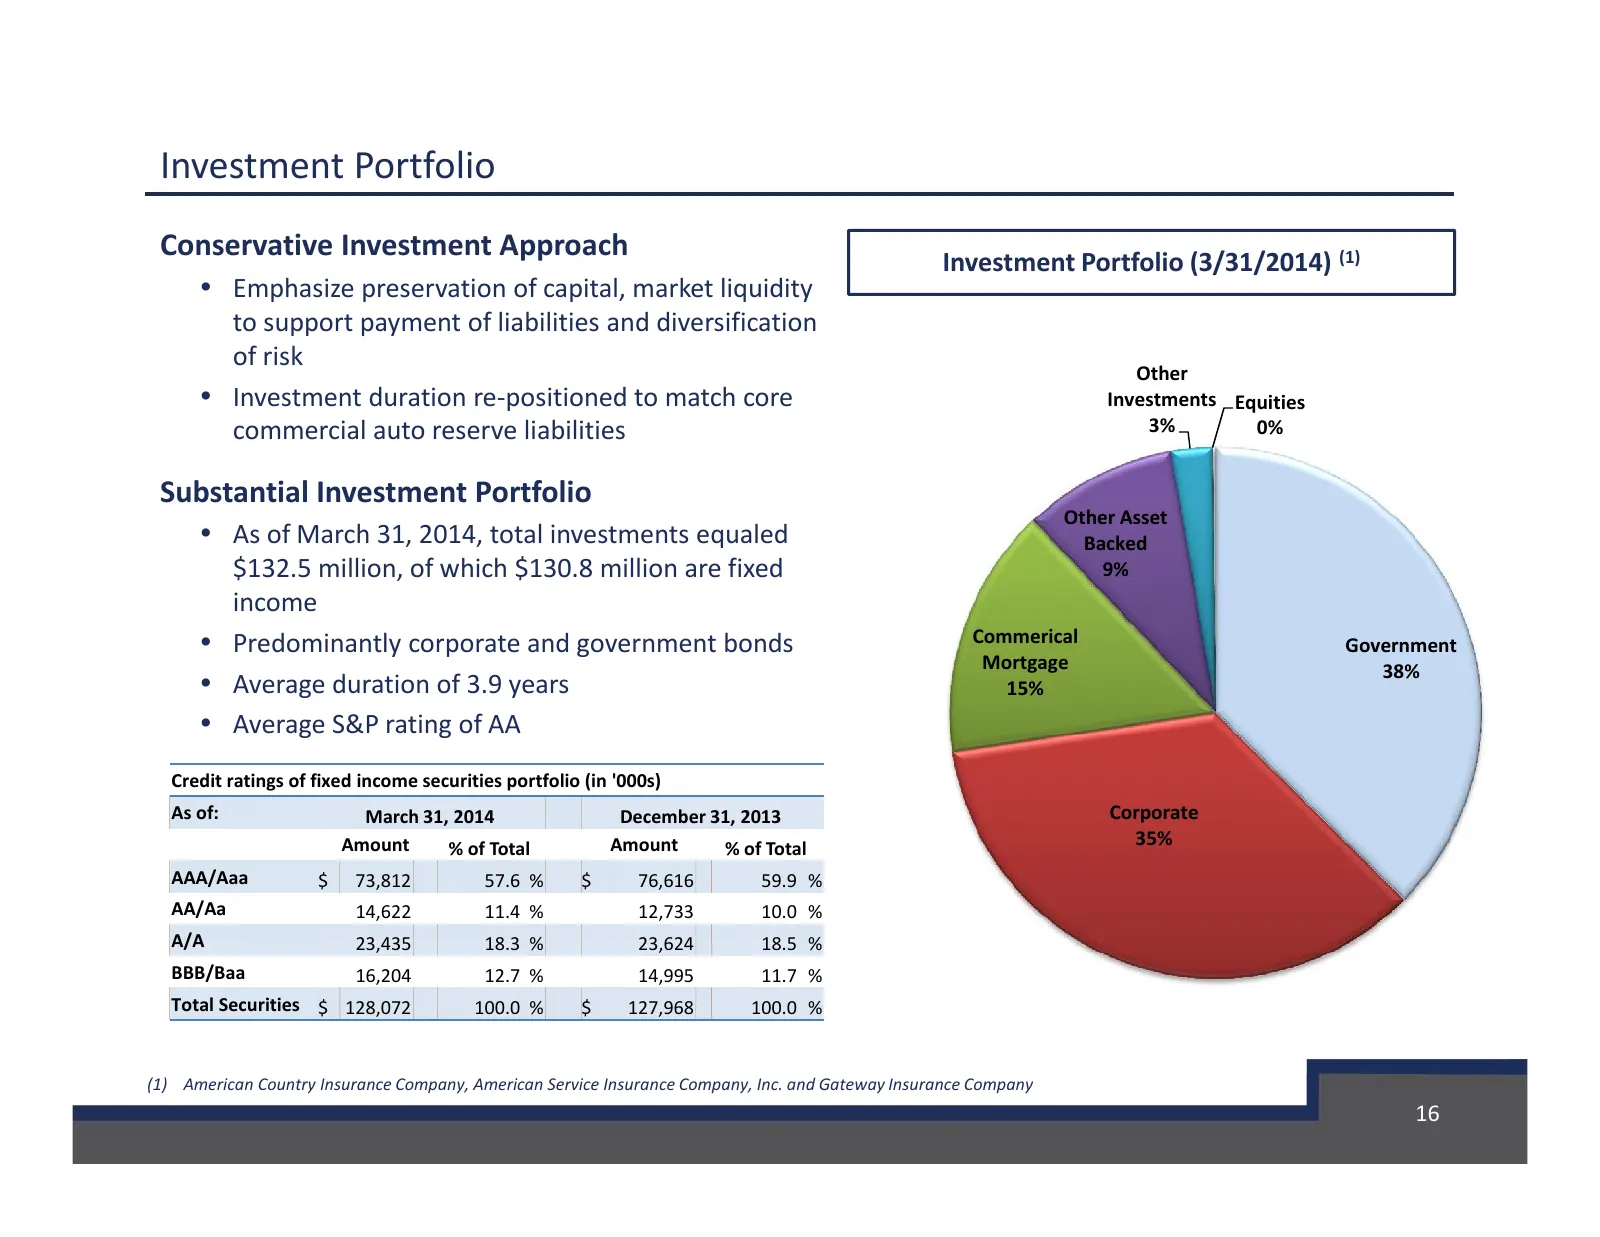
Investment Portfolio Conservative Investment Approach Investment Portfolio (3/31/2014) (1) • Emphasize preservation of capital, market liquidity to support payment of liabilities and diversification of risk Other • Investment duration re-positioned to match core Investments Equities commercial auto
Slide 17: For Additional Information
Nasdaq: AFH For Additional Information At the Company: Scott Wollney Chief Executive Officer swollney@atlas-fin.com 847-700-8600 Investor Relations: The Equity Group Inc. Adam Prior Senior Vice President APrior@equityny.com 212-836-9606 Terry Downs Associate TDowns@equityny.com 212-836-9615
Source: SEC EDGAR · 8-K filed May 7, 2014
More decks from Atlas Financial Holdings Inc
 Investor Presentation (November 2022)20 slides · Nov 14, 2022
 Investor Presentation (August 2022)21 slides · Aug 12, 2022
 Investor Presentation (May 2022)20 slides · May 23, 2022
 Investor Presentation (April 2022)18 slides · Apr 4, 2022
 Investor Presentation (November 2021)28 slides · Nov 8, 2021
 Q2 2021 Earnings Presentation26 slides · Aug 10, 2021