Southern Union — Barclays Capital 2009 CEO Energy Conference
29 slides from Southern Union's conference presentation, Sep 10, 2009
Slide 1: Barclays Capital 2009 CEO Energy Conference
Barclays Capital 2009 CEO Energy Conference New York September 10, 2009 www.sug.com
Slide 2: Forward-Looking Statements
Forward-Looking Statements Statements contained in this presentation that include company expectations or predictions of the future are forward-looking statements intended to be covered by the safe harbor provisions of the Securities Act of 1933 and the Securities Exchange Act of 1934. It is importa
Slide 3: Southern Union Company: Portfolio of Stable, High-Quality Assets
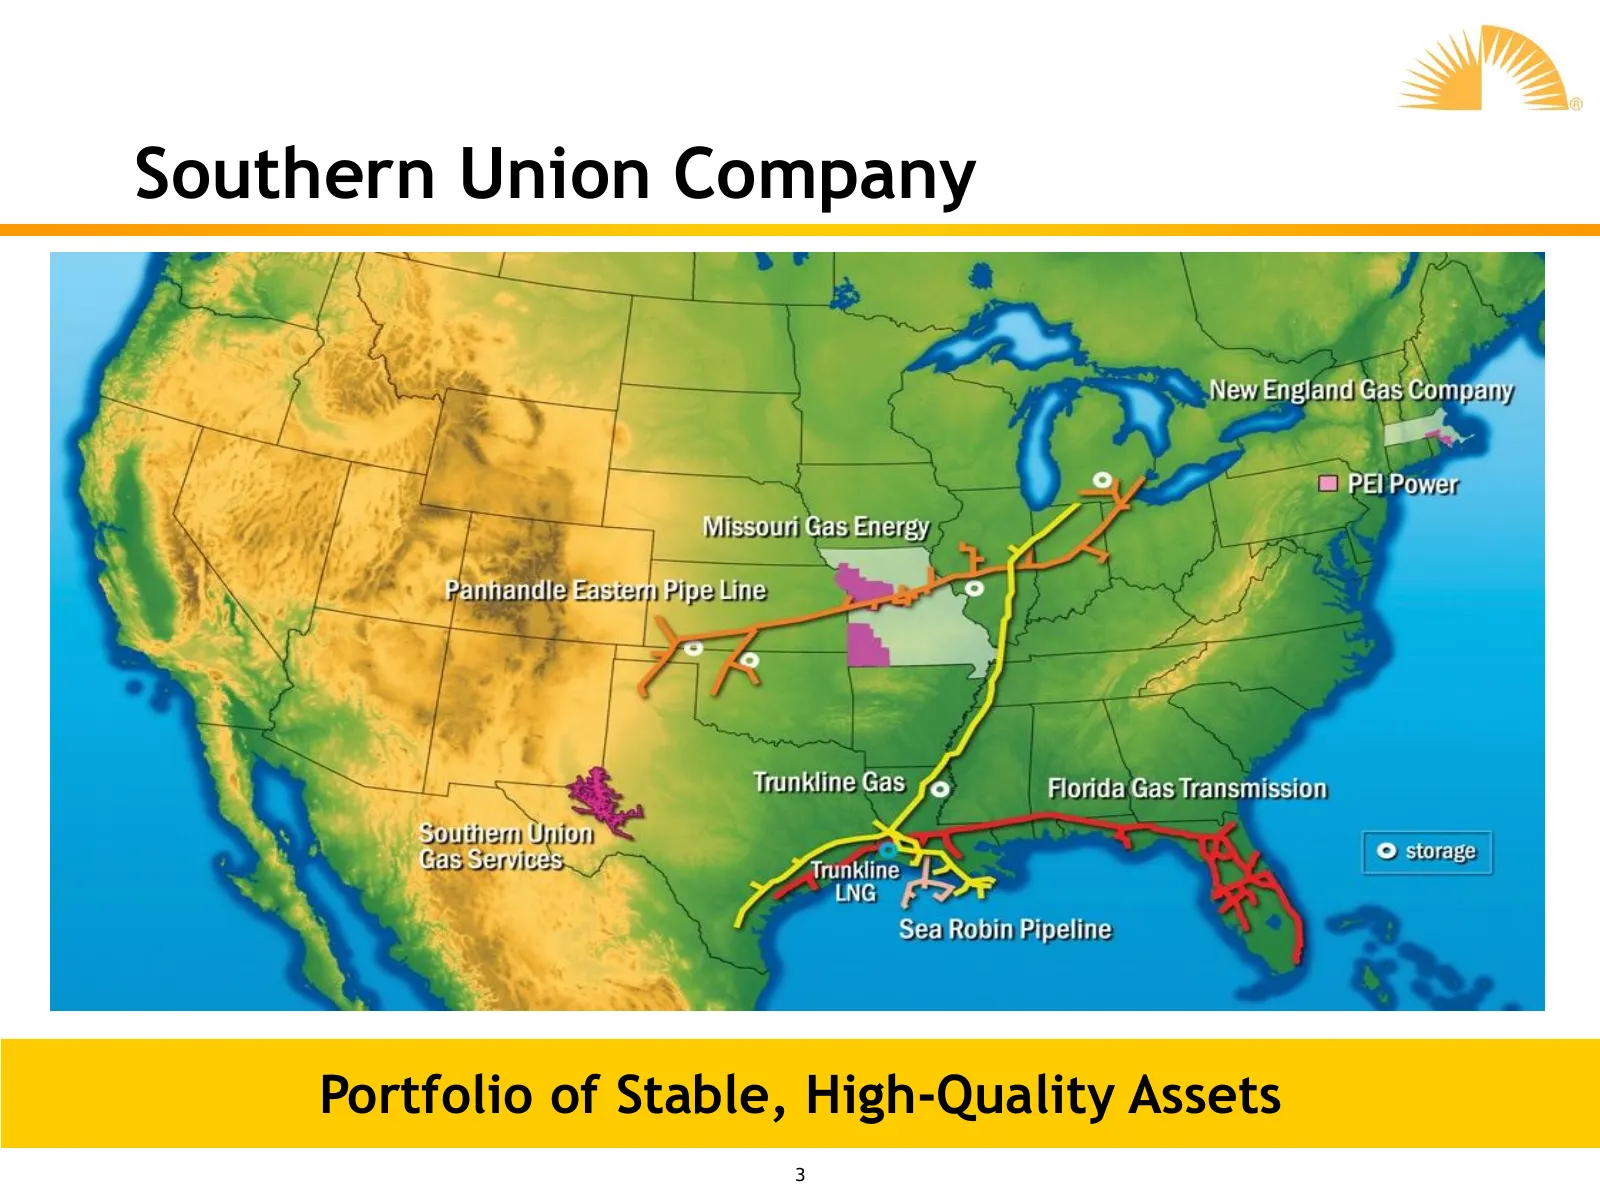
Southern Union Company Portfolio of Stable, High-Quality Assets 3
Slide 4: Company Facts
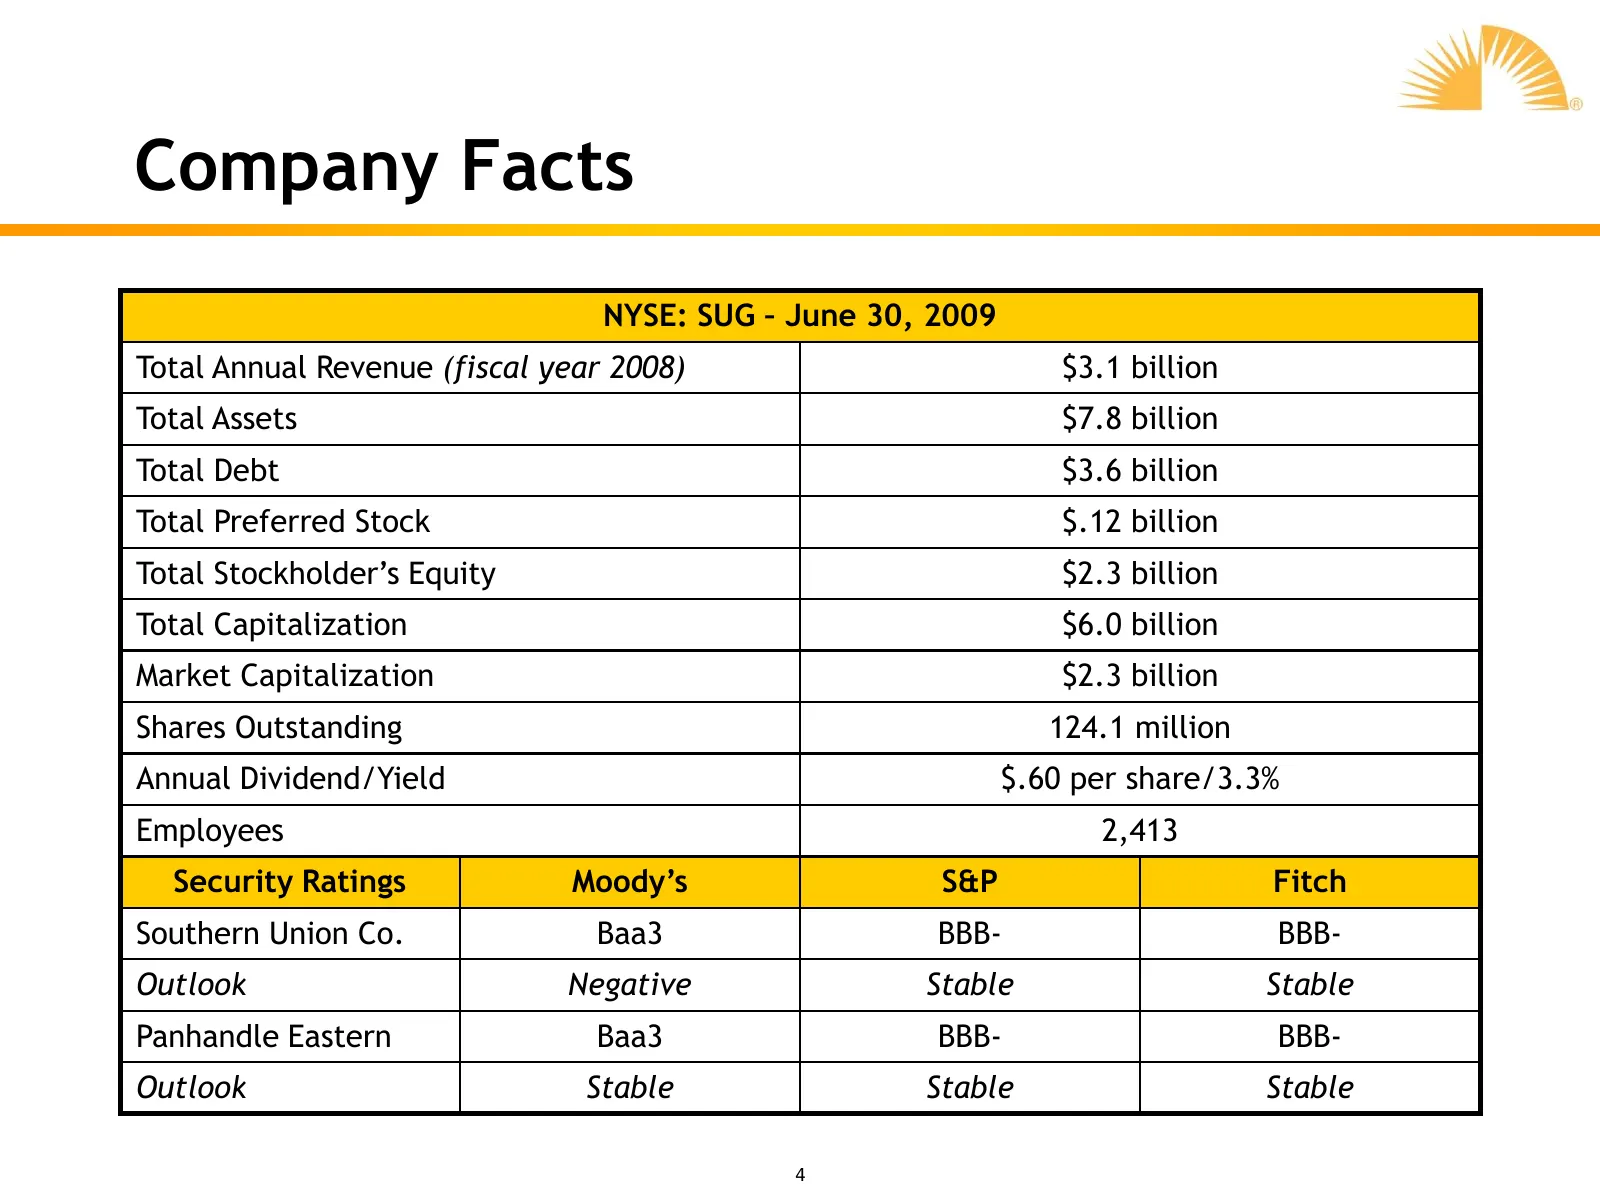
Company Facts NYSE: SUG – June 30, 2009 Total Annual Revenue (fiscal year 2008) $3.1 billion Total Assets $7.8 billion Total Debt $3.6 billion Total Preferred Stock $.12 billion Total Stockholder’s Equity $2.3 billion Total Capitalization $6.0 billion Market Capitalization $2.3 billion Shares Outsta
Slide 5: Creating Shareholder Value
Creating Shareholder Value Ni
Slide 6: Value Creation
Value Creation • Value creation will come from: –Prudent financial management –Organic growth projects –Strategic initiatives Focused on Creating Long-Term Value 6
Slide 7: Prudent Financial Management
Prudent Financial Management • Preservation of investment grade ratings is important for: – Lower financing costs/eliminates collateral requirements – Improves rate making and regulatory relationships • Free cash flow may be used for: – Organic growth projects – Debt repayment – Increased dividends
Slide 8: Organic Growth Projects
Organic Growth Projects • Vast pipeline network with access to multiple supply sources and diverse markets will help fuel organic growth • Analyze trends in the natural gas industry to identify opportunities • Current organic growth projects: – Trunkline LNG Infrastructure Enhancement Project – FGT
Slide 9: Strategic Initiatives
Strategic Initiatives • Evaluate and pursue market opportunities – Strategic acquisitions – Partnership or joint venture opportunities – Disciplined approach to reviewing all opportunities 9
Slide 10: Business Segments
Business Segments Ni
Slide 11: Transportation & Storage
Transportation & Storage • Vast pipeline network with access to diverse supply sources and growing markets • Approximately 15,000 miles of interstate pipelines with transportation capacity of 7.8 Bcf/d • One of North America’s largest liquefied natural gas (LNG) import terminals with peak send out o
Slide 12: Transportation & Storage Assets
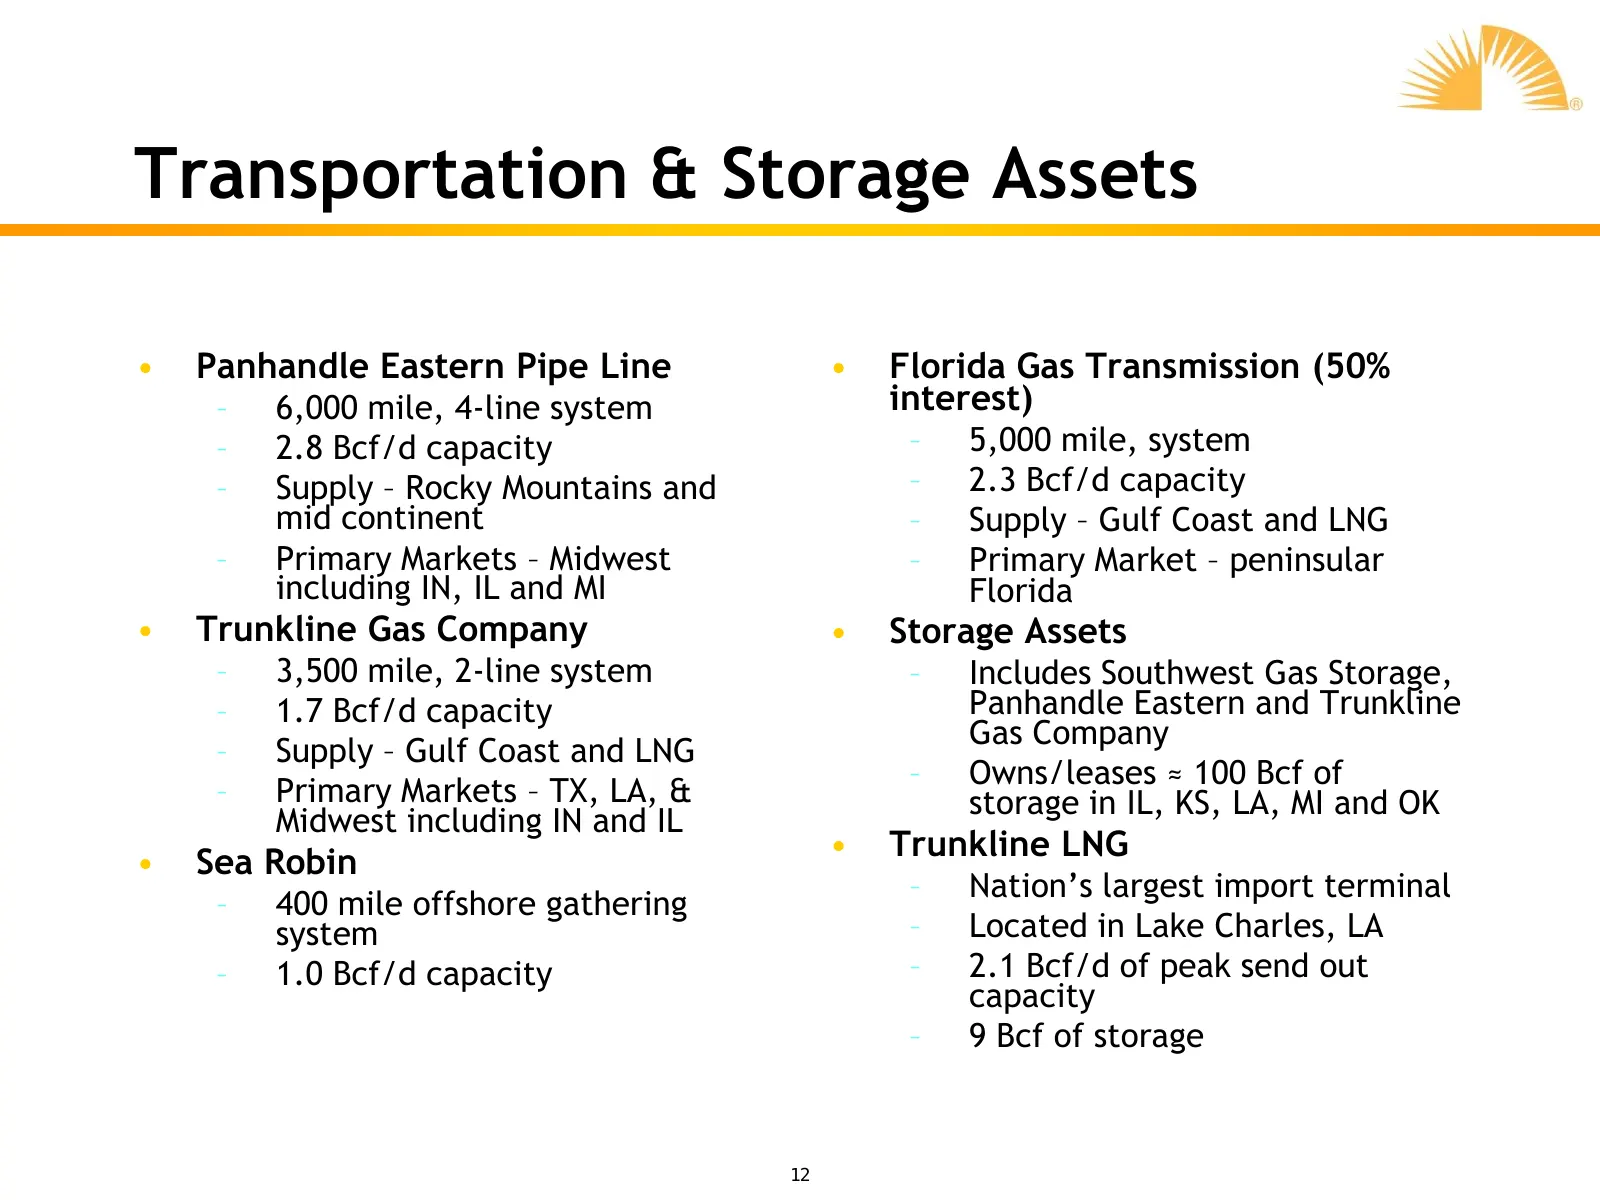
Transportation & Storage Assets • Panhandle Eastern Pipe Line • Florida Gas Transmission (50% – 6,000 mile, 4-line system interest) – 2.8 Bcf/d capacity – 5,000 mile, system – Supply – Rocky Mountains and – 2.3 Bcf/d capacity mid continent – Supply – Gulf Coast and LNG – Primary Markets – Midwest –
Slide 13: Trunkline LNG: Infrastructure Enhancement Project
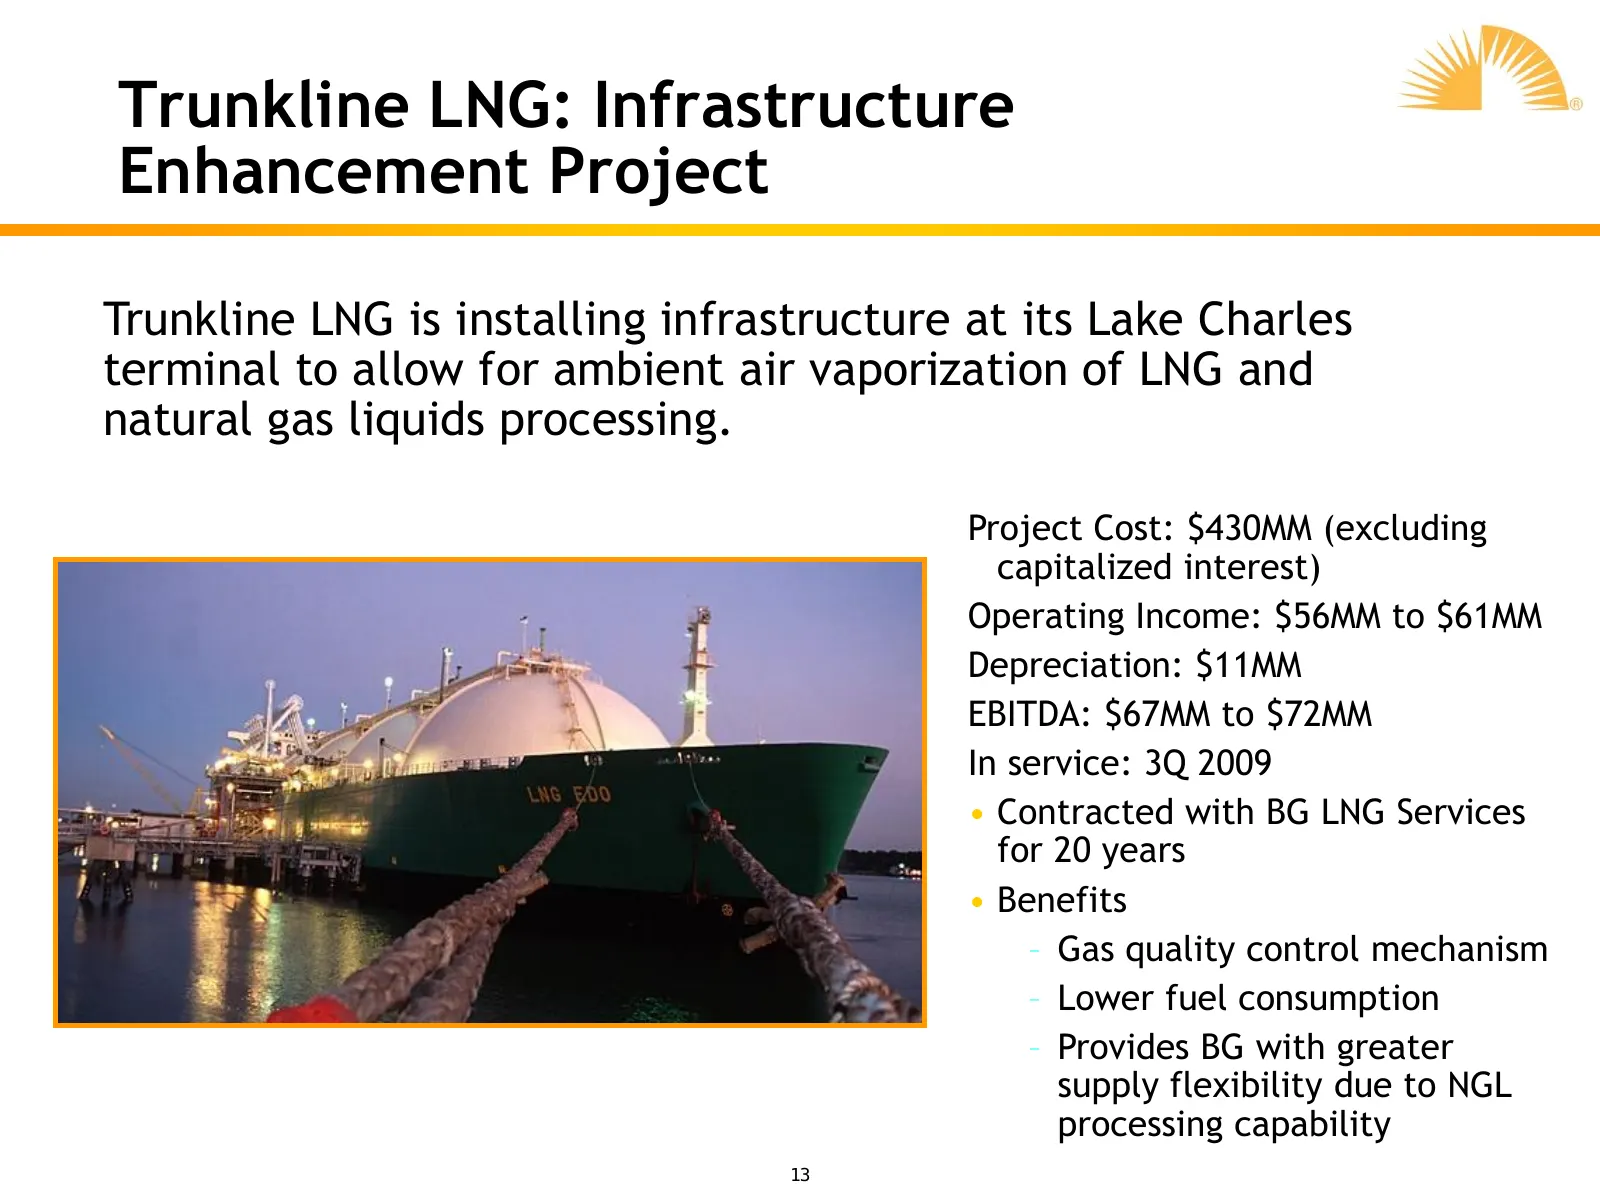
Trunkline LNG: Infrastructure Enhancement Project Trunkline LNG is installing infrastructure at its Lake Charles terminal to allow for ambient air vaporization of LNG and natural gas liquids processing. Project Cost: $430MM (excluding capitalized interest) Operating Income: $56MM to $61MM Depreciati
Slide 14: FGT Phase VIII Expansion
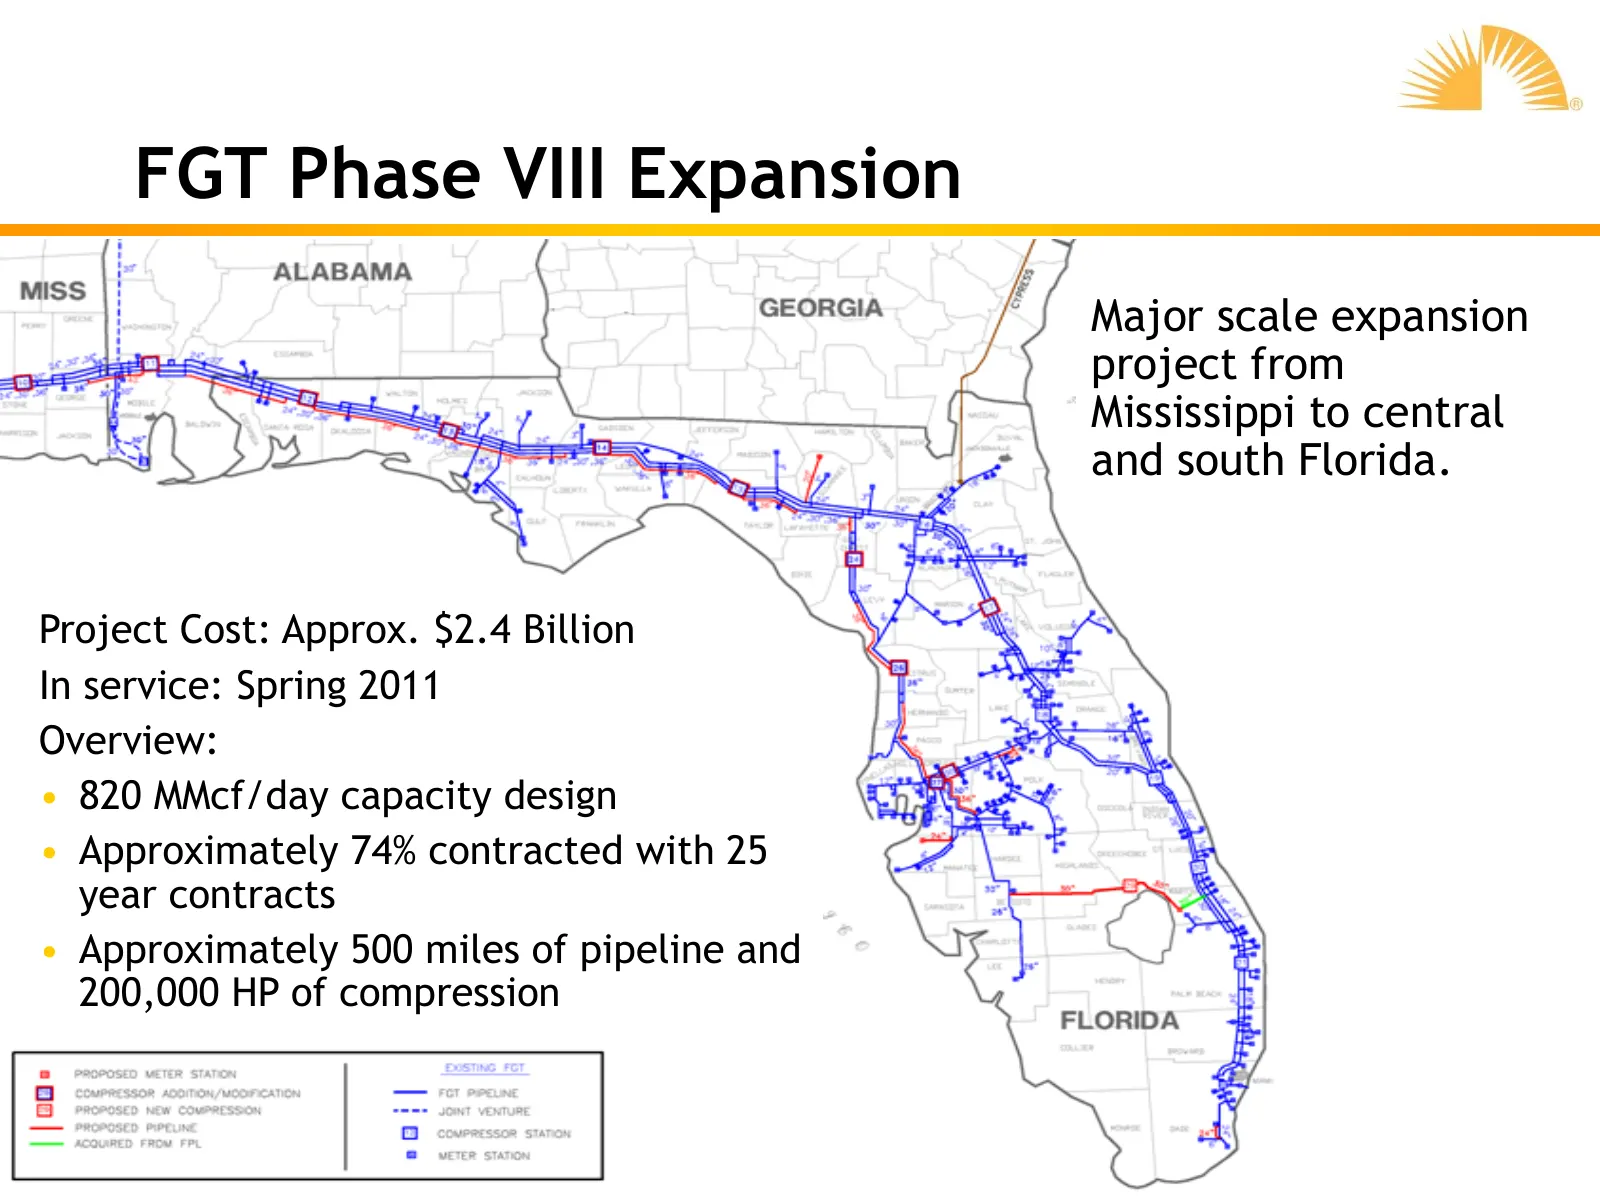
FGT Phase VIII Expansion Major scale expansion project from Mississippi to central and south Florida. Project Cost: Approx. $2.4 Billion In service: Spring 2011 Overview: • 820 MMcf/day capacity design • Approximately 74% contracted with 25 year contracts • Approximately 500 miles of pipeline and 20
Slide 15: FGT Phase VIII Expansion Timeline
FGT Phase VIII Expansion Timeline • Open season ran January 14 through February 15 • Filed FERC Certificate on October 31, 2008 • Expect FERC Approval 4th Quarter 2009 • Target In-Service Date – Spring 2011 • Expect operating income of $240 to $260 million, depreciation of $50 million and EBITDA of
Slide 16: FGT Pascagoula Lateral
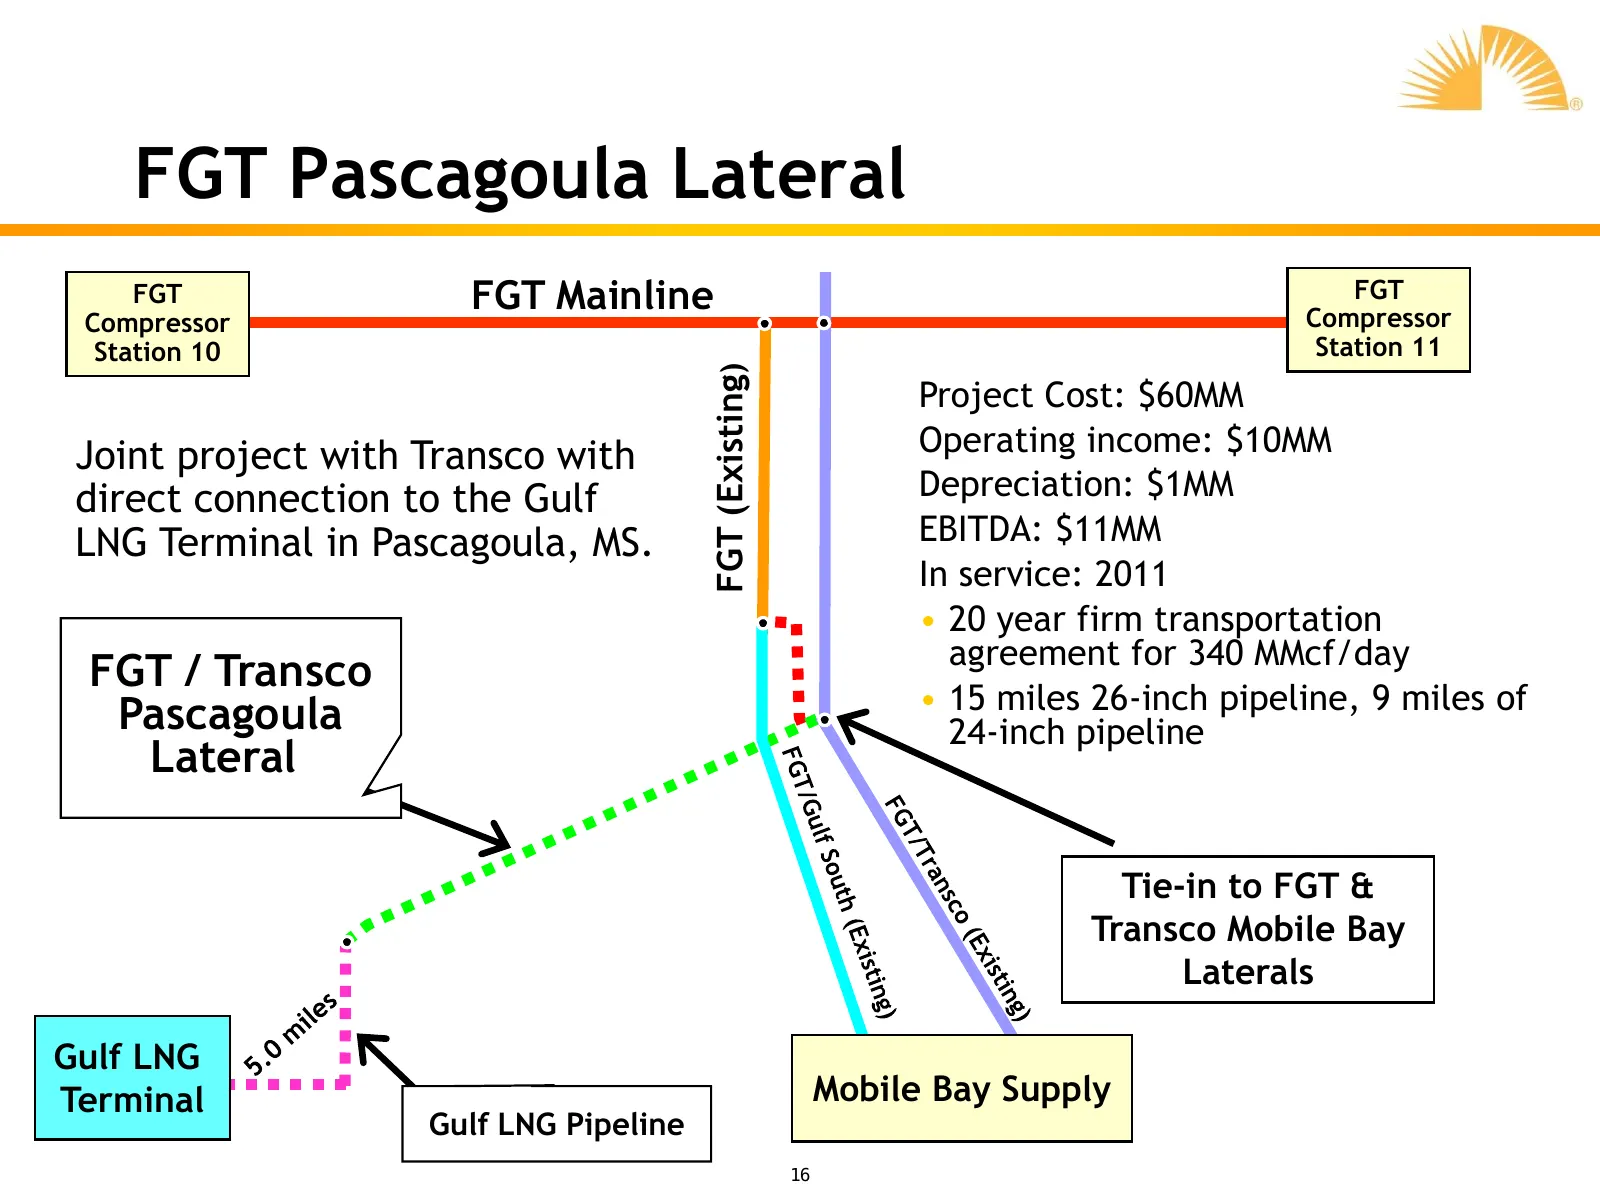
FGT Pascagoula Lateral FGT FGT Mainline FGT Compressor Compressor Station 10 Station 11 FGT (Existing) Project Cost: $60MM Joint project with Transco with Operating income: $10MM direct connection to the Gulf Depreciation: $1MM LNG Terminal in Pascagoula, MS. EBITDA: $11MM In service: 2011 • 20 year
Slide 17: Gathering & Processing
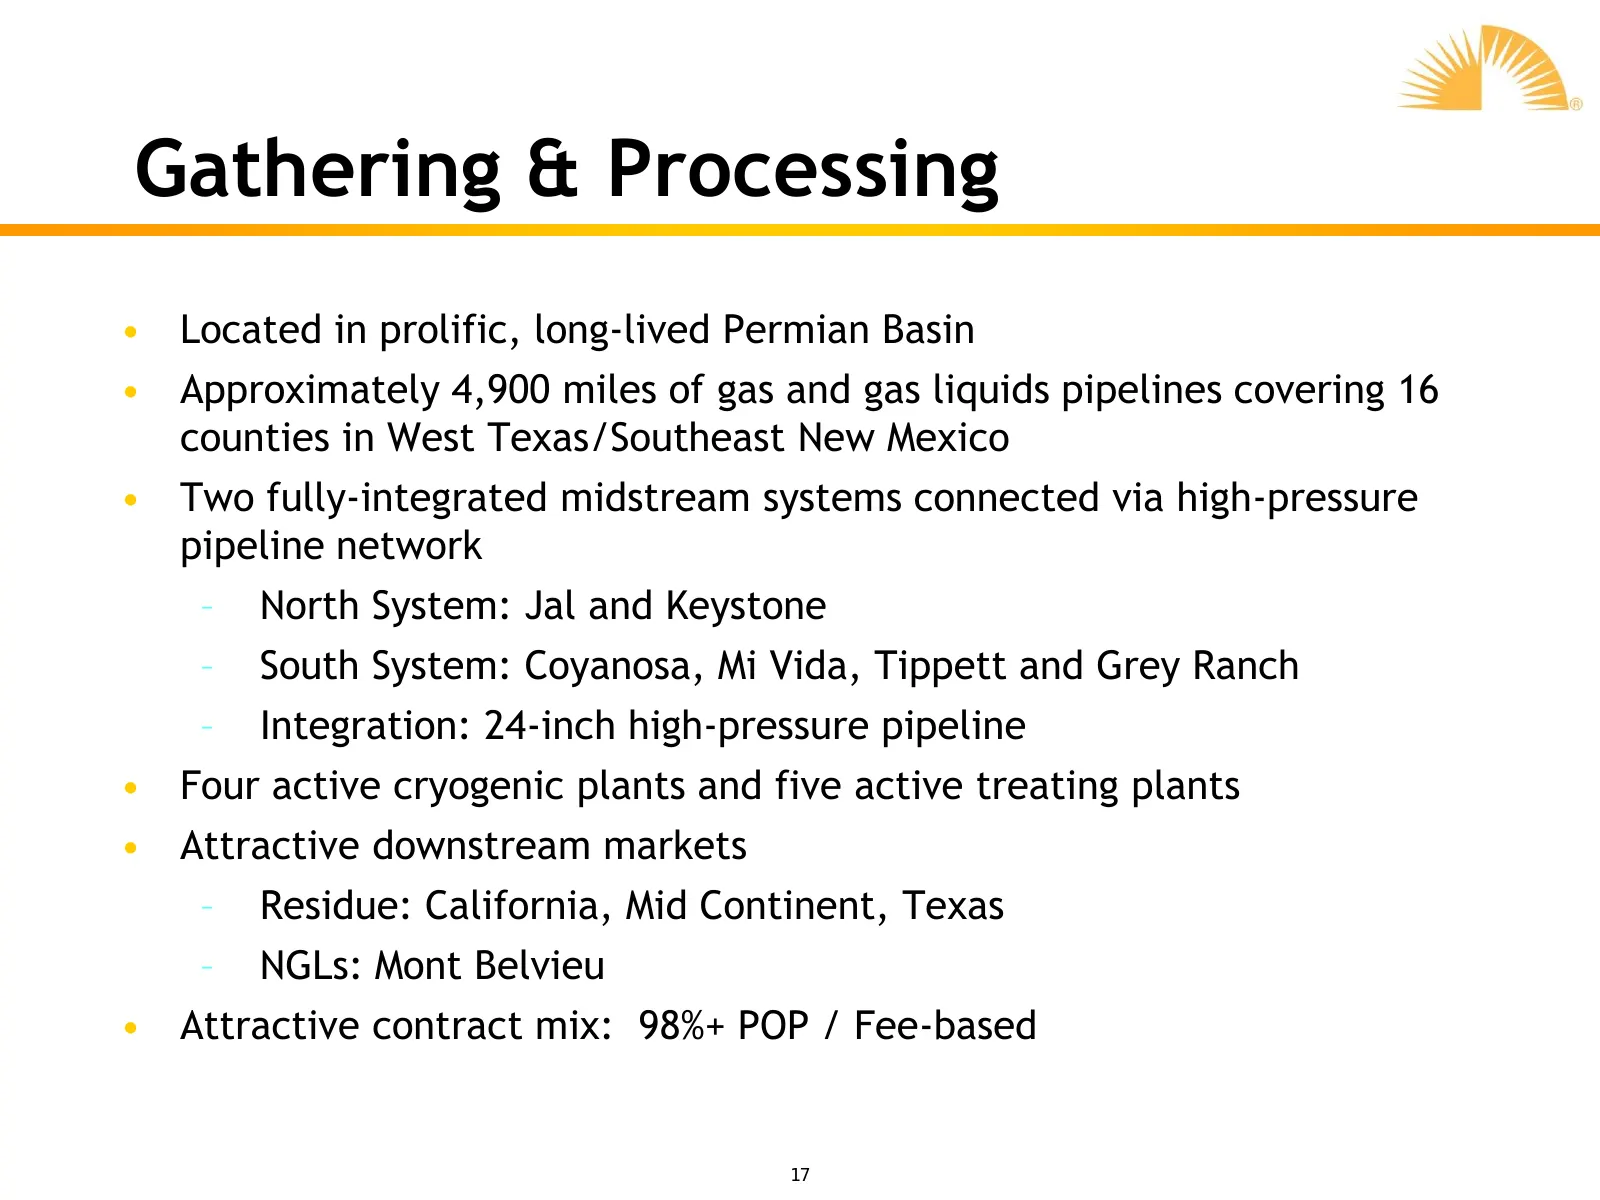
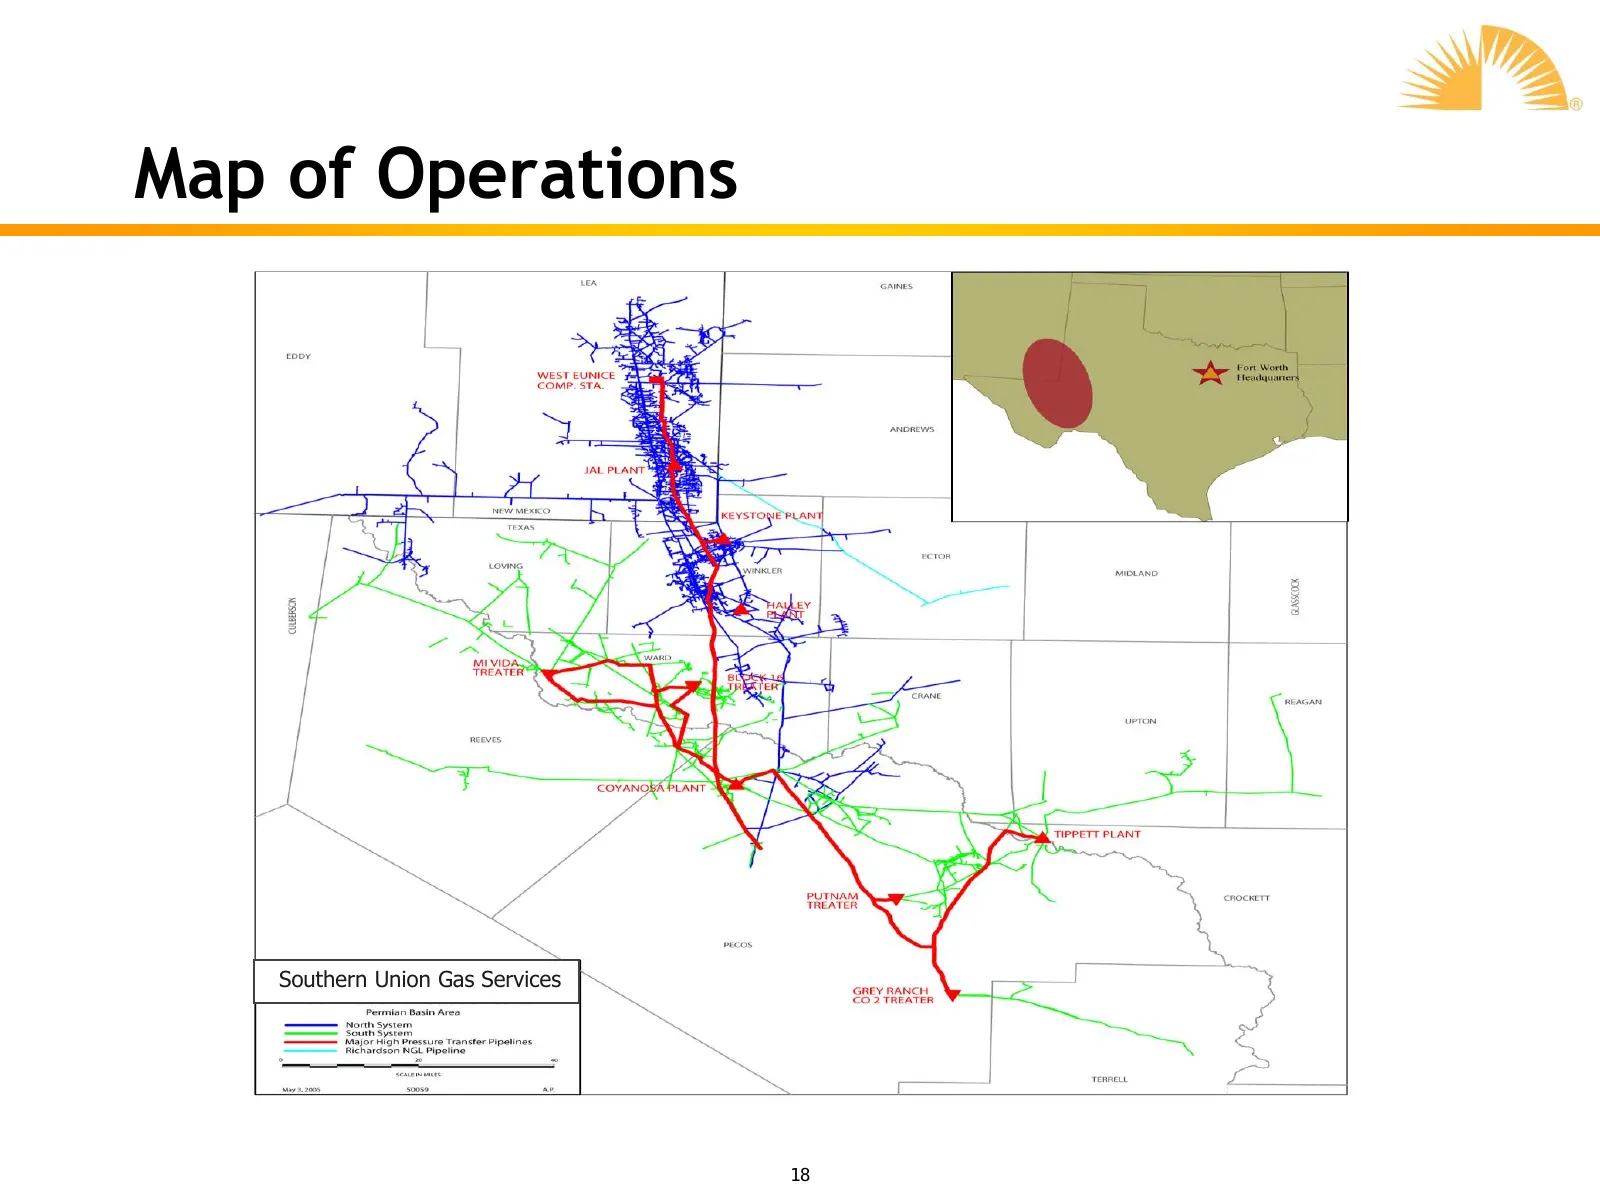
Gathering & Processing • Located in prolific, long-lived Permian Basin • Approximately 4,900 miles of gas and gas liquids pipelines covering 16 counties in West Texas/Southeast New Mexico • Two fully-integrated midstream systems connected via high-pressure pipeline network – North System: Jal and Ke
Slide 18: Map of Operations
Map of Operations •Southern Union Gas Services 18
Slide 19: North System
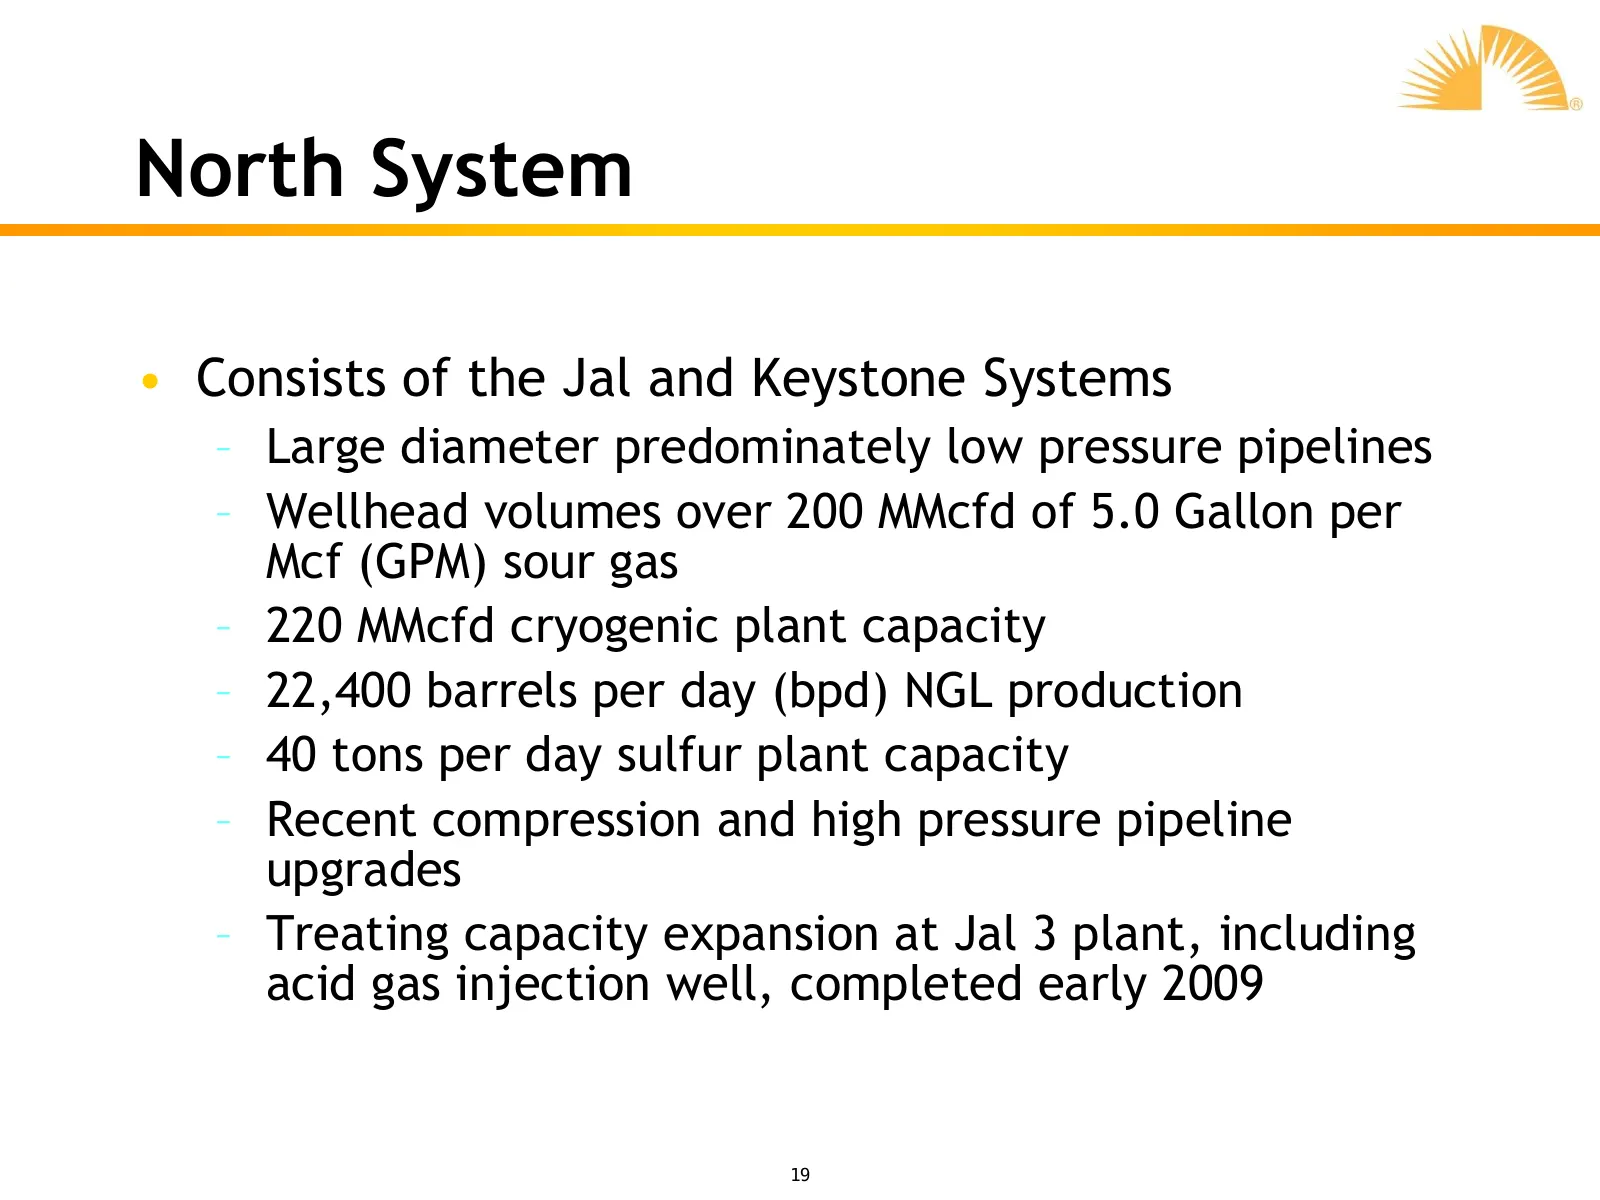
North System • Consists of the Jal and Keystone Systems – Large diameter predominately low pressure pipelines – Wellhead volumes over 200 MMcfd of 5.0 Gallon per Mcf (GPM) sour gas – 220 MMcfd cryogenic plant capacity – 22,400 barrels per day (bpd) NGL production – 40 tons per day sulfur plant capac
Slide 20: South System
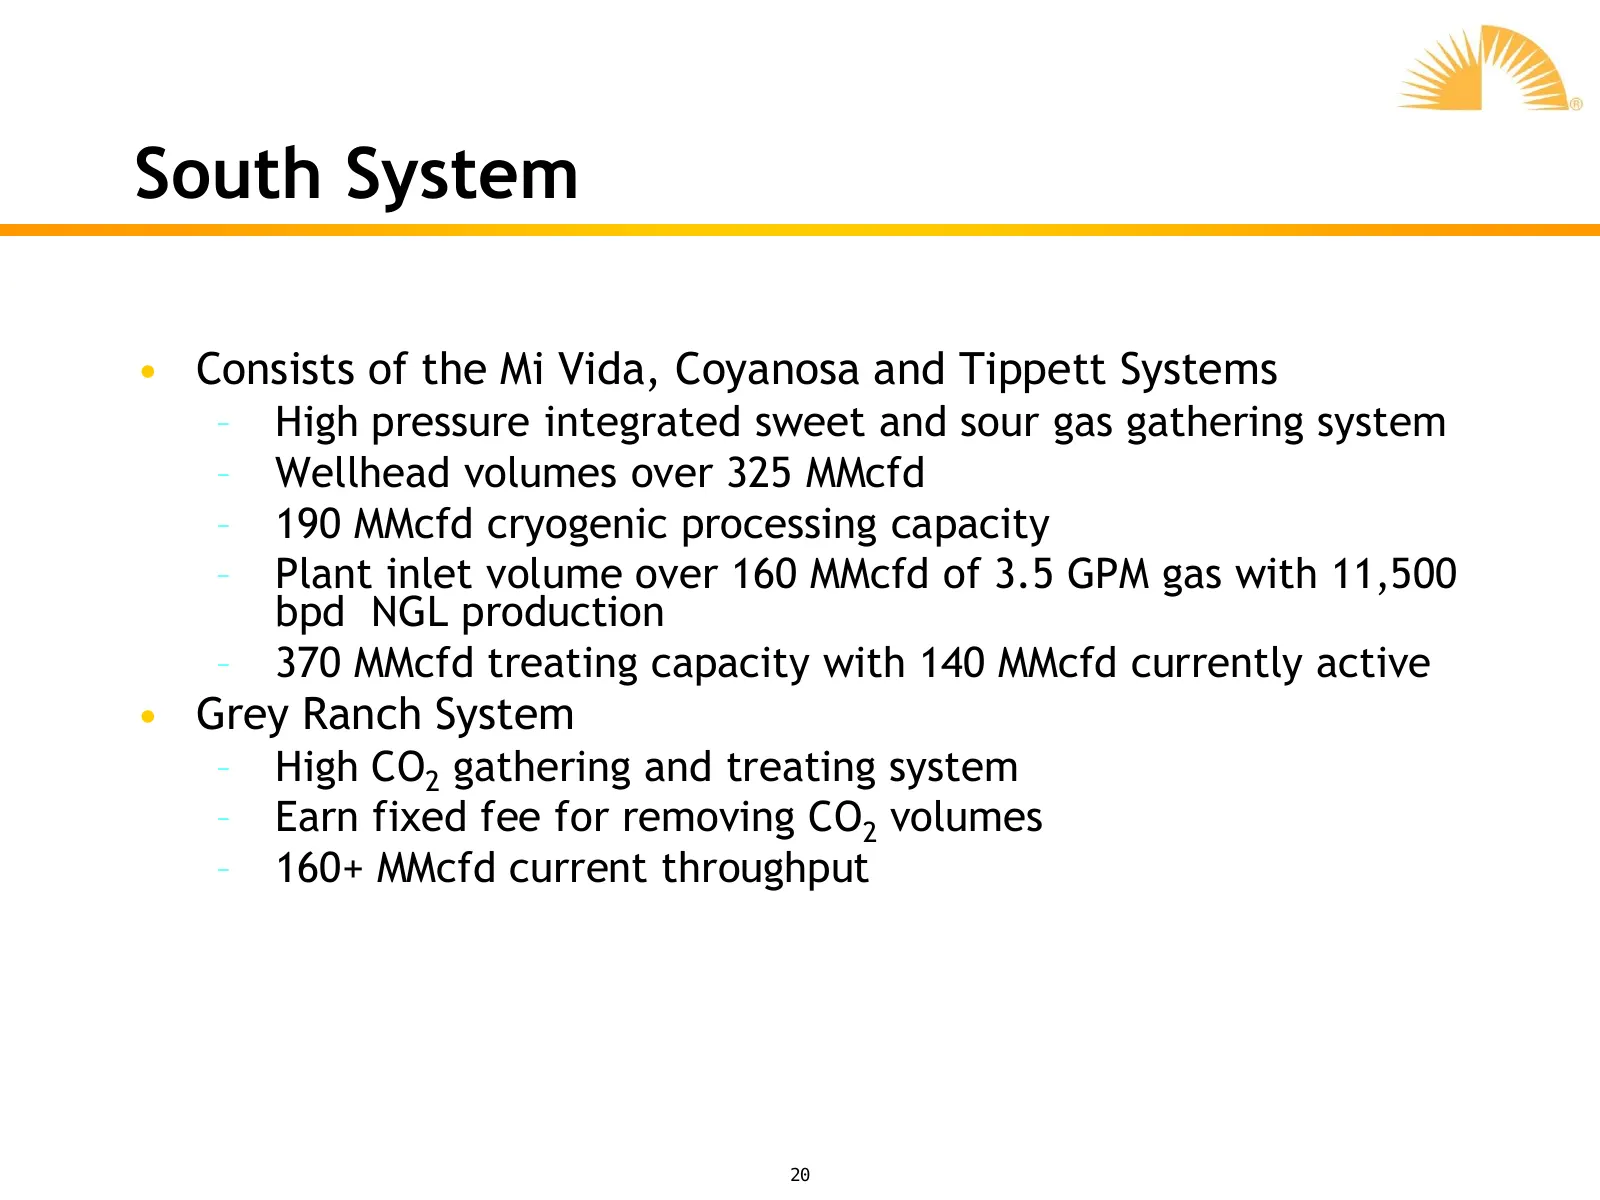
South System • Consists of the Mi Vida, Coyanosa and Tippett Systems – High pressure integrated sweet and sour gas gathering system – Wellhead volumes over 325 MMcfd – 190 MMcfd cryogenic processing capacity – Plant inlet volume over 160 MMcfd of 3.5 GPM gas with 11,500 bpd NGL production – 370 MMcf
Slide 21: High Pressure Transfer System
High Pressure Transfer System • Consists of 84 miles of 16-inch and 24-inch pipelines • Provides operational flexibility – Transfer processable gas between plants – Move sour, lean gas between treaters • Option available to increase residue gas value – Capture Permian to WAHA differential 21
Slide 22: Diversified, Active Producer Portfolio
Diversified, Active Producer Portfolio • Stable and active producer base • Diversified portfolio of oil and gas companies • Strong producer relationships • Significant customers include Chesapeake, Anadarko, Apache, ExxonMobil, ConocoPhillips, ChevronTexaco, BEPCo, Devon and others 22
Slide 23: Gas Supply – Contract Risk Mitigation
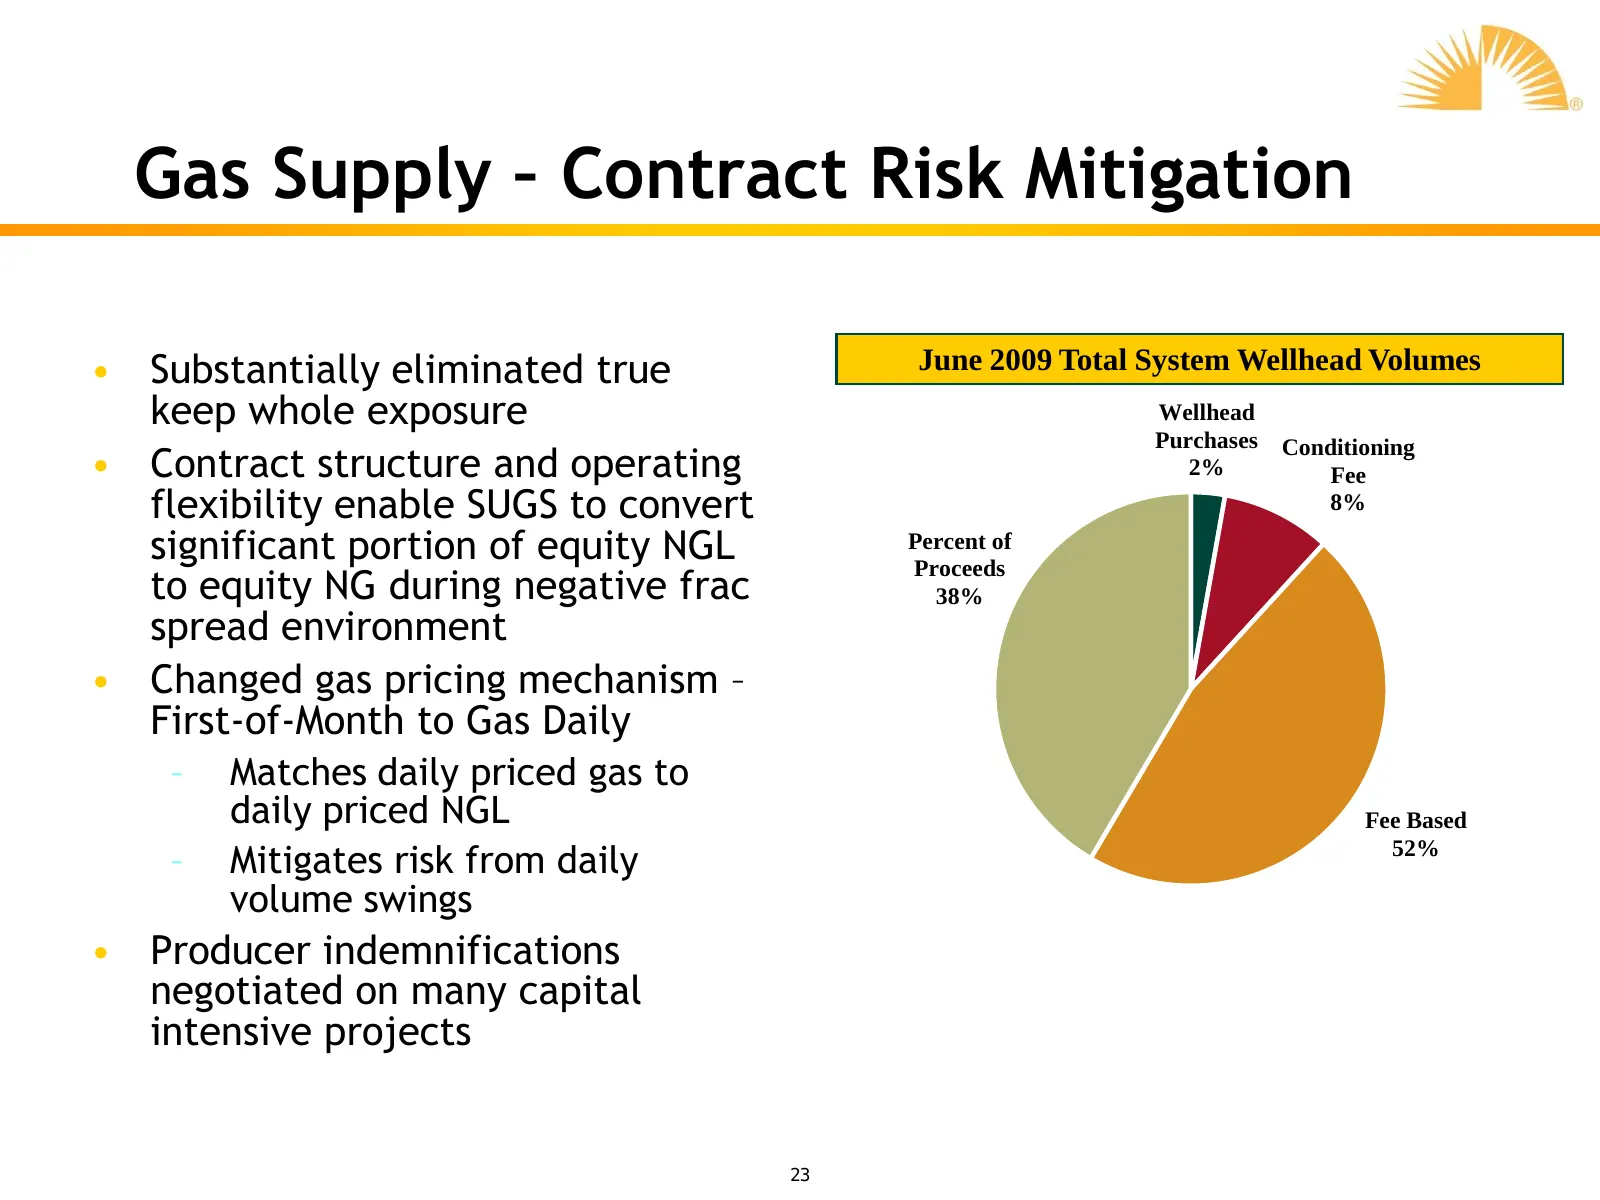
Gas Supply – Contract Risk Mitigation • Substantially eliminated true June 2009 Total System Wellhead Volumes keep whole exposure Wellhead Purchases Conditioning • Contract structure and operating 2% Fee flexibility enable SUGS to convert 8% significant portion of equity NGL Percent of Proceeds to e
Slide 24: 2009 G&P Assumptions
2009 G&P Assumptions • Positive processing spread environment allows conversion of equity volumes into mostly natural gas liquids • Equity volumes – Natural Gas Liquids equity volume of 40,000 to 45,000 MMBtu/d equivalent – Natural Gas equity volume of 2,500 to 7,500 MMBtu/d • Normalized fuel, flare
Slide 25: G&P Hedge Portfolio
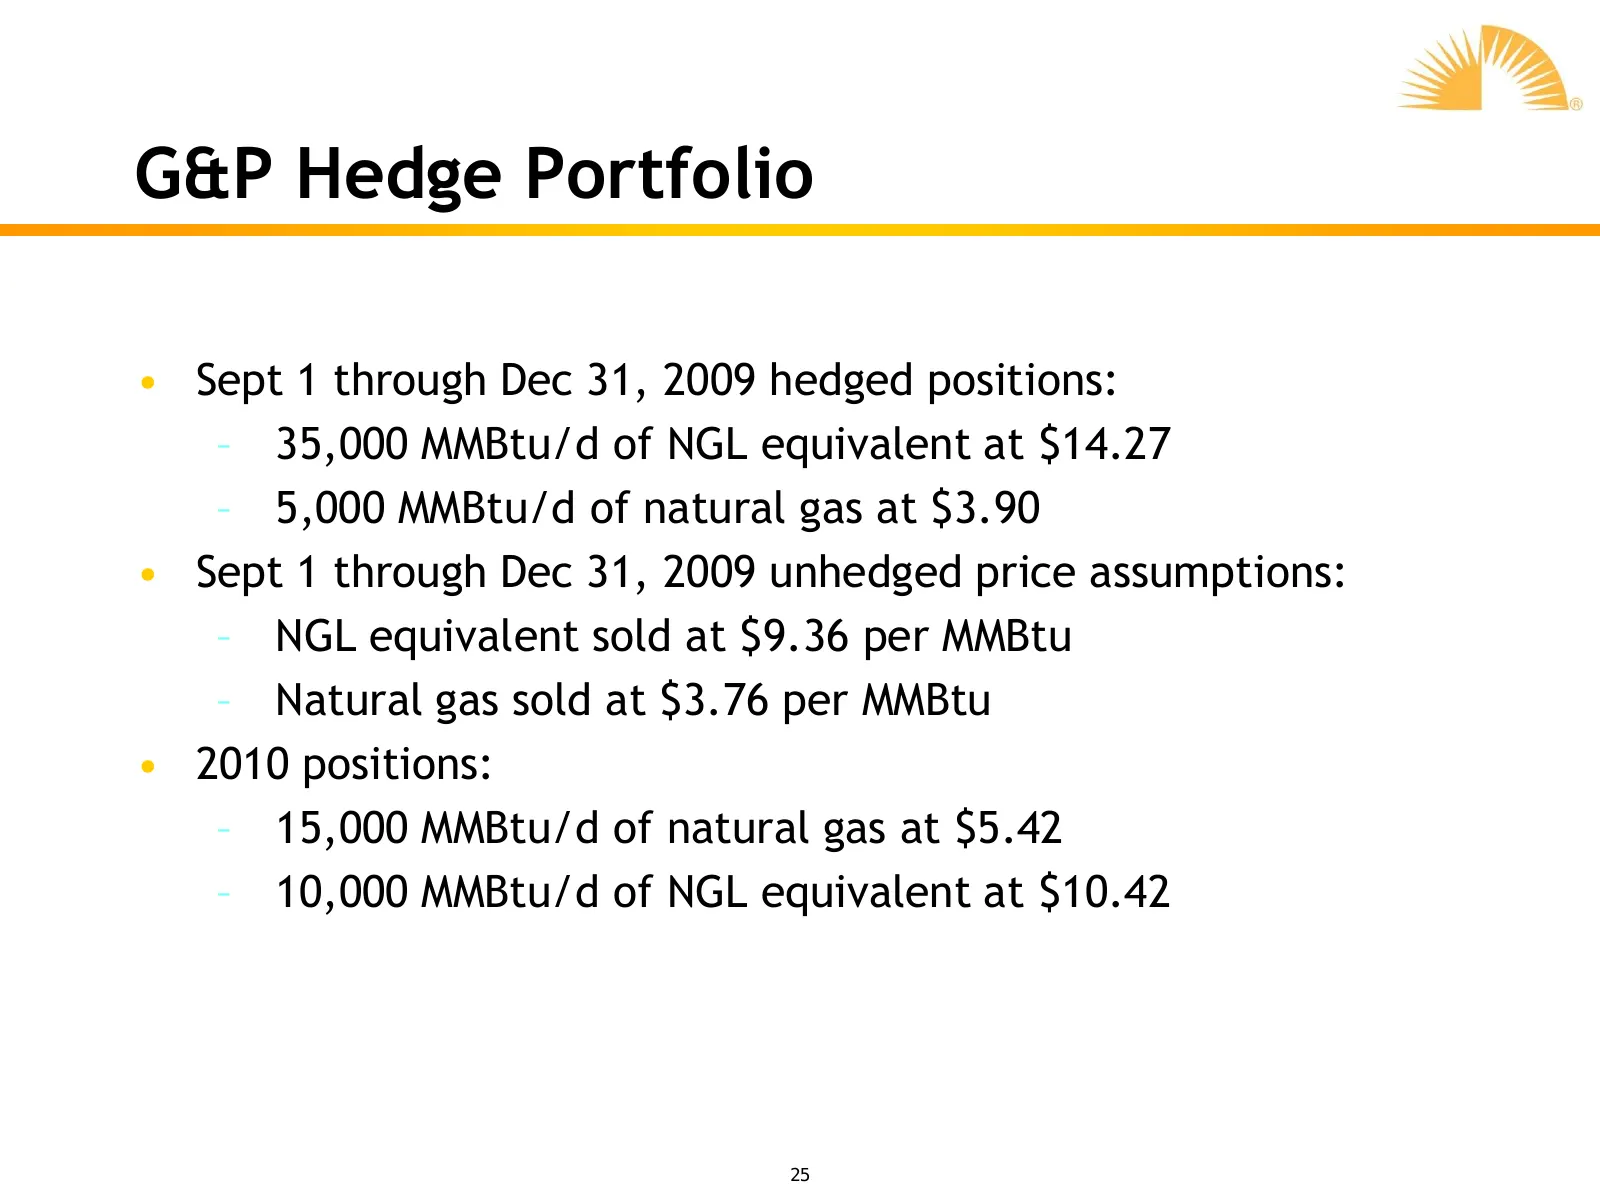
G&P Hedge Portfolio • Sept 1 through Dec 31, 2009 hedged positions: – 35,000 MMBtu/d of NGL equivalent at $14.27 – 5,000 MMBtu/d of natural gas at $3.90 • Sept 1 through Dec 31, 2009 unhedged price assumptions: – NGL equivalent sold at $9.36 per MMBtu – Natural gas sold at $3.76 per MMBtu • 2010 pos
Slide 26: SUGS Growth Projects
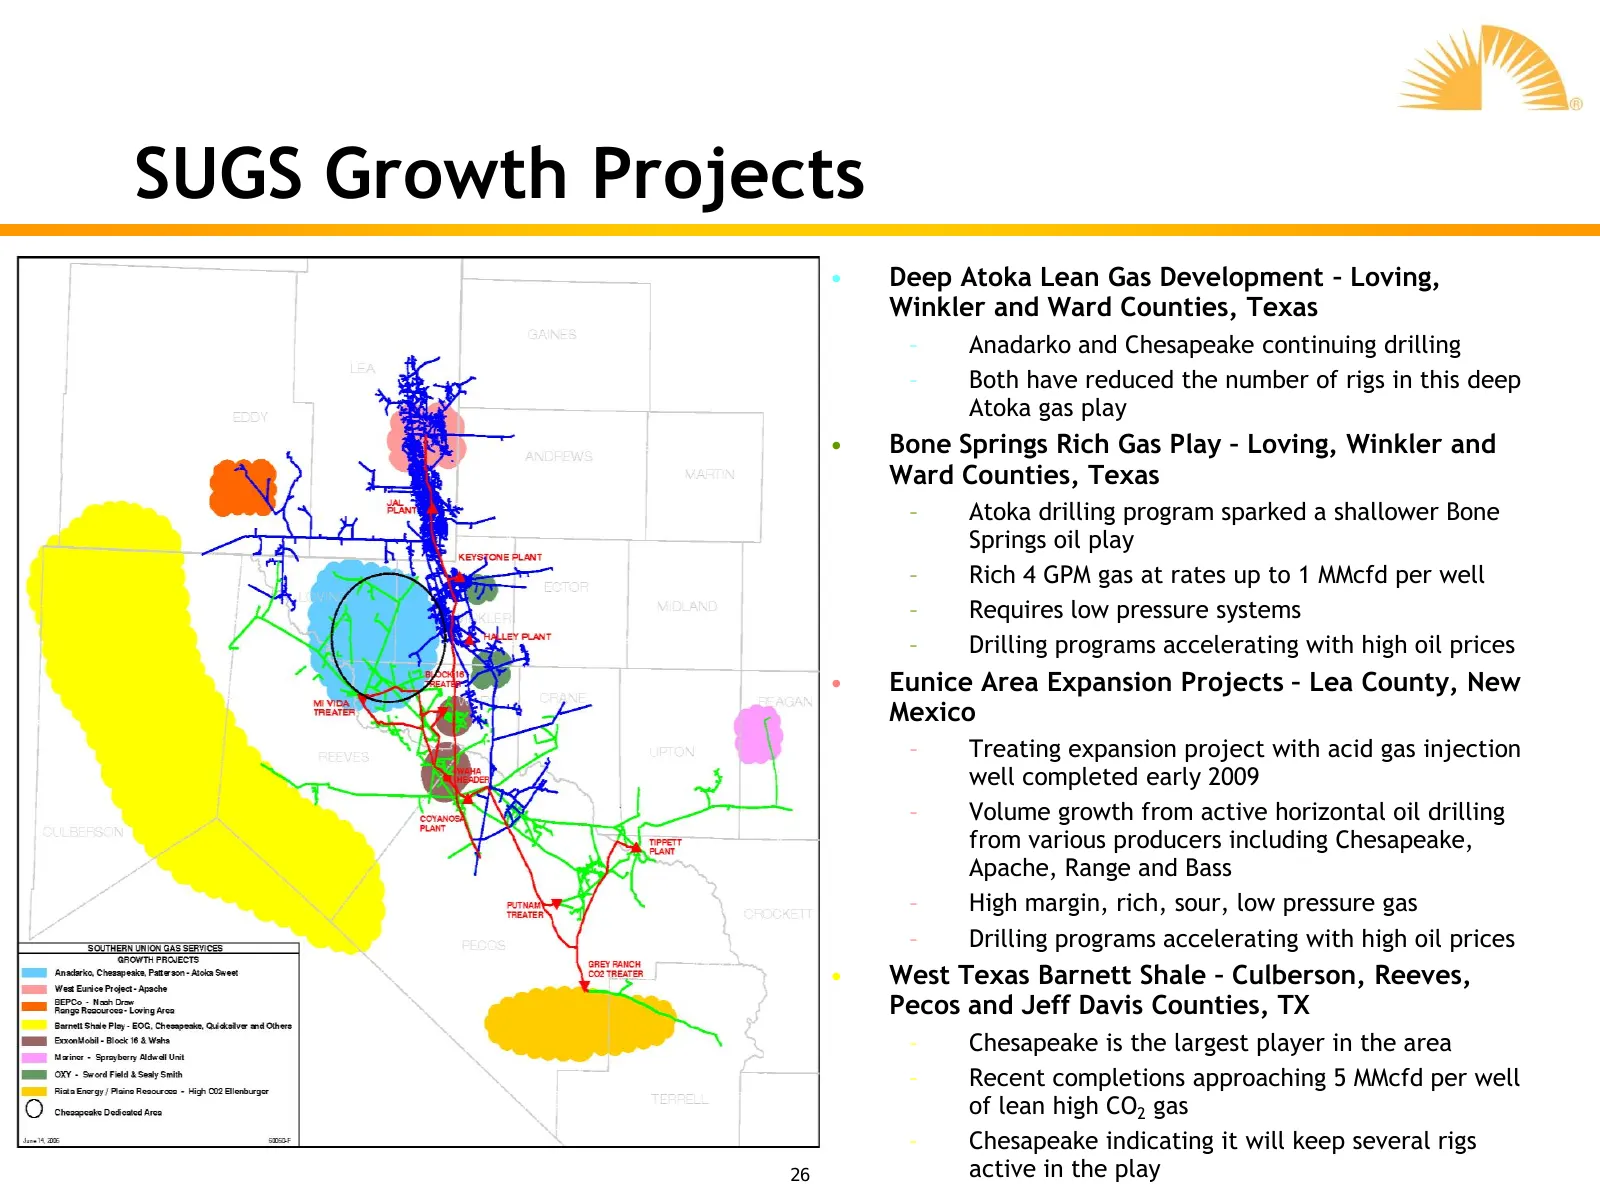
SUGS Growth Projects • Deep Atoka Lean Gas Development – Loving, Winkler and Ward Counties, Texas – Anadarko and Chesapeake continuing drilling – Both have reduced the number of rigs in this deep Atoka gas play • Bone Springs Rich Gas Play – Loving, Winkler and Ward Counties, Texas – Atoka drilling
Slide 27: Distribution
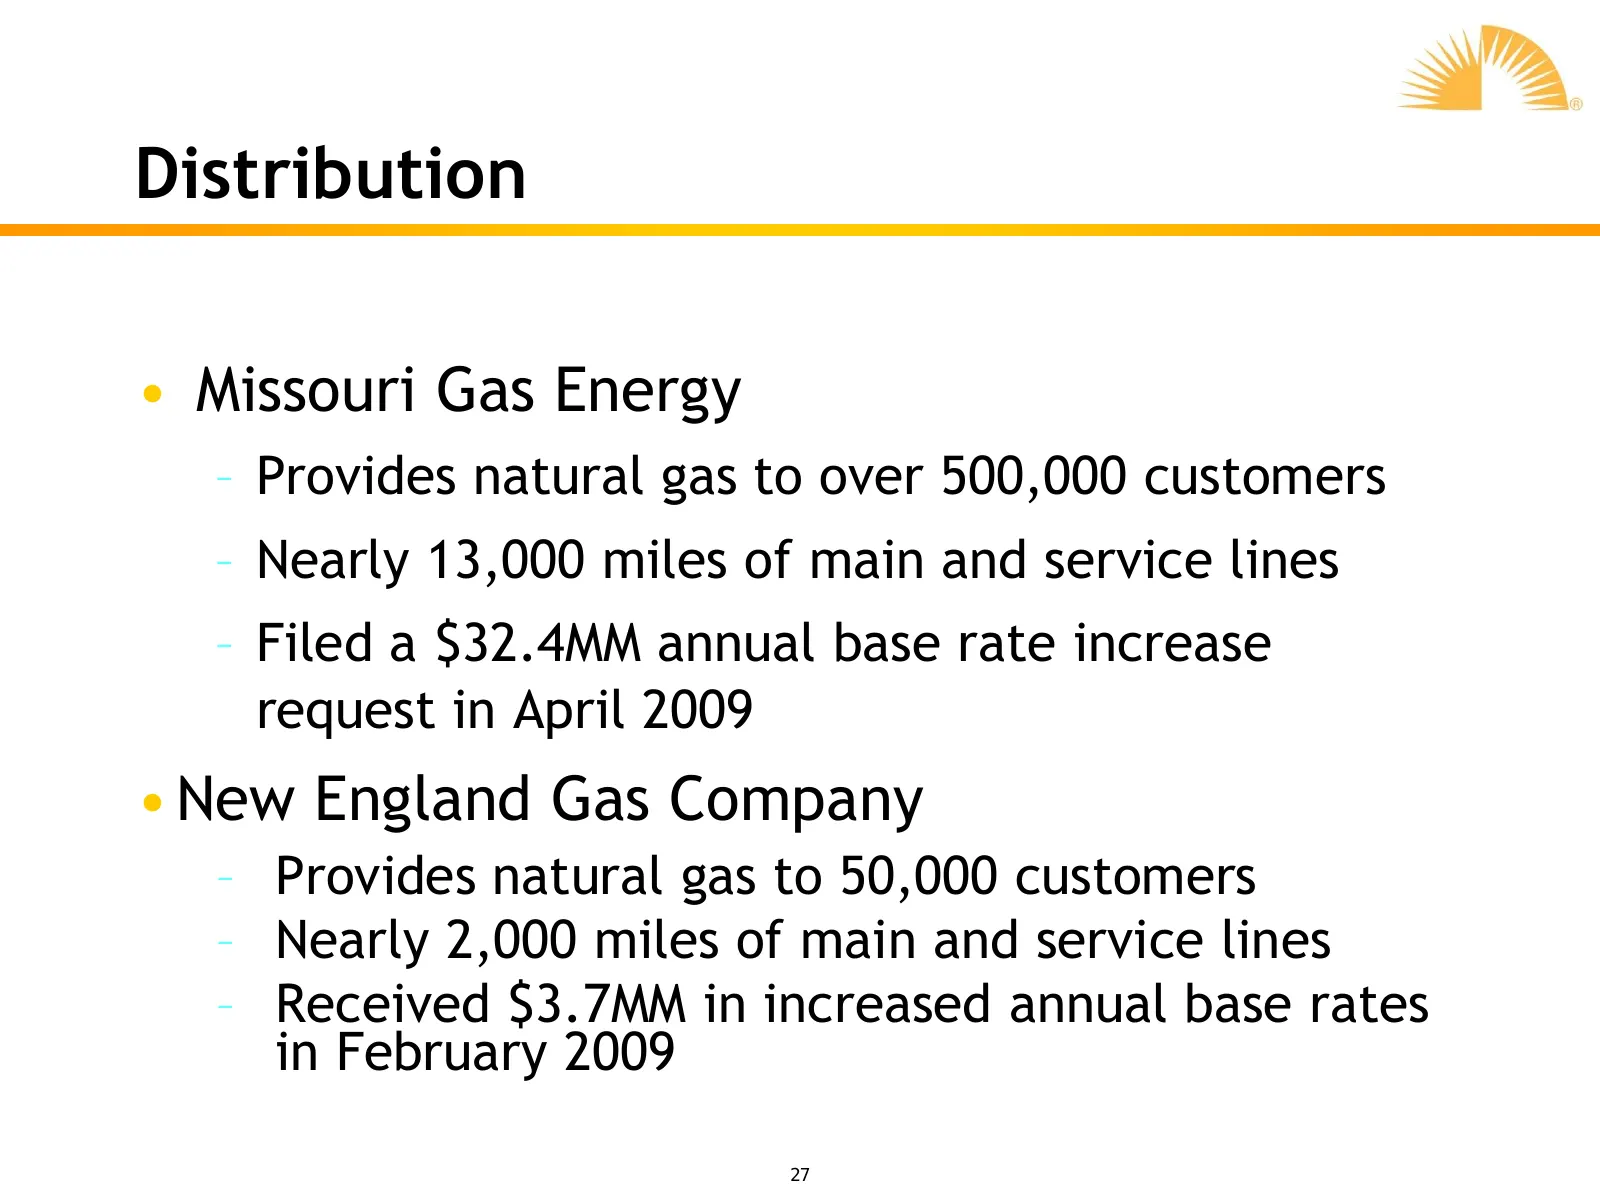
Distribution • Missouri Gas Energy – Provides natural gas to over 500,000 customers – Nearly 13,000 miles of main and service lines – Filed a $32.4MM annual base rate increase request in April 2009 • New England Gas Company – Provides natural gas to 50,000 customers – Nearly 2,000 miles of main and
Slide 28: Corporate & Other
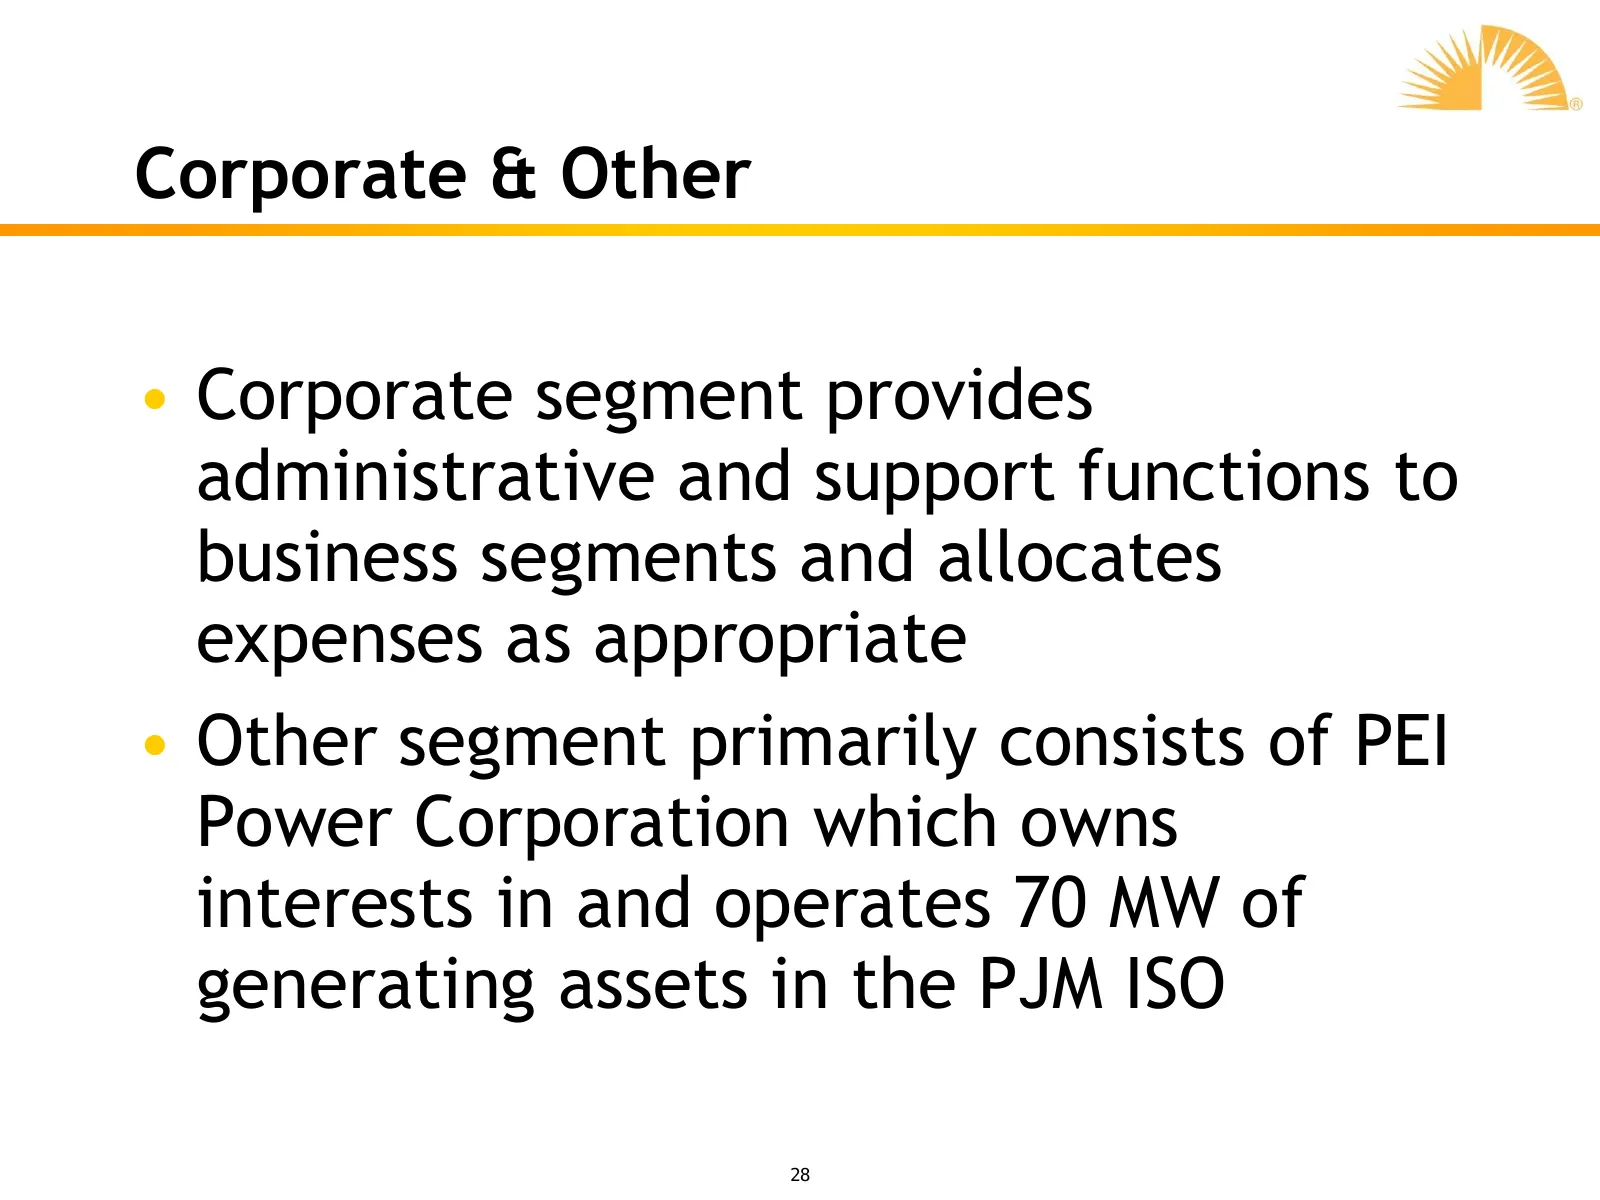
Corporate & Other • Corporate segment provides administrative and support functions to business segments and allocates expenses as appropriate • Other segment primarily consists of PEI Power Corporation which owns interests in and operates 70 MW of generating assets in the PJM ISO 28
Slide 29: Summary
Summary • Compelling vision and clear strategic plan going forward – Focus on natural gas related infrastructure – Hedged position in 2009 helps mitigate volatility in NGL margins – Organic growth projects with clear visibility towards earnings growth and value creation – Balance preservation of inv
Source: SEC EDGAR · 8-K filed Sep 10, 2009
More decks from Southern Union Co
 Barclays Capital Investment Grade Energy and Pipeline Conference 201232 slides · Mar 8, 2012
 Debt Investor Presentation (February 2012)33 slides · Feb 22, 2012
 Merger or Acquisition (July 2011)11 slides · Jul 5, 2011
 Merger or Acquisition (June 2011)22 slides · Jun 16, 2011
 Investor Presentation (February 2011)37 slides · Feb 25, 2011
 BMO Capital Markets 2010 Utilities and Pipelines Day23 slides · Nov 30, 2010