NuStar Energy LP — Wells Fargo Securities Midstream and Utility Symposium 2018
35 slides from NuStar Energy LP's conference presentation, Dec 6, 2018
Slide 1: Wells Fargo Midstream and Utility Symposium
Exhibit 99.1 Wells Fargo S e c u r i t i e s R e s e a r c h , E c o n o m i c s WELLS& S t r a t e g y M i dFARGO s t r e a m a n d U t i l i t y S y m p o s i u m Securities Research, Economics & Strategy Midstream and Utility Symposium December 5, 2018 December 5, 2018
Slide 2: Forward-Looking Statements
Forward-Looking Statements Statements contained in this presentation other than statements of historical fact are forward-looking statements. While these forward-looking statements, and any assumptions upon which they are based, are made in good faith and reflect our current judgment regarding the d
Slide 3: Introduction
Introduction
Slide 4: Completed Our Stepped Plan to Achieve Characteristics Demanded by the MLP Sector
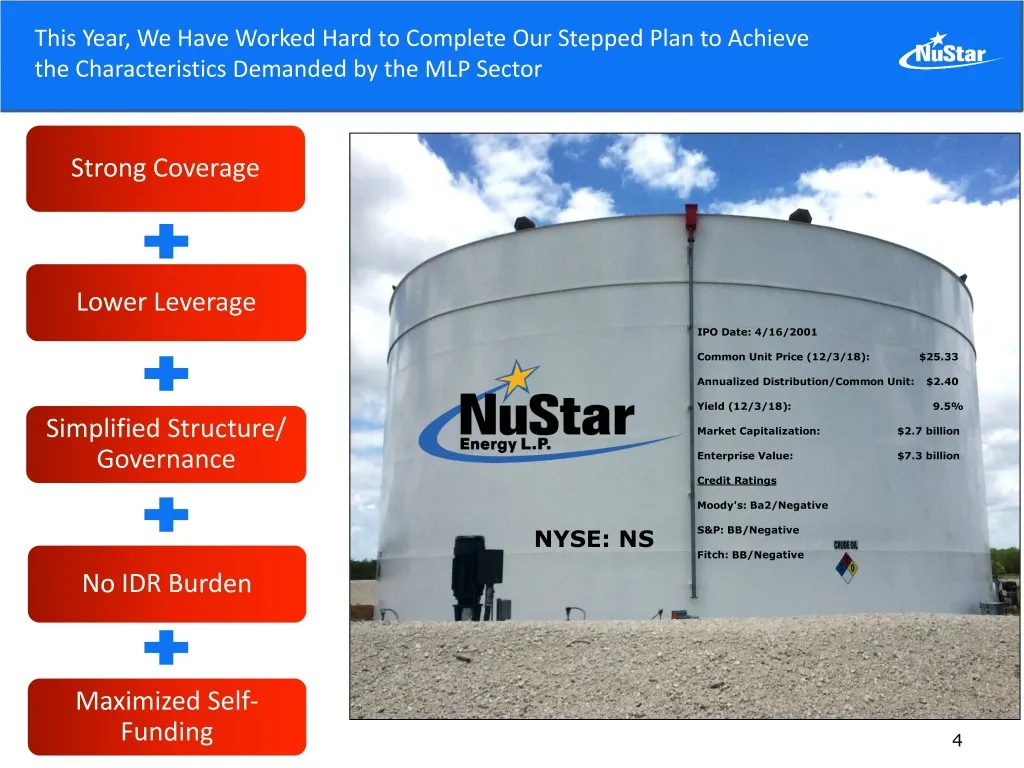
This Year, We Have Worked Hard to Complete Our Stepped Plan to Achieve the Characteristics Demanded by the MLP Sector Strong Coverage Lower Leverage IPO Date: 4/16/2001 Common Unit Price (12/3/18): $25.33 Annualized Distribution/Common Unit: $2.40 Yield (12/3/18): 9.5% Simplified Structure/ Market C
Slide 5: High-Quality Assets Poised for Permian-Driven Growth and Legacy Optimization
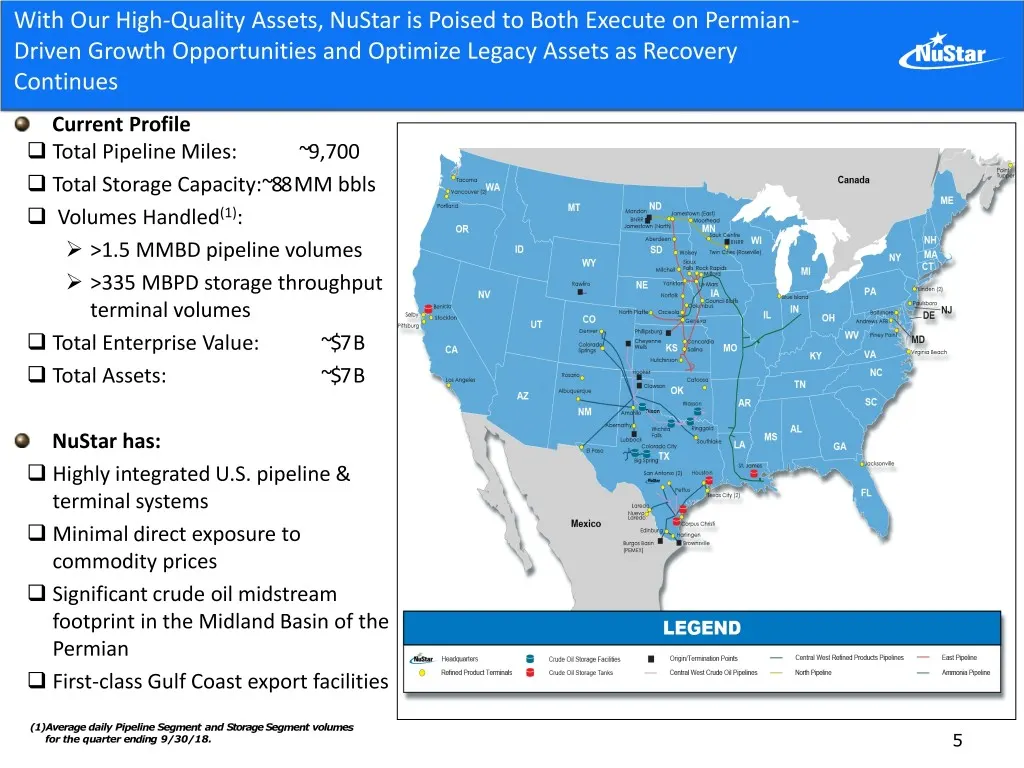
With Our High-Quality Assets, NuStar is Poised to Both Execute on Permian- Driven Growth Opportunities and Optimize Legacy Assets as Recovery Continues Current Profile Total Pipeline Miles: ~9,700 Total Storage Capacity:~88 MM bbls Volumes Handled(1): ➢ >1.5 MMBD pipeline volumes ➢ >335 MBPD s
Slide 6: The Permian Basin: Phenomenal Growth Driving Midstream Opportunities
The Permian Basin: Phenomenal Growth Driving Midstream Opportunities
Slide 7: Permian Basin Has Grown Faster Than Any Other Basin
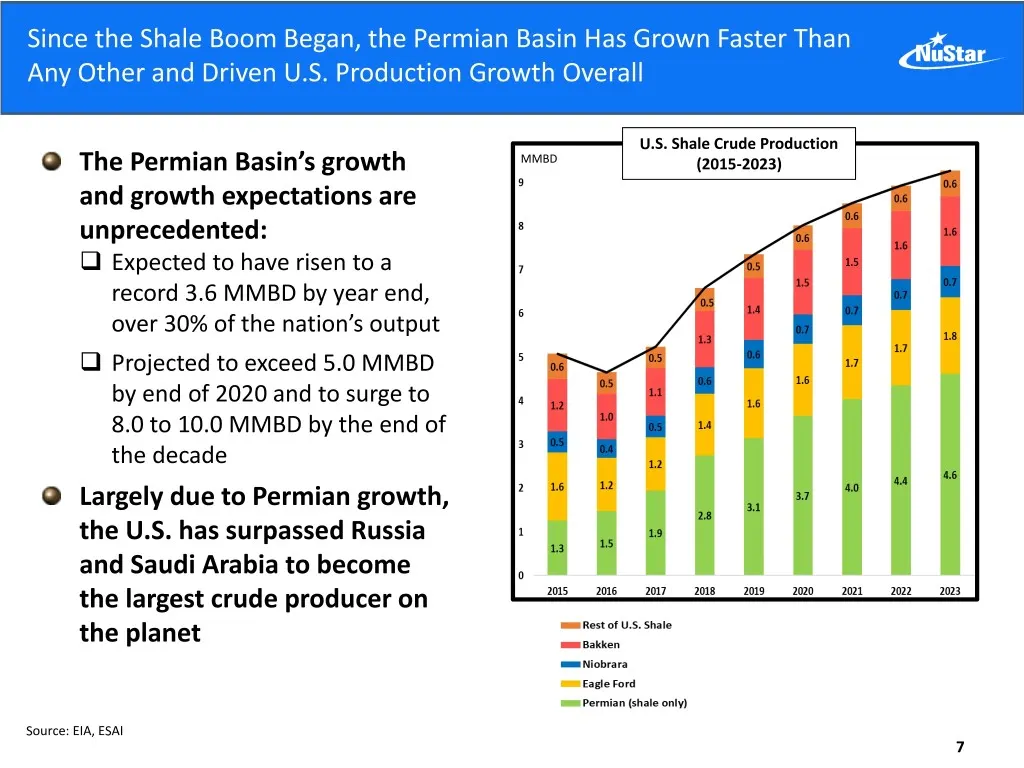
Since the Shale Boom Began, the Permian Basin Has Grown Faster Than Any Other and Driven U.S. Production Growth Overall U.S. Shale Crude Production The Permian Basin’s growth MMBD (2015-2023) and growth expectations are unprecedented: Expected to have risen to a record 3.6 MMBD by year end, over 3
Slide 8: If the Permian Were a Country, It Would Rank #7 Among Liquids Producers
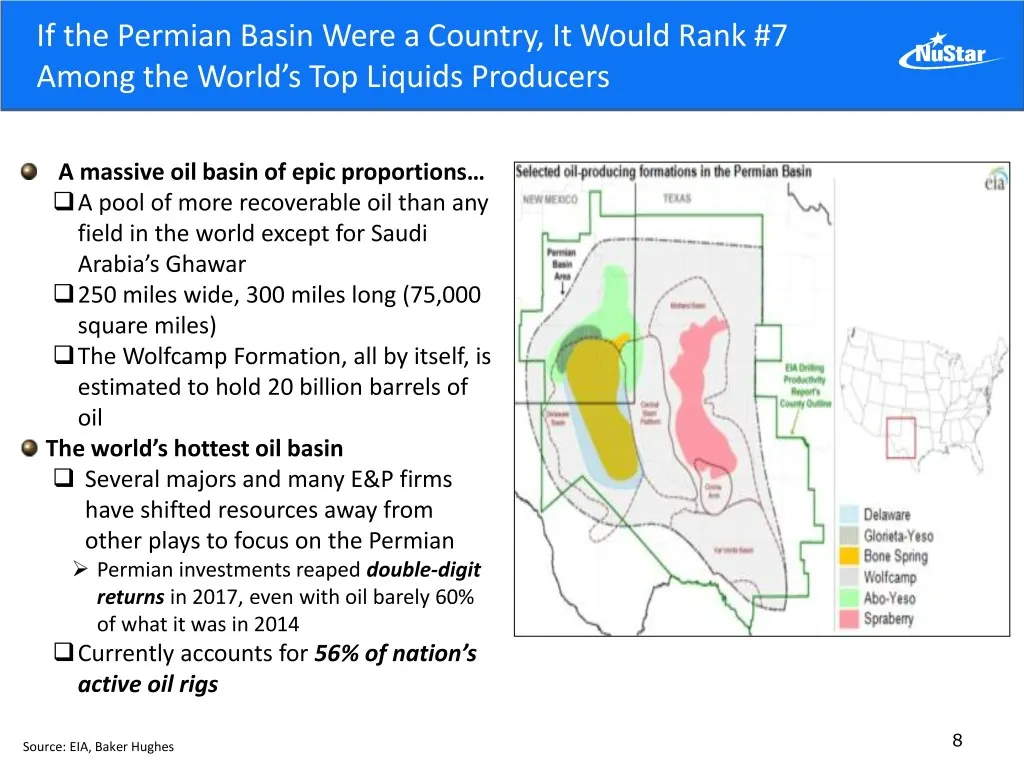
If the Permian Basin Were a Country, It Would Rank #7 Among the World’s Top Liquids Producers A massive oil basin of epic proportions… A pool of more recoverable oil than any field in the world except for Saudi Arabia’s Ghawar 250 miles wide, 300 miles long (75,000 square miles) The Wolfcamp Form
Slide 9: Permian Would Continue to Grow Even at $50 WTI
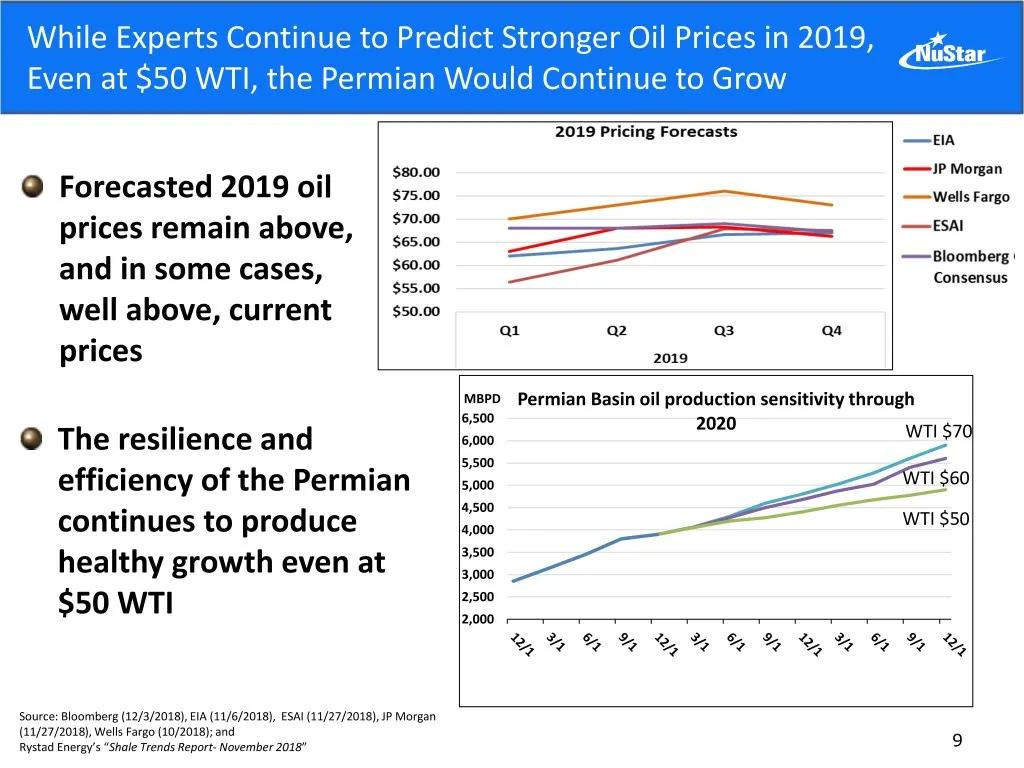
While Experts Continue to Predict Stronger Oil Prices in 2019, Even at $50 WTI, the Permian Would Continue to Grow Forecasted 2019 oil prices remain above, and in some cases, well above, current prices MBPD Permian Basin oil production sensitivity through 6,500 2020 WTI $70 The resilience and 6,000
Slide 10: Producers Remain Bullish on Permian Growth, Strength & Resiliency
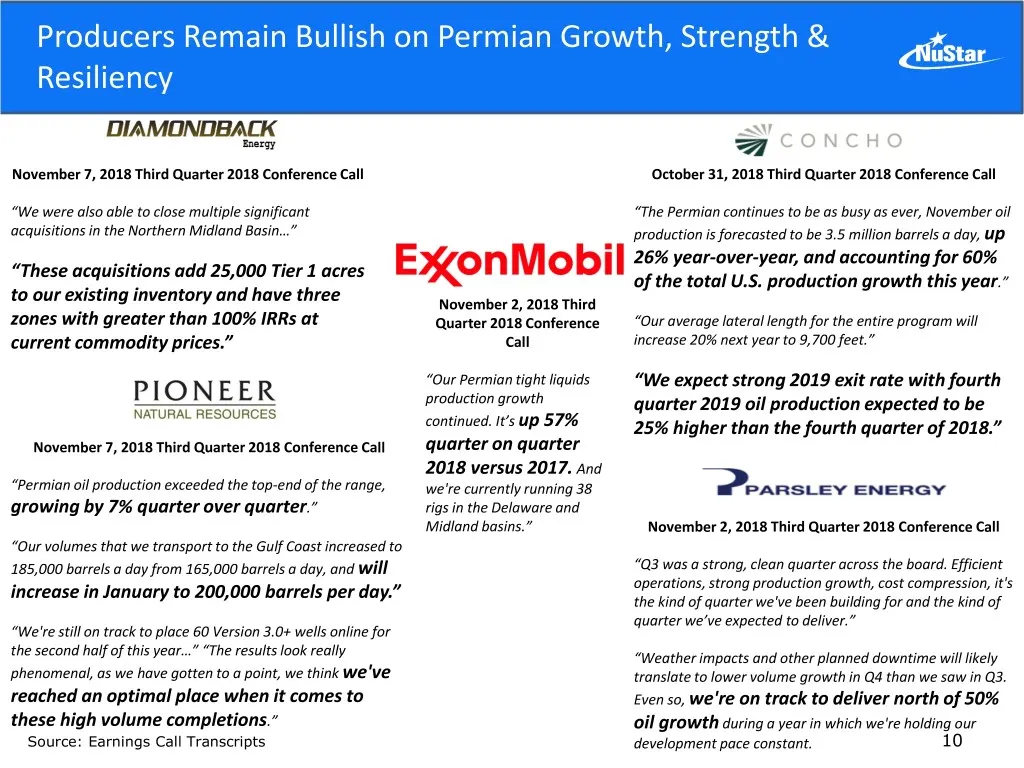
Producers Remain Bullish on Permian Growth, Strength & Resiliency November 7, 2018 Third Quarter 2018 Conference Call October 31, 2018 Third Quarter 2018 Conference Call “We were also able to close multiple significant “The Permian continues to be as busy as ever, November oil acquisitions in the No
Slide 11: NuStar Permian Opportunities
atistar Permian Opportunities
Slide 12: Permian Is the Genesis for Most Midstream Growth Opportunities
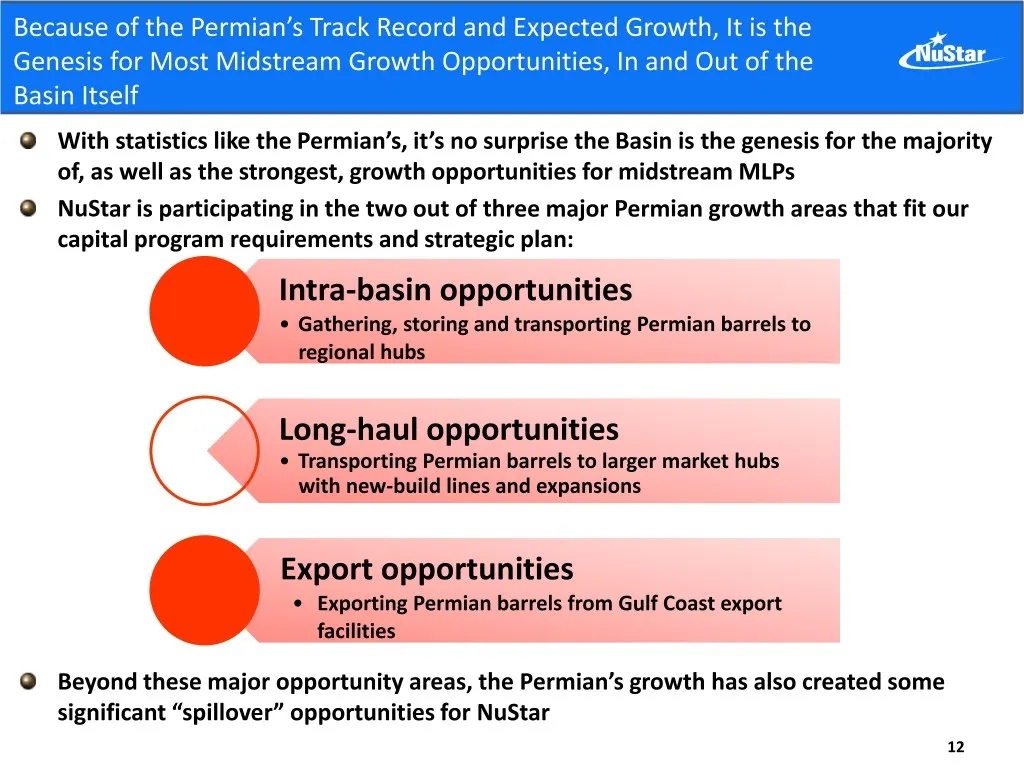
Because of the Permian’s Track Record and Expected Growth, It is the Genesis for Most Midstream Growth Opportunities, In and Out of the Basin Itself With statistics like the Permian’s, it’s no surprise the Basin is the genesis for the majority of, as well as the strongest, growth opportunities for m
Slide 13: Intra-Basin Opportunities: Permian Crude System Continues to Prove Itself
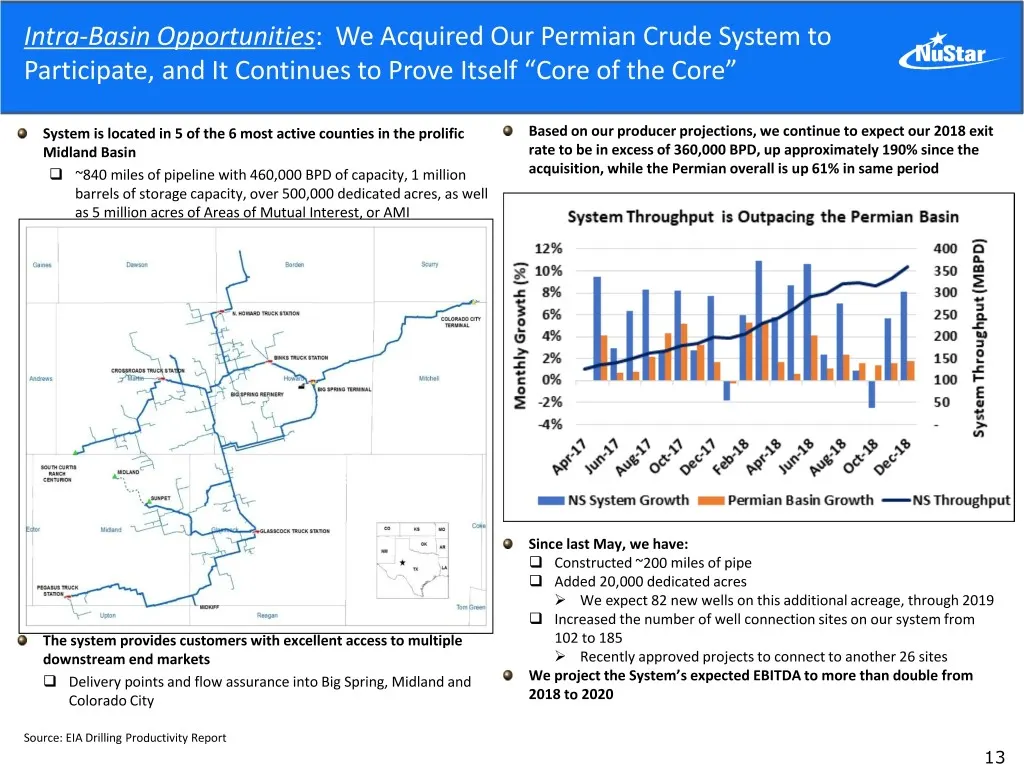
Intra-Basin Opportunities: We Acquired Our Permian Crude System to Participate, and It Continues to Prove Itself “Core of the Core” System is located in 5 of the 6 most active counties in the prolific Based on our producer projections, we continue to expect our 2018 exit Midland Basin rate to be in
Slide 14: Permian System Receipts and EBITDA Growing Rapidly
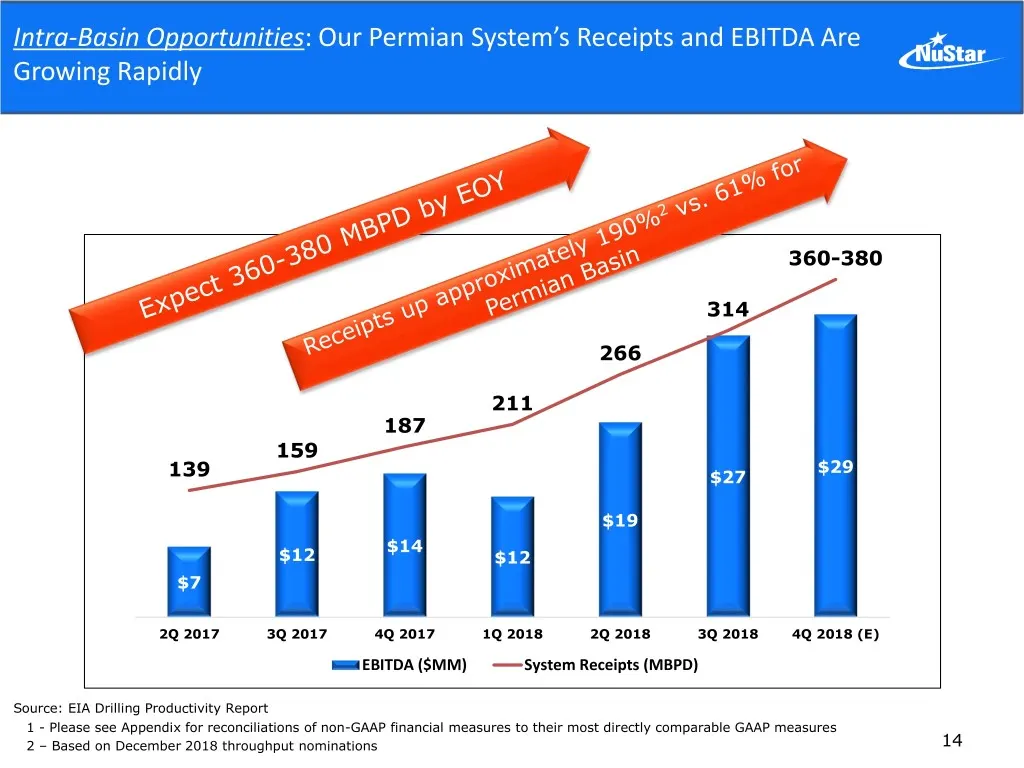
Intra-Basin Opportunities: Our Permian System’s Receipts and EBITDA Are Growing Rapidly $35 360-380 400 350 $30 314 300 $25 266 250 $20 211 187 200 159 $15 139 $29 $27 150 $10 $19 100 $14 $12 $12 $5 50 $7 $0 0 2Q 2017 3Q 2017 4Q 2017 1Q 2018 2Q 2018 3Q 2018 4Q 2018 (E) EBITDA ($MM) System Receipts (
Slide 15: Export Opportunities: Incremental Permian Barrels Will Move Out of Gulf Coast
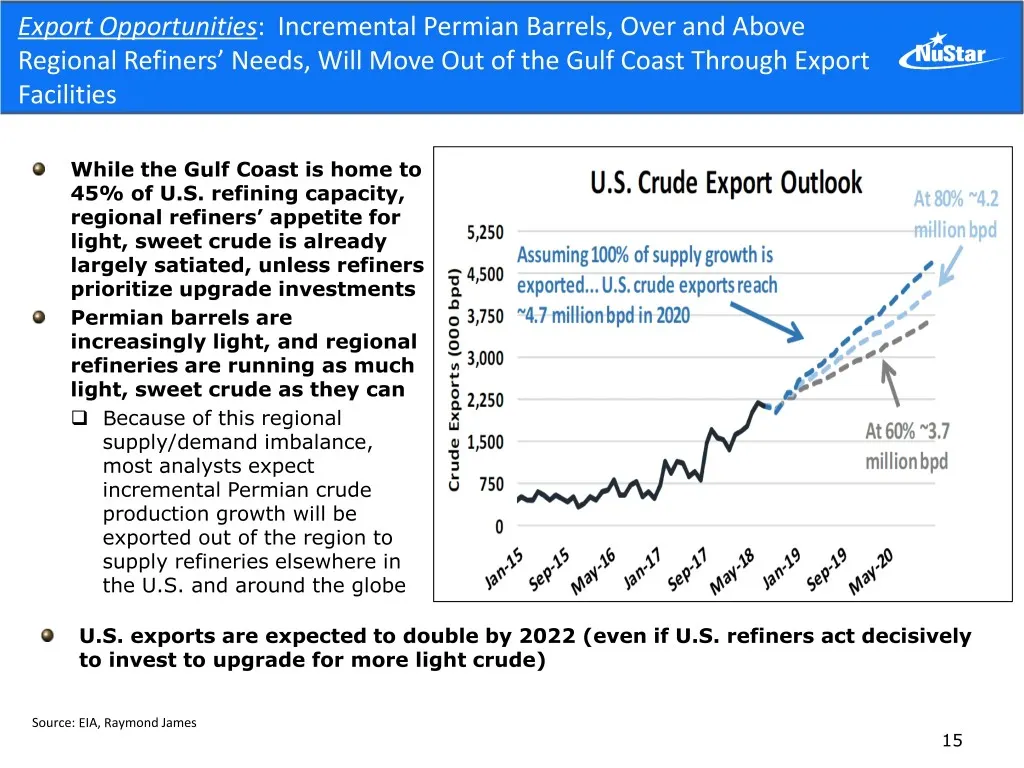
Export Opportunities: Incremental Permian Barrels, Over and Above Regional Refiners’ Needs, Will Move Out of the Gulf Coast Through Export Facilities While the Gulf Coast is home to 45% of U.S. refining capacity, regional refiners’ appetite for light, sweet crude is already largely satiated, unless
Slide 16: NuStar's CCNB Dock Facility Positioned to Benefit From Export Growth
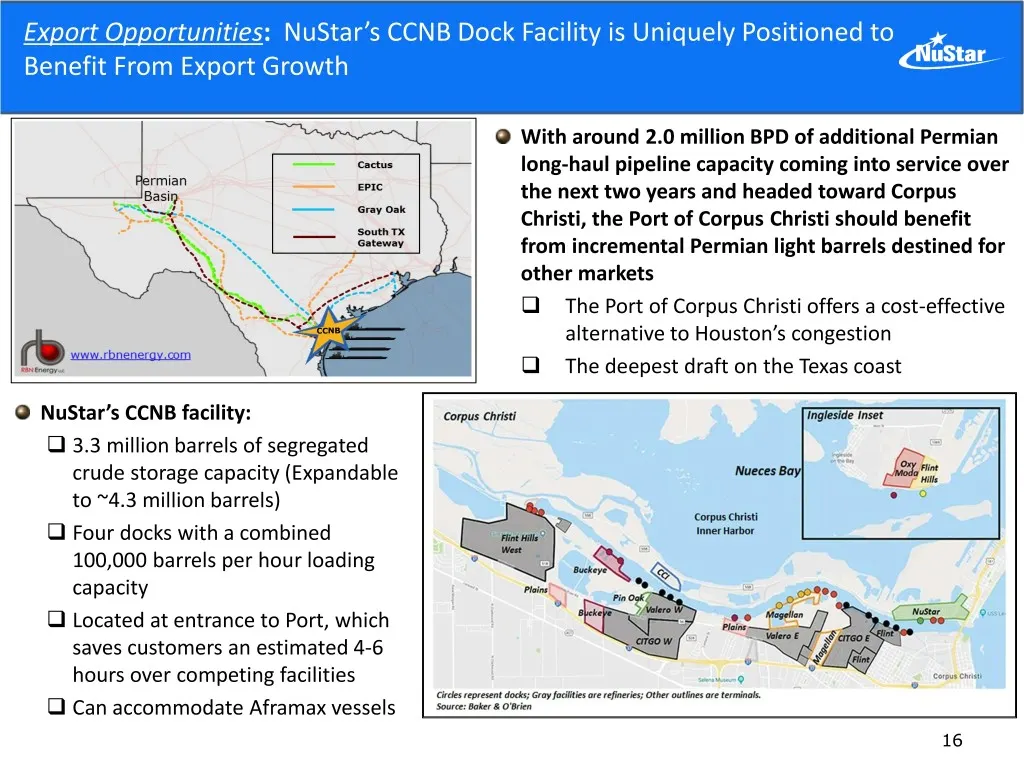
Export Opportunities: NuStar’s CCNB Dock Facility is Uniquely Positioned to Benefit From Export Growth With around 2.0 million BPD of additional Permian long-haul pipeline capacity coming into service over the next two years and headed toward Corpus Christi, the Port of Corpus Christi should benefit
Slide 17: Agreement With Trafigura Leverages South Texas System and CCNB
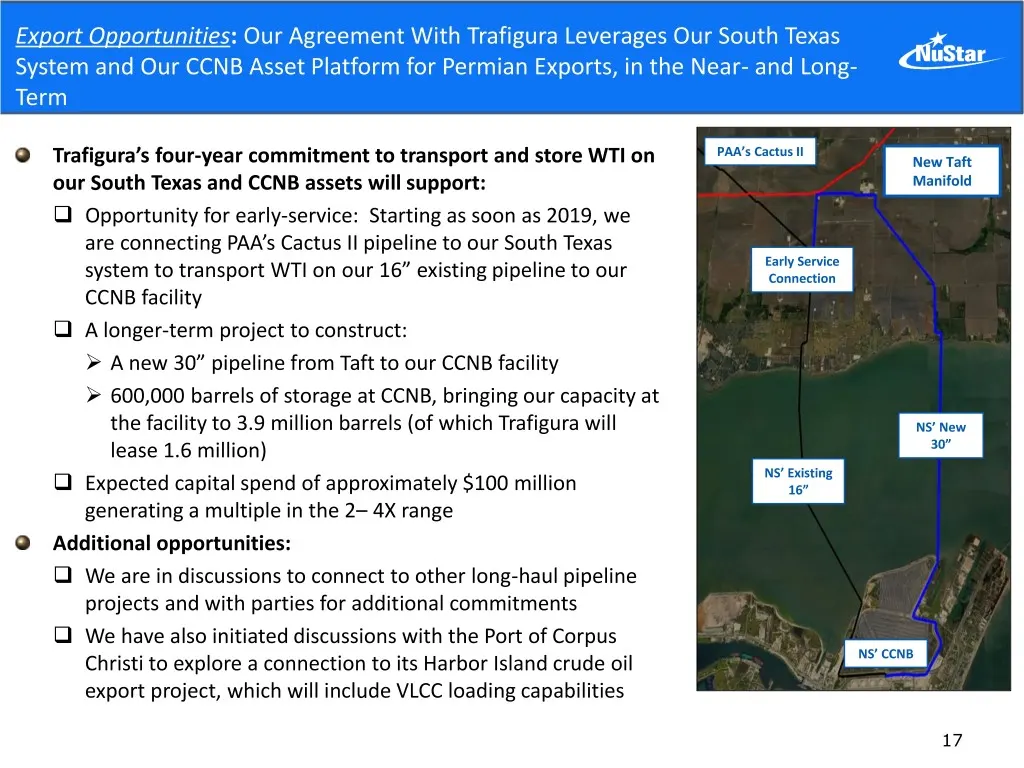
Export Opportunities: Our Agreement With Trafigura Leverages Our South Texas System and Our CCNB Asset Platform for Permian Exports, in the Near- and Long- Term PAA’s Cactus II Trafigura’s four-year commitment to transport and store WTI on New Taft our South Texas and CCNB assets will support: Manif
Slide 18: Spillover Opportunities: South Texas Crude System
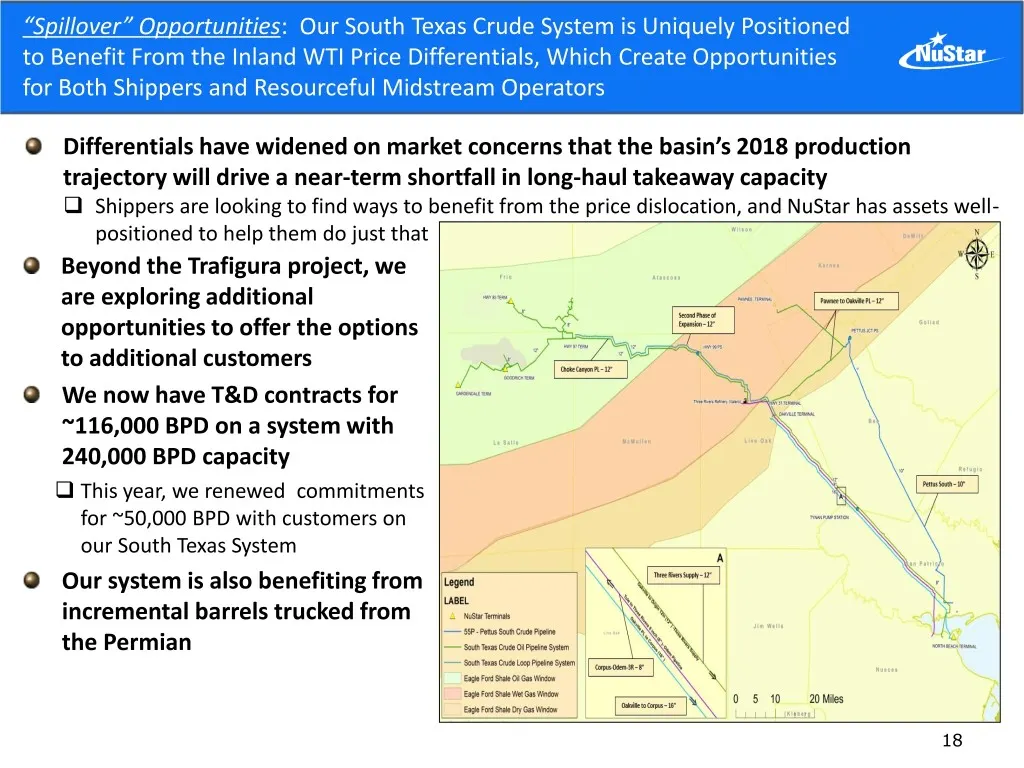
“Spillover” Opportunities: Our South Texas Crude System is Uniquely Positioned to Benefit From the Inland WTI Price Differentials, Which Create Opportunities for Both Shippers and Resourceful Midstream Operators Differentials have widened on market concerns that the basin’s 2018 production trajector
Slide 19: Supplying Permian Barrels to Ardmore and McKee Refineries
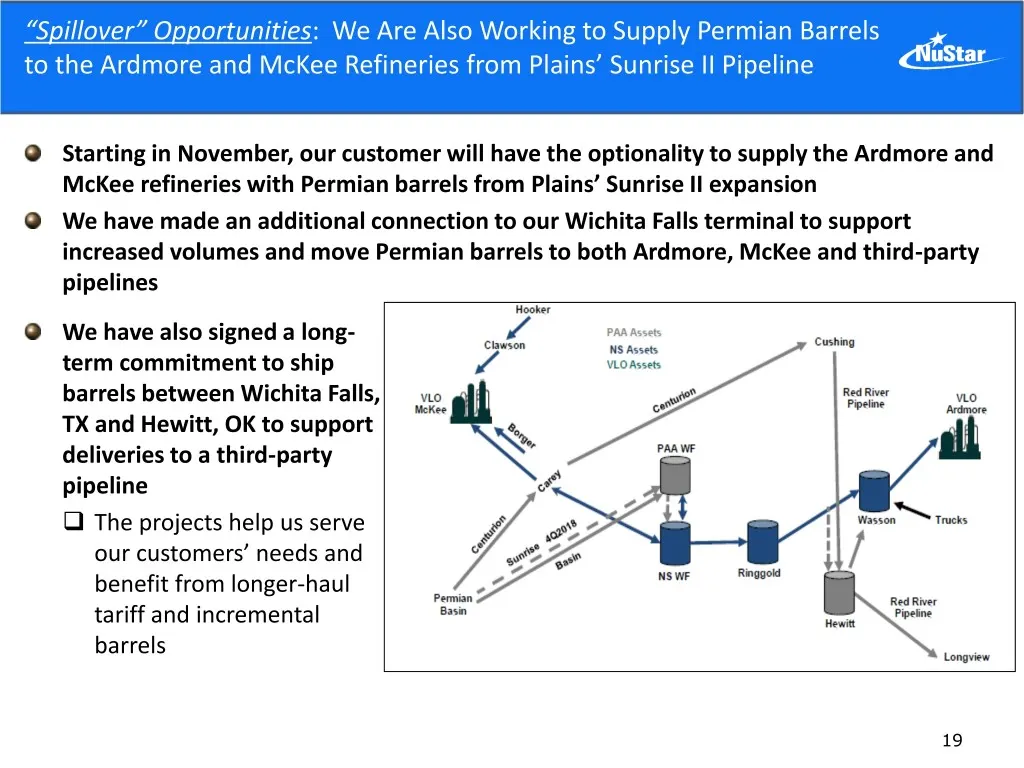
“Spillover” Opportunities: We Are Also Working to Supply Permian Barrels to the Ardmore and McKee Refineries from Plains’ Sunrise II Pipeline Starting in November, our customer will have the optionality to supply the Ardmore and McKee refineries with Permian barrels from Plains’ Sunrise II expansion
Slide 20: St. James Terminal Benefiting From Price Dislocations
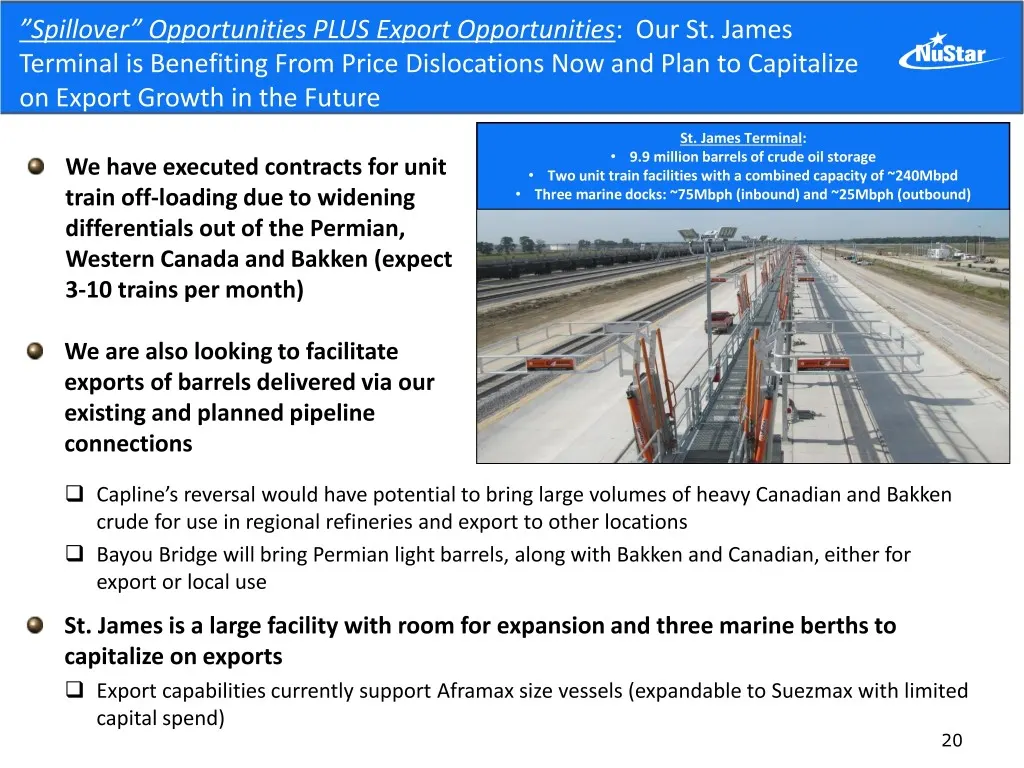
”Spillover” Opportunities PLUS Export Opportunities: Our St. James Terminal is Benefiting From Price Dislocations Now and Plan to Capitalize on Export Growth in the Future St. James Terminal: • 9.9 million barrels of crude oil storage We have executed contracts for unit • Two unit train facilities w
Slide 21: Optimizing Our Legacy Assets
Optimizing Our Legacy Assets
Slide 22: Optimizing Our Mature Systems As Markets Evolve
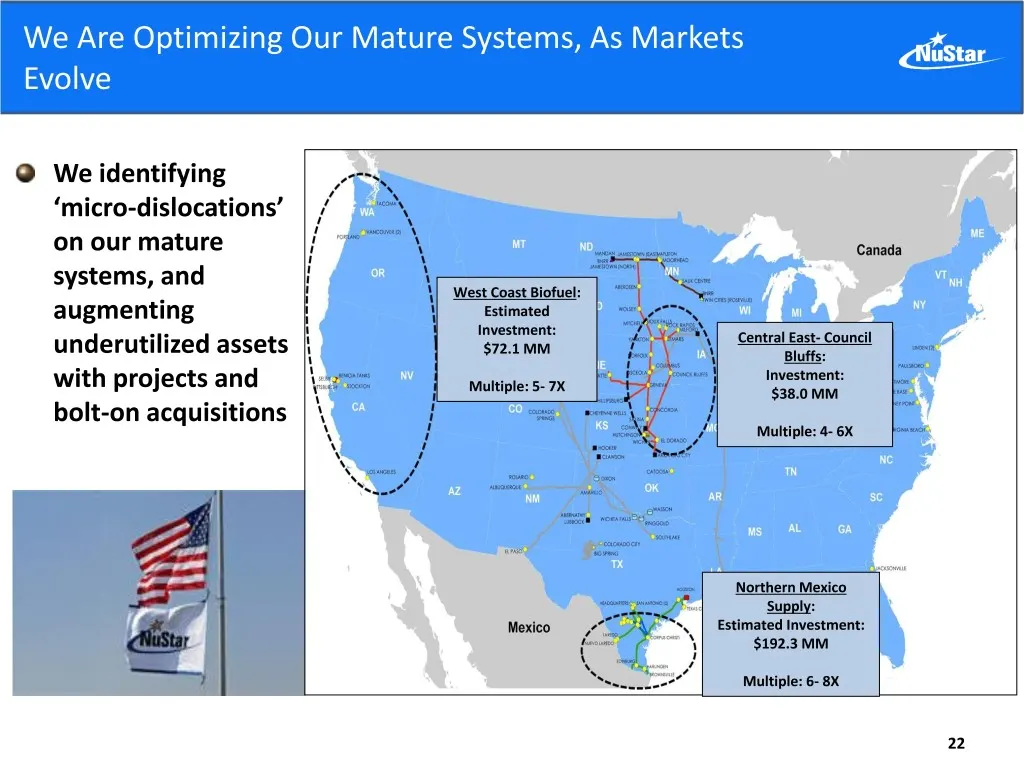
We Are Optimizing Our Mature Systems, As Markets Evolve We identifying ‘micro-dislocations’ on our mature systems, and West Coast Biofuel: augmenting Estimated Investment: Central East- Council underutilized assets $72.1 MM Bluffs: with projects and Investment: Multiple: 5- 7X $38.0 MM bolt-on acqui
Slide 23: Northern Mexico Refined Products Export Projects Progressing on Schedule
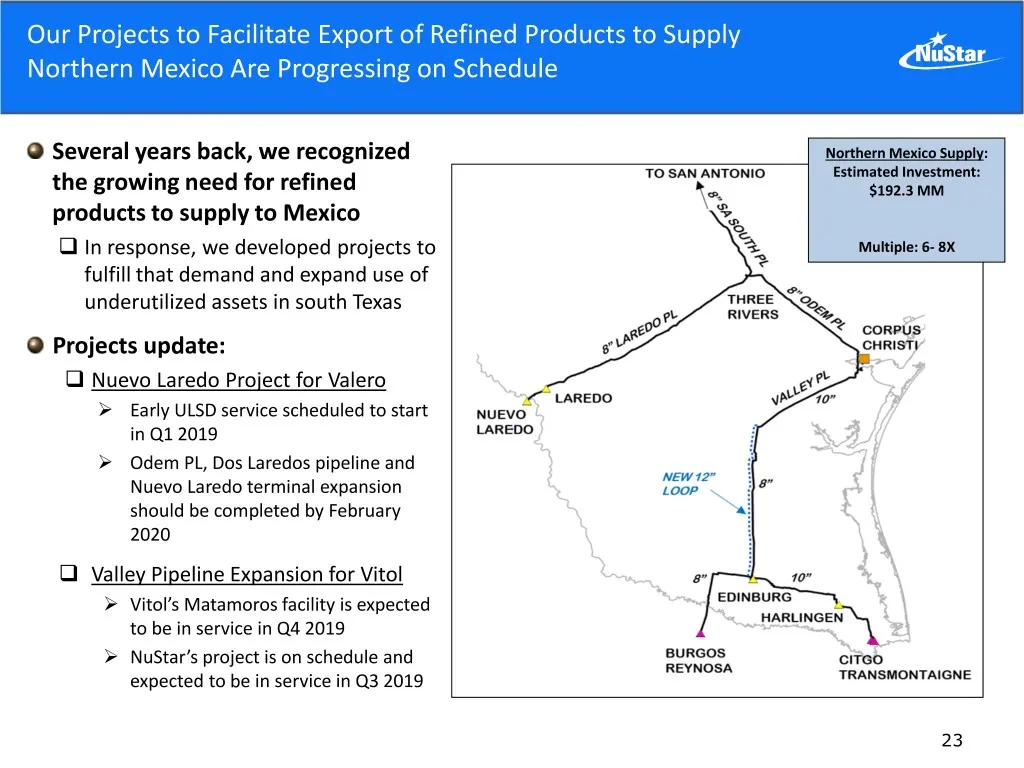
Our Projects to Facilitate Export of Refined Products to Supply Northern Mexico Are Progressing on Schedule Several years back, we recognized Northern Mexico Supply: Estimated Investment: the growing need for refined $192.3 MM products to supply to Mexico In response, we developed projects to Mult
Slide 24: Central East-Council Bluffs System Offers Multiple Opportunities
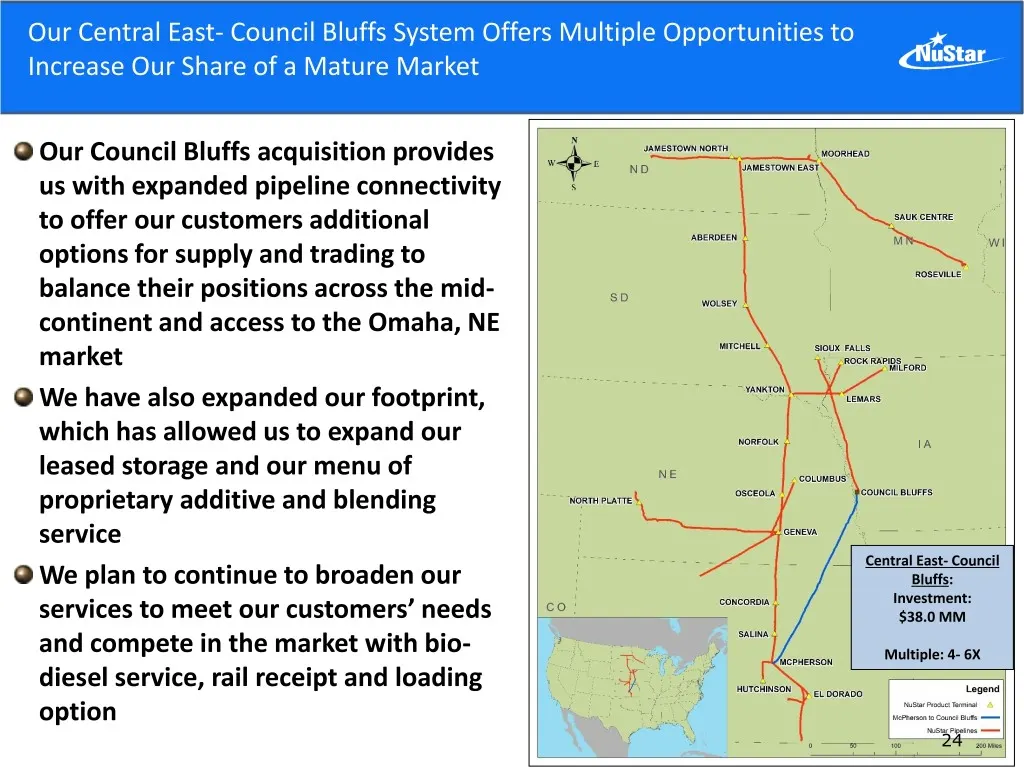
Our Central East- Council Bluffs System Offers Multiple Opportunities to Increase Our Share of a Mature Market Our Council Bluffs acquisition provides us with expanded pipeline connectivity to offer our customers additional options for supply and trading to balance their positions across the mid- co
Slide 25: West Coast Biofuel Strategy Leverages Regulations
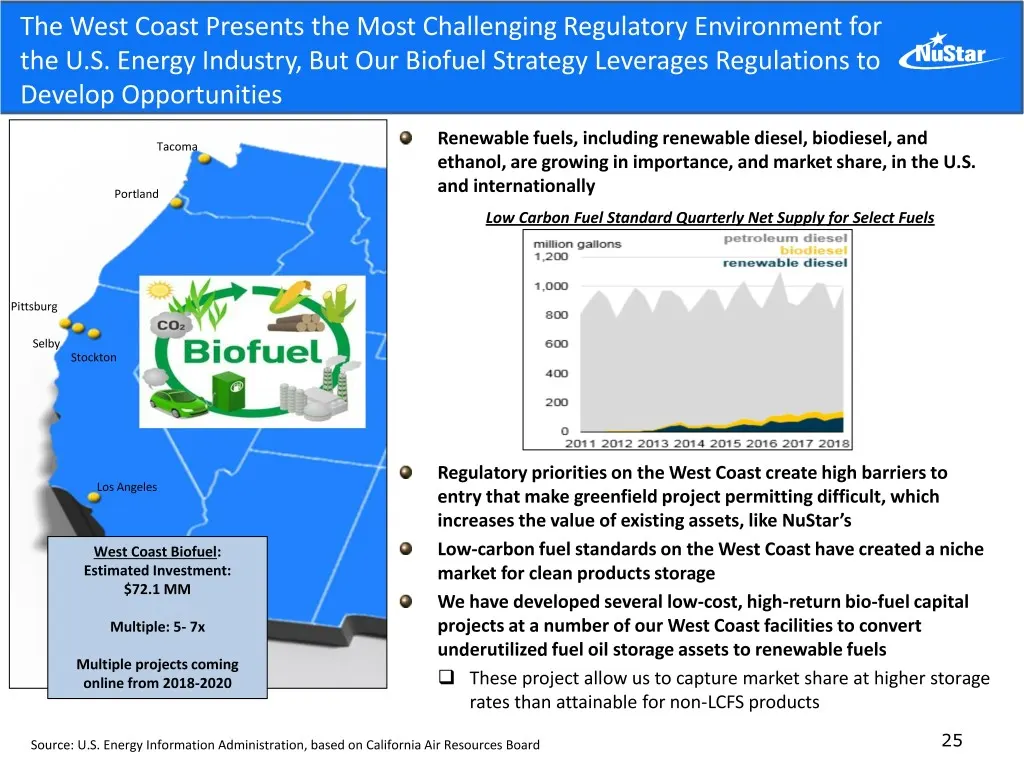
The West Coast Presents the Most Challenging Regulatory Environment for the U.S. Energy Industry, But Our Biofuel Strategy Leverages Regulations to Develop Opportunities Tacoma Renewable fuels, including renewable diesel, biodiesel, and ethanol, are growing in importance, and market share, in the U.

Slide 26: Looking Ahead to 2019
cilistar_ Looking Ahead to 2019
Slide 27: Closing of UK/Europe Sale Completes 2018 Plan
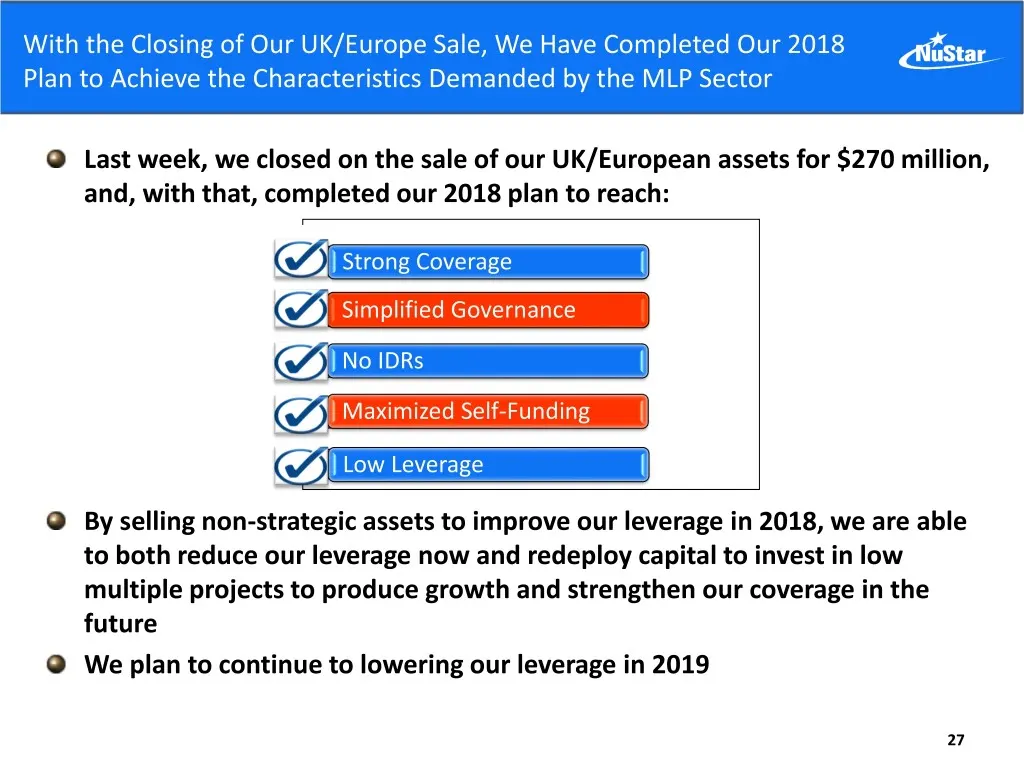
With the Closing of Our UK/Europe Sale, We Have Completed Our 2018 Plan to Achieve the Characteristics Demanded by the MLP Sector Last week, we closed on the sale of our UK/European assets for $270 million, and, with that, completed our 2018 plan to reach: Strong Coverage Simplified Governance No ID
Slide 28: Rigorously Evaluating Each Project and Exercising Capital Discipline
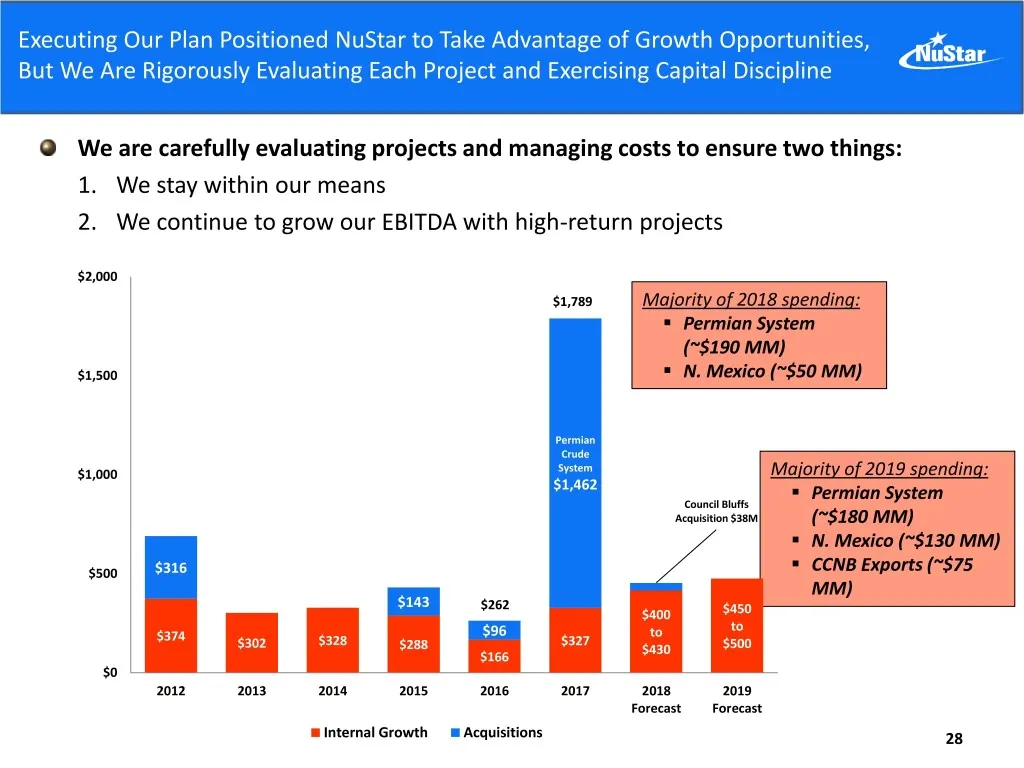
Executing Our Plan Positioned NuStar to Take Advantage of Growth Opportunities, But We Are Rigorously Evaluating Each Project and Exercising Capital Discipline We are carefully evaluating projects and managing costs to ensure two things: 1. We stay within our means 2. We continue to grow our EBITDA
Slide 29: In 2019, Building on Foundational Strengths for Stable Growth
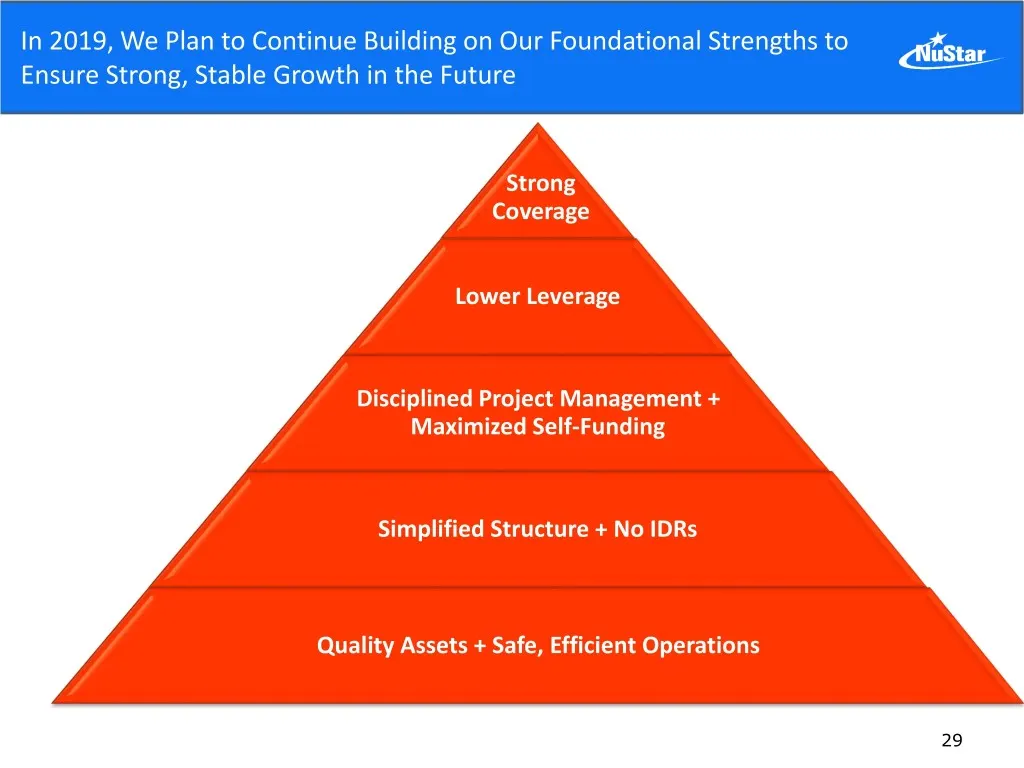
In 2019, We Plan to Continue Building on Our Foundational Strengths to Ensure Strong, Stable Growth in the Future Strong Coverage Lower Leverage Disciplined Project Management + Maximized Self-Funding Simplified Structure + No IDRs Quality Assets + Safe, Efficient Operations 29
Slide 30: Appendix
Appendix
Slide 31: Debt Maturity Schedule (as of September 30, 2018)
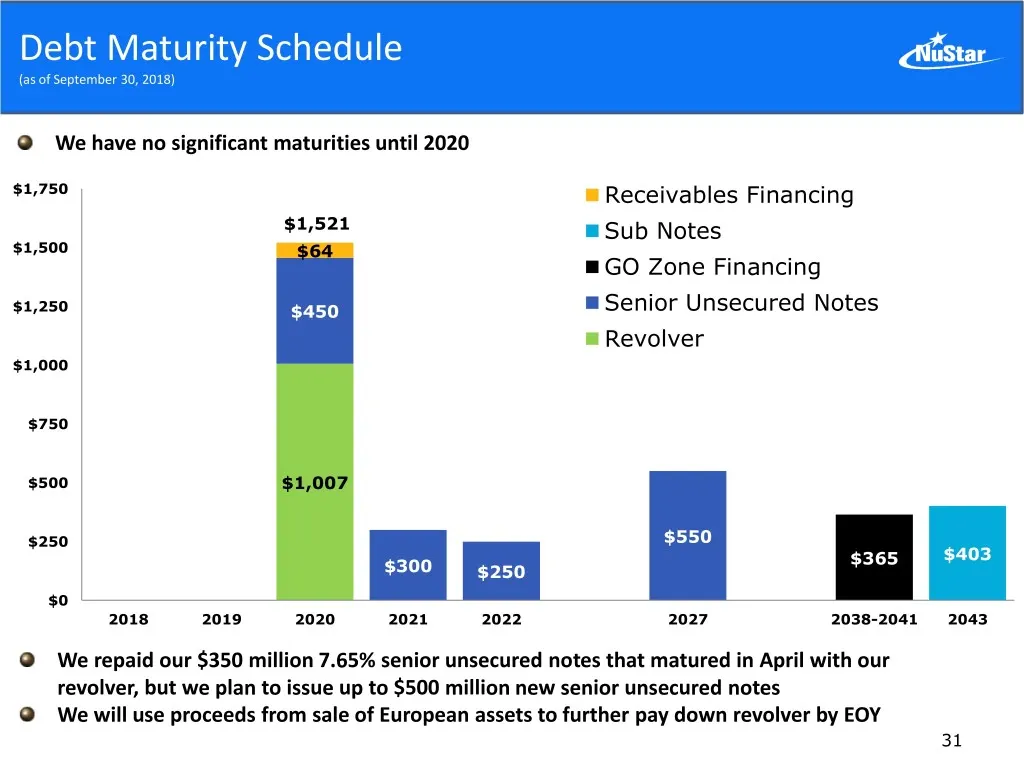
Debt Maturity Schedule (as of September 30, 2018) We have no significant maturities until 2020 $1,750 Receivables Financing $1,521 Sub Notes $1,500 $64 GO Zone Financing $1,250 $450 Senior Unsecured Notes Revolver $1,000 $750 $500 $1,007 $250 $550 $365 $403 $300 $250 $0 2018 2019 2020 2021 2022 2027
Slide 32: Capital Structure as of September 30, 2018
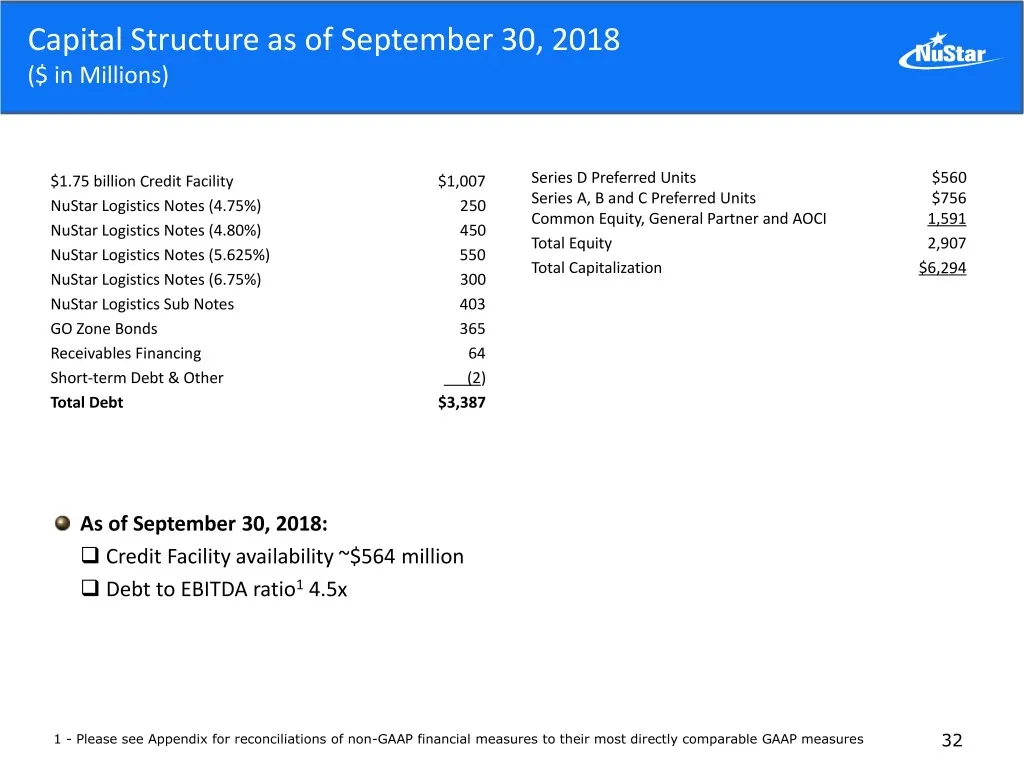
Capital Structure as of September 30, 2018 ($ in Millions) $1.75 billion Credit Facility $1,007 Series D Preferred Units $560 NuStar Logistics Notes (4.75%) 250 Series A, B and C Preferred Units $756 Common Equity, General Partner and AOCI 1,591 NuStar Logistics Notes (4.80%) 450 Total Equity 2,907
Slide 33: Reconciliation of Non-GAAP Financial Information
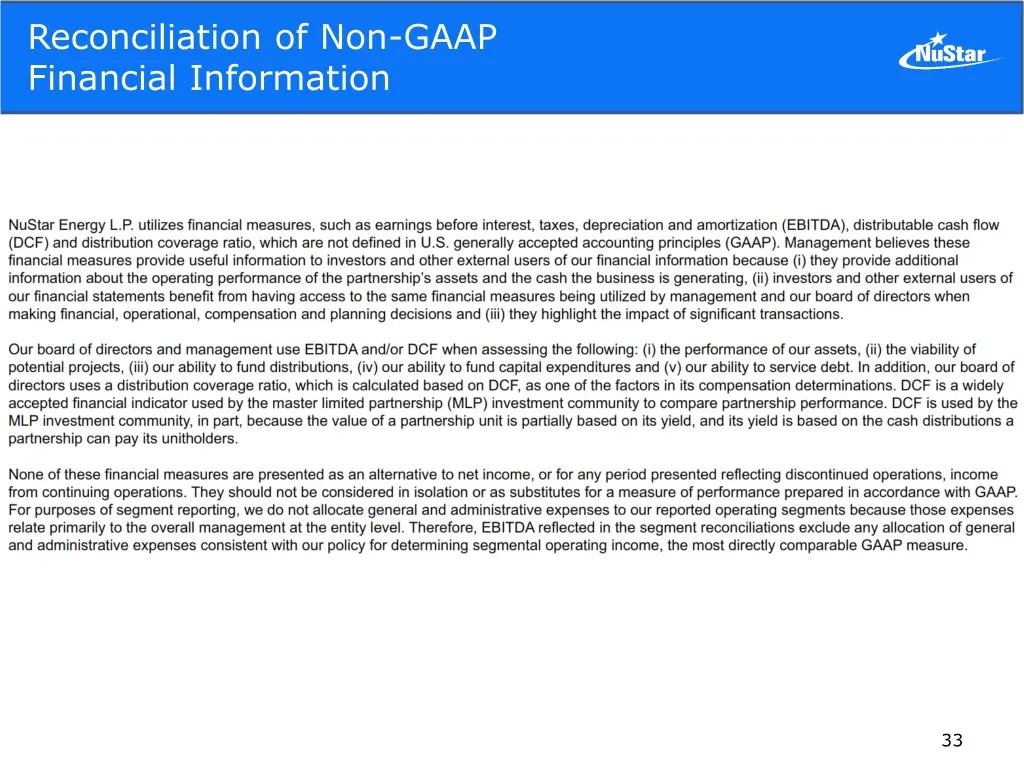
Reconciliation of Non-GAAP Financial Information 33
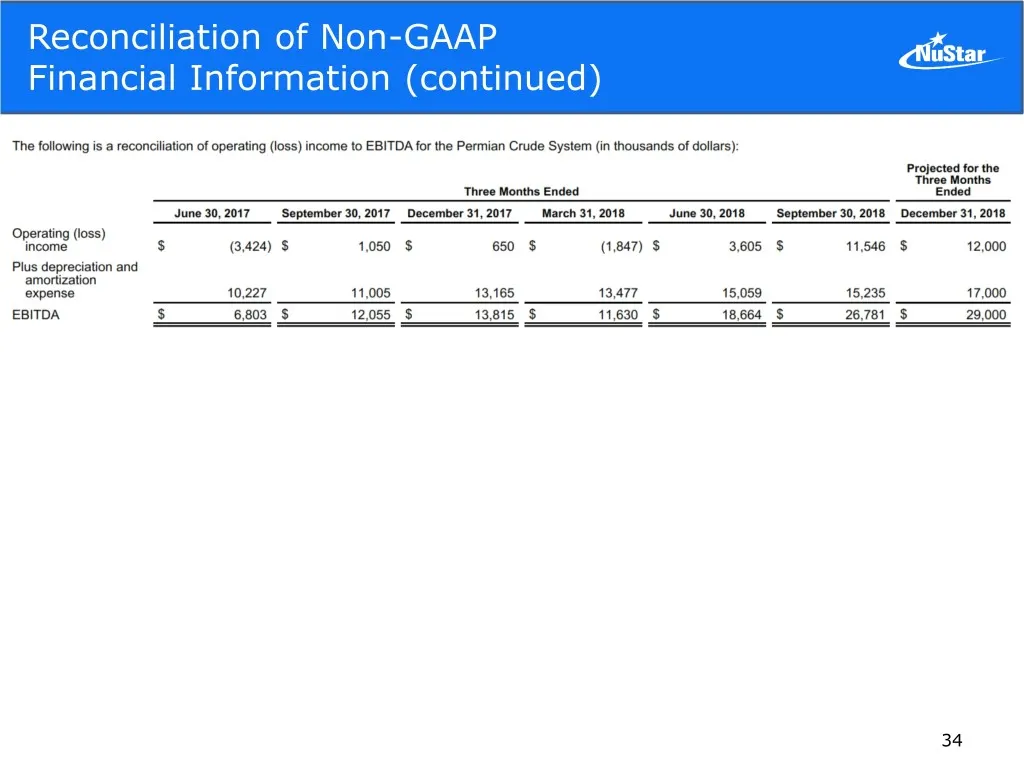
Slide 34: Reconciliation of Non-GAAP Financial Information (continued)
Reconciliation of Non-GAAP Financial Information (continued) 34
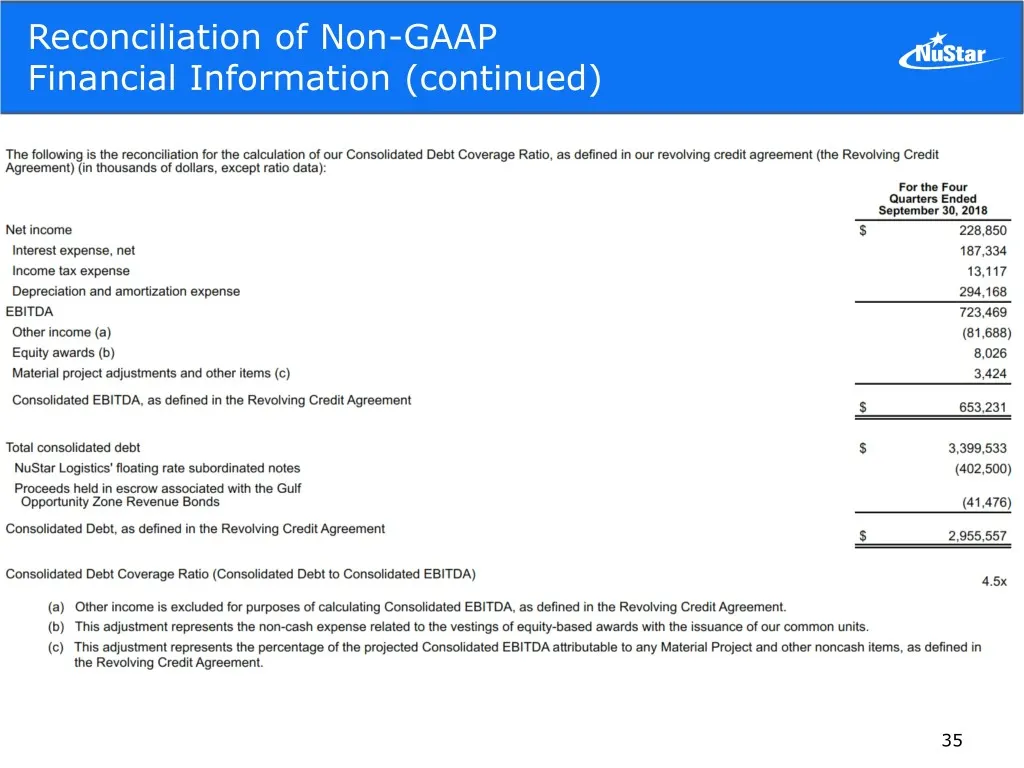
Slide 35: Reconciliation of Non-GAAP Financial Information (continued)
Reconciliation of Non-GAAP Financial Information (continued) 35
Source: SEC EDGAR · 8-K filed Dec 6, 2018
More decks from NuStar Energy LP
 Merger or Acquisition (January 2024)14 slides · Jan 22, 2024
 Investor Presentation (December 2023)35 slides · Dec 5, 2023
 Raymond James Virtual Energy Supply Chain Conference 2023; Pickering Energy Partners TE&MF36 slides · Sep 19, 2023
 Barclays CEO Energy-Power Conference 202336 slides · Sep 6, 2023
 Citi One-on-One Midstream/Energy Infrastructure Conference 202336 slides · Aug 22, 2023
 8th Annual J.P. Morgan Energy, Power & Renewables Conference 202336 slides · Jun 21, 2023