Grenergy Renovables S.A · BME:GRE
Grenergy Renovables — Investor Presentation (September 2022)
35 slides from Grenergy Renovables's investor presentation, September 2022
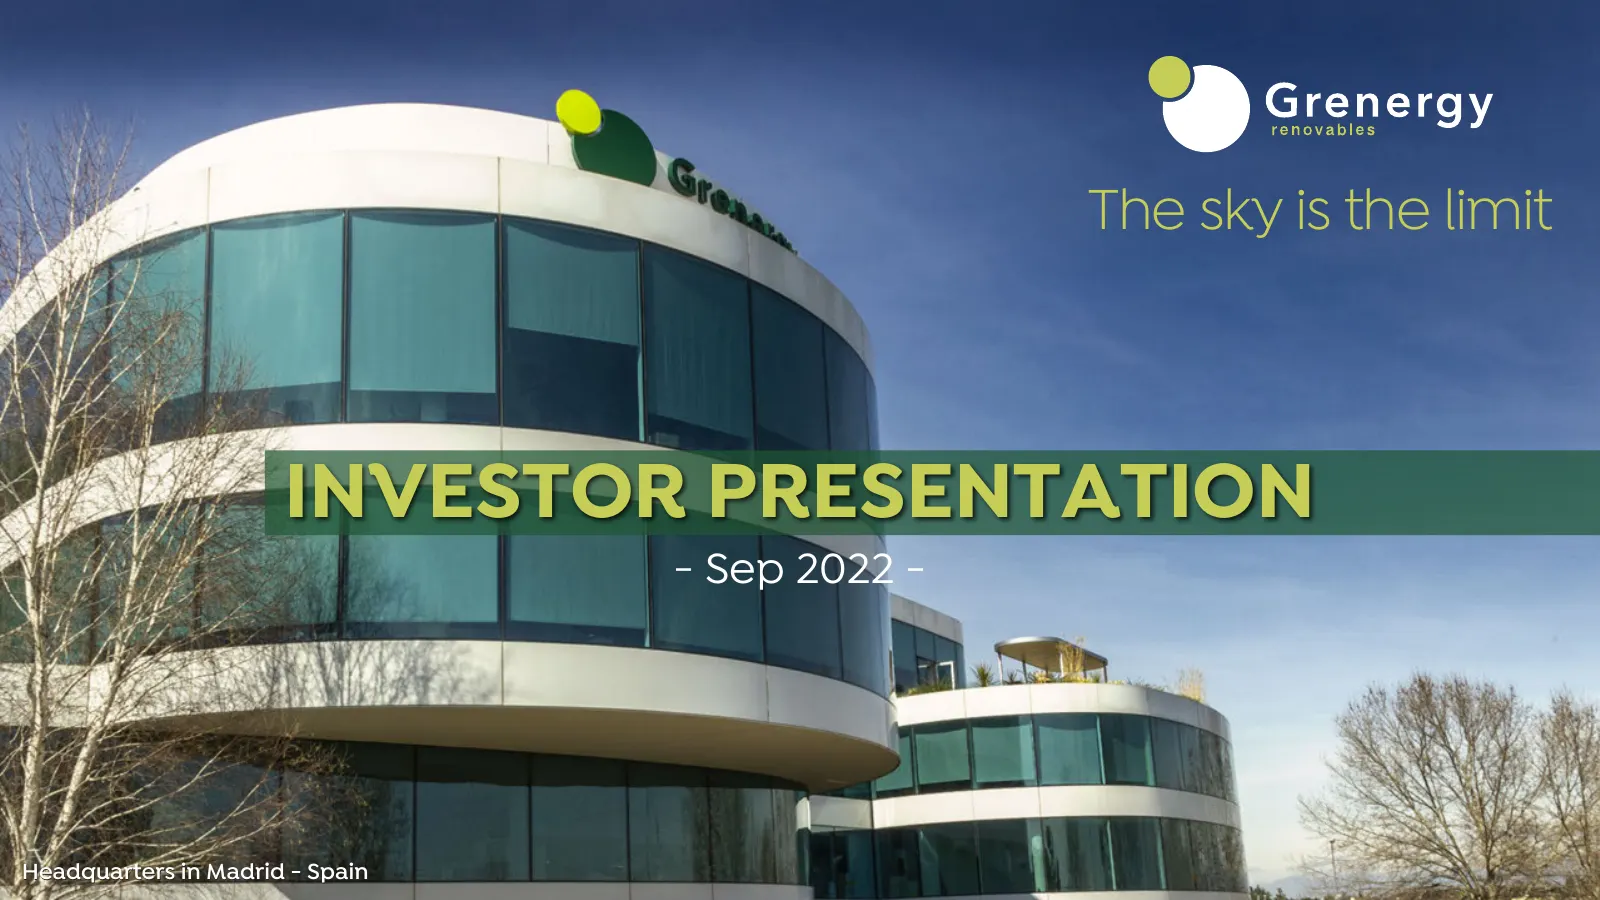
Slide 1: Investor Presentation Sep 2022
The sky is the limit INVESTOR PRESENTATION - Sep 2022 - Headquarters in Madrid - Spain
Slide 2: Disclaimer
DISCLAIMER By attending this presentation and/or by accepting this presentation you will be cial condition or results of operations by the Company and should not be relied upon taken to have represented, warranted and undertaken that you have read and when making an investment decision. Certain finan
Slide 3: Agenda
1 EQUITY STORY & KEY FIGURES 2 PLATFORM & PIPELINE 3 OPERATIONAL INFORMATION 4 STRONG GOVERNANCE STRUCTURE WITH FOCUS ON ESG 03
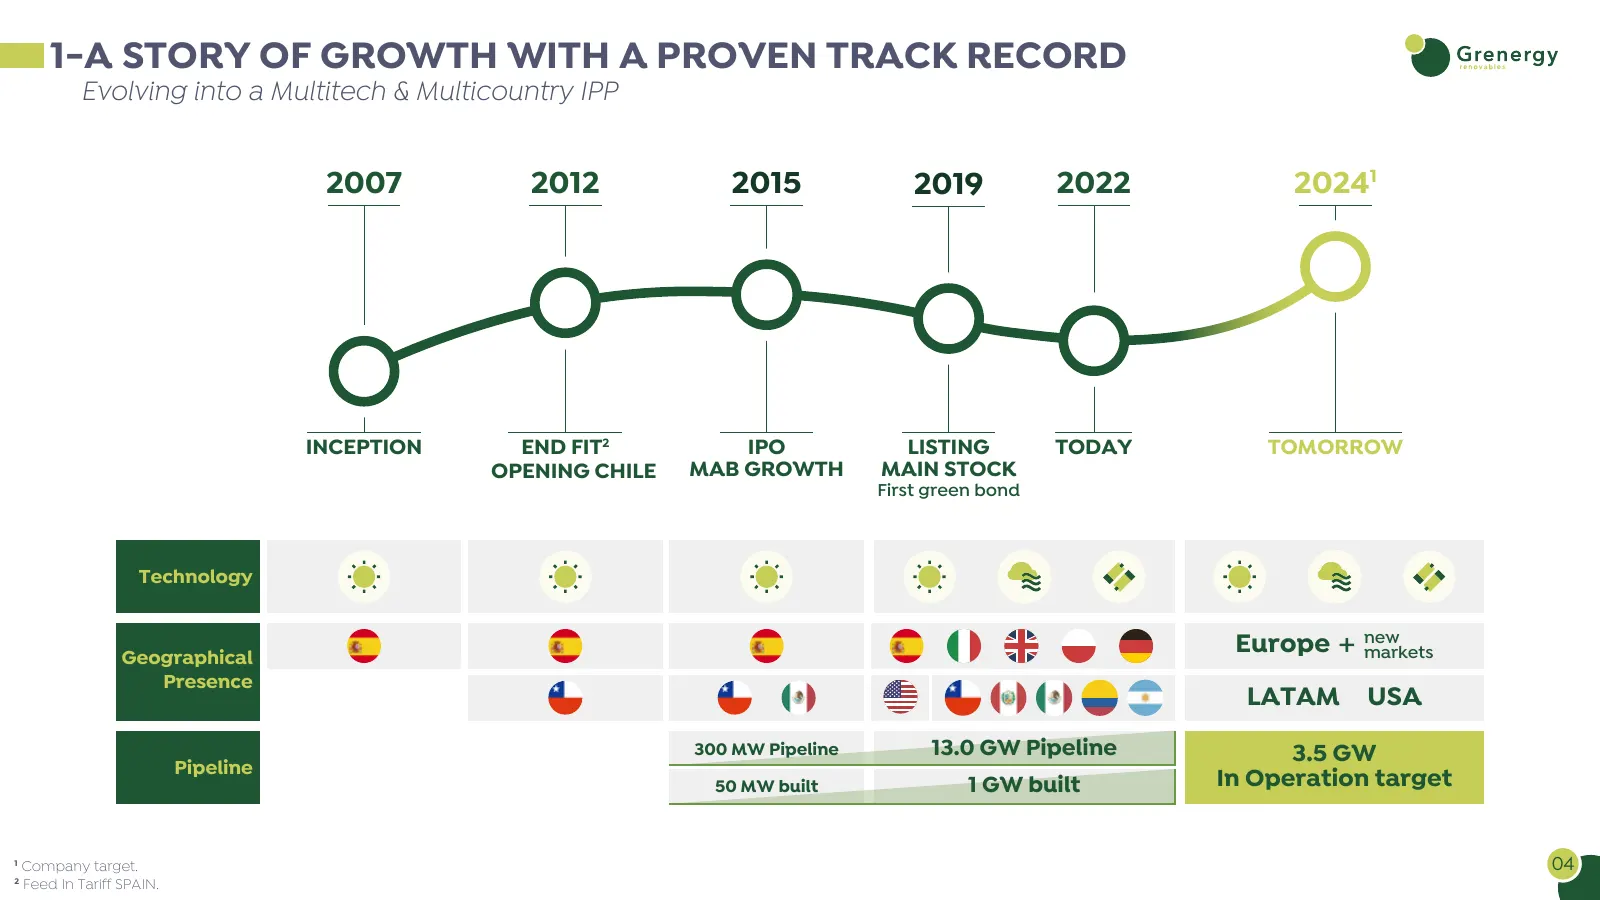
Slide 4: A Story of Growth with a Proven Track Record
1-A STORY OF GROWTH WITH A PROVEN TRACK RECORD Evolving into a Multitech & Multicountry IPP 2007 2012 2015 2019 2022 20241 INCEPTION END FIT2 IPO LISTING TODAY TOMORROW OPENING CHILE MAB GROWTH MAIN STOCK First green bond Technology Geographical Europe + new markets Presence LATAM USA 300 MW Pipelin
Slide 5: Grenergy in a Nutshell
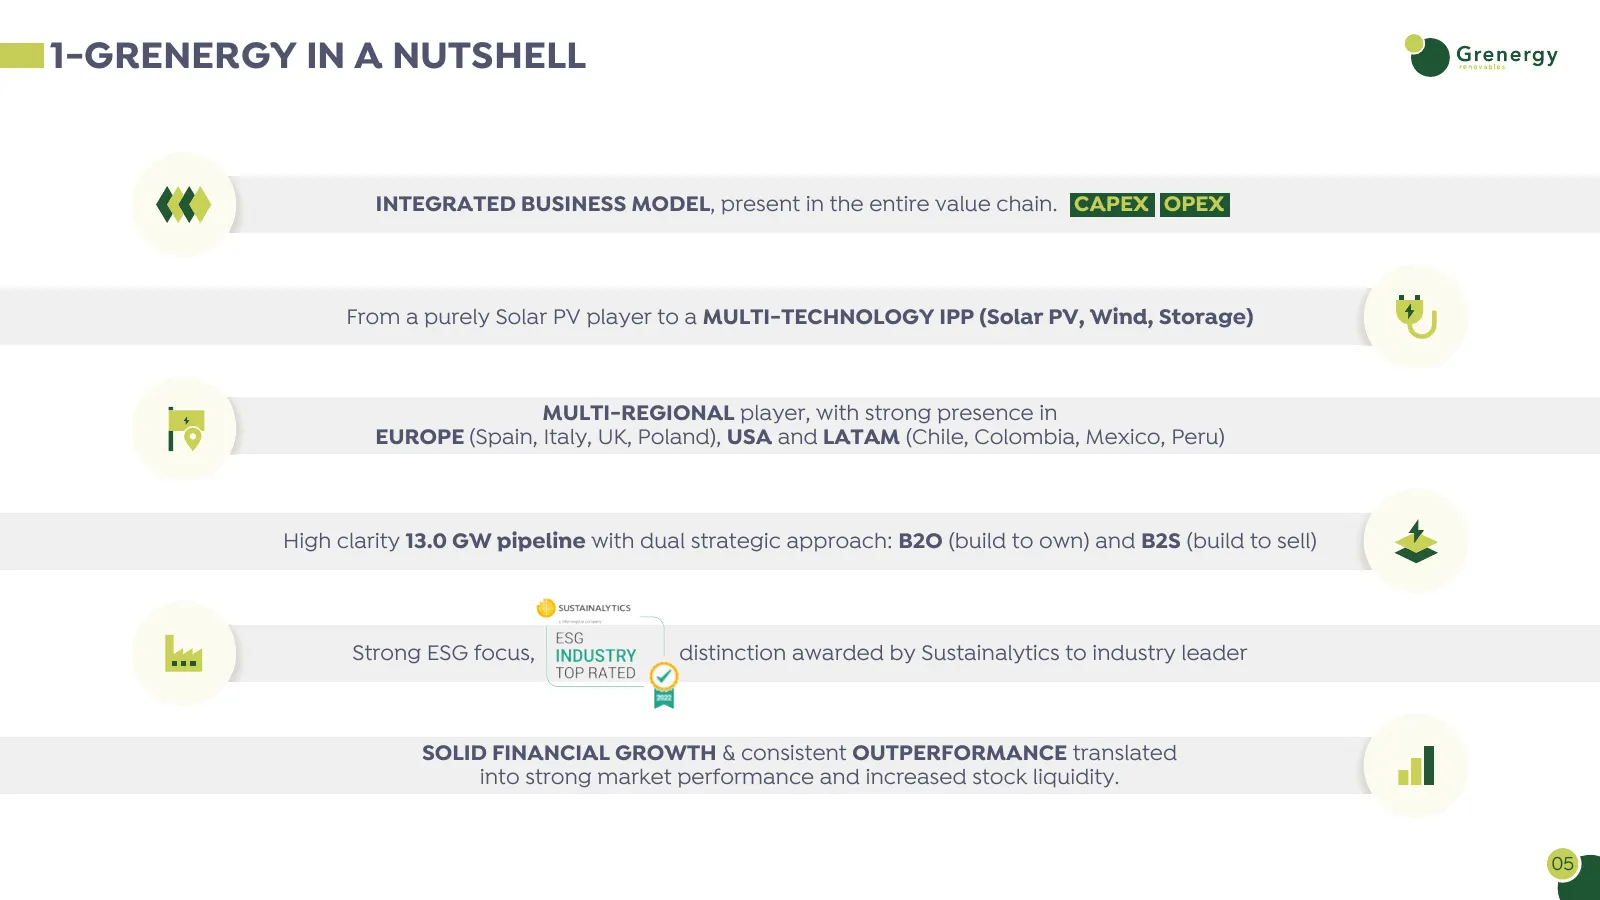
1-GRENERGY IN A NUTSHELL INTEGRATED BUSINESS MODEL, present in the entire value chain. CAPEX OPEX From a purely Solar PV player to a MULTI-TECHNOLOGY IPP (Solar PV, Wind, Storage) MULTI-REGIONAL player, with strong presence in EUROPE (Spain, Italy, UK, Poland), USA and LATAM (Chile, Colombia, Mexico
Slide 6: Integrated Business Model
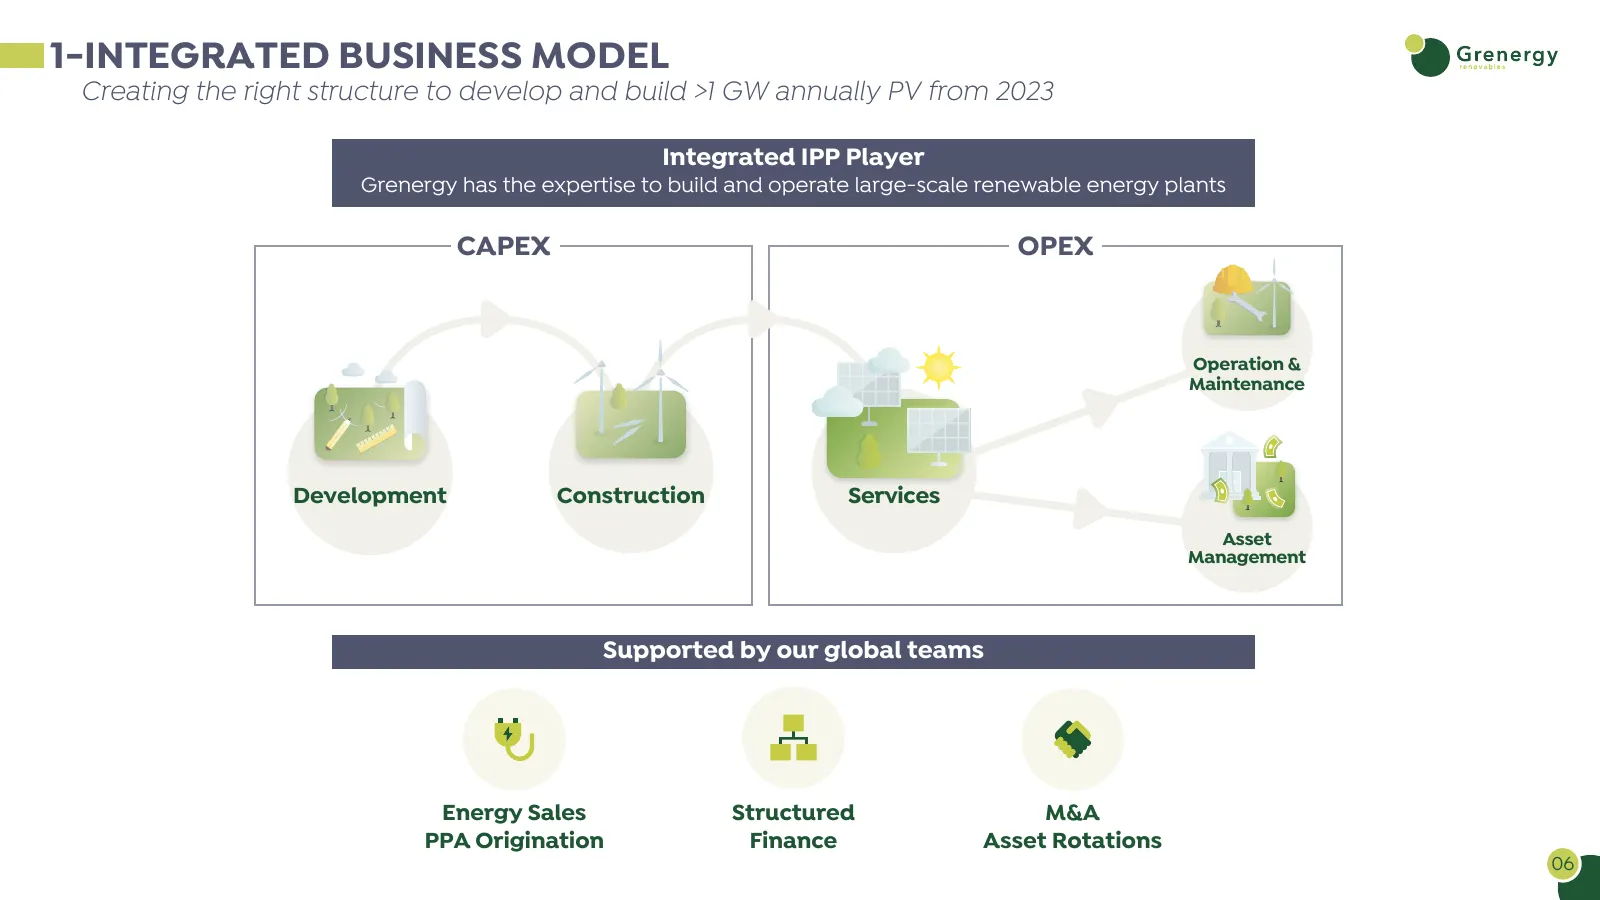
1-INTEGRATED BUSINESS MODEL Creating the right structure to develop and build >1 GW annually PV from 2023 Integrated IPP Player Grenergy has the expertise to build and operate large-scale renewable energy plants CAPEX OPEX Operation & Maintenance Development Construction Services Asset Management Su
Slide 7: Key Figures 1Q22
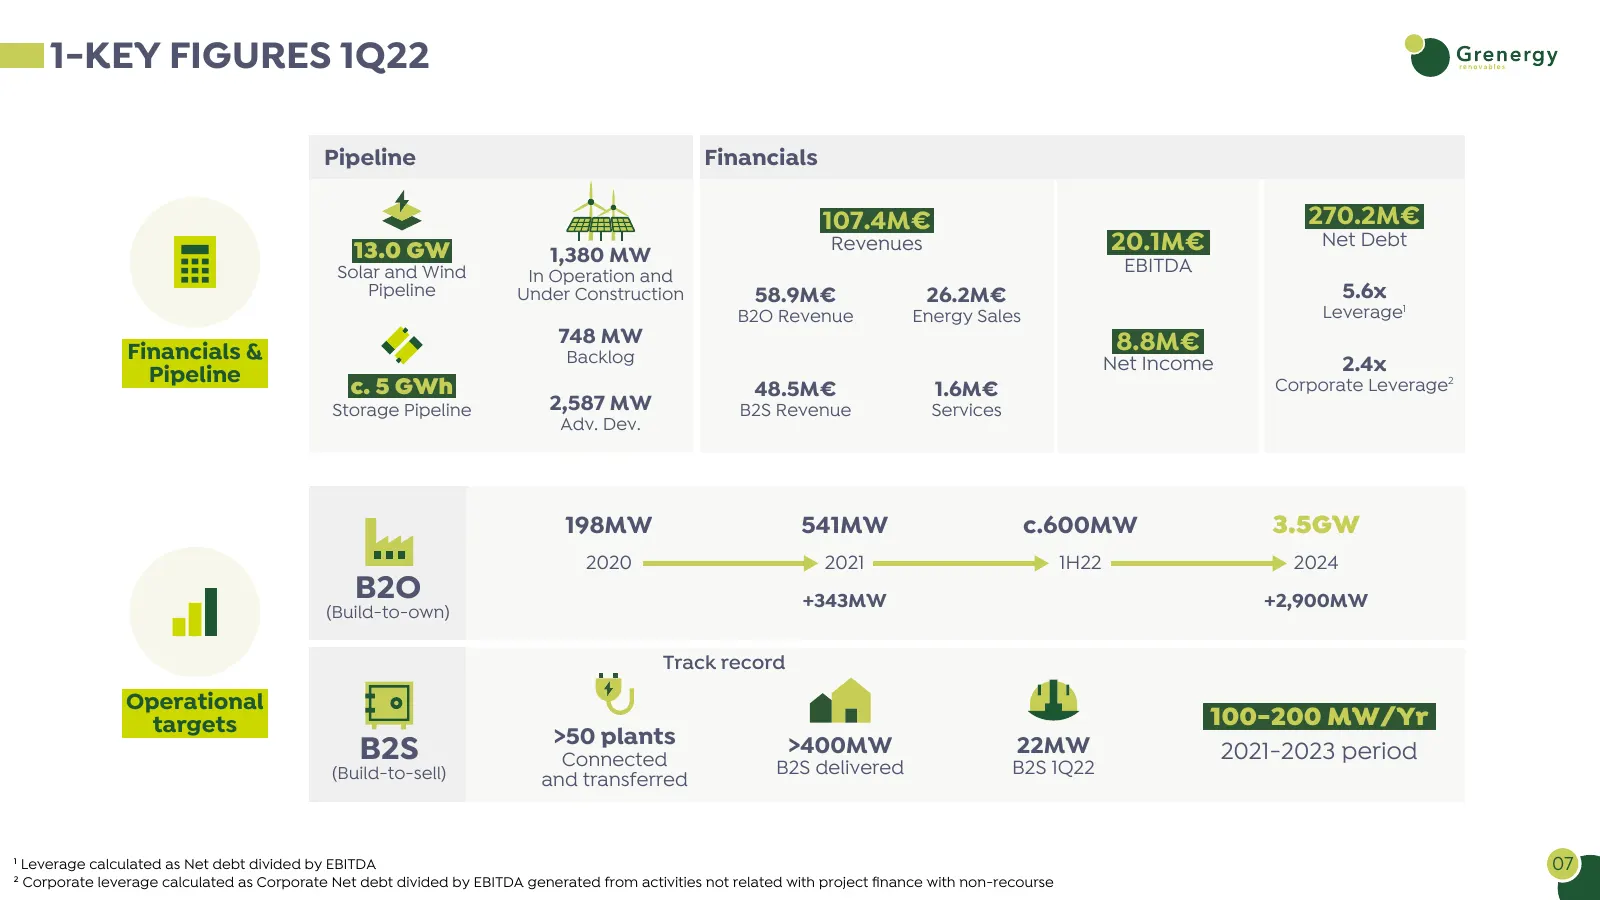
1-KEY FIGURES 1Q22 Pipeline Financials 107.4M€ 270.2M€ 13.0 GW 1,380 MW Revenues 20.1M€ Net Debt Solar and Wind In Operation and EBITDA Pipeline Under Construction 58.9M€ 26.2M€ 5.6x B2O Revenue Energy Sales Leverage1 748 MW 8.8M€ Financials & Backlog Net Income 2.4x Pipeline c. 5 GWh Corporate Leve
Slide 8: Agenda
1 EQUITY STORY & KEY FIGURES 2 PLATFORM & PIPELINE 3 OPERATIONAL INFORMATION 4 STRONG GOVERNANCE STRUCTURE WITH FOCUS ON ESG 08
Slide 9: Company Platforms Overview
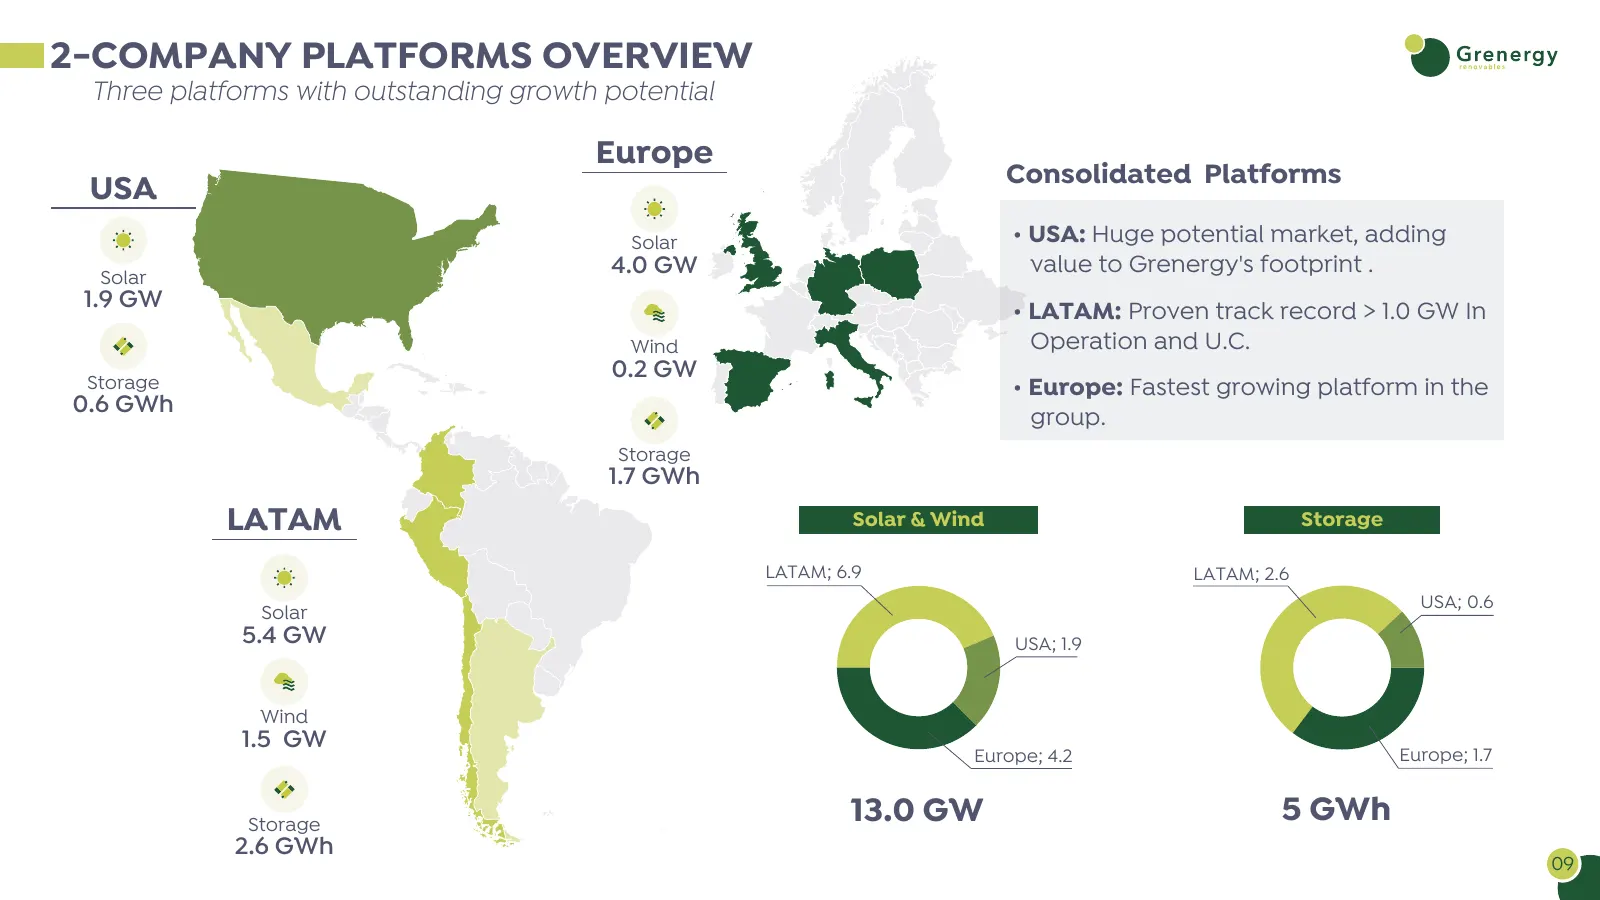
2-COMPANY PLATFORMS OVERVIEW Three platforms with outstanding growth potential Europe Consolidated Platforms USA Solar • USA: Huge potential market, adding Solar 4.0 GW value to Grenergy's footprint . 1.9 GW • LATAM: Proven track record > 1.0 GW In Wind Operation and U.C. Storage 0.2 GW • Europe: Fa
Slide 10: North America Platform
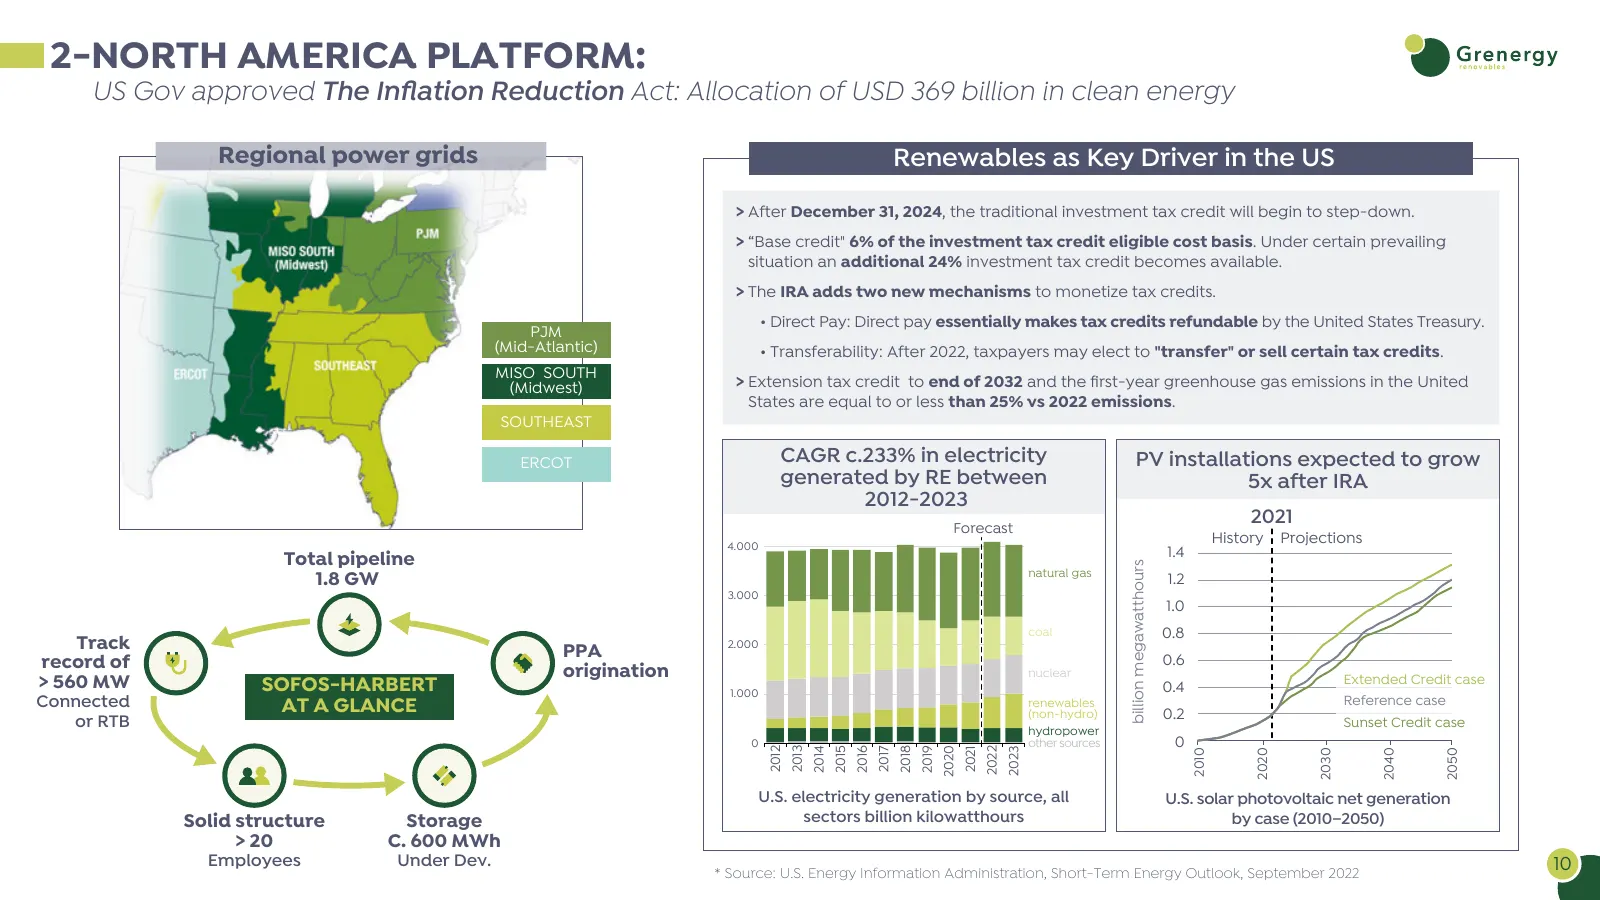
2-NORTH AMERICA PLATFORM: US Gov approved The Inflation Reduction Act: Allocation of USD 369 billion in clean energy Regional power grids Renewables as Key Driver in the US > After December 31, 2024, the traditional investment tax credit will begin to step-down. > “Base credit" 6% of the investment
Slide 11: An Unprecedented Opportunity
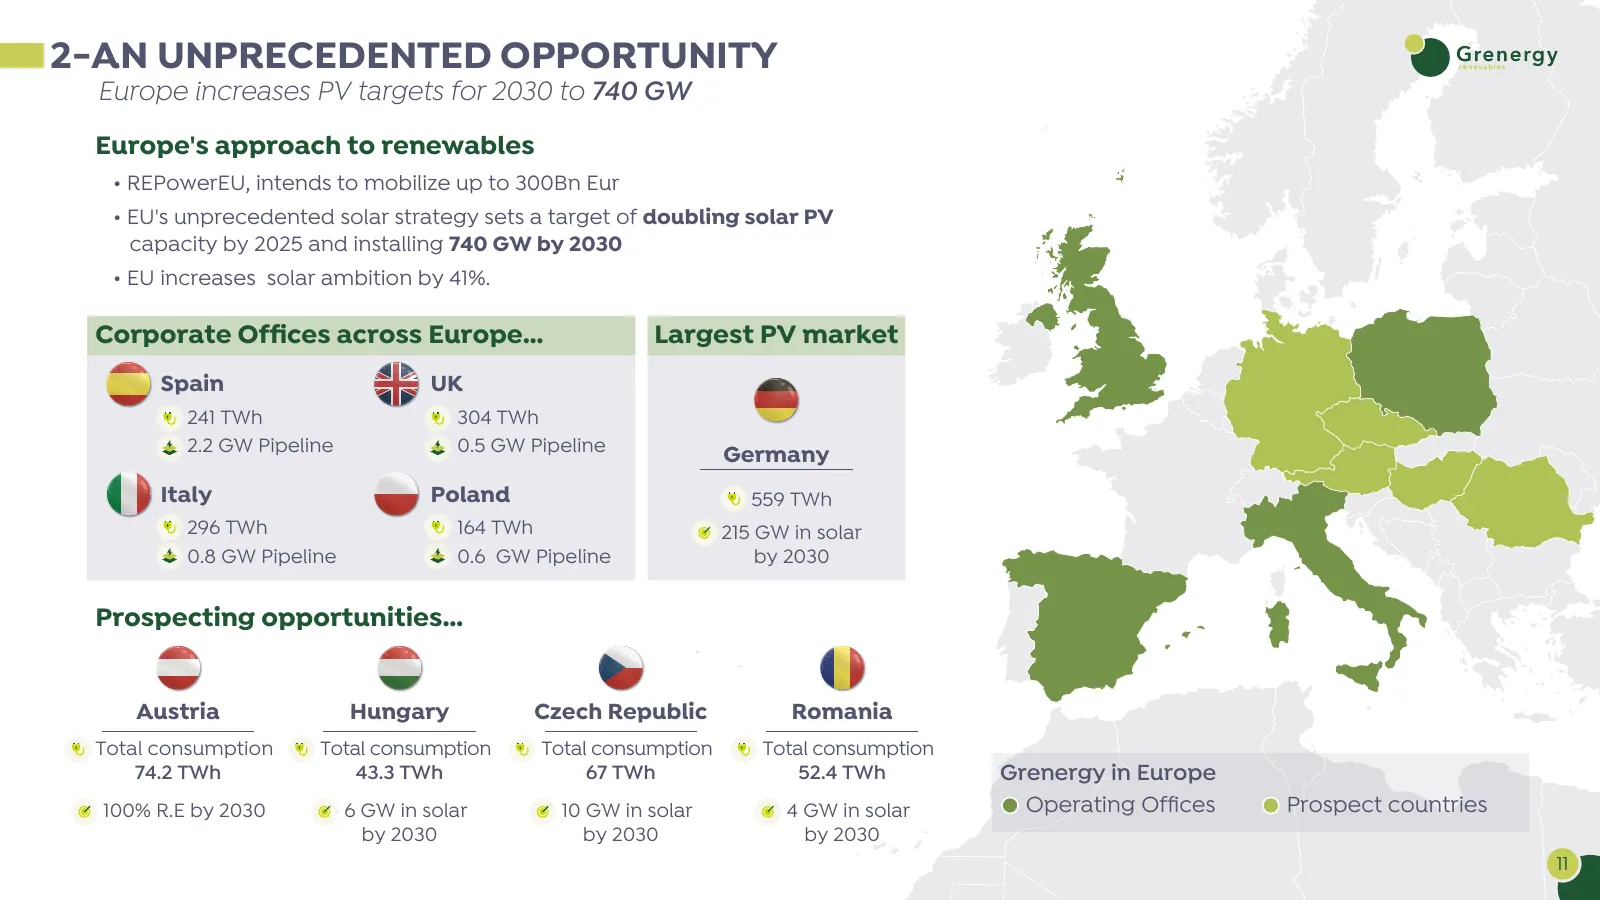
2-AN UNPRECEDENTED OPPORTUNITY Europe increases PV targets for 2030 to 740 GW Europe's approach to renewables • REPowerEU, intends to mobilize up to 300Bn Eur • EU's unprecedented solar strategy sets a target of doubling solar PV capacity by 2025 and installing 740 GW by 2030 • EU increases solar am
Slide 12: Pipeline Update: Project Portfolio
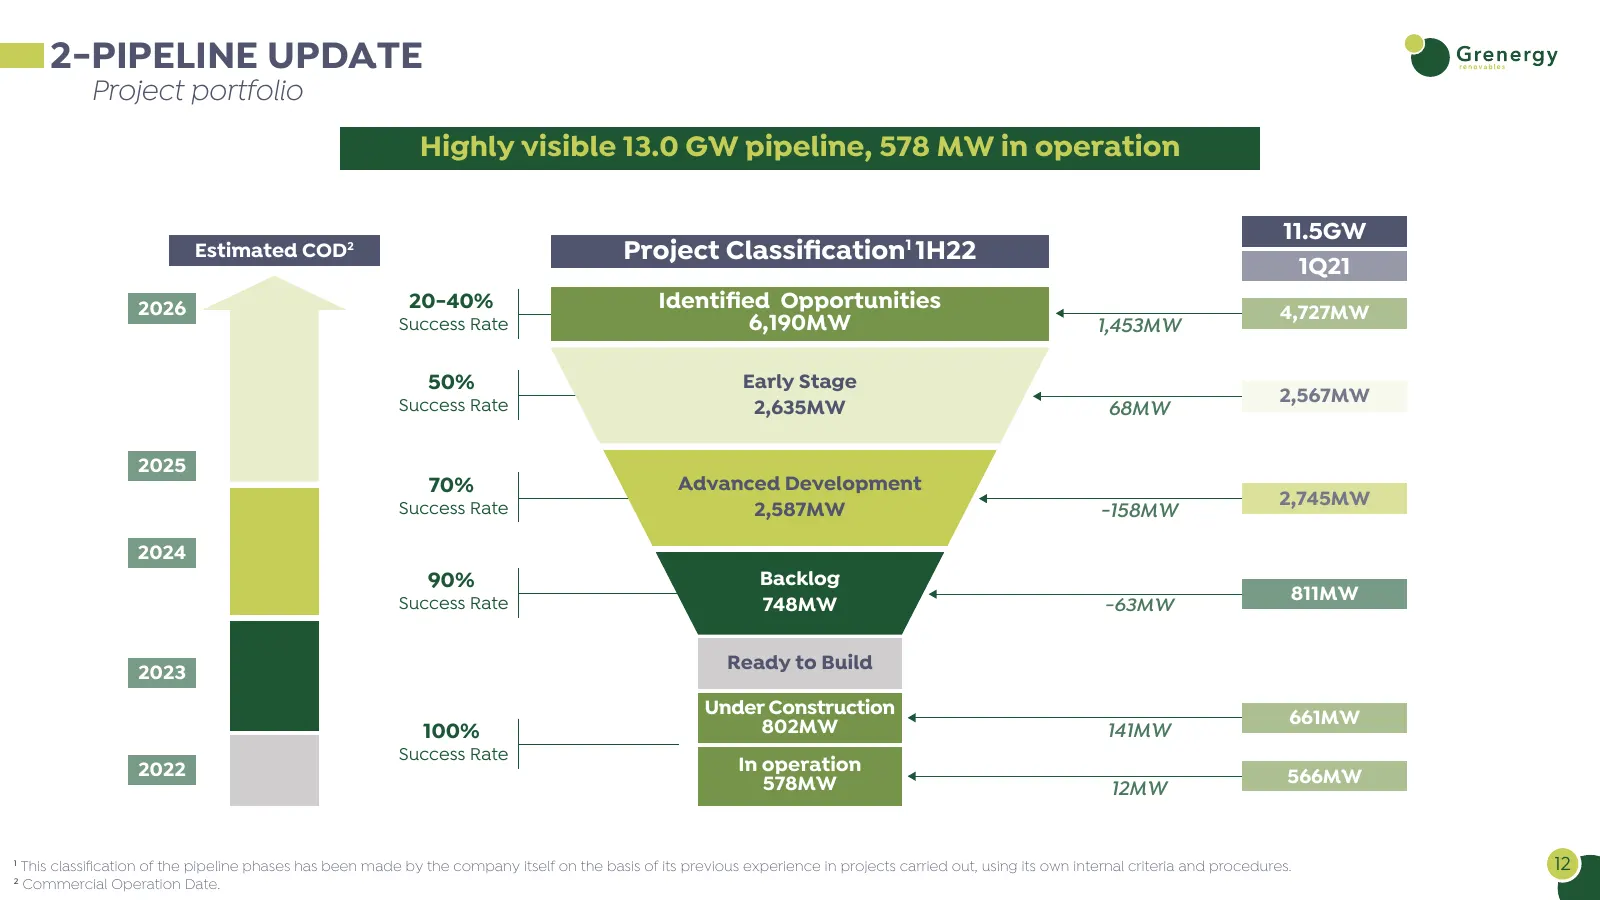
2-PIPELINE UPDATE Project portfolio Highly visible 13.0 GW pipeline, 578 MW in operation 11.5GW Estimated COD2 Project Classification1 1H22 1Q21 2026 20-40% Identified Opportunities 4,727MW Success Rate 6,190MW 1,453MW 50% Early Stage 2,567MW Success Rate 2,635MW 68MW 2025 70% Advanced Development 2,7
Slide 13: Pipeline Update: Total Pipeline 13.0 GW
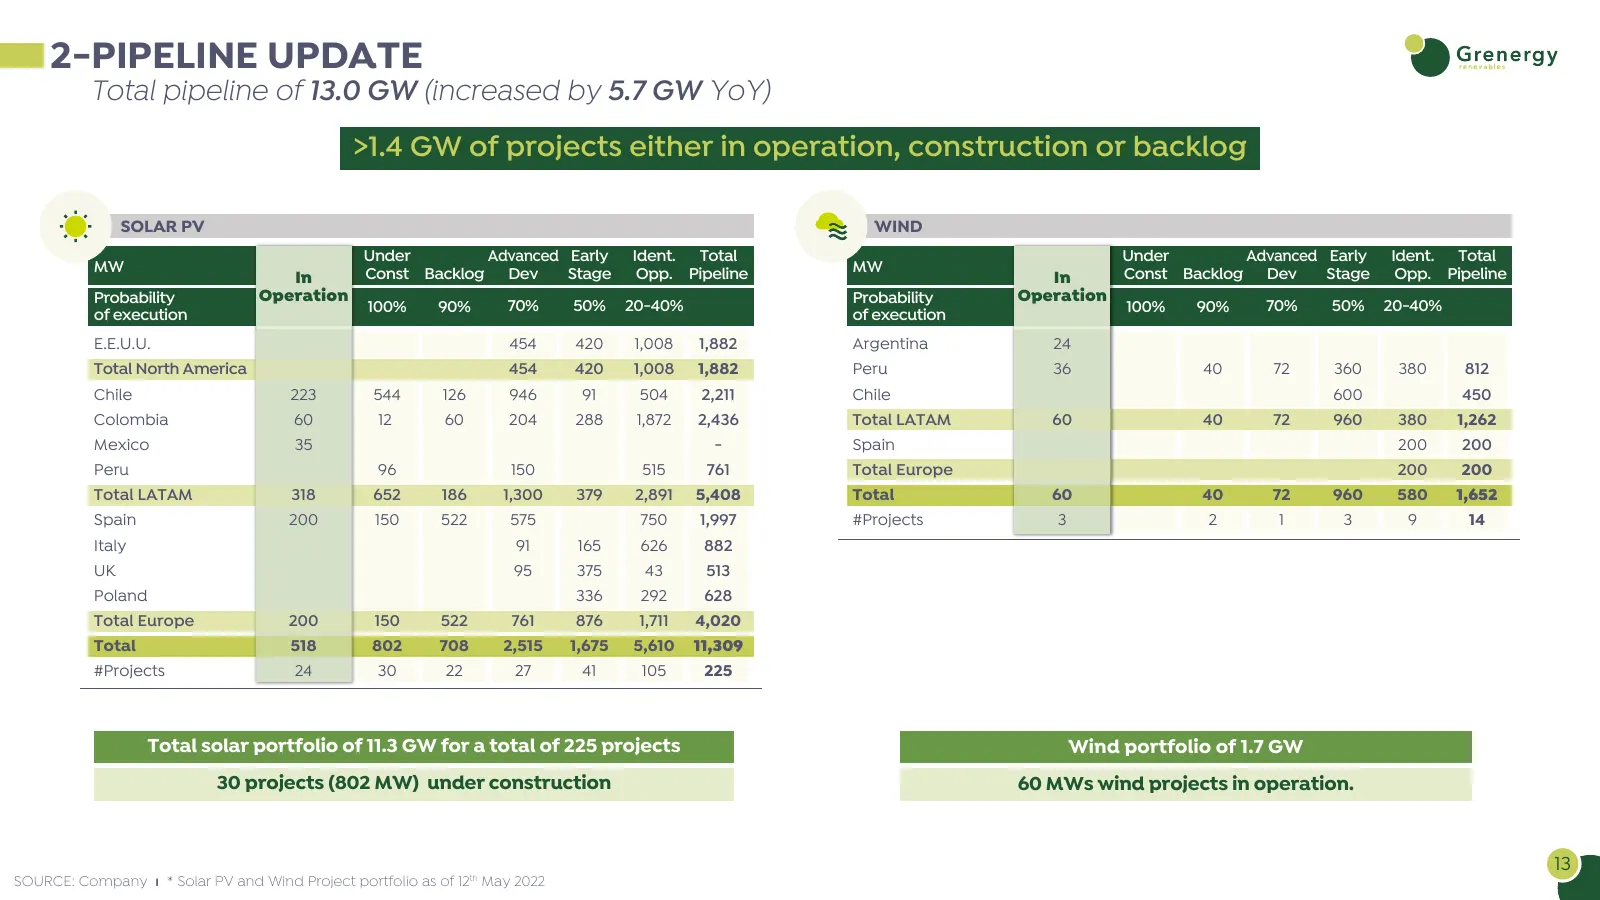
2-PIPELINE UPDATE Total pipeline of 13.0 GW (increased by 5.7 GW YoY) >1.4 GW of projects either in operation, construction or backlog SOLAR PV WIND Under Advanced Early Ident. Total Under Advanced Early Ident. Total MW Const Backlog Dev Stage Opp. Pipeline MW Const Backlog Dev Stage Opp. Pipeline I
Slide 14: Energy Storage: Company's Pipeline
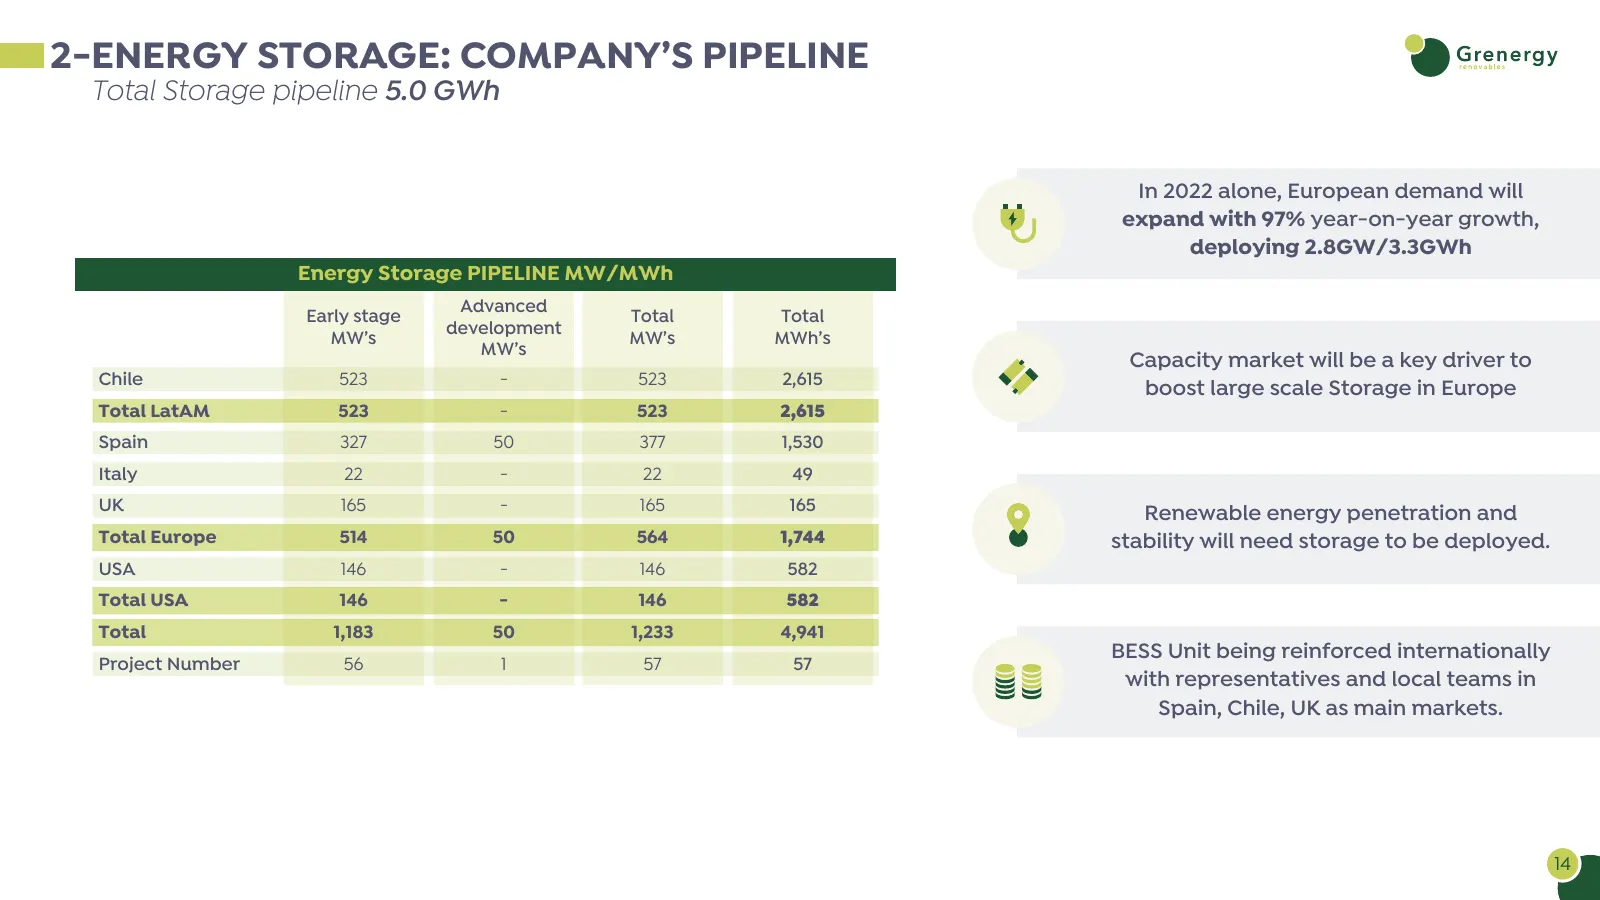
2-ENERGY STORAGE: COMPANY’S PIPELINE Total Storage pipeline 5.0 GWh In 2022 alone, European demand will expand with 97% year-on-year growth, deploying 2.8GW/3.3GWh Energy Storage PIPELINE MW/MWh Advanced Early stage Total Total development MW’s MW’s MWh’s MW’s Capacity market will be a key driver to
Slide 15: Projects in Operation, Under Construction & Backlog
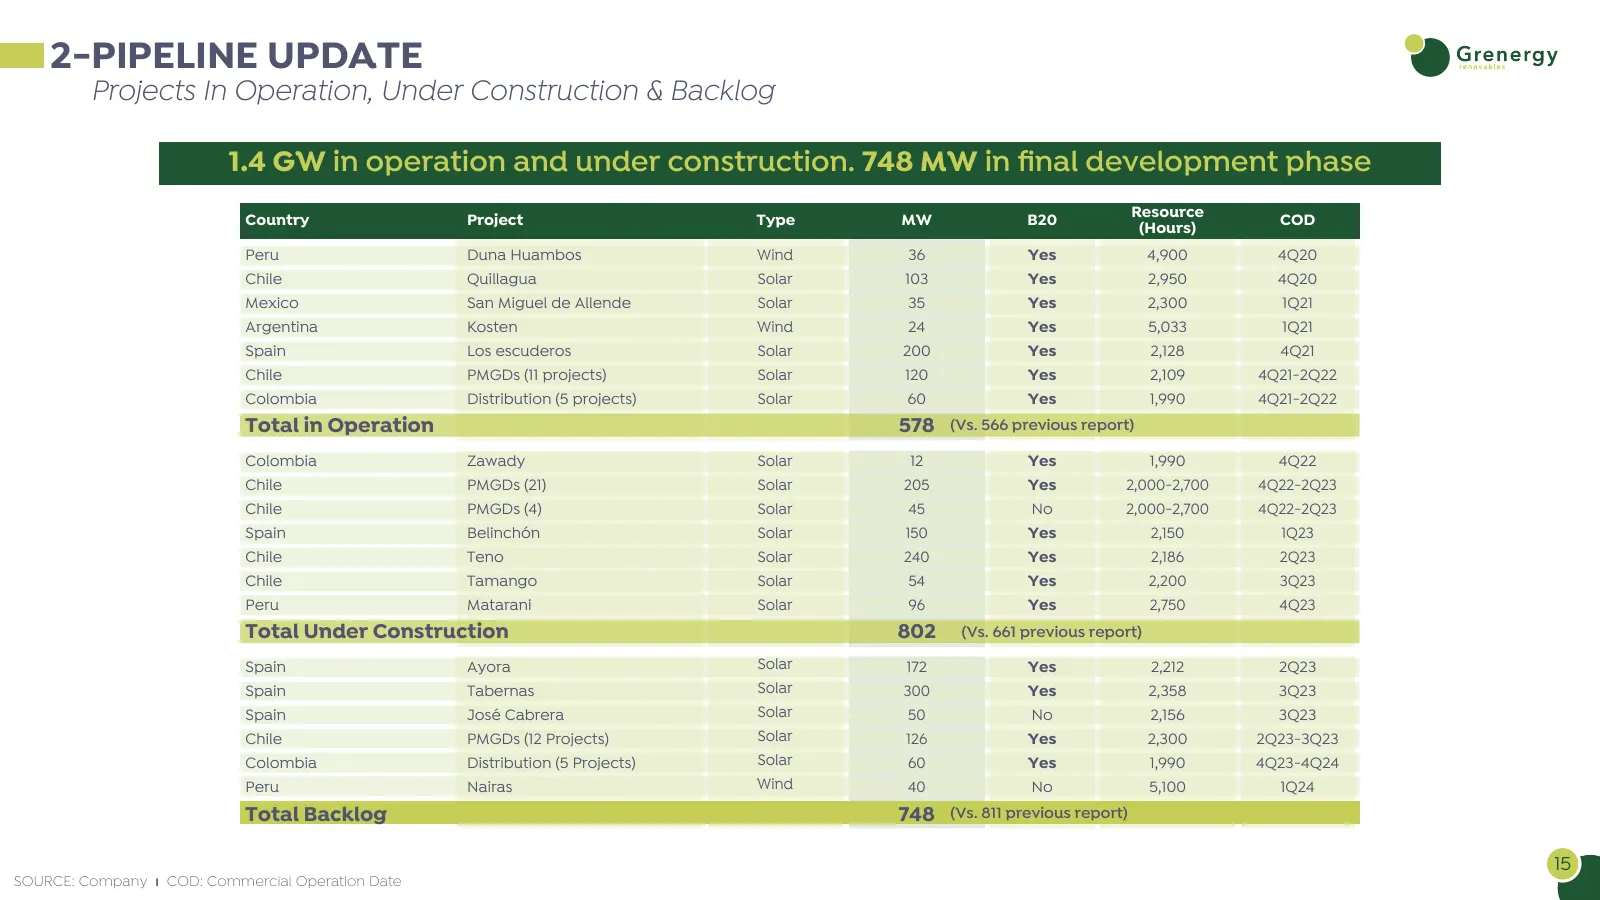
2-PIPELINE UPDATE Projects In Operation, Under Construction & Backlog 1.4 GW in operation and under construction. 748 MW in final development phase Country Project Type MW B20 Resource COD (Hours) Peru Duna Huambos Wind 36 Yes 4,900 4Q20 Chile Quillagua Solar 103 Yes 2,950 4Q20 Mexico San Miguel de
Slide 16: Projects in Advanced Development
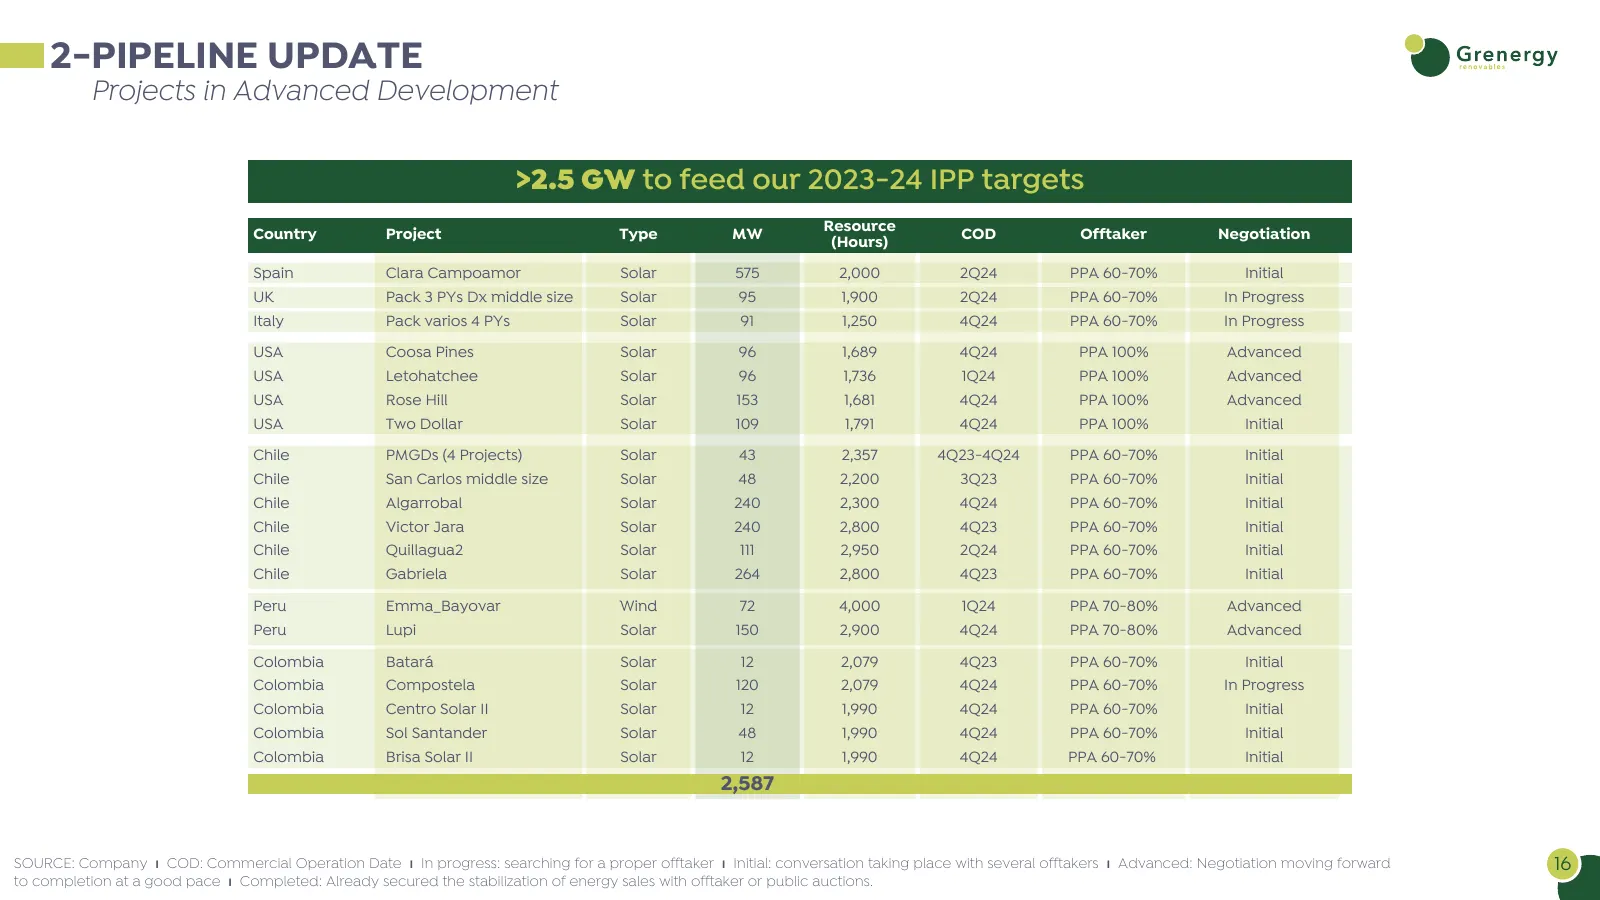
2-PIPELINE UPDATE Projects in Advanced Development >2.5 GW to feed our 2023-24 IPP targets Resource Country Project Type MW COD Offtaker Negotiation (Hours) Spain Clara Campoamor Solar 575 2,000 2Q24 PPA 60-70% Initial UK Pack 3 PYs Dx middle size Solar 95 1,900 2Q24 PPA 60-70% In Progress Italy Pac
Slide 17: Agenda
1 EQUITY STORY & KEY FIGURES 2 PLATFORM & PIPELINE 3 OPERATIONAL INFORMATION 4 STRONG GOVERNANCE STRUCTURE WITH FOCUS ON ESG 17
Slide 18: Integrated Business Model - B2O (Build-to-own)
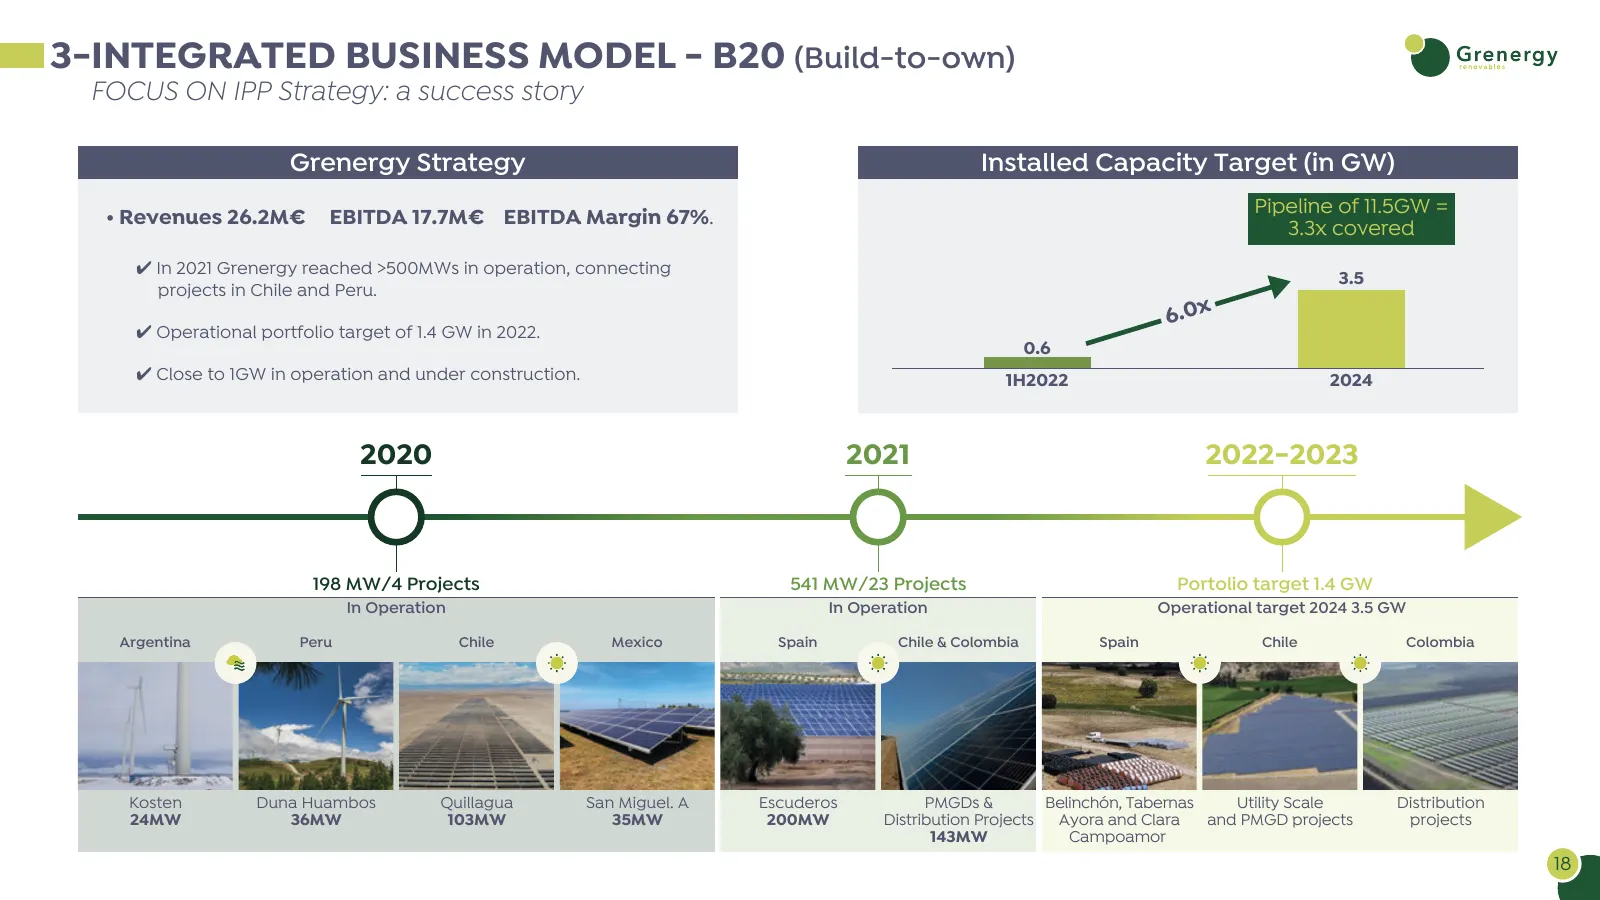
3-INTEGRATED BUSINESS MODEL - B20 (Build-to-own) FOCUS ON IPP Strategy: a success story Grenergy Strategy Installed Capacity Target (in GW) • Revenues 26.2M€ EBITDA 17.7M€ EBITDA Margin 67%. Pipeline of 11.5GW = 3.3x covered ✔ In 2021 Grenergy reached >500MWs in operation, connecting 3.5 projects in
Slide 19: Integrated Business Model - B2S (Build-to-sell)
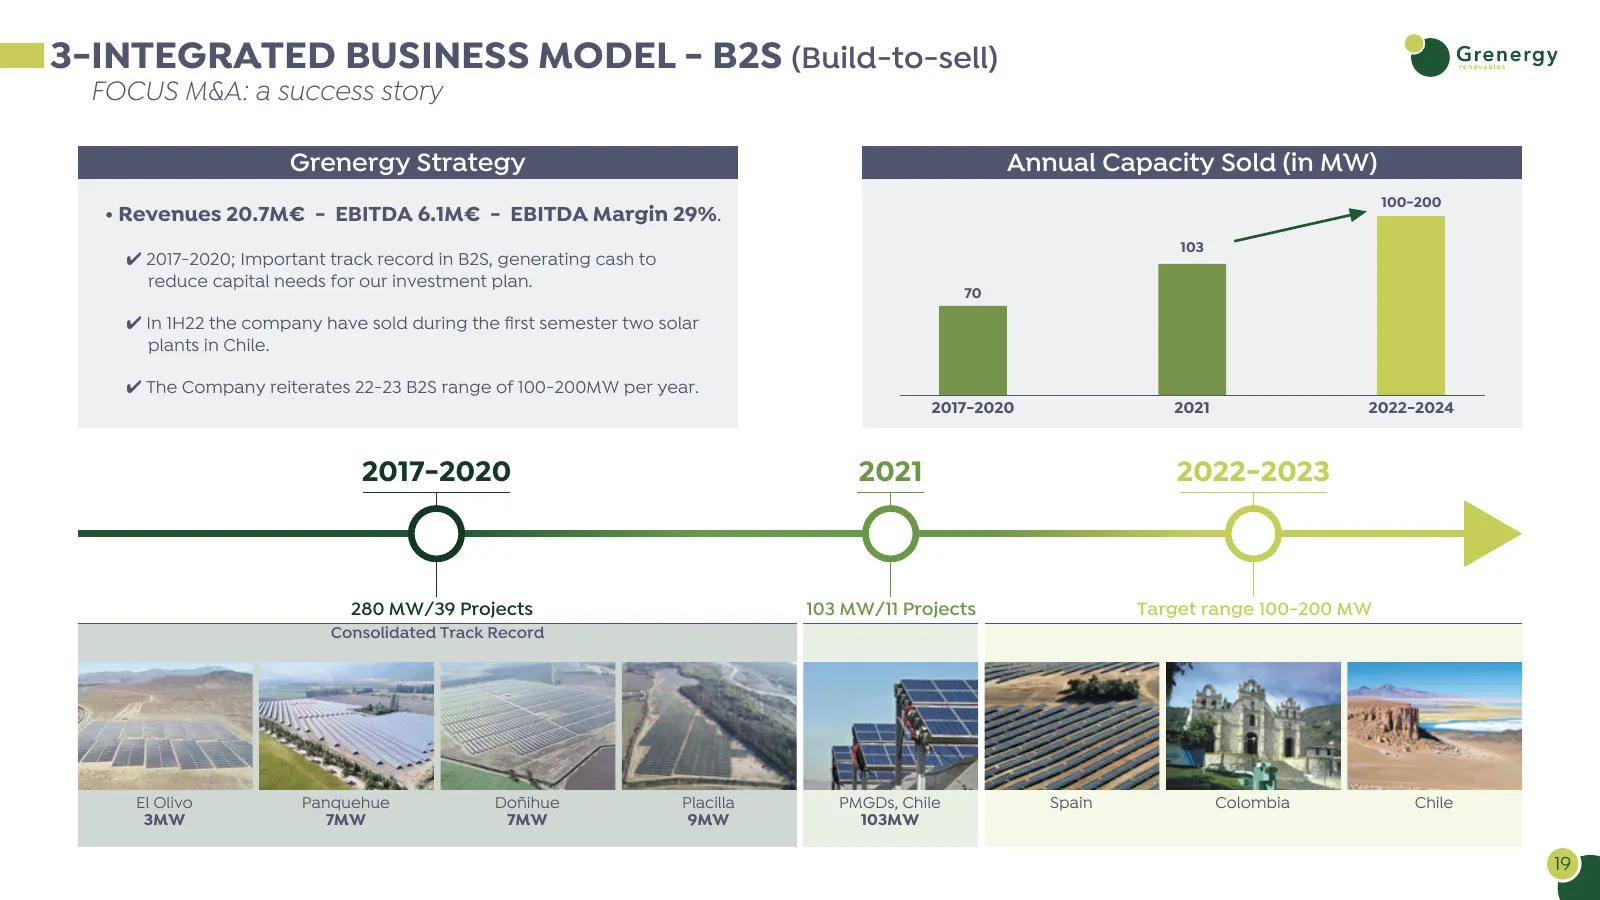
3-INTEGRATED BUSINESS MODEL - B2S (Build-to-sell) FOCUS M&A: a success story Grenergy Strategy Annual Capacity Sold (in MW) 100-200 • Revenues 20.7M€ - EBITDA 6.1M€ - EBITDA Margin 29%. 103 ✔ 2017-2020; Important track record in B2S, generating cash to reduce capital needs for our investment plan. 7
Slide 20: Solar PV CAPEX
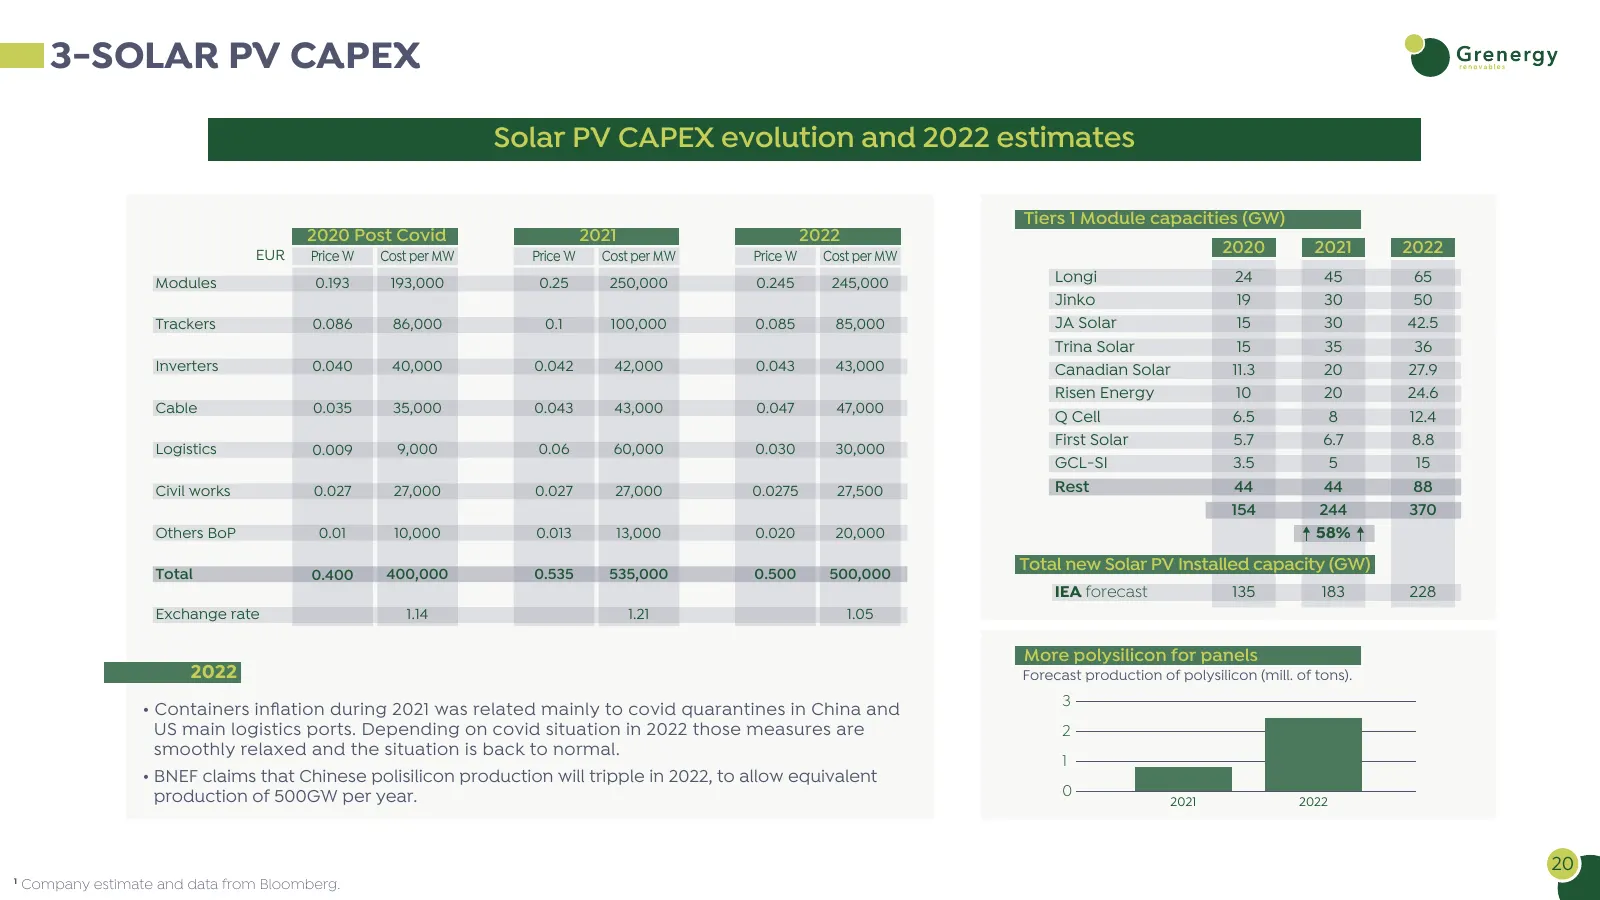
3-SOLAR PV CAPEX Solar PV CAPEX evolution and 2022 estimates Tiers 1 Module capacities (GW) 2020 Post Covid 2021 2022 EUR Price W Cost per MW Price W Cost per MW Price W Cost per MW 2020 2021 2022 Modules 0.193 193,000 0.25 250,000 0.245 245,000 Longi 24 45 65 Jinko 19 30 50 Trackers 0.086 86,000 0.
Slide 21: Strategy and Operational Targets - Storage CAPEX
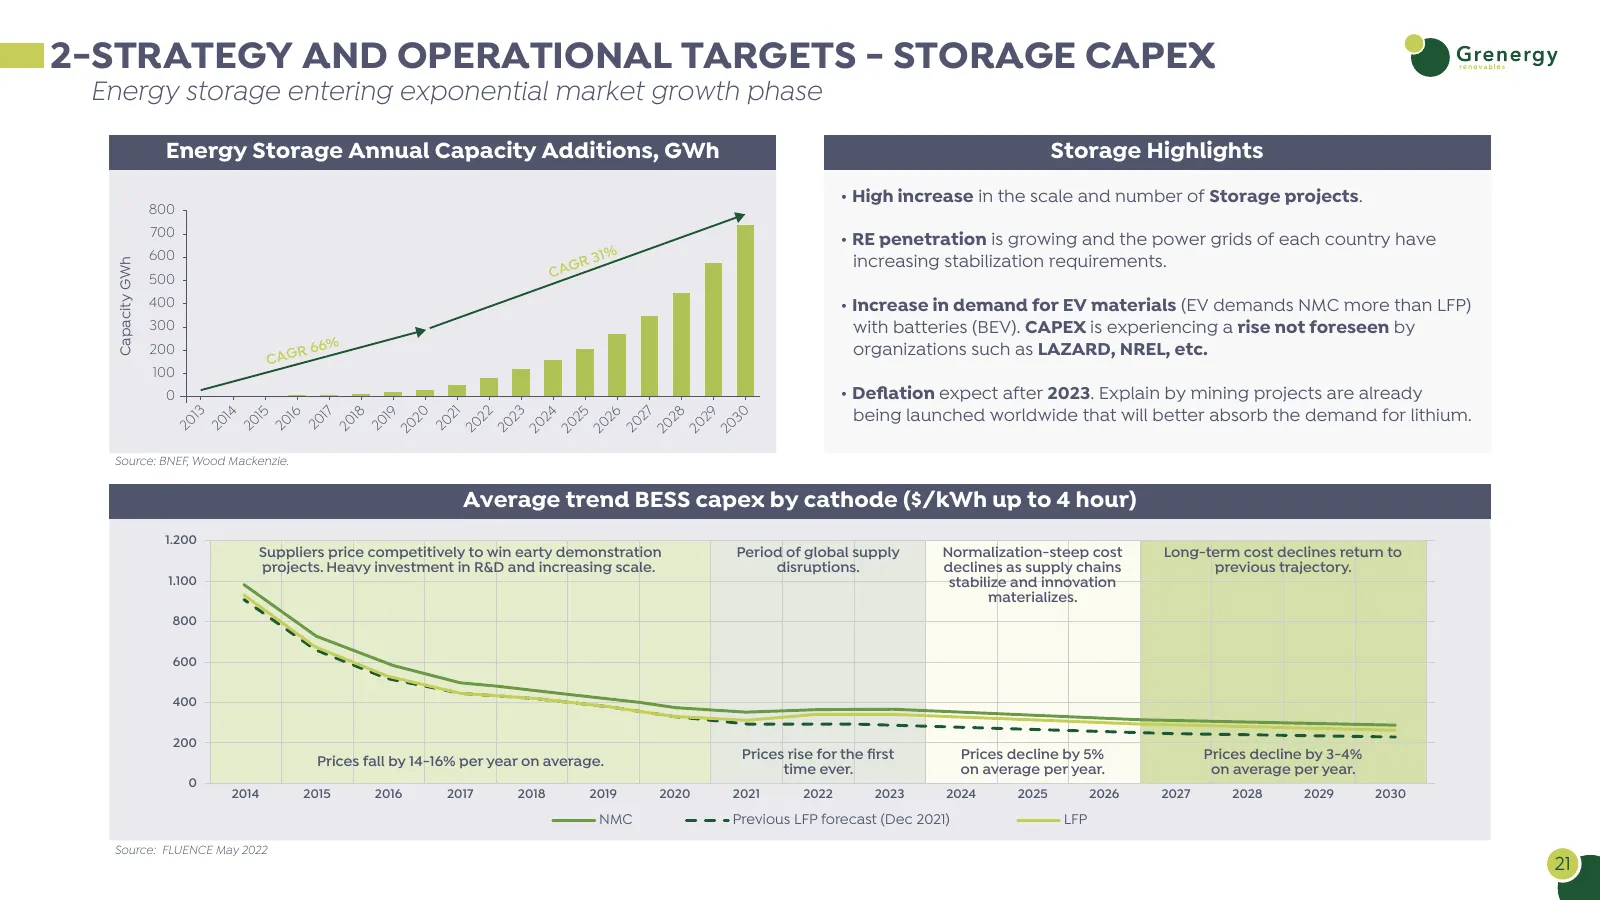
2-STRATEGY AND OPERATIONAL TARGETS - STORAGE CAPEX Energy storage entering exponential market growth phase Energy Storage Annual Capacity Additions, GWh Storage Highlights • High increase in the scale and number of Storage projects. 800 700 • RE penetration is growing and the power grids of each cou
Slide 22: Renewables Revolution - Storage Markets
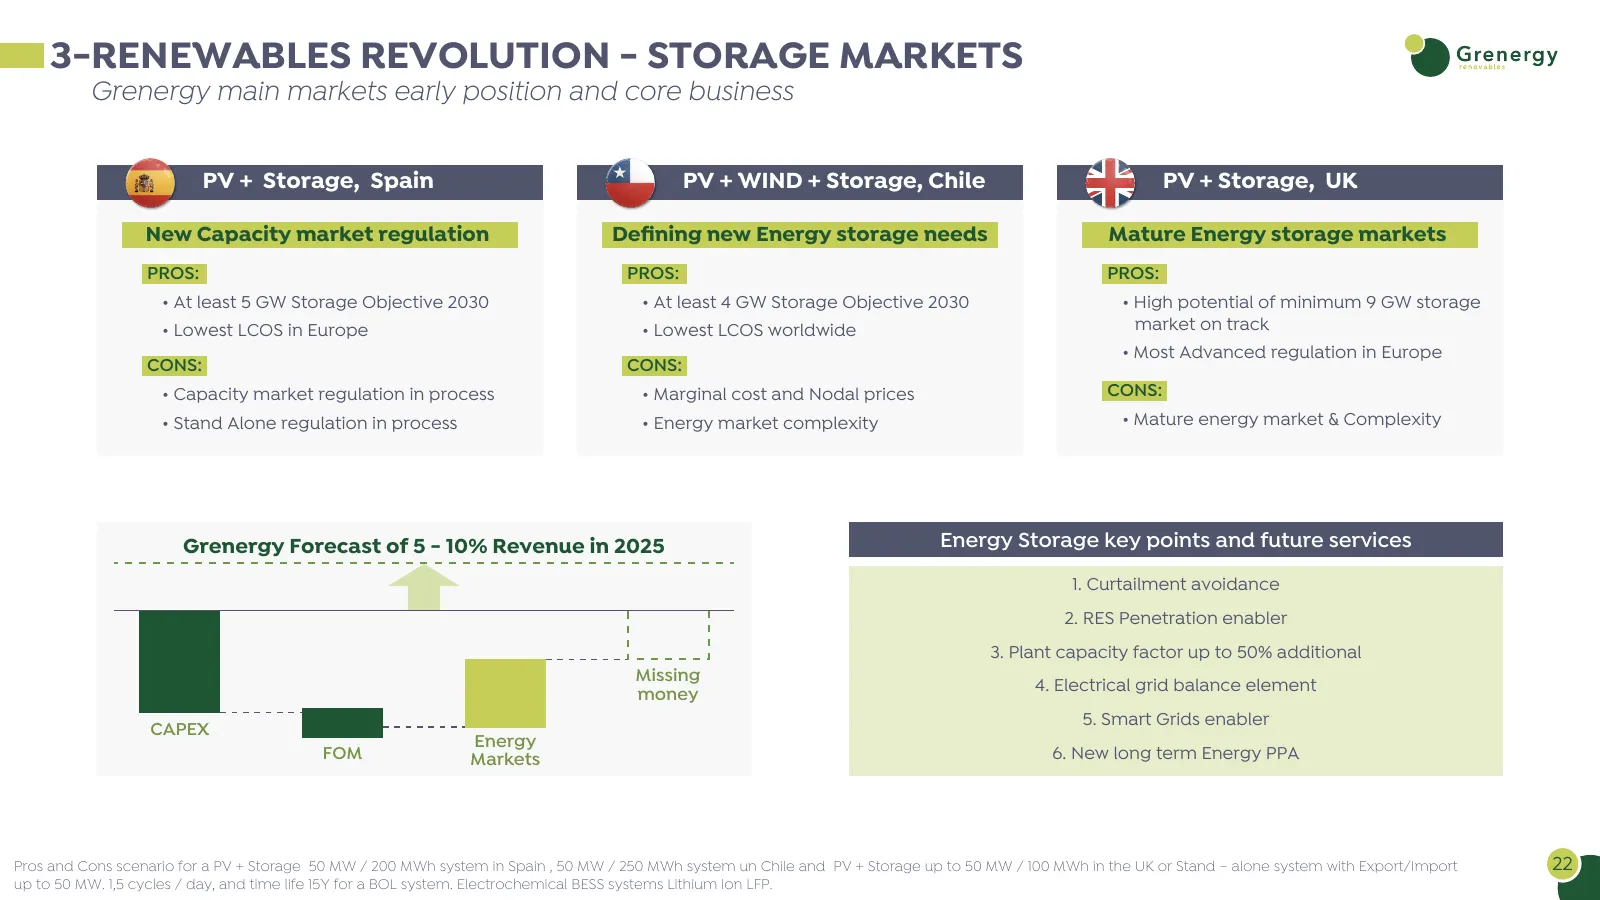
3-RENEWABLES REVOLUTION - STORAGE MARKETS Grenergy main markets early position and core business PV + Storage, Spain PV + WIND + Storage, Chile PV + Storage, UK New Capacity market regulation Defining new Energy storage needs Mature Energy storage markets PROS: PROS: PROS: • At least 5 GW Storage Ob
Slide 23: Capital Markets & Financing
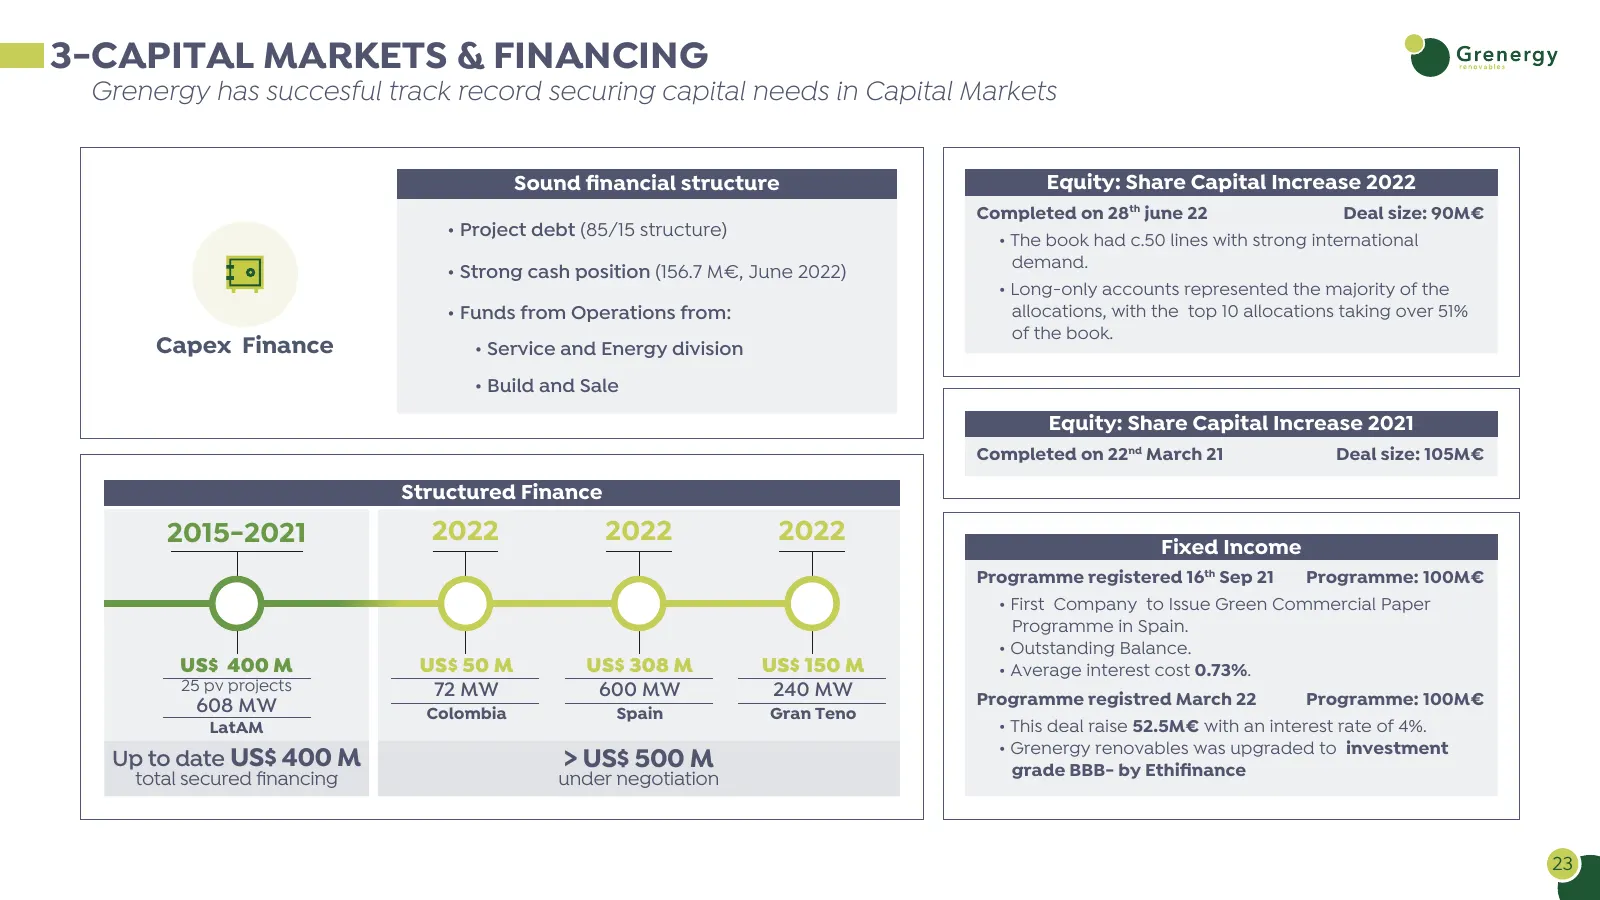
3-CAPITAL MARKETS & FINANCING Grenergy has succesful track record securing capital needs in Capital Markets Sound financial structure Equity: Share Capital Increase 2022 Completed on 28th june 22 Deal size: 90M€ • Project debt (85/15 structure) • The book had c.50 lines with strong international dem
Slide 24: Strategy, Estimates & Operational Targets - B2O
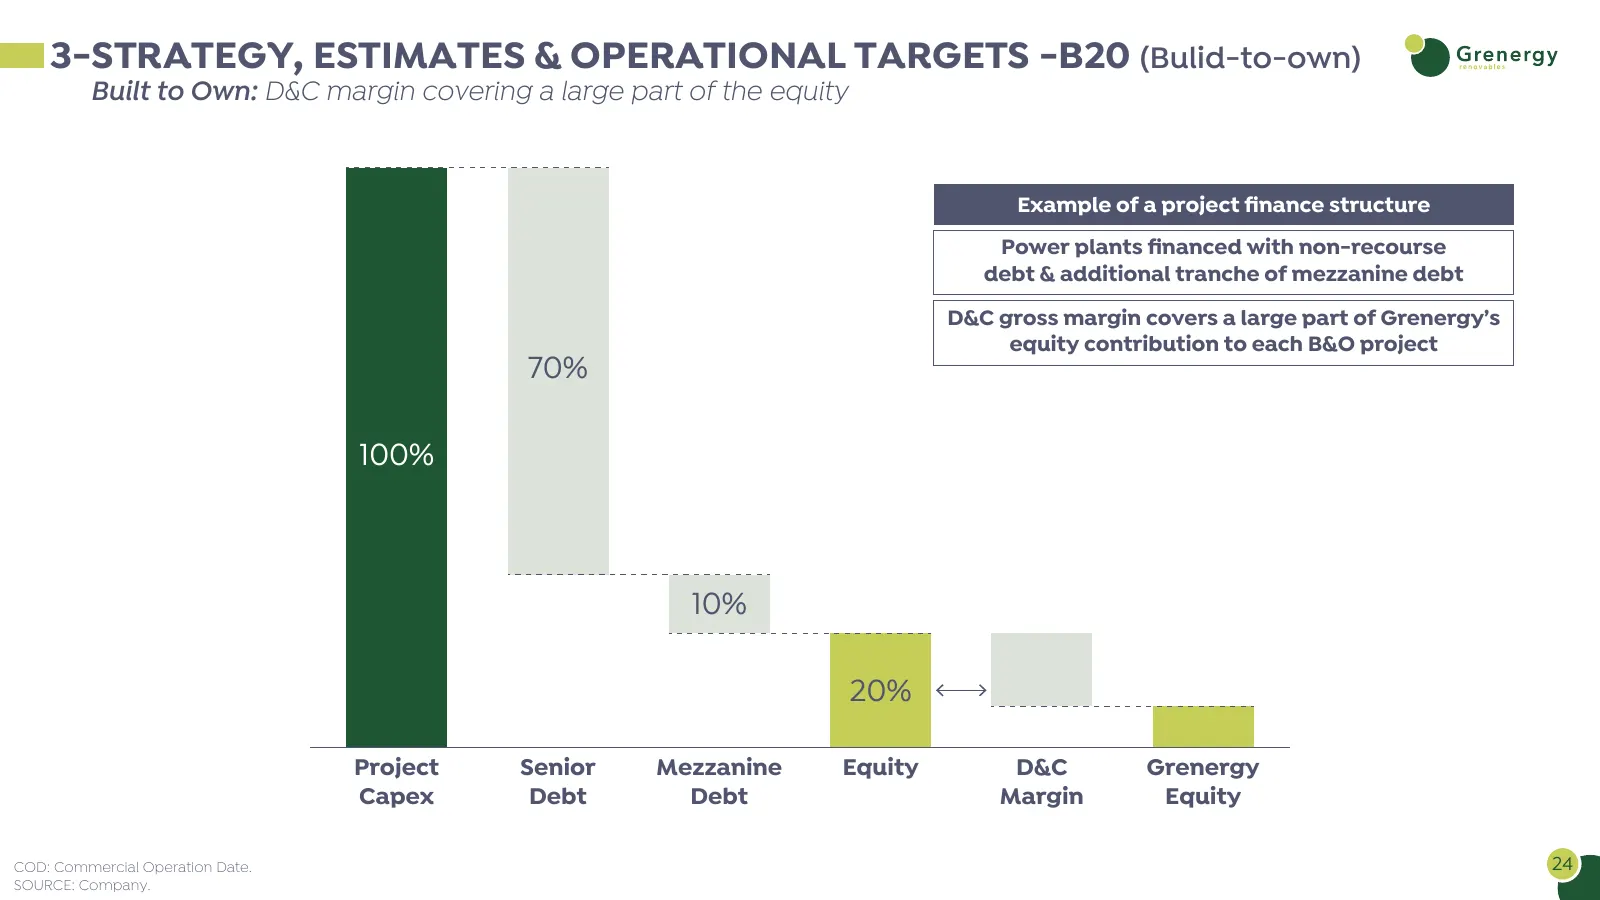
3-STRATEGY, ESTIMATES & OPERATIONAL TARGETS -B20 (Bulid-to-own) Built to Own: D&C margin covering a large part of the equity Example of a project finance structure Power plants financed with non-recourse debt & additional tranche of mezzanine debt D&C gross margin covers a large part of Grenergy’s equ
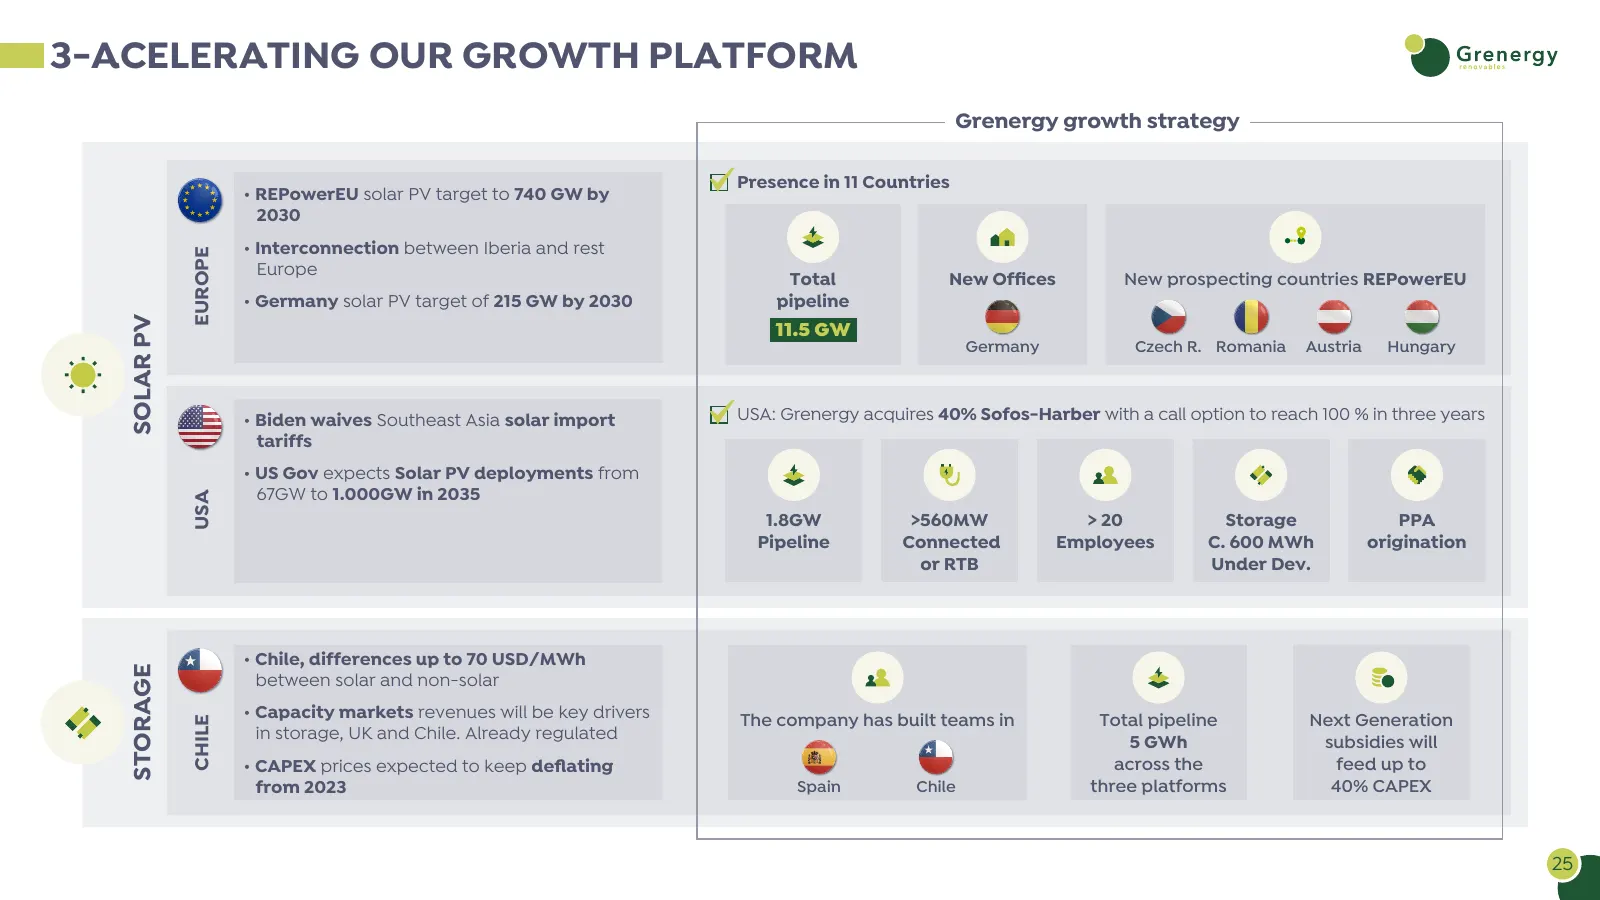
Slide 25: Accelerating Our Growth Platform
3-ACELERATING OUR GROWTH PLATFORM Grenergy growth strategy Presence in 11 Countries • REPowerEU solar PV target to 740 GW by 2030 • Interconnection between Iberia and rest EUROPE Europe Total New Offices New prospecting countries REPowerEU • Germany solar PV target of 215 GW by 2030 pipeline SOLAR PV
Slide 26: Agenda
1 EQUITY STORY & KEY FIGURES 2 PLATFORM & PIPELINE 3 OPERATIONAL INFORMATION 4 STRONG GOVERNANCE STRUCTURE WITH FOCUS ON ESG 26
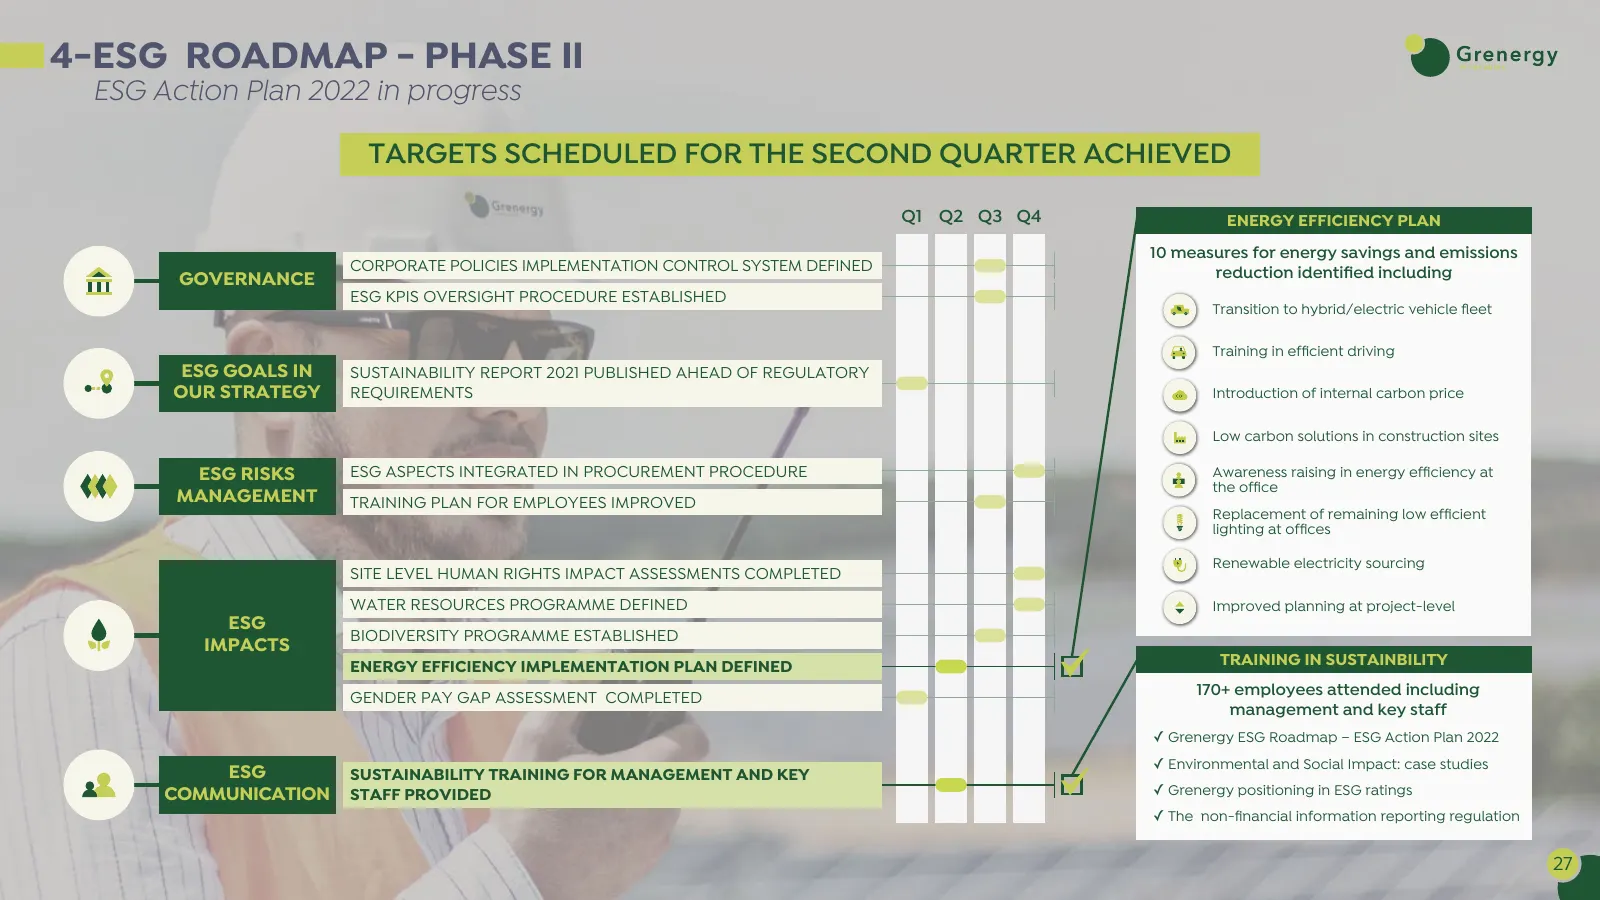
Slide 27: ESG Roadmap - Phase II
4-ESG ROADMAP - PHASE II ESG Action Plan 2022 in progress TARGETS SCHEDULED FOR THE SECOND QUARTER ACHIEVED Q1 Q2 Q3 Q4 ENERGY EFFICIENCY PLAN 10 measures for energy savings and emissions CORPORATE POLICIES IMPLEMENTATION CONTROL SYSTEM DEFINED reduction identified including GOVERNANCE ESG KPIS OVER
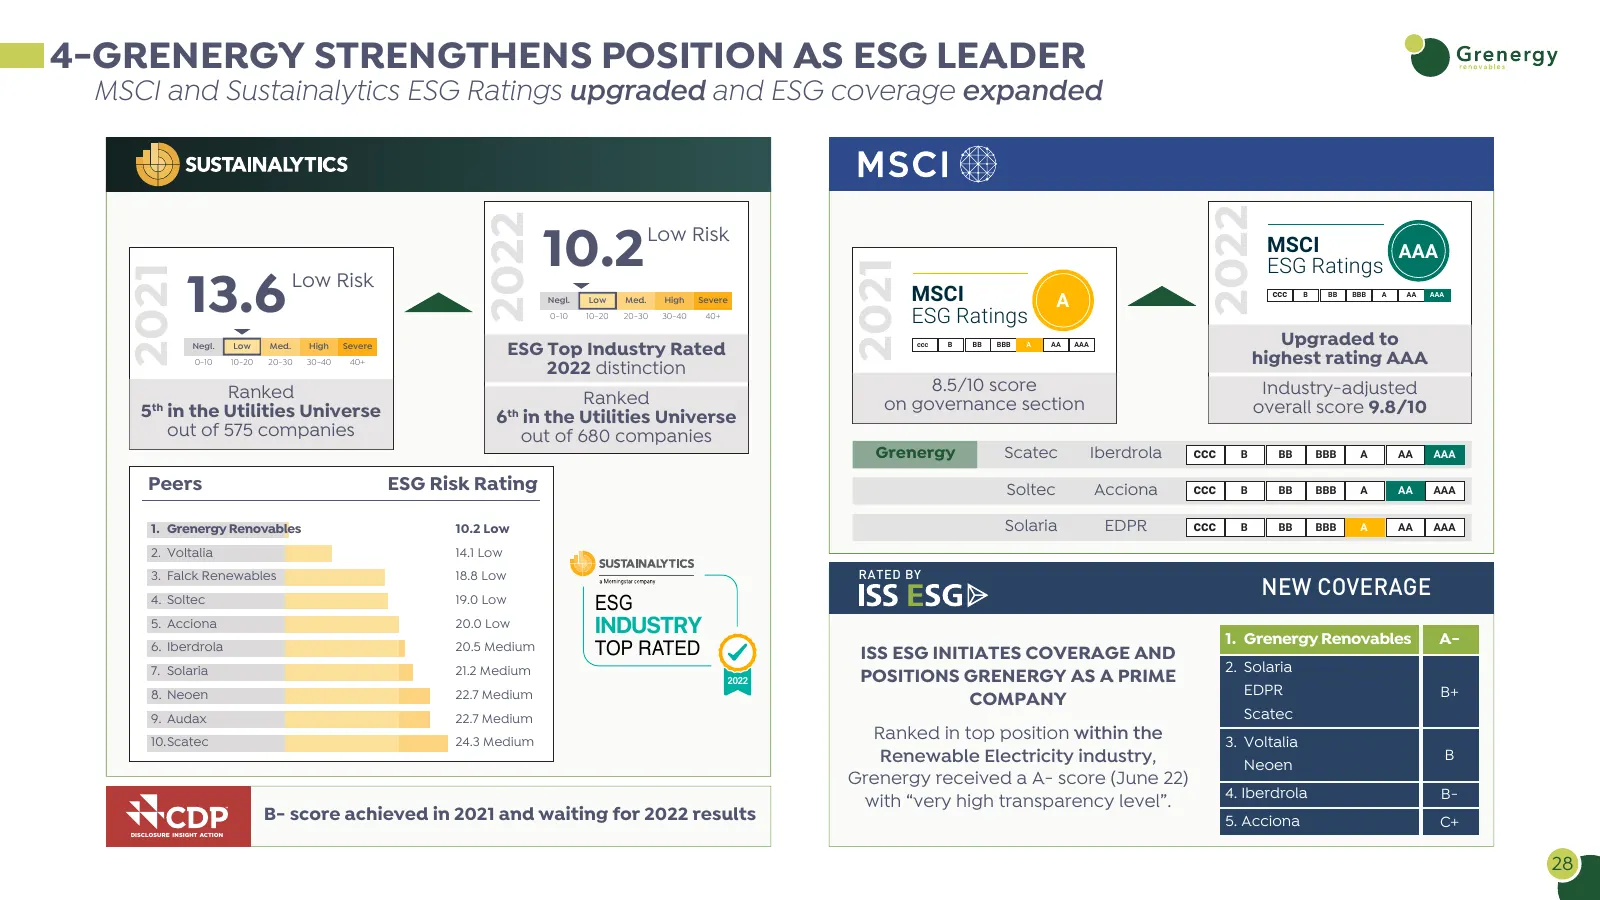
Slide 28: Grenergy Strengthens Position as ESG Leader
4-GRENERGY STRENGTHENS POSITION AS ESG LEADER MSCI and Sustainalytics ESG Ratings upgraded and ESG coverage expanded 2022 2022 10.2 Low Risk MSCI ESG Ratings AAA 2021 13.6 2021 Low Risk Negl. Low Med. High Severe MSCI A ccc B BB BBB A AA AAA 0-10 10-20 20-30 30-40 40+ ESG Ratings Upgraded to Negl. L
Slide 29: Strong Governance with Focus on ESG
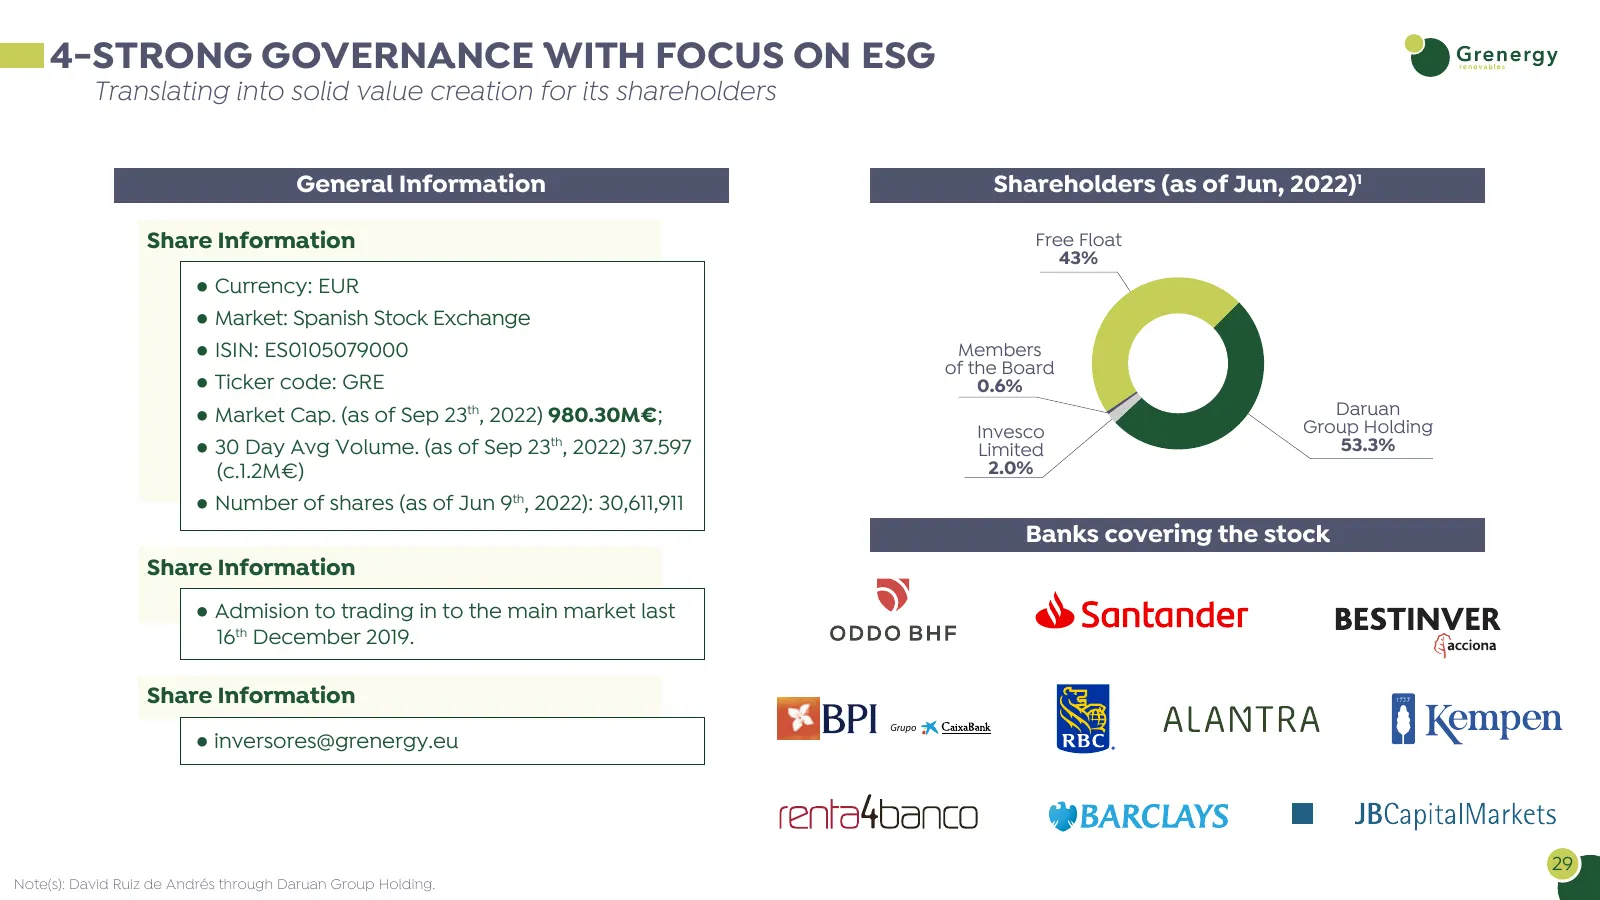
4-STRONG GOVERNANCE WITH FOCUS ON ESG Translating into solid value creation for its shareholders General Information Shareholders (as of Jun, 2022)1 Share Information Free Float 43% ● Currency: EUR ● Market: Spanish Stock Exchange ● ISIN: ES0105079000 Members of the Board ● Ticker code: GRE 0.6% ● M
Slide 30: Appendices
APPENDICES
Slide 31: Platform with Relevant Growth Potential
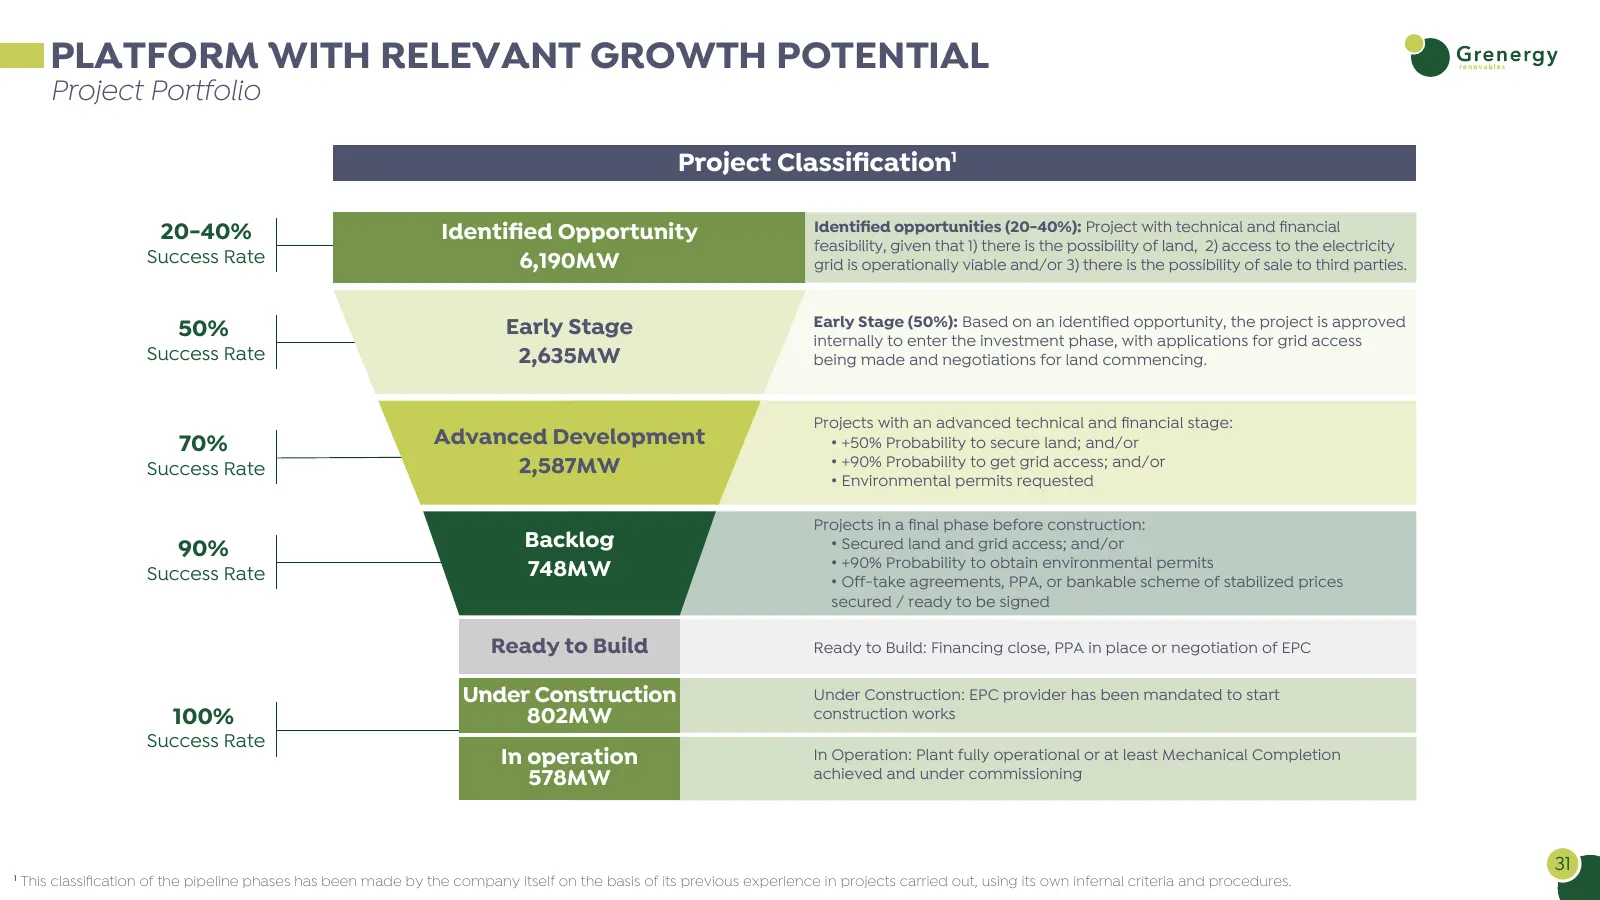
PLATFORM WITH RELEVANT GROWTH POTENTIAL Project Portfolio Project Classification1 20-40% Identified Opportunity Identified opportunities (20-40%): Project with technical and financial feasibility, given that 1) there is the possibility of land, 2) access to the electricity Success Rate 6,190MW grid is o
Slide 32: 1H22 Results: Profit and Losses
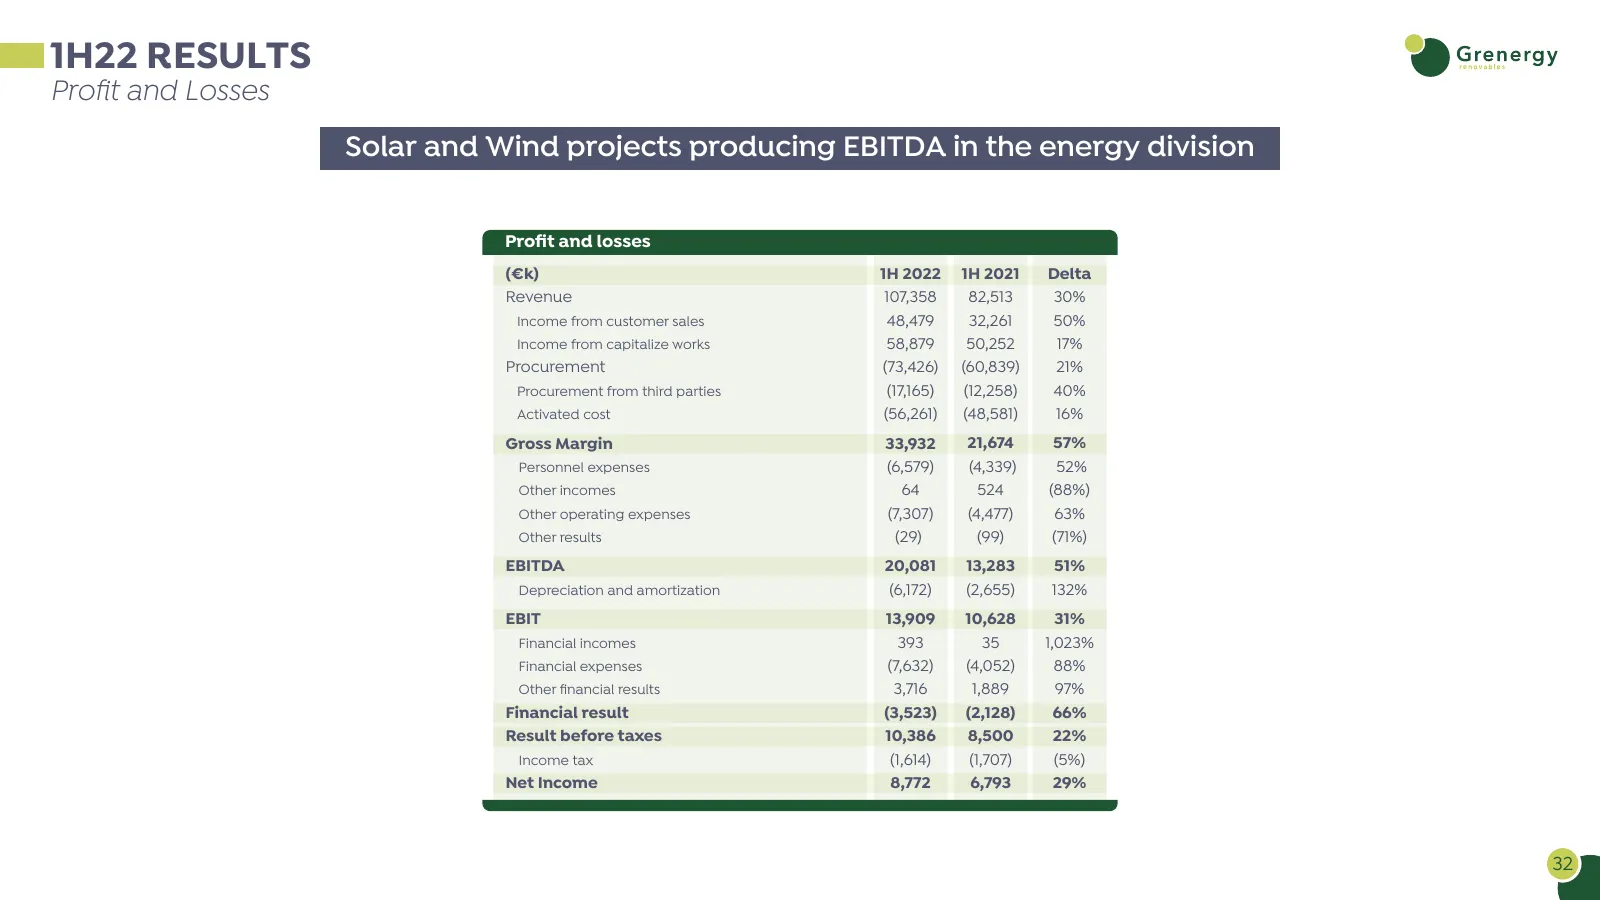
1H22 RESULTS Profit and Losses Solar and Wind projects producing EBITDA in the energy division Profit and losses (€k) 1H 2022 1H 2021 Delta Revenue 107,358 82,513 30% Income from customer sales 48,479 32,261 50% Income from capitalize works 58,879 50,252 17% Procurement (73,426) (60,839) 21% Procurem
Slide 33: 1H22 Results: Balance Sheet
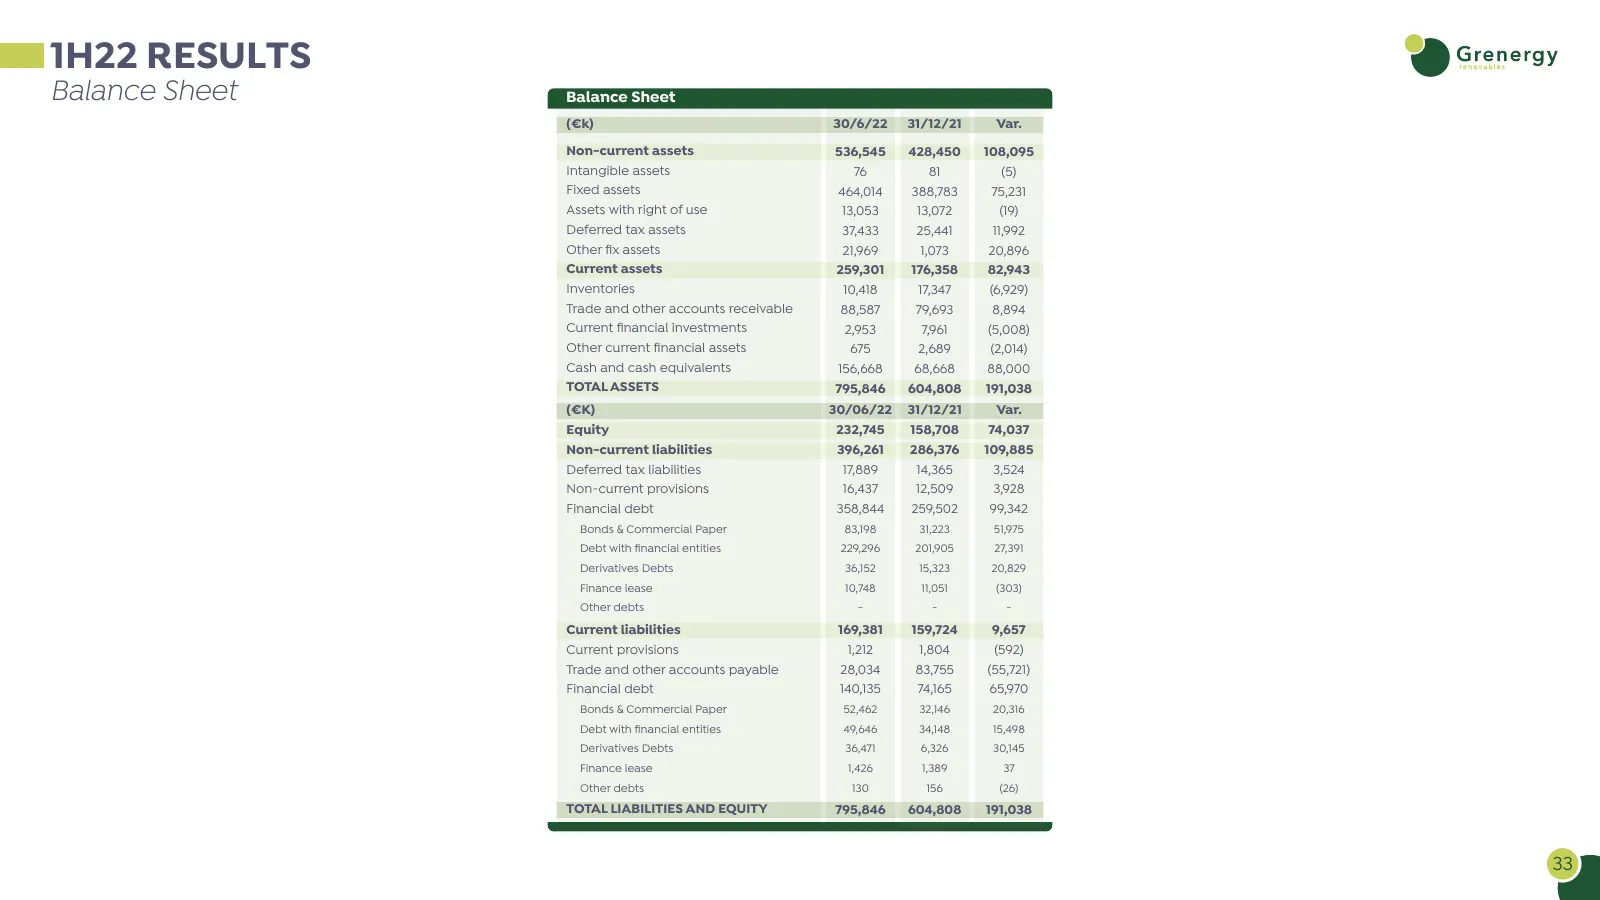
1H22 RESULTS Balance Sheet Balance Sheet (€k) 30/6/22 31/12/21 Var. Non-current assets 536,545 428,450 108,095 Intangible assets 76 81 (5) Fixed assets 464,014 388,783 75,231 Assets with right of use 13,053 13,072 (19) Deferred tax assets 37,433 25,441 11,992 Other fix assets 21,969 1,073 20,896 Cur
Slide 34: 1H22 Results: Net Debt
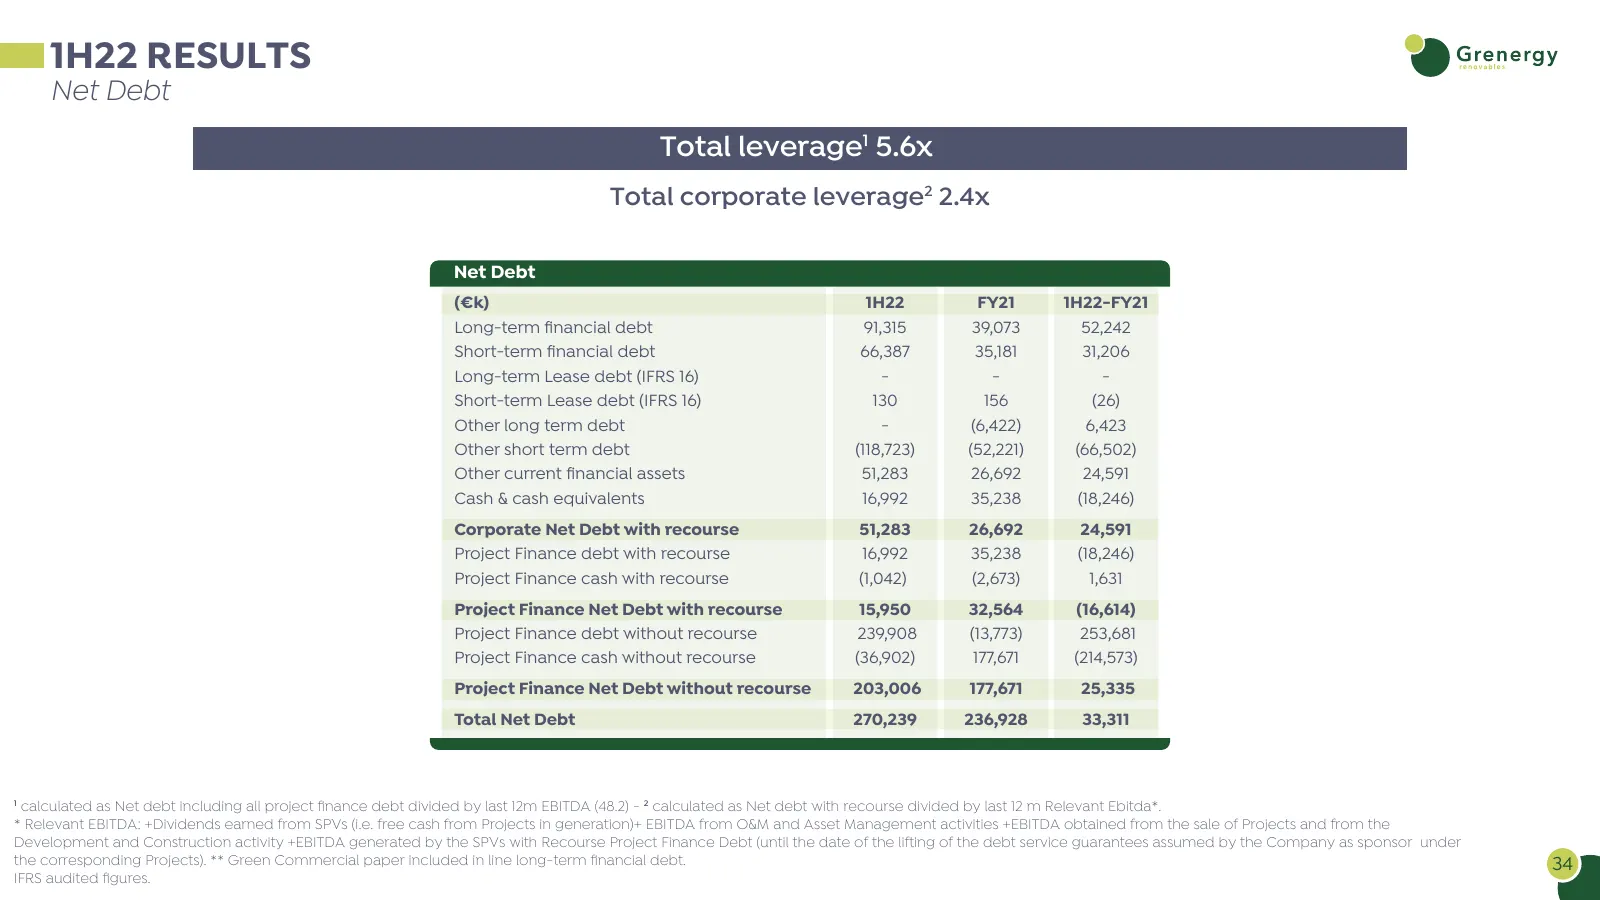
1H22 RESULTS Net Debt Total leverage1 5.6x Total corporate leverage2 2.4x Net Debt (€k) 1H22 FY21 1H22-FY21 Long-term financial debt 91,315 39,073 52,242 Short-term financial debt 66,387 35,181 31,206 Long-term Lease debt (IFRS 16) - - - Short-term Lease debt (IFRS 16) 130 156 (26) Other long term d
Slide 35: Developers & IPP of Solar PV - Wind - Storage projects
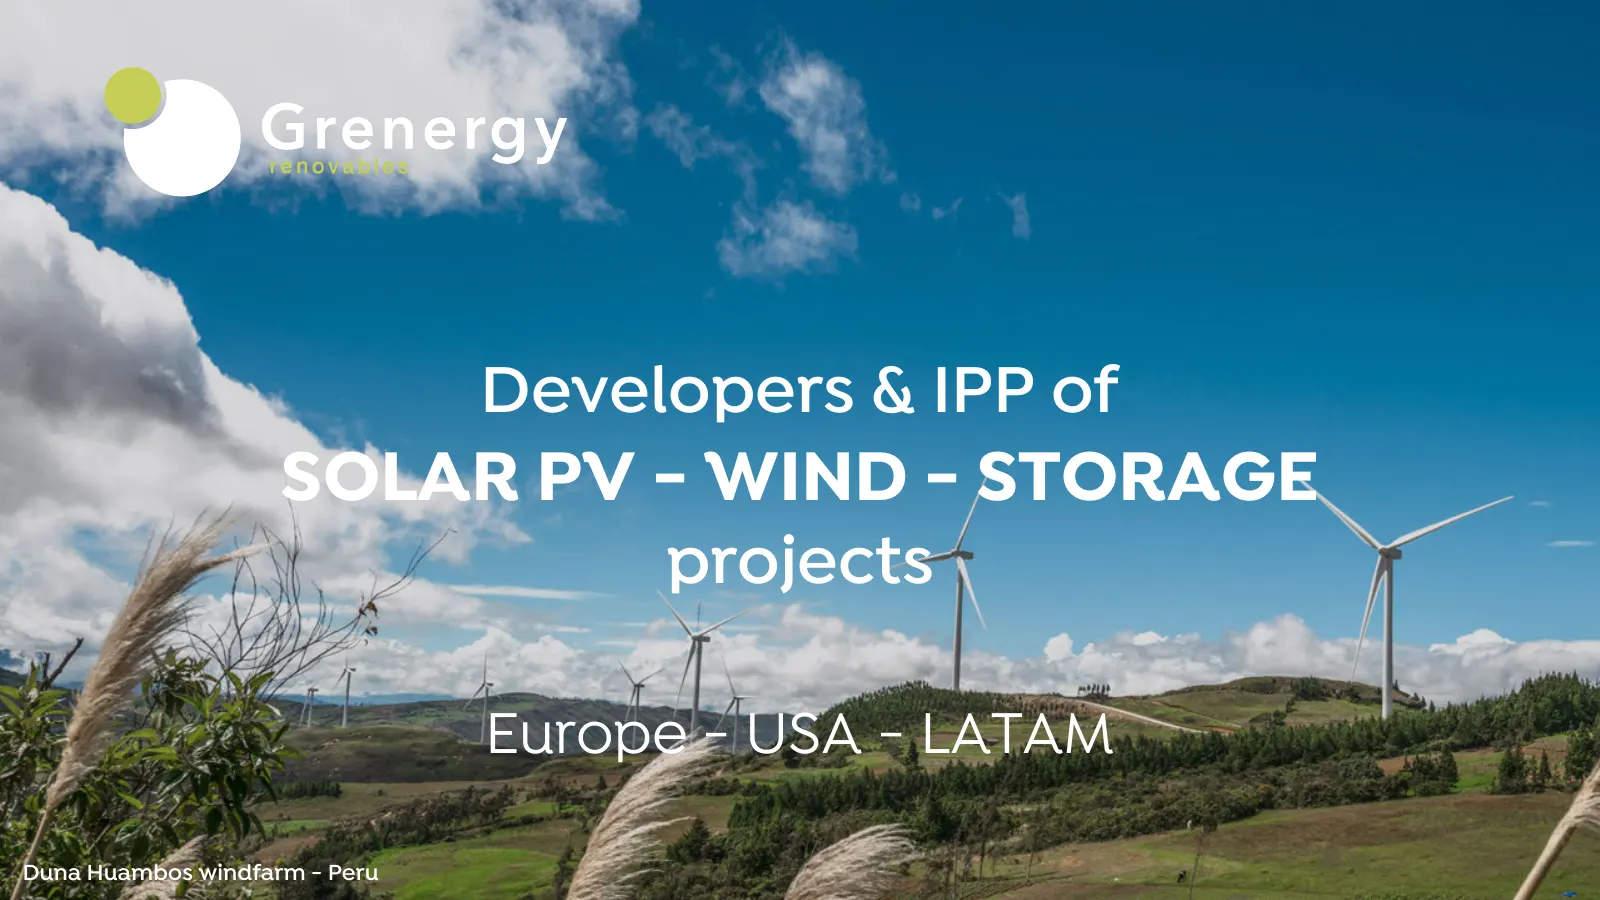
Developers & IPP of SOLAR PV - WIND - STORAGE projects Europe - USA - LATAM Duna Huambos windfarm - Peru
Source: Internet Archive copy of grenergy.eu
More decks from Grenergy Renovables S.A
 H1 2026 Earnings Presentation38 slides · Sep 16, 2026
 Investor Presentation (September 2026)55 slides · September 2026
 Investor Presentation (July 2026)46 slides · July 2026
 Q1 2026 Earnings Presentation50 slides · May 27, 2026
 9M 2025 Earnings Presentation36 slides · Nov 27, 2025
 Investor Day (May 2025)50 slides · May 28, 2025